subglacial flood path development during a rapidly rising
TRANSCRIPT

Subglacial flood path development during a rapidly risingjökulhlaup from the western Skaftá cauldron, Vatnajökull, Iceland
BERGUR EINARSSON,1 TÓMAS JÓHANNESSON,1 THORSTEINN THORSTEINSSON,1
ERIC GAIDOS,2 THOMAS ZWINGER3
1Icelandic Meteorological Office, Reykjavík, Iceland2Department of Geology & Geophysics, University of Hawai’i, Honolulu, Hawai’i, USA
3CSC – IT Center for Science Ltd., Espoo, FinlandCorrespondence: Bergur Einarsson <[email protected]>
ABSTRACT. Discharge and water temperature measurements in the Skaftá river and measurements ofthe lowering of the ice over the subglacial lake at the western Skaftá cauldron, Vatnajökull, Iceland,were made during a rapidly rising glacial outburst flood (jökulhlaup) in September 2006. Outflowfrom the lake, flood discharge at the glacier terminus and the transient subglacial volume of floodwaterduring the jökulhlaup are derived from these data. The 40 km long initial subglacial path of thejökulhlaup was mainly formed by lifting and deformation of the overlying ice, induced by water pressurein excess of the ice overburden pressure. Melting of ice due to the heat of the floodwater from the sub-glacial lake and frictional heat generated by the dissipation of potential energy in the flow played asmaller role. Therefore this event, like other rapidly rising jökulhlaups, cannot be explained by thejökulhlaup theory of Nye (1976). Instead, our observations indicate that they can be explained by acoupled subglacial-sheet–conduit mechanism where essentially all of the initial flood path is formedas a sheet by the propagation of a subglacial pressure wave.
KEYWORDS: glacier hydrology, jökulhlaups (GLOFs), subglacial lakes
1. INTRODUCTIONJökulhlaups in the river Skaftá from western Vatnajökulloccur at 1–2 year intervals with volumes of 0.05–0.4 km3
and maximum discharge of 50–3000 m3 s–1 (Björnsson,1977; Zóphóníasson, 2002; unpublished data from theIcelandic Meteorological Office). The floods originate fromtwo subglacial lakes below 50–150 m deep and 1–3 kmwide depressions (cauldrons) in the ∼450 m thick surround-ing ice cap. Together, the depressions drain ∼50 km2 of theice cap (Pálsson and others, 2006) (Fig. 1). The jökulhlaupstravel ∼40 km subglacially before they emerge at the ter-minus of the outlet glacier Skaftárjökull.
Jökulhlaups in Skaftá reach maximum discharge in 1–3days and typically recede in 1–2 weeks (Björnsson, 2002)(Fig. 2). They are on the ‘rapidly rising’ side of the spectrumof ‘rapidly rising’ to ‘slowly rising’ jökulhlaups (Einarsson andothers, 2016). The hydrograph of slowly rising jökulhlaups,such as most floods from Grímsvötn subglacial lake inVatnajökull, gradually rises to maximum discharge in 1–3weeks and recedes in <1 week, often in only 1–3 days(Björnsson, 2002) (Fig. 2). Jökulhlaups from subglacial andmarginal lakes at other locations in Iceland may rise evenmore rapidly than jökulhlaups in Skaftá and can reachmaximum discharge in less than half a day (Thórarinsson,1974; Sigurðsson and Einarsson, 2005; Jónsson andÞórarinsdóttir, 2011). The hydrographs of slowly risingjökulhlaups are reasonably well explained by the theory ofconduit-melt–discharge feedback, developed by Nye(1976). The rapid initial increase of the hydrograph duringjökulhlaups in Skaftá is difficult to explain with Nye’stheory without invoking implausibly high temperature forthe lake water (Björnsson, 1992), and many aspects of thedynamics of rapidly rising jökulhlaups are still unresolved.
As rapidly rising jökulhlaups have a fast discharge increase,they may be extremely dangerous since warning times forresponse are short.
The fundamental reasons that govern whether a jökulhlaupdevelops as a rapidly rising or slowly rising flood are not fullyunderstood. The predominant discharge development mech-anism appears to be different for these two types of floods.Hydraulic uplift of the glacier, caused by water pressureexceeding glacier overburden pressure in a propagating sub-glacial pressure wave, is likely to be an important componentin the flood path formation for rapidly rising jökulhlaups(Björnsson, 2002; Jóhannesson, 2002; Flowers and others,2004; Roberts, 2005; Einarsson and others, 2016). Floodpath formation by coupled subglacial sheet of water andconduit flow has been used for modelling of rapidly risingjökulhlaups (Flowers and others, 2004). The formation ofthe initial sheet has been proposed to be caused by icedam flotation near the subglacial lake (Björnsson, 2002,2010; Flowers and others, 2004; Sugiyama and others,2008) and hydraulic jacking along the flood path (Flowersand others, 2004). Positive feedback between dischargeand melting in the sheet leads to the creation of conduitsthat carry an increasing proportion of the water as the flooddevelops. The subglacial flood path of slowly risingjökulhlaups is, on the other hand, thought to be mainlyformed by melting by frictional heat released in the flowby dissipation of potential energy and the initial heat ofthe source water (Nye, 1976; Spring and Hutter, 1981,1982). Recent research on jökulhlaups from Grímsvötnindicates that lifting of the glacier may also play a role inflood path formation of some slowly rising jökulhlaups(Björnsson, 2010; Magnússon and others, 2011; Einarssonand others, 2016).
Journal of Glaciology (2017), 63(240) 670–682 doi: 10.1017/jog.2017.33© The Author(s) 2017. This is an Open Access article, distributed under the terms of the Creative Commons Attribution licence (http://creativecommons.org/licenses/by/4.0/), which permits unrestricted re-use, distribution, and reproduction in any medium, provided the original work is properly cited.
Downloaded from https://www.cambridge.org/core. 23 Mar 2022 at 09:20:21, subject to the Cambridge Core terms of use.

The discharge development of a jökulhlaup seems todepend on both local conditions at each site and the initialconditions for each particular flood. Both rapidly rising andslowly rising jökulhlaups can originate from the samesource location. As an example, the 1861, 1892, 1938 andthe November 1996 jökulhlaups from Grímsvötn inVatnajökull were all of the rapidly rising type (Thórarinsson,1974; Björnsson, 2002), whereas over 20 jökulhlaups fromGrímsvötn in the decades from 1940 to 2010 were slowlyrising (Thórarinsson, 1974; Björnsson, 2002; Sigurðssonand Einarsson, 2005; unpublished data from the IcelandicMeteorological Office). Different drainage mechanisms fordifferent outbursts from the same source location have like-wise been identified for Gornersee in Switzerland (Hussand others, 2007).
Subglacial water flow and variations in subglacial waterpressure have attracted increasing attention in recent yearsas a likely cause of the large variations in ice flow velocitiesthat have been observed on the main outlets of theGreenland ice sheet and some of the ice streams ofAntarctica (e.g. Rignot and Kanagaratnam, 2006; Frickerand others, 2007; Stearns and others, 2008; Doyle andothers, 2015). Subglacial accumulation of water has beenobserved or inferred at many locations on large and smallglaciers and found to be associated with substantial increasesin ice flow velocities (e.g. Iken and Bindschadler, 1986;Fudge and others, 2009; Magnússon and others, 2011).Jökulhlaups provide one of the best opportunities to studythe response of the subglacial hydraulic system to largeand sudden variations in water flow, and lessons learnedfrom studies of jökulhlaups may be useful for understandingvariations in basal sliding and ice flow in glaciers and icesheets in general (Bell, 2008).
To gain understanding of the energy balance, heat dissipa-tion and flood path formation and development in rapidlyrising jökulhlaups, a campaign to monitor the Skaftá caul-drons and the Skaftá river was initiated in 2006. This paperreports our results on the subglacial hydrology of theSeptember 2006 jökulhlaup from the western Skaftá caul-dron. Outflow from the subglacial lake and transientstorage of water in the subglacial flood path are derivedand used, together with water temperature measurementsin the subglacial lake and near the terminus, to shed lighton the dynamics of the flood path development for thistype of flood. The emptying of a cylindrically symmetric sub-glacial lake is simulated with the full-Stokes ice-dynamicmodel Elmer/Ice (Gagliardini and others, 2013) to deduce arelationship between water volume in the lake and ice-shelf elevation for calculations of outflow from the lake andfor analysing the size of the subglacial lake in relation tothe observed dimensions of the ice-surface depression.
2. DATA AND METHODSThe ice shelf covering the western Skaftá cauldron was pene-trated by a hot water drill in June 2006 (Thorsteinsson andothers, 2007). (The term ‘ice shelf’ is used in this paper todescribe the ice cover overlying the subglacial lakes as theweight of the ice is to a large extent supported by flotation.The ice shelves are, however, fundamentally different fromthe large ice shelves at the margins of ice sheets and glaciersin, for example, Antarctica, Greenland and Canada.) A tem-perature sensor was deployed at the bottom of the lake andconnected with a cable to a data logger on the surface
Fig. 1. (a) The Skaftá cauldrons and subglacial lakes in the westernVatnajökull ice cap and the upper part of the watershed of the Skaftáriver. The inferred subglacial paths of jökulhlaups (dotted lines) andlocations of instruments described in the text are shown. (b) Ahillshade of a DEM of the cauldron area measured by lidar(acronym for ‘light detection and ranging’) in 2010.
Fig. 2. Comparison of the hydrographs of a large rapidly risingjökulhlaup in 2002 (solid curve) and the small jökulhlaup in 2006with a rapid initial rise, which is the subject of this paper (dashedcurve), both from the western Skaftá cauldron. The hydrograph ofa typical slowly rising jökulhlaup from Grímsvötn in 1986 (dottedcurve) is also shown. The hydrograph of the Grímsvötn jökulhlaupis based on discrete discharge measurements which are shown asdots. The rapid rise of the hydrograph of the 2006 jökulhlaup ismore clearly visible in Figure 6 which shows the same dischargecurve with the vertical scale expanded.
671Subglacial flood path development during a rapidly rising jökulhlaup
Downloaded from https://www.cambridge.org/core. 23 Mar 2022 at 09:20:21, subject to the Cambridge Core terms of use.
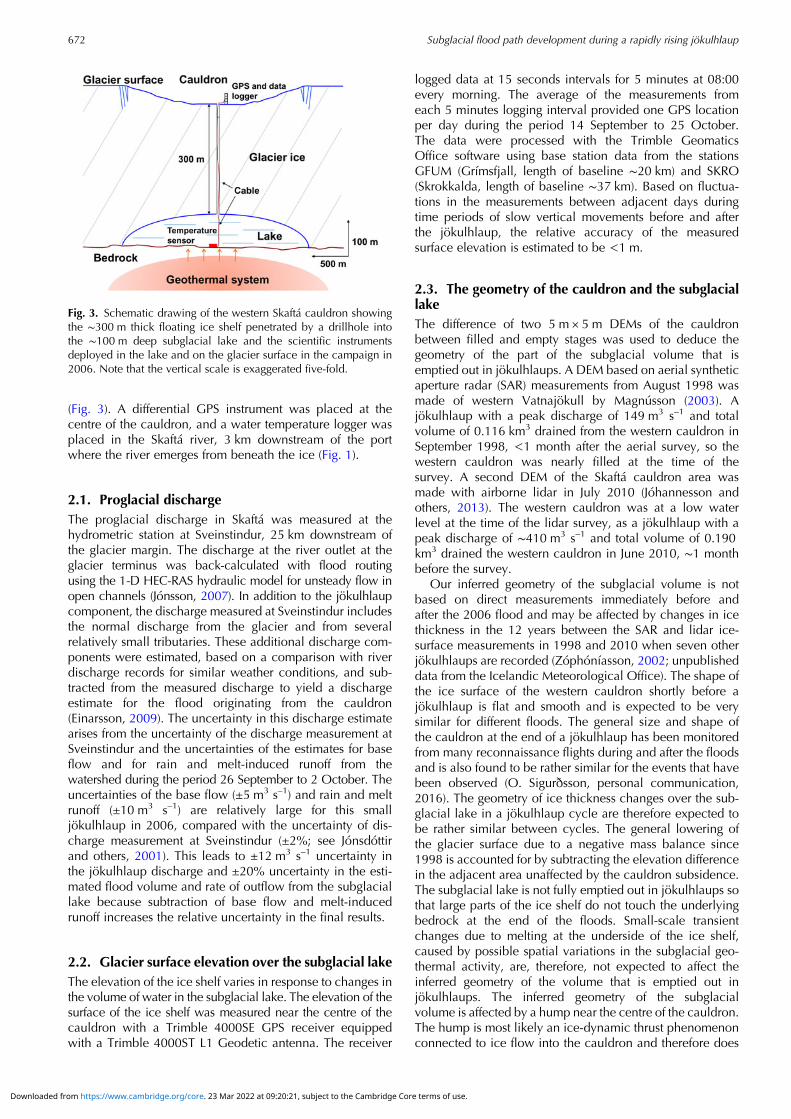
(Fig. 3). A differential GPS instrument was placed at thecentre of the cauldron, and a water temperature logger wasplaced in the Skaftá river, 3 km downstream of the portwhere the river emerges from beneath the ice (Fig. 1).
2.1. Proglacial dischargeThe proglacial discharge in Skaftá was measured at thehydrometric station at Sveinstindur, 25 km downstream ofthe glacier margin. The discharge at the river outlet at theglacier terminus was back-calculated with flood routingusing the 1-D HEC-RAS hydraulic model for unsteady flow inopen channels (Jónsson, 2007). In addition to the jökulhlaupcomponent, the discharge measured at Sveinstindur includesthe normal discharge from the glacier and from severalrelatively small tributaries. These additional discharge com-ponents were estimated, based on a comparison with riverdischarge records for similar weather conditions, and sub-tracted from the measured discharge to yield a dischargeestimate for the flood originating from the cauldron(Einarsson, 2009). The uncertainty in this discharge estimatearises from the uncertainty of the discharge measurement atSveinstindur and the uncertainties of the estimates for baseflow and for rain and melt-induced runoff from thewatershed during the period 26 September to 2 October. Theuncertainties of the base flow (±5 m3 s–1) and rain and meltrunoff (±10 m3 s–1) are relatively large for this smalljökulhlaup in 2006, compared with the uncertainty of dis-charge measurement at Sveinstindur (±2%; see Jónsdóttirand others, 2001). This leads to ±12 m3 s–1 uncertainty inthe jökulhlaup discharge and ±20% uncertainty in the esti-mated flood volume and rate of outflow from the subglaciallake because subtraction of base flow and melt-inducedrunoff increases the relative uncertainty in the final results.
2.2. Glacier surface elevation over the subglacial lakeThe elevation of the ice shelf varies in response to changes inthe volume of water in the subglacial lake. The elevation of thesurface of the ice shelf was measured near the centre of thecauldron with a Trimble 4000SE GPS receiver equippedwith a Trimble 4000ST L1 Geodetic antenna. The receiver
logged data at 15 seconds intervals for 5 minutes at 08:00every morning. The average of the measurements fromeach 5 minutes logging interval provided one GPS locationper day during the period 14 September to 25 October.The data were processed with the Trimble GeomaticsOffice software using base station data from the stationsGFUM (Grímsfjall, length of baseline ∼20 km) and SKRO(Skrokkalda, length of baseline ∼37 km). Based on fluctua-tions in the measurements between adjacent days duringtime periods of slow vertical movements before and afterthe jökulhlaup, the relative accuracy of the measuredsurface elevation is estimated to be <1 m.
2.3. The geometry of the cauldron and the subglaciallakeThe difference of two 5 m × 5 m DEMs of the cauldronbetween filled and empty stages was used to deduce thegeometry of the part of the subglacial volume that isemptied out in jökulhlaups. A DEM based on aerial syntheticaperture radar (SAR) measurements from August 1998 wasmade of western Vatnajökull by Magnússon (2003). Ajökulhlaup with a peak discharge of 149 m3 s–1 and totalvolume of 0.116 km3 drained from the western cauldron inSeptember 1998, <1 month after the aerial survey, so thewestern cauldron was nearly filled at the time of thesurvey. A second DEM of the Skaftá cauldron area wasmade with airborne lidar in July 2010 (Jóhannesson andothers, 2013). The western cauldron was at a low waterlevel at the time of the lidar survey, as a jökulhlaup with apeak discharge of ∼410 m3 s–1 and total volume of 0.190km3 drained the western cauldron in June 2010, ∼1 monthbefore the survey.
Our inferred geometry of the subglacial volume is notbased on direct measurements immediately before andafter the 2006 flood and may be affected by changes in icethickness in the 12 years between the SAR and lidar ice-surface measurements in 1998 and 2010 when seven otherjökulhlaups are recorded (Zóphóníasson, 2002; unpublisheddata from the Icelandic Meteorological Office). The shape ofthe ice surface of the western cauldron shortly before ajökulhlaup is flat and smooth and is expected to be verysimilar for different floods. The general size and shape ofthe cauldron at the end of a jökulhlaup has been monitoredfrom many reconnaissance flights during and after the floodsand is also found to be rather similar for the events that havebeen observed (O. Sigurðsson, personal communication,2016). The geometry of ice thickness changes over the sub-glacial lake in a jökulhlaup cycle are therefore expected tobe rather similar between cycles. The general lowering ofthe glacier surface due to a negative mass balance since1998 is accounted for by subtracting the elevation differencein the adjacent area unaffected by the cauldron subsidence.The subglacial lake is not fully emptied out in jökulhlaups sothat large parts of the ice shelf do not touch the underlyingbedrock at the end of the floods. Small-scale transientchanges due to melting at the underside of the ice shelf,caused by possible spatial variations in the subglacial geo-thermal activity, are, therefore, not expected to affect theinferred geometry of the volume that is emptied out injökulhlaups. The inferred geometry of the subglacialvolume is affected by a hump near the centre of the cauldron.The hump is most likely an ice-dynamic thrust phenomenonconnected to ice flow into the cauldron and therefore does
Fig. 3. Schematic drawing of the western Skaftá cauldron showingthe ∼300 m thick floating ice shelf penetrated by a drillhole intothe ∼100 m deep subglacial lake and the scientific instrumentsdeployed in the lake and on the glacier surface in the campaign in2006. Note that the vertical scale is exaggerated five-fold.
672 Subglacial flood path development during a rapidly rising jökulhlaup
Downloaded from https://www.cambridge.org/core. 23 Mar 2022 at 09:20:21, subject to the Cambridge Core terms of use.

not represent the shape of the subglacial lake. This effect issmall compared with other uncertainties in the estimationof the geometry of the lake.
2.4. The hypsometry of the subglacial lakeThe water volume in the subglacial lake is not a simple func-tion of the lake geometry and water level as for lakes inbedrock basins because the geometry of the lake maychange with the ice-shelf elevation. A hypsometric curve,i.e. lake water volume as a function of ice-shelf elevation,for the lowering of the ice shelf was calculated with thefull-Stokes ice-dynamic model Elmer/Ice (Gagliardini andothers, 2013) by simulating the emptying of a cylindricallysymmetric subglacial lake below an ice cover with theapproximate dimensions of the western Skaftá cauldron.The question to be addressed by the simulation is whetherthe subglacial water body maintains a similar shape as theice shelf is lowered and the lake is emptied or whether thelake geometry changes substantially due to internal shearwithin the ice shelf near the lake edge such that the ground-ing line at the lateral boundary moves inward as the shelflowers. These two possibilities correspond to different rela-tionships between the rate of lowering of the ice shelf andthe rate of outflow from the subglacial lake, leading to differ-ent trajectories between the two known points on thevolume–ice-shelf-elevation curve that are determined bythe observed total outflow and surface lowering. Our model-ling is simplistic and meant to capture the main physical pro-cesses that determine the shape of the hypsometric curve butnot the 2006 event in detail. The model setup is, thus, basedon a simplified geometry of the western cauldron and generalcharacteristics of jökulhlaups released from there and thefinal results are scaled to the observed volume and iceshelf lowering in the 2006 event. The physical basis of ourmodel formulation is in principle similar to the analyticalmodel of cauldron subsidence during jökulhlaups developedby Evatt and Fowler (2007) but there are differences in thegeometrical and physical assumptions as will be furtherdescribed in Section 4.
The Skaftá cauldrons and ice flow in their vicinity areclose to being cylindrically symmetric in geometry (Figs 1and 3). A cylindrically symmetric model configuration waschosen because the detailed geometry of the ice-flow basinaway from the subglacial lake, which deviates from cylin-drical symmetry, is not expected to influence the form ofthe calculated hypsometric curve to a significant degree.
We take the overall shape and size of the subglacial lakeas given, based on the inferred geometry of the volume
emptied out in the 2010 jökulhlaup. This shape is dynamic-ally determined over many jökulhlaup cycles and it is outsidethe scope of this paper to derive and analyse this time-dependent geometry by modelling. The modelled lake isassumed to have a convex shape and maximum depth of∼100 m at the centre at the start of a jökulhlaup and to becovered with an ice shelf with surface geometry based onthe 1998 SAR DEM (see Fig. 4, which explains the notationused to describe the model geometry). The glacier and thelake are underlain by flat bedrock in the model set-up.
The dynamic and kinematic boundary conditions at theice surface and the ice/bed interface are formulated with astress-free upper surface, as is customary in ice flowmodels of this kind (e.g. Gagliardini and others, 2013), anda constant uniform positive surface mass balance bs. Thestress-free upper surface is assumed to have a smooth geom-etry, ignoring the dynamic effect of surface crevasses that areobserved to be formed in a concentric pattern during the sub-sidence of the ice shelf. The lidar measurements in 2010,shortly after a jökulhlaup, showed crevasse depths up to40 m, which should be considered a minimum as the lidaris not likely to have reached to the bottom of the deepest cre-vasses. Crevasses formed over a timescale of several daysduring a jökulhlaup may be estimated to be on the order of100 m deep (Cuffey and Paterson, 2010, Eqn (10.6),p. 449). As the surrounding glacier is ∼450 m thick, the cre-vasses may have some effect on the ice dynamics butneglecting them is not likely to have a dominating effect onour results considering other simplifications in our modellingspecification.
The kinematic boundary condition at the bottom of theice takes geothermal melting of ice, mg, into accountwithin the radius of the geothermal area rg. The dynamicboundary condition at the ice/bed interface assumesWeertman sliding, ub ¼ C τm�1
b τb, where ub is the bed-par-allel velocity component, τb is the basal shear stress and Cand m are parameters.
Water pressure in the lake, pw, is assumed to be hydro-static:
pw ¼ ρw g ðzw � zÞ; ð1Þ
where zw is the piezometric height of the lake, and thedynamic boundary condition at the ice/water interface is for-mulated in terms of the water pressure that is set equal to the(negative of the) surface normal stress in the ice at the shear-stress-free bottom of the ice shelf. The position of the ground-ing line, where the ice/water interface meets the ice/bedinterface, is part of the solution and evolves with time. Its
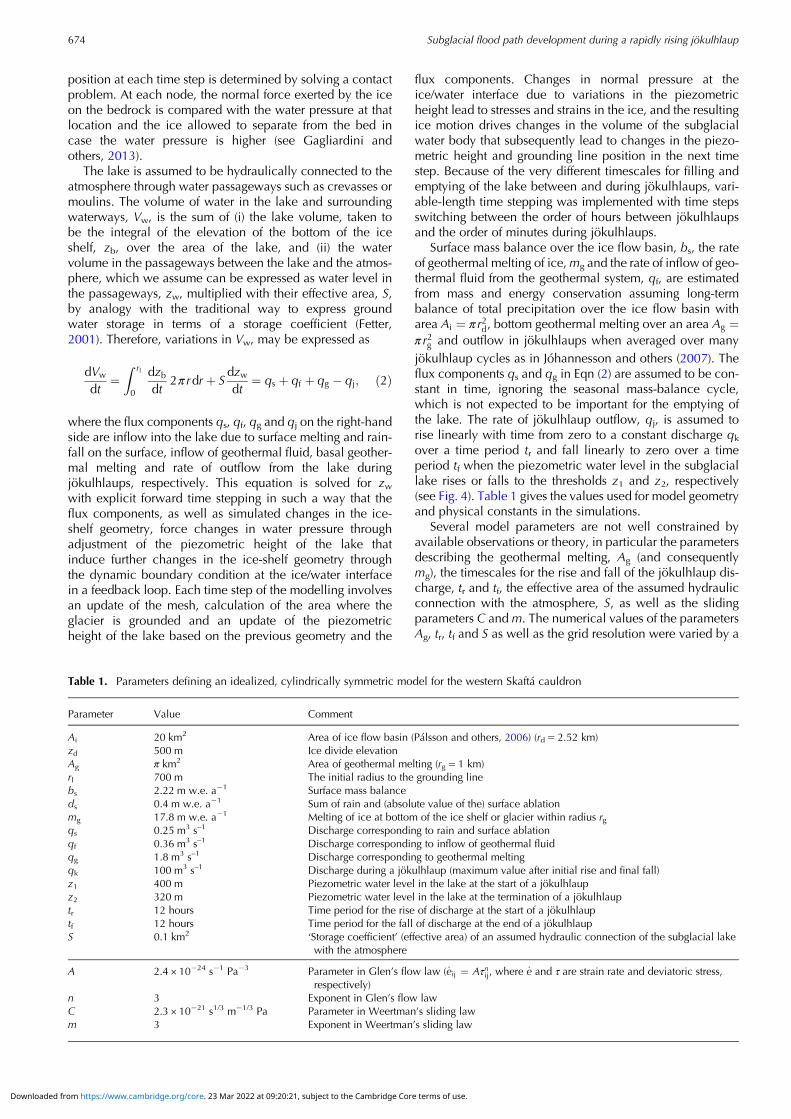
Fig. 4. The Elmer/Ice computational finite-element mesh for the cylindrically symmetric model of a glacier on a flat bed overlying a subglaciallake with dimensions corresponding to the western Skaftá cauldron. The figure explains the notation used to define the geometry of the model:the elevation of the ice surface, zs, and the bottom of the ice, zb, the time-dependent piezometric water level of the subglacial water lake, zw,the radial distance to the grounding line, rl, the radius of the geothermal area, rg, the radius to the ice divide at the boundary of the cauldron iceflow basin with the surrounding ice cap, rd and the ice-surface elevation at the ice divide, zd. A jökulhlaup is released when zw reaches acritical level z1 and terminated when zw reaches z2.
673Subglacial flood path development during a rapidly rising jökulhlaup
Downloaded from https://www.cambridge.org/core. 23 Mar 2022 at 09:20:21, subject to the Cambridge Core terms of use.
position at each time step is determined by solving a contactproblem. At each node, the normal force exerted by the iceon the bedrock is compared with the water pressure at thatlocation and the ice allowed to separate from the bed incase the water pressure is higher (see Gagliardini andothers, 2013).
The lake is assumed to be hydraulically connected to theatmosphere through water passageways such as crevasses ormoulins. The volume of water in the lake and surroundingwaterways, Vw, is the sum of (i) the lake volume, taken tobe the integral of the elevation of the bottom of the iceshelf, zb, over the area of the lake, and (ii) the watervolume in the passageways between the lake and the atmos-phere, which we assume can be expressed as water level inthe passageways, zw, multiplied with their effective area, S,by analogy with the traditional way to express groundwater storage in terms of a storage coefficient (Fetter,2001). Therefore, variations in Vw, may be expressed as
dVw
dt¼
Z rl
0
dzbdt
2π rdr þ Sdzwdt
¼ qs þ qf þ qg � qj; ð2Þ
where the flux components qs, qf, qg and qj on the right-handside are inflow into the lake due to surface melting and rain-fall on the surface, inflow of geothermal fluid, basal geother-mal melting and rate of outflow from the lake duringjökulhlaups, respectively. This equation is solved for zwwith explicit forward time stepping in such a way that theflux components, as well as simulated changes in the ice-shelf geometry, force changes in water pressure throughadjustment of the piezometric height of the lake thatinduce further changes in the ice-shelf geometry throughthe dynamic boundary condition at the ice/water interfacein a feedback loop. Each time step of the modelling involvesan update of the mesh, calculation of the area where theglacier is grounded and an update of the piezometricheight of the lake based on the previous geometry and the
flux components. Changes in normal pressure at theice/water interface due to variations in the piezometricheight lead to stresses and strains in the ice, and the resultingice motion drives changes in the volume of the subglacialwater body that subsequently lead to changes in the piezo-metric height and grounding line position in the next timestep. Because of the very different timescales for filling andemptying of the lake between and during jökulhlaups, vari-able-length time stepping was implemented with time stepsswitching between the order of hours between jökulhlaupsand the order of minutes during jökulhlaups.
Surface mass balance over the ice flow basin, bs, the rateof geothermal melting of ice,mg and the rate of inflow of geo-thermal fluid from the geothermal system, qf, are estimatedfrom mass and energy conservation assuming long-termbalance of total precipitation over the ice flow basin witharea Ai ¼ π r2d, bottom geothermal melting over an area Ag ¼π r2g and outflow in jökulhlaups when averaged over manyjökulhlaup cycles as in Jóhannesson and others (2007). Theflux components qs and qg in Eqn (2) are assumed to be con-stant in time, ignoring the seasonal mass-balance cycle,which is not expected to be important for the emptying ofthe lake. The rate of jökulhlaup outflow, qj, is assumed torise linearly with time from zero to a constant discharge qkover a time period tr and fall linearly to zero over a timeperiod tf when the piezometric water level in the subglaciallake rises or falls to the thresholds z1 and z2, respectively(see Fig. 4). Table 1 gives the values used for model geometryand physical constants in the simulations.
Several model parameters are not well constrained byavailable observations or theory, in particular the parametersdescribing the geothermal melting, Ag (and consequentlymg), the timescales for the rise and fall of the jökulhlaup dis-charge, tr and tf, the effective area of the assumed hydraulicconnection with the atmosphere, S, as well as the slidingparameters C andm. The numerical values of the parametersAg, tr, tf and S as well as the grid resolution were varied by a
Table 1. Parameters defining an idealized, cylindrically symmetric model for the western Skaftá cauldron
Parameter Value Comment
Ai 20 km2 Area of ice flow basin (Pálsson and others, 2006) (rd= 2.52 km)zd 500 m Ice divide elevationAg π km2 Area of geothermal melting (rg= 1 km)rl 700 m The initial radius to the grounding linebs 2.22 m w.e. a−1 Surface mass balanceds 0.4 m w.e. a−1 Sum of rain and (absolute value of the) surface ablationmg 17.8 m w.e. a−1 Melting of ice at bottom of the ice shelf or glacier within radius rgqs 0.25 m3 s–1 Discharge corresponding to rain and surface ablationqf 0.36 m3 s–1 Discharge corresponding to inflow of geothermal fluidqg 1.8 m3 s–1 Discharge corresponding to geothermal meltingqk 100 m3 s–1 Discharge during a jökulhlaup (maximum value after initial rise and final fall)z1 400 m Piezometric water level in the lake at the start of a jökulhlaupz2 320 m Piezometric water level in the lake at the termination of a jökulhlauptr 12 hours Time period for the rise of discharge at the start of a jökulhlauptf 12 hours Time period for the fall of discharge at the end of a jökulhlaupS 0.1 km2
‘Storage coefficient’ (effective area) of an assumed hydraulic connection of the subglacial lakewith the atmosphere
A 2.4 × 10⁻²⁴ s−1 Pa−3 Parameter in Glen’s flow law ( _eij ¼ Aτnij , where _e and τ are strain rate and deviatoric stress,respectively)
n 3 Exponent in Glen’s flow lawC 2.3 × 10⁻²¹ s1/3 m−1/3 Pa Parameter in Weertman’s sliding lawm 3 Exponent in Weertman’s sliding law
674 Subglacial flood path development during a rapidly rising jökulhlaup
Downloaded from https://www.cambridge.org/core. 23 Mar 2022 at 09:20:21, subject to the Cambridge Core terms of use.

factor of 2–100 to test the sensitivity of the model, and nosignificant changes in simulation results occurred. For com-putational reasons, the adopted values of S are large com-pared with the expected magnitude of water passagewaysthrough bottom channels, englacial cavities and crevasses.Varying S by two orders of magnitude made little differenceto model results, indicating that this parameter only affectsthe resulting hypsometric curve to a small degree.
The resulting hypsometric curve shows an approximatelylinear relation between ice-shelf elevation and lake watervolume (Fig. 5, dashed curve), indicating that the subglacialwater body maintains a similar shape as the ice shelf islowered. The simulated hypsometric curve was scaled to fitthe observed values for total outflow volume and surfacelowering during the 2006 jökulhlaup, allowing the calcula-tion of outflow discharge as a function of time based on themeasured lowering of the ice shelf during the flood.
2.5. Floodwater temperature and energy available forsubglacial meltingContinuous measurements of water temperature in Skaftáriver were made at Fagrihvammur, 3 km downstream of theglacier margin (Fig. 1), during the September/October 2006jökulhlaup, using a Starmon mini temperature recorderwith an accuracy of ± 0.1°C. The measurements, as well asan evaluation of potential warming over the 3 km distancefrom the glacier margin to the measurement site, aredescribed by Einarsson (2009). Discrete measurements offloodwater temperature at the glacier margin in jökulhlaupsin Skaftá in August and October 2008 and October 2015were made with a high-precision RBR thermometer, withan accuracy of ± 0.005°C. Measurements of water tempera-ture in the subglacial lake of the western cauldron in June2006 are described by Jóhannesson and others (2007).
The energy available for melting of ice along the subgla-cial flood path until a particular point in time after thefloods starts may be used to calculate an upper bound onthe volume of the flood path that can have been created by
melting at that time
Vmelt ¼cwρwVlTl þ gρwVlΔH� cwρwVsTs
Lρi; ð3Þ
where g is the acceleration of gravity and ρw, cw, ρi and L arethe density and the heat capacity of water, and the densityand latent heat of fusion of ice, respectively (Table 2). Tland Ts are the temperature of the floodwater in the lakeand at the glacier snout. ΔH is the elevation differencebetween the water level in the subglacial lake and theglacier snout (815 m for the flood path from the westernSkaftá cauldron, Einarsson, 2009). Finally Vl and Vs are thevolumes of water released from the subglacial lake and atthe glacier snout up to the time in question. The first termin the numerator on the right-hand side of the equation isthe available thermal energy due to the initial heat of thewater in the lake, the second term is the available potentialenergy and the third term is the thermal energy left in thewater at the glacier snout. The kinetic energy in the waterflow at the glacier snout is neglected as it is small comparedwith the other terms. This volume estimate is an upper boundas the potential energy component corresponds to flow allthe way from the lake to the outlet and the thermal energycorresponding to the deviation of the subglacial floodwatertemperature from the freezing point upstream from thesnout is included in the estimate of the available energy.
3. RESULTS
3.1. Proglacial dischargeA rapidly rising jökulhlaup from the western Skaftá cauldronemerged at the glacier margin on 27 September 2006, reach-ing a maximum discharge close to 100 m3 s–1 in ∼2 days. Ithad the typical form of small jökulhlaups from the westerncauldron, with a relatively flat discharge maximum for ∼6days, and receded in ∼4 days. The back-calculated flood dis-charge at the glacier terminus (Fig. 6, solid curve), after sub-traction of the base flow, reached its maximum of ≈97 m3 s–1
in the afternoon of 2 October. As the estimation of the time-varying base flow is uncertain, the true discharge maximummight have occurred in the interval 29 September to 2October, but the maximum value of ≈100 m3 s–1 is fairlyaccurate as the discharge peak was broad and flat.
As for other jökulhlaups from the Skaftá cauldrons, therapid rise in flood discharge during the first 2 days cannotbe described by classic jökulhlaup theory (Björnsson, 1977,1992; Sigurðsson and Einarsson, 2005). Using model para-meters based on the geometry of the flood path andchannel roughness nm (Manning’s roughness) in the range0.01–0.1 s m–1/3, as reported for subglacial conditions byCuffey and Paterson (2010), the classic theory implies thatthe discharge should increase by a factor of 2 in the range
Fig. 5. Hypsometric curves for the subglacial lake below the westernSkaftá cauldron showing lake volume as a function of the elevationof the cauldron centre. The result of the Elmer/Ice modelling (dashedcurve) and a scaled curve that fits the observed flood volume vs. ice-shelf lowering in the September/October 2006 jökulhlaup (solidcurve) are shown.
Table 2. Physical parameters used in melt volume calculations
Parameter Value Comment
g 9.82 m s–2 Acceleration of gravityρi 910 kg m–3 Density of iceρw 1000 kg m–3 Density of waterL 3.34 × 10⁵ J kg−1 Latent heat of fusioncw 4.22 × 10³ J kg−1 K−1 Heat capacity of water
675Subglacial flood path development during a rapidly rising jökulhlaup
Downloaded from https://www.cambridge.org/core. 23 Mar 2022 at 09:20:21, subject to the Cambridge Core terms of use.

of 1–7 days for discharge between 20 and 80 m3 s–1. The dis-charge, however, increased from ∼20 to ∼40 m3 s–1 inapproximately half a day and from ∼40 to ∼80 m3 s–1 inless than a day. The form of the discharge variation is alsofar from the nearly exponential concave shape typical forslowly rising jökulhlaups (Fig. 6).
3.2. The geometry of the cauldron, the subglacial lakeand the adjacent flood pathInward movement of the grounding line in the modelled low-ering of the ice shelf (Fig. 7) is minimal, ∼40 m and the waterdepth is reduced in approximately the same proportioneverywhere during outflow. The lake shape for differentstages is therefore similar, leading to the approximatelylinear hypsometric curve shown in Figure 5. This indicatesthat the shelf has a substantial internal strength and shearstress support at the sides. We find that the water pressureat the bottom of the ice shelf in the centre of the cauldronfalls below the ice overburden (positive effective pressureat the top of the subglacial cavity) by 0.2–0.4 MPa during
the main outflow phase. This imbalance is compensated bya bridging shear stress of 0.15–0.3 MPa at the margins ofthe ice shelf. The modelling, furthermore, shows consider-able thickening of the ice shelf during subsidence, whichalso affects the time-dependent shape of the lake (Fig. 7).This thickening from 305 to 320 m is caused by increasedice flow towards the centre during subsidence. The iceflow is increased both because of increased surface slopeof the cauldron and shear softening of the glacier ice. Theshear softening is caused by higher shear stresses in the iceshelf as support from the water pressure in the lake isreduced. The linear shape of the hypsometric curve is,thus, a net result of complex ice dynamics where bothlateral support and vertical extension play a role. The recip-rocal of the slope of a straight line, fitted to the hypsometry(Fig. 5), is the ‘effective’ area of the lake, if it were beingemptied in a piston-like manner. This area, 1 km2, issmaller than the 1.5 km2 initial area of the modelled lakeand relatively constant during lowering. The lowering ofthe surface of the cauldron affects an area substantiallylarger than the subglacial lake so that the surface loweringat the lake edge is ∼20% of the maximum lowering at thecentre. The modelled surface lowering is more than 1 m ata radius of 1050 m, 1.5 times the initial radius of the lake.
The subtraction of the SAR and lidar DEMs from 1998 and2010 indicates a subglacial water body with a smooth,approximately cylindrically symmetrical shape (Fig. 8). Thearea that subsided is ∼2.5 km in diameter, with maximumdepth of ∼90 m near the centre of the cauldron. The elongatedshapes that appear on the flanks of the central water cupola aredue to surface crevasses represented in the 2010 lidar DEMthat were formed or enhanced during the July 2010jökulhlaup. These shapes are thus not surface topographyexpressions of variations in subglacial lake depth. The mod-elled lowering of the ice shelf indicates that the margins ofthe ice surface depression with comparatively little differencein elevation between 2010 and 1998 (Fig. 8) are formed byice dynamics during the lowering of the ice shelf and by iceflow into the cauldron over the month that elapsed from thejökulhlaup in June 2010 to the lidar survey in July (Fig. 7).The true width of the subglacial lake before a jökulhlaupmay thus be expected to be smaller than shown in Figure 8.
Melting over the subglacial flood path has created anelongated depression in the outlet area of the cauldron,visible as the extension to the southwest from the area ofthe western cauldron in Figure 1b. The depression isdeeper shortly after a jökulhlaup (as in 2010) than shortlybefore a jökulhlaup (as in 1998) and has been observed tobe bounded by thin belts of narrow crevasses on each sideafter jökulhlaups (O. Sigurðsson, personal communication,2008), indicating subsidence of the glacier surface alongthe depression. The ice surface elevation difference indicatesthat an ice volume ∼10 m high, a few hundred metres wideand ∼3 km long, which takes the shape of a ridge in Figure 8,is melted as the depression is formed during the initial stageof a jökulhlaup. Due to smoothing caused by ice dynamicsthe true geometry of the subglacial volume could be nar-rower and higher.
3.3. The water level and the depth of the subglaciallakeThe water level in the borehole was at 1488 m a.s.l. at thetime of the instrument set-up in June 2006, which is ∼5 m
Fig. 7. Lake and surface geometry during a jökulhlaup modelled withElmer/Ice. The geometry is drawn at daily intervals with darker colouras time progresses. The lake and surface geometries 1 month after theend of the jökulhlaup are also drawn (dashed curves).
Fig. 6. Back-calculated discharge of jökulhlaup water (solid curve)at the glacier terminus during the jökulhlaup in September/October 2006 after subtracting base flow from the glacier andtributary rivers upstream of the Sveinstindur hydrometric station.The relative elevation of the cauldron centre, as measured withGPS, is also shown (dashed curve) as well as the calculatedoutflow from the subglacial lake (dash-dotted curve) derived fromthe lowering of the ice surface elevation using the hypsometriccurve for the subglacial lake.
676 Subglacial flood path development during a rapidly rising jökulhlaup
Downloaded from https://www.cambridge.org/core. 23 Mar 2022 at 09:20:21, subject to the Cambridge Core terms of use.

higher than the level corresponding to flotation of the centralpart of the shelf. This deviation from floating balance meansthat an excess pressure of∼0.05MPa was acting on the under-side of the ice shelf near the centre (Einarsson, 2009). The iceshelf rose slowly by 12 m from early June to the triggering ofthe jökulhlaup. It then fell by 67 m in 11 days and by ∼55m in the 6 days of most rapid decline (Fig. 6, dashed curve).
Measurements of water depth and ice shelf lowering at thelocation of the June 2006 borehole show that the lake was∼125 m deep just before the jökulhlaup while the loweringof the ice shelf during the jökulhlaup was only 67 m,leaving ∼60 m of water in the lake at the location of the bore-hole. Thus, the lake was not completely drained by the flood.The elevation of the centre of the western cauldron accordingto the 2010 lidar DEM (adjusted to account for the generallowering of the glacier in this area between 2006 and2010) was ∼16 m lower than after the jökulhlaup in 2006.This indicates that more water remained in the subglacial
lake after the 2006 jökulhlaup than after the 2010jökulhlaup.
3.4. Outflow from the subglacial lakeThe outflow from the subglacial lake deduced from the GPSmeasurements of the lowering of the ice shelf is shown inFigure 6. The outflow reached a maximum of ∼100 m3 s–1
in ∼4 days, at about the same time that appreciable flood dis-charge started at the terminus. The outflow then receded in∼4 days.
The travel time of the subglacial flood wave from the caul-dron to the terminus is in the range 29–62 hours. This widerange arises both from an uncertainty in the timing of thestart of outflow from the lake and from the terminus. Thereis a ±12 hour uncertainty of the timing of the start ofoutflow from the lake as the GPS recorder in the cauldrononly recorded elevations once per day. The onset ofoutflow at the terminus is also not well determined, as thediurnal discharge variation at the outlet masked the start ofdischarge increase there. The mean speed of the front ofthe subglacial flood wave along the 40 km path from thecauldron is estimated at 0.2–0.4 m s–1.
3.5. Transient volume of subglacial floodwaterFigure 9 shows the estimated volume of floodwater in the sub-glacial lake and the cumulative volume of the jökulhlaup dis-charge at the glacier margin during the September/October2006 jökulhlaup, as well as the transient volume of waterstored in the subglacial pathway. The volume of water inthe subglacial pathway is estimated by subtracting the cumu-lative volume of flood discharge at the terminus from thecumulative volume of floodwater released from the subgla-cial lake. The subglacial water volume is considerablerelative to the total flood volume of 5.3 × 10⁻² km3. Itreached a maximum of ∼3.3 × 10⁻² km3 on 30 September,2 days after the outflow from the lake reached its maximum,and was already ∼1:4 × 10�2 km3 before any outflowstarted at the glacier margin. For flow speed equal to orlarger than the mean propagation speed of the subglacialflood front and flood path length of 40 km, one finds that aflood path with a volume of less than half the inferred subgla-cial water volume is needed to carry the flood discharge at
Fig. 8. (a) A hillshade of the difference between the adjusted 1998SAR DEM and the 2010 lidar DEM. (b) A contour map of theinferred depth of the subglacial water body emptied in the 2010flood, contour interval of 5 m. The data are smoothed with a 100m × 100 m window.
Fig. 9. Volume of floodwater in the subglacial lake (solid curve),cumulative volume of the flood discharge at the glacier terminus(dash-dotted curve), the estimated volume of water stored in thesubglacial flow path (dashed curve) and calculated amount of meltdue to friction in the flow and initial heat of the floodwater (dottedcurve). Dates are day/month of 2006.
677Subglacial flood path development during a rapidly rising jökulhlaup
Downloaded from https://www.cambridge.org/core. 23 Mar 2022 at 09:20:21, subject to the Cambridge Core terms of use.

the time of maximum subglacial water storage. This will beelaborated below.
3.6. Floodwater temperature and thermodynamicsThe measurements of floodwater temperature in Skaftáduring the September/October 2006 jökulhlaup indicatethat the outburst water was within 1°C from the meltingpoint as it emerged from beneath the ice cap. The uncertaintyof up to 1°C is caused by frictional heating and heatexchange with the atmosphere along the ∼3 km long riverpath from the terminus to the thermometer location.Measurements of floodwater temperature at the glaciermargin in jökulhlaups in Skaftá in August and October2008 and October 2015 showed floodwater temperaturesat the melting point within ± 0.01°C. The measurementswere carried out at a discharge close to the maxima of 240and 1290 m3 s–1 for the August and October jökulhlaups in2008, respectively, and close to the maximum of ∼3000m3 s–1 for the 2015 jökulhlaup. The predicted outflow tem-peratures for these events, according to the heat transferequation in the unsimplified jökulhlaup theory of Nye(1976) as formulated in Jóhannesson (2002), are 0.05–0.8°C and 1.0–2.5°C for the August and October jökulhlaups in2008, respectively, and 1.8–3.4°C for the 2015 jökulhlaup.These calculations are based on the geometry of the floodpath and channel roughness nm (Manning’s roughness) inthe range 0.01–0.1 s m–1/3, and also account for the initialheat stored in the lake water.
The vertical temperature profile through the 100 m deepsubglacial lake in June 2006 (Jóhannesson and others, 2007)showed that the bulk of the water was close to 4.7°C, with adistinct ∼10 m deep layer at 3.5°C at the bottom (bothtemperatures are higher than the temperature correspondingto maximum density of water at the pressures encountered inthe lake). Temperature measurements at different depths inthe subglacial lake below the eastern Skaftá cauldron overseveral months in 2007 showed little variation with time inthe lake water temperature, which was close to 4.0°C atmost depths (unpublished data from the IcelandicMeteorological Office). The lake water temperature in thewestern cauldron during the September/October 2006jökulhlaup may thus be assumed to have been close to4.5°C.
Most of the initial heat in the lake water is presumably lostduring the first few kilometres of the flood path. This is indi-cated by the few hundred metres wide and up to ∼10 m deepdepression that stretches ∼3 km southwestward from thewestern cauldron, along the assumed location of the floodpath, that is more prominent shortly after jökulhlaups thanshortly before the floods, as described above (Figs 1b and8). The volume change of the depression between the 1998DEM and the 2010 DEM is ∼ 1 � 10�2 km3. Bearing inmind that the heat transfer in subglacial water flow may beassumed to be very rapid (Jóhannesson, 2002; Jarosch andZwinger, 2015) and comparing this to the volume of icemelted by the heat content in 0.190 km3 of 4.5°C warmwater discharged out of the cauldron in the 2010jökulhlaup, which is 1.2 × 10⁻² km3, it seems likely thatmost of the initial heat in the 2010 jökulhlaup floodwaterwas lost in the flow along this part of the path. Thesenumbers should of course be considered to represent orderof magnitudes estimates as the volume of the depression isdetermined from measurements of the glacier separated by
many jökulhlaup cycles. We expected similar heat loss tohave taken place in the 2006 jökulhlaup, and therefore thefloodwater may be assumed to have been near the meltingpoint for most of the length of the flood path.
4. DISCUSSION AND CONCLUSIONSOur measurements of the lowering of the ice shelf in thewestern Skaftá cauldron during a jökulhlaup, along with dis-charge measurements of the proglacial flood discharge inSkaftá river, allow estimation of the transient subglacialstorage of floodwater. The inferred subglacial storage andthe measured discharge, along with information on flood-water temperatures in the subglacial reservoir and close tothe glacier margin, may be used to draw conclusions aboutthe formation of the subglacial flood path.
At the time of maximum subglacial storage, 4.3 × 10⁻²
km3 of water had been released from the subglacial lake(Fig. 9). The initial heat contained in this volume of waterwith a temperature of ∼4.5°C and heat formed by potentialenergy dissipation in the flow down the subglacial floodpath (corresponding to a temperature rise of ∼2.0°C) are suf-ficient to melt at most ∼3:4 × 10�3 km3 of ice (Eqn (3)), if allavailable thermal energy is used in melting, and consideringthe potential energy corresponding to the entire elevation dif-ference from the lake to the snout. This is <∼10% of thevolume of water in the subglacial pathway and subglacialstorage along the path, which thus must have been formedmainly by mechanical processes. The ratio of the volumeof ice that could have been melted at any particular pointin time during the entire rising phase of the jökulhlaup tothe subglacial water volume at the same time is also on theorder of 10%. Melting therefore cannot have been themain process responsible for the formation of the initialsubglacial flood path. Other processes, such as lifting of theice, hydraulic fracturing as well as viscous and elasticdeformation induced by water pressure higher than overbur-den pressure, must therefore be the main processes respon-sible for the propagation of the initial jökulhlaup floodwave and the formation of the subglacial path. This is inagreement with earlier findings of Björnsson (1992, 2002),Jóhannesson (2002), Flowers and others (2004) andEinarsson and others (2016) for rapidly rising jökulhlaups,and is in contrast to classic jökulhlaup theory (Nye, 1976)where the flood path is formed by a feedback mechanismbetween water flow and conduit enlargement. Similar transi-ent water storage created by high subglacial water pressureand glacier lifting has been observed for other rapidly risingjökulhlaups at Gornersee, Switzerland (Huss and others,2007; Werder and others, 2009), and at Hidden CreekLake, Alaska (Bartholomaus and others, 2008, 2011). Thesubstantial volume of floodwater that spreads subglaciallyduring the initial phase of the jökulhlaup, ∼ 1:4 × 10�2 km3,before any outflow has started at the terminus, also showsthat outflow from the subglacial lake does not require directthroughflow of water extending from the lake to the terminus.
It may be assumed that essentially all the subglacialvolume of the jökulhlaup path is formed during each individ-ual flood. Preexisting channels, incised into the bedrock orconduits in the ice formed in prior jökulhlaups must be ice-filled since air- or water-filled subglacial cavities in theform of an incipient flood path with a substantial extensionare unlikely to be sustained under the glacier betweenjökulhlaups. According to Nye’s (1953) analysis of the
678 Subglacial flood path development during a rapidly rising jökulhlaup
Downloaded from https://www.cambridge.org/core. 23 Mar 2022 at 09:20:21, subject to the Cambridge Core terms of use.
contraction of a subglacial cylindrical cavity with the creepparameter for temperate ice from Cuffey and Paterson(2010), the radius of an air-filled cavity under 400 m of icewill decrease to <10% of its initial value in less than aweek. Low and broad air-filled cavities collapse evenfaster. Water-filled conduits with flowing water will contractand adjust to available water sources between jökulhlaups.This adjustment is not instantaneous but will take placeover days to weeks, depending on the position within theglacier and the amplitude and rate of change of water input(Cuffey and Paterson, 2010). Finally, a substantial waterbody of stagnant water at the glacier bed is only stable inlocal depressions in the hydraulic potential (Björnsson,1988), such as at the cauldrons between jökulhlaups, andsuch conditions are not present along the flood path of theSkaftá jökulhlaups (Magnússon, 2003).
Due to the strength of the overlying glacier, the part of theflood path that is initially formed by mechanical processescan be expected to be broad and flat and therefore theflow there will be in the form of a sheet. This part of thepath is formed by lifting of the ice through elastic andviscous deformation and hydraulic fracturing induced bywater pressure higher than the ice overburden pressure. Itis, therefore, unlikely to have a horizontal width smallerthan a few ice thicknesses.
Measurements of floodwater temperatures in Skaftá fordischarges on the order of 240–3000 m3 s–1 show that thejökulhlaup water is at or very close to the melting pointwhen it emerges at the glacier terminus. Essentially allinitial heat of the lake water and heat formed in the floodpath by dissipation of potential energy has thus been lostfrom the floodwater. As pointed out by Björnsson (1992),Jóhannesson (2002) and Clarke (2003), this indicates muchmore effective heat transport from the floodwater to the sur-rounding ice walls of the subglacial flood path than is consist-ent with the heat transfer mechanism assumed in the classicunsimplified jökulhlaup theory of Nye (1976), and laterdevelopments of this theory by Spring and Hutter (1981,1982) and Fowler (1999). A better physical understandingof subglacial water flow is clearly needed to explain thisvery efficient heat transfer (Jóhannesson, 2002; Werder andFunk, 2009; Jarosch and Zwinger, 2015).
Magnússon and others (2007) observed an increase insurface speed in an 8 km wide area on Skaftárjökull for asmall jökulhlaup from the eastern cauldron in 1995, exceptfor the uppermost 6 km of the flood path near the cauldronwhere no speed-up was observed. They suggested that the1995 jökulhlaup was drained in a conduit along this upper-most part of the flood path and as a sheet farther down inagreement with the interpretation presented here for the2006 jökulhlaup. Narrow flood paths with width <500 mextending from both cauldrons are indeed indicated by theelongated surface depressions near the cauldrons describedearlier. Although melting driven by the initial heat of thefloodwater can only create ∼10% of the subglacial waterstorage, this melting can play an important role over alimited part of the flood path length. A plausible mechanismfor the initiation of the flood therefore appears to be (i)melting of a conduit along the first ∼3 km of the path,driven by rapid release of the initial heat of the lake water,and (ii) formation of a sheet-like flood path farther down-glacier by lifting and ice deformation due to a propagatingsubglacial pressure wave (Jóhannesson, 2002; Einarssonand others, 2016). Such a sheet-like initial subglacial flood
path can rapidly develop conduits to become a highly effi-cient waterway (Jóhannesson, 2002; Flowers and others,2004; Einarsson and others, 2016) allowing faster rise of dis-charge than the conduit-melt–discharge feedback (Nye,1976) (Fig. 6, solid curve). The formation of a pressurewave requires an efficient pressure connection betweentwo locations of the flood path where subglacial water pres-sure near ice overburden at the upper location leads to pres-sure higher than ice overburden at the (lower) location fartherdown the path. In the case of the Skaftá cauldrons, theconduit formed by the release of the initial heat near the caul-dron may provide this connection with a small potential gra-dient needed to drive the water flow. This situation may be anessential component in the formation of a subglacial pressurewave in jökulhlaups at this location. The propagating pres-sure wave would then not be formed at the source lake butsome kilometres downstream of it, explaining the shift fromconduit flow to sheet flow inferred for the 1995 jökulhlaupby Magnússon and others (2007).
We find that only part of the subglacial water storage isneeded to carry the discharge of the flood, even for low esti-mates of the flow speed, particularly during the initial rise ofthe flood discharge. This may be interpreted as initial storagein subglacial reservoirs that do not contribute much to thetransportation of floodwater. Such transient subglacialstorage of floodwater has been documented for a rapidlyrising jökulhlaup in 2004 from Gornersee in Switzerland(Huss and others, 2007; Werder and others, 2009). Up tohalf of the volume of this flood is reported to have beenstored subglacially and they suggest that this storage isrelated to lateral spreading of the floodwater and uplift ofthe glacier. This is not a unique feature of rapidly risingjökulhlaups, as lateral spreading and glacier uplift has alsobeen observed for slowly rising jökulhlaups fromGrímsvötn and Gornersee, where a propagating subglacialpressure wave was not observed (Huss and others, 2007;Magnússon and others, 2007; Werder and others, 2009;Magnússon and others, 2011; Einarsson and others, 2016).
A rise in the ratio of subglacial volume needed to carry thedischarge of the flood to the total volume of subglacial watermay be inferred from our data. This indicates a developmenttowards more efficient subglacial water flow and/or releaseof water from subglacial storage to the main flood pathover the course of the 2006 jökulhlaup. This may be inter-preted as a development towards effective conduit flowfrom ineffective initial sheet flow formed in the wake of asubglacial pressure wave.
Our estimate for the travel speed of the subglacial floodfront in 2006 (0.2–0.4 m s–1) is faster than the propagationspeed of a small jökulhlaup from the eastern Skaftá cauldronin October 1995 (<0.06 m s–1) estimated by Magnússon andothers (2007, there is a typo in Magnússon’s paper where thisspeed is given as 0.6 m s–1). Magnússon and others’ (2007)estimation is based on detection of ice surface speed-updue to the jökulhlaup by SAR satellite imagery before theflood front reached the ice margin. Similar propagationspeeds as our estimate for the 2006 jökulhlaup have alsobeen estimated for a small jökulhlaup from the western caul-dron in August 2008 and a large jökulhlaup from the easterncauldron in October 2008, 0.1–0.3 and 0.4–0.6 m s–1,respectively (Einarsson and others, 2016). These travelspeed estimates are considerably slower than the speed ofthe flood front of the rapidly rising jökulhlaup fromGrímsvötn in November 1996 (1.3 m s–1) (Björnsson, 2002)
679Subglacial flood path development during a rapidly rising jökulhlaup
Downloaded from https://www.cambridge.org/core. 23 Mar 2022 at 09:20:21, subject to the Cambridge Core terms of use.

but similar to the speed of a flood front of a rapidly risingjökulhlaup from Hidden Creek Lake, Alaska, in July 2006(0.4 m s–1) (Bartholomaus and others, 2011). The speed ofthe subglacial flood front for rapidly rising jökulhlaups there-fore seems to vary between different locations due to differ-ences in flood path geometry, and large subglacial floodsappear to propagate faster than small floods at the samelocation.
There are indications that the speed of the subglacialwater flow increases at later stages for jökulhlaups in Skaftáafter the proglacial discharge has peaked. This developmentmay also be interpreted as filling of lateral storage of flood-water during the initial phase of the flood that may laterrelease subglacially stored water into the main flood path.Earthquake tremors, indicating boiling within the geothermalsystem below the subglacial lake, due to the pressure releaseaccompanying the emptying of the lake, were observedduring a jökulhlaup from the eastern cauldron in 2002. Atime series for the concentration of suspended material inthe jökulhlaup waters at the gauging station at Sveinstindurdisplayed a peak believed to result from the same boilingevent. The timing of the earthquake tremors and the peakin the suspended sediments were used to estimate a speedfor the subglacial water flow, ∼0.8 ± 0.1 m s–1 (O.Sigurðsson, personal communication, 2008). This is 2–4times the speed estimated here for the initial phase of the2006 jökulhlaup and 1.3–2 times the speed estimated forthe 2008 October jökulhlaup.
The derived shape of the lake at a full stage (Fig. 8) resem-bles the theoretically predicted shape of subglacial lakesbelow a surface cauldron with a slope of the ice/water inter-face at the top of the lake that is opposite to the slope of theice surface and an order of magnitude larger (Björnsson,1975, 2002). The derived shape does not reflect the fulldepth and extent of the water body, as some water was leftin the lake after the jökulhlaups in 2006 and 2010. Forsimilar ice-shelf thickness in 2010 to that in 2006, ∼40 mof water would have been left at the cauldron centre. Theresolution of bedrock data is insufficient to determinewhether this water is located in a bedrock depression orretained by the closing of the lake seal. The decline of the dis-charge after the flood peaks varies between jökulhlaups, andthe final elevation of the ice shelf after jökulhlaups varies bytens of metres (unpublished data from the IcelandicMeteorological Office and the Institute of Earth Sciences atthe University of Iceland). This indicates that the closing ofthe seal depends delicately on some (subglacial) conditionsthat vary from event to event. Termination of jökulhlaupsbefore the water level drops below the bedrock threshold isalso observed at Grímsvötn (Björnsson, 1974) and has beenassumed to be caused by conduit closing because of icedeformation exceeding melting of conduit walls (Björnsson,1974; Nye, 1976) or settling of a flat-based ice dam onto asmooth bedrock (Björnsson, 1974). Some jökulhlaups, forexample at Gornersee, continue, however, until the sourcelake is empty (Werder and others, 2009).
The hypsometric curve for a subglacial lake during lower-ing in a jökulhlaup depends on the strength of the overlyingice shelf, which determines to what extent the shelf is carriedby floating or shear forces. Our simulations show that theshelf has considerable shear strength, due to shear stressesinduced by the subsidence that are caused by verticalshear straining over the entire shelf except at the centre,and the local force balance therefore deviates from floating
equilibrium. The resulting hypsometric curve is nearlylinear (Fig. 5) and not concave as it would be for a lakeunder an ice shelf mainly carried by floating. Our resultsshow that ice-surface depressions caused by the emptyingof subglacial lakes are considerably larger than the footprintof the corresponding water body at the glacier bed; in thecase of the western Skaftá cauldron, modelled ice-surfacesubsidence >1 m is found over an area more than twicethat of the subglacial lake. This result may be relevant fortime-varying subglacial water bodies at other locations.
Our magnitude for the pressure difference and lateralshear stress, 0.2–0.4 and 0.15–0.3 MPa, respectively, maybe crudely compared with the analytical results of the caul-dron subsidence model of Evatt and Fowler (2007). Theirmodel predicts ∼0.15 and ∼0.2 MPa for the pressure differ-ence and shear stress, respectively, when the model para-meters have been adapted to the spatial scale of thewestern Skaftá cauldron, assuming ice flow parameters fortemperate ice and a similar outflow magnitude as for the2006 jökulhlaup. The model of Evatt and Fowler is basedon 2-D geometry, rather than cylindrical geometry, and thewater outflow is calculated by Nye’s (1976) theory forslowly rising jökulhlaups, whereas we employ an outflowvariation corresponding to a rapidly rising flood. Consideringthese differences in assumptions and the formulation of themodels, there is overall agreement between the models onthe dynamics of the cauldron subsidence.
Many of the most well-known rapidly rising jökulhlaups,such as the jökulhlaups from the Katla volcano (Tómasson,1996) and the 1996 Grímsvötn jökulhlaup, are dramaticand up to more than three orders of magnitude larger thanthe jökulhlaup described in this paper. The relatively smallsize of the rapidly rising jökulhlaups from the Skaftá caul-drons therefore indicates that the total water volume (i.e.flood size) is not the key factor determining the rapidity offlood release. Considering that some large and smalljökulhlaups in Iceland in modern times were rapidly rising(Björnsson, 2002; Jóhannesson, 2002; Sigurðsson andEinarsson, 2005; Einarsson and others, 2016), the type oflarge jökulhlaups at the end of the last glaciation in Icelandand elsewhere must be considered an open question. A fun-damental understanding of the conditions that determine thedevelopment of subglacial floods, in particular whether theydevelop rapidly by lifting of the overlying ice or over a longertime through a feedback between discharge and ice meltingin a conduit, is therefore required for an improved under-standing of prehistoric jökulhlaups. Theoretical studies ofthe palaeohydraulics of jökulhlaups from Lake Missoula,Montana, USA (Clarke and others, 1984), and LakeAgassiz, North America (Clarke and others, 2004), arebased on the assumption that these floods were of theslowly rising type and controlled by the melt-discharge-feed-back in a conduit. The possibility of a sheet-like flood fromLake Agassiz is deemed highly unlikely by Clarke andothers (2005) as the inflow into the lake was not rapid andas it is not likely that the critical conditions for ice-damlifting would be reached over large areas of a dam restingon an irregular bed and variously attacked by icebergcalving. Our example of a rapidly rising flood with aninitial sheet-like flood path from the slowly filling subglaciallake below the western Skaftá cauldron shows that rapidinflow is not an essential condition for the release of suchfloods. Our interpretation also indicates that a flood paththat starts as a conduit near the source lake can develop as
680 Subglacial flood path development during a rapidly rising jökulhlaup
Downloaded from https://www.cambridge.org/core. 23 Mar 2022 at 09:20:21, subject to the Cambridge Core terms of use.
a sheet farther downstream if a propagating subglacial pres-sure wave is formed.
ACKNOWLEDGEMENTSThe Icelandic Research Fund, the Landsvirkjun (NationalPower Company of Iceland) Research Fund, the IcelandicRoad Administration, the Kvískerja fund and the IcelandGlaciological Society provided financial and field support,which made this study possible. A map of the subglacial top-ography along the route of jökulhlaups from the Skaftá caul-drons and the inferred paths of the jökulhlaups shown inFigure 1 was made available by Helgi Björnsson andFinnur Pálsson at the Institute of Earth Sciences of theUniversity of Iceland. Halldór Geirsson at the IcelandicMeteorological Office provided GPS base data fromGrímsvötn and Skrokkalda. We thank Olivier Gagliardinifor assistance with the Elmer/Ice model calculations. TheIcelandic Coast Guard provided helicopter transportation tothe western cauldron in November 2006. This material isbased upon work supported in part by the NationalAeronautics and Space Administration through the NASAAstrobiology Institute under Cooperative AgreementNNA04CC08A issued through the Office of Space Science.Thomas Zwinger was supported by the Nordic Centre ofExcellence, ‘eScience Tools for Investigating ClimateChange at High Northern Latitudes’ (eSTICC) funded byNordForsk. We thank Vilhjálmur S. Kjartansson, GunnarSigurðsson, Hlynur Skagfjörð Pálsson and Mary Miller forassistance during field operations. We thank GwennFlowers and two anonymous reviewers of an earlier versionof the manuscript and Geoffrey W. Evatt and an anonymousreviewer of this manuscript for detailed and constructivecomments that helped us improve the paper and KenMoxham for help with the English language. This publicationis contribution No. 4 of the Nordic Centre of ExcellenceSVALI, ‘Stability and Variations of Arctic Land Ice’, fundedby the Nordic Top-level Research Initiative (TRI).
REFERENCESBartholomaus TC, Anderson RS and Anderson SP (2008) Response
of glacier basal motion to transient water storage. Nat. Geosci.,1(1), 33–37 (doi: 10.1038/ngeo.2007.52)
Bartholomaus TC, Anderson RS and Anderson SP (2011) Growthand collapse of the distributed subglacial hydrologic system ofKennicott Glacier, Alaska, USA, and its effects on basalmotion. J. Glaciol., 57(206), 985–1002 (doi: 10.3189/002214311798843269)
Bell RE (2008) The role of subglacial water in ice-sheet massbalance. Nat. Geosci., 1(5), 297–304 (doi: 10.1038/ngeo186)
Björnsson H (1974) Explanation of jökulhlaups from Grímsvötn,Vatnajökull, Iceland. Jökull, 24, 1–26
Björnsson H (1975) Subglacial water reservoirs, jökulhlaups and vol-canic eruptions. Jökull, 25, 1–11
Björnsson H (1977) The cause of jökulhlaups in the Skaftá river,Vatnajökull. Jökull, 27, 71–78
Björnsson H (1988) Hydrology of ice caps in volcanic regions.Societas Scientarium Islandica, University of Iceland,Reykjavík, Iceland
Björnsson H (1992) Jökulhlaups in Iceland: prediction, characteris-tics and simulation. Ann. Glaciol., 16, 95–106
Björnsson H (2002) Subglacial lakes and jökulhlaups in Iceland.Global Planet. Change, 35, 255–271
Björnsson H (2010) Understanding jökulhlaups: from tale to theory.J. Glaciol., 56(200), 1002–1010
Clarke GKC (2003) Hydraulics of subglacial outburst floods: newinsights from the Spring-Hutter formulation. J. Glaciol., 49(165),299–313
Clarke GKC, MathewsWH and Pack RT (1984) Outburst floods fromglacial Lake Missoula. Quat. Res., 22(3), 289–299
Clarke GKC, Leverington DW, Teller JT and Dyke AS (2004)Paleohydraulics of the last outburst flood from glacial LakeAgassis and the 8200 BP cold event. Quat. Sci. Rev., 23, 389–407 (doi: 10.1016/j.quascirev.2003.06.004)
Clarke GKC, Leverington DW, Teller JT, Dyke AS and Marshall SJ(2005) Fresh arguments against the Shaw megaflood hypothesis.A reply to comments by David Sharpe on ‘Paleohydraulics of thelast outburst flood from glacial Lake Agassiz and the 8200 BPcold event’. Quat. Sci. Rev., 24, 1533–1541 (doi: 10.1016/j.quascirev.2004.12.003)
Cuffey KM and Paterson WSB (2010) The physics of glaciers, 4thedn. Elsevier, Oxford
Doyle SH and 15 others (2015) Amplified melt and flow of theGreenland ice sheet driven by late-summer cyclonic rainfall.Nat. Geosci., 8, 647–653 (doi: 10.1038/ngeo2482)
Einarsson B (2009) Jökulhlaups in Skaftá: A study of a jökulhlaup fromthe Western Skaftá cauldron in the Vatnajökull ice cap, Iceland.(MS thesis, University of Iceland, also available as technicalreport VI 2009–006 from the Icelandic Meteorological Office)
Einarsson B and 5 others (2016) A spectrum of jökulhlaup dynamicsrevealed by GPS measurements of glacier surface motion. Ann.Glaciol., 57(72), 47–61 (doi: 10.1017/aog.2016.8)
Evatt GW and Fowler AC (2007) Cauldron subsidence and subglacialfloods. Ann. Glaciol., 45, 163–168 (doi: 10.3189/172756407782282561)
Fetter CW (2001) Applied Hydrogeology. International edn. 4th edn.Pearson Education, New Jersey
Flowers GE, Björnsson H, Pálsson F and Clarke GKC (2004) Acoupled sheet–conduit mechanism for jökulhlaup propagation.Geophys. Res. Lett., 31(5), L05401 (doi: 10.1029/2003GL019088)
Fowler AC (1999) Breaking the seal at Grímsvötn, Iceland. J.Glaciol., 45(151), 506–516
Fricker HA, Scambos T, Bindschadler R and Padman L (2007) Anactive subglacial water system in West Antarctica mapped fromspace. Science, 315(5818), 1544–1548 (doi: 10.1126/science.1136897)
Fudge TJ, Harper JT, Humphrey NF and Pfeffer WT (2009) Rapidglacier sliding, reverse ice motion and subglacial water pressureduring an autumn rainstorm. Ann. Glaciol., 50(52), 101–108
Gagliardini O and 14 others (2013) Capabilities and performance ofElmer/Ice, a new-generation ice sheet model. Geosci. ModelDev., 6(4), 1299–1318
Huss M, Bauder A, Werder M, Funk M and Hock R (2007) Glacier-dammed lake outburst events of Gornersee, Switzerland. J.Glaciol., 53(181), 189–200
Iken A and Bindschadler RA (1986) Combined measurements ofsubglacial water pressure and surface velocity ofFindelengletscher, Switzerland: conclusions about drainagesystem and sliding mechanism. J. Glaciol., 32(110), 101–119
Jarosch AH and Zwinger T (2015) Explicit numerical modeling ofheat transfer in glacial channels. American Geophysical Union,Fall Meeting 2015, abstract #C54B-05
Jóhannesson T (2002) Propagation of a subglacial flood wave duringthe initiation of a jökulhlaup. Hydrol. Sci. J., 47(3), 417–434
Jóhannesson T, Thorsteinsson Th, Stefánsson A, Gaidos E andEinarsson B (2007) Circulation and thermodynamics in a subgla-cial geothermal lake under the Western Skaftá cauldron of theVatnajökull ice cap, Iceland.Geophys. Res. Lett., 34(19), L19502
Jóhannesson T and 7 others (2013) Ice-volume changes, biasestimation of mass-balance measurements and changes in sub-glacial lakes derived by lidar mapping of the surface ofIcelandic glaciers. Ann. Glaciol., 54(63), 63–74 (doi: 10.3189/2012AoG63A422)
Jónsdóttir JF, Kristjánsdóttir GB and Zóphóníasson S (2001) Skaftávið Sveinstind, vhm 166 Rennslislykill nr. 5 [Skaftá by
681Subglacial flood path development during a rapidly rising jökulhlaup
Downloaded from https://www.cambridge.org/core. 23 Mar 2022 at 09:20:21, subject to the Cambridge Core terms of use.

Sveinstindur, vhm 166 Discharge water elevation relationshipnumber 5]. National Energy Authority, Reykjavík, Report OS-2001/001
Jónsson GÞ and Þórarinsdóttir T (2011) Hlaup í Múlakvísl 8.–10. júlí2011 [Outburst flood in Múlakvísl 8–10 July 2011]. IcelandicMeteorological Office, Reykjavík, GThJ-TTh/2011-01
Jónsson S (2007) Flóðrakning með takmörkuðum gögnum [Floodrouting with limited input data]. (MS-thesis, University of Iceland)
Magnússon E (2003) Airborne SAR data from S-Iceland: analyses,DEM improvements and glaciological application. (MS-thesis,University of Iceland)
Magnússon E, Rott H, Björnsson H and Pálsson F (2007) The impactof jökulhlaups on basal sliding observed by SAR interferometryon Vatnajökull, Iceland. J. Glaciol., 53(181), 232–240
Magnússon E and 8 others (2011) Localized uplift of Vatnajökull,Iceland: subglacial water accumulation deduced from InSARand GPS observations. J. Glaciol., 57(203), 475–484
Nye JF (1953) The flow law of ice from measurements in glaciertunnels, laboratory experiments and the Jungfraufirn boreholeexperiment. Proc. R. Soc. London, Ser. A, 219(1139), 477–489
Nye JF (1976) Water flow in glaciers: Jökulhlaups, tunnels and veins.J. Glaciol., 17(76), 181–207
Pálsson F, Björnsson H, Haraldsson HH and Magnússon E (2006)Vatnajökull: Mass balance, meltwater drainage and surface vel-ocity of the glacial year 2004–2005. Institute of Earth Sciences,University of Iceland, Report RH-06-2006
Rignot E and Kanagaratnam P (2006) Changes in the velocitystructure of the Greenland Ice Sheet. Science, 311(5763),986–990
Roberts MJ (2005) Jökulhlaups: a reassessment of floodwater flowthrough glaciers Rev. Geophys., 43, RG1002 (doi: 10.1029/2003RG000147)
Sigurðsson O and Einarsson B (2005) Jökulhlaupaannáll 1989–2004[Catalogue of jökulhlaups in Iceland 1989–2004]. NationalEnergy Authority, Reykjavík, Report OS-2005-031
Spring U and Hutter K (1981) Numerical studies of jökulhlaups. ColdReg. Sci. Technol., 4(3), 227–244
Spring U and Hutter K (1982) Conduit flow of a fluid through its solidphase and its application to intraglacial channel flow. Int. J. Eng.Sci., 20(2), 327–363
Stearns LA, Smith BL and Hamilton GS (2008) Subglacial floodscause rapid increase in flow speed of a major East Antarcticoutlet glacier.Nat. Geosci., 1, 827–831 (doi: 10.1038/ngeo0356)
Sugiyama S, Bauder A, Huss M, Riesen P and Funk M (2008)Triggering and drainage mechanisms of the 2004 glacier-dammed lake outburst in Gornergletscher, Switzerland. J.Geophys. Res., 113, F04019 (doi: 10.1029/2007JF000920)
Thórarinsson S (1974) Vötnin stríð. Saga Skeiðarárhlaupa og Gríms-vatnagosa. [The swift flowing rivers. The history of Gríms-vötn jökulhlaups and eruptions]. Bókaútgáfa Menningarsjóðs,Reykjavík. 254 pp
Thorsteinsson Th and 8 others (2007) A hot water drill with built-insterilization: design, testing and performance. Jökull, 57, 71–82
Tómasson H (1996) The jökulhlaup from Katla in 1918. Ann.Glaciol., 22, 249–254
Werder MA and Funk M (2009) Dye tracing a jökulhlaup: II. Testinga jökulhlaup model against flow speeds inferred from measure-ments. J. Glaciol., 55(193), 899–908
Werder MA, Loye A and Funk M (2009) Dye tracing a jökulhlaup:I. Subglacial water transit speed and water-storage mechanism.J. Glaciol., 55(193), 889–898
Zóphóníasson S (2002) Rennsli í Skaftárhlaupum 1955–2002[Discharge in jökulhlaups in Skaftá 1955–2002]. NationalEnergy Authority, Reykjavík, Report SZ-2002/01
MS received 9 December 2016 and accepted in revised form 26 May 2017; first published online 6 July 2017
682 Subglacial flood path development during a rapidly rising jökulhlaup
Downloaded from https://www.cambridge.org/core. 23 Mar 2022 at 09:20:21, subject to the Cambridge Core terms of use.