sub-project title: combined inclusion of a reducing agent
TRANSCRIPT

POULTRY CRC LTD
FINAL REPORT
Project No: 2.9.3
PROJECT LEADERS: Amy F Moss, Ha H Truong, Sonia Yun Liu, and Peter H Selle
DATE OF COMPLETION: April 2016
Sub-Project Title: Combined inclusion of a reducing agent and an exogenous protease in poultry diets

2
© 2016 Poultry CRC Ltd All rights reserved. ISBN 1 921010 89 4 Combined inclusion of a reducing agent and an exogenous protease in poultry diets Project No. 2.9.3
The information contained in this publication is intended for general use to assist public knowledge and discussion and to help improve the development of sustainable industries. The information should not be relied upon for the purpose of a particular matter. Specialist and/or appropriate legal advice should be obtained before any action or decision is taken on the basis of any material in this document. The Poultry CRC, the authors and/or contributors do not assume liability of any kind whatsoever resulting from any person's use or reliance upon the content of this document. This publication is copyright. However, Poultry CRC encourages wide dissemination of its research, providing the Centre is clearly acknowledged. For any other enquiries concerning reproduction, contact the Communications Officer on phone 02 6773 3767. Researcher Contact Details Peter H Selle BVSc PhD MRCVS Adjunct Associate Professor Poultry Research Foundation Camden Campus, The University of Sydney 425 Werombi Road Camden NSW 2570 Phone: (02) 9351 1697 Email: [email protected]
Poultry CRC Contact Details PO Box U242 University of New England ARMIDALE NSW 2351 Phone: 02 6773 3767 Fax: 02 6773 3050 Email: [email protected]. Website: http://www.poultrycrc.com.au Published in 2017

3
Executive Summary
The effects of tandem inclusions of a sulphite reducing agent, sodium metabisulphite, and an
exogenous protease, Ronozyme® ProAct, in wheat- and sorghum-based diets for broiler chickens
were investigated. Male Ross 308 chicks were offered nutritionally-equivalent experimental diets
from 7 to 28 days post-hatch in a 2x2x2 factorial array of dietary treatments, which comprised:
(i) diets based on wheat or sorghum, (ii) without and with 2.75 g/kg sodium metabisulphite, (iii)
without and with 1000/kg units of protease activity. The parameters assessed included growth
performance, nutrient utilisation, protein (N) digestibility coefficients and disappearance rates
(g/bird/day) in four small intestinal segments, starch digestibility coefficients and disappearance
rates in two small intestinal segments and starch:protein disappearance rate ratios in the proximal
jejunum and distal ileum.
The outstanding outcomes were significant grain type by sodium metabisulphite
interactions (P = 0.015–0.005) observed for apparent metabolisable energy (AME),
metabolisable energy:gross energy ratios (ME:GE), nitrogen (N) retention and N-corrected AME
(AMEn). The inclusion of sodium metabisulphite in sorghum-based diets enhanced AME by
0.18 MJ (12.47 versus 12.29 MJ/kg), ME:GE ratios by 1.20% (0.761 versus 0.752), N retention
by 1.89 percentage units (65.80 versus 63.91%) and AMEn by 0.09 MJ (11.17 versus 11.08
MJ/kg). In contrast, sodium metabisulphite inclusion in wheat-based diets depressed AME by
0.43 MJ (11.88 versus 12.31 MJ/kg), ME:GE ratios by 3.65% (0.713 versus 0.740), N retention
by 2.65 percentage units (61.75 versus 64.40%) and AMEn by 0.40 MJ (10.53 versus 10.93
MJ/kg). A similar interaction was observed for feed conversion ratios (FCR) that approached
statistical significance (P = 0.061) where sodium metabisulphite improved FCR of sorghum-
based diets by 1.28% (1.541 versus 1.561) but depressed FCR of wheat-based diets by 3.68%
(1.577 versus 1.521).
Clearly, therefore, the benefits of including sodium metabisulphite in sorghum-based
diets do not extend to wheat-based broiler diets. This suggests, as discussed, that sodium
metabisulphite-generated reductions of disulphide cross-linkages in β- and γ-fractions of kafirin
located in the periphery of protein bodies are pivotal to sodium metabisulphite responses in
sorghum-based diets. It does appear that the positive effects of sodium metabisulphite may be
4
“sorghum specific” and stem from biophysical and/or biochemical starch-protein interactions
involving starch granules and kafirin protein bodies which are both embedded in the glutelin
protein matrix of sorghum endosperm.
As a main effect, protease significantly increased feed intake by 2.91% (2408 versus
2340 g/bird; P < 0.05) and tended to increase protein (N) digestibility coefficients by 9.37%
(0.537 versus 0.491; P = 0.052) in the proximal jejunum. Thus overall responses to an exogenous
protease were subtle.
In a preliminary investigation, concentrations of free amino acids and glucose in the
portal (anterior mesenteric vein) and systemic (brachial vein) blood-flows were determined in
birds offered control wheat-based diets and the same diet supplemented with sodium
metabisulphite and protease. The two feed additives in tandem significantly depressed plasma
amino acid concentrations of the following amino acids: alanine, cystine, glutamine, glycine,
histidine, isoleucine, methionine, proline, serine and valine. The two feed additives numerically
disadvantaged FCR by 4.56% (1.582 versus 1.513) and there are some instructive correlations
between free amino acid concentrations in portal blood and FCR of broiler chicks.
Finally, it is our intention to submit a paper based on this study to Animal Nutrition. The
tentative title is “Inclusions of sodium metabisulphite and exogenous protease, individually and
in combination, generate interactions between sodium metabisulphite and grain type in wheat-
and sorghum-based broiler diets for parameters of nutrient utilisation” by Peter H Selle, Ha H
Truong, Amy F Moss and Sonia Yun Liu.

5
Objectives
The primary objective of this project was to investigate the tandem inclusions of a sulphite
reducing agent, sodium metabisulphite, and an exogenous protease, Ronozyme® ProAct, in diets
for broiler chickens. The rationale was that because exogenous proteases do not have the
capacity to reduce disulphide cross-linkages they could be advantaged by the simultaneous
inclusion of a reducing agent. The secondary objective was to ascertain whether or not the
benefits of including sodium metabisulphite in sorghum-based diets extend to wheat-based
broiler diets.
Methodolgy
Wheat, sorghum and soybean meal were characterised and wheat- and sorghum-based diets were
formulated to standard nutrient specifications as shown in Table 1. Sodium metabisulphite (2.75
g/kg) and/or an exogenous protease (500 g/kg) were included in the two basal diets that were
steam-pelleted at a conditioning temperature of 80°C and crumbled. The trial design consisted of
a 2x2x2 factorial array of dietary treatments; wheat or sorghum-based diets, without and with Na
metabisulphite, without and with exogenous protease. The enzyme used was Ronozyme® ProAct
(CT), a serine protease produced by a genetically modified strain of Bacillus licheniformis, and
marketed by DSM. The addition rate provided 1000 units of protease activity per kg of feed.
Each of the eight dietary treatments was offered to six replicates (6 male Ross 308 chicks
per caged replicate) from 7 to 28 days post-hatch in an environmentally-controlled housing
facility. Growth performance and nutrient utilisation [AME (MJ/kg and MJ/day), ME:GE ratios,
N retention, AMEn] were determined by standard procedures. Similarly, apparent digestibility
coefficients of protein (N) in four small intestinal sites (proximal jejunum, distal jejunum,
proximal ileum, distal ileum) and disappearance rates (g/bird/day) were determined. Apparent
digestibility coefficients and disappearance rates of starch were determined in the proximal
jejunum and distal ileum and starch:protein disappearance rate ratios in these two sites were
calculated. Blood samples from two treatment groups were taken from the anterior mesenteric
and brachial veins to determine concentrations of free amino acids and glucose, which is
considered separately.

6
Experimental data was analysed using the IBM SPSS Statistics 20 program (IBM
Corporation, Somers, NY, USA). The feeding study complied with specific guidelines approved
by the Animal Ethics Committee of the University of Sydney.
Results
The effects of grain type and dietary inclusions of sodium metabisulphite and protease on growth
performance are shown in Table 2. Overall, bird performance was highly satisfactory with a
weight gain of 1532 g/bird, feed intake of 2370 g/bird, FCR of 1.549 from 7 to 28 days post-
hatch with a low mortality/cull rate of 0.78%. The only significant treatment effect observed was
that protease increased feed intake by 2.91% (2408 versus 2340 g/bird; P < 0.05). However, the
interaction between grain type and sodium metabisulphite closely approached significance (P =
0.061) for FCR. This was because sodium metabisulphite improved FCR of sorghum-based diets
by 1.28% (1.541 versus 1.561) but depressed FCR of wheat-based diets by 3.68% (1.577 versus
1.521).
The effects of dietary treatments on parameters of nutrient utilisation are shown in Table
3. As a main effect, sorghum-based diets supported better AME by 0.29 MJ (12.38 versus 12.09
MJ/kg; P < 0.01), ME:GE ratios by 3.99% (0.756 versus 0.727; P < 0.001), N retention by 1.77
percentage units (64.85 versus 63.08%; P < 0.04) and AMEn by 0.30 MJ (11.03 versus 10.73
MJ/kg; P < 0.001). However, there were significant grain type by sodium metabisulphite
interactions (P = 0.015 – 0.005) that impacted on the above outcomes of all four parameters. The
inclusion of sodium metabisulphite in sorghum-based diets enhanced AME by 0.18 MJ (12.47
versus 12.29 MJ/kg), ME:GE ratios by 1.20% (0.761 versus 0.752), N retention by 1.89
percentage units (65.80 versus 63.91%) and AMEn by 0.09 MJ (11.17 versus 11.08 MJ/kg). In
total contrast, sodium metabisulphite inclusion in wheat-based diets depressed AME by 0.43 MJ
(11.88 versus 12.31 MJ/kg), ME:GE ratios by 3.65% (0.713 versus 0.740), N retention by 2.65
percentage units (61.75 versus 64.40%) and AMEn by 0.40 MJ (10.53 versus 10.93 MJ/kg).
Dietary treatments did not influence energy intake expressed as MJ/day.
The effects of dietary treatments on apparent protein (N) digestibility coefficients in four
small intestinal segments at 28 days post-hatch are shown in Table 4. There were no significant
effects recorded. Although, protease increased proximal jejunal protein (N) digestibility
coefficients by 11.0% (0.537 versus 0.491; P = 0.052), which closely approached significance.

7
The effects of dietary treatments on protein (N) disappearance rates in four small
intestinal segments are shown in Table 5. Wheat-based diets supported a higher distal ileal
protein disappearance rate by 13.9% (27.0 versus 23.7 g/bird/day; P < 0.001). There was a
significant interaction (P < 0.025) between grain type and Na metabisulphite in the distal
jejunum. Sodium metabisulphite increased protein disappearance rates by 8.64% (23.9 versus
22.0 g/bird/day) in sorghum-based diets; but decreased protein disappearance rates by 7.08%
(22.3 versus 24.0 g/bird/day) in wheat-based diets.
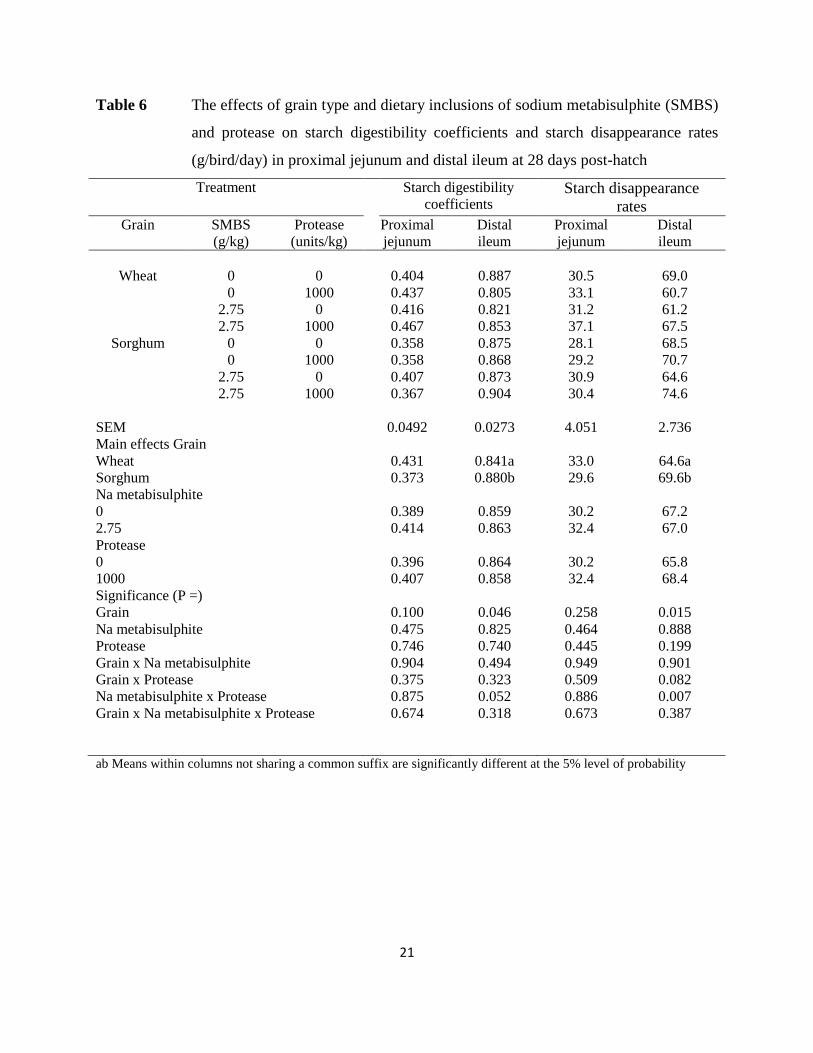
The effects of dietary treatments on starch digestibility coefficients and starch
disappearance rates in the proximal jejunum and distal ileum are shown in Table 6. Sorghum-
based diets supported higher distal ileal starch digestibility coefficients by 4.64% (0.880 versus
0.841; P < 0.05) and starch disappearance rates by 7.74% (69.6 versus 64.6 g/bird/day; P < 0.02)
than wheat-based diets. There was a significant sodium metabisulphite by protease interaction (P
= 0.007) for starch disappearance rates in the distal ileum. Protease alone retarded starch
disappearance rates from 68.8 to 65.7 g/bird/day; whereas, in combination with sodium
metabisulphite, protease accelerated rates from 62.8 to 71.0 g/bird/day.
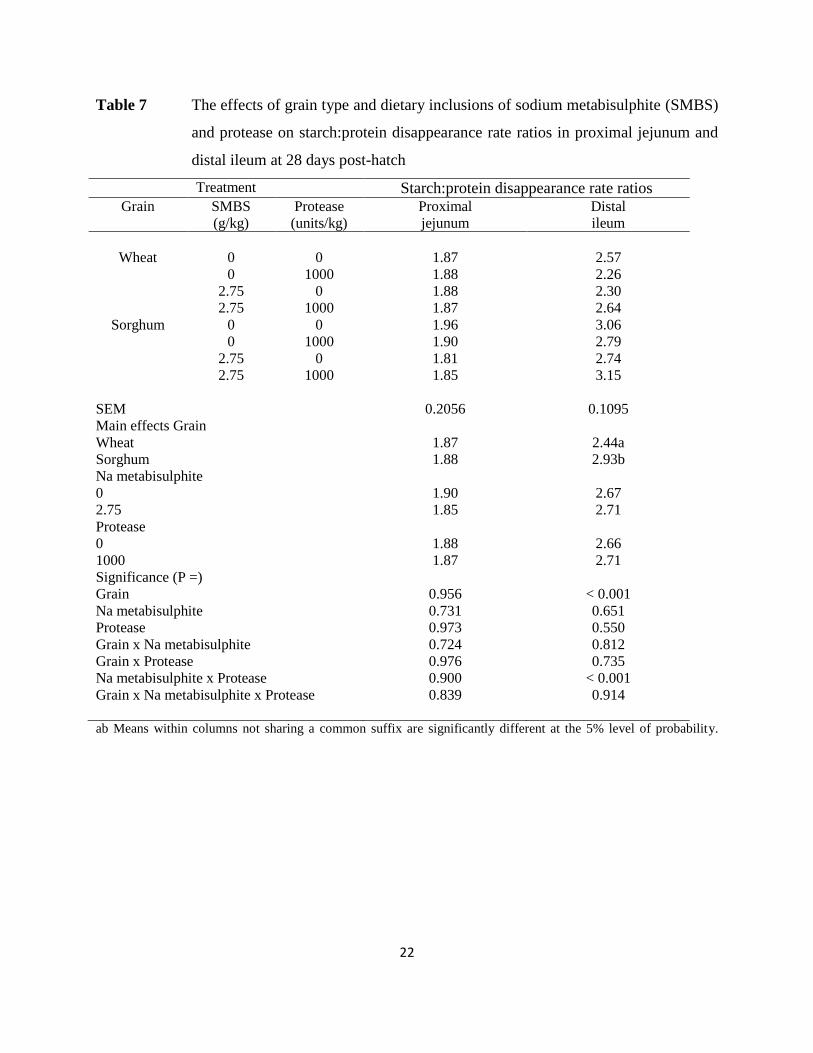
The effects of dietary treatments on starch:protein disappearance rate ratios in proximal
jejunum and distal ileum are shown in Table 7. There were no significant treatment effects in the
proximal jejunum. In the distal ileum wheat based diets supported “narrower” disappearance rate
ratios (2.41 versus 2.96; P < 0.001). There was a significant sodium metabisulphite by protease
interaction (P < 0.001). Protease alone decreased disappearance rate ratios (2.53 versus 2.81) but
increased disappearance rate ratios (2.89 versus 2.52) in the presence of sodium metabisulphite.
Starch:protein disappearance rate ratios in the proximal jejunum were negatively correlated with
weight gain and positively correlated with FCR to significant extents as illustrated in Figure 1.
Transfer of amino acids into the portal circulation
As a preliminary investigation blood samples were taken from the anterior mesenteric and
brachial veins to determine concentrations of free amino acids and glucose in the portal and
systemic circulations, respectively. Thus three birds at random from each caged replicate were
sampled that had been offered the control wheat-based diets or the same diet containing both
sodium metabisulphite and protease. The choice of these two treatments proved serendipitous as
the control wheat-based diet supported the best FCR numerically but the poorest following the
8
inclusion of both feed additives. Feed conversion ratios (FCR) were increased by 4.56% from
1.513 in negative control diet to 1.582 in the supplemented diet and this difference approached
significance (P = 0.084).
As shown in Tables 8 and 9, sodium metabisulphite plus protease significantly depressed
(P < 0.05) the “gross portal transfer” (concentrations of amino acids in plasma taken from the
anterior mesenteric vein) of 10 ex 20 amino acids which included histidine, isoleucine,
methionine, valine, alanine, cystine, glutamine, glycine, proline and serine. sodium
metabisulphite plus protease did not significantly influence systemic concentrations of free
amino acids in plasma taken from the brachial vein. Instructively, concentrations of certain
amino acids in the anterior mesenteric vein were significantly correlated with FCR (Table 3). Of
the essential amino acids 6 ex 10 were significantly negatively correlated (P < 0.05) with FCR
(isoleucine, leucine, methionine, phenylalanine, threonine, valine) and a further 3 (arginine,
histidine, lysine) tended to be correlated (P < 0.10). Threonine had the strongest negative
relationship with FCR (r = -0.773; P = 0.005) and this is illustrated in Figure 2.
Therefore, the gross portal transfer or post-enteral availability of certain amino acids
were related to FCR; probably the single most important parameter of chicken-meat production.
It follows that the tandem inclusion of sodium metabisulphite plus protease may have been
influencing either (i) protein digestion, (ii) amino acid absorption and/or (iii) catabolism of
amino acids in the gut mucosa; thereby compromising feed conversion efficiency. Interestingly,
sodium metabisulphite plus protease depressed proximal jejunal protein (N) disappearance rates
by 14.8% (16.1 versus 18.9 g/bird/day; P = 0.132) but promoted proximal jejunal starch
disappearance rates by 21.6% (37.1 versus 30.5 g/bird/day; P = 0.256); thereby, altering
starch:protein digestive dynamics. The outcomes of this preliminary investigation must be
treated with caution; nevertheless, taking blood samples from the anterior mesenteric vein of
broiler chickens to determine plasma concentrations of amino acids in the portal circulation
appears to be a valid approach to investigate the impacts of dietary treatments on the catabolism
of amino acids in the gut mucosa. Either glucose or amino acids, especially glutamic
acid/glutamine, undergo catabolism in the gut mucosa, in part to meet the copious energy
requirements for gut function. It seems likely that if this ratio could be manipulated towards
glucose as a fuel for the gut then the post-enteral availability of amino acids for protein accretion
would be enhanced. While speculative, it may be that a combination of slower starch but more

9
rapid protein digestive dynamics could be a dietary means of manipulating the catabolism of
glucose versus amino acids in the gut mucosa.
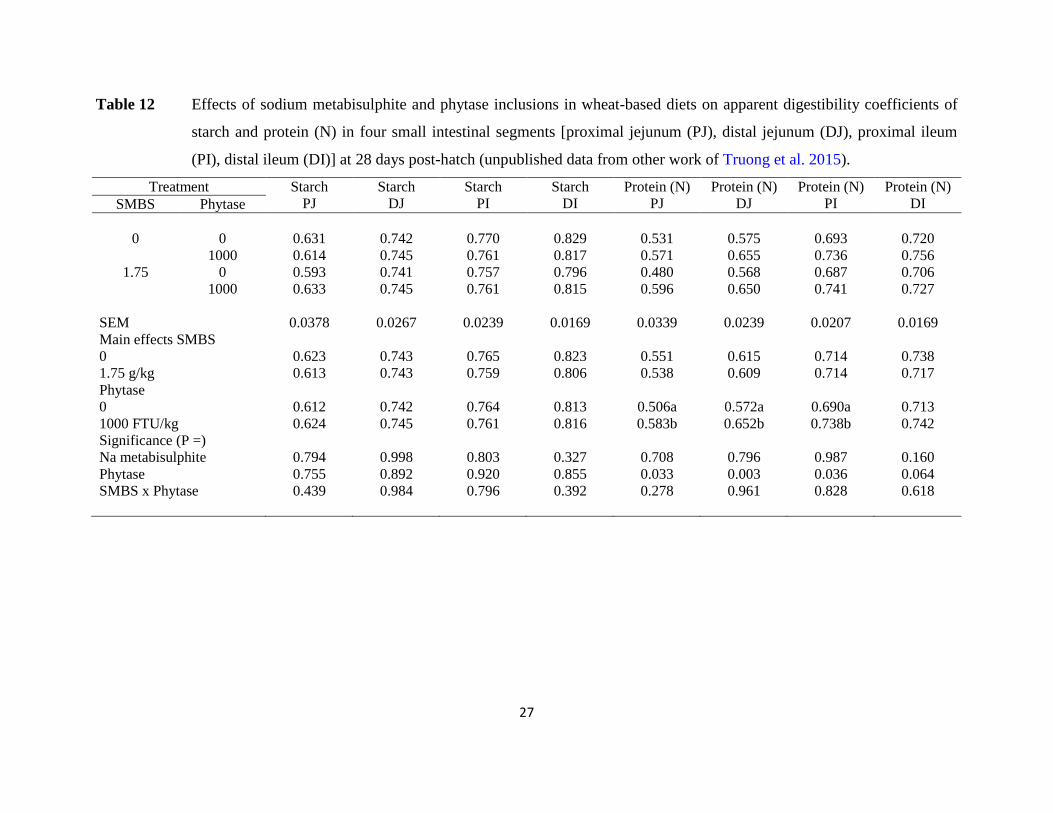
The inclusion of sodium metabisulphite wheat-based broiler diets (unpublished
data)
Truong et al. (2015) reported on the individual and combined additions of sodium
metabisulphite and exogenous phytase to sorghum-based broiler diets. However, in this study the
effects of sodium metabisulphite and phytase in wheat-based diets were also determined
although this data was not reported in the paper and has not been published. A summary of the
pertinent outcomes is presented as Tables 11 and 12. There was a significant treatment
interaction for ME:GE ratios where phytase alone significantly enhanced energy utilisation by
9.16% (0.846 versus 0.775) but sodium metabisulphite addition to the phytase-supplemented diet
significantly depressed energy utilisation by 7.09% (0.786 versus 0.846). There were no other
treatment interactions. The only significant main effects of sodium metabisulphite were to
depress AME (12.83 versus 13.14; P < 0.04) and AMEn (11.87 versus 12.27; P < 0.01).
Individually, Na metabisulphite numerically compromised FCR by 1.87% (1.583 versus 1.554).
In short, there were not any indications that the inclusion of sodium metabisulphite in wheat-
based diets, either alone or in tandem with phytase, was advantageous. In contrast, phytase
generated robust responses in protein (N) digestibility coefficients along the small intestine.
Truong HH, Cadogan DJ, Liu SY, Selle PH (2015) Addition of sodium metabisulfite and microbial
phytase, individually and in combination, to a sorghum-based diet for broiler chickens from 7 to
28 days post-hatch Animal Production Science dx.doi.org/10.1071/AN14841
Discussion
The tandem inclusions of sodium metabisulphite and protease in sorghum-based diets
numerically advantaged weight gain by 3.09% (1533 versus 1487 g/bird), FCR by 1.09% (1.538
versus 1.555), AME by 0.18 MJ (12.46 versus 12.28 MJ/kg) and ME:GE ratios by 1.33% (0.760
versus 0.750). In contrast, tandem inclusions in wheat-based diets disadvantaged weight gain by
0.77% (1541 versus 1553 g/bird), FCR by 4.56% (1.582 versus 1.513), AME by 0.55 MJ (11.93
versus 12.48 MJ/kg) and ME:GE ratios by 6.00% (0.705 versus 0.750). Therefore, while there is
10
a cautious case to be made for sodium metabisulphite and protease inclusions in sorghum-based
diets, this does not appear applicable for wheat-based diets.
The individual inclusion of 2.75 g/kg sodium metabisulphite in sorghum-based diets
fractionally advantaged weight gain by 0.40% (1493 versus 1487 g/bird), FCR by 0.64% (1.545
versus 1.555), AME by 0.20 MJ (12.48 versus 12.28 MJ/kg) and ME:GE ratios by 1.73% (0.763
versus 0.750). Again in contrast, sodium metabisulphite alone in wheat-based diets
disadvantaged weight gain by 1.55% (1529 versus 1553 g/bird), FCR by 3.97% (1.573 versus
1.513), AME by 0.44 MJ (12.04 versus 12.48 MJ/kg) and ME:GE ratios by 3.73% (0.722 versus
0.750).
The responses to inclusions of sodium metabisulphite and protease in sorghum-based
diets only in respect of starch are instructive (Table 6). Individually, sodium metabisulphite
(0.868 versus 0.875) and protease (0.873 versus 0.875) did not influence distal ileal starch
digestibility coefficients to any extent. However, in combination, they improved starch
digestibility by 3.31% (0.904 versus 0.875) as opposed to an additive response of -1.03%.
Similarly, sodium metabisulphite (70.7 versus 68.5 g/bird/day) and protease (64.6 versus 68.5
g/bird/day) did not greatly influence distal ileal starch disappearance rates. The combination
increased starch disappearance by 8.91% (74.6 versus 68.5 g/bird/day; P = 0.148) as opposed to
an additive response of -2.48%. Both outcomes suggest that synergistic responses to tandem
inclusions sodium metabisulphite and protease in sorghum-based diets may be observed.
Sulphite reducing agents, including sodium metabisulphite, have the capacity to
depolymerise starch via oxidative-reductive reactions. However, starch digestibility coefficients
and disappearance rates were not influenced by sodium metabisulphite to significant extents
(Table 6) in the present study. It seems possible that any starch depolymerisation induced by
reducing agents is of little consequence in poultry performance. Sodium metabisulphite has the
capacity to reduce disulphide cross-linkages which are ubiquitous in the protein components of
all relevant feedstuffs. However, as illustrated in Figures 3 and 4, this capacity to reduce
disulphide cross-linkages appears to be reflected in the in vitro protein and starch digestibility of
sorghum, but not maize and wheat. The genesis of this pivotal difference may be the presence of
disulphide cross-linkages in the β- and γ-fractions of kafirin protein bodies. These spherical
protein bodies are located in sorghum endosperm where the β- and γ-fractions encapsulate the
central core of -kafirin. Starch granules and kafirin protein bodies are both embedded in the

11
glutelin protein matrix of sorghum endosperm. It is generally accepted that kafirin impedes
starch utilisation in sorghum via biophysical and biochemical starch-protein interactions
involving disulphide cross-linkages in β- and γ-kafirin. Thus the benefits of sulphite reducing
agents in poultry diets may be “sorghum-specific” because of these unique structural factors in
grain sorghum endosperm.
Therefore, the tentative conclusion from this study, coupled with the unpublished data, is
that the established benefits of sodium metabisulphite in sorghum-based diets do not extend to
wheat-based broiler diets. The advantages from sodium metabisulphite inclusions in sorghum-
based diets may fundamentally, and quite specifically, stem from the reduction of disulphide
cross-linkages of β- and γ-kafirins located in the periphery of protein bodies.
In the present study, the significant impacts of protease as a main effect were limited to a
2.91% increase in feed intake and a widening of the starch:protein disappearance rate ratio from
1.74 to 2.16 in the proximal jejunum. However, our findings have generally indicated that a
narrowing of starch:protein disappearance rate ratios is more likely to advantage broiler
performance. Also, in a previous study we found that an alternative exogenous protease
generated more promising results in sorghum-based diets than the one used in the present study.
However, protease would have been disadvantaged by quite high inclusions of synthetic amino
acids. Synthetic amino acids represented approximately 27% of total lysine, 50% of methionine,
21% of threonine and 32% of arginine across the two diets in the present study and, notionally,
these amino acid proportions are completely digestible. In another previous study we found a
protease significantly increased the digestibility of 14 ex 16 amino acids. The two exceptions
were lysine and methionine, the total dietary levels of which received contributions from
synthetic forms of these two amino acids.
Acknowledgements
We would like to thank Ms Moreen Ali for formulating the diets, Ms Judy O’Keefe for providing
the protease feed enzyme, Ms Joy Gill and her team from the Poultry Research Foundation for
their technical assistance and the Poultry CRC for funding the project.

12
Figure 1 Linear relationships between proximal jejunal starch:protein disappearance rate
ratios and weight gain (r = -0.414; P = 0.006) and FCR (r = 0.431; P = 0.004)

13
Figure 2 Linear relationship (r = -0.773; P = 0.005) between free threonine concentrations
in blood samples taken from the anterior mesenteric vein and FCR in broiler
chickens from 7 to 28 days post-hatch

14
Effect of wet-cooking without and with a reducing agent
(2-mercaptoethanol) on the pepsin digestibility of major
cereals (adapted from Hamaker et al. 1987)
Sorghum: 80.8% 56.5% 81.8%
Figure 3 The effect of wet-cooking and a sulphite reducing agent on the in vitro pepsin
digestibility of maize, sorghum and wheat (adapted from Hamaker et al. 1987)
Legend: Blue = control grain, Red = wet-cooked grain, Green = wet cooked grain
with sulphite reducing agent
Reference
Hamaker BR, Kirleis AW, Butler LG, Axtell JD, Mertz ET (1987) Improving the in vitro protein
digestibility of sorghum with reducing agents. Proceedings of the National Academy of Sciences
of the United States of America 84, 626-628.
15
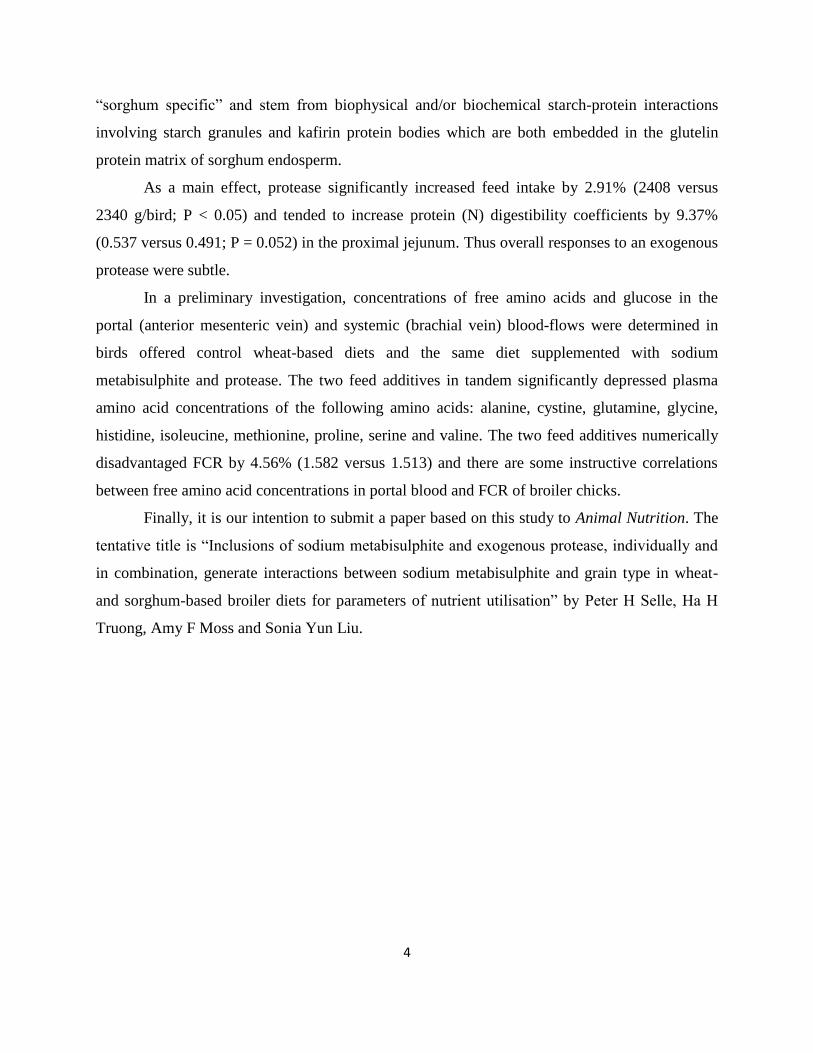
Effect of cooking with sodium metabisulphite (100 mM) on
in vitro starch digestibility of
maize (NS) and sorghum (P < 0.05) flours
(Zhang and Hamaker, 1998)
Figure 4 The effect of wet-cooking and a sulphite reducing agent on the in vitro starch
digestibility of maize and sorghums (adapted from Zhang and Hamaker, et al.
1998)
Legend: Mid-green and mid-blue: wet-cooked grain. Dark-green and dark-blue:
wet-cooked grain with sulphite reducing agent
Reference
Zhang G, Hamaker BR (1998) Low -amylase starch digestibility of cooked sorghum flours and the
effect of protein. Cereal Chemistry 75, 710-713.

16
Table 1 Composition and nutrient specifications of the basal wheat-and sorghum-based
diets
Feed ingredient (g/kg) Wheat-based diet Sorghum-based diet
Wheat
Sorghum
Soybean meal
Canola oil
Limestone
Dicalcium phosphate
Sodium bicarbonate1
Lysine HCl
Methionine
Threonine
Arginine
Choline chloride
Vitamin-trace mineral premix2
Celite3
Metabolisable energy (MJ/kg)
Protein
Calcium
Total phosphorus
Available phosphorus
Sodium
Digestible amino acids
Lysine
Methionine
Methionine + cystine
Tryptophan
Arginine
Threonine
Leucine
Isoleucine
638.2
-
255.0
45.0
13.0
12.0
6.0
3.4
2.6
1.6
5.6
0.6
2.0
15.0
13.06
215.1
8.05
6.54
4.05
1.79
11.40
5.40
8.61
2.13
17.2
7.68
12.6
8.18
-
682.3
235.0
20.0
13.0
12.0
5.7
4.5
3.0
1.6
5.0
0.9
2.0
15.0
12.92
215.7
7.81
6.22
3.85
1.80
11.50
5.78
8.66
2.13
15.6
7.68
17.5
8.31
1Sodium metabisulphite (2.75 g/kg) replaced 2.34 g/kg sodium bicarbonate to maintain Na levels,
difference corrected with Celite 2Vitamin-trace mineral premix supplied per tonne of feed; [million
international units, MIU] retinol 12, cholecalciferol 5, [g] tocopherol 50, menadione 3, thiamine 3,
riboflavin 9, pyridoxine 5, cobalamin 0.025, niacin 50, pantothenate 18, folate 2, biotin 0.2, copper 20,
iron 40 manganese 110, cobalt 0.25, iodine 1, molybdenum 2, zinc 90, selenium 0.3 3Protease added at
the expense of Celite

17
Table 2 The effects of grain type and dietary inclusions of sodium metabisulphite (SMBS)
and protease on parameters of growth performance from 7 to 28 days post-hatch
Treatment Growth performance
Grain SMBS
(g/kg)
Protease
(units/kg)
Weight gain
(g/bird)
Feed intake
(g/bird)
FCR
(g/g)
Mortality/culls
(%)
Wheat
Sorghum
0
0
2.75
2.75
0
0
2.75
2.75
0
1000
0
1000
0
1000
0
1000
1553
1589
1529
1541
1487
1539
1493
1533
2347
2430
2400
2436
2311
2411
2304
2355
1.513
1.529
1.573
1.582
1.555
1.566
1.545
1.538
0.00
3.33
0.00
0.00
0.00
3.33
0.00
0.00
SEM
Main effects Grain
Wheat
Sorghum
Na metabisulphite
0
2.75
Protease
0
1000
Significance (P =)
Grain
Na metabisulphite
Protease
Grain x Na metabisulphite
Grain x Protease
Na metabisulphite x Protease
Grain x Na metabisulphite x Protease
24.459
1553
1513
1542
1524
1516
1551
0.067
0.410
0.106
0.401
0.600
0.666
0.895
44.725
2403
2345
2374
2374
2340a
2408b
0.075
0.985
0.040
0.338
0.798
0.455
0.992
0.0273
1.549
1.551
1.541
1.559
1.546
1.554
0.916
0.354
0.713
0.061
0.788
0.749
0.882
1.5373
0.83
0.83
1.67
0.00
0.00
1.67
1.000
0.136
0.136
1.000
1.000
0.136
1.000
ab Means within columns not sharing a common suffix are significantly different at the 5% level of probability

18
Table 3 The effects of grain type and dietary inclusions of sodium metabisulphite (SMBS) and protease
on parameters of nutrient utilisation within 7 to 28 days post-hatch
Treatment Nutrient utilisation
Grain SMBS
(g/kg)
Protease
(units/kg)
AME
(MJ/kg)
ME:GE
ratio
AME
(MJ/day)
N retention
(%)
AMEn
(MJ/kg)
Wheat
Sorghum
0
0
2.75
2.75
0
0
2.75
2.75
0
1000
0
1000
0
1000
0
1000
12.48
12.15
12.04
11.93
12.28
12.31
12.48
12.46
0.750
0.729
0.722
0.705
0.750
0.754
0.763
0.760
2.14
2.06
1.99
1.94
1.92
1.99
1.94
1.98
65.48
63.32
62.04
61.47
62.76
65.06
65.95
65.64
11.06
10.81
10.71
10.35
11.10
11.06
11.19
11.15
SEM
Main effects Grain
Wheat
Sorghum
Na metabisulphite
0
2.75
Protease
0
1000
Significance (P =)
Grain
Na metabisulphite
Protease
Grain x Na metabisulphite
Grain x Protease
Na metabisulphite x Protease
Grain x Na metabisulphite x Protease
0.1431
12.09
12.38
12.30
12.17
12.32
12.16
0.008
0.205
0.130
0.005
0.104
0.901
0.889
0.0086
0.727
0.756
0.746
0.737
0.746
0.737
< 0.001
0.189
0.138
0.006
0.120
0.856
0.681
2.2913
2.03
1.96
2.03
1.96
2.00
1.99
0.115
0.201
0.870
0.179
0.223
0.944
0.757
1.1036
63.08
64.85
64.16
63.77
64.06
63.87
0.030
0.630
0.814
0.006
0.141
0.745
0.188
0.1357
10.73
11.13
11.01
10.85
11.01
10.84
< 0.001
0.112
0.083
0.015
0.179
0.761
0.790

19
Table 4 The effects of grain type and dietary inclusions of sodium metabisulphite (SMBS)
and protease on protein (N) digestibility coefficients in four small intestinal
segments at 28 days post-hatch
Treatment Protein (N) digestibility coefficients
Grain SMBS
(g/kg)
Protease
(units/kg)
Proximal
jejunum
Distal
jejunum
Proximal
ileum
Distal
ileum
Wheat
Sorghum
0
0
2.75
2.75
0
0
2.75
2.75
0
1000
0
1000
0
1000
0
1000
0.464
0.515
0.490
0.601
0.499
0.513
0.511
0.520
0.741
0.706
0.692
0.695
0.690
0.712
0.700
0.721
0.773
0.759
0.753
0.743
0.749
0.780
0.767
0.743
0.780
0.790
0.786
0.761
0.790
0.760
0.777
0.783
SEM
Main effects Grain
Wheat
Sorghum
Na metabisulphite
0
2.75
Protease
0
1000
Significance (P =)
Grain
Na metabisulphite
Protease
Grain x Na metabisulphite
Grain x Protease
Na metabisulphite x Protease
Grain x Na metabisulphite x Protease
0.0334
0.517
0.511
0.498
0.530
0.491
0.537
0.769
0.166
0.052
0.329
0.144
0.551
0.491
0.0193
0.708
0.705
0.712
0.701
0.705
0.708
0.794
0.401
0.785
0.157
0.147
0.470
0.498
0.0136
0.757
0.760
0.765
0.752
0.761
0.756
0.801
0.211
0.674
0.706
0.457
0.246
0.177
0.0146
0.779
0.777
0.780
0.777
0.783
0.773
0.880
0.765
0.373
0.428
0.854
0.983
0.092
ab Means within columns not sharing a common suffix are significantly different at the 5% level of probability

20
Table 5 The effects of grain type and dietary inclusions of sodium metabisulphite (SMBS)
and protease on protein (N) disappearance rates (g/bird/day) in four small
intestinal segments at 28 days post-hatch
Treatment Protein (N) disappearance rates (g/bird/day)
Grain SMBS
(g/kg)
Protease
(units/kg)
Proximal
jejunum
Distal
jejunum
Proximal
ileum
Distal
ileum
Wheat
Sorghum
0
0
2.75
2.75
0
0
2.75
2.75
0
1000
0
1000
0
1000
0
1000
18.9
17.4
17.5
16.1
15.8
15.7
18.2
14.0
24.7
23.4
23.2
21.5
22.6
21.4
23.2
24.5
25.9
25.1
25.2
23.0
24.5
23.5
25.7
25.4
26.8
26.9
26.8
27.3
22.1
25.4
23.5
24.0
SEM
Main effects Grain
Wheat
Sorghum
Na metabisulphite
0
2.75
Protease
0
1000
Significance (P =)
Grain
Na metabisulphite
Protease
Grain x Na metabisulphite
Grain x Protease
Na metabisulphite x Protease
Grain x Na metabisulphite x Protease
1.2541
17.5
15.9
16.9
16.5
17.6
15.8
0.083
0.613
0.051
0.361
0.686
0.261
0.239
1.0362
23.2
22.9
23.0
23.1
23.4
22.7
0.728
0.905
0.335
0.021
0.296
0.518
0.355
1.2330
24.8
24.8
24.7
24.8
25.3
24.2
0.995
0.993
0.229
0.110
0.612
0.825
0.530
1.0415
27.0b
23.7a
25.3
25.4
24.8
25.9
< 0.001
0.902
0.151
0.918
0.289
0.421
0.268
ab Means within columns not sharing a common suffix are significantly different at the 5% level of probability
21
Table 6 The effects of grain type and dietary inclusions of sodium metabisulphite (SMBS)
and protease on starch digestibility coefficients and starch disappearance rates
(g/bird/day) in proximal jejunum and distal ileum at 28 days post-hatch
Treatment Starch digestibility
coefficients Starch disappearance
rates
Grain SMBS
(g/kg)
Protease
(units/kg)
Proximal
jejunum
Distal
ileum
Proximal
jejunum
Distal
ileum
Wheat
Sorghum
0
0
2.75
2.75
0
0
2.75
2.75
0
1000
0
1000
0
1000
0
1000
0.404
0.437
0.416
0.467
0.358
0.358
0.407
0.367
0.887
0.805
0.821
0.853
0.875
0.868
0.873
0.904
30.5
33.1
31.2
37.1
28.1
29.2
30.9
30.4
69.0
60.7
61.2
67.5
68.5
70.7
64.6
74.6
SEM
Main effects Grain
Wheat
Sorghum
Na metabisulphite
0
2.75
Protease
0
1000
Significance (P =)
Grain
Na metabisulphite
Protease
Grain x Na metabisulphite
Grain x Protease
Na metabisulphite x Protease
Grain x Na metabisulphite x Protease
0.0492
0.431
0.373
0.389
0.414
0.396
0.407
0.100
0.475
0.746
0.904
0.375
0.875
0.674
0.0273
0.841a
0.880b
0.859
0.863
0.864
0.858
0.046
0.825
0.740
0.494
0.323
0.052
0.318
4.051
33.0
29.6
30.2
32.4
30.2
32.4
0.258
0.464
0.445
0.949
0.509
0.886
0.673
2.736
64.6a
69.6b
67.2
67.0
65.8
68.4
0.015
0.888
0.199
0.901
0.082
0.007
0.387
ab Means within columns not sharing a common suffix are significantly different at the 5% level of probability
22
Table 7 The effects of grain type and dietary inclusions of sodium metabisulphite (SMBS)
and protease on starch:protein disappearance rate ratios in proximal jejunum and
distal ileum at 28 days post-hatch
Treatment Starch:protein disappearance rate ratios
Grain SMBS
(g/kg)
Protease
(units/kg)
Proximal
jejunum
Distal
ileum
Wheat
Sorghum
0
0
2.75
2.75
0
0
2.75
2.75
0
1000
0
1000
0
1000
0
1000
1.87
1.88
1.88
1.87
1.96
1.90
1.81
1.85
2.57
2.26
2.30
2.64
3.06
2.79
2.74
3.15
SEM
Main effects Grain
Wheat
Sorghum
Na metabisulphite
0
2.75
Protease
0
1000
Significance (P =)
Grain
Na metabisulphite
Protease
Grain x Na metabisulphite
Grain x Protease
Na metabisulphite x Protease
Grain x Na metabisulphite x Protease
0.2056
1.87
1.88
1.90
1.85
1.88
1.87
0.956
0.731
0.973
0.724
0.976
0.900
0.839
0.1095
2.44a
2.93b
2.67
2.71
2.66
2.71
< 0.001
0.651
0.550
0.812
0.735
< 0.001
0.914
ab Means within columns not sharing a common suffix are significantly different at the 5% level of probability.

23
Table 8 The effects of feed additives (sodium metabisulphite plus protease) in wheat-based diets on concentrations of essential
amino acids and glucose in the portal and systemic circulation of broiler chickens at 28 days post-hatch
Amino
acid (mg/ml)
Portal circulation (anterior mesenteric vein) Systemic circulation (brachial vein)
Control Additives SEM P = Control Additives SEM P =
Arginine
Histidine
Isoleucine
Leucine
Lysine
Methionine
Phenylalanine
Threonine
Tryptophan
Valine
Glucose
(mmol/L)
108.9
12.2
18.6
26.1
47.0
15.8
21.0
63.8
6.2
27.8
17.4
85.4
2.3
15.5
23.7
39.3
12.5
17.9
50.8
6.0
23.3
19.3
12.117
0.923
0.976
1.153
3.321
0.829
1.116
7.446
0.477
1.305
1.427
0.200
0.023
0.048
0.180
0.133
0.017
0.075
0.247
0.791
0.037
0.365
97.5
5.9
9.6
14.9
33.4
14.2
13.9
56.8
4.7
17.6
15.4
99.5
5.6
9.5
15.1
34.8
12.5
12.9
56.7
4.5
17.2
14.6
8.385
0.670
0.729
0.903
2.830
1.506
0.953
5.704
0.365
0.953
0.600
0.867
0.732
0.912
0.889
0.728
0.452
0.475
0.994
0.707
0.782
0.311

24
Table 9 The effects of feed additives (sodium metabisulphite plus protease) in wheat-based diets on concentrations of non-
essential amino acids in the portal and systemic circulation of broiler chickens at 28 days post-hatch
Amino
acid (mg/ml)
Portal circulation (anterior mesenteric vein) Systemic circulation (brachial vein)
Control Additives SEM P = Control Additives SEM P =
Alanine
Aspartic acid
Asparagine
Cystine
Glutamic acid
Glutamine
Glycine
Proline
Serine
Tyrosine
88.7
13.1
30.0
13.6
47.9
196.6
51.9
69.2
59.2
27.6
66.7
23.5
21.4
9.9
52.2
143.8
37.7
48.3
48.1
27.2
5.911
3.830
4.474
0.852
2.680
10.734
2.463
5.099
3.299
2.400
0.025
0.084
0.202
0.001
0.280
0.006
0.002
0.016
0.039
0.909
53.0
9.0
22.5
11.8
31.0
171.2
37.2
53.9
49.2
22.0
53.2
10.0
17.7
10.10.
27.7
149.3
31.8
42.7
47.9
23.8
4.189
1.033
3.216
0.678
1.136
12.819
1.887
5.252
3.905
2.274
0.972
0.502
0.318
0.116
0.068
0.253
0.075
0.161
0.830
0.588

25
Table 10 Correlations between gross portal transfers of amino acids and feed conversion ratios of broilers offered wheat-based
diets without and with sodium metabisulphite plus protease from 7 to 28 days post-hatch
Essential
amino acids
Correlation
coefficient (r = )
Significance
(P =)
Non-essential
amino acids
Correlation
coefficient (r = )
Significance
(P =)
Arginine
Histidine
Isoleucine
Leucine
Lysine
Methionine
Phenylalanine
Threonine
Tryptophan
Valine
-0.563
-0.568
-0.643
-0.621
-0.575
-0.660
-0.683
-0.773
-0.247
-0.657
0.072
0.068
0.033
0.042
0.064
0.027
0.021
0.005
0.464
0.028
Alanine
Aspartic acid
Asparagine
Cystine
Glutamic acid
Glutamine
Glycine
Proline
Serine
Tyrosine
-0.157
-0.019
-0.606
-0.329
+0.295
-0.501
-0.692
-0.802
-0.499
+0.085
0.644
0.956
0.048
0.322
0.379
0.116
0.018
0.003
0.118
0.804

26
Table 11 Effects of sodium metabisulphite and phytase inclusions in wheat-based diets on growth performance, toe ash and
nutrient utilisation from 7 to 28 days post-hatch (unpublished data from other work of Truong et al. 2015).
Treatment Weight
gain
Feed
intake
FCR Toe ash
(%)
AME
(MJ/kg)
ME:GE
ratio
N
retention
AMEn
(MJ/kg) SMBS Phytase
0
1.75
0
1000
0
1000
1527
1506
1517
1512
2364
2342
2401
2350
1.554
1.559
1.583
1.558
12.05
11.60
12.49
11.49
12.99
13.29
12.83
12.83
0.775a
0.846b
0.790a
0.786a
68.36
67.42
69.17
67.92
12.11
12.44
11.82
11.92
SEM
Main effects SMBS
0
1.75 g/kg
Phytase
0
1000 FTU/kg
Significance (P =)
Na metabisulphite
Phytase
SMBS x Phytase
41.73
1517
1515
1522
1509
0.967
0.759
0.851
46.43
2353
2376
2382
2346
0.633
0.477
0.759
0.0358
1.557
1.570
1.569
1.558
0.698
0.767
0.661
0.3044
11.82
11.99
12.27b
11.54a
0.590
0.027
0.383
0.0187
13.14b
12.83a
12.91
13.06
0.033
0.288
0.276
0.0112
0.810
0.788
0.782
0.816
0.101
0.016
0.008
1.132
67.89
68.55
68.76
67.67
0.567
0.343
0.893
0.1449
12.27b
11.87a
11.96
12.18
0.010
0.145
0.439
27
Table 12 Effects of sodium metabisulphite and phytase inclusions in wheat-based diets on apparent digestibility coefficients of
starch and protein (N) in four small intestinal segments [proximal jejunum (PJ), distal jejunum (DJ), proximal ileum
(PI), distal ileum (DI)] at 28 days post-hatch (unpublished data from other work of Truong et al. 2015).
Treatment Starch
PJ
Starch
DJ
Starch
PI
Starch
DI
Protein (N)
PJ
Protein (N)
DJ
Protein (N)
PI
Protein (N)
DI SMBS Phytase
0
1.75
0
1000
0
1000
0.631
0.614
0.593
0.633
0.742
0.745
0.741
0.745
0.770
0.761
0.757
0.761
0.829
0.817
0.796
0.815
0.531
0.571
0.480
0.596
0.575
0.655
0.568
0.650
0.693
0.736
0.687
0.741
0.720
0.756
0.706
0.727
SEM
Main effects SMBS
0
1.75 g/kg
Phytase
0
1000 FTU/kg
Significance (P =)
Na metabisulphite
Phytase
SMBS x Phytase
0.0378
0.623
0.613
0.612
0.624
0.794
0.755
0.439
0.0267
0.743
0.743
0.742
0.745
0.998
0.892
0.984
0.0239
0.765
0.759
0.764
0.761
0.803
0.920
0.796
0.0169
0.823
0.806
0.813
0.816
0.327
0.855
0.392
0.0339
0.551
0.538
0.506a
0.583b
0.708
0.033
0.278
0.0239
0.615
0.609
0.572a
0.652b
0.796
0.003
0.961
0.0207
0.714
0.714
0.690a
0.738b
0.987
0.036
0.828
0.0169
0.738
0.717
0.713
0.742
0.160
0.064
0.618