sub-nyquist reconstruction final presentation winter 2010/2011 by: yousef badran supervisors: asaf...
TRANSCRIPT

Sub-NyquistReconstruction
Final PresentationWinter 2010/2011
By:
Yousef Badran
Supervisors:
Asaf ElronIna Rivkin
TechnionIsrael Institute of Technology

Project Overview
• Part of the Modulated Wideband Converter project cluster.– A system for sub-Nyquist sampling of multiband
signals.• Sub-module of the reconstruction block. • Implemented on a single NI FlexRio Virtex-5
SX95T FPGA device.– NI LabVIEW interface

Sub-Nyquist Xampling Project Block Diagram

Project Goals
Reconstruction Algorithm outline:1. Covert complex-valued sequences to real-
valued sequences.2. Estimate power spectral density.3. Find band edges.
COMPLEX FFT!!

Input and Output
Input:Sequences z[n] representing spectrum slices.At most N sequences, one per slice.
Spectral support slices s B
nt
lBtjl thetxnz
|)())((][ 2
Problem:Spectral support and carrier frequencies of bands are unknown.A single slice may contain more than one band (at most N/2).A single band might be divided between two slices.

Input and Output
Output:• A sequence of vectors, one per spectral slice.• Each vector describes energy distribution in the slice; areas in the slice that
hold energy.• Requires high resolution vectors.

Welch’s Method for Power Estimation
Algorithm— Divide the time signal into successive, overlapping blocks.— Form the periodogram for each block:
— The Welsh estimate of the power spectral density is given by:
(K= # of blocks)
Contradiction: Maximize M for spectral resolution vs. Maximize K for better averaging results and greater spectral stability.
Typical choice:
21( ) | ( ) |
kx kP f FFT xM
1
1( ) ( )
k
k
X xi
S f P fK
_ _M K Length of vector

Spectrum Quantization
Final step: Define band location
1. Find PSD threshold.
2. Unite support regions that are closer than .
3. Prune isolated regions with widths smaller than .
bandsbetweenspacingMinimal
widthbandMinimalB
min
min
min
minB

Implementation Demands
Demands
– 18-bit signed fixed-point representation (input).
• 17 bit word length
• 1 bit fraction length
– Input rate of 20 MHz
– Complex FFT
– Implementation on a single FPGA
• Use 30% of FPGA resources.

Project Block Diagram
Low rate sequences
CTF module FIFO
20 MHZ
Power Estimation
Band detection
output

Testing Environment
Host.vi

Host.vi (Write)
Parse data(64bit
double to U32)
Display Input Signal
Host to FPGA FIFO
(WRITE)
2048 elements
1024 Samples
data
Generate Sequence
MU
X
Select
1 MHz rate
Complex data
Real data
Img data
Join numbers(U64bit)

Host.vi (Read)
Write to file
Display Output Signal
FPGA to Host FIFO
(READ)
2048 elements
1024 Samples(U64 bit) 1024 Samples
(double)
DBL
WELCHDisplay and
compare results

FPGA
Real
Split numbers
(I32)
Host to FPGA FIFO
(READ)
2048 element
s
FPGA FIFO
1024 element
s
FPGA to Host FIFO
(WRITE)
2048 elements
FPGA FIFO
1024 elements
FXP
FXP
Img.Welch Power
Spectral Estimation
Spectrum Quantization

Welch PSD – Block Diagram
Data out
en
CounterMemory
Read Addr.
Data outData in
Write Addr.
Hamming Window
Real data in
Img. data in
Real data
Img. dataComplex
FFT
Real data
Img. data
Out validShift reg

Quantization – Block Diagram
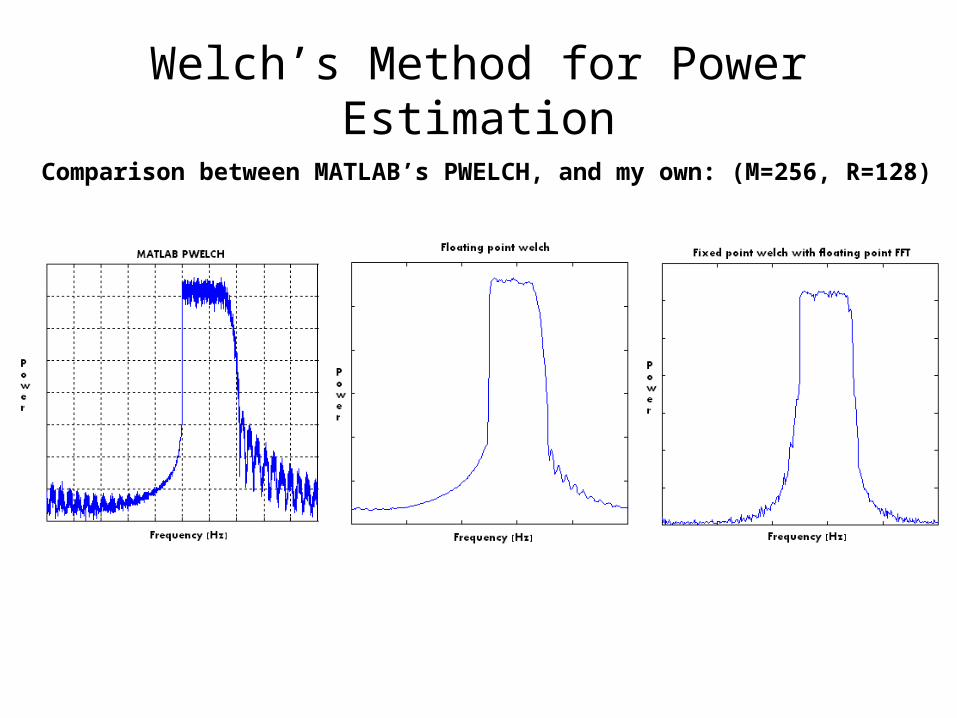
Welch’s Method for Power EstimationComparison between MATLAB’s PWELCH, and my own: (M=256, R=128)

ResultsComplex FFT size = 1024.

Welch’s Method for Power EstimationComparision between MATLAB’s PWELSH, and my own: (M=256, R=128)

ResultsComplex FFT size = 1024.
Mathematical Tools
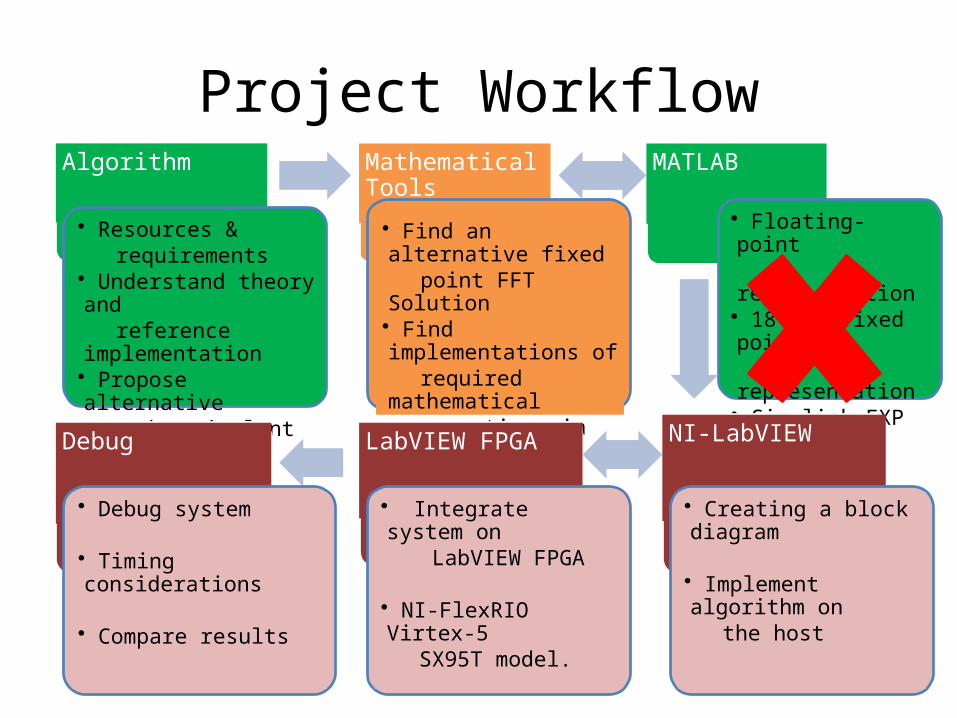
Project WorkflowAlgorithm
• Resources & requirements• Understand theory and reference implementation• Propose alternative and equivalent calculation
MATLAB
• Floating-point representation• 18-bit fixed point representation• Simulink FXP FFT model
• Find an alternative fixed point FFT Solution• Find implementations of required mathematical operations in VHDL
NI-LabVIEW
• Creating a block diagram
• Implement algorithm on the host
LabVIEW FPGA
• Integrate system on LabVIEW FPGA
• NI-FlexRIO Virtex-5 SX95T model.
Debug
• Debug system
• Timing considerations
• Compare results

Resource Estimation
New Device Utilization ( NO HOST/FPGA FIFOS)
Total Slices 3292 14720 22.36
Slice Registers 10626 58880 18
Slice LUTs 13869 58880 23.5
Block RAMs 24 244 9.8
@ 40MHz, FFT size of 1024

Next Steps
• Detect bands and isolate them.
• Estimate carrier frequency per band.• 6 low rate sequences (20MHz) instead of 1.

Next Steps (Cont.)
Serial FFT!
Low rate sequences
(20MHz each) FIFO1024
elementsFIFO1024
elementsFIFO1024
elementsFIFO1024
elementsFIFO1024
elementsFIFO1024
elements
Complex FFT&
Hamming Window
PSD&
Band DetectionM
UX
High rate Calculation 120 MHz FIFO1024
elementsFIFO1024
elementsFIFO1024
elementsFIFO1024
elementsFIFO1024
elementsFIFO1024
elements

Thank you!