sub #3 organics summary v0
TRANSCRIPT
1 #3 - Organics & Fibers Summary | SCS ENGINEERS
#3 Subcommittee Meeting #3 Summary – Organics & Fibers Organics & September 1, 2021 9AM-12PM Fibers
Subcommittee meeting #3 of the Organics & Fibers Subcommittee (#3‐Organics & Fibers) was convened
virtually via Zoom on September 1, 2021 from 9AM‐12PM, CST. Attendance for #3‐Organics & Fibers is
provided in Table 1.
Table 1. #3 Organics & Fibers Subcommittee Membership and Attendance
Name Company Attended 9/1/21
Karen Rodekamp ISU Dining, Iowa State University Present
Michelle Hurd Iowa Grocery Industry Association Present(1)
Beth MacKenzie University of Iowa Present
Rich Stephens Archer Daniels Midland Company Absent
Jennifer Trent Iowa Waste Reduction Center Present
Aubrey Alvarez Eat Greater Des Moines Absent
Jennifer Jordan City of Iowa City Landfill and Recycling Center Present
Jon Koch City of Muscatine Absent
Scott Amendt GreenRU, LLC & Chamness Technology, Inc. Present
Kathy Morris Waste Commission of Scott County Present
Doyle Smith City of Cedar Falls Present
Alan Schumacher Quincy Recycle Paper/Iowa Recycling Association Present
Aaron Holt Sysco Foods Present
Theresa Stiner DNR Internal SMM Team Present
Reid Bermel DNR Internal SMM Team Present
Laurie Rasmus DNR Internal SMM Team Present
Mike Sullivan DNR Internal SMM Team Present
Tom Anderson DNR Internal SMM Team Present
Jennifer Wright DNR Internal SMM Team Present
Jennifer Reutzel Vaughn DNR Internal SMM Team Present
Michelle Leonard Consultant – SCS Engineers Present
Christine Collier Consultant – SCS Engineers Present
Jeff Phillips Consultant – SCS Engineers Present
Karen Luken Sub‐Consultant – EESI(2) Present (1)Present for first 22 minutes. (2) Economic Environmental Solutions International
A. Subcommittee #3 ‐ Organics & Fibers Summary The meeting began with the project consulting team reviewing the agenda for this meeting (see Attachment A), the overall objectives of the Sustainable Materials Management (SMM) – Vision for Iowa project, the process and goals of the project process, and the goals for today’s subcommittee meeting. The Stakeholder Meeting #2 schedule and Subcommittee responsibilities were also discussed. The slides presented for this Subcommittee meeting are included in Attachment B.

2 #3 - Organics & Fibers Summary | SCS ENGINEERS
The project consulting team then introduced guest presenter Michelle Hurd with the Iowa Grocery Association. Michelle presented a brief summary of the Iowa Grocery Association and a description of practices implemented by retailers to minimize food wastes. Some of these waste minimization practices include the following:
Inventory control technologies to ensure products are rotated and used in a timely manner;
Date code for end of shelf life for store inventory – Items that exceed this shelf life code are used as store samples.
Damaged or bruised products are repurposed for recipes (i.e., salsa).
Food scraps generated in their kitchens are collected for composting by a third‐party.
Partner with food pantry’s across Iowa. Over 3 million pounds of food is donated each year by Iowa Grocery Association members.
Retailers have increased their consumer education to help better understand the different between food safety labels (i.e., expiration dates) and food quality labels (i.e., best used by).
Michelle stated that retailers are committed to reducing food waste as managing this waste impacts their bottom line, but they also want to serve their community and meet their environmental responsibilities.
The project consulting team then introduced guest presenter and new subcommittee member Aaron Holt, Executive Chef with Sysco Foods and owner of Doolittle Farm LLC. Aaron provided a brief description of Sysco Foods, Doolittle Farm LLC, and then a summary of programs and organizations tied to the restaurant industry that are working to minimize food waste.
Aaron stated that approximately 25% of what is prepped for meals at restaurants or at homes is thrown away. Within the restaurant industry, there is an initiative to reduce the amount of waste generated within the kitchen and in the operations of a restaurant. These practices include the following:
Zero waste cooking practices (i.e., capturing meal prep waste for use in other meals or for composting).
Reuse and recycling of fryer oil.
Require suppliers to use more reusable packaging and decrease the size of packaging.
Require suppliers to use reusable pallets.
Promote reduce, reuse, recycle.
Eliminate plastic bottles for customers as well as employees.
Aaron stated that the biggest challenge is always moving the collected material from the restaurant (or from several centralized restaurants) to a location for proper management (i.e., compost).
Aaron mentioned that there are organizations that assist restaurants as well as residents with collecting and managing their organics wastes. For instance, Compost Ninja in Iowa City, Iowa offers services to collect organic waste from restaurants and residents for composting. Another example Aaron provided was The Wormery in West Des Moines, Iowa. The Wormery is a volunteer organization that collects
3 #3 - Organics & Fibers Summary | SCS ENGINEERS
organic waste from local restaurants and operates a vermicomposting operation. The compost and worm castings are offered to program volunteers.
Several subcommittee members had questions concerning zero waste cooking practices and how prevalent these practices are within the restaurant industry. Aaron stated that these practices are taught in culinary schools as a way to minimize the production of waste primarily for the reduction of operational expenses. However, chefs are taking more of an interest in these practices to not only minimize costs, but also to demonstrate to their community their environmentally conscious behaviors.
The project consulting team then led participants through a discussion about what gaps there may be in Iowa as methods of diverting organics from disposal. Identified potential gaps include:
Composting and aerobic digestion (AD) operation information (i.e., location, feedstock’s used,production and expansion capacity, etc.).
Adequate transportation and processing infrastructure to support increased organicsmanagement efforts.
Regulations to support both environmental health and the ability for businesses to make profits.
Food label requirements that are clearly understood by consumers. One subcommittee membersuggested the possibility of changing labels from “best used by” to “donate by”.
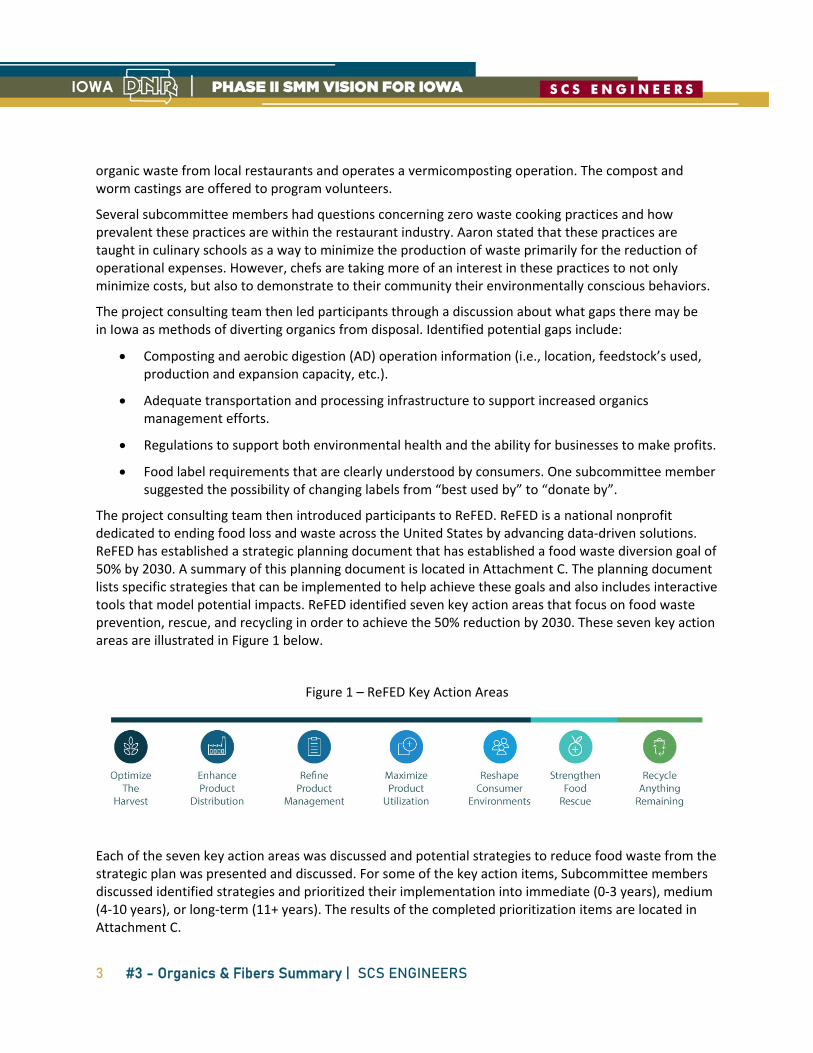
The project consulting team then introduced participants to ReFED. ReFED is a national nonprofit dedicated to ending food loss and waste across the United States by advancing data‐driven solutions. ReFED has established a strategic planning document that has established a food waste diversion goal of 50% by 2030. A summary of this planning document is located in Attachment C. The planning document lists specific strategies that can be implemented to help achieve these goals and also includes interactive tools that model potential impacts. ReFED identified seven key action areas that focus on food waste prevention, rescue, and recycling in order to achieve the 50% reduction by 2030. These seven key action areas are illustrated in Figure 1 below.
Figure 1 – ReFED Key Action Areas
Each of the seven key action areas was discussed and potential strategies to reduce food waste from the strategic plan was presented and discussed. For some of the key action items, Subcommittee members discussed identified strategies and prioritized their implementation into immediate (0‐3 years), medium (4‐10 years), or long‐term (11+ years). The results of the completed prioritization items are located in Attachment C.

4 #3 - Organics & Fibers Summary | SCS ENGINEERS
The following is a brief description of the seven key action areas, the identified potential strategies, and a summary of Subcommittee member discussions for each.
• Key Action Area ‐ Optimize the Harvest (Prevention)
o Avoid over‐production, then harvest as much as possible.
o 82% of food that reaches maturity is left behind after harvest. A quarter of the surplus is left behind, because its considered “not marketable”
o Identified Strategies:
Package and distribute surplus, off‐grade, near expiration, or imperfect produce to retailers or consumers
Adjust purchasing specifications to allow for imperfect produce
Collect leftover product from fields after the initial commercial harvest(Gleaning)
Implement processes to only reject partial loads of produce
o Subcommittee Member Discussion:
There appears to be a disconnect between different levels from food producers, to donation, to use.
Legislative change may be needed to battle the low fees at landfills for managing these materials. The material collected for composting or AD should be a higher value.
Work with appropriate state departments to more easily allow food waste to go to animals.
Corn and soybeans are the primary crops in Iowa. The waste from these crops are typically collected for alternative uses and have well established markets. Furthermore, it is unlikely that these crops would be well suited for gleaning efforts to capture unharvested food for human consumption.
There may be language within the proposed Farm Bill that will have more focus on managing food waste at the agricultural level than in the past. It is possible that proposed language may guide these planning conversations and later actions.
Some of what we are talking about here may already be occurring in other avenues (i.e., federal or state agencies, private organizations, etc.). Some of these identified strategies may help guide our path in the future.

5 #3 - Organics & Fibers Summary | SCS ENGINEERS
Key Action Area ‐ Enhance Product Distribution (Prevention)
o Maximize freshness and selling time by using technology to create small systems to efficiently move products.
o Identified Strategies:
Use intelligent routing – perishable products closer to destination
Decreased transit time
Priority over moving materials based on expiration vs. first in
Temperature monitoring
Reduce warehouse handling
o Subcommittee Member Discussion:
There are several food warehouse and transportation companies servicing Iowa retailers. Transportation managers are struggling with a labor shortage as the entire transportation industry is competing for limited drivers with experience and required certifications (i.e., commercial drivers license, etc.).
Is there a way to provide information to direct rejected loads from retailers to other users (i.e., food bank)? Perhaps we can communicate with and educate those at higher levels in corporations to encourage them to consider diverting materials to alternative uses rather than disposal.
Continue to encourage, promote, and support local food rescue programs.
Contact food transportation industry representatives (i.e., Iowa Motor Truck Association, Sysco Foods, PDI, etc.) to see if they would be interested in participating in this project.
Key Action Area ‐ Refine Product Management (Prevention)
o Align purchases with sales as closely as possible, and when surplus arises, finding secondary outlets to accommodate it.
o Build out systems and processes for optimal on‐site handling.
o Identified Strategies:
Improved intelligence around demand planning through systems or incorporating historical data in future decisions (i.e., machine learning) to aid in better forecasting and fulfilment.
Provide technology‐enabled tracking of food loss and waste to highlight opportunities for reduction.
Application to alert consumers to markdowns or excess food at retailers or restaurants.

6 #3 - Organics & Fibers Summary | SCS ENGINEERS
Dynamic pricing to help retailers automate and comprehensively update markdowns, optimizing price points to sell more product.
Minimize on‐hand inventory.
Decreased minimum order quantity.
Increased delivery frequency.
Assisted distressed sales.
Collect data on food generated by sector.
o Subcommittee Member Discussion:
We should ask the Iowa Grocery Association about consumer trends. Do customers buy a day or two or weeks‐worth of groceries? Is there any statistical data that correlates demographics with purchasing practices?
A large grocer in Iowa recently gave a presentation that they were looking to change the model of their stores to sell more prepared foods. This may change what is being transported (i.e., less canned goods and more prepared foods which may reduce shelf life and/or require refrigeration in warehouse and transportation).
Key Action Area ‐ Maximize Product Utilization (Prevention)
o Design facilities, operations, and menus to use as much of each product as possible.
o Rethinking the concept of waste by turning surplus and byproducts into food products through upcycling.
o Identified Strategies:
Promote manufacturing byproduct utilization (upcycling).
Support active and intelligent packaging research.
Identify opportunities to reduce food waste form manufacturing and processing operations.
o Subcommittee Member Discussion:
No discussion.
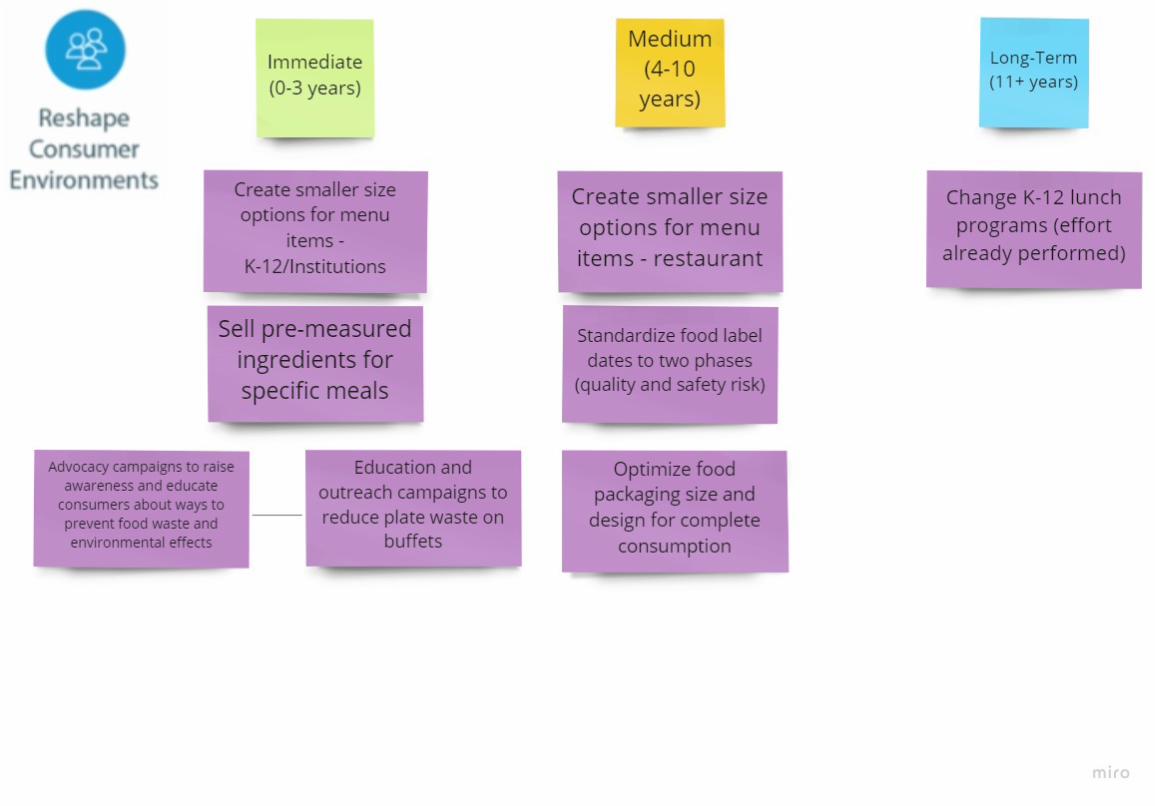
Key Action Area ‐ Reshape Consumer Environments (Prevention)
o Households are the greatest source of food waste in the US, making this a critical area for action.
o 37% of all surplus food is generated by consumers.
o Identified Strategies:
Create smaller size options for menu items to reduce over portioning and plate waste.

7 #3 - Organics & Fibers Summary | SCS ENGINEERS
Sell pre‐measured ingredients to cook specific meals.
Conduct advocacy campaigns to raise awareness and educate consumers about ways to prevent food waste.
Standardize food label dates to two phases (quality and safety).
Optimize food packaging size and design to ensure complete consumption by consumer by reducing spoilage.
Develop education campaigns focused to reduce plate waste on buffets.
Change K‐12 lunch programs.
o Subcommittee Member Discussion:
The Department of Natural Resources (DNR), Iowa waste Exchange (IWE), and the Iowa Waste Reduction Center (IWRC) have worked with the Iowa Department of Education to implement food waste reduction initiatives. Switching order or lunch to recess was discussed but rejected primarily because it didn’t change the amount of time students had to eat.
The IWRC works with IWE to perform waste sorts for schools that are interested in determining the types and volumes of food waste.
K‐12 lunch programs is low hanging fruit and has mostly already been taken care of or has good momentum. The focus should be more on generators rather than schools.
Most of the people that have a lot of left over food from a restaurant take their food home. However, the question becomes based on those people, how many of them then eat this food or later just throw it out.
Changing the size and shape of plates in a food service setting can directly impact the amount of food waste generated. Using bowl shape plates rather than traditional plates decreased the food wastage by nearly 50%. May want to share the results of this study with other institutional cafeterias.
The DNR has given grants for removing trays from dinning halls and installing water bottle filling stations.
We as a state haven’t done a great job in collecting data and making it accessible.
The challenge with education and advocacy campaigns becomes how to craft these messages so that they aren’t “insulting” or “patronizing”.
Our messaging has to be careful. If we say don’t waste food. It comes off as the University is trying to cut costs. If the message comes from the students, it helps with the results.
When you couple food waste with compost – food waste can sometimes increase because the consumer feels that it is ok to “waste” the food because it

8 #3 - Organics & Fibers Summary | SCS ENGINEERS
is being managed in a more preferred method than disposal. In these cases, perhaps the message should be more focused on the environmental impacts.
Buffets have a variety of reasons that they do not want smaller plates. From an environmental perspective, customers use more small plates and this increases the amount of water and energy they use to clean plates.
A survey performed by the IWE of educational institution facilities indicated that they were interested in getting support (i.e., financial and technical) for managing their food waste.
For the pre‐packaged meal commercial programs, are they producing food waste during the manufacturing of these meals and what are they doing with their food scraps?
What are other states doing for education? California is very progressive.
Key Action Area ‐ Strength in Food Rescue (Rescue)
o Just 3% of surplus food ends up being donated, with the greatest portion coming from grocery retail.
o Distribution and logistic challenges contribute to these low percentages of food being donated.
o Identified Strategies:
Donation education.
Donation transportation.
Donation storage and handling capacity.
Donation coordination and matching.
Donation value added processing.
Edible food recovery legislation.
o Subcommittee Member Discussion:
Getting edible leftover food transported to those that need it is really important. We want to ensure those efforts are supported.
Need to investigate if there are other resources available that can help provide financial or technical support for those interested in distributing donated food.
Even if resources are available for funding and technical support – it still takes staff time to do the work. However, most programs don’t fund staff.
While SMM policies in Iowa aren’t officially established, we recognize that the way we are managing our waste today isn’t the best way.
Discussion concerning that SMM may cause organizations to increase their costs and therefore may be against SMM.
9 #3 - Organics & Fibers Summary | SCS ENGINEERS
While we aren’t against SMM in Iowa, we recognize that the current funding structure isn’t sustainable. Increasing fees on landfills isn’t an answer either as this may drive waste out of state to other cheaper facilities. Waste leaving Iowa reduces revenue receive and therefore the services and programs supported by these revenues would need to adjust.
We need to keep in mind that the SMM project is looking at the materials and how we manage them. This will help drive the broader discussion regarding legislation and funding.
There was a stakeholder group in Iowa that had previously developed several white papers on organic waste management strategies.
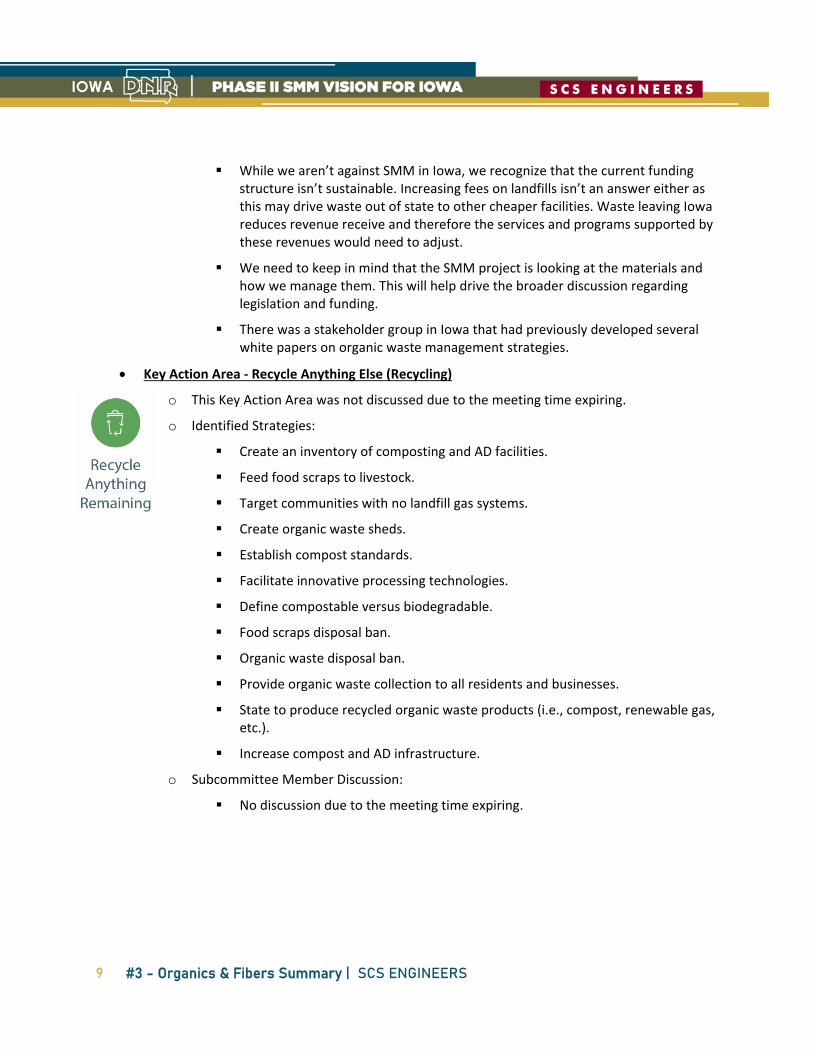
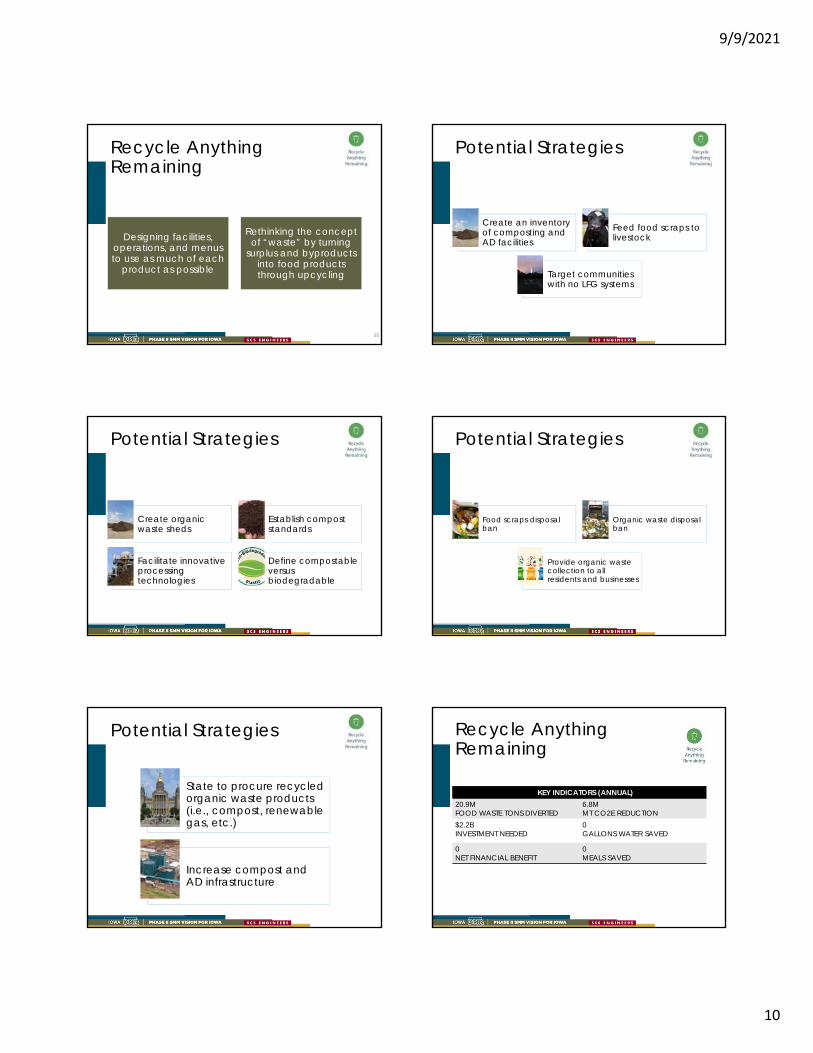
Key Action Area ‐ Recycle Anything Else (Recycling)
o This Key Action Area was not discussed due to the meeting time expiring.
o Identified Strategies:
Create an inventory of composting and AD facilities.
Feed food scraps to livestock.
Target communities with no landfill gas systems.
Create organic waste sheds.
Establish compost standards.
Facilitate innovative processing technologies.
Define compostable versus biodegradable.
Food scraps disposal ban.
Organic waste disposal ban.
Provide organic waste collection to all residents and businesses.
State to produce recycled organic waste products (i.e., compost, renewable gas, etc.).
Increase compost and AD infrastructure.
o Subcommittee Member Discussion:
No discussion due to the meeting time expiring.

10 #3 - Organics & Fibers Summary | SCS ENGINEERS
B. Research Request List Through the discussions and in follow up discussions, various topics have been identified for further
research. These are provided below.
Consider inviting the following to participate in future Subcommittee Meetings:
o Composting Ninja in Iowa City
o Severs Family Farm
o ISU Extension Office representative – Composting and agriculture perspective
o Iowa Department of Agriculture and Land Stewardship (IDALS)
o Farm Bureau
o Table to Table and/or Feeding America
o Food Warehousing and/or Food Transportation Representatives:
Iowa Trucking Council (Freight Advisory Council)
Iowa Motor Truck Association
PDI
Sysco
o Kitchen Practices and Education Program Representatives:
Zero Cooking representative or a restaurant that has embraced this approach.
Culinary curriculum developers and schools
Request Farm Bill language to determine what policies may influence SMM practices in Iowa.
Collect Iowa Organic Waste Management White Papers.
C. Other Notes Other items of note from the #3‐Organics & Fibers meeting are as follows:
Second Stakeholder Meeting will be held on September 30, 2021. Subcommittee members
in addition to other interested parties are invited and encouraged to attend.
Attachments:
Attachment A: Agenda
Attachment B: PowerPoint Presentation
Attachment C: Additional Information

Attachment A Agenda

Sub#3 Organics & Fibers Agenda Page 1 of 1 www.scsengineers.com
Subcommittee Meeting #3 – Organics and Fibers
September 1, 2021
9:00AM – 12:00PM (CST)
Virtual Meeting
1. Recap SMM Goal, Process, and Schedule
2. Guest Speaker
3. Fundamental Questions
4. Potential SMM Strategies
5. Break
6. Prioritize Strategies
7. Next Steps
a. Stakeholder Meeting#2 (September 30, 2021)
b. Future meetings dates and logistics

Attachment B PowerPoint Presentation

9/9/2021
1
Organics and Fibers Subcommittee Meeting #3September 1, 2021
Agenda
• Recap SMM Goal, Process, and Schedule• Guest Speaker• Fundamental Questions• Potential SMM Strategies • Break• Prioritize Strategies• Next Steps
• Stakeholder Meeting#2 (September 30, 2021)• Future meetings dates and logistics
Goal
Establish a clear direction for implementing an SMM system with immediate, medium and
long-term strategies
Process
Select specific material types
within each category
Define and prioritize specific strategies• Legislation• Policies• Programs• Infrastructure
Identify implementation
timeline, responsible
party, funding measures, and performance
metrics
Material Types Selected
Organics & Fibers
Edible Food
Pre-Consumer Spoiled Food
Compostable/AD Paper, Food and
Yard Waste
Plastics
Single-Use PET Water Bottles
Plastic Film/Bags
Polystyrene (Styrofoam)
Renewable Energy
Equipment
Wind Turbines
Solar Panels
Storage Batteries
Construction & Demolition
Interior Building Components
Roofing Materials
Drywall, Plaster and Gypsum
Board
Treated and Untreated Wood
Subcommittee Role
Finalized Material-Specific Groups
Continue as Active Working Groups
Size and Composition May Change
•Combination of Invitation and Application
•Composition is Fluid
Representation of Various Interests
Reflecting Material Life Cycle
Make Recommendations to
the StakeholdersVital to Project
Progress and Success
9/9/2021
2
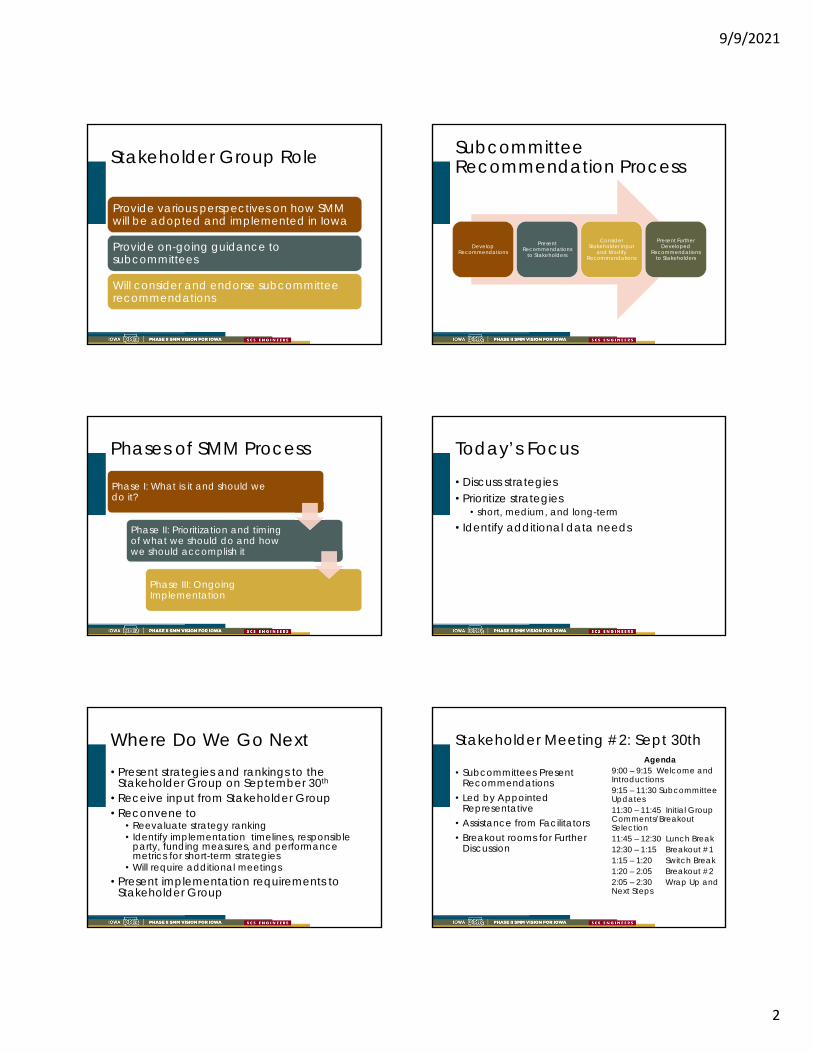
Stakeholder Group Role
Provide various perspectives on how SMM will be adopted and implemented in Iowa
Provide on-going guidance to subcommittees
Will consider and endorse subcommittee recommendations
Subcommittee Recommendation Process
Develop Recommendations
Present Recommendations
to Stakeholders
Consider Stakeholder Input
and Modify Recommendations
Present Further Developed
Recommendations to Stakeholders
Phases of SMM Process
Phase I: What is it and should we do it?
Phase II: Prioritization and timing of what we should do and how we should accomplish it
Phase III: Ongoing Implementation
Today’s Focus
• Discuss strategies• Prioritize strategies
• short, medium, and long-term• Identify additional data needs
Where Do We Go Next• Present strategies and rankings to the
Stakeholder Group on September 30th
• Receive input from Stakeholder Group• Reconvene to
• Reevaluate strategy ranking• Identify implementation timelines, responsible
party, funding measures, and performance metrics for short-term strategies
• Will require additional meetings• Present implementation requirements to
Stakeholder Group
Stakeholder Meeting #2: Sept 30th
• Subcommittees Present Recommendations
• Led by Appointed Representative
• Assistance from Facilitators • Breakout rooms for Further
Discussion
Agenda9:00 – 9:15 Welcome and Introductions9:15 – 11:30 Subcommittee Updates11:30 – 11:45 Initial Group Comments/Breakout Selection11:45 – 12:30 Lunch Break12:30 – 1:15 Breakout #1 1:15 – 1:20 Switch Break1:20 – 2:05 Breakout #22:05 – 2:30 Wrap Up and Next Steps
9/9/2021
3
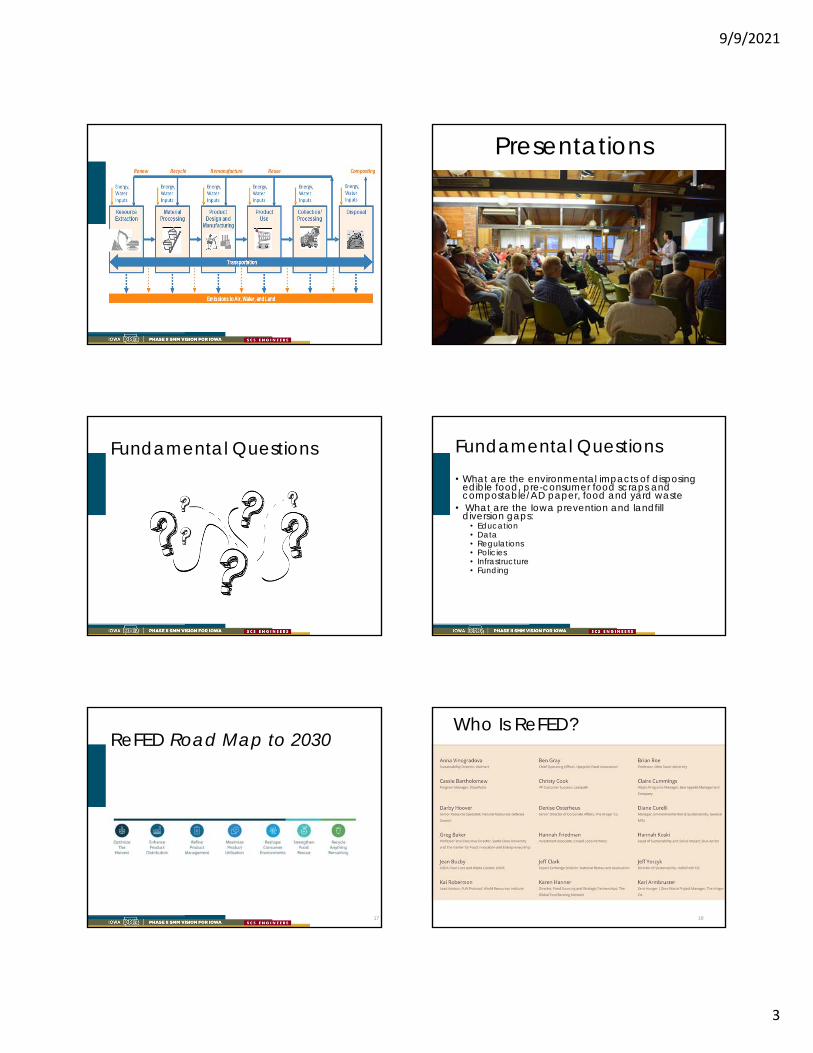
Presentations
14
Fundamental Questions Fundamental Questions• What are the environmental impacts of disposing
edible food, pre-consumer food scraps and compostable/AD paper, food and yard waste
• What are the Iowa prevention and landfill diversion gaps:• Education• Data• Regulations• Policies• Infrastructure• Funding
ReFED Road Map to 2030
17 18
Who Is ReFED?
9/9/2021
4
19
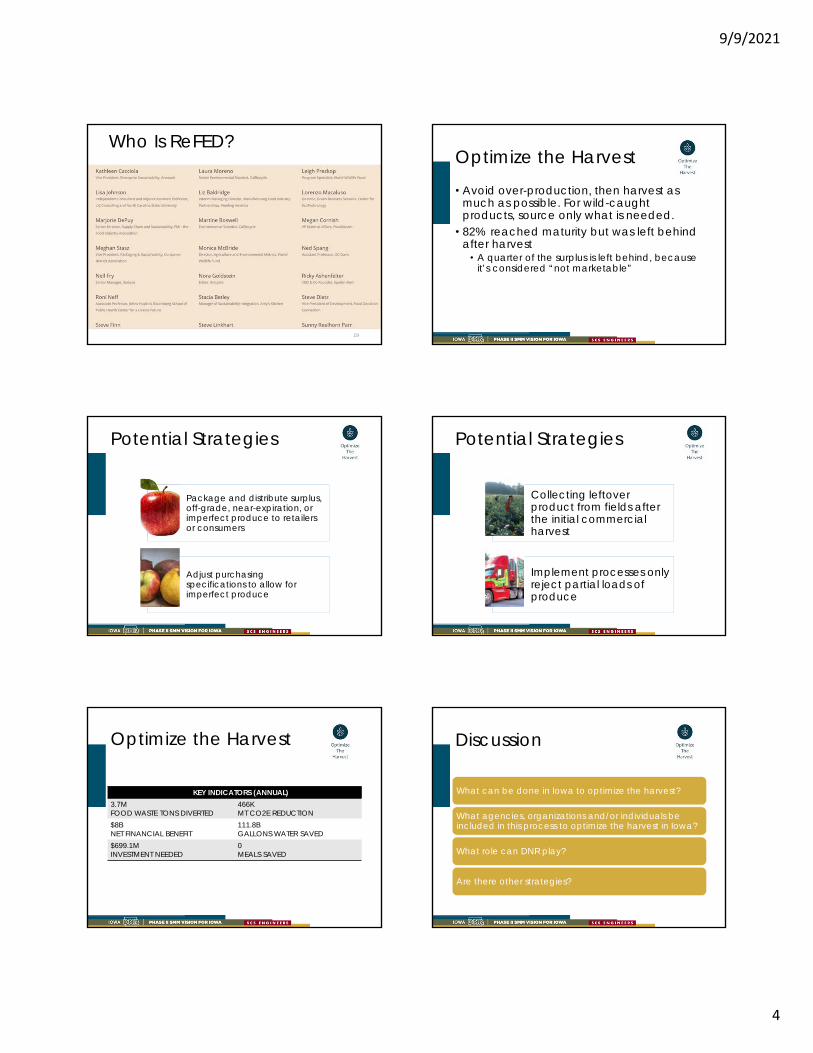
Who Is ReFED?Optimize the Harvest
• Avoid over-production, then harvest as much as possible. For wild-caught products, source only what is needed.
• 82% reached maturity but was left behind after harvest• A quarter of the surplus is left behind, because
it’s considered “not marketable”
Potential Strategies
Package and distribute surplus, off-grade, near-expiration, or imperfect produce to retailers or consumers
Adjust purchasing specifications to allow for imperfect produce
Potential Strategies
Collecting leftover product from fields after the initial commercial harvest
Implement processes only reject partial loads of produce
Optimize the Harvest
3.7MFOOD WASTE TONS DIVERTED
466KMT CO2E REDUCTION
$8BNET FINANCIAL BENEFIT
111.8BGALLONS WATER SAVED
$699.1MINVESTMENT NEEDED
0MEALS SAVED
KEY INDICATORS (ANNUAL)
Discussion
What can be done in Iowa to optimize the harvest?
What agencies, organizations and/or individuals be included in this process to optimize the harvest in Iowa?
What role can DNR play?
Are there other strategies?

9/9/2021
5
Enhance Product Distribution
Maximize freshness and selling time by harnessing the power of technology to create smart systems
to efficiently move products
Food loss during transportation relatively
low during transportation, but room
for improvement
25
Potential Strategies
Use intelligent routing –perishable closer to destination (cold chain management)
Decreased Transit Time
Move product based on what will expire first, rather than when it was received
Potential Strategies
Use technology temperature monitoring (pallet transport)
Reduce warehouse handling
Enhance Product Distribution
3.3MFOOD WASTE TONS DIVERTED
7.1MMT CO2E REDUCTION
$2.2BINVESTMENT NEEDED
528.1BGALLONS WATER SAVED
$8.4BNET FINANCIAL BENEFIT
0MEALS SAVED
KEY INDICATORS (ANNUAL)
Discussion
What can be done in Iowa to Enhance Product Distribution?
What agencies, organizations and/or individuals be included in this process to Enhance Product Distribution in Iowa?
What role can DNR play?
Are there other strategies?
Refine Product Management
Align purchases with sales as closely as
possible, and when surplus arises, finding secondary outlets to
accommodate it
Build out systems and processes for optimal
on-site handling
30

9/9/2021
6
Potential Strategies
Improved intelligence around demand planning through systems or incorporating historical data in future decisions, often using machine learning to aid in better forecasting and fulfillment
Provide technology-enabled tracking of food loss and waste to highlight opportunities for reduction
Potential Strategies
Develop applications that alert consumers to markdowns or excess food at retailers or restaurants
Establish dynamic pricing to help retailers automate and comprehensively update markdowns, optimizing price points to sell more product
Potential Strategies
Minimize on-hand inventory
Decreased minimum order quantity
Potential Strategies
Increased delivery frequency Assisted distressed sales
Collect data on Food generated by sector (i.e. commercial, institutional)
Refine Product Management
4.6MFOOD WASTE TONS DIVERTED
14.2MMT CO2E REDUCTION
$3.9BINVESTMENT NEEDED
528.1BGALLONS WATER SAVED
$15.8BNET FINANCIAL BENEFIT
0MEALS SAVED
KEY INDICATORS (ANNUAL)
Discussion
What can be done in Iowa to Refine Product Management?
What agencies, organizations and/or individuals be included in this process to Refine Product Management in Iowa?
What role can DNR play?
Are there other strategies?

9/9/2021
7
BREAK (10 Minutes)37
Maximize Product Utilization
Designing facilities, operations, and menus to use as much of each
product as possible
Rethinking the concept of “waste” by turning
surplus and byproducts into food products through upcycling
38
Potential Strategies
Promote Manufacturing Byproduct Utilization (upcycling)
Support Active & Intelligent Packaging Research
Identify opportunities to reduce food waste from manufacturing and processing operations
Maximize Product Utilization
3.3MFOOD WASTE TONS DIVERTED
9.8MMT CO2E REDUCTION
$2.4BINVESTMENT NEEDED
869.7BGALLONS WATER SAVED
$4.8BNET FINANCIAL BENEFIT
0MEALS SAVED
KEY INDICATORS (ANNUAL)
Discussion
What can be done in Iowa to Maximize Product Utilization?
What agencies, organizations and/or individuals be included in this process to Maximize Product Utilization in Iowa?
What role can DNR play?
Are there other strategies?
Reshape Consumer Environments
Households are the greatest source of
food waste in the US, making this a critical
area for action
37% of all surplus food is generated by
consumers
42
9/9/2021
8
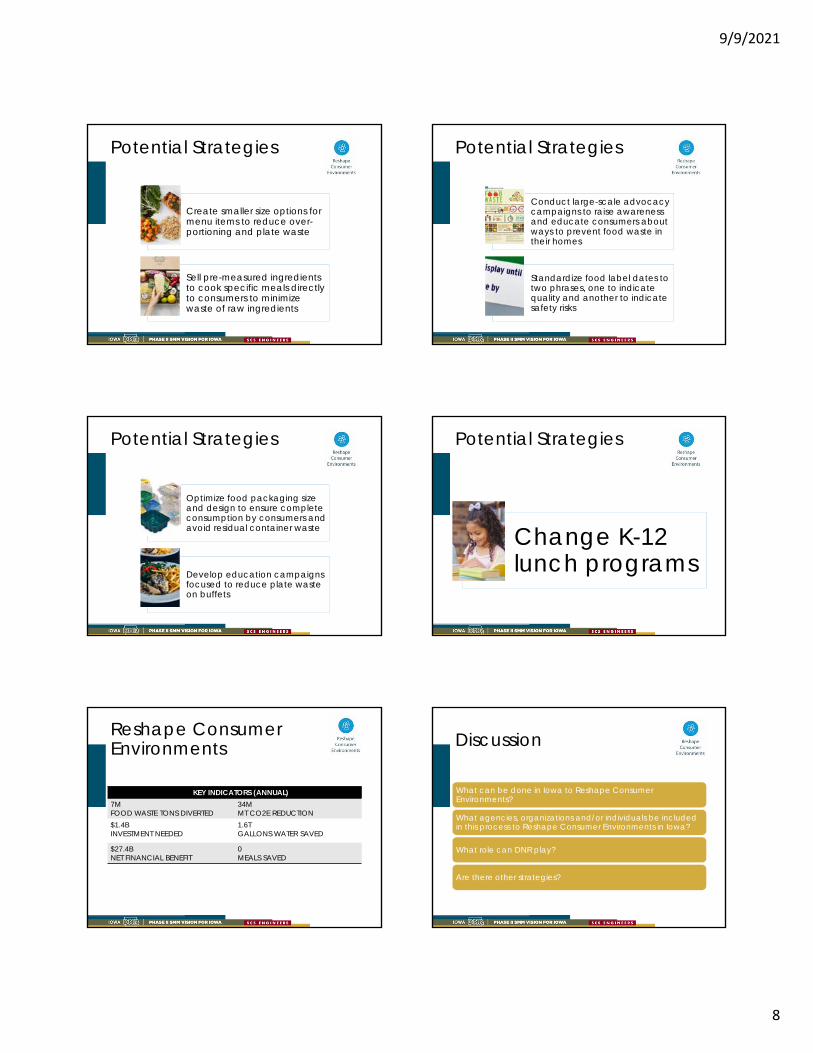
Potential Strategies
Create smaller size options for menu items to reduce over-portioning and plate waste
Sell pre-measured ingredients to cook specific meals directly to consumers to minimize waste of raw ingredients
Potential Strategies
Conduct large-scale advocacy campaigns to raise awareness and educate consumers about ways to prevent food waste in their homes
Standardize food label dates to two phrases, one to indicate quality and another to indicate safety risks
Potential Strategies
Optimize food packaging size and design to ensure complete consumption by consumers and avoid residual container waste
Develop education campaigns focused to reduce plate waste on buffets
Potential Strategies
Change K-12 lunch programs
Reshape Consumer Environments
7MFOOD WASTE TONS DIVERTED
34MMT CO2E REDUCTION
$1.4BINVESTMENT NEEDED
1.6TGALLONS WATER SAVED
$27.4BNET FINANCIAL BENEFIT
0MEALS SAVED
KEY INDICATORS (ANNUAL)
Discussion
What can be done in Iowa to Reshape Consumer Environments?
What agencies, organizations and/or individuals be included in this process to Reshape Consumer Environments in Iowa?
What role can DNR play?
Are there other strategies?

9/9/2021
9
Strengthen Food Rescue
Just 3% of surplus food ends up being
donated, with the greatest portion
coming from grocery retail
Distribution and logistics challenges contribute
to this
49
Potential Strategies
Donation Education
Donation Transportation
Potential Strategies
Donation Storage Handling & Capacity
Donation Coordination & Matching
Potential Strategies
Donation Value-Added Processing
Edible Food Recovery Legislation
Strengthen Food Rescue
2.3MFOOD WASTE TONS DIVERTED
2.7MMT CO2E REDUCTION
$1.4BINVESTMENT NEEDED
298.7BGALLONS WATER SAVED
$8.8BNET FINANCIAL BENEFIT
3.9BMEALS SAVED
KEY INDICATORS (ANNUAL)
Discussion
What can be done in Iowa to Strengthen Food Rescue?
What agencies, organizations and/or individuals be included in this process to Strengthen Food Rescue in Iowa?
What role can DNR play?
Are there other strategies?
9/9/2021
10
Recycle Anything Remaining
Designing facilities, operations, and menus to use as much of each
product as possible
Rethinking the concept of “waste” by turning
surplus and byproducts into food products through upcycling
55
Potential Strategies
Create an inventory of composting and AD facilities
Feed food scraps to livestock
Target communities with no LFG systems
Potential Strategies
Create organic waste sheds
Establish compost standards
Facilitate innovative processing technologies
Define compostable versus biodegradable
Potential Strategies
Food scraps disposal ban
Organic waste disposal ban
Provide organic waste collection to all residents and businesses
Potential Strategies
State to procure recycled organic waste products (i.e., compost, renewable gas, etc.)
Increase compost and AD infrastructure
Recycle Anything Remaining
20.9MFOOD WASTE TONS DIVERTED
6.8MMT CO2E REDUCTION
$2.2BINVESTMENT NEEDED
0GALLONS WATER SAVED
0NET FINANCIAL BENEFIT
0MEALS SAVED
KEY INDICATORS (ANNUAL)

9/9/2021
11
Discussion
What can be done in Iowa to Recycle Anything Else?
What agencies, organizations and/or individuals be included in this process to Recycle Anything Else?
What role can DNR play?
Are there other strategies? BREAK (10 Minutes)62
SummaryTons Diverted from the Landfill
Summary
MtCO2E Reduced
65
Where Do We Go Next
Present strategies and rankings to the Stakeholder Group on September 30th
Receive input from Stakeholder Group
Reconvene to•Reevaluate strategy ranking
•Identify implementation timelines, responsible party, funding measures, and performance metrics
Present implementation requirements to
Stakeholder Group

Attachment C Additional Information

Roadmap to 2030: ReducingU.S. Food Waste by 50% and the ReFED Insights EngineAt-A-Glance
February 2021

Acknowledgements
This effort would not be possible without the generous support of:
Funders
Contributors
Additional funding came from:
ReFED’s Roadmap to 2030 and Insights Engine analysis draws from the input of dozens of experts and practitioners from the food industry, professional trades, solution providers, academia, and more. We have enormous appreciation for the time, expertise, and data that they contributed. Please click here for a full list of all the contributors who have helped to make these resources possible.
About ReFEDReFED is a national nonprofit working to end food loss and waste across the food system by advancing data-driven solutions to the problem. We leverage data and insights to highlight supply chain inefficiencies and economic opportunities; mobilize and connect supporters to take targeted action; and catalyze capital to spur innovation and scale high-impact initiatives. Our goal is a sustainable, resilient, and inclusive food system that optimizes environmental resources, minimizes climate impacts, and makes the best use of the food we grow. To learn more about our solutions to reduce food waste, please visit www.refed.com.
AJANA FOUNDATION
ARJAY R. & FRANCES F. MILLER FAMILY FOUNDATION
ATTICUS TRUST
HARBOURTON FOUNDATION
THE HINDAWI FOUNDATION
KENNETH GOLDMAN DONOR FUND
PETER WELLES
WIANCKO CHARITABLE FOUNDATION
ROBERT W. WILSON CHARITABLE TRUST
ANONYMOUS DONOR
THE CLANEIL FOUNDATION
CROWN FAMILY PHILANTHROPIES
THE FINK FAMILY FOUNDATION
GENERAL MILLS
POSNER FOUNDATION OF PITTSBURGH
SPRING POINT PARTNERS
WALMART FOUNDATION
Anchor Funder
In-Kind Funders
All data in this document comes from the ReFED Insights Engine, unless otherwise noted. To
download our methodologies and other related resources, please click here.

1 in 6Americans arefood insecure
Climate and Resources
In 2019, the U.S. let a huge 35% of the 229 million tons of food available go unsold or uneaten. We call this “surplus food,” and while a very small portion of it is donated to those in need and more is recycled, the vast majority becomes “food waste,” going straight to landfill, incineration, or down the drain, or is simply left in the fields to rot. Overall, ReFED estimates that 24% of food in the U.S. – 54 million tons – goes to these waste destinations.
That’s almost 130 billion meals’ worth of food that we’re letting go unsold or uneaten each year, worth almost 2% of U.S. GDP. And the impacts of surplus food and food waste on our climate and environment are enormous, since food that is never eaten still requires resources to grow, harvest, transport, cool, cook, or otherwise prepare – even when it ends up being disposed of. Around the world, food waste has been recognized as an urgent issue requiring immediate action – the United Nations, U.S. Government, European Parliament, global business coalitions such as the Consumer Goods Forum, and more have all set goals to cut food waste in half by 2025 or 2030.
In the United States, 35% of all food goes unsoldor uneaten – and most of that ends up in the trash.
What is the Impact of Uneaten Food?
When food goes uneaten, the resources used to produce it go to waste as well. If all of our country’s surplus food was grown in one place, this “mega-farm” would cover roughly 80 million acres, over three-quarters of the state of California. In the United States alone, surplus food is responsible for:
EconomicIn 2019, surplus food was valued at $408 billion. Of this, 70% – $285 billion – was due to food waste. While the financial cost of uneaten food is greatest for consumers, the food industry lost $250 billion, with restaurants and other foodservice businesses shouldering the greatest burden.
Food SecurityBecause of the impact of COVID-19, the number of people struggling with food insecurity grew in 2020 to more than 50 million, according to Feeding America. A significant portion of wasted food is perfectly edible and could go to help those in need.
of U.S. GHGEmissions
4%of all Fresh Water Use
of all Cropland Use
14%
18%of Landfill Inputs#1 material (EPA Estimate)
24%
$408BTotal Value OfSurplus Food
DONATED FOOD
$10B | 2%
RECYCLED FOOD
$113B | 28%
FOOD WASTE
$285B | 70%
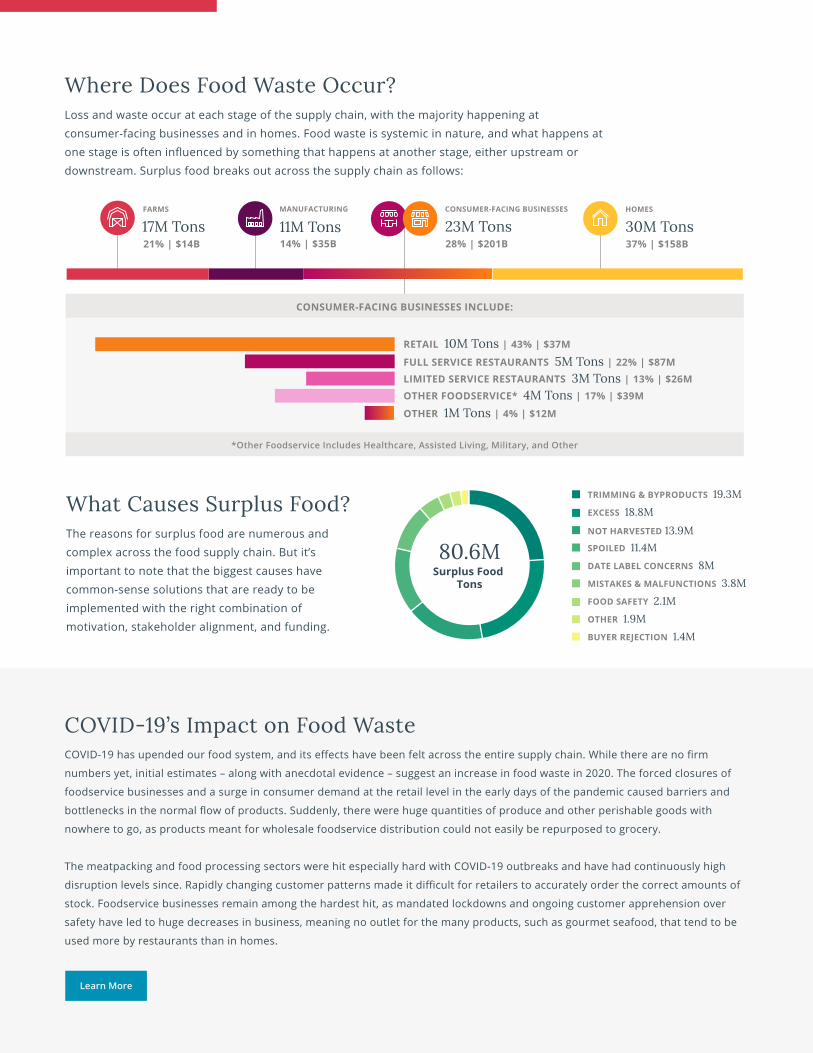
Where Does Food Waste Occur?Loss and waste occur at each stage of the supply chain, with the majority happening at consumer-facing businesses and in homes. Food waste is systemic in nature, and what happens at one stage is often influenced by something that happens at another stage, either upstream or downstream. Surplus food breaks out across the supply chain as follows:
What Causes Surplus Food?The reasons for surplus food are numerous and complex across the food supply chain. But it’s important to note that the biggest causes have common-sense solutions that are ready to be implemented with the right combination of motivation, stakeholder alignment, and funding.
COVID-19’s Impact on Food WasteCOVID-19 has upended our food system, and its effects have been felt across the entire supply chain. While there are no firm
numbers yet, initial estimates – along with anecdotal evidence – suggest an increase in food waste in 2020. The forced closures of
foodservice businesses and a surge in consumer demand at the retail level in the early days of the pandemic caused barriers and
bottlenecks in the normal flow of products. Suddenly, there were huge quantities of produce and other perishable goods with
nowhere to go, as products meant for wholesale foodservice distribution could not easily be repurposed to grocery.
The meatpacking and food processing sectors were hit especially hard with COVID-19 outbreaks and have had continuously high
disruption levels since. Rapidly changing customer patterns made it difficult for retailers to accurately order the correct amounts of
stock. Foodservice businesses remain among the hardest hit, as mandated lockdowns and ongoing customer apprehension over
safety have led to huge decreases in business, meaning no outlet for the many products, such as gourmet seafood, that tend to be
used more by restaurants than in homes.
NOT HARVESTED 13.9MEXCESS 18.8MTRIMMING & BYPRODUCTS 19.3M
SPOILED 11.4MDATE LABEL CONCERNS 8MMISTAKES & MALFUNCTIONS 3.8MFOOD SAFETY 2.1MOTHER 1.9MBUYER REJECTION 1.4M
Learn More
80.6MSurplus Food
Tons
HOMESMANUFACTURING CONSUMER-FACING BUSINESSESFARMS
37% | $158B14% | $35B 28% | $201B21% | $14B30M Tons11M Tons 23M Tons17M Tons
RETAIL 10M Tons | 43% | $37M
FULL SERVICE RESTAURANTS 5M Tons | 22% | $87MLIMITED SERVICE RESTAURANTS 3M Tons | 13% | $26MOTHER FOODSERVICE* 4M Tons | 17% | $39M
CONSUMER-FACING BUSINESSES INCLUDE:
OTHER 1M Tons | 4% | $12M
*Other Foodservice Includes Healthcare, Assisted Living, Military, and Other

Food waste is a solvable problem - here’s how to do it.In line with the “Target-Measure-Act” framework for food waste reduction that’s been adopted around the world, ReFED’s Roadmap to 2030 is a comprehensive blueprint for action that can help the food system cut food waste by 50% over the next ten years. We estimate that with a $14 billion investment in food waste reduction solutions each year for the next ten years, the U.S. can achieve an annual reduction in food waste of 45 million tons, deliver $73 billion in annual net financial benefit for the country, reduce GHG emissions by 75 million metric tons and rescue food equivalent to four billion meals for people in need each year, create 51,000 jobs over ten years – and achieve our 2030 reduction goal.
Powered by the Insights EnginePowering the Roadmap to 2030, ReFED’s new Insights Engine is an online resource providing data and solutions to help you bring a food waste reduction initiative to life – including a granular analysis of food waste by sector, state, food type, cause, and impact; a comprehensive review of 40+ food waste reduction solutions; a detailed overview of the funding needed to implement each solution and the corresponding return; a directory of solution providers; and more.
GALLONS IN WATER SAVINGS4T
TONS GHG EMISSION REDUCTION POTENTIAL (MT CO2e)75M
JOBS CREATED THROUGH SOLUTION IMPLEMENTATION OVER 10 YEARS51K
MEALS FOR PEOPLE IN NEED4B
NET FINANCIAL BENEFIT$73B
ANNUAL FOOD WASTEDIVERSION (TONS)
45M
40+SOLUTIONS
$14BINVESTMENT ANNUALLY
POLICY CHANGES
INNOVATION
ENGAGEMENT
IMPACT PER YEARWHAT'S NEEDEDWASTE
REDUCTION
Launch the Insights Engine
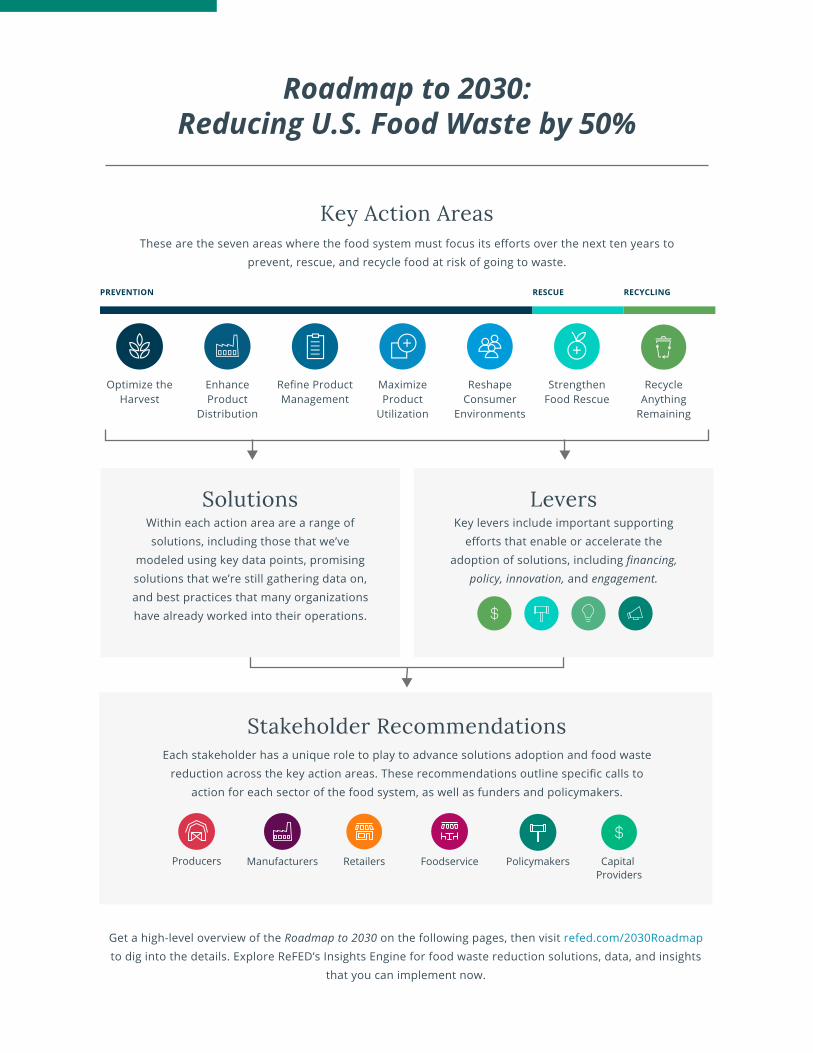
Key Action AreasThese are the seven areas where the food system must focus its efforts over the next ten years to
prevent, rescue, and recycle food at risk of going to waste.
Get a high-level overview of the Roadmap to 2030 on the following pages, then visit refed.com/2030Roadmap to dig into the details. Explore ReFED’s Insights Engine for food waste reduction solutions, data, and insights
that you can implement now.
Optimize the Harvest
Enhance Product
Distribution
Refine Product Management
Maximize Product
Utilization
Reshape Consumer
Environments
Strengthen Food Rescue
Recycle Anything
Remaining
PREVENTION RESCUE RECYCLING
Stakeholder Recommendations
Producers PolicymakersFoodserviceManufacturers Retailers CapitalProviders
Each stakeholder has a unique role to play to advance solutions adoption and food waste reduction across the key action areas. These recommendations outline specific calls to
action for each sector of the food system, as well as funders and policymakers.
Solutions LeversWithin each action area are a range of solutions, including those that we’ve
modeled using key data points, promising solutions that we’re still gathering data on, and best practices that many organizations have already worked into their operations.
Key levers include important supporting efforts that enable or accelerate the
adoption of solutions, including financing,
policy, innovation, and engagement.
Roadmap to 2030:Reducing U.S. Food Waste by 50%

A focus on these seven areas can make a meaningful reduction in the amount of food going to waste across the food supply chain. We’ve placed an emphasis on prevention-related action areas, as they typically have the greatest financial and environmental impact compared to the investment required, yet have received less attention than rescue and recycling in the past.
Key Action Areas
$8B
Optimize the Harvest
Avoid overproduction, then harvest as much as possible. For wild-caught products, source only what is needed.
Imperfect & Surplus Produce Channels
Buyer Specification Expansion
Gleaning
Partial Order Acceptance
$5.1B Net Financial Benefit
$2.7B Net Financial Benefit
$152M Net Financial Benefit
$78.8M Net Financial Benefit
2.9M Food Waste Tons Diverted
667.6K Food Waste Tons Diverted
78.5K Food Waste Tons Diverted
38.6K Food Waste Tons Diverted
NET FINANCIAL BENEFIT
3.7MFOOD WASTE TONS DIVERTED
$699.1MINVESTMENT NEEDED
0MEALS SAVED
466KMTCO2e REDUCTION
111.8BGALLONS WATER SAVED
KEYINDICATORS(ANNUAL)
Dive into this Key Action Area
4 Modeled Solutions
$8.4BNET FINANCIAL BENEFIT
3.3MFOOD WASTE TONS DIVERTED
$2.2BINVESTMENT NEEDED
0MEALS SAVED
7.1MMTCO2e REDUCTION
528.1BGALLONS WATER SAVED
KEYINDICATORS(ANNUAL)
Enhance Product Distribution
Leverage technology to create smart systems that help efficiently move products to maximize freshness and selling time.
Fact Sheet
Fact Sheet
Fact Sheet
Fact Sheet
|
|
|
|
$2.7B Net Financial Benefit
$2.5B Net Financial Benefit
$1.6B Net Financial Benefit
$1.5B Net Financial Benefit
1.1M Food Waste Tons Diverted
617.5K Food Waste Tons Diverted
1.0M Food Waste Tons Diverted
550.6K Food Waste Tons Diverted
5 Modeled Solutions
Fact Sheet
Fact Sheet
Fact Sheet
Fact Sheet
|
|
|
|
$63.4M Net Financial Benefit 22.3K Food Waste Tons Diverted Fact Sheet|
Intelligent Routing
Decreased Transit Time
First Expired First Out
Temperature Monitoring (Pallet Transport)
Reduced Warehouse Handling
Dive into this Key Action Area
Learn more about these modeled solutions and explore unmodeled solutions, best practices, and levers on our website.
Learn more about these modeled solutions and explore unmodeled solutions, best practices, and levers on our website.
PRIVATE
PHILANTHROPIC
PUBLIC
Venture Capital
Non-Government Grants
Government Grants
Private Equity
Impact-First Investments
Government Project Finance
Corporate Finance & SpendingCommercial Project Finance
Government Tax Incentives
$81.9M
$52.1M
$32.2M
$81.9M
$98.6M
$0
$352.4M$0
$0
ANNUALINVESTMENT
NEEDED
$699.1M
Venture Capital
Non-Government Grants
Government Grants
Private Equity
Impact-First Investments
Government Project Finance
Corporate Finance & SpendingCommercial Project Finance
Government Tax Incentives
PRIVATE
PHILANTHROPIC
PUBLIC
$205.2M
$56.6M
$31.0M
$205.2M
$117.7M
$0
$1.6B$0
$0
ANNUALINVESTMENT
NEEDED
$2.2B

Maximize Product Utilization
Design facilities, operations and menus to use as much of each product as possible. Upcycle surplus and byproducts into food products.
Refine Product Management
Align purchases with sales as closely as possible and find secondary outlets for surplus. Build out systems and processes for optimal on-site handling.
$15.8B
Enhanced Demand Planning
Waste Tracking (Foodservice)
Markdown Alert Applications
Dynamic Pricing
$5.2B Net Financial Benefit
$3.8B Net Financial Benefit
$3.8B Net Financial Benefit
$1.1B Net Financial Benefit
1.2M Food Waste Tons Diverted
1.0M Food Waste Tons Diverted
771.1K Food Waste Tons Diverted
461.8K Food Waste Tons Diverted
NET FINANCIAL BENEFIT
4.6MFOOD WASTE TONS DIVERTED
$3.9BINVESTMENT NEEDED
0MEALS SAVED
14.2MMTCO2e REDUCTION
852.7BGALLONS WATER SAVED
KEYINDICATORS(ANNUAL)
Dive into this Key Action Area
9 Modeled Solutions
Fact Sheet
Fact Sheet
Fact Sheet
Fact Sheet
|
|
|
|
Assisted Distressed Sales
Minimized On Hand Inventory
Decreased Minimum Order Quantity
Increased Delivery Frequency
$339.4M Net Financial Benefit
$620.9M Net Financial Benefit
$568.7M Net Financial Benefit
$374.0M Net Financial Benefit
590.5K Food Waste Tons Diverted
195.2K Food Waste Tons Diverted
189.2K Food Waste Tons Diverted
138.6K Food Waste Tons Diverted
Fact Sheet
Fact Sheet
Fact Sheet
Fact Sheet
|
|
|
|
Temperature Monitoring (Foodservice) $15.5M Net Financial Benefit 4.2K Food Waste Tons Diverted Fact Sheet|
$4.8B
Manufacturing Byproduct Utilization (Upcycling)
Manufacturing Line Optimization
Active & Intelligent Packaging
$2.7B Net Financial Benefit
$328.2M Net Financial Benefit
$1.7B Net Financial Benefit
1.9M Food Waste Tons Diverted
967.1K Food Waste Tons Diverted
451.8K Food Waste Tons Diverted
NET FINANCIAL BENEFIT
3.3MFOOD WASTE TONS DIVERTED
$2.4BINVESTMENT NEEDED
0MEALS SAVED
9.8MMTCO2e REDUCTION
869.7BGALLONS WATER SAVED
KEYINDICATORS(ANNUAL)
Dive into this Key Action Area
3 Modeled Solutions
Fact Sheet
Fact Sheet
Fact Sheet
|
|
|
Learn more about these modeled solutions and explore unmodeled solutions, best practices, and levers on our website.
Learn more about these modeled solutions and explore unmodeled solutions, best practices, and levers on our website.
Venture Capital
Non-Government Grants
Government Grants
Private Equity
Impact-First Investments
Government Project Finance
Corporate Finance & SpendingCommercial Project Finance
Government Tax Incentives
PRIVATE
PHILANTHROPIC
PUBLIC
$613.4M
$202.2M
$39.4M
$220.2M
$262.0M
$0
$2.5B$0
$0
ANNUALINVESTMENT
NEEDED
$3.9B
Venture Capital
Non-Government Grants
Government Grants
Private Equity
Impact-First Investments
Government Project Finance
Corporate Finance & SpendingCommercial Project Finance
Government Tax Incentives
PRIVATE
PHILANTHROPIC
PUBLIC
$288.4M
$96.1M
$96.1M
$411.1M
$96.1M
$0
$1.4B$0
$0
ANNUALINVESTMENT
NEEDED
$2.4B

Reshape Consumer Environments
Drive consumers towards better food management and less waste by creating shopping, cooking, and eating environments that promote those behaviors.
Strengthen Food Rescue
Further the rescue of high-quality, nutritious food by increasing capacity, addressing bottlenecks, and improving communication flow.
$27.4B
Portion Sizes
Meal Kits
Consumer Education Campaigns
Package Design
$9.0B Net Financial Benefit
$6.5B Net Financial Benefit
$6.1B Net Financial Benefit
$2.4B Net Financial Benefit
2.4M Food Waste Tons Diverted
1.7M Food Waste Tons Diverted
1.4M Food Waste Tons Diverted
649.5K Food Waste Tons Diverted
NET FINANCIAL BENEFIT
7MFOOD WASTE TONS DIVERTED
$1.4BINVESTMENT NEEDED
0MEALS SAVED
34MMTCO2e REDUCTION
1.6TGALLONS WATER SAVED
KEYINDICATORS(ANNUAL)
Dive into this Key Action Area
10 Modeled Solutions
Fact Sheet
Fact Sheet
Fact Sheet
Fact Sheet
|
|
|
|
Standardized Date Labels
Trayless
Small Plates
Buffet Signage
$2.4B Net Financial Benefit
$366.1M Net Financial Benefit
$355.9M Net Financial Benefit
$194.6M Net Financial Benefit
582.4M Food Waste Tons Diverted
104.2K Food Waste Tons Diverted
95.6K Food Waste Tons Diverted
52.3K Food Waste Tons Diverted
Fact Sheet
Fact Sheet
Fact Sheet
Fact Sheet
|
|
|
|
K-12 Education Campaigns $25.5M Net Financial Benefit 14.8K Food Waste Tons Diverted Fact Sheet|
K-12 Lunch Improvements $13.2M Net Financial Benefit 7.1K Food Waste Tons Diverted Fact Sheet|
$8.8B
Donation Education
Donation Transportation
Donation Storage Handling & Capacity
$4.5B Net Financial Benefit
$2.5B Net Financial Benefit
$826.6M Net Financial Benefit
1.1M Food Waste Tons Diverted
642.7K Food Waste Tons Diverted
265.4K Food Waste Tons Diverted
NET FINANCIAL BENEFIT
2.3MFOOD WASTE TONS DIVERTED
$1.4BINVESTMENT NEEDED
3.9BMEALS SAVED
2.7MMTCO2e REDUCTION
298.7BGALLONS WATER SAVED
KEYINDICATORS(ANNUAL)
Dive into this Key Action Area
5 Modeled Solutions
Fact Sheet
Fact Sheet
Fact Sheet
|
|
|
Donation Value-Added Processing
Donation Coordination & Matching
$429.6M Net Financial Benefit
$594.9M Net Financial Benefit
190.8K Food waste Tons Diverted
143.7K Food waste Tons Diverted
Fact Sheet
Fact Sheet
|
|
Learn more about these modeled solutions and explore unmodeled solutions, best practices, and levers on our website.
Learn more about these modeled solutions and explore unmodeled solutions, best practices, and levers on our website.
PRIVATE
PHILANTHROPIC
PUBLIC
$166.4M
$54.9M
$104.0M
$165.4M
$29.0M
$0
$908.2M$0
$0
Venture Capital
Non-Government Grants
Government Grants
Private Equity
Impact-First Investments
Government Project Finance
Corporate Finance & SpendingCommercial Project Finance
Government Tax Incentives
ANNUALINVESTMENT
NEEDED
$1.4B
INVESTMENTREQUIRED
$1.4B
PRIVATE
PHILANTHROPIC
PUBLIC
$21.3M
$697.2M
$228.5M
$0
$206.0M
$0
$104.9M $0
$97.2M
Venture Capital
Non-Government Grants
Government Grants
Private Equity
Impact-First Investments
Government Project Finance
Corporate Finance & SpendingCommercial Project Finance
Government Tax Incentives
ANNUALINVESTMENT
NEEDED
$1.4B

Recycle Anything Remaining
Find the highest and best use for any remaining food or food scraps in order to capture nutrients, energy, or other residual value.
$293.7M
Centralized Composting
Centralized Anaerobic Digestion
Co-digestion At Wastewater Treatment Plants
Home Composting
$49.4M Net Financial Benefit
$171.4M Net Financial Benefit
$71.0M Net Financial Benefit
$4.9M Net Financial Benefit
13.8M Food Waste Tons Diverted
3.8M Food Waste Tons Diverted
3.0M Food Waste Tons Diverted
93.6K Food Waste Tons Diverted
NET FINANCIAL BENEFIT
20.9MFOOD WASTE TONS DIVERTED
$2.2BINVESTMENT NEEDED
0MEALS SAVED
6.8MMTCO2e REDUCTION
0GALLONS WATER SAVED
KEYINDICATORS(ANNUAL)
Dive into this Key Action Area
6 Modeled Solutions
Fact Sheet
Fact Sheet
Fact Sheet
Fact Sheet
|
|
|
|
Livestock Feed
Community Composting
$-1.5M Net Financial Benefit
$-1.5M Net Financial Benefit
60.4K Food Waste Tons Diverted
57K Food Waste Tons Diverted
Fact Sheet
Fact Sheet
|
|
Learn more about these modeled solutions and explore unmodeled solutions, best practices, and levers on our website.
PRIVATE
PHILANTHROPIC
PUBLIC
$44.1M
$58.2M
$493.2M
$848K
$99.8M
$714.2M
$205.0M$617.3M
$0
Venture Capital
Non-Government Grants
Government Grants
Private Equity
Impact-First Investments
Government Project Finance
Corporate Finance & SpendingCommercial Project Finance
Government Tax Incentives
ANNUALINVESTMENT
NEEDED
$2.2B
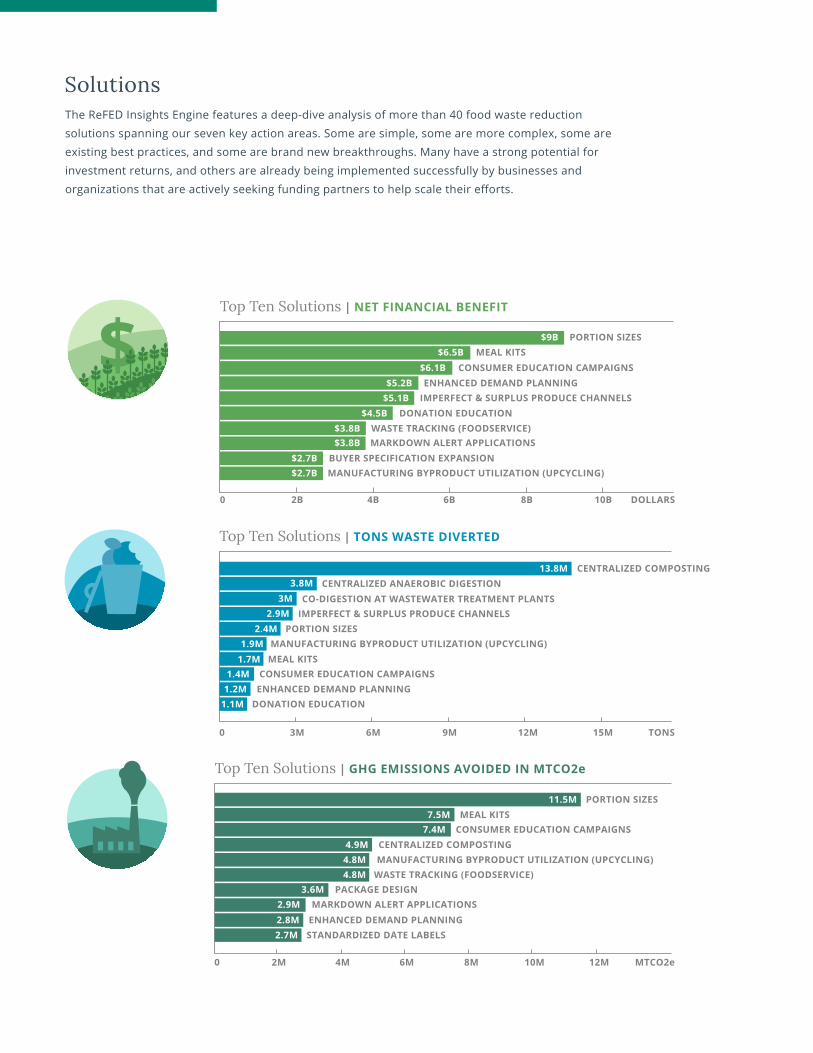
The ReFED Insights Engine features a deep-dive analysis of more than 40 food waste reduction solutions spanning our seven key action areas. Some are simple, some are more complex, some are existing best practices, and some are brand new breakthroughs. Many have a strong potential for investment returns, and others are already being implemented successfully by businesses and organizations that are actively seeking funding partners to help scale their efforts.
Solutions
0 2M 4M MTCO2e6M 8M 10M 12M
Top Ten Solutions | GHG EMISSIONS AVOIDED IN MTCO2e
0 2B 4B DOLLARS6B 8B 10B
Top Ten Solutions | NET FINANCIAL BENEFIT
0 3M TONS6M 15M9M 12M
Top Ten Solutions | TONS WASTE DIVERTED
1.1M1.2M1.4M
1.7M1.9M
2.4M2.9M
3M3.8M
13.8M CENTRALIZED COMPOSTINGCENTRALIZED ANAEROBIC DIGESTION
CO-DIGESTION AT WASTEWATER TREATMENT PLANTSIMPERFECT & SURPLUS PRODUCE CHANNELS
PORTION SIZESMANUFACTURING BYPRODUCT UTILIZATION (UPCYCLING)
MEAL KITSCONSUMER EDUCATION CAMPAIGNS
ENHANCED DEMAND PLANNINGDONATION EDUCATION
PORTION SIZESMEAL KITS
CONSUMER EDUCATION CAMPAIGNSCENTRALIZED COMPOSTINGMANUFACTURING BYPRODUCT UTILIZATION (UPCYCLING)
WASTE TRACKING (FOODSERVICE)PACKAGE DESIGN
MARKDOWN ALERT APPLICATIONSENHANCED DEMAND PLANNINGSTANDARDIZED DATE LABELS
PORTION SIZESMEAL KITS
CONSUMER EDUCATION CAMPAIGNSENHANCED DEMAND PLANNING
IMPERFECT & SURPLUS PRODUCE CHANNELSDONATION EDUCATION
WASTE TRACKING (FOODSERVICE)MARKDOWN ALERT APPLICATIONS
BUYER SPECIFICATION EXPANSIONMANUFACTURING BYPRODUCT UTILIZATION (UPCYCLING)$2.7B
$2.7B$3.8B$3.8B
$4.5B$5.1B$5.2B
$6.1B$6.5B
$9B
11.5M7.5M
7.4M4.9M4.8M4.8M
3.6M2.9M2.8M2.7M

These essential tools can facilitate the implementation – and scaling – of food waste reduction solutions:
Levers
Financing
Innovation
Policy
Engagement
In the fight against food waste, capital plays an integral role in funding the development and adoption of food waste solutions – many of which have a strong potential for investment returns. Effective action against food waste requires a smart matching of the correct type of capital with the appropriate opportunity, and in many cases, multiple types of capital are required to fund food waste reduction solutions from conception to adoption.
Policy and regulation are especially effective in overcoming challenges by 1) changing incentive structures, especially when there are misaligned incentives between who is funding a solution and who is receiving the benefit; 2) driving scaled adoption of early-stage technologies; and 3) bringing about changes that market forces alone don’t address. Additionally, federal policy plays an important role when differing state policies can make solutions implementation difficult (e.g., by standardizing conflicting date labeling requirements).
The implementation of existing solutions can reduce a significant amount of food from going to waste across the supply chain. But there is still a need for new innovations to accelerate the adoption of these solutions and to develop new products, technologies, and business models to close the gaps where solutions either don’t exist or are struggling to adequately scale.
Multi-stakeholder or systems-level communication, education, and training can facilitate the adoption of food waste reduction solutions. Because it’s a system-wide problem, reducing food waste often requires collaboration among different sectors; building and using cross-sector relationships can accelerate adoption or even enable solutions to be implemented in the first place.
Learn More About Levers
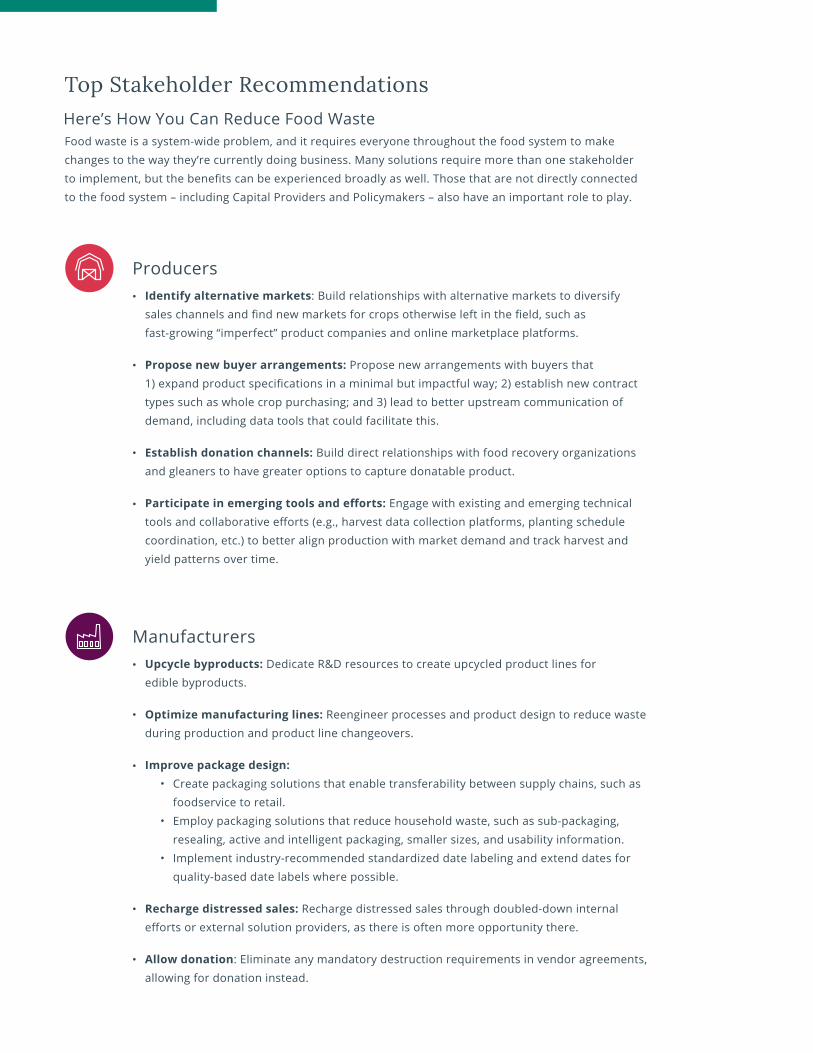
Food waste is a system-wide problem, and it requires everyone throughout the food system to make changes to the way they’re currently doing business. Many solutions require more than one stakeholder to implement, but the benefits can be experienced broadly as well. Those that are not directly connected to the food system – including Capital Providers and Policymakers – also have an important role to play.
Top Stakeholder RecommendationsHere’s How You Can Reduce Food Waste
ProducersIdentify alternative markets: Build relationships with alternative markets to diversify sales channels and find new markets for crops otherwise left in the field, such as fast-growing “imperfect” product companies and online marketplace platforms.
Propose new buyer arrangements: Propose new arrangements with buyers that 1) expand product specifications in a minimal but impactful way; 2) establish new contract types such as whole crop purchasing; and 3) lead to better upstream communication of demand, including data tools that could facilitate this.
Establish donation channels: Build direct relationships with food recovery organizations and gleaners to have greater options to capture donatable product.
Participate in emerging tools and efforts: Engage with existing and emerging technical tools and collaborative efforts (e.g., harvest data collection platforms, planting schedule coordination, etc.) to better align production with market demand and track harvest and yield patterns over time.
ManufacturersUpcycle byproducts: Dedicate R&D resources to create upcycled product lines for edible byproducts.
Optimize manufacturing lines: Reengineer processes and product design to reduce waste during production and product line changeovers.
Improve package design: Create packaging solutions that enable transferability between supply chains, such as foodservice to retail. Employ packaging solutions that reduce household waste, such as sub-packaging, resealing, active and intelligent packaging, smaller sizes, and usability information. Implement industry-recommended standardized date labeling and extend dates for quality-based date labels where possible.
Recharge distressed sales: Recharge distressed sales through doubled-down internal efforts or external solution providers, as there is often more opportunity there.
Allow donation: Eliminate any mandatory destruction requirements in vendor agreements, allowing for donation instead.

RetailersEnhance demand planning: Optimize forecasting and inventory management systems throughout operations with demand planning informed by machine learning.
Employ dynamic pricing models: Implement dynamic pricing and markdown strategies such as markdown alert apps that increase sales of short-life product.
Implement advanced distribution technologies: Implement technologies that will inform product quality and shelf life, such as early product analysis and detection, and incorporate intelligent routing solutions using dynamic decision-making based on product freshness.
Buy more of what is grown:Strive for stable buyer-grower relationships and innovative purchasing models, such as whole-crop purchasing, to ensure full utilization of product grown.Revise product specifications to accept broader cosmetic variety, using more of what is actually grown; where not feasible, create established “imperfect” product lines.
Assist customers with food management: Educate and assist consumers in better home food management through in-store information, food preparation services (e.g., meal kits, on-demand cutting or butchering), appropriate promotions, and customized product tips.
FoodserviceOffer reduced portion sizes and “à la carte” choices: Discourage plate waste by reducing portion sizes and/or offering customers flexibility in portion sizes, sides, and à la carte options.
Track waste: Implement waste tracking processes to inform production, menu planning, and inventory management.
Design low-waste menus: Implement low-waste menu design solutions, including smaller menus, product repurposing, and whole-product utilization.
Sell end-of-day product: Employ dynamic pricing options for end-of-day sales, such as late happy hours or using markdown alert apps.
Establish donation relationships: Establish relationships for collection of extra food for donation, either directly with organizations or through matching software solutions.
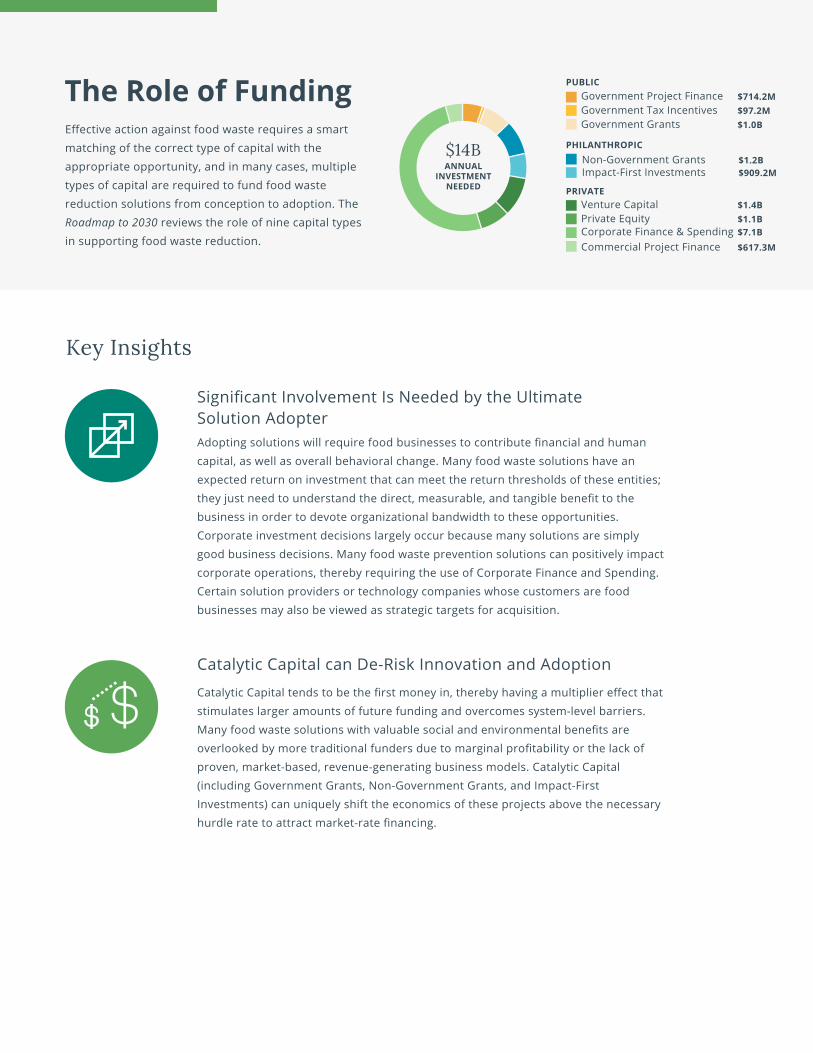
Effective action against food waste requires a smart matching of the correct type of capital with the appropriate opportunity, and in many cases, multiple types of capital are required to fund food waste reduction solutions from conception to adoption. The Roadmap to 2030 reviews the role of nine capital types in supporting food waste reduction.
The Role of Funding
Significant Involvement Is Needed by the Ultimate Solution AdopterAdopting solutions will require food businesses to contribute financial and human capital, as well as overall behavioral change. Many food waste solutions have an expected return on investment that can meet the return thresholds of these entities; they just need to understand the direct, measurable, and tangible benefit to the business in order to devote organizational bandwidth to these opportunities. Corporate investment decisions largely occur because many solutions are simply good business decisions. Many food waste prevention solutions can positively impact corporate operations, thereby requiring the use of Corporate Finance and Spending. Certain solution providers or technology companies whose customers are food businesses may also be viewed as strategic targets for acquisition.
Catalytic Capital can De-Risk Innovation and Adoption
Catalytic Capital tends to be the first money in, thereby having a multiplier effect that stimulates larger amounts of future funding and overcomes system-level barriers. Many food waste solutions with valuable social and environmental benefits are overlooked by more traditional funders due to marginal profitability or the lack of proven, market-based, revenue-generating business models. Catalytic Capital (including Government Grants, Non-Government Grants, and Impact-First Investments) can uniquely shift the economics of these projects above the necessary hurdle rate to attract market-rate financing.
Key Insights
PRIVATE
PHILANTHROPIC
PUBLIC
$1.4B
$1.2B
$1.0B
$1.1B
$909.2M
$714.2M
$7.1B $617.3M
$97.2M
Venture Capital
Non-Government Grants
Government Grants
Private Equity
Impact-First Investments
Government Project Finance
Corporate Finance & SpendingCommercial Project Finance
Government Tax Incentives
ANNUALINVESTMENT
NEEDED
$14B

Plenty of Alpha to Go Around for Private Investors, Including Venture CapitalWith ever-increasing funding round sizes, the first – of possibly many – food waste unicorns (Apeel Sciences), and growing recognition of the significant profit boosting potential for food companies in a tight margin business, private investors, especially venture capitalists, have an important role to play in scaling and firmly establishing food waste as an investment category. Particularly, this form of capital can continue to fund cutting-edge innovation (especially as technology and reducing food waste often go hand-in-hand, including hardware- and software-driven solutions) and disruptive business models with a large potential total addressable market. We have seen new market-based innovations continuing to emerge with no signs of slowing down, as well as several early stage food waste solution providers beginning to become household names, challenging existing later stage and legacy brands and services.
Building Infrastructure with Commercial and Government Project Finance
Project Finance is necessary to cover the sheer size of financial commitment for the build-out of facilities, equipment, and transportation, which are required to collect edible food for donations and sustainably dispose of food that was originally going to landfill. In a low interest rate environment, Project Finance can now be sourced at a historically low cost. Enabling equipment and technologies, such as grinders for centralized composting and depackagers for centralized anaerobic digestion, are not necessarily products that get the most attention but are vital for these processes. Local and regional capital in the form of philanthropy can also be useful in funding gaps in financing or higher-risk opportunities.
Review All Funding Recommendations

The Roadmap to 2030 includes a series of legislative and regulatory recommendations developed in collaboration with the Harvard Food Law & Policy Clinic and arranged by the themes below. The enactment of these and other related policies can be the critical linchpin in driving solutions adoption to help achieve the nation’s 2030 food waste reduction goal.
The Role of Policy
Better Organic Waste ManagementOrganic waste bans are one of the most powerful ways to not only require recycling, but act to incentivize preventative measures and food donations while also enabling measurement. Federal, state, and local governments can disincentivize, limit or ban food from landfills, and eliminate restrictions on food scraps in animal feed.
Funding for InfrastructureGovernment-funded capital investments are critical for donation storage and capacity-building projects, temperature-controlled food distribution, and streamlined development of food waste reduction and waste management infrastructure.
Funding for InnovationGovernment-funded research can support market expansion and product utilization. Recommended projects to fund include farm-level yield and loss research, crop preservation and post-harvest loss prevention technologies, spoilage-inhibition technologies, and upcycled food R&D.
Improvements to Tax LawsLaws can be adjusted to incorporate alternative tax credits for food donations by farmers, expand food donation tax deductions to include non-profit sales and transportation services, allow application of beginning inventory donations to current year losses, and eliminate tax deduction for edible food discards that incentivize waste.
Expanded Food Donation Policies Federal and state governments can work to expand food donation programs, clarify guidance on food safety for donations, strengthen liability protections, and incorporate donation requirements into operational guidelines for government agencies and their contractors.
Consumer EducationFederal, state, and local governments can drive full-scale consumer education campaigns, changes to school lunch programs, and industry changes to address the confusion and lack of awareness that results in waste.
Key Policy Areas
Review All Policy Recommendations

Food waste is often considered to be a singular problem, but it’s an entirely different situation when hundreds of tons of broccoli go unharvested on a farm compared to a half-full platter of uneaten potatoes scraped into the trash at home. And that can make the challenge of reducing food waste by 50% by 2030 seem daunting – if not impossible.
We believe it can be done – and we’re not alone. In fact, our Insights Engine analysis shows that the amount of food waste in the United States has leveled off since 2016 after increasing 11.9% in the earlier part of the decade – and per capita food waste has actually declined 2% over the last three years. Across the country and around the world, businesses, governments, funders, and more are recognizing the importance of implementing food waste reduction solutions. They realize that food waste reduction can protect our climate and natural resources, and help support those facing food insecurity – while also growing our economy and creating jobs. The Roadmap to 2030 and the Insights Engine can help the food system move from awareness about the problem to bold action. Many of the solutions we analyzed are ready to be implemented today, and there’s a compelling business advantage for companies to act quickly.
Our hope is that these resources serve as a data-driven playbook that can guide food waste reduction efforts over the next ten years. We invite you to join us in making the most of this opportunity – and in creating a sustainable, resilient, and inclusive food system for us all.
An Opportunity for Action
Explore the Entire Roadmap

Full ReFED Solutions Analysis
SOLUTIONS
PORTION SIZES
MEAL KITS
CONSUMER EDUCATION CAMPAIGNS
ENHANCED DEMAND PLANNING
IMPERFECT & SURPLUS PRODUCE CHANNELS
DONATION EDUCATION
WASTE TRACKING (FOODSERVICE)
MARKDOWN ALERT APPLICATIONS
BUYER SPECIFICATION EXPANSION
MANUFACTURING BYPRODUCT UTILIZATION
INTELLIGENT ROUTING
DECREASED TRANSIT TIME
DONATION TRANSPORTATION
STANDARDIZED DATE LABELS
PACKAGE DESIGN
ACTIVE & INTELLIGENT PACKAGING
FIRST EXPIRED FIRST OUT
TEMPERATURE MONITORING (PALLET TRANSPORT)
DYNAMIC PRICING
DONATION STORAGE HANDLING & CAPACITY
MINIMIZED ON HAND INVENTORY
DONATION COORDINATION & MATCHING
DECREASED MINIMUM ORDER QUANTITY
DONATION VALUE-ADDED PROCESSING
INCREASED DELIVERY FREQUENCY
TRAYLESS
SMALL PLATES
ASSISTED DISTRESSED SALES
MANUFACTURING LINE OPTIMIZATION
BUFFET SIGNAGE
CENTRALIZED ANAEROBIC DIGESTION
GLEANING
PARTIAL ORDER ACCEPTANCE
CO-DIGESTION AT WASTEWATER TREATMENT
REDUCED WAREHOUSE HANDLING
CENTRALIZED COMPOSTING
K-12 EDUCATION CAMPAIGNS
TEMPERATURE MONITORING (FOODSERVICE)
K-12 LUNCH IMPROVEMENTS
HOME COMPOSTING
COMMUNITY COMPOSTING
LIVESTOCK FEED
NET FINANCIAL BENEFIT GHG EMISSIONSTONS WASTE DIVERTED
Launch Insights Engine
2.4M
1.7M
1.4M
1.2M
2.9M
1.1M
1.0M
771.1K
667.6K
1.9M
1.1M
1.0M
642.7K
582.4K
649.5K
451.8K
617.5K
550.6K
461.8K
265.4K
195.2K
143.7K
189.2K
190.8K
138.6K
104.2K
95.6K
590.5K
967.1K
52.3K
3.8M
78.5K
38.6K
3.0M
22.3K
13.8M
14.8K
4.2K
7.1K
93.6K
57.0K
60.4K
$9.0B
$6.5B
$6.1B
$5.2B
$5.1B
$4.5B
$3.8B
$3.8B
$2.7B
$2.7B
$2.7B
$2.5B
$2.5B
$2.4B
$2.4B
$1.7B
$1.6B
$1.5B
$1.1B
$826.6M
$620.9M
$594.9M
$568.7M
$429.6M
$374.0M
$366.1M
$355.9M
$339.4M
$328.2M
$194.6M
$171.4M
$152.2M
$78.8M
$71.0M
$63.4M
$49.4M
$25.5M
$15.5M
$13.2M
$4.9M
-$1.5M
-$1.5M
11.5M
7.5M
7.4M
2.8M
272.8K
893.8K
4.8M
2.9M
148.8K
4.9M
2.3M
2.2M
1.0M
2.7M
3.6M
2.4M
1.3M
1.2M
1.0M
306.2K
442.2K
552.0K
436.1K
-62.3K
330.3K
493.7K
452.9K
1.5M
2.5M
247.5K
912.4K
-25.7K
70.0K840.8K
44.0K
4.9M
70.2K
21.5K
33.6K
41.0K
25.0K
-0.8K
MTCO2e6M07M05B 12M14M10B0
DOLLARS TONS