stunt and - eric
TRANSCRIPT
DOCUMENT RESUME
ED 353 875 HE 026 129
TITLE Managing for the Future: Challenges & Opportunitiesfor Higher Education in Ohio. Report of Ohio'sManaging for the Future Task Force.
INSTITUTION Ohio Board of Regents, Columbus.PUB DATE Jul 92NOTE 389p.; Portions of appendixes are of marginal
legibility. For a related document, see HE 026128.
PUB TYPE Reports Evaluative/Feasibility (142)
EDRS PRICE MFOI/PC16 Plus Postage.DESCRIPTORS Access to Education; College Faculty; College
Students; Educational Policy; Educational Quality;Efficiency; Financial Exigency; Government SchoolRelationship; *Higher Education; *Long RangePlanning; Program Evaluation; Retrenchment; StateAid; State Boards of Education; *State Colleges;State Government; State Programs; State Standards;*State Universities; Statewide Planning
IDENTIFIERS *Ohio; Ohio State Board of Education; *State Collegeand University Systems; State College Relationship
ABSTRACT
In this document, a state appointed task forcecommissioned to examine how Ohio state colleges and universities cansustain quality programs with the highest degree of efficiency duringtimes of fiscal constraint reports on its findings and conclusions.and offers its recommendations. Following an executive summary thereport is presented in four parts the first of which offers ananalysis of the challenges facing the state's higher education systemin the coming decades. The second section provides an overview ofhigher education in Ohio profiling the system's size and scope, thestudents, the faculty, governance structures, and goals. Also treatedhere are the historical values expressed in Ohio's policy of access,quality and efficiency. The third section presents facts about theOhio system particularly concerning revenue and expenditure patternsand "cost drivers." The final section advances the recommendationsand conclusions, which involve linking state colleges anduniversities more effectively, suggests six statewide priorities, andencourages the strengthening of leadership responsibilities. A briefdissenting report on the conclusions is included. Extensiveappendixes contain the following information: location of stateinstitutions; enrollment. data and degrees awarded; stunt andfaculty data; efforts to improve access, quality, and efficiency;revenue and expenditure sources; faculty workload and productivity;medical school plans; and executive summaries of reports to the taskforce from individual colleges and universities. (Contains 52references.) (JB)
***********************************************************************Reproductions supplied by EDP.S are the best that can be made
from the original document.***********************************************************************
U.% DEPARTMENT OF EDUCATIONOffice c E icationat Research and Improvement
EDUCATIUNAL RESOURCES INFORMATIONCENTER (ERIC)
his dycument has been reproduced asreceived from the person or organizationoriginating it
0 Minor charges nave been made to improvereproduction quality
1 ''PERMISSION TO REPRODUCE THISMATERIAL HAS BEEN GRANTED BY
ON Board of RPEPnts-
Points of view or Opinions stated in this dock).mnt do not necessarily represent official TO THE EDUCATIONAL RESOURCESOERI position or policy
INFORMATION CENTER (ERIC)."
MANAGING FOR
Dr. ICertneth M. ClementDentistLinea, Ohio
Dr. Sharon Coady, DeanAcademic and Student.Affairs&ram State Community CollegePiqua, Ohio
Mr. Thomas G. CodyExecutive Vice PresidentLegal and Human RaosaraFedentted Dept:absent Stores. Inc.Cu:armedl, Obi.
Mr. Tun CosgroveDirector ofPolky & Legislative InitiativesGovernor's OfficeColunths% Ohio
Mr. Bruce DouglasThe Douglas CompanyToledo, Ohio
Mr. N. Victor Goodman, Task Force ChairAttorneyBersesch, Friedlander; Coplatt and AronoffColumbus. Ohio
Dr. Elaine H. HairstonchowderOhio Board ofRegentsColureelne; Ohio
Dr. Charles E. HathawayProvostWright State UniversityDayton, Ohio
Mrs. Martha HughesPrrsidentNortham Ohio League of Savings InstitutionsCleve/wt.; Ohio
Mr. William G. Lyvien, Jr.Chairman (the BoardThe Lydon CompanyYoungstown, Ohio
THE FUTURE TASK FORCE
Mr. Kent B. McGoughPresidentMcGough &Associata, Inc.Columbus; Ohio
Mr. Stephen PerryDirectorDepartment ofAdminiarative ServicesGtluntbses, Ohio
Dr. David H. ArnimPresidentSinclair Cottrnmity CollegeDayton, Ohio
Mt. Verna K RsffeChairmanBoard of TrusteesShawnee State UniversityColumba; Ohio
Dr. Richard RuppertPresidentMedical College of OhioToledo, Ohio
Mr. William J. ShkuniVice President,* FinanceThe Ohio State UniversityColumbus; Ohio
Dr. Joseph StegerPresidentUniversity of CincinnatiCincinnati, Ohio
Dr. Charles E TaylorPartnerLana& Associate% Inc.Clevelantt Ohio
Mn. Anita S. WardVice ChairmanOhio Board ofRegentsColumbus, Ohio
Board (Regents Stiff
Dr. Ann IL MooreVice arancellor fir Planning &
Orgenizational Development
0
42t7ifegig#44444.nneth M. Clemens
lAtAtie efro'Sharon Coady
Tim Cosg ove
Bruce Douglas
Elaine H. Hairston
Charles Hathaway
Marsha es
William G. Lyden, Jr.
cc/at ./.0chard Ruppert
tv<Z444n 1141.William J. Shkurti
Jose s:\tePtIrl- St ertC arles E. Taylor
Anita S. Ward
BENESCH,
650 EUCLID AVENUE. SUITE 1100
CLEvELAN O. 01110 salts.3399TELEPHONE (216) 363-4500TELECOPtER (216) 363-4560
2600 CINCINNATI COMMERCE CENTER
600 VINE STREETCINCINNATI. 01.90 45202.2A09
TELEPHONE (513) 762.6200TELECOPIER (513) 762.6245
Mr. Raymond T. SawyerChairmanOhio Board of Regents3600 State Office Tower30 East Broad StreetColumbus, Ohio 43215
Dear Ray:
FRIEDLANDER, COPLAN & ARONOFFATTORNEYS AT LAW
88 EAST BROAD STREET
COLUMBUS, OHIO 43215-3506(614) 223-9300
July 21, 1992
CABLE "ISFCA"
TELEX 297607TELECOP1ER (6I4) 223-9330
WRITER'S DIRECT DIAL NUMBER
(614) 223-9343
As chairman of the Managing for the Future Task Force, I am pleased to submitthe results of our year-long deliberations. At the request of the Board, our 19-memberTask Force examined how to provide the highest quality higher education services withina constrained state resource environment. Leaders of higher education, localcommunities, government, business and industry gave of their valuable time to assist inthis important and challenging task.
The work of the Managing for the Future Task Force was divided into two parts:statewide and institutional. A Statewide Issues Committee of the Task Force exploredquality and cost issues that have statewide impact and focussed on statewide strategiesfor preserving high quality services with fewer state resources. In addition, each collegeand university empaneled an Institutional Committee on Managing for the Future toguide an internal review of the same issues from an institutional perspective. Colleges.and universities were requested to engage leaders outside the campus in these activitiesand to report their findings to the state-level Task Force. 'The. Executive Summary ofeach campus report is included in Appendix J of the report; the full reports aretransmitted herewith.
Less than half way through the deliberations of the Managing for the Future TaskForce, an additional 4% budget cut was imposed on higher education, following anearlier 3% loss from 1991. The severity and the timing of this second budget cutforced institutions to make rapid decisions about cost curtailment and preempted muchof the scheduled work of the state-level and institutional task forces as immediateresponses were made to address the 1992-1993 fiscal crisis.
BEIIESCH. FRIEDLANDER. COPLAN 6r. ARONOFF
Because the constrained resource environment had already become an instantreality to the higher education community, the work of the task forces turned to longer-term issues of. quality, access, stability and viability of higher education in Ohio, withinsuch an environment. That is the main thrust of this report.
Now that the 1993 higher education budget has been decreased by another 1C.5%,there is an even greater urgency for Ohio's colleges and universities to make the kind oflong-term changes recommended by the institutional management task forces and thosewe have proposed in this report. Cost-reduction and cost-containment approaches mustcontinue on our campuses. However, at the same time, we believe the Ohio Board ofRegents, Ohio's political leaders, the higher education community, and college anduniversity advocates must work together to find the resources needed to make a collegeeducation more affordable to the increasing numbers of students.
We believe the recommendations in our report will require careful considerationand implementation. We urge, however, that the Board move toward implementation assoon as possible. Task Force members stand willing to assist you in any way you deemappropriate.
. Victor GoodmanChairman
NVG:bt

STRUCTURE OF THIS REPORT
Because it is important for the reader to understand the influences that led the Task Force to its conclusions,this report seeks first to provide an overview of higher education in Ohio (Section II). Next, the facts aboutOhio's higher education revenue and expenditure patterns are presented (Section III). Finally, Section IVcontains a more detailed description of the Task Force's proposed solutions and recommendations.
The views ofthe Task Force members do not necessarily represent the positions or policies oftheir respectivecolleges or universities.
i
Table of ContentsACKNOWLEDGEMENTS
EXECUTIVE SUMMARY
I. THE CHALLENGE:RESHAPING THE FUTURE OF OHIO'S HIGHER EDUCATION SYSTEM
The Problem: Increasing Demand vs. Decreasing Resources 1
The Patterns Are Clear 3The Structure Must be Redesigned 7
IL THE OVERVIEW:OHIO HIGHER EDUCATION PROFILE, VALUES AND UNIQUE FEATURES
Profile 11Size and Scope 11Student Profile 12Faculty Profile 12Governance Structure 13Goals 13
Historical Values: Access, Quality and Efficiency 14Access 14Quality 15Efficiency 16
Unique Features 17
III. THE FACTS:HIGHER EDUCATION REVENUE AND EXPENDITURE PATTERNS ------------------------------------- 19
Ohio's Economic, Social and Political Environment 19Revenue and Expenditure Patterns in Higher Education 29
1. Revenues became diversified. 292. Costs rose above inflation. 333. Faculty compensation was readjusted. 364. Tuition charges were increased. 375. Cost containment strategies were developed. 38
Cost Drivers 38
IV. THE RECOMMENDATIONS AND CONCLUSIONS:MANAGING FOR THE FUTURE --------------- 47
Needed: A Higher Education System 47Task Force Recommendations 48I. Link state colleges & universities more effectively to form a higher education system. 48II. Structure the higher education system to address six statewide priorities. 50
PRIORITY 1: Meet the Diverse Needs of Students and Optimize Their Achievement 50PRIORITY 2: Assure Excellence in Academic Programming. 52PRIORITY 3: Increase Productivity and Reduce Costs. 54PRIORITY 4: Ensure Accountability. 57PRIORITY 5: Strengthen Leadership and Management Effectiveness. 58PRIORITY 6: Secure Resources to Make Higher Education Affordable 59
III. Strengthen the Higher Education System Leadership Responsibilities of the Ohio Board of Regentswhile Retaining College and University Responsibility for Campus Policies and Operations 61
Conclusions 62
REFERENCES 65
EXECUTIVE SUMMARYReport of
Ohio's Managing fir the Fuiun Task Force
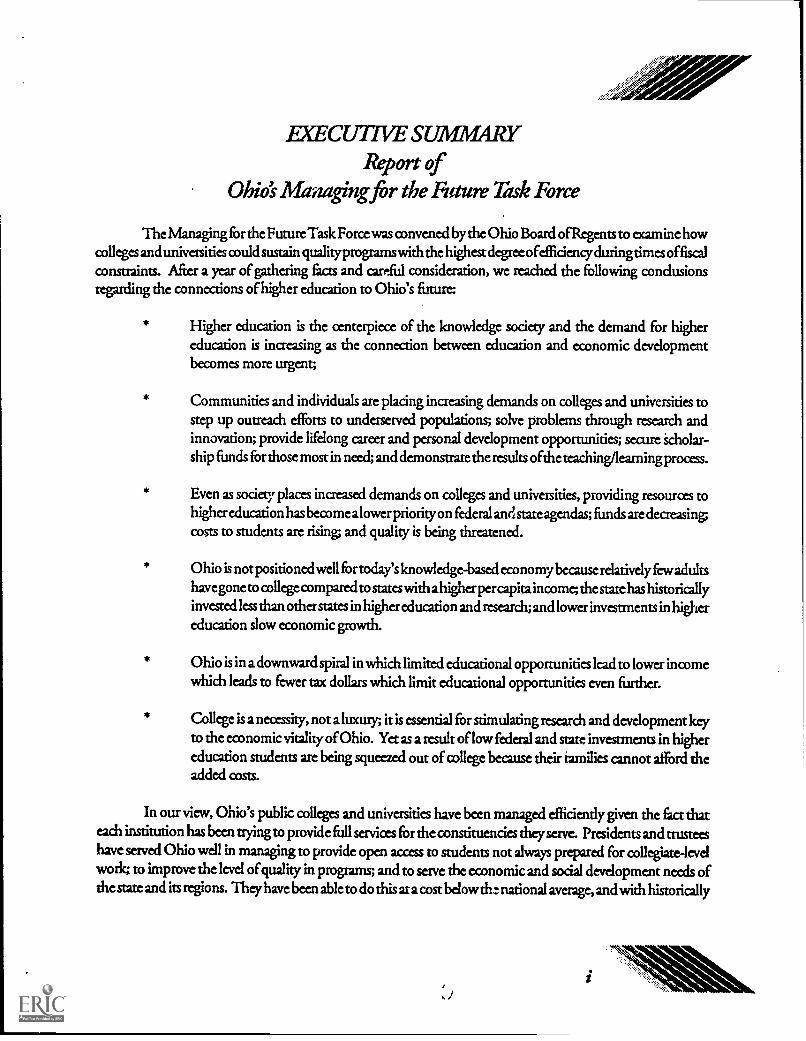
The Managing for the Future Task Force was convened by the Ohio Board of Regents to examine howcolleges and univetsities could sustain qualityprograms with the highest degree ofefficiencyduringtimes offiscalconstraints. After a year of gathering facts and careful consideration, we reached the following condusionsregarding the connections of higher education to Ohio's future
Higher education is the centerpiece of the knowledge society and the demand for highereducation is increasing as the connection between education and economic developmentbecomes more urgent;
Communities and individuals are placing increasing demands on colleges and universities tostep up outreach efforts to underserved populations; solve problems through research andinnovation; provide lifelong career and personal development opportunities; secure ic.holar-ship funds for those most in need; and demonstrate the results ofthe teaching/leasning process.
Even as society places increased demands on colleges and universities, providing resources tohigher education has become alower priorityon federal and state agendas; funds are decreasing;costs to students are rising; and quality is being threatened.
Ohio is not positioned well for today's knowledge-based economy because relatively few adukshave gone to college compared to states with ahigherper capita income; the state has historicallyinvested less than other states in higher education and research; and lower investments in highereducation slow economic growth.
Ohio is in a downward spiral in which limited educational opportunities lead to lower incomewhich leads to fewer tax dollars which limit educational opportunities even further.
College is a necessity, not a luxury; it is essential for stimulating research and development key
to the economic vitality of Ohio. Yet as a result of low federal and state investments in highereducation students are being squeezed out of college because their families cannot afford theadded costs.
In our view, Ohio's public colleges and universities have been managed efficiently given the fact thateach institution has been trying to provide full services for the constituencies they serve. Presidents and trusteeshave served Ohio well in managing to provide open access to students not always prepared for collegiate-levelwork; to improve the level of quality in programs; and to serve the economic and social development needs ofthe state and its regions. They have been able to do this at a cost below th: national average, and with historically
wN'''..44\.. ,-.
low levels of funding from the state. Student fees have taken up part of the slack, but cost-containment efforts
on every campus have held student fees lower than they would have been if spending levels in Ohio were at or
above the national average.
The universities, for the most part, have been trying to offer programs rangingfrom developmental and remedial education through doctoral degrees andresearch. Community and technical colleges have provided open access to theirregions at the associate degree level and serve the immense job training needs ofthose individuals already in the workforce. Our challenge, as a task force, was tofind away for the colleges and universities to continue to achieve the access, quality,and efficiency standards apected by Ohioans within what we believe will be a
protracted period of limited resources.
We believe the greatest benefit to Ohioans will come in larger, overarchingstructural changes within each college and university as identified by their taskforces, and across the state as incorporated in our recommendations. Each campushas demonstrated to us specific ways it has been reducing costs over the last decade;
each is on a path to streamline operations without loss of quality.
Our report has identified where we believe the strengths lie in highereducation. The strengths of the campuses must not be diluted in our attempts toreshape higher education. At the same time, we believe those strengths provide asolid foundation for a more systematic approach to planning and coordination,
with the Ohio Board of Regents assuming a stronger leadership role. College and university presidents andtrustees need to work more closely together in a higher education system that responds more fully to the needs
of all Ohioans while also having enough autonomy to carry out the effective operation of each institution.
Summary of Recommendations
We conduded from our own examination ofavailable evidence and information provided in the collegeand university management reports that the longer-term strategy for building a robust higher education .gstemin Ohio requires revisiting its structure and the delivery of its services. While there may be short-term costsassociated with the recommendations that follow, the long-term benefits will accrue from higher quality,productivity, efficiency and effectiveness in meeting the educational needs of Ohioans.
Ourstate-level Managing fortheFutureTaskForceand the institutional management committees haveconduded that it is necessary for Ohio to:
4/ir
1. Link state colleges and universities more effectively to form a higher education system
2. Redesign the higher education structure to address six statewide priorities; and
4)
3. Strengthen the higher education system leadership responsibilities of the Ohio Board ofRegents while retaining college and university responsibility for campus policies and opera-
tions.
Our recommendations and assigned responsibility to enact them are included in Section IV of theReport. What follows is a summary of key points.
For Ohio to achieve greatest access for its citizens to academically strong and ecoaomically efficienthigher education services, we recommend the following actions:
I. Link state colleges and universities more effectively to form a higher education system.
Develop a new strategic plan that sets the mission, goals, objectives and expected results for thehigher education system
Review and refocus college and university missions to fit the mission, goals and objectives of thestate higher education system.
Require regional collaboration where appropriate in graduate and professional education.
Support the plan ofthe State's seven medical colleges, to build both a regionalized system ofhealthcare and statewide collaboration in areas such as educational technology and biomedical research.
Communicate state higher education funding goals, prioritl.s and policies to college and universitytrustees and presidents, and work doselywith them to achieve the goals and carry out the policies.
IL Structure the higher education system to address six statewide priorities.
1. Meet the Diverse Needs of Strident and Optimize Their Achievement
Work doselywith the State Board of Education and with schools to ensure that, by the year 2000,all Ohio high school graduates can demonstrate completion of a college or technical preparatorycurriculum for admission without condition to community and technical colleges.
Increase the participation and achievement of economically disadvantaged and minority studentsat each college and university, and at all levels of education.
Structure the State's two-year college system to: create regional community college districts;consolidate 'co-located' technical colleges and university branches into community colleges; andoffer site and time specific upper-division and graduate programs through university affiliations.The community colleges, working in the framework of a strengthened articulation and transfermechanism, would become the principal open access points for higher education in the State andwould have primary responsibility for developmental and remedial education.

Assure Excellence in Academic Programming.
Refocus campus missions to ensure that offerings are consistent with the overall mission of Ohio's
system of higher education.
Strengthen campus- and state-level reviews of quality and effectiveness of academic programs.
Eliminate or consolidate programs where there is unnecessary duplication or where the yield is too
small for continued high quality.
Require colleges and universities to measure and report on institutional effectiveness.
Restore funding for incentive-based programs targeted at quality improvement, much like theSelective Excellence initiatives did.
Improve teaching and learning in the schools, especially those school districts with consistently high
numbers of students needing remediation.
Reaffirm the importance of undergraduate education and develop strategies to encourageinstructional innovation and efficiency at the undergraduate level, including the use oftechnologyand more effective deployment of teaching personnel.
Reaffirm the value of research both as an integral part of higher education and as a critical factorin the economic well-being ofthe State. Focus research funding to centers ofexcellence both at theState's comprehensive research universities, Ohio State and Cincinnati, and to selected programs
at other universities.
Designate Ohio's two-year college workforce training network, EnterpriseOhio, and its memberinstitutions as the preferred mechanism for the delivery of customized training throughout Ohio.
3. Increase Productivity and Reduce Costs.
Hold administrative costs down by negotiating cost-to-inflation benchmarks for each campus. Inaddition, campuses should adopt a continuous quality improvement approach to administration;implement energy conservation plans; develop collaborative programs in areas such as health care
insurance and purchasing and privatize campus operations where appropriate.
Ensure that faculty time is allocated in the most productive manner by developing an institutionalfaculty worldoad and performance evaluation policy. The policy should ensure that both assignedteaching and the evaluation and reward system ate consistent with institutional mission. Contractsfor both faculty and administrators should be performance-based.
Take specific steps to eliminate duplicative reporting requirements at both the State and federalkw's.
Streamline and reform State policies for personnd systems, for the use of architectural andmanagement services in facilities construction, and in the use of auditing and legal services.
4. Ensure Accountability.
Require that appropriate accountability mechanisms are in place at the campus and State levels.Each college and university should inform the Board of Regents how the following will bemeasured: the qualitt of dassroom teaching quality of services in student support areas; studentachievement faculty workload, and evaluation of faculty performance.
Identify separately all student charges for intercollegiate athletics and identify explicitly all revenues
and expenditures for intercollegiate athletics in the institution's annual budget report.
5. Strengthen Leadership and Afanagement Effictiveness.
Convene leadership conferences to broaden the participation of colleges and universities insystemwide planning and coordination; work with colleges and universities to develop suitablemeasures of institutional effectiveness in support of campus and system goals and objectivecommunicate results of these assessments to all campuses and to the public; identify with claritythe responsibilities and expectations of college and university trustees. Boards ofTrustees shouldannually evaluate their own effectiveness.
Secure Resources to Make Higher Education Affordable.
Assure that State monies are directed to higher education system priorities in both the operatingand capital budgets for the years ahead.
Develop, with the Office of Budget and Management, formal rules concerning the type of'community project? that are eligible to be funded by higf,t.° education bonds.
Provide incentives, or at least remove disincentives, in state funding policies to encourageconsolidation, merger, elimination, transfer or other reduction of unnecessarily duplicative orotherwise low priority academic programs.
Work to ensure that state funding provides incentives for quality enhancement

III Strengthen the higher education system leadership role of the Ohio Board of Regents whileretaining college and university responsibility for campus policies and operations.
An affordable system design will require that the Ohio Board of Regents become responsible fon setting
statewide goals and objectives for higher education; guiding the development of institutional missions to
ensure the most effective deployment ofresources; eliminating unnecessary program duplication; establish-
ing statewide funding priorities; providing a framework forthe debate ofhigher education policy issues; and
assuring that students are rexiving the highest quality services possible. We therefore recommend that the
Ohio General Assembly authorize the Board of Regents to carry out the responsibilities which are not
currently part of the Board's charter, and to coordinate the delivery of all adultpostsecondary programs.
Responsibility for providing leadership in restructuring the system of higher education lies first with the
Ohio Board ofRegents and the college and university leaders, but this alone is not enough. The state's elected
officials need to address where higher education fits among other budget priorities. If Ohio's goal is to
produce more educated citizens, then the state of Ohio needs to support additional funding for growingnumbers of students on at least an equal footing with additional funding for prisons and for Medicaid.Otherwise restructuring the system ofhigher education will expend a great deal ofenergy without reversing
the decline in Ohio's ability to compete in a global economy.
We have examined the evidence and offer our recommendations to the Ohio Board of Regents for theirconsideration. Our recommendations are not short-term in nature. They will require careful consideration
by Ohio's government leaders, the higher education community, and industry, labor and communityleaders across Ohio. We urge that this process move deliberately and that implementation of therecommendations begin yet this year.
L THE CHALLENGE:
RESHAPING THE FUTURE OF OHIO'S HIGHER
EDUCATION SYSTEM1
as ab
As the society becomes more complete the amount ofeducation and knowledge needed
to ma.keaproductive contribution to the economy becomesgraten A century ago, a high
school education was thought to be superfluous fir facto?), workers anda college degree
was the mark ofan academic or a lawyer. Between now andthe year 2000, fir the first
time in histoos a majority of all new jobs will require postsecondary education."
William B. JohnstonWorkforce 2000,1982
The Problem: Increasing Demand vs. Decreasing Resources
Higher education is the centerpiece of the knowledge society, yet without adequate resources itsstrengths will erode. The economic and sodal imperatives for higher education are dean
Economic growth and stability in a state is affected by the correlation between:
Education and incomeThe higher the education level ofa state's population, the higher the per capitaincome level and ability to contribute to state resources.
Education and tedinology adaptation The higher the education level of a stare's population, thehigher the level of productivity in its industries.
Education and innovation The higher the education level ofa state's population, the more likely itis that new products and new businesses will be developed.
Education and economic development The higher the education level ofa state's potentialworkers,the more likely businesses will locate in the StatC.
The Task Force only reviewed and this report only addresses Ohio's public colleges and univosities.
Education and the quality of one's life The higher the education level of a state's population, the
greater are the opportunities to participate and provide leadership to the cultural, social, and spiritual
development of communities throughout the state.
+ Educated workers are needed to support the agingpopulation. As the baby-boomers near retirement,
the strain on public services such as Medicaid and Medicare will escalate. Only three working adults
will support one elderly person, compared to the 17:1 ratio that existed 15 years ago.
Increased demands are being made on colleges and universities today.
. Increasing racial and ethnic diversity requires colleges and universities to step up their outreach to
populations historically underserved.
+ Communities depend on higher education research and innovation to solve problems.
+ Global competition requires graduates who have been taught to think, write and solve problems.
+ Individuals changing careers must have opportunities for lifelong learning.
+ Preservation ofdemocratic principles requires a high literacy rate and arich, culmrally sensitive learning
experience for all.
+ Declines in disposable family income require more scholarship funds for students.
+ Demands for accountability challenge educators to demonstrate the results of the teaching/learning
process.
Yet as society places more demands on colleges and universities, providing resources tohigher education
has become a lower priority on many state agendas. Funds to support public colleges and universities are
decreasing and threatening quality.
+ The instability and uncertainty of state higher education revenues make sound planning, effective
management, and long-term investments in quality difficult.
+ Administrative and support services are the first to be pared away as budgets shrink. Increasing federaland state reporting and compliance requirements sap the remaining resources and detract from thefunds needed for effective campus leadership.
+ Severe budget reductions cut into the heart of th- enterprise teaching and learning. Programs are
dismantled, library resources diminished, course selections trimmed, facilities and laboratory equip-ment outmoded, and faculty and staff terminated.
Word travels fast. Good faculty and staff move on to "greener pasture? and new ones are difficult torecruit to campuses with inadequate resources.
The national and international reputations of individual programs and entire institutions becometarnished if they cannot sustain the quality upon which their reputation is based.
These phenomena will place Ohio higher education in great peril ifwe do not seize the opportunity to reshapeits destly.
The Patterns Are Clear
Ohio has not invested as heavily in higher education as other states. In the past higher education seemedunnecessary to many. Generations of Ohioans raised families on incomes earned from farming, mining andmanufacturing. This is no longer possible. Without an appropriate investment in higher education, the state'sfuture will be dim. The patterns are dear.
.4- Relatively few adults have gone to college compared to other states. Now that the economy has shifted,the state needs more college educated workers, and growing enrollments reflect this trend.
Ohio is in long term economic dedine, and is not positioned well to compete in today's knowledge-based economy. This places continuing pressure on the state budget, making it difficult to generate areal increase in support for higher education.
The cost of higher education has been rising and stare support has not been sufficient to fully fundenrollment growth. The slack has been picked up only partially through student fees.
Resistance to higher tuition is growing.
The state's finances are being eaten up by federally mandated entitlement programs (e.g., Medicaid and
other human services programs) and state legislated protections (e.g., prisons) rather than being investedin preventive programs such as higher education.
Higher education has become alower priority in state funding at a timewhen it is perceived by corporateleaders as a necessity for rebuilding the economy of this star. and nation.
The economic and political realities require that we search for ways to provide more effective service withthe resources currently available. Thus, we attempted to find ways to sustain and improve quality in anenvironment of limited resources. Our recommendations were based on the following conclusions:
Higher education is no longer a luxury it is now a necessity for preparing people for good jobs andraising income levels. It is essential for stimulating research and development key to the economicvitality of Ohio. Its societal value is more important today than ever before.
In general, Ohio's colleges and universities have been very efficiently managed given all they have tried
to accomplish within the resources acquired from the state and student fees.
The resource problem for higher education is not just a short-term issue that colleges and universities
can "ride out." We found compellirg evidence that having adequate resources for higher education is
a long-term problem.
Even as colleges and universities try to keep their fees as low as possible, the cost borne by students is
likely to remain high.
As a result of decreasing federal and state resources for higher education, middle income students arebeing squeezed out of college because their families cannot afford the added cost. Federal and statefinancial aid programs combined are not enough to pay the tuition fees for those in greatest need.
Ohio cannot support all current higher education programs and services with reduced resources.
The goals of access, quality and efficiency are perceived by rnany to be competing with one another.
Quality is the centerpiece of cost-containment strategies. In the search for improved cost-effectiveness
quality must not be diluted.
The most pertinent issue for us from a state-level perspective was the elective use of resources.
Costs per student in Ohio are lower, and in some specific cases considerably lower, than costs in comparablecolleges and universities in other states. This reflects solid management at the institutional level and the wisdomof state policies that have provided incentives for good management. The campuses shared many oftheir cost-containment strategies with us, which are summarized on page 5, and presented more fully in Appendix F andin the campus report summaries included in Appendix J. It was apparent from the campus reports that it willbe difficult to reduce spending further and maintain quality; the obvious cuts were made long ago.
We concluded from our own examination of available evidence and information provided in the collegeand university management reports that the longer-term strategy for building a robust higher education systemin Ohio requires revisiting its structure and the delivery of its services. As one of our members put it, "the realproblem we are dealing with here is that in terms of values and structure, we have a 1960's design that hasn'tcaught up to the economic realities of the 1990's. The real challenge for us is to improve the design?'
The overall mission of the higher education system must be charted in away that links the colleges anduniversities together to effectively achieve these goals which we believe are essential to Ohio's higher education
future
Student Focus: State assisted colleges and universities should be expected to focus primarily on theeducational needs ofstudents, local communities and the citizens ofOhio within the contact ofaglobal
society.
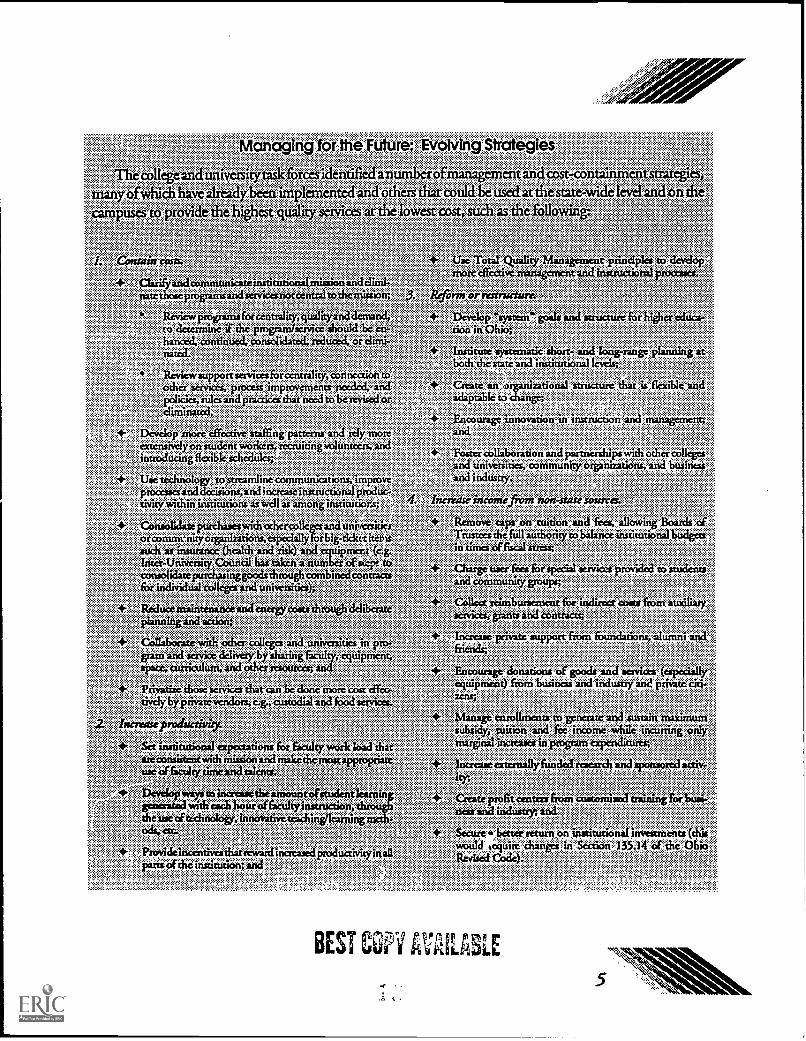
Managing for the Filturez. Evolving Strategies
The collegeand universitytask &rats identified an rofmanagement andcost-containment suategi es,
many ofwhich have Oxen implemented and others that could be used atthe state-widelevel and on the'campuses to provide the highest quality services at the lowest cost, such as the followfigt.
C.4mmin man ,
Clarifyandcostunnnicateinstitutionalmissionandelimi-natethoseprogramsandsenticcsnotcentraltothemission;
Reviewprogramsforcentrality, qualityanddcmancl,to determine if the program/service ;hong be eo,hutted, continued, consolidated. reduced, or elimi-nated.
Review supportservicesforcentrality, connection toother services, process improvements needed, andpolicies, rules and practices that need to be revised oreliminated.
Develop more effective staffing patterns and rely moreextetuivelyon student woticets, recruiting volunteers, andintroducing ficcible schedules;
+ Use technology to streamline-communications. improveprocesses tmcl decisions, and inctease instructional pnxtuc-tivtr' /within institutions aswell as among institutions;
Consondateptuchaseswithothercolleget and universitiesotoammenityotganizations, lyforbig-tidut items*Lich as insurance 01611th and aisk) and equipmentinter - University Courted has sal a number of toconsolidate inggoods thtough combinedcontractsfor individual colleges and universities);
+ Radnor nointenancecurettnero coots through deliberateplanning and action;
+ Collaborate with other colleges and universities in pro.gram and service delivery by sharing faculty, equipment.space, curriculum, and other resources; and
Privatize those services that ow be done more coo elTec-tively byprivatevendon, e.g., custodial and food =Vita.
fserreseproistctioit
set institutional expectations for faculty work load thatiseconsistentwith striation and nokethernostappropilatealto/ faculty timeatici talent&
Dc clop ways to increuethe amountofstudent learnin
etgratitethnoloty.innovativeteaching/learningwith each hour offacultyinstruction, throttgin
mmecthheads, etc.
Provideincentivesthatretvantincreaselprodualvityinallpans of the institution; and
+ Use Total Quality Management prindplet tomore effective. managantnt and htstructional processes.
Reibron or restructurc
+ Develop "system" goals and sanctum 16r higher ectuca-lion in Ohio;
Institute systematic short- and long-range planning atboth the state and institutional level4
Create an organizational structure that is flexible andadaptable to change
+ Encourage innovation in instruction and management;and
Foster collaboration and partnerships with other collegesand universities, community organizations, and businessand indusuy.
4. Inemite incomefromstson-state smarm
Remove taps on tuition and fees, allowing Boards ofTrustees thefull authority to balance institutional budgetsin times 4fiscal stress;
Charge user fees for special at:vices provided so studentsand community groups;
Collect reimbursement for indirect coat from a "services, rants and contract;
+ Increase private support from foundations, alumni andfriends;
+ Encourage Zonations of goods and services ( yequipment) from business and industry and private7.;Manage enrollments to generate and sustain maximumsuhsidy, tuition and fee income while incurring onlymarginal increases in program exper4tutes;
Inclease externally funded research and sponsontrl acs v.sty;
Create profitzenters from customized training for bug.ness and industry; and
secure. better return on institutional investments (thkwould .equine changes in Section 13534 of the OhioRevise' d Code).
BEST COQ' ATALASLE
5
Student Access and Achievement: Each college and university should commit its resources to assureeadi student will achieve his/her educational goals. The emphasis should be on student retention andcompletion of programs.
Affordability: The cost of higher education borne by students should not be a major deterrent toattending college; adequate financial aid should be available for students most in need, whether theyattend college on a full-time or part-time basis.
Quality: Colleges and universities should be expected to achieve high standards of quality in servicesfor students and communities. A process which will help a college or university achieve quality is onewhich has the following characteristics:
leadership vision that charts a course for the college or university into the future;
dearly defined, appropriate mission that reflects the educational needs of those it is to serve;
long-range and strategic plans for effective operation of the institution, induding goals andmeasurable objectives;
mechanisms for determining institutional effectiveness, including program and student learningassessments;
vrays to continually improve quality and productivity.
Diversity: Colleges and universities should foster a campus dimate thatencourages cultural, racial andethnic diversity in its mix of students, faculty and staff and should include multi-cultural persptctivesin the teaching/learning process.
Collaboration: Colleges and universities shouldworkwithone anc tiler and/orwith other organizations(e.g., schools; industry; labor) to deliver quality services to students and communities, and to containcosts.
Accountability: Each college and university should be able to demonstrate to the Board of Regentsefficiency and effectiveness in the delivery of higher education services to students, communities andthe State. The Board of Regents must demonstrate system-wide results to Ohio's citizens.
Autonomy: The Ohio Board ofRegents should continueto serve as the state planning and coordinatingagency for higher education, setting system-wide policy in a manner that serves the best interests ofthecitizens of Ohio. Colleges and universities should contifine to be separately governed by boards oftrustees that will set policies and make operating decisions consistent with the aims and goals set forthby the Ohio Board of Regents.
The Structure Must be Redesigned
Prior to 1960 there were only six state universities. Ohioans demanded greater access to college for first theBaby Boom and then the Adult Echo. This expansion reflected the commitment of then Governor James A.Rhodes to place a college within a30 minute commuting distance ofevery Ohioan. It reflected the populationpatterns including increasing urbanization and responded dira:dy to the growing need for college educatedadults in Ohio. In response the Board of Regents and the Ohio General Assembly created 57 additionalcampuses over the next two decades. The result was a patchwork quilt of colleges and universities, each withits own uniqueprogtams and strengths. The campuses have never been required to followsystematic state highereducation goals. Without moving the campuses into a rystem-wide response to the needs of the state and itspeople, we believe that students will not be effectively served in Ohio.
Service to studentswas our main guiding principle in discussions leading to the redesign of higher educationin Ohio. We envisioned an effective higher education system designed to:
1. Meet the diverse needs of students and optimize their achievement,
2. Assure excellence in academic programming,
3. Increase productivity and reduce costs,
4. Ensure accountability,
5. Strengthen leadership and management effectiveness, and
6. Secure resources to make higher education affordable.
Meet the Diverse Needs of Students and Optimize Their Achievement
The highereducation structure must be redesigned to ensure enrollment andachievement ofmorestudents.State resources need to be deployed in the most effective way to achieve student success. This will require:
Working with schools to ensure basic academic preparation of students entering college,
Developing a comprehensive system of open access community colleges serving as feeders to theuniversity system,
Placing major but not exclusive responsibility for developmental and remedial education in thecommunity colleges,
Providing selected baccalaureate and graduate degree opportunities to placebound students,
Ensuring that campuses meet the academic, financial, logistical, cultural, and psychological needs of
all students,
Placing the responsibility for student retention and completion with faculty,
Making it possible for students to transfer from one state higher education institution to another
without loss of credits, and
Requiring each institution to make education accessible and customer oriented.
Assure Excelknce in Academic Programming
The higher education structure redesign must focus on academicexcellence. This will require:
Reviewing and refocusing institutional missions to fit into a statewide system,
Evaluating programs for quality, centrality to refocused missions, and avoidance of unnecessary
duplication,
Eliminating programs that are of low quality, not central to the institutional mission or duplicate other
programs,
Measuring and reporting institutional effectiveness to the Board of Regents, and
Developing innovative ways to improve the teaching/learning process.
Inawse Productivity and Reduce Costs
The higher education structure redesign should result in a quality product for an affordable price. This will
require:
Increasing administrative and instructional productivity,
Improving or diminating a variety of state processes that have driven up higher education costs, and
Evaluating institutional effectiveness based on dear institutional missions.
Enswr Accountability
In the redesign, qualityandproduaivityshould be demonstrated with appropriate accountability measures.College and university trustees and presidents are responsit t for accountability to their students andcommunities. Accountability to the citizens ofOhio for the state higher education system is the role ofthe Board
of Regents and chancellor. These need to be defined for the classroom as well as the service areas.
dr.
Strengthen Leadership and Management Ejictiveness
The redesign of the higher education structure should assure that those individuals charged with theresponsibility and accountability for the colleges and universities have the authority and expertise to carry outtheir charges. This will require dearly defined leadership roles and responsibilities, strong board appointments,forthright state and institutional leaders, and governance policies and practices that allow leadership teams toimplement the recommendations induded in this report.
Secure Resources to Make Higher Education Afoniable
The structure redesign must focus on new income sources for college and university operations that areneeded to keep student costs down. Equally important, though, is the need to find ways to help students andtheir families pay for college. This will require redesign of financial aid programs and finding new partnerswilling to commit needed resources.
To accomplish this redesign, we concluded that more effective planning and coordination at the state levelis needed to create a higher education rystem. Campus autonomy should be preserved to the highest degreepossible, especially at the campus operational level. The role of presidents and trustees is vital. But the Boardof Regents must play a strong role in designing a more effective higher education system.
An affordable system design will require that the Board of Regents become responsible for.
Setting statewide goals and objectives for higher education,
Guiding the development of institutional missions to ensure the most effective deployment ofresources,
Eliminating unnecessary duplication,
Establishing statewide funding priorities,
Providing a framework for the debate of higher education policy issues, and
Assuring that students are receiving the highest quality services possible.
The Board of Regents currently does not have the authority in state statute necessary to carry out theseresponsibilities. Thus, we recommend expansion of the Board's responsibilities, and call upon the Board toexercise its new authority in dose consultation with the colleges and universities that make up the highereducation system in Ohio.

IL THE OVERVIEW
OHIO HIGHER EDUCATION PROFILE, VALUES AND UNIQUE FEATURES
'Hail the universiot Have no doubt; our universities and colleges am our number one
rekttive conpetitivestrength. That'srigh4 number one... almostno one disagres aboutAmerica's az,--ecome higher education advantage..."
The knowledge society is here from the practice ofkw to the design ofsemiconductors
We've never been so dependent upon our universities to be flag bearers fir our economy
. . . . Our university .rystem merits ringingapplause and continuedvi gorous support."
Tom Peters
fl Passion for Excellence, 1985.
Profile
Higher education in Ohio has developed in response to the needs of the people where ever and who everthey are, whether in large urban centers or small towns in Ohio's 29 Appalachian counties. State officials andcollege and university leaders have launched numerous costly strategics over the years urban universities,geographical access, technical education to assure that its citizens learn more earn more, and live a better life.These were wise investments for the state and they are producing well-educated citizens. As a result, however,many of today's costs and pressures arc embedded in the system and must be addressed by the Governor,Legislature and higher education leaders working together.
Size and Scope
Since the founding of Ohio University in 1804, a higher education structure has evolved in Ohio thatindudes 63 public campuses, 48 independent non-profit liberal arts colleges and universities, and more than70 specialized independent non-profit colleges (art and music academics, seminaries, nursing schools). Includedin the public sector are 13 universities, 2 free-standing medical schools, 10 community colleges, 13 technicalcolleges, and 25 university branch campuses. See Appendix A for the location of each campus.
Public colleges and universities vary in size and scope of programming from a small campus such as Rio
Grande Community College with 1,421 students and 13 associate degree programs to The Ohio StateUniversitywith over 53,900 students, more than 250 degree programs at the associate, baccala u 'mate, graduate,
and professional levels, and a comprehensive research agenda.
Collectively, Ohio's public colleges and universities enroll more than 443,000 (headcount) students in
credit programs. Ohio's independent institutions enroll more than 100,000. The Board of Regents does not
collect data on student retention or graduation rates, but national data indicate approximately 81,000 students
earn degrees in Ohio every year 60,003 from public institutions and 21,000 from independent non-profitinstitutions. Ofthe degrees granted, more than halfare at the baccalaureatelevel; one-fourth are at the associate
level. See Tables 1 and 2 in Appendix B for enrollment patterns and degrees awarded.
The physical plant of Ohio's public institutions alone includes over 1,800 buildings and 81 million gross
square feet of space. Over 21,300 full-time equivalent faculty are employed by Ohio's public colleges and
universities; more than 48,000 full-time equivalent administrative and support staff areemployed.
Total expenditures for all public institutions are approximately $3.8 billion per year the State of Ohio
provides less than half the revenue needed to meet higher education expenditures each year.
Student Profik
Overall, the student prof ile has changed over the last decade fiom a traditional-aged (1 8-21) male, full-time,daystudent to atypical student todaywho is female, older (23 +), svith work and/or fiunily responsibilities. Morestudents attend school part-time, in the evening or on weekends than a decade ago. Full-time, traditional-agedstudents from across the state and outside Ohio are most often found in the residential universities. Studentsattending non-residential universities and two-year campuses are usually older, from the local community orregion, attending part-time and in the evenings. The racial and ethnic mix has not changed substantially' inOhio's colleges and universities over the last decade. (See Tables 3-7, Appendix C for a more detailed student
profile.)
Faculty Profik
The Board ofRegents does not have retrievable &am fiu:ulty.age, gender or race/ethnicity. The proportion
of faculty in the ranks of Professor, Associate Professor, Assistant Professor and Instructor at Ohio's publiccolleges and universities has remained steady for the last five years even though the number of faculty hasincreased. There has been a decline in the last year in the use of Graduate Teaching Assistants and Instructorsand an increase in the use of other teaching staff, i.e., adjuncts and clinical faculty. These patterns reflect aninabilityD3 provide resources for graduate student stipends and uncertaintyabout placing new faculty into tenure
track positions.

In the two-year college sector, the number ofAssistant Professors, Instructors, and part-time teaching staffhas increased. Since substantial enrollment growth has occurred in this sector, the addition of faculty, especiallypart-time faculty, would be expected (see Table 8, Appendix C).
Slightly over half of Ohio's public university faculty at all ranks are tenured, which is less than the nationalnorm for public universities (59%).2
Governance Structure
The stewardship and governance of Ohio's colleges and universities is in the hands of independent boardsof trustees made up of leaders from corporations, community organizations, and local government. Trusteesare appointed to university boards by the Governor, and to community and technical college boards by acombination ofappointing authorities (e.g., Governor, boards ofcounty commissioners and area school boardpresidents).
The Ohio Board of Regents, as an agency of state government responsible for planning and coordinationof higher education, is charged with "considering the needs of the people, the needs of the state, and the roleof individual public and private institutions within the state in fulfilling these needs. . .." (Ohio Revised Code3333.04). The nine-member Board, appointed by the Governor, has limited authority regarding the fiscal andoperational management of Ohio's colleges and universities.
Goals
The planning responsibility of the Board of Regents has been used to establish broad direction for highereducation. A Master Plan for Higher Education has been developed about every five years since the Board ofRegents was established in 1963. The current Regents' 1988 Master Plan, Toward the Year 2000, frames ahigher education agenda within four major goals:
1. To develop a first-dass system ofhigher educatio n which is recognized forks consistent, high qualityand for its responsiveness to state needs.
2. To assure that all Ohioans are prepared for a lifetime of changing careers.
3. To provide leadership in the development of collaborative strategies for economic and socialchange.
4. To seek support for a strong financial foundation for excellence in higher education.
20hio data fiom the American Association ofUniversiv Professors; U.S. data from Acuity in Higher Education
Institutions. 1988, U.S. Department ofEducation, National Center for Educational Statistics, March 1990
The Master Plan outlines several interrelated strategies to achieve these goals. The full development ofthose
strategies has been interrupted by thestate's fiscal crisis.
Historical Values Access, Quality and Efficiency
Access
Perhaps the most consistent public policy issue for highereducation over the decades has been access. The
State of Ohio has invested in broad student access to colleges and universities in several ways:
Building colleges and universities within commuting distance of virtually all Ohioans.
Providing Ohio high school graduates with open admission to thestate's colleges and universities.
Granting funds (Ohio Instructional Grants) to aid those students who qualify on the basis of need.
Awarding academic scholarships to two graduating seniors from eachhigh school in the state to attend
an Ohio college c. university of his or her choice.
Making it possible for students to choose independent colleges as well as public colleges through the
tuition differentials provided in the Ohio Instructional and Student Choice Grant programs.
Allowing students to begin college early by taking college coursework intheir senior year of high school
through the Postsecondary Enrollment Options Program.
Establishing college savings programs through the Ohio Tuition Trust Authority and student loan
guarantees through the Ohio Student LoanCommission.
State-kveldforts to improve access. In addition to these state programs, the Board of Regents has developed
strategies to help students, particularly those students previously underrepresented in higher education, move
more effectively through the levels of education, from kindergarten through graduate school.
College and university e jJ2 r to improve access. For manyyears, colleges and universities have used avatiety
of strategies to reach out to prospective students, draw them into the college, and help them reach their
educational goals. Although the emphasis historically has been on recruitment, attentionhas been turning more
recently to student retention and completion. This was dearly a pattern presented in the institutional reports,
and connects the access of students more closely to issues of quality.
Appendix D provides additional details on state-level and college and university access programs.
4-s
There are about as many ways to define and measure quality as there are colleges and universities in Ohio.On some campuses, quality is defined as "meeting and exceeding the needs ofcustomers;* on others the concept
is not as crisply stated.
State-level eons to improve quality. The Ohio Board of Regents approves all new degrees and degreeprograms based on minimum quality standards. But there has not been a mechanism for the Board to assessthe quality of programs already in place.
In the absence ofprogram review authority, the Board, in 1983, launched its Selective Excellence Program,a five-part package to stimulate quality improvement on college and university campuses. The SelectiveExcellence Program represented the Board's first attempt to targetfunds to a specific statewide goal to be adrievedin higher education.' One outgrowth of these programs was the identification of a number of characteristicsof excellent undergraduate programs through a project funded by the federal Fund for the Improvement ofPostsecondary Education (1987-89).
Complementary programs such as the Ohio Supercomputer Center, Ohio Aerospace Institute, and theEdison Technology Centers have stimulated both basic and applied research in Ohio, raising the prospects foreconomic revitalization. Ohio's investment over several years in instructional and laboratory equipment,attempting to keep pace with changes in technology, has also contributed to qualitative gains within the state'scolleges and universities.
The Board of Regents also convened an Imes Forum involving faculty and administrative leaders withinthe two-year college sector, as well as external participants, in the review of major issues central to thedevelopment ofan excellent two-year college system. Ten issue papers were developed and widely dispersed forinternal use in the colleges, leading to many qualitative improvements.
Finally, the Board of Regents recently co-sponsored a conference on the application to higher education ofTotal Quality Management principles. These principles offer new strategies for optimizing higher educationquality.
College anduniversiv ems to improve quay. The Selective Excellence programs have had considerableimpact on those academic programs which received the targeted funds and competitive awards. Qualityteaching, demonstrated student learning gains, increased external funding for research, and stronger outreachto business and industry are just some of the results.
3A comprehensive evaluation of the Selective Excellence Program u currently being conducted with results expected
in October 1992 04 two of the fivi programs still exis4 Research Challenge and Productivity ImprovementChallenge, and most ofthe appropriatedfind ;for these two programs havenow disappeared as a result ofbudget cuts
fvr fucal year 1993.
15
All campuses measure and reward quality some use more traditional means; others have comprehensive
and innovative approaches in operation. Quality has traditionally been determined by accreditation reviews;
competitive awards and grants received; numbers of students, amount of space, faculty credentials and
reputation, and size of resource pool; and externally validated reputation of programs and colleges. More
mouldy, colleges and universities have incorporated faculty productivity and student achievement measures in
their detennination of institutional effectiveness, in part as a response to aNorth Central Association ofC,olleges
and Schools (regional accrediting body) mandate. The assessment process will make it possible for colleges and
universities to demonstrate effectiveness ofthe teachingand learning process andwill contribute to the continual
improvement of learning experiences for students.
See Appendix E for a description of these state-level and college and university efforts to improve quality.
Eflidency
In 1965, the State of Ohio did two things to establish a foundation for efficiency: created a single
instructional subsidy, and allowed colleges to maintain their own treasuries. Appropriating state funds for
colleges and universities through a single instructional subsidy, rather than through a series of separate
appropriations for different objects of expenditure, such as payroll, maintenance,and equipment, has provided
campus managers with at least two incentives to keep unit costs below the statewide average:
Savings in one spending category, such as reduced utilitycosts, canbe reallocated to a different one, such
as adding faculty.
Savings occur whenever institutional costs are below the statewide average cost experience for the
programs offered by the institution.
Allowing colleges and universities to maintain their own treasuries has meant that
* The institutions were exempted from many of the bureaucratic controls imposed on state agency
spending.
* Appropriations unspent at year end could be retained by the institution for use in later years.
In addition to this important foundation, several state-wide management improvementefforts have been
launched over the years, with resulting guidelines that have led to improvements in institutional planning,
program budgeting, personnel management, computer servicxs,scheduling and registration, program develop-
ment and review, cost containment, and managementdevelopment.'
'The Ohio Board ofRegen# published a series ofmanagementrepons in 1974 and in 1979.
State-level eforts w increase eciency. Several other state-level cost-containment initiatives are in place,induding efforts to improve the quality of students attending college. There have been more recent efforts tolink colleges and universities through technology and collaboration to avoid unnecessary duplication ofresources.
College and university eorts to increase emiency. The college and university task forces identified manycost-containment efforts that have been made on the campuses in energy management, administrativereorganization, streamlining processes, and bulk purchasing.
Appendix F indudes a description of slate-level and college and university efforts to increase efficiency.
Unique Features
Several features unique to Ohio shape the cost of higher education and the ability of institutions and thestate to resolve some of the issues put before the Managing for the Future Task Force.
Open admissions. Unlike most other states, Ohio does not have a stratified higher education systemwith state universities, state colleges, and community colleges, each with different admission criteria.Instead, Ohio has an "open admissions" law which has been generally interpreted to mean that any Ohiohigh school graduate may be admitted to the public college or university of his/her choice.
Large number of colleges and universities. Where some states are currently adding campusesto meet student needs, Ohio has in place more than 100 public and independent colleges Anduniversities tc, serve students. The public a..npuses are located geographically in urban centersand in rural communities across Ohio.
An emphasis on technical education. Rather than developing a system of community colleges witha mix of technical and transfer education, as was done in most other states, Ohio invested majorresources in technical colleges with programs designed to prepare students directly for the world ofwork. Technical education programs are more expensive than the transfer programs.
An expensive structure. Ohio's students compared to students in other states are more likely to beenrolled in a comprehensive university or in a technical program, and much less likely to be enrolledin a baccalaureate transfer program at a local community college. Since Ohio students are enrolled inmore expensive programs. or more expensive settings, one would expect the cost per student to beconsiderably above the national average as well. But per-student costs are at the national average overall(see Figure 14, page 34) and look favorable in peergroup comparisons pri marily because campus leadershave managed their resources efficiently.
State support through a single instructional subsidy. Ohio was one of the first states to develop aformula-based operating subsidy for higher 'education, which has provided college and universitymanagers with incentives to keep unit costs below the statewide average.
Dwentra lintion of financial administration. Unlike many other states, Ohio's colleges anduniversities are by law permitted to maintain their own treasuries, resulting in less bureaucratic red tape
at the state level, and an ability to save funds and retain those dollars in Deserves.
Record enrollment increases. While other states have been experiencing enrollment dedines that
mirror those in the high school aged population, Ohio's public higher education enrollment has
increased by 55,000 students in the last five years at a rate of 2-3% a year. This pattern is expected
to continue because ofthe large number ofadults attending the two-year colleges, the institutions with
the largest enrollment growth.
High tuition and fees. Because student tuition is the largest source of funding beside state support, the
student's share of the cost of higher education grows in direct proportion to the decreases in state
funding. State support per student is low. Student tuition is high. The result: Ohio has among the
highest public college and university student fees in the nation.
The unique characteristics ofhigher education in Ohio pose added challenges to finding state-level policies
that can be applied equitably or uniformly across all public colleges and universities. Each institution candemonstrate excellent examples of access, quality and efficiency. In terms ofstudent outcomes, however,
program effectiveness is neither uniform acrossdepartments within each college and university, nor consistent
aaoss the state. Every attempt must be made to ensure students receive quality, affordable services, wherever
in the state they attend college.
.,/ ,:;':''
HI. ME FACTS:5
HIGHER EDUCATION REVENUE AND
EXPENDITURE PATTERNS
7 hope that over the next few years, as institutions look at their financialcapabilities and at their continuing commitments, more institutions will decidenot to do a little less of evr.rything, but to do more ofsome things that they're nowdoing and perhaps more of others, or as much of others as they're now doing."
Robert M. Rosenzweig, PresidentAssociation of American Universities, 1992.
Ohio's Economic, Social and Political Environment
Economic trends, the political climate, and the value of education to past generations have been importantto tie shaping of higher education in Ohio. Today, they are creating downward spirals where limitededucational opportunities lead to lower income which leads to fewer tax dollars which limit educationalopportunities even further.
High Income, Low Tax, Low Service Beginning. Historically, Ohio has been a high income,low tax, low service style. During the 1950s, Ohio's economywas based on heavy industry payingrelatively high wages and facing little international competition.
5 The facts included here are aggregated to the state level; individual college and universiv factsmay differ.

Figure 1: Ratio of Ohio to U.S. Per Capita Personal income
1%0
Source: Surway of Current tusintass. 1990
110 IWO 1110 1110
Ohio per capita income was 8% above the national average in 1950 and more than 5% belowthe national average in 1990 (Figure 1).
State and local taxes were the lowest in the country as a share of personal income as late as 1978(Figure 2). Even as late as 1988, Ohio ranked 34th in the nation in state and local taxes as apercentage of personal income.
Higher education was perceived as a luxury, unconnected to economic needs, and the state'sinvestment in higher education has been historically low .
J3

0.00%
-5.00%
-10.00%
-15.00%
-20.00%
-25.00%
Figure 2: Ohio State & Local Taxes As A Percentage of PersonalIncome
1953 1965 1975 1978 1981 1984 1985 1986 1987 1988
I
-6.66%
49th 48th 51st 51st 49th 29thU.S. Rank
U.S . Average = 0
33rd 30th 30th 34th
State higher education appropriations per student have on average been 17-20% below thenational average for more than a decade (Figure 3).
Emergence of Competitive, Knowledge-based Economy. With the world economy placing newdemands on American firms, income has become much more closely related to education. Theeconomy increasingly rewards the skills it needs to survive.

s P,.1.,V1Vak.'z..S.T"'sms,,,,,,,,,
-
9 ., , , , ,: : :
: :
:
:V V
P-41.15
ely
: . ., raNsva
141FW
: I . <io4 aftL
v
,
,
3
k :'ltigt.7/
17
I
. . ,
BOO Se
esewiffyFigure 4: Mean Monthly Earnings for Adults 18 & Over, by Degree
Level; Spring 1987
Total
Doctorate
Professional
Masters
Bachelor's
Associate
Vocational
Some College, nodegree
High school graduateonly
Not a high schoolgraduate
$1,540
$3,950
$4A80
$2.311
$1,733
$1.136
$1=
$773
$710
4$583
$709
$207
$1.977
$1499
$1A83
$1,350
$2A71
$2.901
SO $500 $1,000 $1,500 $2,000 52,500 $3,000 53,500 $4,000 $4,500
12 Men
I Women
"Note: There were not enough women with doctorate degrees k n the survey to Nst the mean monthlyearnings.
Source: What's it Worth? Educational Background and Economic Status Speog 1987, arrent Population Reports. Series P-70, No. 21.
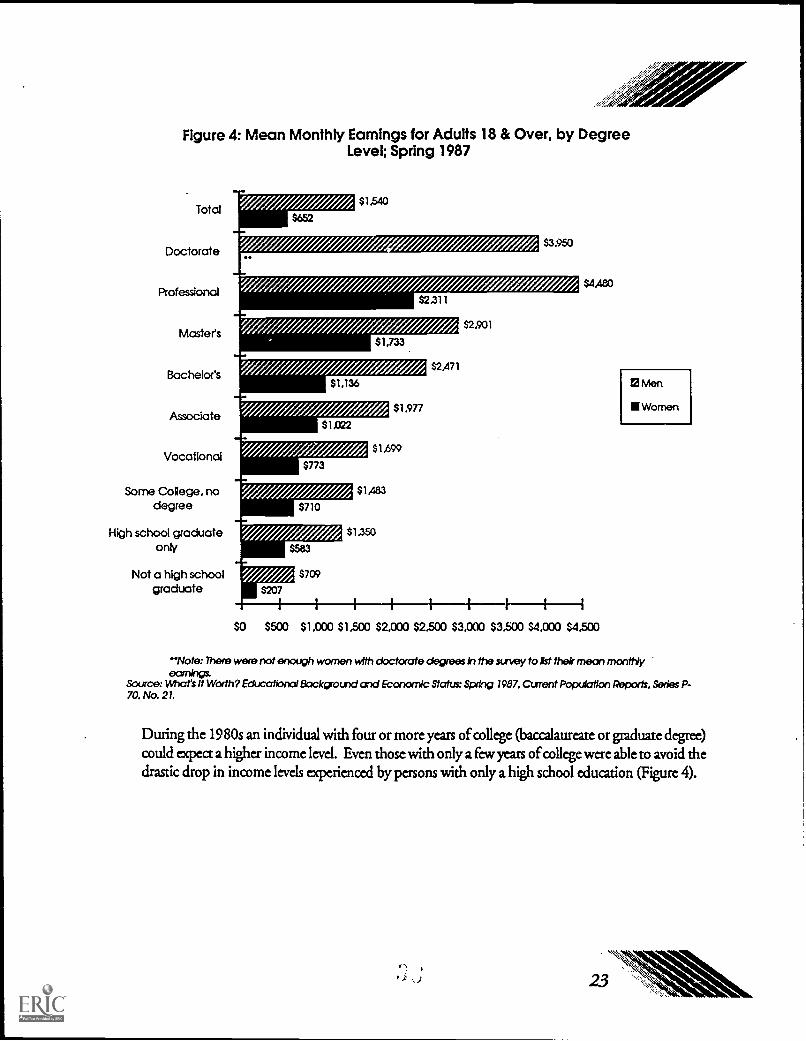
During the 1980s an individual with four or more years of college (baccalaureate or graduate degree)could expect a higher income level. Even those with only a few years of college were able to avoid thedrastic drop in income levels experienced by persons with only a high school education (Figure 4).
23
iiUnols
Michigan
United States
Wisconsin
Ohio
Indiana
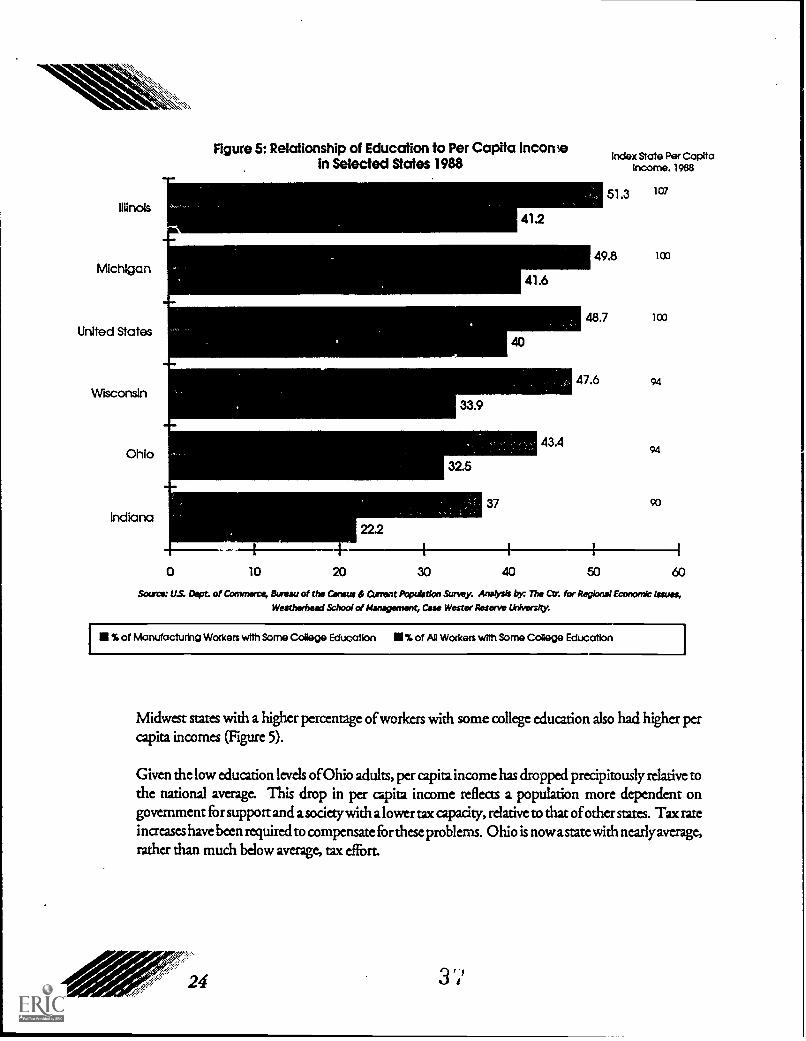
Figure 5: Relationship of Education to Per Capita Incon ieIn Selected States 1988
0 10
Index State Per C.apttaIncome. 1988
51.3 107
49.8 too
48.7 too
47.6 94
94
90
20 30 40 50 60
Sour= U.S. Dept. of Commerce, Bureau of the Census & Cu rent Population Surrey. Analysis by The CV. for Regbnal Economic Issues,Weatherheacl School of Management, Case Wester Reserve Univer-Ay.
I IA of Manufactudng Workers with Some C041308 Education II 7. of All Workers with Some College Education
Midwest states with a higher percentage of workers with some college education also had higher percapita incomes (Figure 5).
Given the low education levels of Ohio adults, per capita income has dropped precipitously relative tothe national average. This drop in per capita income reflects a population more dependent ongovernment for support and a society with a lower tax capacity, relative to that of other states. Tax rateincreases have been required to compensate for these problems. Ohio is now a state with nearly average,rather than much below average, tax effort.
3' '
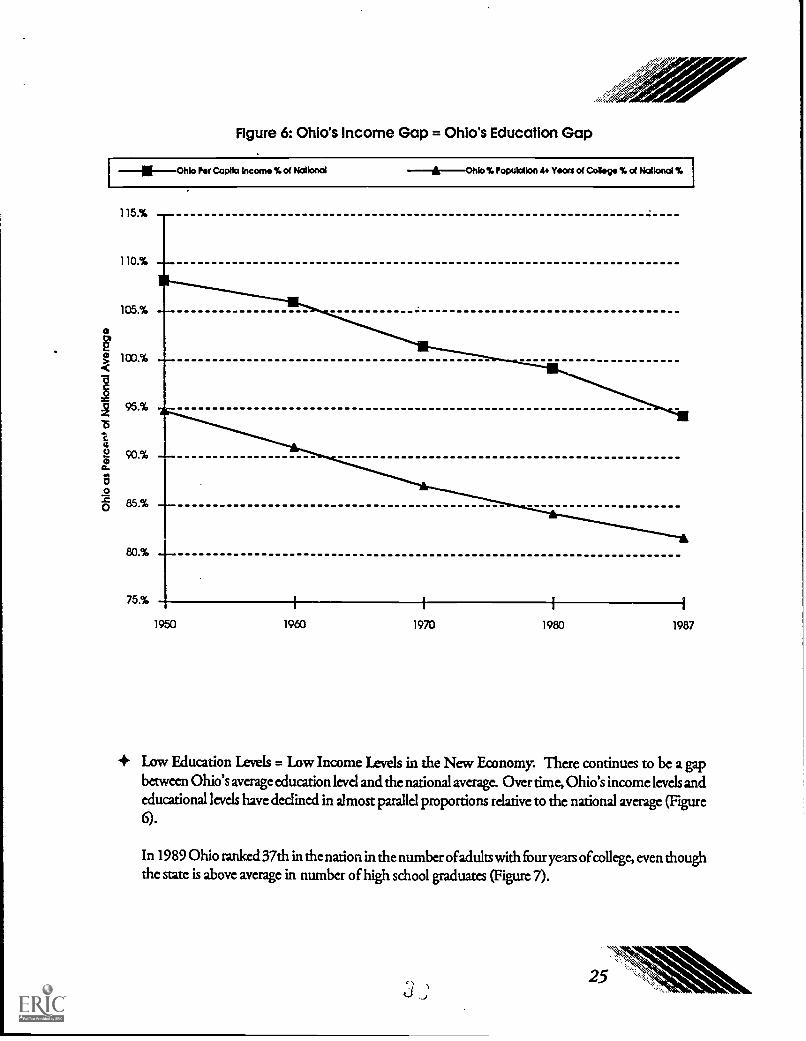
Figure 6: Ohio's income Gap = Ohio's Education Gap
Ohio Per Capita Income 1. of Nationci % Population 4+ Years of College of National 16
115.%
110.%
105.%
95.%
c0.%
85.%
80.%
75.%
1950 1960 1970 1980 1987
Low Education Levels = Low Income Levels in the New Economy. There continues to be a gapbetween Ohio's average education level and the national average. Over time, Ohio's income levels andeducational levels have declined in almost parallel proportions relative to the national average (Figure6).
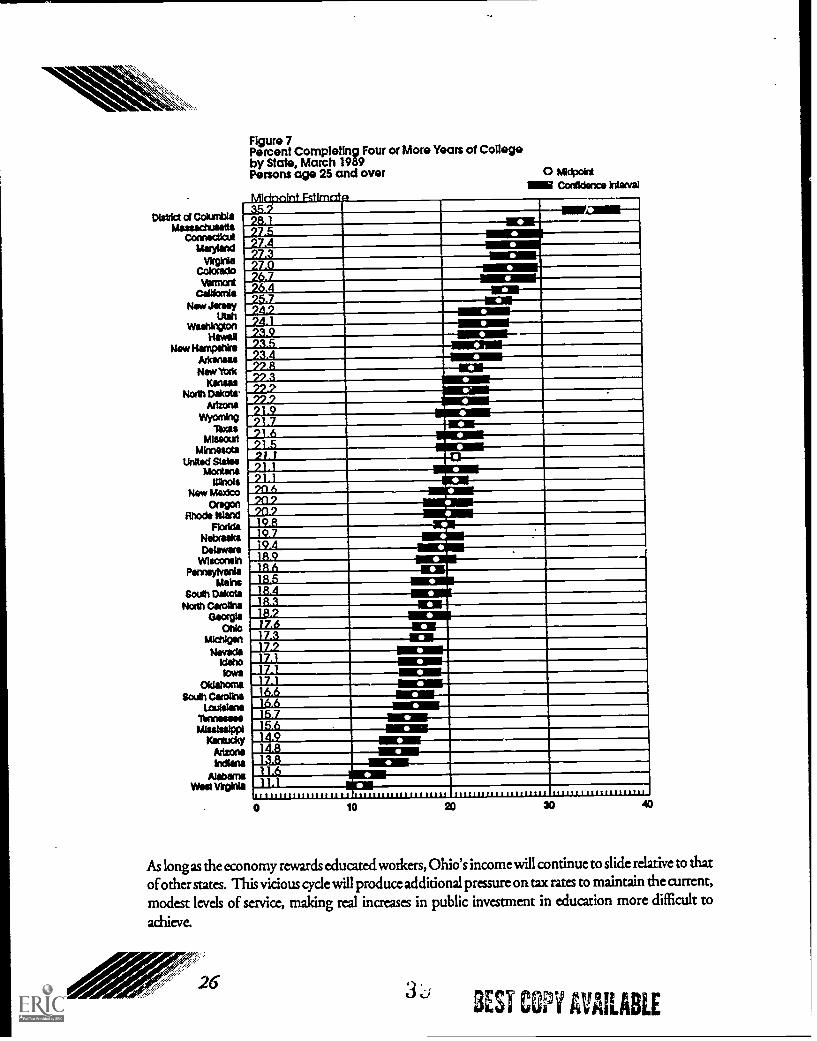
In 1989 Ohio ranked 37th in the nation in the number ofadults with fouryears of college, even thoughthe state is above average in number of high school graduates (Figure 7).
District of ColumbiaMassachusetts
ComecticutMaryland
AVMColoradoVannont
CalikoteNew Jersey
UtahWashington
HawaiiNew Hampshire
ArkansasNew Yak
KansasNo Mott
ArizonaWyoming
ThusMissouri
MinnesotaUnited Stales
MontanaIllinois
New Mexico
0(0011Rhode Island
FloridaNebraskaDelaware
WisconsinPennsylvania
MainsSouth Dakota
North Caroana°eagle
OhioMichigan
NevadaIdahoIowa
OklahomaSoulh Carolina
LculsisnaTennesseeMississippi
Kw/MickyArizonaIndiana
AlabamaWee Virginia
Figure 7Percent Completing Four or More Years of Collegeby State, March 1989Persons age 25 and over
Midpoint Estirncrt35 928J97.5
0 MidpointEMI Confidence Interval
-111311---27.427.327.026.726.425.794.224.123.923523.4
--1111110111111--
99 379.922.921.921.791 691.521.121.121.120690290910819.719.41,19
85
8.38.2
17.67.37.2
17.117.1
_17-1 -111111011111-6.66.6
15.715.6
.14.914.8
11.6
IN131111
0 10 20 30 40
As long as the economy rewards educated workers, Ohio's income will continue to slide relative to thatof other states. This vicious cycle will produce additional pressure on tax rates to maintain the current,modest levels of service, making real increases in public investment in education more difficult to
achieve.
26 :3JBEST COPY AVAILABLE

:".ZserAgera"...ZrLow State Investment in Higher Education Slows Economic Growth. Low levels of investment inhigher education have also produced unusually low levels of research activity. This means that Ohio'seconomy is likely to remain a traditional one, taking relatively little advantage of newly createdknowledge, and that those Ohioans who do achieve high levels of education will be more inclined tomigrate to other states with industries that are more advanced. The loss of educated workers makes itmore likely that our industries will remain traditional.
College is a Necessity, Not a Luxury. As Ohio's traditional jobs in heavy industry, mining, andagriculture have become less reliable sources ofincome, college enrollments have begun to increase even
though the population of traditional aged students has fallen. Higher education is increasinglyperceived as a necessity, especially for adults currently in the workforce who are finding it more difficultto sustain adequate employment. It is those adults, often with rusty or undeveloped academic abilities,who are pushing Ohio's college enrollments up. Serving these students is often more costly than thestudent just out of high school who has a more current basic education in science, mathematics, andwriting.
Figure 8: Ohio State Support of Higher Educationdighol FY 1991 vs. Pvised FY 1993
1991
Operations 61 Debt Service
1093
Higher Education Absorbs Disproportionate State Budget Cuts. State support (including debtservice) for higher education today stands some $144 million below what it was in July, 1990(Figure 8). The original higher education appropriation for FY 1991 were $1,520,054,764 for
J
operations, $268,853,000 for debt service, and $1,788,907,764 in total. After the executiveorder reductions announced on July 1, 1992, FY 1993 state appropriations for operations
amount to $1,376,490,460, plus $298,991,382 for debt service, for a total of $1,675,481,842.Meanwhile, enrollments have been increasing steadily. During these two years, we expectenrollments to increase by over 16,000 full-time students - more than the entire enrollment of
Wright State University near Dayton. Although higher education accounts for roughly 12.4%
of the state's spending in any given year, it absorbed 39% of the budget cuts announced onFebruary 1, 1992 ($44.9 million out of the $114.6 million), and 29% of the cuts announcedDecember 30, 1991 ($57.2 million out of the $196 million). Even after a last-minute reprieve
trom even larger cuts, higher education's FY 1993 reduction, announced on July 1, 1992, was
substantially larger and more disproportionate. Higher education appropriations were reduced
by $170.2 million which represented 54% of the entire state budget cut. The amount of thiseduction is nearly equal to the entire instructional subsidy allocated to all community and
technical colleges in FY 1992.
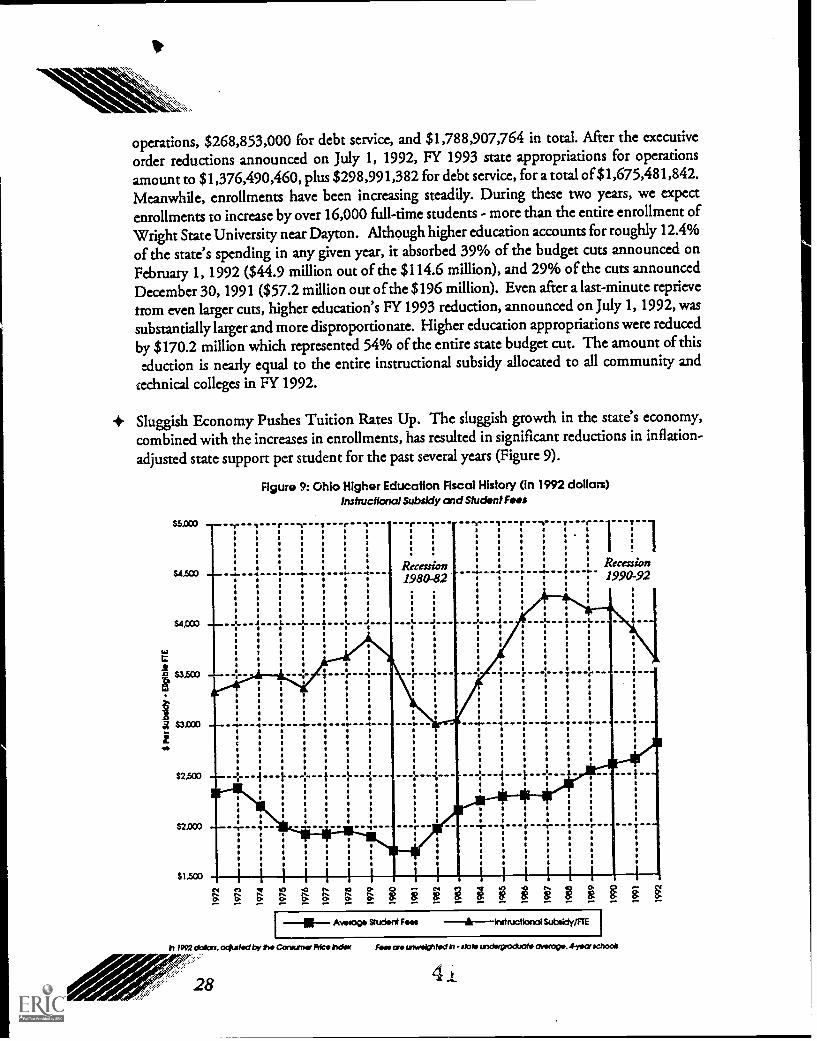
Sluggish Economy Pushes Tuition Rates Up. The sluggish growth in the state's economy,combined with the increases in enrollments, has resulted in significant reductions in inflation-
adjusted state support per student for the past several years (Figure 9).
Figure 9: Ohio Higher Education Fiscal History (in 1992 dollars)Instructional Subsidy and Studant huts
$2.500
S2,000
51,500
fq SO cs Is. eaA I, 0A A 0.A A h.O. 0, 0*
Avistogo Student Foos --jrInitructionol Subsidy/RE
kt 1902 daft's. °gusted by the Conzener Mc* heist Few alp unweighhod h slab undsegroduate ~ago. 4-yocr actvoi
4.1
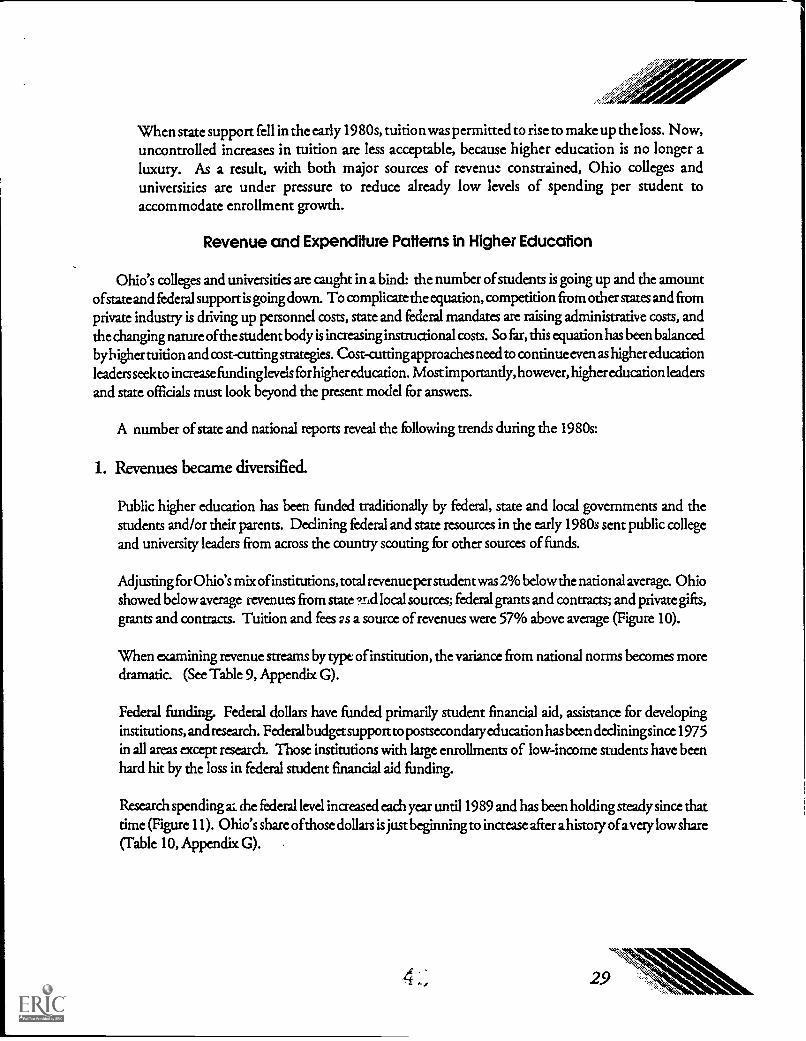
When state support fell in the early 1980s, tuition was permitted to rise to make up the loss. Now,uncontrolled increases in tuition are less acceptable, because higher education is no longer aluxury. As a result, with both major sources of revenue constrained, Ohio colleges anduniversities are under pressure to reduce already low levels of spending per student toaccommodate enrollment growth.
Revenue and Expenditure Patterns in Higher Education
Ohio's colleges and universities are caught in a bind: the number of students is going up and the amountofstate and federal support is going down. To complicate the equation, competition from other states and fromprivate industry is driving up personnel costs, state and federal mandates are raising administrative costs, andthe changing nature ofthe student body is increasing instructional costs. So far, this equation has been balancedby b igher tuition and cost-cutting strategies. Cost-cutting approaches need to continue even as higher educationleaders seekto increase funding levels for higher education. Most importantly, however, higher education leaders
and state officials must look beyond the present model for answers.
A number of state and national reports reveal the following trends during the 1980s:
1. Revenues became diversified.
Public higher education has been funded traditionally by federal, state and local governments and thestudents and/or their parents. Declining federal and state resources in the early 1980s sent public collegeand university leaders from across the country scouting for other sources of funds.
Adjusting for Ohio's mix of institutions, total revenue perstudent was 2% below the national average. Ohioshowed below average revenues from state and local sources; federal grants and contracts; and private gifts,grants and contracts. Tuition and fees as a source of revenues were 57% above average (Figure 10).
When examining revenue streams by type of institution, the variance from national norms becomes moredramatic. (See Table 9, Appendix G).
Federal funding. Federal dollars have funded primarily student financial aid, assistance for developinginstitutions, and research. Federal budget support to postsecondaryeducation has been declining since 1975in all areas except research. Those institutions with large enrollments of low-income students have beenhard hit by the loss in federal student financial aid funding.
Research spending at die federal level increased each year until 1989 and has been holding steady since thattime (Figure 11). Ohio's share ofthose dollars is just beginning to increase after a history of avery low share(Table 10, Appendix G).
4
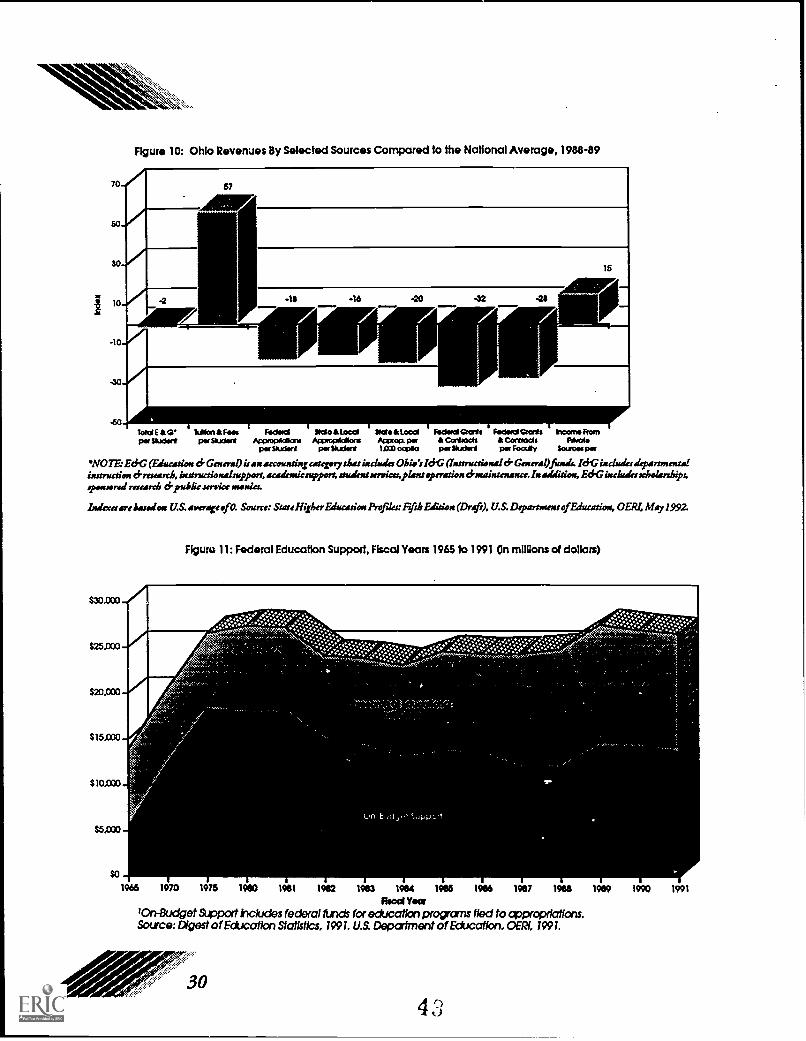
- I
.II 1
-f/11..-1..
1 l
SOS
150
z 1 5
r :
Ltn but7, t
r if_//,
t ,1,0J1
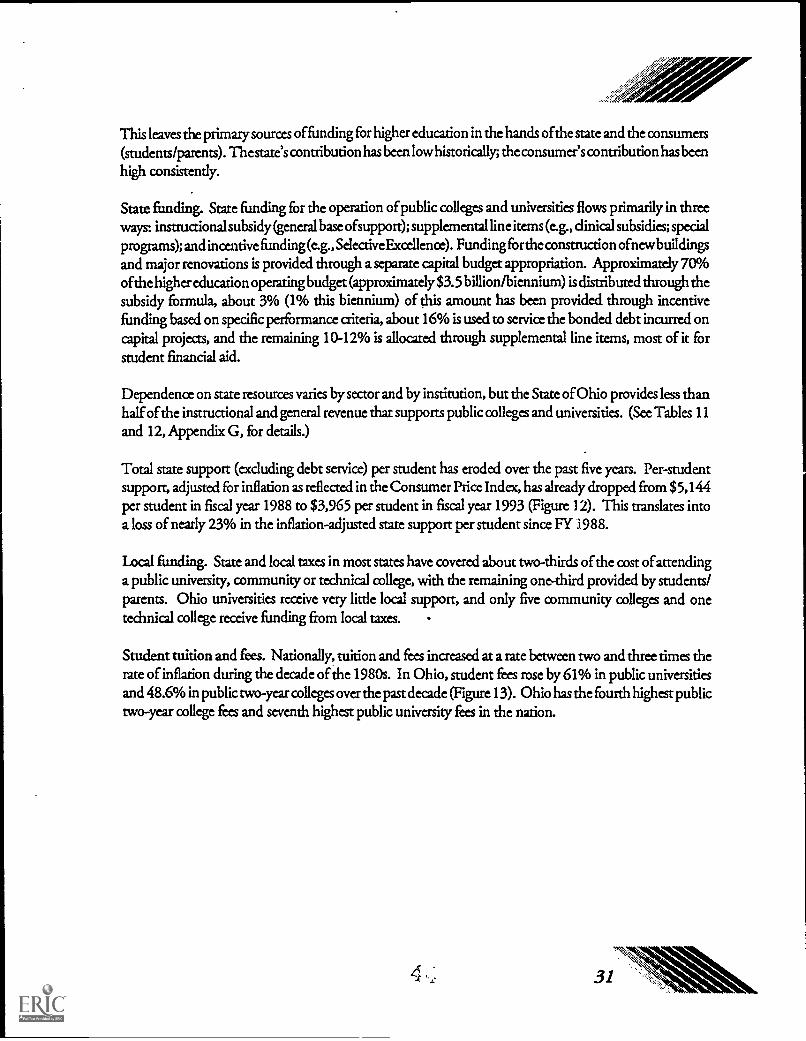
This leaves the primary sources of funding for higher education in the hands ofthe state and the consumers(students/parents). The state's contribution has been low historically; the consumer's contribution has been
high consistently.
State funding. State funding for the operation of public colleges and universities flows primarily in threeways: instructional subsidy (general base ofsupport); supplemental line items (e.g., clinical subsidies; specialprograms); and incentive funding (e.g., Selective Excellence). Funding for thc construction ofnew buildingsand major renovations is provided through a separate capital budget appropriation. Approximately 70%ofthe higher education operating budget (approximately $3.5 billion/biennium) is distributed through thesubsidy formula, about 3% (1% this biennium) of this amount has been provided through incentivefunding based on specific performance criteria, about 16% is used to service the bonded debt incurred oncapital projects, and the remaining 10-12% is allocated through supplemental line items, most of it forstudent financial aid.
Dependence on state resources varies by sector and by institution, but the State of Ohio provides less thanhalf of the instructional and general revenue that supports public colleges and universities. (See Tables 11and 12, Appendix G, for details.)
Total state support (occluding debt service) per student has eroded over the past five years. Per-studentsupport, adjusted for inflation as reflected in the Consumer Price Index, has already dropped from $5,144per student in fiscal year 1988 to $3,965 per student in fiscal year 1993 (Figure 12). This translates intoa loss of nearly 23% in the inflation-adjusted state support per student since FY .1988.
Local funding. State and local taxes in most states have covered about two-thirds of the cost of attendinga public university, community or technical college, with the remaining one-third provided by students/parents. Ohio universities receive very little local support, and only five community colleges and onetechnical college receive funding from local taxes.
Student tuition and fines. Nationally, tuition and fees increased at a rate between two and three times therate of inflation during the decade of the 1980s. In Ohio, student fees rose by 61% in public universitiesand 48.6% in public two-year colleges over the past decade (Figure 13). Ohio has the fourth highest publictwo-year college fees and seventh highest public university fees in the nation.
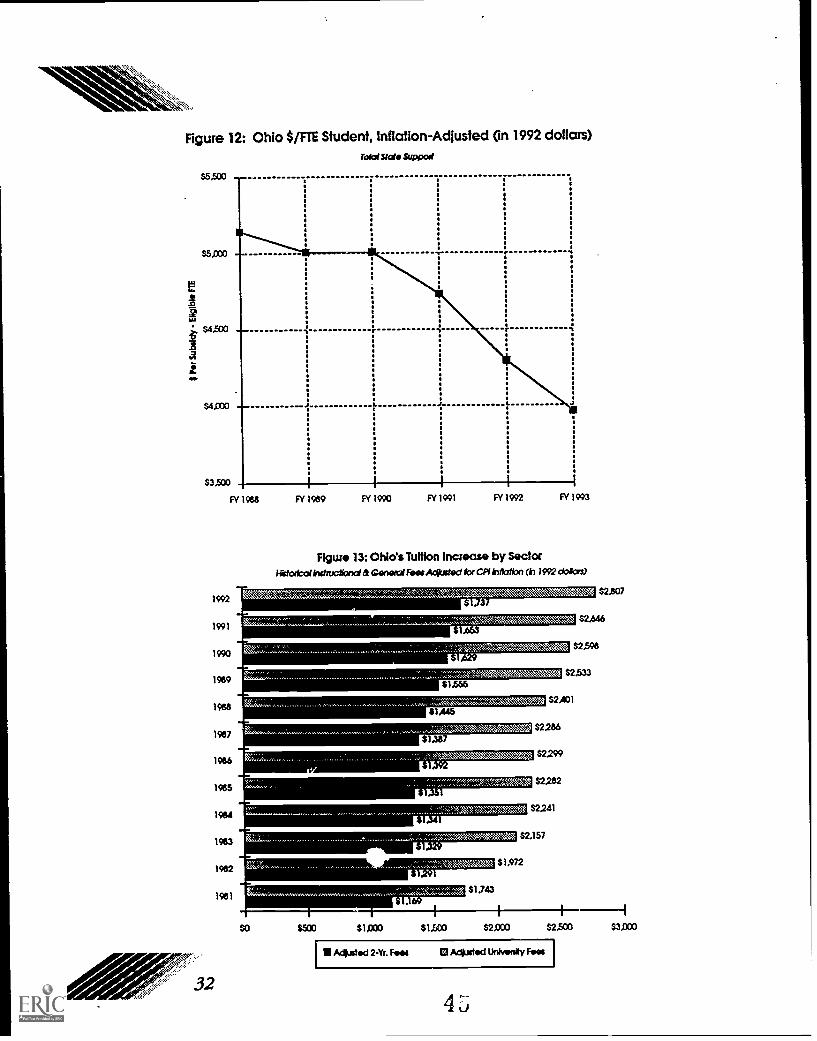
;1
I I
- (
.
tiP14
Eirz1/4
I
ZUZMWKWR:7A15,..
(..w.oe
de'
(
UPI.?"-
EIN4aa
,`"
-Air
,SS 11 11S SS 111
1 .
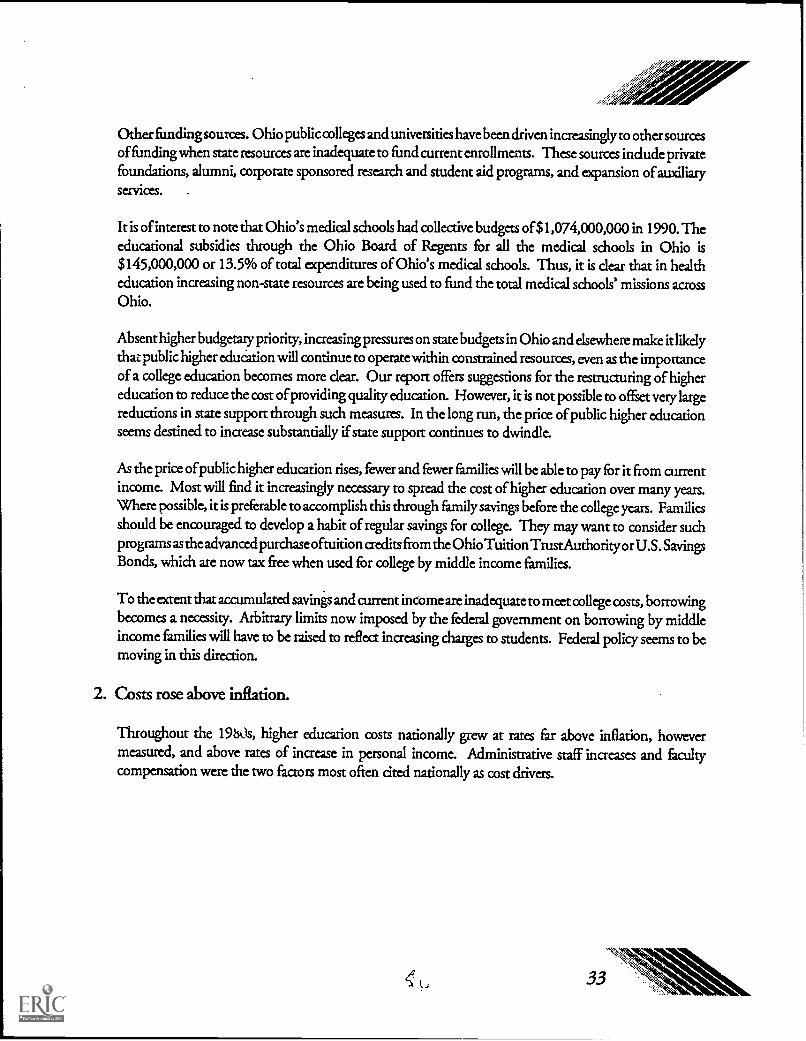
Other funding sources. Ohio public colleges and universities have been driven increasingly to othersourcesof funding when state resources are inadequate to fund current enrollments. These sources indude privatefoundations, alumni, corporate sponsored research and student aid programs, and expansion of auxiliaryservices.
It is of interest to note that Ohio's medical schools had collective budgets of $1,074,000,000 in 1990. Theeducational subsidies through the Ohio Board of Regents for all the medical schools in Ohio is$145,000,000 or 13.5% of total expenditures of Ohio's medical schools. Thus, it is clear that in healtheducation increasing non-state resources are being used to fund the total medical schools' missions acrossOhio.
Absent higher budgetary priority, increasing pressures on state budgets in Ohio and elsewhere make it likelythat public higher eduCation will continue to operate within constrained resources,even as the importanceof a college education becomes more dear. Our report offers suggestions for the restructuring of highereducation to reduce the cost of providing quality education. However, it is not possible to offsetvery largereductions in state support through such measures. In the long run, the price of public higher educationseems destined to increase substantially if state support continues to dwindle.
As the price of public higher education rises, fewer and fewer families will be able to pay for it fromcurrentincome. Most will find it increasingly necessary to spread the cost of higher education over many years.Where possible, it is preferable to accomplish this through family savings before the college years. Familiesshould be encouraged to develop a habit of regular savings for college. They may want to consider suchprograms as the advanced purchase oftuition credits from the Ohio Tuition TrustAutho rity or U.S. SavingsBonds, which are now tax free when used for college by middle income families.
To the extent that accumulated savings and current income are inadequate to meet college costs, borrowingbecomes a necessity. Arbitrary limits now imposed by the federal government on borrowing by middleincome families will have to be raised to reflect increasing charges to students. Federal policy seems to bemoving in this direction.
2. Costs rose above inflation.
Throughout the 19&)s, higher education costs nationally grew at rates far above inflation, howevermeasured, and above rates of increase in personal income. Administrative staff increases and facultycompensation were the two factors most often cited nationally as cost drivers.
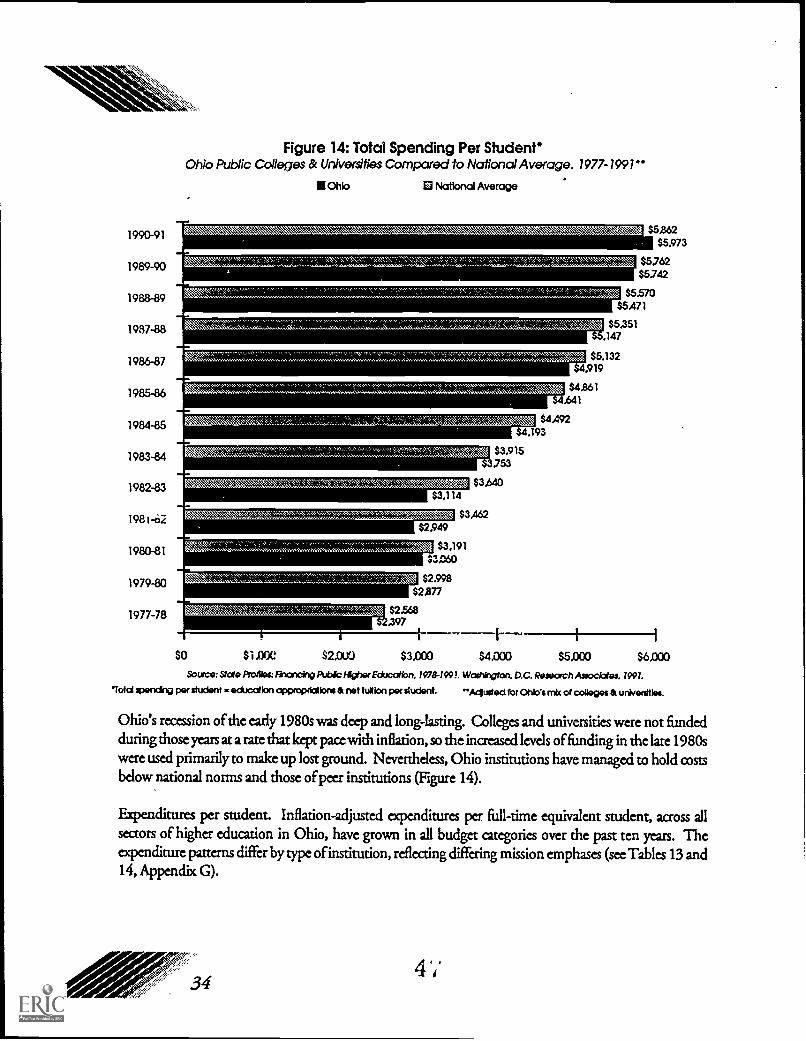
or r
- -r r :-.tZ
:
:I
:I
, &t.),tstotE .
VIRM^Acqk,,,Z,,,,,,,,,C WA 0 " ), V,s M , tN.G.( ,, i5 .,<L57,,,,,,,
, ,$4,`4.% , , 55, s, 55, 55, ',Iv:
I All
VD,
I
I IV
I II II I
II y I
ekI 11
I I VA. I
I
11,1 1,51
a I I y I
4. I R
III I II y. V, I I I I I I y, t I
y .11 4. 0 * ly Pt _1 11A... a /I V to it I a I I I : 4.1 RY en V
II I
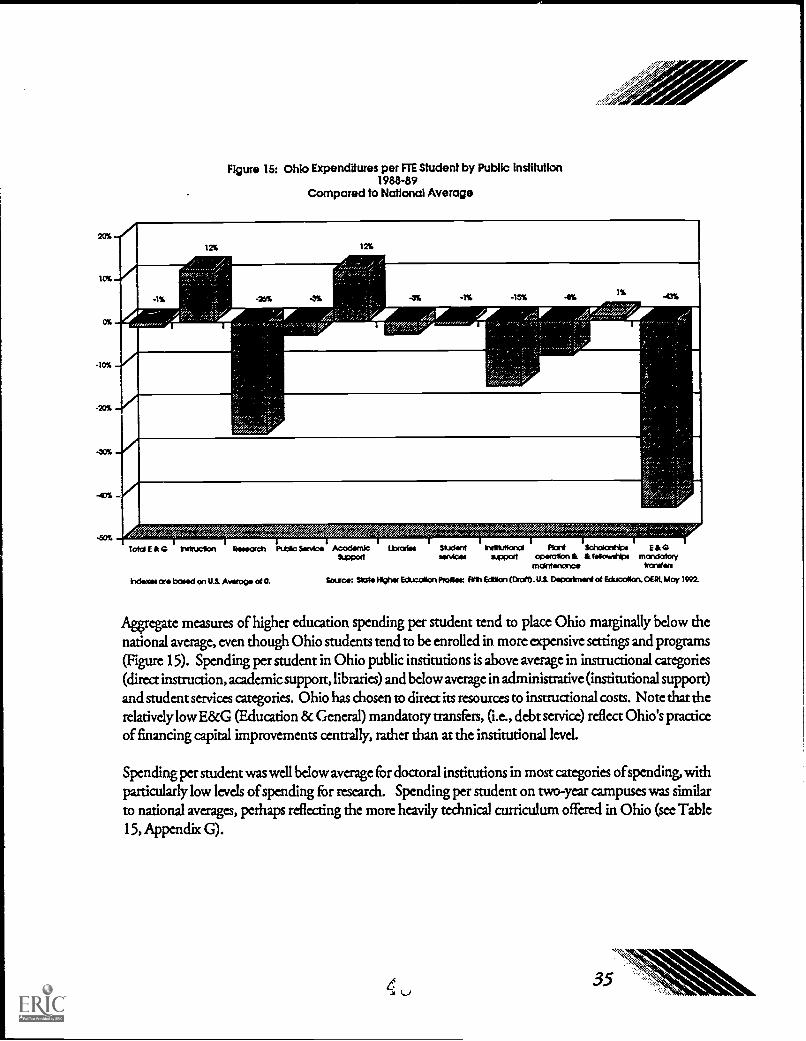
01d r '-:IY f,',/,V .e,, ,-;/./r ,r Jr .,-//
.,,,,,,
P
sa.
- I f
.
0,C,72 .......................................................................................................................... ';',''''',K'ZI",r''`'".
....in, 1.
", A.'.1,5;,,
F. ..1k. v. 0 . .1 II ID 0 : pa. 4 . 4 4 ID 0 a
. y_t 0 A . ".
!- 0_ I 1 1 1 1 .
.. . 0 . I.
I 1 V . i_p j_
P. I IA w
OIL. A I1
}
, '
V
1 A 141.
1 1
.. ...
I I I
4 0 a g
k I
4 .I .. 1 r
wee 1 S_D

10.00%
0.00%
-10.00%
-20.00%
-30.00%
-40.00%
-50.00%
Figure 16: Ohio Percentage In Relation to Regional Average, Doctoral GrantingInstitutions
Average FTEEnrollment
State SupportPer FTE
Total AdministrativeEducational ExpendituresExpenditures Per FTE
Data Compied nk, !chn Minter Associates from U.S. Department of Educatbn dcrta
Additionally, the 1988-89 data for 13 contiguous states show that total expenditures per student in doctoralgranting institutions were 26% bclowthe average ofthe other states, administrative expenditures perstudent
were 33% below the average, and state support per student was 41% below the average (Table 16, Appendix
G).
Sr/ ffing patterns. Ohio colleges and universities reported that their single largest expenditure is personnel,representing on average about 80% of their operating budgets. The rate of growth of administrative andsupport staffhas exceeded the rate ofgrowth in faculty and students (Table 17, Appendix G). College anduniversity task force reports cited many reasons for the increases in administrative costs, which aresummarized in the section of this report on 'cost drivers'.
3. Faculty compensation was readjusted.
While inflation-adjusted compensation of faculty and administrators grew at high rates nationally and inOhio in the early 1980s, it grew more slowly than compensation o fpeople with similar backgrounds outsidethe academy. Faculty salary increases were needed to offset precipitous declines in the 1970s. (Today'sfaculty salaries are still below 1970s adjusted purchasing power.)
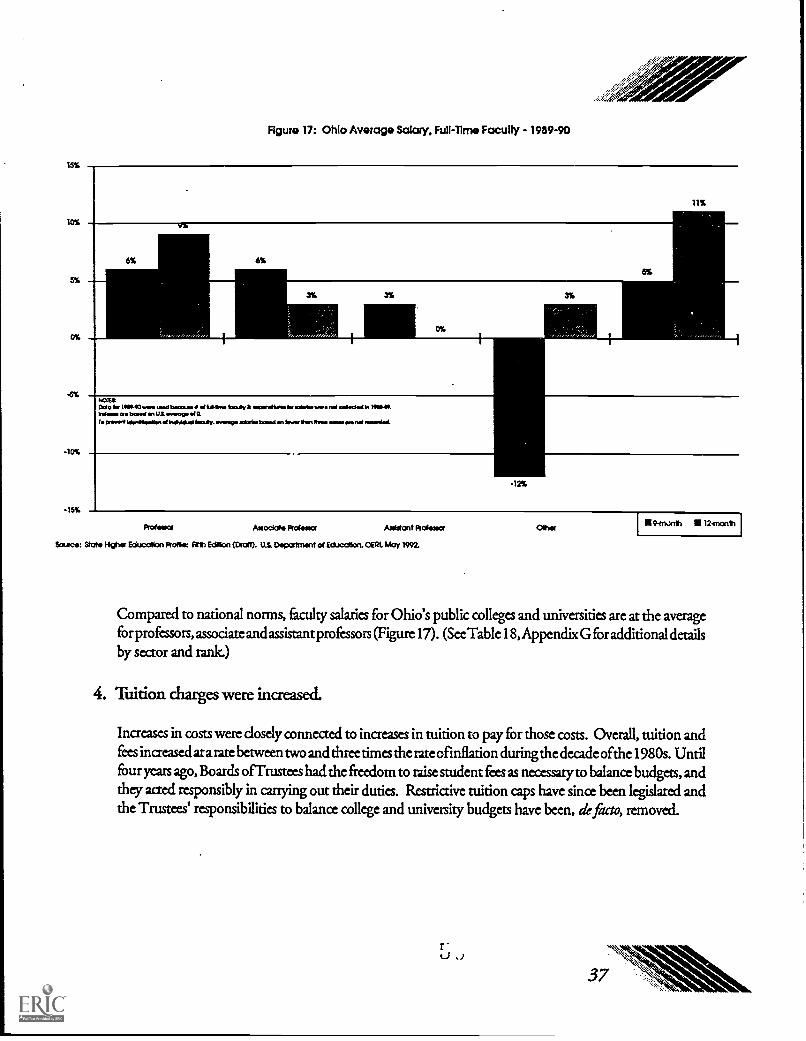
15%
10%
5%
0%
-10%
-15%
Figure 17: Ohlo Average Salary. Full -lime Faculty - 1989-90
11%
6% 6%
5%
3%
0%i:,.. ,,,,,,,,,,,,,,
3%
I
1401EtDole Int 19111101.re toed borax. of UMW* *molly& opendiureskomIshaymnnol aged.' In HMV.Ind.. se bawd an US mownellTo IndOskol Inosay. *rowworentiden~nn et women main Ismid an limn**mn err monist wraeodet
-12%
Professor Associate Professor Asistant Professor Ober 9-tri.inti 12-criontt
Soma: State Haber Education ProtliK Fifth Edition (Dtcel). U S. Depairnont of EiLication.OERL May 1992.
Compared to national norms, faculty salaries for Ohio's public colleges and universities are at the averagefor professors, associaxe and assistant professors (Figure 17). (SeeTable 18, Appendix G for additional detailsby sector and rank)
4. Tuition charges were increased.
Increases in costs were closely connected to increases in tuition to pay for those costs. Overall, tuition andfees increased at a rate betvveen two and three times the rate ofinflation during the decade ofthe 1980s. Until
four years ago, Boards of Trusters had the freedom to raise student fees as necessary to balance budgets, andthey acted responsibly in carrying out their duties. Restrictive tuition caps have since been legislated andthe Trustees' responsibilities to balance college and university budgets have been, de facto, removed.
5. Cost containment strategies were developed.
The strategies most commonly used during the 1980s to control costs were improving the use oftechnology, increasing the use of part-time facility, reorganizing the administration, cutting budgetsinstitution-wide, deferring maintenance, establishing cooperative programs, and eliminating academicprograms. Increased use ofpart-time faculty, delayed construction, and institution-wide budget arts werereported to have had the greatest impact on the ability to control costs.
Colleges and universities instituted various management procedures during this time period, such asimproved/automated budget processes, strategic planning, management information systems, use ofoutside consultants, and external budget reviews. (See Appendix F for sample cost-cutting strategies usedin Ohio's colleges and universities.)
Cost Drivers
The campus level managing for the future task forces provided us with specific causes within theirinstitutions and at the state level for rising costs. We also included some cost drivers we identified from a state-level perspective. Examples include:
1. Administrative Steng
Expanding services and mission. Each college and university has triedto meet increasing demands forservices from students, alumni, faculty, communities, and state and federal governments while federaland state higher education resources decline. Many of these expanded services are mandated withoutthe resources to carry them out. This has resulted in what some have called "mission drift" extendingservices and resources beyond the functional mission of the institution.
Sustaining and enhancing quality. Many of the campuses have sharpened their focus and redirectedresources to build "centers of excellence programs that are recognized as the best in the country or,in some cases, the world.
Meeting the needs ofa changing student population. Even though a college - preparatory curriculumhas been in place in Ohio high schools since 1981, approximately 20% of the college freshmen whoenter directly from high school are placed in remedial mathematics and English. Almost three-fourthsof the adult students enrolling in college need some developmental or remedial assistance. The smallclass sizes, tutorial assistance, and learning laboratories needed to improve the academic abilities ofthesestudents drive up institutional costs.
Staying currentwith technological change. Computer hardware and software becomeobsolete almostwhen they are installed. Sophisticated laboratory equipment for science programs, research and health
5
related fields must be current and adequately maintained. Also, equipment used in technical programsmust be at the cutting edge to represent that used in industry. Staying current, both in terns of
technology and the staff to operate the equipment, is costly.
Responding to mandated reporting requirements. Mandated compliance reports have escalated overthe last several years, particularly reporting requirements ofthe following federal legislation:
Resource Conservation and Recovery Act (environmental regulations).Rehabilitation Act of 1973, Executive Order 504 (educational services and programs for thedisabled).American Disabilities Act of 1990 (additional requirements to serve the needs ofthe disabled).The Immigration Reform and Control Actof 1986.Title V ofthe Federal Anti-Drug Abuse Actof1988 and the Drug-Free Schools and CommunityAct Amendments of 1989.
The Student Right-to-Know Act.The Campus Crime Act.
Examples ofsome state reporting requirements include:
Court-ordered child support payments remitted to courts, and reportingofchanges in income.Earnings records subpoenaed for Domestic Relations Courts when they are also on file at the OhioBureau ofEmployment Services.Refiling of specific information requested by the Civil Rights Commission when it is alreadyreported yearly to the Commission.Filing Selective Service registration status ofmale students.
Raising additional revenues. Staff have been added and funds expended to raise revenues throughexternal grants and contracts, endowments, ancillary services and local tax levies.
Maintaining adequate facilities. Renovations, repairs and general maintenance ofthe campuses werecurtailed in the 1980s when funds had to be diverted to protecting the academic core during the lastrecession. Only in the last five years have the campuses begun to catch up on deferred maintenance.
Protecting the health and safety ofstudents, faculty and staff~ A variety of campus safety and securityprograms and mandated health education programs and services (e.g., prevention of substance abuseand sexually transmitted diseases) have been added in recent years.
Engaging in increased litigation. Campuses have been facing added legal costs due to contractualobligations, costs associated with collective bargaining, and an increasingly litigious society.
Supporting inter-collegiate athletics. The costs associated with intercollegiate athletics have risen asa result of competitive aspirations of university and college supporters and federal requirements to
provide equal access to sports programs by men and women. Athletic-related revenues are ofteninsufficient to cover the cost ofthe entire intercollegiate athletics program and student fees are often used
to offset those deficits (Table 19, Appendix G).
2 Faculty Productivity
In Ohio, over the past ten years faculty time devoted to teaching and student advising has decreasedsomewhat, while time devoted to research has increased (Fable 20, Appendix G). Faculty course sectionsassigned each term have not changed in the aggregate, but the average "student credit hours taught" (credithourvalue ofthe course times the number ofstudents enrolled in the course) has decreased by 10% (Fable21, Appendix G). This would indicate either that faculty are teaching courses with fewer students than inthe past and/or they are spending their time on the research and service contributions that make up thebalance of their work assignment.
Compared to national norms, however, time spent on teaching in Ohio's colleges and universities remainsslightly above average, and time devoted to research and service is slightly below average. This reflects thehistorical emphasis in Ohio on undergraduate education, and a relatively recent (last 15 years) emphasis by
the universities on graduate education and research.
Misconceptions exist as to the value of research for teaching programs and the general financialsupport of colleges and universities. Externally funded research pays faculty and staff salaries andprovides indirect costs to support the overall research efforts of the faculty member's department oruniversity. The funds recovered from indirect costs enable universities to recruit outstanding facultywho add to the undergraduate teaching effort and play a major role in graduate education.
It is at the graduate level where students receive their major experience in the laboratory setting. Inaddition to the traditional scientific laboratory, research may occur in other settings such as farms,hospitals, offices,Ilbraries, or industrial shop floors where everyday problems are encountered. Thus,applied research is important to the quality of education on campuses and is often a component ofthe assigned workload of faculty.
In an effort to find out ifteading and research responsibilities offacultywere in balance, we commissioneda special committee to study the role of faculty and the factors that contribute to their work load. TheCommittee found that faculty workload in Ohio mirrors national norms generally, but there was notenough data to determine if the patterns were consistent from campus to campus. The Study Committeeindicated that institutional missions and reward systems were the main determinants of how faculty timeis assigned at the departmental or institutional level. The E:cecutive Summary ofthe Committee's full reportis induded in Appendix H.
rer
t)

3. State-level Policies and Procedures
Our task force members, especially those from business and industry, were astonished at the amount ofgovernment regulation with which colleges and universities have to contend. We focussed on several state-level policies or procedures that were driving costs up on college and university campuses, induding thefollowing:
Debt on capital construction projects. In the 1993 operating budget for higher education, debt servicefor capital projects already in existence will total $299 million (16.1%) ofthe nearly $2 billion total foroperations. State-supported physical plant operating allowances are expected to total $293 million. Thetotal scope of these two aspects of higher education capital facilities, therefore, is about $592 million(Tables 22 through 24, Appendix G).
Debt service has doubled in the last decade as a percentage of the operating budget. Thegrowth is attributable to several causes:
(1) Size of the overall physical plant that needs to be renovated and maintained;(2) Increase in the number of community projects supported in the higher education capital
budget;(3) Added cost to projects not completed on time or within the original budget;(4) Higher education bonds have not yet begun to mature (each new bond sale simply adds
to debt service costs); and(5) In 1980, the state decided to reduce future borrowing costs by selling 15-year bonds
rather than 25 -year bonds. This required increased principal payments in the 1980s, butwill pay off in lower interest costs in the late 1990s.
Research facilities and laboratory space have been the fastest growing capital expenditures, a factorjudged important in attracting faculty and students to Ohio institutions because of the quality ofresearch facilities available. At the same time, however, additional dassroom space is needed for thoseinstitutions, particularly community and technical colleges, which have had substantial enrollmentgrowth over the past five years.
The current budgeting system for higher education facilities is centralized. Debt service costs for allprojects authorized in the capital bill for higher education are funded from a single line item in thestateoperating budget. Funds to operate and maintain higher education facilities are allocated to institutionsbya formula based on square footage. As a result, the costs of building, renovating, and operating highereducation facilities are made at a state level rather than at an institutir-741 level. This is in contrast togeneral experience in higner education, which has shown that decisions madeat an institutional level,with the institutions bearing the responsibility for and enjoy;ng the benefits of those decisions, providefor much greater efficiency.
Capital design and construction process. Capital design and construction projects for statecommunity colleges and universities must be deared throughthe State Architect's Office for approval
and contracting. Over the past several years, this process has been so slow that projects have had to be
extended in time and in cost, resulting in millions ofdollats spent unnecessarily. The Ohio Department
of Administrative Services is redesigning the process to be moreefficient and effective.
State personnel policies that prevent necessary reductions instaffi Several of the campuses reported
that state personnel policies are not flexible enough to allow forEzirand humane separation ofemployees
due to lack of revenues. Because the institutions are unable to extend health benefits or grant severance
pay to furloughed employees, they often keep them on the payroll until they are able to find otheremployment. In addition, employee salaries are often ratcheted upfrom one institution to another
through organized collective bargaining.
4. Program Duplication
From the time the Board of Regents was created (1963) until now, 57 public campuses have been
added to the original six state-assisted universities that were in place in Ohio. Several of thesecampuses existed as independent colleges prior to the designation as state universities. Thus, many
programs at the undergraduate, graduate and professional levels were "grandfathered," resulting inmultiple programs across the state within the same subject-matter field.
The Board of Regents was assigned the responsibility to approve all new degree programs in all public
and independent colleges and universities as a mechanism to ensure basic quality, demonstrate needfor the program, determine the impact of new programs on state resources, and to avoid unnecessary
duplication. And, while the Board has taken this responsibility very seriously, there has been adelicate balance between the duplication of programs already in existence and allowing developing
institutions to create new programs in response to the needs of their communities.
Program duplication is more of an issue at the graduate level than in undergraduate education.Associate and baccalaureate degree granting institutions need a wide array of programs to meet theneeds of their students and communities. There are some areas in the state, however, whereundergraduate institutions are located close to one another and unnecessary duplication has becomean issue for Board of Regents intervention.
Program duplication is not inherently bad. There are some cases where strong programs across thestate have provided a solid foundation for economic development purposes (e.g., chemistry). Thereare, however, some programs, particularly at thegraduate level, which are needed only on a statewide
or inter-state basis (e.g., Veterinary Medicine), some that are needed only on a regional basis (e.g.,Engineering, humanities programs), some that are needed at the local level (e.g., Business, Nursing,Education), and some that are needed within a university to help sustain undergraduate programs(e.g., graduate programs in English provide instructors for the many course sections at the freshman
and sophomore levels). Currently, there is no system in place to sort out among existing and proposedprograms where duplication is a strength and where it is unnecessary and which programs should beprovided only on a statewide or regional basis and which ones should be consolidated or eliminatedto create higher quality, a greater number of graduates, and to reduce costs.
Once new programs have been approved, the Board of Regents has no authority to revisit programsto determine if an existing program in one area of the state that may be of lower quality and providea smaller yield should be eliminated to make way for a new program which is judged to be of higherquality and more strategically located. As a result, the issue of "program duplication" is a recurrentone.
Much has been discussed about duplication of medical schools in Ohio or an excess number of M.D.graduates from Ohio's medical schools. Ohio's seven medical schools are an example of uniqueresources available to Ohioans located strategically across the state. Each medical school in Ohio islocated in - metropolitan area and provides health education programs and health services on aregional basis in association with other universities and colleges. However, the demand for physiciangraduates across the state and nation continues to be extremely high especially in all areas of primarycare and selected areas in subspecialty care.
Ohio's public medical schools enroll 85-95% Ohioans for their first-year Bars and through thespecial support from the Ohio General Assembly for primary care programs, have emphasized publicaccess to health care. However, both federal funding as well as limited state resources for primarycare have supported increased subspecialty education at the medical schools and their teachinghospitals. Recent decisions by Health and Human Services at the federal level have furtheremphasized subspecialty care by influencing reimbursement funding for subspecialty services at theexpense of primary care. Ohio needs an increasing emphasis on primary care as do other states inthe nation. Therefore, legislative action, both federal and state, is needed to support thisdevelopment.
Given the fact that many qualified Ohioans are still unable to enter an Ohio medical school becauseof competitiveness for first year positions, it seems unwise to limit access to the schools resulting inOhio's citizens having limited opportunities for entering medical education. Such reduction ofopportunities for Ohioans will result in their going out of state for their education or seeking theireducation in foreign medical schools. The unique facilities of Ohio's medical schools should be calledupon increasingly to play an active role in the health service programs that might be made availableto citizens of Ohio.
Ohio's regionalized system of medical education has been highly effective, but new developments ineducational technology and biomedical research as well as the expanded challenges presented by thecost of modern health care, makes this an appropriate time for the medical colleges to extend theirexisting collaborative efforts to a new, more active and more comprehensive stage. Expansion andcooperation can strengthen the graduate professional programs and all of health education.
43
5. Infective Use of Resources
Paying for the same services twice. Remediation ofcollege students who recendygraduated from highschool is costly and results in paying at the college level for something for which the schools should beaccountable. A decade's work on this problem by the Board of Regents and State Board of Educationhas resulted in some improvement, but 20% ofthe recent high school graduates still need remedial workin mathematics and English before they can continue successfully in their collegiate studies.
Co-located campuses. There are seven areas ofthe state where a university branch campus, which offers
the first two years of a baccalaureate program, and a technical college, which offers career trainingprograms, are located side by side on the same property. Each charges different fees and operates with
separate administrative structures and academic programs, but they both serve similar types ofstudents.As these campuses have evolved, the e. have been some attempts to share facilities, staff and programs,but over the years competition and conflict have hampered their collective ability to serve the diverse
needs of their students and communities.
Because of mission differences of the two institutions, the technical college responds primarily to theneeds ofthe community, while the university branch campus responds primarily to the outreach needsof the university. The technical college is separately governed and can respond rapidly to thecommunity; the branch campus is governed by the university, and response time is often slowed bychain of command.
We learned ofcost savings that could result with the elimination ofduplicative administrative fractionsand academic programs that exist between the shared campuses. More importantly, however, welearned that significantly more students could be served in the seven communities if affordable,accessible, comprehensive programming were available on these shared campuses.
Adult job-training. For at least a decade there has been growing overlap in adult education and trainingservices provided by the state's two-year colleges and area vocational schools. As high school vocationalenrollments have declined over the years the schools have tried to expand their markets to serve adults.Many of the vocational schools and technical colleges are located adjacent to each other where moreeffective use of facilities, equipment, and resources could be made through better coordination andassignment of responsibility.
Duplicative state and federal research assurances and compliance documentation. Colleges anduniversities receiving grants from federal and state agencies often have to submit two sets ofcompliancedocuments and assurances, as well as be subjected to state and federal monitoring, reporting, andauditing of the grant. Both processes often include the same information, but in a different format,creating added overhead costs.

Duplicative state and federal data reporting. The Ohio Board of Regents maintains a data base usedfor calculating the subsidy formula; the data are compiled from campus reports on computer tapes. Atthe sametime, colleges and universities are required to file similar datawith the Integrated PostsecondaryEducation Data System in the U.S. Department of Education. The two reporting formats are differentenough that two separate reports of the same data often need to be generated.
State monopoly of services. State law requires that the colleges and universities purchase the servicesofthe Auditor of State and the State Attorney General. These services are not always provided at a pricecompetitive with services the colleges and universities can purchase in their communities.
The facts illustrate that higher education in Ohio has received less federal and state support than thenational average, and that the students' share of the cost of their college education is significantly higherthan average. Yet, even with a large, expensive higher education structure, colleges and universities havebeen able to keep total costs consistently below average.
With the help of the college and university task forces, we have been able to identify many of thefactors at both the institutional and state levels that have driven up costs. Our recommendations for long-term cost-containment strategies follow.
r: -1
45 .
IV THE RECOMMENDATIONS AND CONCLUSIONS:
MANAGING FOR THE FUTURE
"If we can learn to anticipate the future better, we need not fear it. In fact, we can welcomeit, embrace it, prepare for its coming, because more ofit will be the direct outgrowth ofour ownciforts."
Joel Arthur BarkerFuture Edge, 1992.
On itz
Needed: A Higher Education System
It is clear from the evidence provided that the demand for higher education is increasingdramatically while the state's ability to adequately support its colleges and universities is declining. It isalso clear that acceptable quality levels are in serious jeopardy without adequate funding. The collegesand universities cannot be "everything to everyone". The Board of Regents, in consultation with stateelected officials and college and university leaders, needs to establish vision and priorities for the use ofstate dollars directed to higher education and to ensure student accommodation to the greatest degreepossible.
The state higher education system must be structured to achieve both economies of scale andqualities ofscale. While there may be short-term costs associated with the recommendations that follow,the long-term benefits will accrue from higher quality, productivity, efficiency and effectiveness inmeeting the educational needs of Ohioans. We believe the system must
1. Meet the diverse needs of students and optimize their achievement,
2. Assure excellence in academic programming,
3. Increase productivity and reduce costs,
4. Ensure accountability,
5. Strengthen leadership and management effectiveness, and
6. Secure resources to make higher education affordable.
In order to achieve these priorities, the Board of Regents should draw together all the strengths of thestate's public colleges and universities and create a system-wide strategy for theeffective deployment of
resources. The benefit to Ohio will be greater economic productivity, more responsible citizenship and
a better quality of life for its citizens.
Task Force Recommendations
I. Link state colleges and universities more electively to form a higher education system.
Ohio's higher education system is currently shaped as a loose federation of autonomousinstitutions, each trying to serve educational needs to the best of its ability. Neither economies norqualities of scale can be achieved at current funding levels. In order to more effectively serve the needsof Ohioans within a constrained resource environment, colleges and universities will need to functionas a system of higher education, with an appropriate division of responsibilities for particular types ofservice divided among the colleges and universities.
The most appropriate role for the Board of Regents would optimize its responsibilities for statesystem policy, planning and coordination with the campus trustees' responsibilities for local institutionalpolicies and operations within the larger system. In this leadership role, it is important that the membersof the Board of Regents represent the interests of all Ohioans, not just the interests of specific collegesor universities or regions of the state.
We recommend that the Ohio Board of Regents:
1. Develop a statewide strategic plan for the higher education system which addresses themission, goals, objectives and expected results for higher education in Ohio as a system,in consultation with elected officials, college and university leaders and communityrepresentatives.
2. Adhere, in developing this statewide strategic plan, to the following priorities for the useof state higher education funding:
e:4; '
6 ve
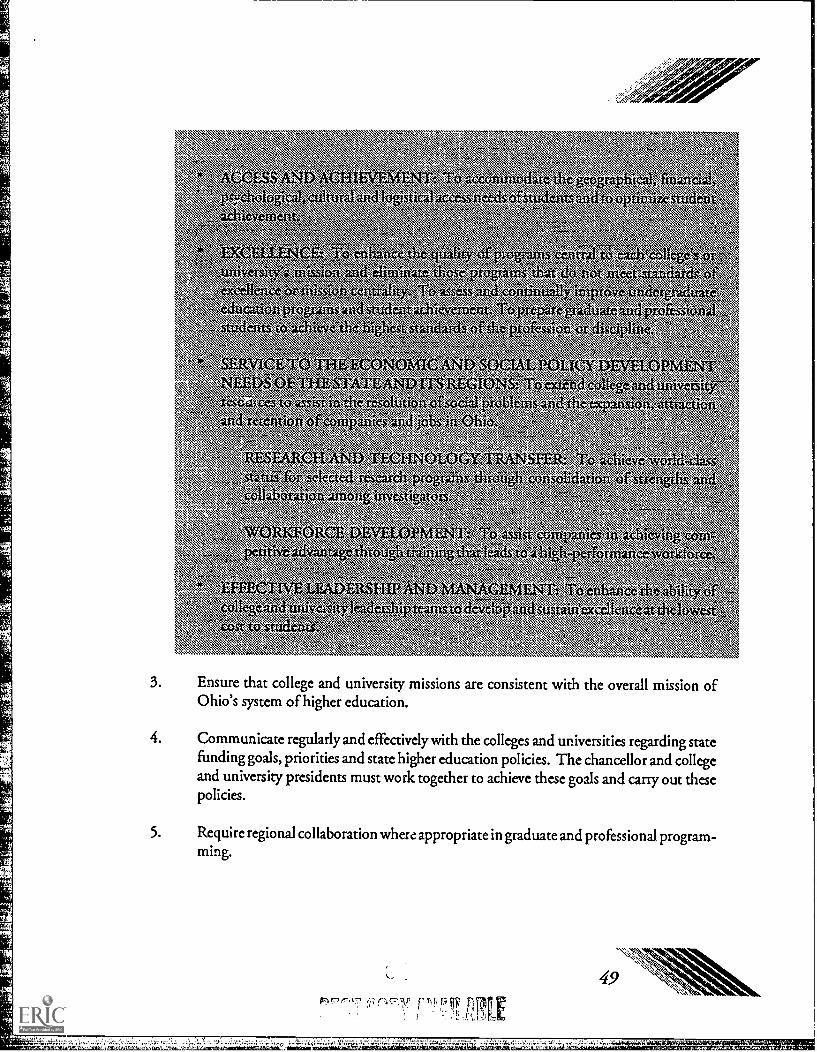
04V4k°.Y..d/O,P
>,Vz\ oparl'iN
h&a.s0: Zinn 1:3,XWttpaiv:"W
.n..,attrAcraizin.$s:k
1144tite4
m,x5k'.. it l,-rtvu ''\..\'le%twb,,.
iflartcfto
,. 4..::\Z: N kiko.,:c ..,..
"N..,:N:IVAU.%s N.
'. .k, 'sc, N.
.sN'tskAsssk,:::.: \ '::aNk...... ,*:.
"va-".;
:Nk..Vaimtwa,
3. Ensure that college and university missions are consistent with the overall mission ofOhio's system of higher education.
4. Communicate regularly and effectively with the colleges and universities regarding statefunding goals, priorities and state higher education policies. The chancellor and collegeand university presidents must work together to achieve these goals and carry out thesepolicies.
5. Require regional collaboration where appropriate in graduate and professional program-ming.
R? (i;r-irzT frFALE
6. Require the medical schools to work together to accomplish the following:
a. Increase the emphasis on education in primary care, and residency programs inFamily Practice, Internal Medicine and Pediatrics.
b. Improve health care through increased cost effectiveness, enhanced quality, andimproved access. See Appendix I for an action plan developed by the deans ofOhio's medical schools.
c. Develop regionalized programs in association with other public agencies in Ohiosuch as the regional Health Departments, Mental Health Departments, Medi-care/Medicaid Health Services, and other statewide programs which mightutilize resources in medical schools.
II. Redesign the higher education structure to address six statewide priorities.
PRIORITY 1: MEET THE DIVERSE NEEDS OF STUDENTS AND OPTIMIZE THEIR ACHIEVEMENT.
The higher education structure must be redesigned to ensure enrollment and achievement of morestudents. State resources need to be deployed in the most effective way to achieve student success.
We recommend that the Ohio Board of Regents:
1. Work with the State Board of Education to strengthen the college preparatory require-ments and to reaffirm to all school boards, school administrators, teachers and counsel-ors, and parents, the expectations for admission to universities.
2. Require all Ohio high school graduates, by the year 2000, to demonstrate completion ofa college preparatory or technical preparatory curriculum for admission without condi-tions to community and technical colleges.
3. Increase the participation and achievement of economically disadvantaged and minoritystudents at each college and university, and at each level of education (e.g., associate,baccalaureate, masters and doctoral levels).
6 ,,)
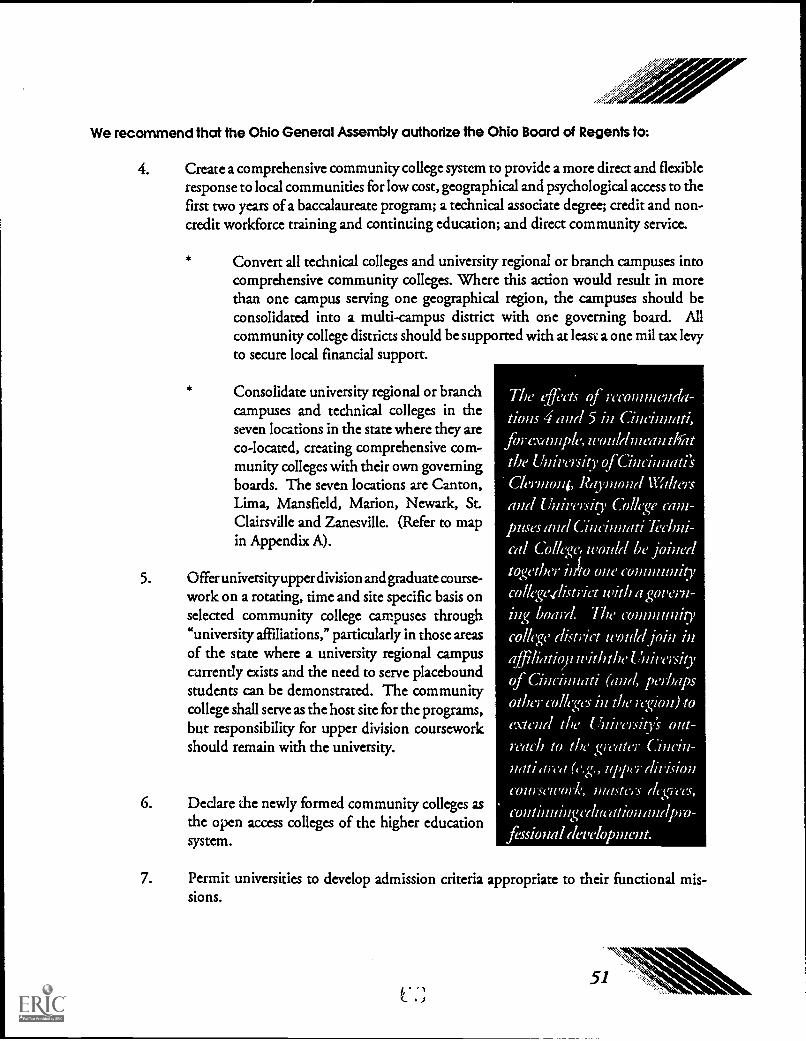
We recommend that the Ohio General Assembly authorize the Ohio Board of Regents to:
4. Create a comprehensive community college system to provide a more direct and flexibleresponse to local communities for low cost, geographical and psychological access to thefirst two years of a baccalaureate program; a technical associate degree; credit and non-credit workforce training and continuing education; and direct community service.
Convert all technical colleges and university regional or branch campuses intocomprehensive community colleges. Where this action would result in morethan one campus serving one geographical region, the campuses should beconsolidated into a multi-campus district with one governing board. Allcommunity college districts should be supported with at least a one mil tax levyto secure local financial support.
Consolidate university regional or branchcampuses and technical colleges in theseven locations in the state where they areco-located, creating comprehensive com-munity colleges with their own governingboards. The seven locations are Canton,Lima, Mansfield, Marion, Newark, St.Clairsville and Zanesville. (Refer to mapin Appendix A).
5. Offer un ivers ity upper division and graduate course-work on a rotating, time and site specific basis onselected community college campuses through"university affiliations," particularly in those areasof the state where a university regional campuscurrently exists and the need to serve placeboundstudents can be demonstrated. The communitycollege shall serve as the host site for the programs,but responsibility for upper division courseworkshould remain with the university.
6. Declare the newly formed community colleges asthe open access colleges of the higher educationsystem.
The effi'as of recommenda-tions 4 and 5 in Cincinnati,
for e.vtmple, u,ortl d mean th;tt
the Univeisit-yofCincinnati'sClermont, Thtymond nitersand University College (WM-
plISCS and Cincinnati ji'ehni-
cal College would he joinedtogether into one communitycollege.distriet with a gor,ern-
ing boaid The amtmunitycollege district would join inaffiliatiopu,iththel:Tniivrshyof Cincinnati (and, peihapsother colleges in the izgion) to
extend the tinireisitvs out-read] to the givate Cincin-nati area (e.g., upper divisioncoursework, mthiers dtgiees,continuingegutationandpro-fessional dawlopment.
7. Permit universities to develop admission criteria appropriate to their functional mis-sions.
51
8. Assign primary, but not exclusive, responsibility for developmental and remedialeducation to the community colleges.
9. Strengthen the articulation and transfer process so that all credits from any state highereducation institution shall be accepted by any other.
PRIORITY 2: ASSURE EXCFI i FNCE IN ACADEMIC PROGRAMMING.
The redesign of higher education must focus on academic excellence.
We recommend that the Ohio General Assembly authorize the Ohio Board of Regents to:
1. Refocus college and university missions as necessary to carry out the mission, goals andobjectives of the state higher education system. Functional missions should build oncurrent institutional strengths and eliminate unnecessary duplication. The institution'sfunctional mission will then be the basis for its trustees, presidents and staff to defineadmission criteria, programming, faculty assignments and rewards, and determineinstitutional effectiveness.
2. Develop mechanisms to strengthen existing campus level reviews of academic programsand to reinforce them with state-level consideration of effectiveness and quality. Statelevel processes must be developed in a way that minimizes the need for additionalreporting and expanded bureaucracy. Instead ofa comprehensive review of all programs,the emphasis should be focussed only on areas of demonstrated concern.
3. Eliminate or consolidate programs where there is unnecessary duplication, or the yieldis too small for continued high quality.
We recommend that the Ohio Board of Regents:
4. Identify uniform criteria from the quality standards ofthe North Central Association andother appropriate accrediting agencies, and require colleges and universities to measureand report institutional effectiveness, based on those criteria, related to mission, goalsand objectives in the areas of teaching, research and service.
5. Seek restoration of funding to provide incentives for quality improvement, such as theSelective Excellence Programs.
6. Work with the State Board of Education and colleges and universities in efforts toimprove the teaching and learning in schools, most particularly those school districtswith consistently high numbers of students needing remediation at the collegiate level.
7. Work with the State Board of Education to ensure that the human and material resources
of higher education are accessible to schools in a manner that promotes quality andopportunity throughout the levels ofeducation, from kindergarten through graduation.
8. Ensure that each college or university reaffirms the importance of undergraduateeducation as part of its institutional mission and reports on outcomes in an annual
institutional effectiveness evaluation.
9. Develop strategies to encourage instructional innovation and efficiency in undergradu-
ate education and to pilot improvementof instruction through the use oftechnology and
more effective deployment of teaching personnel.
10. Reaffirm the importance of research to enhancing teaching, promoting economicdevelopment, bringing eminent scholars to the state, and making it possible for colleges
and universities to achieve their missions.
11. Continue to attract world-class scholars and research faculty through Ohio's researchefforts (that have added to the economic well-being ofthe state by attracting new dollars),
and elevate the national and international standing of Ohio's universities and colleges.
12. Recognize, as part ofthe institutional mission review, that The Ohio State Universityand
the University of Cincinnati arc the state's comprehensive research institutions withgraduate education programs competitive at the national and international levels.
13. Establish, as part of the institutional mission review, selected centers ofresearchstrength
on other university campuses (e.g., polymer sciences at the Uni 'ersity of Akron).
14. Work carefully with the Ohio Science and Technology Council to focus researchpriorities on those areas with the greatest potential benefits to the state and its regions(e.g., economic development, reducing medicaid costs, curing diseases), and drawindustry and university research strengths together to address those priorities.
15. Collaborate with the Department of Development to develop incentives for colleges anduniversities to conduct research and development activities designed specifically to
advance the economic competitiveness of the state.
16. Encourage colleges and universities located in metropolitan areas to assume greaterresponsibility for applied research and development on social and economic issuesimportant to the region.
17. Work with the Depastment of Development to promote Ohio's two-year collegeworkforce training network, Enterprise Ohio, and its member institutions, as thepreferred mechanism for the delivery of customized training in local communitiesthroughout Ohio. This would involve consolidation of customized training by voca-tional schools and two-year colleges into one delivery system coordinated by the college,or jointly, as in the case of the Tri-County Training Consortium in Piqua, Ohio.
PRIORITY 3: INCREASE PRODUCTIVITY AND REDUCE COSTS.
The higher education redesign should result in a quality product for an affordable price.
We recommend that the Ohio Board of Regents:
1. Hoid administrative costs down by working with each college and university to establishgeneral "cost-to-inflation" benchmarks. The campuses should use some, if not all, of thefollowing strategies if they have not already implemented them:
a. Adopting a continuous quality improvement approach to administering theinstitution, in order to reach the highest level of quality with the lowest cost.
b. Streamlining organizational structure, creating greater flexibility and respon-siveness to the changing institutional environment.
c. Implementing energy conservation plans.
d. Developing cost-effective employee health care plans, in collaboration wherefeasible with other colleges and universities or with other relevant entities (e.g.,employers in the region, the state of Ohio, etc.).
c. Establishing risk management/property insurance programs in collaborationwith other colleges and universities (or on a statewide basis).
f. Increasing regional collaboration for purchasing, computing, mailing and otheroperations where cost savings will result.
g. Privatizing campus operations where appropriate.
2. Share best practices and cost containment ideas among colleges and universities.
40..4,01"
3. Ensure that faculty time is allocated in the most productive manner, consistent withinstitutional and departmental missions. To accomplish this, the Ohio Board of Regentswill endorse the recommendations of the Study Committee on Faculty Workload(Appendix H) and require each public college and university to:
a. Develop an institutional faculty workload policy which defines the individual orgroup performance standard for each academic area and includes procedures forhandling cases where the standard is not achieved, and specifies who hasauthority to assign courses and the times they shall be taught.
b. Develop and implement a faculty performance evaluation and appropriatereward system consistent with institutional mission, goals and objectives. Thefaculty performance standards must be based upon relevant, objective, quanti-tative and qualitative evaluation criteria.
c. Establish an annual performance evaluation mechanism to measure actualoutput or outcomes and report actual results vs. expected standard (measure byindividual and/or group).
4. Direct the higher education system toward performance based contracts to maintainhigh continuing performance of all administrators and faculty. In order to accomplishthis, the Ohio Board of Regents should require colleges and universities to:
a. Employ a definition and application of tenure for all college and universityfaculty that focuses on protecting academic freedom. Tenure is not a lifetimeguarantee of employment, but it is a commitment to academic freedom.
b. Adopt flexible administrative and contractual approaches to tenure that do notresult in unconditional, guaranteed lifetime job security without the require-ment to meet the specified performance standards for productivity and effective-ness within the mission of the institution.
c. Establish time-limited contracts for tenured faculty who, in a post-tenure review,have been determined by the criteria established above to be non-productive andineffective.
5. Work in collaboration with other state agencies to reduce or eliminate the number ofduplicative and unnecessary state reporting requirements for grants and contracts. TheOhio Board of Regents should convene an inter-agency task force, including particularlythe Department of Administrative Services, Secretary of State and State Auditor'sOffices, to identify ways to eliminate duplicative and unnecessary state reportingrequirements for grants and contracts.
6. Work in collaboration with the Ohio DepartmentofEducation to consolidate, by 1995,
the higher education data reporting for the Integrated Postsecondary Education Data
System (IPEDS) and the Board of Regents. This will require that the Ohio GeneralAssembly appropriate funds in the 1993-95 biennium for the redesign of the Board of
Regents' Uniform Information System to accorrur-date the data needs of the fundingformula, to consolidate state and federal higher education data reporting, and to build
a database to be used for planning and system effectiveness purposes.
7. Seek legislative exemption from some state employment policies and develop andimplement a human resource management system with appropriatedifferences from the
State's Civil Service Classification System. The Ohio Boardof Regents should convene
a task force to determine specific state employment policies and procedures for whichexemptions for colleges and universities should be sought, and develop model human
resourcemanagement systems for colleges and universities that have at least the following
assurances:
Employees are protected against arbitrary dismissal.
Hiring is done on the basis of qualifications not political affiliation.
Employees are guaranteed periodic and written performance evaluations.
The rights of employees to bargain collectively are protected.
8. Seek legislation to permit institutions to create early retirement programs for specific
components of the campus that have been identified for reduction or elimination andto permit basing priority for early retirement on length of service with the institutionrather than with the retirement system as a whole.
9. Encourage the continuation ofthe cooperative efforts ofthe Department ofAdministra-tive Services, Division of Public Works and the college and university architects andfacility management personnel to establish a more appropriate balance between thecentralization /decentralization of the facility design and construction process andthereby, to provide for more local involvement in the administration of projects asdetermined to be appropriate on an institution-by-institution basis.
This can be best accomplished by a system that involves university architects and facility
management personnel in various aspects ofthe administration of individual projects or,where criteria is met, delegation of authority for complete local administration ofindividual projects. This would include the delegation of the selection of architects,
design document review, etc. to those institutions having demonstrated the willingnessand capability to do so. It would be the responsibility of the Department of Adminis-trative Services, Division of Public Works, to establish criteria, delegate authority, andto monitor performance based on clear, objective criteria.
These criteria might include:
Evidence of trained, capable registered architectural and engineering staff:
A formal procz,ss to assure open competition for architects, engineers and contrac-tors.
Evidence of compliance with all state requirements regarding minority set aside,prevailing wage, safety and environmental regulation.
Assumption of responsibility to complete projects on time and within budget.
Mechanism to report to the state on compliance.
In addition, the Task Force supports the recommendations of the Governor's Opera-tions Improvement Task Fo rce and others regarding the elimination of redundant reviewby the Controlling Board on facility design and construction projects.
10. Support a pilot project to assess the value of the "single prime contractor" approach toconstruction projects in lieu of current "multiple prime contractors" approach.
11. Seek legislative authorization to allow colleges and universities to contract locally withauditing or legal firms rather than use the centralized services ofthe State Auditor's Officeor the Office of the Attorney General.
PRIORITY 4: ENSURE ACCOUNTABIUTY.
In the redesign of higher education, college and university trustees as well as the Ohio Board of Regentsmust be held accountable to their constituents for the results ofthe teaching/learning process. Ways mustbe developed to measure quality and productivity.
We recommend that the Ohio Board of Regents:
1. Require each college and university to inform the Ohio Board of Regents how each ofthe following will be measured:
* Quality of classroom teaching and courses.
Quality of service in areas such as registration, admissions, etc.
* Student achievement.
Faculty workload induding number of students (H 1 Es) taught per course per term(semester, quarter); average dollars per faculty from grants, contracts, and awards notcounting those from the Ohio Board of Regents; and hours per week spent onconsulting or private endeavors (collateral employment).
* Evaluation of faculty performance.
* Impact the granting of sabbaticals has had on teaching and/or scholarship/research.
2. Require each college and university to develop a plan and timetable of implementationof those items specified in #1 above. The plan should be available by December 1993,and the measures implemented by September 1994.
3. Require that all student charges for intercollegiate athletics be separately identified, andthat all expenditures and sources of revenues for intercollegiate athletics be identifiedexplicitly in the institution's annual budget report.
PRIORITY 5: STRENGTHEN LEADERSHIP AND MANAGEMENT EFFECTIVENESS.
The redesign of higher education should assure that those individuals charged with the responsibility andaccountability for the colleges and universities have the authority and expertise to carry out their charges.Recommendations:
We recommend that the Ohio General Assembly authorize the Ohio Board of Regents to:
1. Identify with clarity the responsibilities and expectations of college and universitytrustees and publish a trustees handbook. The Board of Regents and chancellor shouldwork with trustees and presidents to develop the handbook of trustee expectations andto ensure that all trustees are oriented to the local institution (by the college or university)as well as the state higher education system (by the Ohio Board of Regents). Boards ofTrustees should annually evaluate their own effectiveness and provide a summary to theirappointing authorities.
We recommend that the Ohio Board of Regents:
2. Convene leadership conferences and issue forums to broaden the participation ofcollegesand universities in statewide higher education system planning and coordination.
3. Document and communicate regularly the effectiveness of Ohio's higher educationsystem to government leaders and the citizens of Ohio. To do this the Board of Regentswill work in consultation with the higher education community to develop goals,objectives and suitable measures to be used statewide to document the effectiveness ofthe higher education system.
4. Encourage colleges and universities to communicate the results of their institutionaleffectiveness assessments more widely to those whom they serve.
PRIORITY 6: SECURE RESOURCES TC MAKE HIGHER EDUCATION AFFORDABLE.
In light of the issues raised in this report, the higher education system and the state funds that supportit need to be positioned to meet the needs of the students and the state in the long term.
We recommend that the Ohio Board of Regents:
1. Assure that state monies are directed to higher education system priorities in both theoperating and capital budgets for the years ahead.
2. Ensure consideration in the higher education budgeting process the implications for thefollowing policy issues:
a. Whether current state funding mechanisms provide appropriate incentives toencourage the accomplishment of institutional missions with the most efficientuse of space, including the determination of whether centralized budgeting ofdebt service and the allocation of plant operation and maintenance funds on asquare footage basis create incentives to invest inappropriately in additionalspace.
b. Whether the state should continue to protect institutions from the financialeffects ofenrollment decline through a formula that distributes funds on the basisof historic (base) enrollments when those are higher than current enrollments,or whether state resources should follow current enrollments more closely.
c. Whether the current enrollments that are used for the distribution of fundsshould continue to be limited to summer and fall enrollments only, or whetherthe use of enrollments from all terms would be fairer and less, subject tomanipulation.
11,
d. Whether enrollment growth should be funded on the same average cost basis asstable enrollments, or whether enrollment growth should be funded on amarginal cost basis, and for how long.
e. Whether the institutional financial audit process can be used to provide averification for the enrollments reported for subsidy purposes.
f. What provisions should be made to protect institutions from the consequencesof resulting losses in formula allocations in the event that significant changes are
made to the formula.
What mechanism should be used to reward quality, retention, student successand the accomplishment of other state goals.
h. How the state will reconcile its need to see more of its citizens prepared througha program of higher education for successful employment with its inability toprovide a stable level of funding for core higher education programs. If fundingcannot keep pace with enrollment growth,what happens to the services providedto students as resources continue to be diluted? Should certain typesofnoncreditinstruction that are specifically designed to increase the skills of workers beeligible for state support? Where would the resources be found to prevent sucha step from diluting support even further?
3. Develop with the Office of Budget and Management formal guidelines concerning thetype of"community projects" that are eligible to be funded by the higher educationbondfund.
4. Provide incentives, or at least remove disincentives, in state funding policies andprocedures to encourage appropriate consolidation, merger, elimination, transfer orother reduction of unnecessary duplication or low priority academic programs.
5. Work in partnership with business, industry and community groups to secure additionalresources for student aid.
6. Continue to invest in the colleges' and universities' successes in attracting externalresearch dollars through the Research Challenge and Action and Investment FundPrograms. These dollars have led to major advancements in scientific knowledge as wellas very practical applications in the development of new products for the benefit of thepublic.
7. Continue to invest in the colleges' successes in workforce development through theProductivity Improvement Challenge Program.
Strengthen the higher education system leadership responsibilities of the Ohio Board of Regentswhile retaining college and university responsibility for campus policies and operations.
To accomplish this redesign, more errective planning and coordination at the state level is needed tocreate a higher education system. Campus autonomy should be preserved to the highest degree possible,especially at the campus operational level, but the Board of Regents must play a strong role in designinga more effective higher education system.
Recommendations:
1. Expand the Ohio Board of Regents' responsibilities to include:
* Setting statewide goals and objectives for higher education.
* Guiding the development of institutional missions to ensure the most effectivedeployment of resources.
* Eliminating unnecessary program duplication.
* Establishing statewide funding priorities.
Providing a framework for the debate of higher education policy issues.
Assuring that students receive the highest quality services possible.
The Board should exercise its new authority in dose consultation with the colleges anduniversities that make up the higher education system in Ohio.
2. Seek legislation charging the Board of Regents with responsibility to coordinate thedelivery of all adult postsecondary programs. This recommendation was included in therecommendations of the Governor's Task Force on Education, "Model for the Future:An Organization Study of the Ohio Department of Education," August 1991.

Conclusions
Our state-level Managing for the Future Task Force and the institutional managementcommittees have concluded that it is necessary for Ohio to:
1. Link state colleges and universities more effectively to form a higher education system;
2. Redesign the higher education structure to address six statewide priorities; and
3. Strengthen the higher education system leadership responsibilities of the Ohio Board ofRegents while retaining college and university responsibility for campus policies andoperations.
In our view, Ohfo's public colleges and universities have been managed efficiently given the factthat each institution has been trying to provide full services for the communities they serve. Presidentsand trustees have served Ohio well in managing to provide open access to students not always preparedfor collegiate-level work; improve the level of quality in programs, and serve the economic and socialdevelopment needs ofthe state and its regions. They have been able to do this at a cost below the nationalaverage, and with historically low levels of funding from the state. Student fees have taken up part of theslack, but cost-containment efforts on every campus have held student fees lower than they would havebeen if spending levels in Ohio were at or above the national average.
The universities, for the most part, have been trying to offer programs ranging from developmen-tal and remedial education through doctoral degrees and research. Community and technical collegeshave provided open access to their regions at the associate degree level and serve the immense job trainingneeds of those individuals already in the workforce. Our challenge, as a task force, was to find a way forthe colleges and universities to continue to achieve the access, quality, and efficiency standards expectedby Ohioans within what we believe will be a protracted period of limited resources.
We believe the greatest benefit to Ohioans will come in larger, overarching structural changeswithin each college and university as identified by their task forces and in this report. Each campus hasdemonstrated to us specific ways they have been reducing costs over the last decade; each is on a path tostreamline operations without loss of quality.
Our report has identified where we believe the strengths lie in higher education. The strengthsof the campuses must net be diluted in our attempts to reshape higher education. At the same time, webelieve those strengths provide a solid foundation for a more systematic approach to planning andcoordination, with the Ohio Board of Regents assuming a stronger leadership role. College anduniversity presidents and trustees need to work more closely together in a higher education system thatresponds more fully to the needs of all Ohioans while also having enough autonomy to carry out theeffective operation of each institution.
ddrrarP.
Responsibility for providing leadership in restructuring the system of higher education lies firstwith the Ohio Board of Regents and the college and university leaders, but this alone is not enough. Thestate's elected officials need to address where higher education fits among other budget priorities. IfOhio's goal is to produce more educated citizens, then the state of Ohio needs to support additionalfunding for growing numbers ofswdents on at least an equal footing with additional funding for prisonsand for Medicaid. Otherwise restructuring the system of higher education will expend a great deal ofenergy without reversing the decline in Ohio's ability to compete in a global economy.
We have examined the evidence and offer our recommendations to the Ohio Board of Regentsfor their consideration. Many of our recommendations will require support of the Governor and OhioGeneral Assembly in legislation.
Our recommendations are not short-term in nature. They will require careful consideration byOhio's government leaders, the higher education community, and industry, labor and communityleaders across Ohio. We urge that this process move deliberately and that implementation of therecommendations begin yet this year. We stand ready to assist you in any appropriateway.
63
AGOVOWLEDGMENTS
Our gratitude goes first to the college and university task force members who served ably and thoughtfullyin finding ways their institutions could more effectively manage for the future. For many it was their first in-depth exposure to the college or university and they came away from their experience with a new understandingof the strengths that exist in higher education.
Next, our thanks to the many who testified before our task force: bus incss, industryand community leaders;trustees; presidents; provosts and chief academic officers; and faculty. They informed our debate and shapedour thinking.
Finally, there are a number of individuals who contributedto the staffing of an undertaking this large, andwe appreciate the work that many have done to provide timely information and develop a finished product.Thanks, particularly, to Chancellor Elaine H. Hairston and her able staff, Vice Chancellors MatthewV. Filipic,William J. Napier and E. Garrison Walters for sharing their expertise, and to N. Jane Fullerton, Donna KKlabunde, Catherine L Routte, Wendy M. Merchant, and Cynthia L Saunders for handling the day-to-daytask force details. And to Vice Chancellor Ann H. Moore, our deepest appreciation for crafting our thoughts,at the direction of the Writing Committee, so carefully and skillfully into this final document.
N Victor Goodman, ChairmanManaging for the Future Task Force
BRUCE DOUGLASCHAIRMAN or THE BOARDUNIVERSITY OF TOLEDO
DISSENTING REPORT ON THECONCLUSIONS PRESENTED BY THE
MANAGING FOR THE FUTURE TASK FORCE
The Managing for the Future Task Force has examined ways in
which colleges and universities can sustain quality programs with
efficiency in the days ahead. In the areas of meeting student
needs, restoring funding for incentive-based programs targeted at
improvement, and the securing of resources to make higher
?ducation affordable the conclusions of the group are correct.
In these other areas, however, it's thought that the
recommendations should not be implemented for the following
reasons:
Proposal of strengthening the role of The Ohio Board
of Regents
Though it praises current operations of Ohio's public colleges
and universities in the ways they deliver high quality education at
less than national averages of cost and attributes that
accomplishment to the Ohio tradition of policy controlled by local
Board of Trustees, The Task Force is proposing to remove much of
the policy-level authority for these local boards. It's suggested
that we centralize several key policy and managerial functions for
1
higher education, such as responsibility for developing individual
institutional missions and for program discontinuance, by placing
these functions in the hands of The Ohio Board of Regents. This
proposal is contrary to the trend in government today (as well as
in the private sector) to delegate as much responsibility and
authority as possible to local management and to minimize control
by centralized bureaucracies that are often distant and
unresponsible to local needs.
The proposal.is contrary to The Task Force's own findings that
"responsibility for accountability to the constituents of each
institution belongs to the college and university Trustees and
Presidents." Such accountability is impossible unless these Boards
retain their responsibility and authority. The proposal for
centralization is in conflict with the recommendation for local
accountability.
One of the primary concerns, as stated in the report, is the
search for "the highest degree of efficiency during times of fiscal
constraints." Despite this need, The Task force's recommendations
will lead to increased costs. The Task Force does not consider the
recent history in other states that have gone through higher
education "system building." In every case, there has been an
increase in expenditures to support the centralized bureaucracy.
There is not one instance of centralization of higher education in
this country that has not resulted in significant and permanent
increases in costs at the central level. Such Increases are due to
the build-up of duplicative and repetitive bureaucratic functions.
2L.,

Rather than cost savings, the net result nationally has been
increased administrative costs which have drained the limited
resources available for instruction at the institutional level.
The Task Force report speaks of the need to require that
appropriate accountability mechanisms are in place at the campus
and says that the quality of classroom teaching and services in
student support areas; student achievement; faculty workloads;
evaluation of faculty performance will be measured. The increase
in the size of the bureaucracy and the concomitant costs will be
significant.
There is not one instance of a centralized Board developing a
great American university. Every great American public university
was developed by an individual Board committed to that institution
with its accountability to the public for the actions of the board.
Development of a two-tier higher education structure
Designation of The Ohio State University and the University of
Cincinnati as the only two "comprehensive research institutions" in
the State will unnecessarily result in a two-tier system which will
be invidious and destructive to other institutions and to the
economic future of the regions in which they are located.
A two-tier system will lead to differentials in institutional
support from the state for operations and capital based upon the
system rather than upon institutional needs. Such a process does
not lead to enhanced local quality but rather further
3

centralization of needed by distant services.
There is no indication that any of the four-year colleges and
universities in Ohio has ever aspired to the comprehensive state
role played by The Ohio State University in areas, for example,
such as agriculture. In addition, there is no indication that the
University of Cincinnati has ever played a comprehensive role
different than Ohio's other public colleges and universities.
Given such a history, it is questionable why such designations are
necessary or desirable.
The economic, social and cultural diversity of Ohio is rooted
in its geographical diversity. The Task Force proposes designating
two institutions with special responsibilities for all regions of
the state. This will inevitably lead to limitations on the ability
if local institutions of relate to and meet the needs of the
people, its commerce and industry and the institutions of the
region in which they are located. The Task Force did not fully
consider these regional impacts in making this proposal.
Designating two institutions with a special research role and
mission will reduce the competitiveness of the state's other
colleges and universities in the research and technology
marketplace. This will occur at a time when Ohio is most in need
of increasing its competitive position, not reducing it. The
citizens of Ohio's diverse geographic regions, outside of the
Columbus and Cincinnati metropolitan areas, will be hurt most by
this task force proposal.
4
Managing Construction Projects
Again, the management of construction projects at a local
level is a responsible and effective recommendation. The Task
Force acknowledges the significant increase in construction costs
due to the operations of the Department of Administrative Services'
slow, centralized bureaucracy. Unfortunately, The Task Force stops
short of proposing an institutional solution to a problem clearly
identified as resulting from centralization. For the highest
degree of efficiency and effectiveness in the use of capital funds,
individual institutions must be able to control financing and
construction, calling upon the DAS only if needed, on an ad hoc,
consulting basis. There's a parallel in the State's system of
issuing building permits which offers guidance.
B DM aschairman the Board
'!'
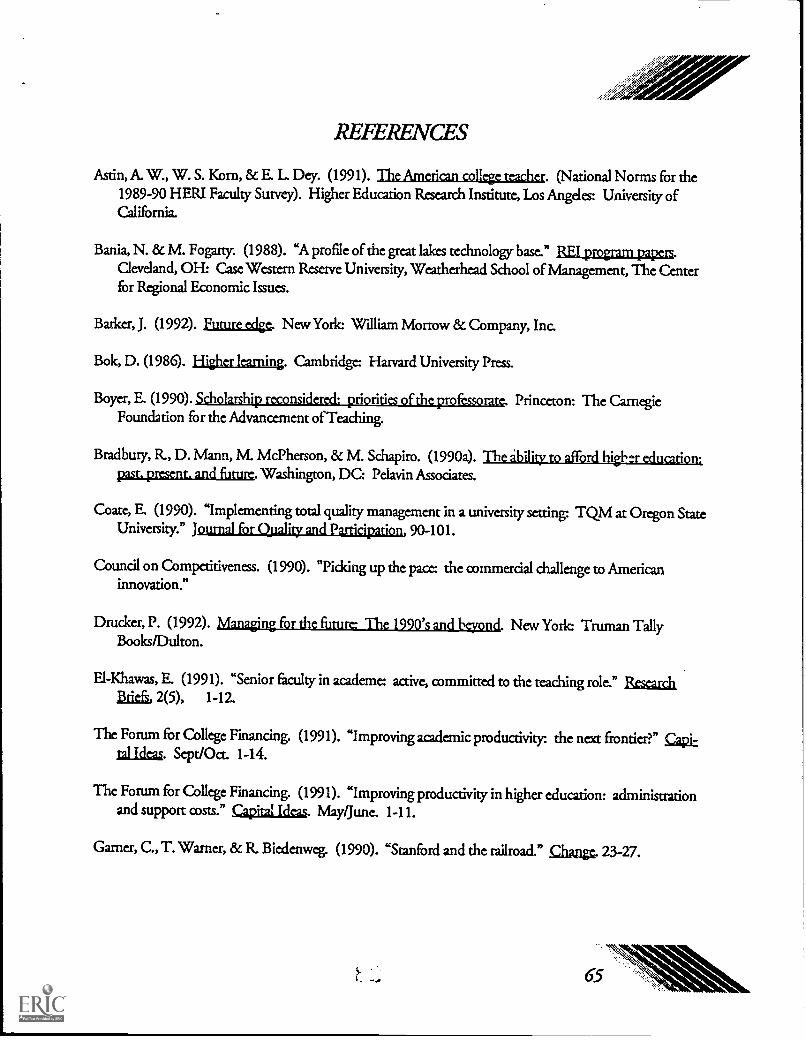
REFERENCES
Astin, A. W., W. S. Korn, & E L Dey. (1991). The American college teacher. (National Norms for the1989-90 HERI Faculty Survey). Higher Education Research Institute, Los Angeles: University ofCalifornia.
Bania, N. & M. Fogarty. (1988). "A profile of the great lakes technology base." RE! program paper .
Cleveland, OH: Case Western Reserve University, Weatherhead School of Management, The Centerfor Regional Economic Issues.
Barker, J. (1992). Future edge. New York William Morrow & Company, Inc.
Bok, D. (1986). Higher learning. Cambridge: Harvard University Press.
Boyer, E (1990). Scholarship reconsidered: priorities of the professorate. Princeton: The CarnegieFoundation for the Advancement of Teaching.
Bradbury, R, D. Mann, M. McPherson, & M. Schapiro. (1990a). The ability to afford higher education:past. present. and future. Washington, DC: Pelavin Associates.
Coate, E (1990). "Implementing total quality management in a university setting: TQM at Oregon StateUniversity." Journal for Osiality and Participation, 90-101.
Council on Competitiveness. (1990). "Picking up the pace: the commercial challenge to Americaninnovation."
Drucker, P. (1992). Managing for the future The 1990's and beyond. New York: Truman TallyBooks/Dulton.
El-Khawas, E. (1991). "Senior faculty in academe: active, committedto the teaching role." Rocuchgriefs, 2(5), 1-12.
The Forum for College Financing. (1991). "Improving academic productivity: the next frontier?" Capi-LaLlsicas. Sept/Oct. 1-14.
The Forum for College Financing. (1991). "Improving productivity in higher education: administrationand support costs." Capital Ideas. May/June. 1-11.
Garner, C., T. Warner, & R. Biedenweg. (1990). "Stanford and the railroad? Change. 23-27.
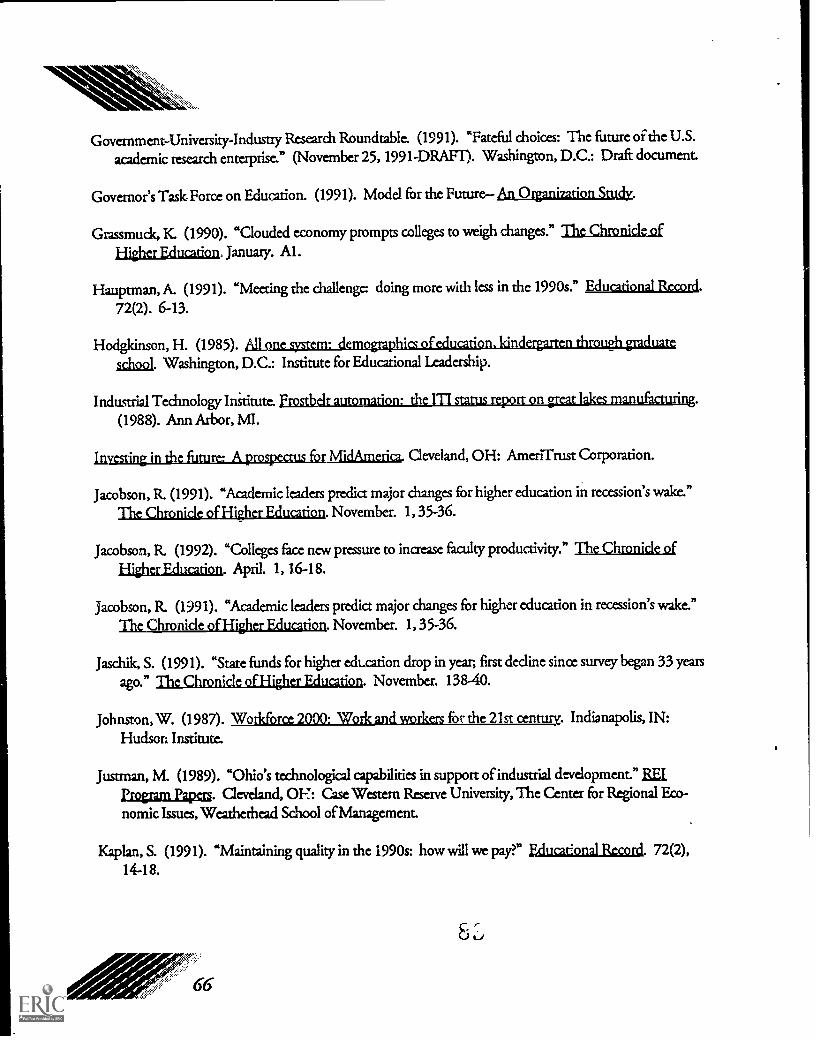
Government - University - Industry Research Roundtable. (1991). "Fateful choices: The future of the U.S.
academic research enterprise." (November 25, 1991-DRAFT). Washington, D.C.: Draft document.
Governor's Task Force on Education. (1991). Model for the Future An_Qrganization Study.
Grassmudc, K (1990). "Clouded economy prompts colleges to weigh changes." The ciumniald
Higher Education, January. Al.
Hauptman, A. (1991). "Meeting the challenge: doing more with less in the 1990s." Educational Record.
72(2). 6-13.
Hodgkinson, H. (1985).§choot. Washington, D.C.: Institute for Educational Leadership.
Industrial Technology institute. Prostbelt automation: the ITI status report on great lakes manufacturing.(1988). Ann Arbor, MI.
Investing in the future: A prospectus for MidAmerica. Cleveland, OH: AmenTrust Corporation.
Jacobson, R. (1991). "Academic leaders predict major changes for higher education in recession's wake."The Chronicle of Higher Education. November. 1, 35-36.
Jacobson, R. (1992). "Colleges face new pressure to increase faculty productivity." The Chronicle ofHigher Education. April. 1, 16-18.
Jacobson, R. (1991). "Academic leaders predict major changes for higher education in recession's wake."The Chronide of Higher Education. November. 1, 35-36.
Jaschik, S. (1991). "State funds for higher cdtcation drop in year first dedine since survey began 33 yearsago." The Chronicle of Higher Education. November. 138-40.
114 ii OAR: 41 O R : 4 I ell I Lie
Johnston, W. (1987).Hudson Institute.
at I i . I IA !Rh II . R. LO 4 Indianapolis, IN:
Justrnan, M. (1989). "Ohio's technological capabilities in support of industrial development" BELProgram Papers. Cleveland, OF': Case Western Reserve University, The Center for Regional Eco-nomic Issues, Weatherhead School of Management.
Kaplan, S. (1991). "Maintaining quality in the 1990s: how will we pay?" Educational Record. 72(2),14-18.
Kirshstein, R., et al. (1990). The escalating costs of higher education. Washington DC: Pelavin Associ-ates.
Kominski, R. (1991). "Educational attainment in the United States: March 1989 and 1988." populationCharacteristics Report Series P-20. No. 451. U.S. Department of Commerce, Economics and Statis-tics Administration.
Langfitt, T. (1992). "Ten years forward: A vision of higher education." Policy Perspectives. The PewHigher Education Research Program, Sponsored by the Pew Charitable Trusts, 4(2). 11B-16B.
Langfitt, T. (1990). "The cost of higher education: lessons to learn from the health care industry."Change. 8-15.
Leatherman, C. (1990). "Definition of faculty scholarship must be expanded to indude teaching, CarnegieFoundation says." The Chronicle of Higher Education. December. Al, A16-17.
Leatherman, C. (1991). "Professors' salaries fail to keep pace with cost of living." The Chronicle of HigherEducation. April. Al, A18.
Mancing, H. (1991). 'Teaching, research, service: the concept of faculty workload." ADFL Bulletin,22(3). Spring. 44-50.
Minter, J. (1991). "Fiscal facts, trends, and forecasts." Educational Record. 72(2), 19-23.
Mooney, C. J. (1991). "Professors feel conflict between roles in teaching and research, say students arebadly prepared." The Chronicle of Higher Education. May. A15-17.
National Center for Education Statistics. (1990).Erofiles of faculty in higher education institutions. 1988.U.S. Department of Education Office of Educational Research and Improvement, August.
Ohio Board of Regents. (1991). Higher education operating budget. FY 1992-FY 1993. presentation tow I 4.4 401.44i SI 641III I
Ohio Board of Regents. (1988). Toward theyear 2000: Master plan for higher education.
Peters, T. (1985). A passion for excellence. New York Random House.
The Pew Higher Education Research Program. (1992) "Keeping the promise." Policy Perspectives. PewCharitable Trusts, 4(2). 1A-8A.
Post, C., & M. Fogarty. (1989). "Ohio's science and technology human resources." REI Program Papal.Cleveland, OH: Case Western Reserve University, The Center for Regional Economic Issues,Weatherhead School of Management. October.
Research Associates of Washington. (1991). Stare profiles: financing public higher education 1978 to
1991. Washington, D.C.:
Roe, M. A.. (1989). Education and U.S. competitiveness: the community college role. Austin, Texas:IC2 Institute, The University of Texas.
Rosenzweig, R. M. (1992). Quoted in Science and Government Report
Thurston, W. (1991). "The college crisis." Jndustry. 8-9,39.
Western Interstate Commission for Higher Education and The College Board. (1991). The road tocollege: Educational progress by race and ethnicity.
The University of Michigan. (1990). "Enhancing quality in an era of resource constraints." Report of thetask force on costs in higher education, The University of Michigan.
U.S. Congress, Office of Technology Assessment. (1991). Federally funded research: Decisions for adecade. Washington, D.C.: U.S. Government Printing Office. May.
U.S. Department of Education Printing Office. (1991). Tough choices: A guide to administrative costmanagement in colleges and universities. Washington, DC: U.S. Department of Education.
Yuker, H. (1984). "Faculty workload: research, theory, and interpretation." ASHE:MallgherEtickLion Research Report #10.
Zemsky, R, & W. Massy. (1990). "Cost containment Committing to a new economic reality.";,. 16-22.
Report of theManaging for the Future Task ForceJuly, 1992
BEST COPY AVAILABLE
Appendix ALocation of Public Colleges dm Universitiesin Ohio
E,
D
STATE SUPPORTED COLLEGES AND UNIVERSITIESMap and Legend
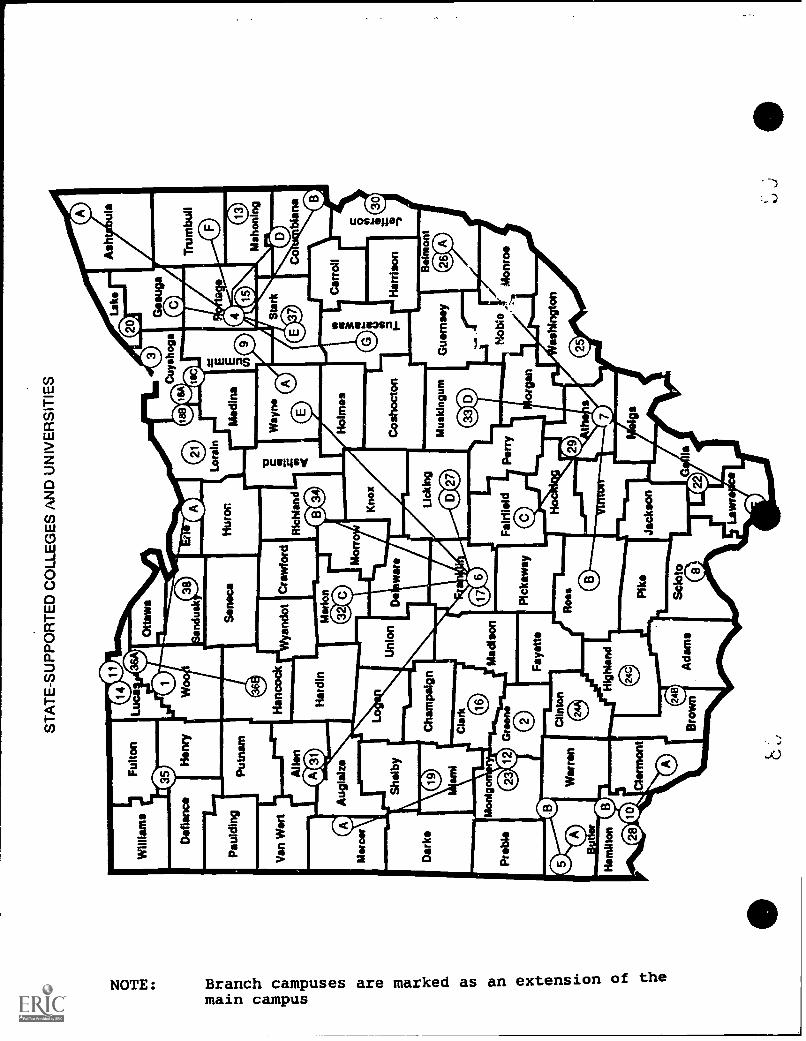
ST
AT
E-S
UP
PO
RT
ED
CO
LLE
GE
S A
ND
UN
IVE
RS
ITIE
S
t
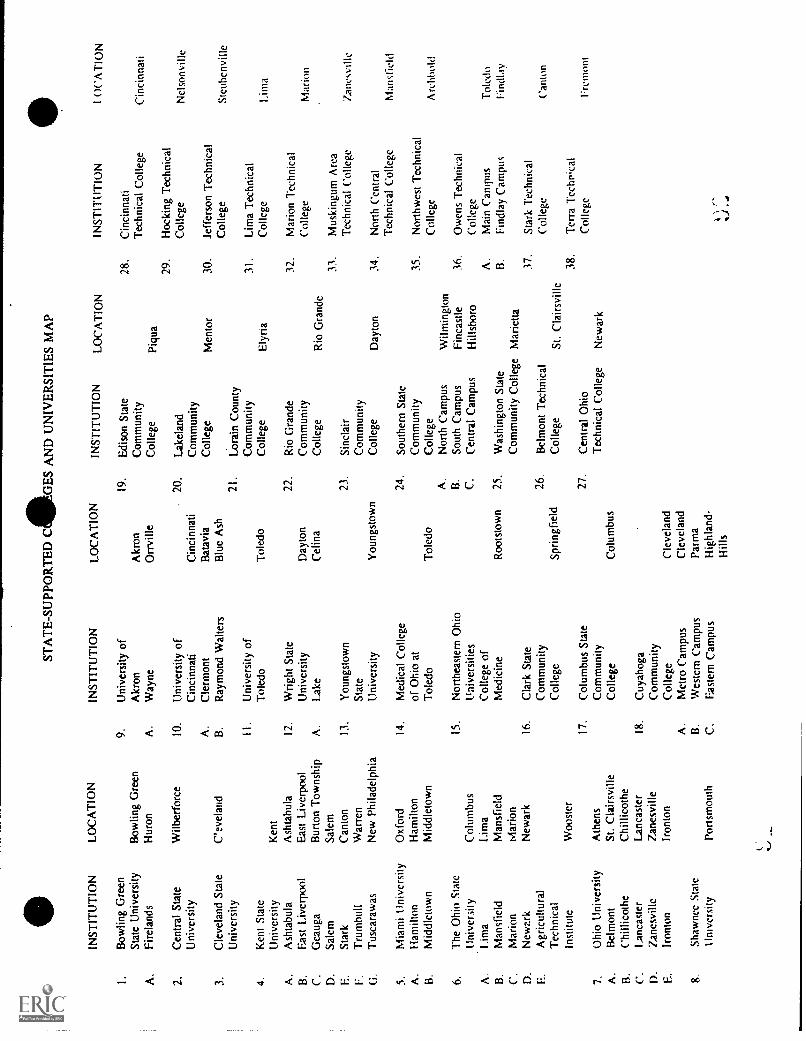
STA
TE
-SU
PPO
RT
ED
CA
DG
ES
AN
D U
NIV
ER
SIT
IES
MA
P
INS
TIT
UT
ION
LOC
AT
ION
INS
TIT
UT
ION
LOC
AT
ION
INS
TIT
UT
ION
LOC
AT
ION
INS
TIT
UT
ION
1 ()
CA
TIO
N
1.B
owlin
g G
reen
9.U
nive
rsity
of
19.
Edi
son
Sta
te28
.C
inci
nnat
iS
tate
Uni
vers
ityB
owlin
g G
reen
Akr
onA
kron
Com
mun
ityT
echn
ical
Col
lege
Cin
cinn
ati
A.
Fire
land
sH
uron
A.
Way
neO
rrvi
lleC
olle
geP
iqua
29.
Hoc
king
Tec
hnic
al2.
Cen
tral
Sta
teW
ilber
forc
e10
.U
nive
rsity
of
20.
Lake
land
Col
lege
Nel
sonv
ille
Uni
vers
ityC
inci
nnat
iC
inci
nnat
iC
omm
unity
A.
Cle
rmon
tB
atav
iaC
olle
geM
ento
r30
.Je
ffers
on T
echn
ical
3.C
leve
land
Sta
teC
'tvel
and
B.
Ray
mon
d W
alte
rsB
lue
Ash
Col
lege
Ste
uben
ville
Uni
vers
ity21
.Lo
rain
Cou
nty
II.U
nive
rsity
of
Com
mun
ity31
.Li
ma
Tec
hnic
al4.
Ken
t Sta
teT
oled
oT
oled
oC
olle
geE
lyria
Col
lege
Lim
aU
nive
rsity
Ken
t
A.
Ash
tabu
laA
shta
bula
12.
Wrig
ht S
tate
22.
Rio
Gra
nde
32.
Mar
ion
Tec
hnic
alB
.E
ast L
iver
pool
Eas
t Liv
erpo
olU
nive
rsity
Day
ton
Com
mun
ityC
olle
geM
ario
nC
.G
eaug
aB
urto
n T
owns
hip
A.
Lake
Cel
ina
Col
lege
Rio
Gra
nde
D.
Sal
emS
alem
33.
Mus
king
um A
rea
E.
Sta
rkC
anto
n13
.Y
oung
stow
n23
.S
incl
air
Tec
hnic
al C
olle
geZ
anes
ville
F.
Tru
mbu
llW
arre
nS
tate
Com
mun
ityT
usca
raw
asN
ew P
hila
delp
hia
Uni
vers
ityY
oung
stow
nC
olle
geD
ayto
n34
.N
orth
Cen
tral
Tec
hnic
al C
olle
geM
ansf
ield
5.M
iam
i Uni
vers
ityO
xfor
d14
.M
edic
al C
olle
ge24
.S
outh
ern
Sta
teA
.H
amilt
onH
amilt
onof
Ohi
o at
Com
mun
ity35
.N
orth
wes
t Tec
hnic
alB
.M
iddl
etow
nM
iddl
etow
nT
oled
oT
oled
oC
olle
geC
olle
geA
rel
thol
dA
.N
orth
Cam
pus
Wilm
ingt
on6.
The
Ohi
o S
tate
15.
Nor
thea
ster
n O
hio
B.
Sou
th C
ampu
sF
inca
stle
36.
Ow
ens
Tec
hnic
alU
nive
riity
Col
umbu
sU
nive
rsiti
esC
.C
entr
al C
ampu
sH
illsb
oro
Col
lege
A.
I .im
aLi
ma
Col
lege
of
A.
Mai
n C
ampu
sT
oled
oB
.M
ansf
ield
Man
sfie
ldM
edic
ine
Roo
tsto
wn
25.
Was
hing
ton
Sta
teB
.F
indl
ay C
ampu
sF
indl
ayC
.M
ario
nM
ario
nC
omm
unity
Col
lege
Mar
ietta
D.
New
ark
New
ark
16.
Cla
rk S
tate
37.
Sta
rk T
echn
ical
E.
Agr
icul
tura
lC
omm
unity
26.
Bel
mon
t Tec
hnic
alC
olle
geC
anto
nT
echn
ical
Col
lege
Spr
ingf
ield
Col
lege
St.
Cla
irsvi
lleIn
stitu
teW
oost
er38
.T
erra
Tec
hnic
al17
.C
olum
bus
Sta
te27
.C
entr
al O
hio
Col
lege
Fre
mon
7.O
hio
Uni
vers
ityA
then
sC
omm
unity
Tec
hnic
al C
olle
geN
ewar
kA
.B
elm
ont
St.
Cla
irsvi
lleC
olle
geC
olum
bus
B.
('hill
icot
heC
hilli
coth
eC
.la
ncas
ter
Lanc
aste
rI8
.C
uyah
oga
D.
Zan
esvi
lleZ
anes
ville
Com
mun
ityF
.Ir
onto
nIr
onto
nC
olle
geC
leve
land
A.
Met
ro C
ampu
sC
leve
land
8.S
haw
nee
Sta
teB
.W
este
rn C
ampu
sP
arm
at I
nive
rsity
Por
tsm
outh
C.
Eas
tern
Cam
pus
Hig
hlan
d-H
ills
.
Appendix BEnrollment 6- Degrees Awarded inOhio Public Colleges e Universities
4.-.I.., LI
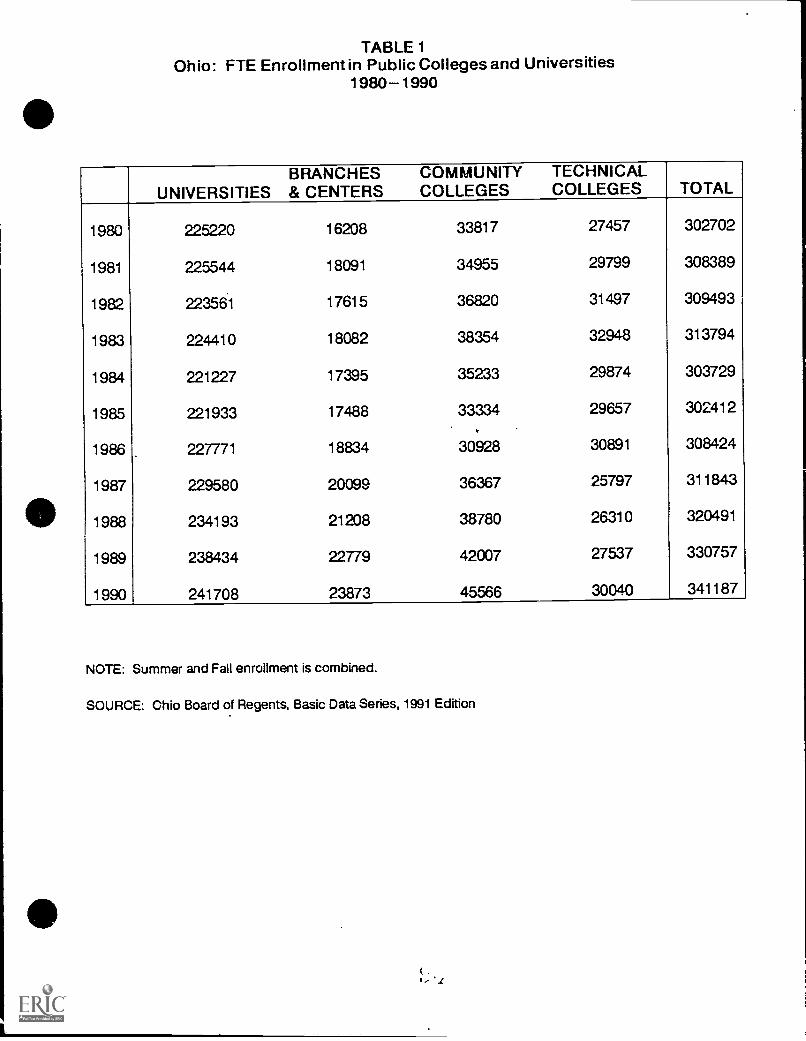
TABLE 1Ohio: FTE Enrollment in Public Colleges and Universities
1980 1990
UNIVERSITIESBRANCHES& CENTERS
COMMUNITYCOLLEGES
TECHNICALCOLLEGES TOTAL
1980 225220 16208 33817 27457 302702
1981 225544 18091 34955 29799 308389
1982 223561 17615 36820 31497 309493
1983 224410 18082 38354 32948 313794
1984 221227 17395 35233 29874 303729
1985 221933 17488 33334 29657 302412
1986 227771 18834 30928 30891 308424
1987 229580 20099 36367 25797 311843
1988 234193 21208 38780 26310 320491
1989 238434 22779 42007 27537 330757
1990 241708 23873 45566 30040 341187
NOTE: Summer and Fall enrollment is combined.
SOURCE: Ohio Board of Regents, Basic Data Series, 1991 Edition
',C
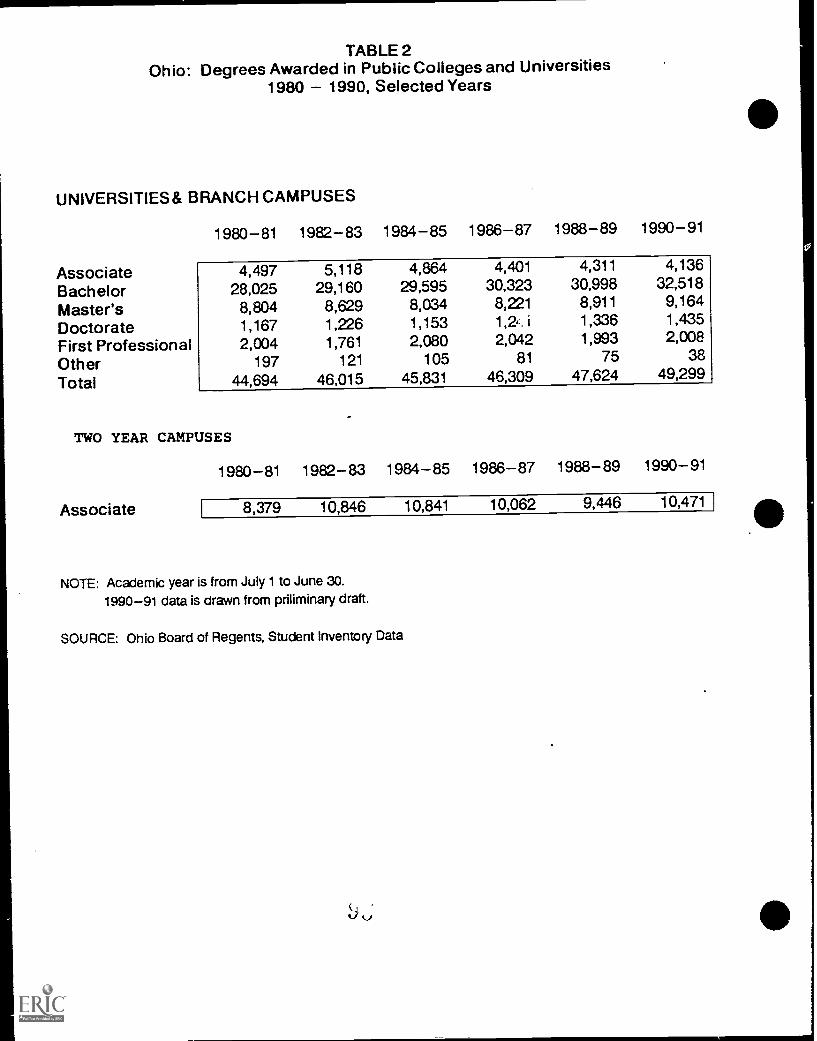
TABLE 2Ohio: Degrees Awarded in Public Colleges and Universities
1980 1990, Selected Years
UNIVERSITIES & BRANCH CAMPUSES
AssociateBachelorMaster'sDoctorateFirst ProfessionalOtherTotal
1980-81 1982-83 1984-85 1986-87 1988-89 1990-91
4,497 5,118 4,864 4,401 4,311 4,136
28,025 29,160 29,595 30,323 30,998 32,518
8,804 8,629 8,034 8,221 8,911 9,164
1,167 1,226 1,153 1,2-. i 1,336 1,435
2,004 1,761 2,080 2,042 1,993 2,008
197 121 105 81 75 38
44,694 46,015 45,831 46,309 47,624 49,299
TWO YEAR CAMPUSES
Associate
1980-81 1982-83 1984-85 1986-87 1988-89 1990-91
8,379 10,846 10,841 10,062 9,446 10,471
NOTE: Academic year is from July 1 to June 30.1990-91 data is drawn from priliminary draft.
SOURCE: Ohio Board of Regents, Student Inventory Data
tg.'lc ..
C., 116 ote"
itY)
Ve
'"
1.i.°.
.,tc,
iv15 e
.00:Qc
Nitiot
1, e% e
0,-
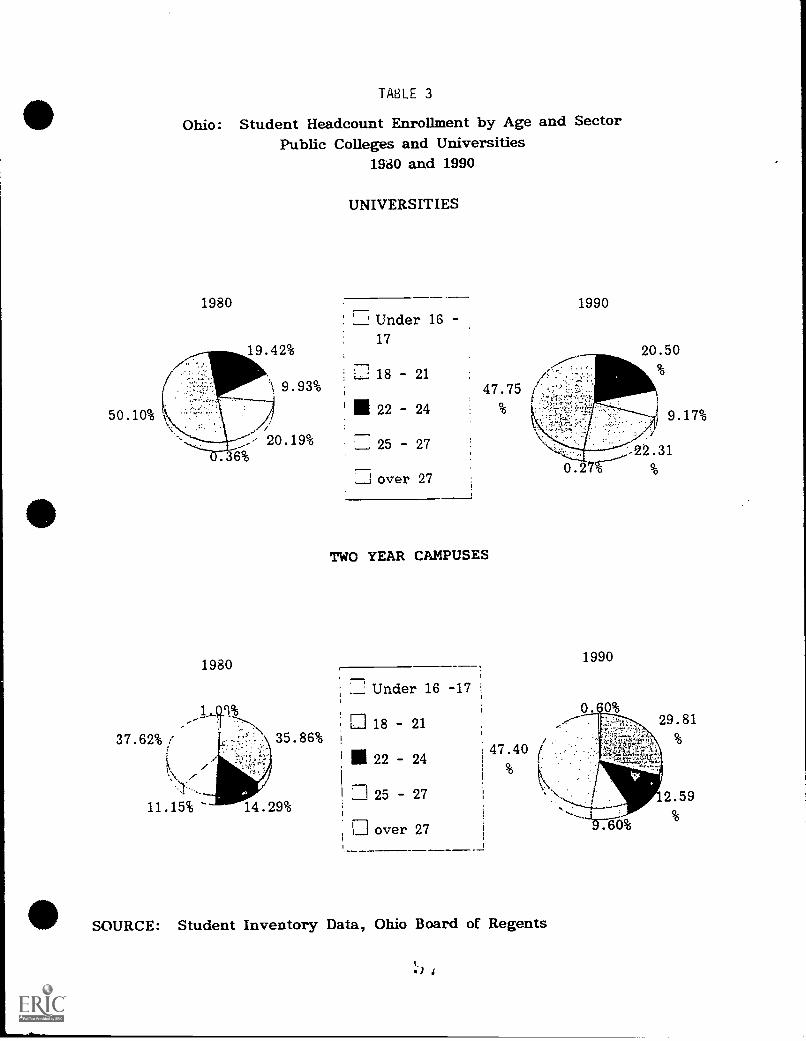
50.10%
TABLE 3
Ohio: Student Headcount Enrollment by Age and SectorPublic Colleges and Universities
19d0 and 1990
1980
1980
35.86%
UNIVERSITIES
Under 16 -17
, U 18 - 21
° III 22 - 24
_; 25 - 27
I over 27
1990
TWO YEAR CAMPUSES
Under 16 -17
' L7.1i 18 - 21
U 22 - 24
0 25 27
0 over 27
1990
SOURCE: Student Inventory Data, Ohio Board of Regents
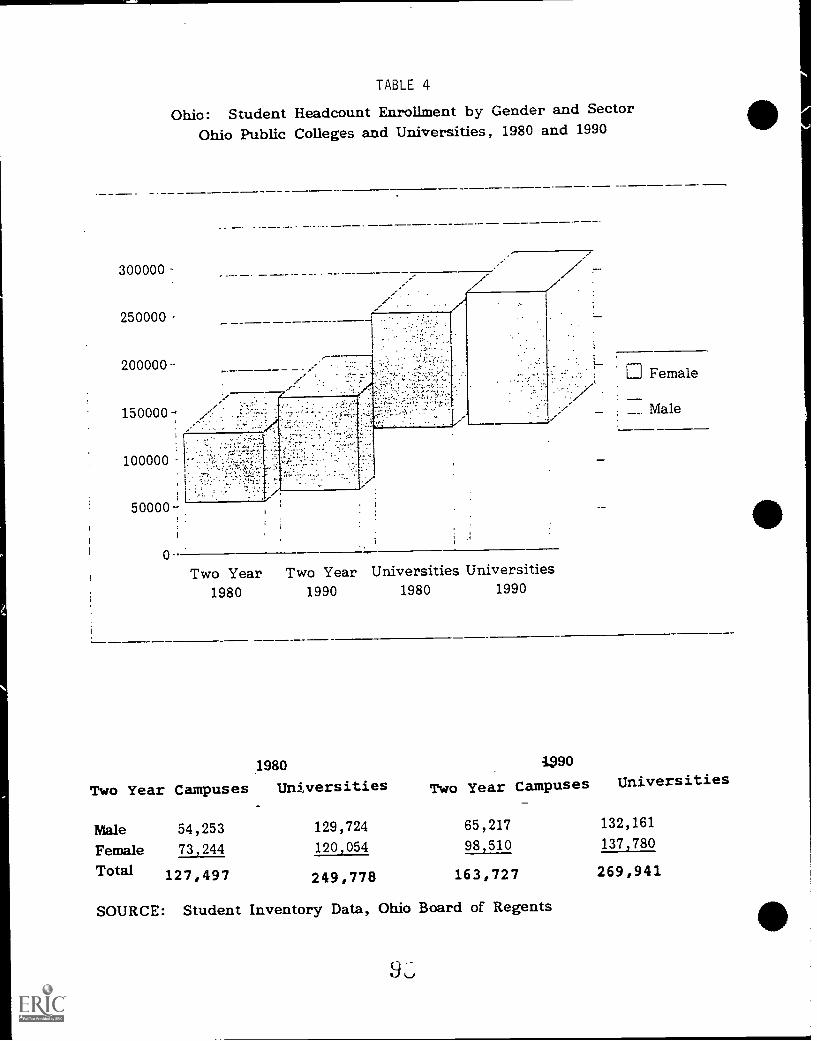
TABLE 4
Ohio: Student Headcount Enrollment by Gender and SectorOhio Public Colleges and Universities, 1980 and 1990
300000
250000
200000
0
Two Year Two Year Universities Universities1980 1990 1980 1990
1980
Two Year Campuses Universities
Male 54,253 129,724
Female 73,244 120,054
Total 127,497 249,778
1,990
Two Year Campuses Universities
65,217 132,16198,510 137,780
163,727 269,941
SOURCE: Student Inventory Data, Ohio Board of Regents
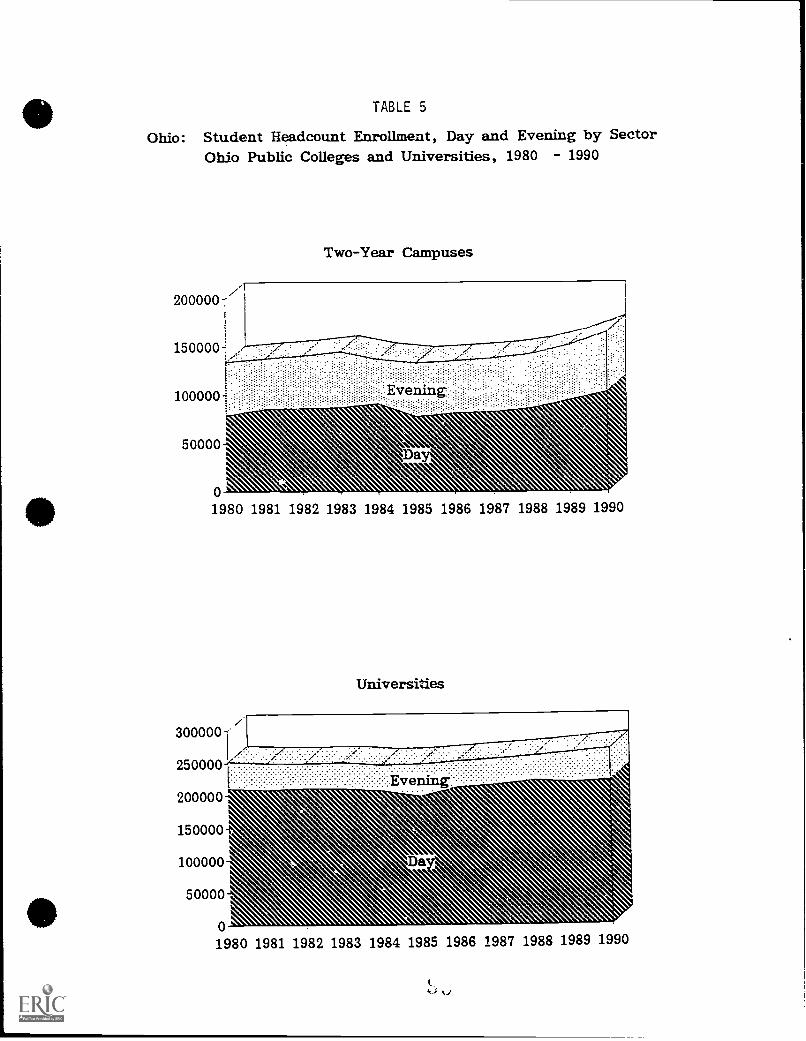
TABLE 5
Ohio: Student Headcount Enrollment, Day and Evening by SectorOhio Public Colleges and Universities, 1980 - 1990
200000"
150000
100000
50000
01980 1981 1982 1983 1984 1985 1986 1987 1988 1989 1990
Two-Year Campuses
vemn
: ,.:....
Universities
200000
150000
100000
50000
01980 1981 1982 1983 1984 1985 1986 1987 1988 1989 1990
4.;
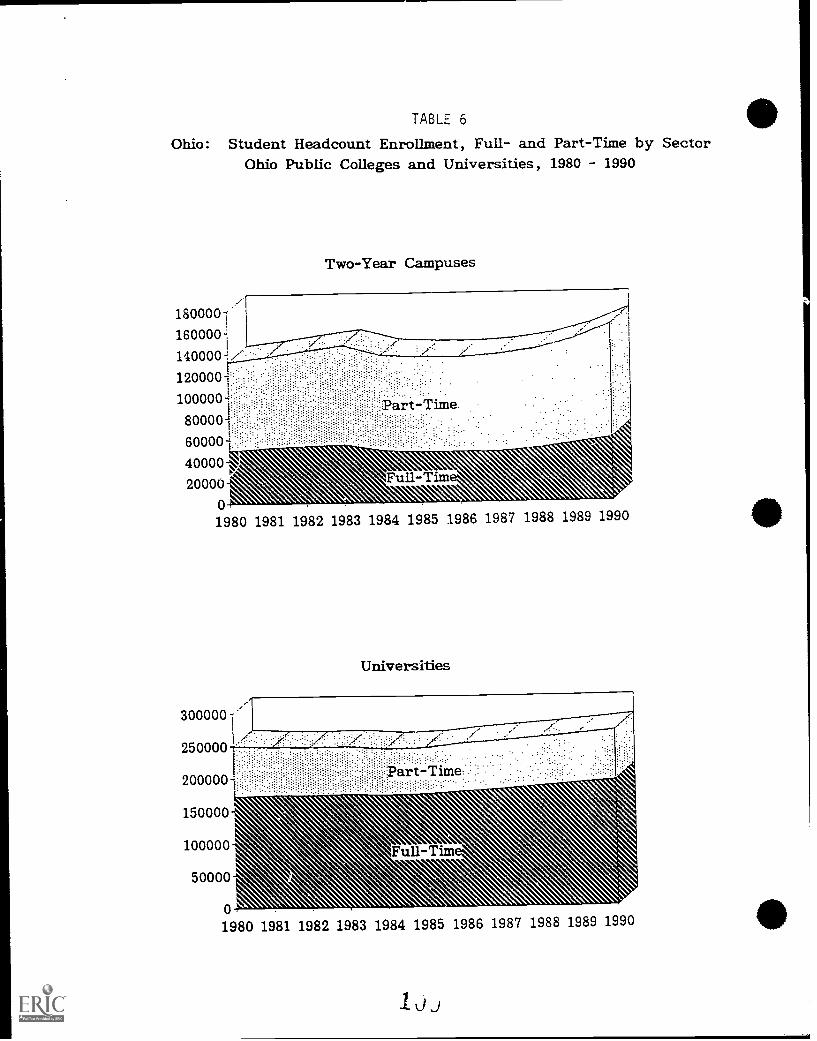
TABLE 6
Ohio: Student Headcount Enrollment, Full- and Part-Time by SectorOhio Public Colleges and Universities, 1980 - 1990
Two-Year Campuses
1800001160000
140000-:,/1200001':..
100000
800004-1
40000
art-Time
2000001980 1981 1982 1983 1984 1985 1986 1987 1988 1989 1990
3000001
2500001
Universities
2000001.
150000
100000
50000
01980 1981 1982 1983 1984 1985 1986 1987 1988 1989 1990
Lis)
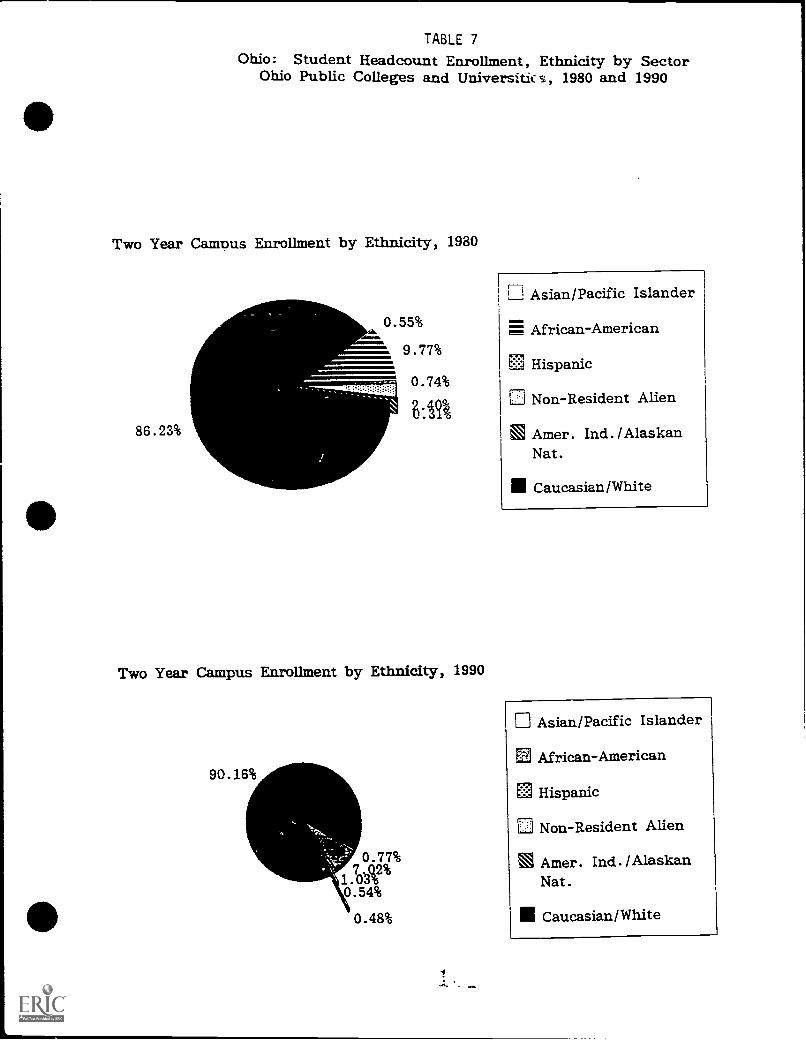
TABLE 7
Ohio: Student Headcount Enrollment, Ethnicity by SectorOhio Public Colleges and Univers:tics, 1980 and 1990
Two Year Campus Enrollment by Ethnicity, 1980
0.55%ions.
9.77%
0.74%
86.23%
Two Year Campus Enrollment by Ethnicity, 1990
90.16%
0.77%7.t 2%
1.030.54%
0.48%
Li! Asian/Pacific Islander111111
African-American
Hispanic
Non-Resident Alien
E Amer. Ind. /AlaskanNat.
11 Caucasian/White
Asian/Pacific Islander
5 African-American
CI Hispanic
Non-Resident Alien
NN Amer. Ind. /AlaskanNat.
III Caucasian/White
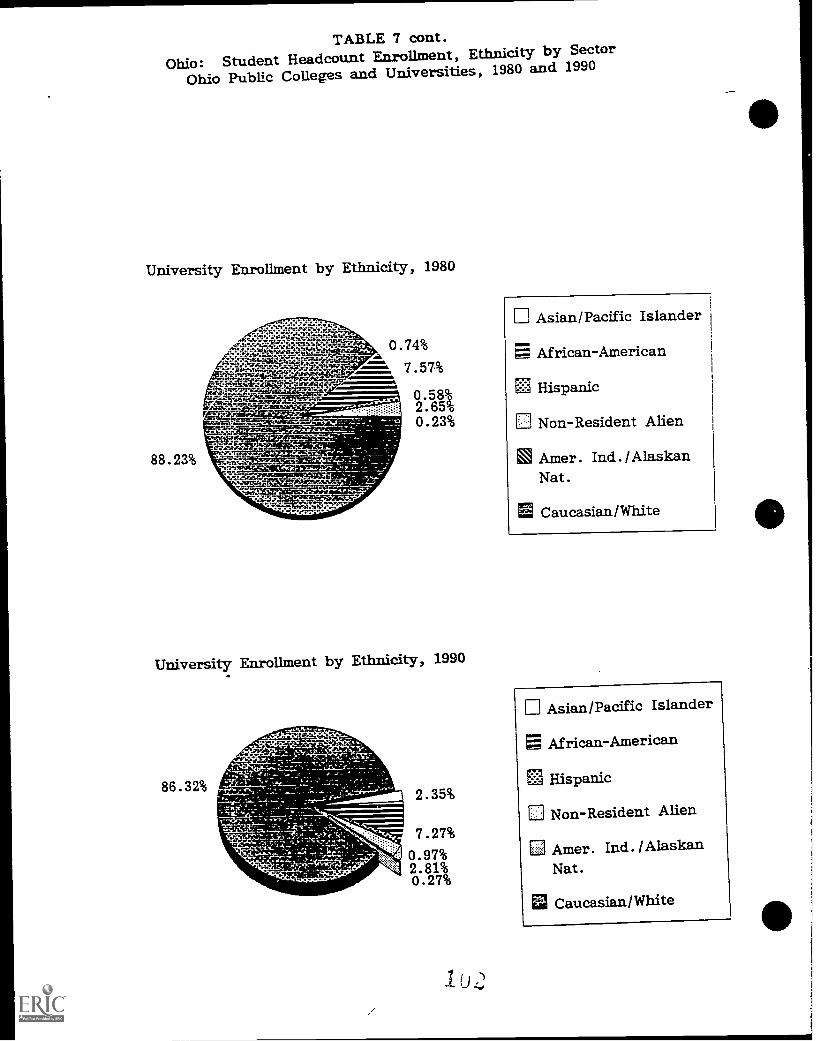
TABLE 7 cont.
Ohio: Student Headcount Enrollment, Ethnicity by Sector
Ohio Public Colleges and Universities, 1980 and 1990
University Enrollment by Ethnicity, 1980
88.23%
d r a--twyrazt.
IkXMWINEmmmgmfo7:0:4TM5Sdeft:YaF
42MMUOMMSEr-sulmmiqp.
University Enrollment by Ethnicity, 1990
86.32%2.35%
7.27%
0.97%2.81%0.27%
ri Asian/Pacific Islander
African-American
EI3 Hispanic
Non-Resident Alien
M Amer. hid. /AlaskanNat.
E Caucasian/White
Asian/Pacific Islander
E African-American
Hispanic
Non-Resident Alien
Amer. Ind./AlaskanNat.
Caucasian/White
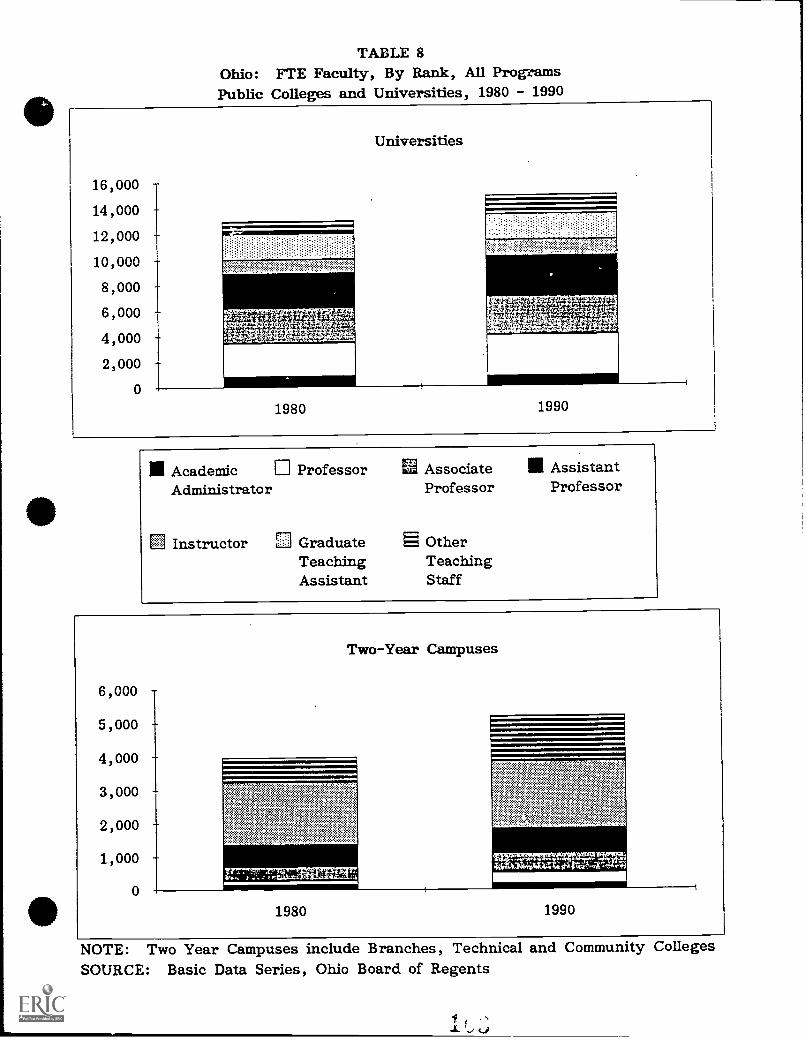
TABLE 8Ohio: FTE Faculty, By Rank, All ProgramsPublic Colleges and Universities, 1980 - 1990
16,000
14,000
12,000
10,000
8,000
6,000
4,000
2,000
0
Universities
1980 1990
R Academic Professor Associate I AssistantAdministrator Professor Professor
Instructor Graduate g OtherTeaching TeachingAssistant Staff
NOTE: Two Year Campuses include Branches, Technical and Community CollegesSOURCE: Basic Data Series, Ohio Board of Regents
Appendix DState-Level el" Public College ó UniversityEfforts to Improve Access
STATE-LEVEL EFFORTS
To IMPROVE ACCESS
In the 1988 policy study ofthe Ohio Board ofRegents on student access and success, the following strategic
goals were stated:
1. To increase the number of individuals participating in higher education at each level (associate,baccalaureate, graduate, professional), with particular attention to minority students.
2. To increase the number of returning and continuing students in Ohio's colleges and universities, withparticular attention to minority students.
3. To improve the rate of degree completion at all levels ofiiigher education and in all colleges and universities,
with particular attention to minority students.
4. To increase minority student enrollments, over a ten-year period, to at least proportional representation foreach college and university service area.
5. To assure that all students are accorded the benefit of ficulty and a learning environment generallyrepresentative of the racial/ethnic mix found in the service district of the college or university.
In an effort to achieve these goals, the following strategies have been used:
aSagiaglitancialAid
Ohio Instructional Grants. The Ohio Instructional Grant Program, instituted in 1969, awards grantsfor college tuition and fees based on income eligibility. More than 70,000 awards are made each year.
War Orphans Scholarships. Children of individuals disabled or killed by U.S. involvement in war areeligible for scholarships for tuition and fees at public colleges and universities in Ohio, and for partialtuition and fees at Ohio's independent colleges. This program has been in existence since 1956 andserves about 900 students annually.
Academic Scholarships. Each year, 1,000 high school graduates are awarded academic scholarships of$1,000 per year for four years. Each Ohio high school nominates eligible recipients to this program,which has been in place since 1976, and serves about 3600 students a year.
Student Choice Grants. In order to provide Ohio high school graduates with a variety of college anduniversity options, Student Choice Grants are awarded to Ohio students attending independentcolleges and universities in Ohio. The grants represent an amount based on the public highereducationinstructional subsidies, and help to offset the tuition charges of independent colleges.
1u
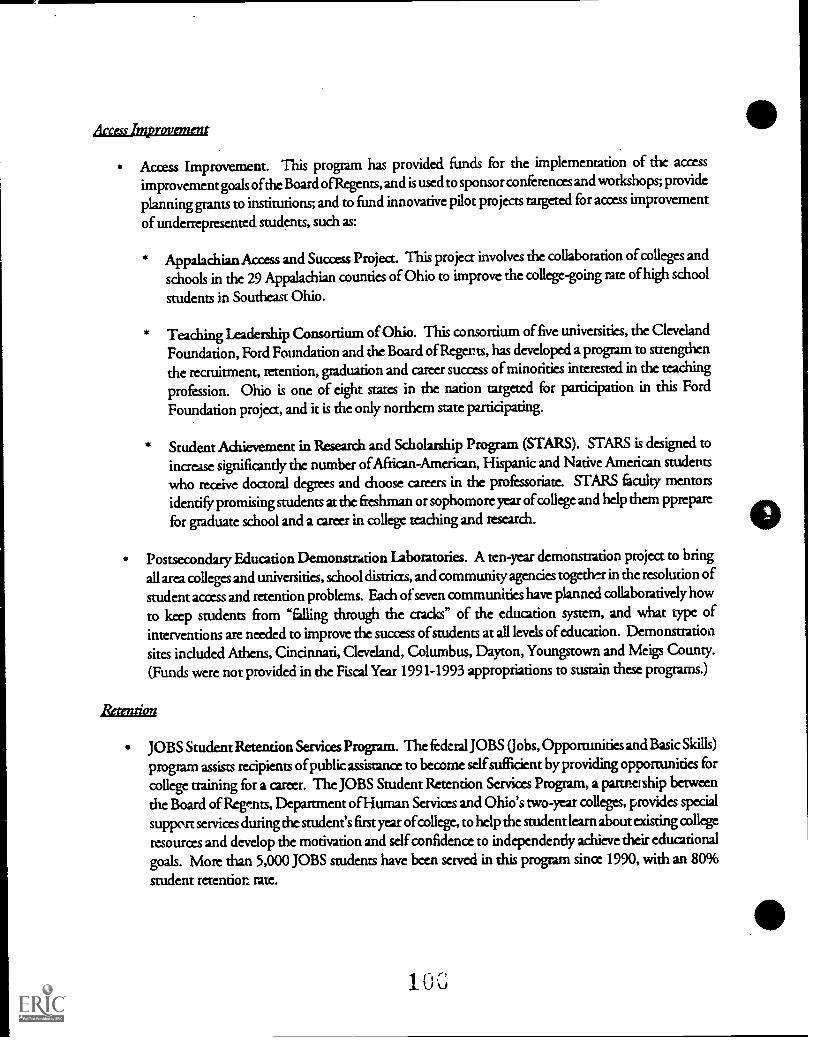
Access Improvement
Access Improvement. This program has provided funds for the implementation of the access
improvement goals ofthe Board ofRegents, and is used to sponsorconferences and workshops; provide
planning grants to institutions; and to fund innovative pilot projects targeted for access improvement
of underrepresented students, such as:
Appalachian Access and Success Project. This project involves the collaboration of colleges and
schools in the 29 Appalachian counties of Ohio to improve the college-going rate of high school
students in Southeast Ohio.
* Teaching Leadership Consortium of Ohio. This consortium of five universities, the Cleveland
Foundation, Ford Foundation and the Board of Regents, has developed a program to strengthen
the recruitment, retention, graduation and career success of minorities interested in the teaching
profession. Ohio is one of eight states in the nation targeted for participation in this Ford
Foundation project, and it is the only northern state participating.
Student Achievement in Research and Scholarship Program (STARS). STARS is designed to
increase significantly the number of African -American, Hispanic and Native American students
who receive doctoral degrees and choose careers in the professoriate. STARS faculty mentors
identify promising students at the freshman or sophomore year of college and help them pprepare
for graduate school and a career in college teaching and research.
Postsecondary Education Demonstration Laboratories. A ten-year demonstration project to bring
all area colleges and universities, school districts, and community agencies together in the resolution of
student access and retention problems. Each of seven communities have planned collaboratively how
to keep students from "falling through the cracks" of the education system, and what type ofinterventions are needed to improve the success of students at all levels of education. Demonstrationsites induded Athens, Cincinnati, Cleveland, Columbus, Dayton, Youngstown and Meigs County.
(Funds were not provided in the Fiscal Year 1991-1993 appropriations to sustain these programs.)
JOBS Student Retention Services Program. The federal JOBS Oobs, Opportunities and Basic Skills)
program assists recipients of public assistance to become self sufficient by providing opportunities for
college training for a career. The JOBS Student Retention Services Program, a partnership betweenthe Board of Rernts, Department of Human Services and Ohio's two-year colleges, provides specialsupport services during the student's first year of college, to help the student learn about existing college
resources and develop the motivation and self confidence to independently achieve their educationalgoals. More than 5,000 JOBS students have been served in this program since 1990, with an 80%student retention rate.
,
Developmental Education. This budget line item provides funding for special materials, tutorials,learning laboratories and other support services for developmental and remedial students on the college
and university campuses. Funds are also provided for the Early Mathematics Placement TestingProgram; Early English Composition Assessment Program; and the State match for federal Eisenhower
Program science remediation all designed to pair college/university and high school faculty together
to improve the teaching and learning process so that fewer students graduating from high school needremediation when they attend college. (Funds were not provided in Fiscal Year 1991-93 to support
developmental education.)
Urban Initiatives. Central State University, in collaboration with Cuyahoga Community College andthe University of Cincinnati, have been focusing attention on the improvement of language arts skillsof school children and college students from inner-city environments of Cleveland and Cincinnati.(Funds were not provided in Fiscal Year 1991-93 to support the Urban Initiatives Program.)
Articulation and Transfer. As directed by the Ohio General Assembly, the Ohio Board of Regentsdeveloped a statewide policy on student articulation and transfer from one college to another withinthe state. The Board is now developing an electronic student transfer data base and student performancetracking capability to fully implement the policy now in place.
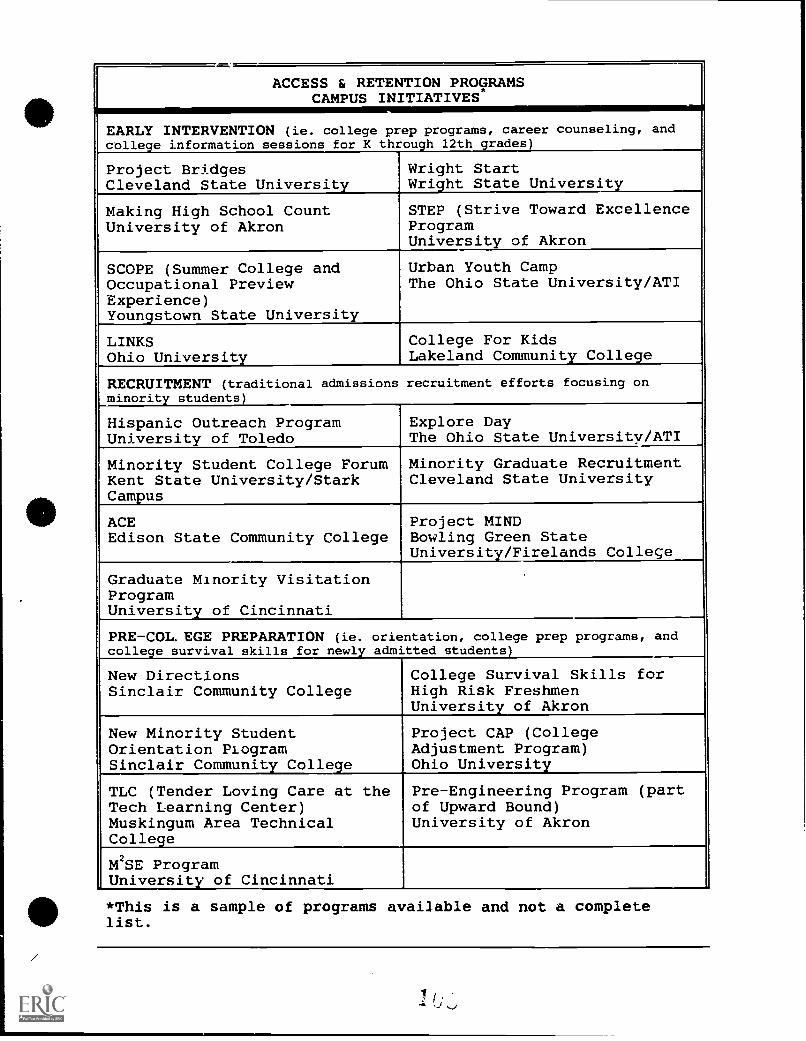
ACCESS & RETENTION PROGRAMSCAMPUS INITIATIVES
EARLY INTERVENTION (ie. college prep programs, career counseling, andcolle.e information sessions for K throuh 12th rades
Project BridgesCleveland State University
Wright StartWright State Universit
Making High School CountUniversity of Akron
STEP (Strive Toward ExcellenceProgramUniversity of Akron
SCOPE (Summer College andOccupational PreviewExperience)Youngstown State University
Urban Youth CampThe Ohio State University/ATI
LINKSOhio University
College For KidsLakeland Community College
RECRUITMENT (traditional admissions recruitment efforts focusing onminority students)
Hispanic Outreach ProgramUniversity of Toledo
Explore DayThe Ohio State University/ATI
Minority Student College ForumKent State University/StarkCampus
Minority Graduate RecruitmentCleveland State University
ACEEdison State Community College
Project MINDBowling Green StateUniversity/Firelands College
Graduate Minority VisitationProgramUniversity of Cincinnati
PRE-COL. EGE PREPARATION (ie. orientation,college survival skills for newly admitted
college prep programs, andstudents)
College Survival Skills forHigh Risk FreshmenUniversity of Akron
New DirectionsSinclair Community College
New Minority StudentOrientation ProgramSinclair Community College
Project CAP (CollegeAdjustment Program)Ohio University
TLC (Tender Loving Care at theTech Learning Center)Muskingum Area TechnicalCollege
Pre-Engineering Program (partof Upward Bound)University of Akron
M2SE ProgramUniversity of Cincinnati
*This is a sample of programs available and not a completelist.
1

ACCESS & RETENTION PROGRAMSCAMPUS INITIATIVES
FINANCIAL (incentives, rewards, scholarships etc.)
Project ExcelUniversity of Tolt.,do
Minority Incentive AwardProgramLorain County CommunityCollege
Foundation Scholarsh.44, (SummerInstitute)Sinclair Community College
ACADEMIC PROGRAMS (ie. high risk student academic programs, math and
writin. labs, remedial coursework, stud skills ro rams)
The Reading Recovery ProjectThe Ohio State University__
STAY ProgramSinclair Community College
GROW ClassesEdison State Community College
Academic Skills ProgramKent State University/EastLiverpool Campus
Success SeminarsClark State Community College
MENTORING/SOCIAL ADJUSTMENT PROGRAMS (ie. special interest housing,
mentoring programs, cultural rooms)
Mentoring ProgramCleveland State University
Young Scholars ProgramThe Ohio State University
Minority Student Support GroupSinclair Communit Colle.e
College Adjustment ProgramOhio Universit /Chillicothe
Minority LeadershipDevelopment ProgramSinclair Community College
MatchesShawnee State University
MONITORING/DATA COLLECTION (data collection and monitoring,
evaluation, early warning systems)
Midterm Grade Reporting SystemUniversity of Akron
Minority Student'AcademicIntervention ProgramSinclair Community College
Early Warning ProgramKent State University
Graduate Exit InterviewsEdison State Community College
Early Alert ProgramClark State Community College
Directed Studies ProgramEdison State Community College,
INSTITUTIONAL LINKAGES (transfer agreements, adopt-a-school programs,
partnerships with businesses and other schools)
Partners in ExcellenceMiami University/Hamilton
LINK Program (Adopt A School)Cleveland State University
*This is a sample of programs available and not a complete
list.
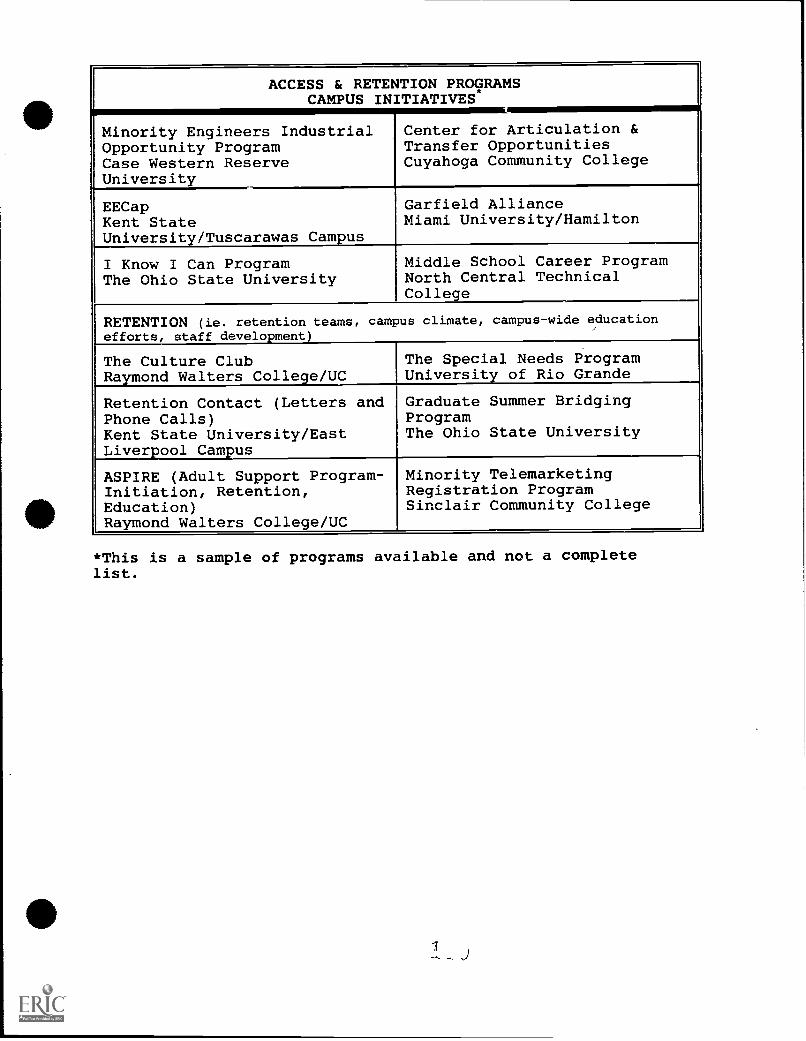
ACCESS & RETENTIONCAMPUS INITIATIVES
......
Minority Engineers IndustrialOpportunity ProgramCase Western ReserveUniversity
PROGRAMS
Center for Articulation &Transfer OpportunitiesCuyahoga Community College
EECapKent StateUniversity/Tuscarawas Campus
Garfield AllianceMiami University/Hamilton
I Know I Can ProgramThe Ohio State University
Middle School Career ProgramNorth Central TechnicalCollege
RETENTION (ie. retention teams, campus climate, campus-wide educationefforts, staff development)
The Culture ClubRa and Walters Colle.e/UC
The Special Needs ProgramUniversit of Rio Grande
Retention Contact (Letters andPhone Calls)Kent State University/EastLiverpool Campus
Graduate Summer BridgingProgramThe Ohio State University
Minority TelemarketingRegistration ProgramSinclair Community College
ASPIRE (Adult Support Program-Initiation, Retention,Education)Raymond Walters College/UC
*This is a sample of programs available and not a completelist.
Appendix EState-Level ek. Public College c UniversityEffirts to Improve Quality
1 1
STATE-EVEL EFFORTS
To IMPROVE QUALITY
As a carefully designed, integrated package of quality improvement initiatives, the Selective ExcellenceProgram represented the Board's first attempt to target funds to a specific statewide goal to be achieved in highereducation. Overall, the Selective Excellence Program has represented about 3% of the higher educationoperating appropriations each biennium. This investment by the state in the long-term qualitative gains inOhio's higher education institutions is beginning to reap many benefits. A comprehensive evaluation of theSelective Excellence Program is currently being conducted, with results expected in October 1992.
The Selective Excellence Program indudes the following components which have been phased in over
several biennia:
Ohio Eminent Scholars Program: Since 1983, 36 Ohio Eminent Scholar awards of $500,000 eachhave been made to Ohio's strongest public graduate and research programs, through a rigorouslycompetitive process. As ofApril 1990, Ohio's Eminent Scholars have attracted more than $11 million
in externally sponsored research support to Ohio.
Program Excellence: A competitive program which recognizes Ohio's best public undergraduateprograms, Program Excellence has awarded 87 enrichment grants ofup to $200,000 each in recognitionof high quality programs. As a result of this competition, institutions have become more sensitiv' tostandards and measures of quality, and programs have benefitted from reviews by faculty pr,:ts fromother colleges and universities.
Academic Challenge Program: More than $140 million, compounded to reflect the six-yearcommitment in the formula to programs selected by colleges and universities, has been invested in thebuilding of"centers ofexcellence" on Ohio's college and university campuses since 1985. Each campuswas challenged to focus these resources on a few programs that were already strong or central to theirmission, in order to substantially increase the quality and prominence of those programs.
Research Challenge Program: Ohio, through the investment in Research Challenge, has signaled tothe nation that it is investing in its own future as well as aggressively seeking private and federal research
funds to support the development of new knowledge. In the 1987-89 biennium alone, the return onthe state's investment was $8.34 for every $1 of Research Challenge funds resulting in over $183million in externally sponsored grants.
Productivity Improvement Challenge: The community and technical colleges, as well as universitybranch campuses, have been challenged through this program to improve the delivery of state-of-the-art training and retraining programs for business and industry. The colleges have joined together,through EnterpriseOhio, to deliver customized and on-site training services anywhere in Ohio they arerequested.
Complementary programs such as the Ohio Supercomputer Center, Ohio Aerospace Institute, and the
Edison Technology Centers have stimulatedboth basic and applied research in Ohio, raising the prospects for
economic revitalization. Ohio's investment over several years in instructional and laboratory equipment,
attempting to keep pace with changes in technology, has also contributed to qualitative gains within the states
colleges and universities.
PUBLIC COLLEGE AND UNIVERSrlY
EFFORTS To IMPROVE QUALITY
College and university leaders strategically identify measures for assessing quality and institutionaleffectiveness. The following is a sample of efforts to improve quality and measure outcomes on several college
and university campuses. The list is not intended to be exhaustive, but provide the readerwith an overview of
the types of initiatives in place on Ohio's campuses.
1.1ff MAL!. /1 11 .? el.. L
Institutions measure effectiveness and assess the quality ofthe academic experience through avariety of measures
and means, including:
Institutional Self-Study
The Bowling Green State University Task Force on Managing for the Future is recommending that theNorth Central Association self-study for the University be used as a framework for developing plans and
processes to improve quality and to achieve growth or change in the future by substitution rather than
accretion.
Other Strategies
Use ofthe principles ofTotal Quality Management to improve quality and contain costs throughcontinuous improvement techniques.
Use of quality assurance surveys and the empaneling of permanent task forces charged with on-
going quality improvement.
Institutional examination of the definition of quality and productivity and reward structures for
faculty and staff
Assessment of Student Performance
Ohio University has developed a comprehensive approach to measuring effectiveness and quality oncampus. This multi-dimensional Approach consists of the assessment of students while they are enrolled
and after graduation. Measures of assessment of quality indude the following:
Increased numbers of applicants. The University experienced a 96% increase in the number offreshman applicants (despite the 25% decline in the ',umber of Ohio high school graduates over thelast ten years.)
Improved performance on standardized tests. Average ACT scores of newfreshman increased 20% in
ten years.
Decreased time to degree and student retention rates. Ten years ago, 52% of the entering classcompleted a bachelor's degree within five years. To date, under selective admissions, 70% of theUniversity's freshman are expected to complete a bachelor's degree within five years. This compares
with a national average of 50%.
Increased satisfaction of students. Survey of students regarding satisfaction with various aspects of the
institution.
Employment rates ofgraduates. 80% of the 1980 bachelor's degree recipients wereemployed within
one year ofgraduation and 90% ufthe 1990chts Each year, over 70% ofgraduates reported working
in Ohio. Thus, the state is not experiencing a net migration of graduates to other states.
Tracking of Graduates
Student retention rates and follow-up surveys of graduates. For example, a follow-up study of NorthCentral Technical College graduates for 1987-88 indicated that 88.7% of those responding frit thatthe course of academic study had prepared them for further study or employment in the workforce.
giaduarsplacement rates. For example, the Clark State Community College class of 1990 had aplacement rate of 96% of all those available for employment.
Other Strategies
Employer evaluation of recent graduates
Graduation rates
Survey /tracking of students as they articulate from two-year to four-year campus
Surveying of local area of service to determine level of acceptability of college service to the
community
Informal /formal meetings with students
Evaluation of Faculty
Annual written evaluations, based on institutional mission and mix ofteaching, research, service functions,and employing such strategies as 1)student evaluations ofteaching, 2)schoLarlyacth 3)quality and extent
of research, induding importance of research and availability of external funding.
Assessment of the quality of instruction and the curricular review process
Sinclair Community College has been recognized fir numerous innovations in instruction. TV Sinclairis an alternative course delivery system. Over 40 courses are offered each quarter through correspondence,take-home video cassettes, commercial and cable television, or on-campus through videocassette oraudiocassette in a unique Individualized Learning Center. In addition, Sindair recently entered into aninnovative partnership agreement with Wright State University and Greater Dayton Public Television toprovide Instructional Television Fixed Service (ITFS).
Periodic academic program review
Wright State University, for example, reviews academic programs every five years. Some of the factors foranalysis include: number of students, number of faculty, student/faculty ratio, class size, library holdings,student scores on standardized test (GRE, GMAT, LSAT, etc.), percentage of students employed withinspecific years of graduation, percentage continuing with graduate education, percentage of courses taughtby graduate students or adjunct faculty, percentage ofwomen and minorities amonggraduates ofa program.
MuskingumArea Technical College engages in an Annual Academic Program Review Process. Academicprograms with a history of low enrollment, low retention, limited graduates and/or lack of job placementhas resulted in the deactivation of such programs.
Columbus State Community College, through its annual Program Review and Evaluation Report,provides both a statistical profile and a written analysis ofproductivity in each academic unit Informationfrom these reports is used to identify areas of low productivity (e.g., decreasing numbers of students, lowcost analysis ratio, poor placement rates, or substandard evaluation scores) as compared with college-widestandards. The design .of this model began almost 12 years ago, and has been cited as an exemplaryinstitutional practice. It has also received national attention and publication as well as an award from theNational Council for Research and Planning in 1983. As a part ofthe report, departmental "status reports"connect each department to three critical components of Columbus State's mission student access,educational excellence, and accountabilityand to the institution's Strategic Plan.
As one example of good practice in the area of departmental program review, the Cleveland StateUniversity's Managing for the Future Task Force evaluated various programs ofstudy, specificallyattending
to issues ofobvious duplication or obsolescence, in order to recommend programs (both administrative andacademic support services) for consolidation or elimination. Throughout this process, they applied thefollowing criteria, 1)centrality ofmission, 2)quality, 3)demand, 4)comparative advantage, and 5)costs. Theevaluative forces of these criteria, coupled with the principles of Total Quality Management, providedspecific indices for resource allocation and resulted in specific recommendations for structural changesresulting in targeted savings ofmore than $2 million. As a complement to this process, the Task Force alsorecommended a reorganization ofthe university and a strengthening/recommitment to an urban universitymission.
t
External evaluations of performance, institutional effectiveness and quality
Performance on stzte/natio nal licensing/certification exams, Forexample, since 1985, 90% ofWright State
University's nursing graduates have passed board exams on the first attempt
Periodic review ofaccreditingagencies/boards. Reviews ofinstitutional/program effectiveness through such
accrediting agencies as North Central Association ofColleges and Schools, the Ohio Board ofNursing, the
National Court Reporting Association, and the Acaediting Board ofEngincering and Tedmology, just to
name a few.
Ifforts to Improve Retention 6. Academic Success
The Comprehensive Learning Center at North Central Technical College provides special classes and
academic support services to encourage/promote student retention and academic success
Through established academic standards, Youngstown State University evaluates incoming students for
deficiencies and for placement into the appropriate level coursework (i.e. remedial or honors). In addition,
YSU provides orientation sessions for .tudents to ease in their transition.
Muskingum Area Technical College connects issues of academic quality and access/retention issues
through mandatory testing and placement of students in reading, writing, and mathematics, and through
the Ksza program that provides support group activities for new students and through the Access program
specifically designed for students who have not been in school for at least 10 years.
The Youngstown State University Foundation, a private organization, annually contributes 85% of its
money to fund scholarships amounting to $2,445,513.
The Success program at Marion Technical College personalizes services towardspecial needs populations
and serves Aid for Dependent Children recipients who are "high risk." The program has a 90% retention
rate and is very effective at getting individuals off welfare.
Central State University's Adopted School Program is a collaborative effort between the University and
local school districts that provide opportunities to educate "at risk" students by implementing a programwhich a) encourages student self-identity, selfesteem, self concept, and selfworth; b) motivates students to
pursue higher education; c) encourages excellence and scholarship; d) encourages student concern for one
another; e) promotes literacy learning, communication activities (reading, writing, listening), and thinkingskill activities. Ten schools have been "adopted" since the beginning of the program in 1986.
Through collaboration and cooperation with other agencies and organizations in the community, Shawnee
State University is attempting to improve quality of service through cost saving programs that provide, at
no cost to the University, a communityservicx anda "feeder system" for recruiting students. These programsindude several funded initiatives through the CommunityAction Organization (Career Life Planning, theGED program, Adult-BASICS). In addition, a local industry (Martin-Marietta) has provided funding forseveral programs such as the Math-Science Academy for high school students, providing an excellentrecruiting device for potential freshman.
Appendix FState-Level elw Public College ef- UniversityEfforts to Increase Efficiency
t)
SDITE-LEVEL EFFORTS
TO IMPROVE EFFICIENCY AND INCREASE COST SAVINGS
Subsidy formula. The higher education subsidy formula encourages cost-containment by allowinginstitutions to keep the money they save duough prudent use of resources. Having their own "rainy-day" fundsmakes it possible for the colleges and universities to survive the instability in state funding.
Efforts to strengthen the preparation of high school students for college. A variety of early interventionprograms have been used to reduce the need for remediation of high school graduates, and increase the chancesfor student success in college.
Since 1980, the Ohio Board ofRegents has conducted a survey ofcollege and university remedial course
enrollments in mathematics and English, providing a copy of the study to each school district in thestate.
In 1981 the Board of Regents and the Board ofEducation developed a college-preparatorycurriculumto strengthen the academic preparation of college-going students. Ohio's high school students whosuccessfully complete the college-preparatory curriculum are admitted unconditionally to the state'suniversities; without having completed the college preparatory curriculum, the student is conditionallyadmitted and placed in remedial courses if needed. The two state-level Boards are currendy developinga technical-preparatoryauriculum to strengthen the preparation ofstudents for success in communityand technical colleges.
For more than a decade, the Board of Regents has funded programs that involve college/universityfaculty and school teachers in partnerships to improve student learning in mathematics, English andscience.
Over 60,000 high school juniors are tested for their college readiness in mathematics through theEarly College Mathematics Placement Testing Program administered by the Department ofMathematics of The Ohio State University. If needed, the students can then take additionalmathematics courses in their senior year to prepare for college.
Through the Early English CompositionAssessment Program, thousands of high school studentwriting samples have been assessed, and the teaching ofwriting in the schools has been improved.Approximately 35 Ohio colleges and universities have participated in this program since 1984.
The federal EisenhowcrMathematics and Science Education Improvement Programwas createdby Congress in 1984 and is used in Ohio to pair college faculty with elementary and secondaryteachers to strengthen curriculum and teaching methods and to provide creative ways to stimulatestudent interest in science.
Project Discovery links schools, colleges and universities together on a regional basis to systemically
improve the teaching of mathematics and sciences atall levels. This project is one of a few nationwide
to receive a multi-year National Science Foundation grant.
These efforts, combined with the college - preparatory curriculum and conditional admission standards,
have led to a reduction in mathematics andEnglish remediation levels in most ofOhio's public universities, and
improved the academic success of students. Themajority of students who need remedial coursework are now
attending university regional campuses, community colleges and technical colleges.
Linking colleges and universities through technology. Several investments have been made in long-term
cost-containment strategies through thedevelopment and use oftechnology for research, teaching,administra-
tion, and inter-institutional communication:
The Ohio Supercomputer Center was established in 1987 to provide subsidized computing resources
to Ohio faculty and administrators. The services of the Center are now available to Ohio research
universities, both public and private, and to industry subscribers who pay a fee for use of the
Supercomputer. The Supercomputer linkages arealso used to support OhioLink and OAR= andwill
be used to support the statewide articulation and transfer of students.
OhioLink, still in the development stage, will provide state-of-the-art library information and retrieval
by linking the state's principal public and private academic libraries electronically to aeate a single
collection of enormous magnitude. When fully operational, students, acuity and researchers will be
able to quiddy locate and retrieve materials regardless of their location around the state.
OARnet (Ohio Academic Resource Network) is the regional electronic network for the state ofOhio.
It serves the entire highereducation community,providing Ohio access to scholars worldwide. OARnet
also directly supports the research efforts of Ohio's businessand industry. The Ohio Supercomputer,
OhioLink, and databases of various types are accessible through OARnet. [ONet, the electronic
network linking the two-year campuses, is being merged with OARnet to streamline operations.]
Encouraging collaboration, avoidingduplication. The most notable attempts to foster inter-institutional
collaboration have been in research, job training, and health/medical education:
The Northeast Ohio Universities Provost Group, which indudes Cleveland State, Kent State,
Youngstown State and Akron Universities, has been working for several years on joint planning of
graduate degree programs in order to avoid duplication and to save costs by sharing resources.
The Medical College of Ohio at Toledo, and Northeastern Ohio Universities College of Medicine
each wo rkwith their neighboring colleges and universities to provideeducational programs in medicine,
nursing and allied health fields, as well as collaborative research in basic medical sciences.
Enterprise Ohio is the two-year college network for customized job training and retraining for businessand industry. Through the network, campuses share expertise and resources so that these services canbe provided anywhere in the state they arc needed.
The Ohio Aerospace Institute and the newly formed Materials Network (MATNet) draw scientistsand engineers from Ohio universities and industries together to maximize the state's potential gainsfrom the creation and application of new knowledge.
Area Health Education Consortia for more than a decade have linked on a regional basis universitymedical and health resources (teaching, research and service) more dosely to community needs and the
resolution of community problems.

PUBLIC COLLEGE & UNIVERSITY
EFFORTS To IMPROVE EFFICIENCY & INCREASE COST SAVINGS
The college and university task forces identified a number of management and cost-containment strategiesthat could be used at the state-wide level and on the campuses to provide the highest quality services at lowestcost. The following is a representative sample ofthese strategies, and in some cases, specific institutional effortsare highlighted. A number ofthe initiatives have been in place for some time. For example, energy conservatior.
strategics were begun in the early 1970's spurred on by the oil crisis. Other strategies are recent inventions asa result of the increasing use of technology to support administrative and academic services or as a result ofgrowing concern regarding the cost of providing health care benefits to employees. In many cases, efficienciesin the following areas not only represent significant cost savings but also provide substantial enhancements tothe quality of instruction provided on the campus.
Contain Costs
Clarify and communicate institutional mission. Eliminate those programs and services no longer centralto the mission.
Review programs for centrality, quality and demand, to determine if the program/service should beenhanced, continued, consolidated, reduced or eliminated.
Review support services for centrality, connection to other services, process improvements needed, andpolicies, rules and practices that need to be revised or eliminated.
M ission/policy change in the Division of Continuing Education. (University of Toledo) To bettermeet the career-related needs of the community, the Division of Corrinuing Education hasrefocused its mission. The Division is a completely self-supporting opet ttion and in the past,surplus revenues from this activity have been transferred into the University fund to supportother operations. The policy change will reduce the number ofpersonal interest courses and focusinstead on those endeavors that will assist Toledo residents in returning to work.
Develop more effective staffing patterns. Rely more extensively on student workers, recruiting volunteers,and introducing flexible schedules.
"Loaned Executive" Assistance. (Sinclair Community College) The College augments thinly staffedtechnical functions (insurance, employee benefits, investments) through the use ofoutside services, thusavoiding the cost of adding permanent full-time employees to the College (i.e. purchasing consultant,insurance consultant, physical plant consultant, attorney, architect, graphic designers, photographers,etc) and allows for the purchase of services on an as-needed basis.

Area Maintenance Shop. (Miami University) Within the physical facilities areaof the university, work
formerly done by skilled trade classifications has been reassigned to more cost effective semi-skilled
workers who are capable ofhandling the work. This has resulted in an annual savings ofapproximately
$60,000. Other savings in the physical facilities area have been realized through the effective use of
personnel. For example, supervisory staffhave been streamlined through attrition fora $37,000 annual
savings and -improved scheduling and the use of overtime payments have resulted in a savings of
approximately $30,000 annually. In addition, the in-house design of mechanical/electrical systems
constructions projects has saved $80,000 to $125,000 in consulting fees.
Early Retirement (Clark State Community College) Since the implementation
of the program, the College has saved $250,000 annually. The original investment of pay-out funds
was recovered after the first 18 months of operation.
12thaLmairs
Use of adjunct faculty to improve efficiency and provide necessary flexibility for ebb/flow of
enrollment profiles
Use of student workers to reduce costs and provide employment for economically disadvantaged
students
Providing incentives in lieu of salary increases (i.e. personal days)
Monitor overtime employment of staff and employ use of shift and alternate days off strategies
Provide variable term contracts (9 month, 10 month, 12 month)
Provide variable workweek schedules in offices which experience highs and lows (weekly, monthly,
seasonally) in workload
Use of four-day work weeks in which staff schedules are rotated but the office unit continues to
operate for full service hours
Development of procedures for "sharing" support services (i.e. secretarial)
Use technology. Streamline communications, improve processesand decisions, and increase instructional
productivity within institutions as well as among institutions.
Quality/EfficiencyEnhancementsThrough Technology (Columbus St2te Community College) -The
College's administrative computer system provides daily, up-to-date information on admissions,
41) registration, course enrollment, and student performance. The availability of adjunct faculty,combined with this current information, enables the college to expand or reduce course sections each
quarter to accommodate fluctuating student enrollments.
J nstallation/Mai ntenance/Repair ofEquipment. (Bowling Green State University) The University hasbeen performing its own microcomputer installation, repair and maintenance resulting in a savings of
over $150,000 per year. Similarly, the University installs, maintains, and repairs single line telephones.
Contracted service for this would cost over $150,000 per year.
Other Strategies:
Cross referencing of student, employees, alumni to eliminate duplication of mailing
Use of postal pre-sort services and reduction of overnight mail service
Consolidation of all appropriate university-wide memos/notices into one weekly notice
Development of a single data base for student records with decentralized access for such studentservice areas as Admissions, Registration and Records, Student Financial Aid and StudentAccounts
Implementation of a telephone registration system to improve service to students and ease theregistration process
Monitoring of optimum class size for planning/scheduling purposes
Consolidate purchases. Collaborate with other colleges and universities or community organizations,especially for big-ticket items such as insurance (health and risk) and equipment.
caraupliuchasingElank (Jefferson Tedmical College). To maximize the purchase ofgoods and servicesthe college maintains membership in and uses the purchasing contracts ofthe I nter-University Counciland the Educational and Institutional Cooperative purchasing groups. The college is currentlyworkingwith the other two year colleges regarding the formation of a group for the purpose of obtaining lower
rates for workers' compensation and property/liability insurance.
Reduce energy and maintenance costs. Reduce energyand maintenance costs through deliberate planningand action.
Thclnagyklanaguncillacztain (Ohio University). The Energy Management Program, throughindividual projects that have impacted the use of all utilities (coal, gas, electricity, and water) has hada total cost avoidance estimated at $5,554,779 over the first ten years of the program. An investmentof$490,798 in the last four years alone has resulted in a cost avoidance for the same time period ofmore
than $3 million.

Energy Management System. (Kent State University) The Energy Management System controls and
monitors critical building functions, providing the earliest possible alert to fires, floods and technical
programs that could, if undetected, cause significant damage to facilities and disruption ofservices. The
EMS and other energy-related measures set in motion since the mid-70's have resulted in a 28%
reduction in energy use on campus. Conservatively,this translates to a savings of$3.5 million in energy
costs.
illwarluy__Ezyclingyuggam. (Miami University) The University RecyclingProgram is presently
recovering 35% to 37% of the solid waste stream, which is approximately comparable to the waste
generated by 50 academic and administrative buildings. In addition, the National Association of
College and University Business Officers has singled out the physical facilities department at Miami
University for many cost reduction awards. Awards for the "Use of Semi Trailers for Storage",
"Refurbishing of Classroom Furnishings in Lieuof Replacement with New Furnishings", "Low Cost
Modification of Electrical Distribution System to Provide Common Secondary Neutrals:, and
"Reducing Solid Waste Disposal through Recydingof Polystyrene (Styrofoam)" have been received.
The annual savings of these programs amounts to $180,000 with an additional $130,000 in cost
avoidance.
Competitive Bid Process. (Clark State Community College) The College has reinstituted competitive
bidding processes for insurance and maintenance (heating and cooling) contracts with resulting
reductions in expenditures of $60,000 per year since 1988.
Facilities Maintenance . (Youngstown State University) The preventive maintenance
program of the University provides for operating and maintenance expenditures 18% below the
national average ($2.63 per Nuare foot versus $3.21).
space Utilization (Ohio University). The space utilization and managementplan is continually revised
to have a cost efficient and appropriately sized system-wide physical plant. A key part ofthis plan is the
development of procedures to use classroom space more effectively and provide more options for
students to take classes during the entire day and throughout the week, thereby reducing the number
ofcourses scheduled at competing times. Procedures were put into effect to insure that each academic
department offers at least 10 percent of its doses at 8 a.m., 10 percent at 12 noon, and 10 percent after
3 p.m. Also, each department must offer at lear,c 15 percent of its classes on Friday. The program has
resulted in a reduction of student course dose outs and a significant increase in classroom utilization.
Additional Strategies:
Use of night and weekend set-back temperatures for heating/cooling to save energy during
unoccupied building status
Replacement of building lights with long life, low wattage fluorescent type lights
to-
Installation of energy efficient replacement windows throughout the campus
Transition from coal to gas fired boilers to effect more cost effective, environmentally safe service
Use of computerized controls of energy systems
Installation of an energy saving roofing system
Collaborate. Collaborate with other colleges and universities in program and service delivery by sharing
faculty, equipment, space, curriculum, and other resources.
Facility and StafFSharing (Muskingum Area Technical College) Muskingum Area Technical Collegeshares facilities and staffwith nearby Ohio University- Zanesville Branch. These campuses share plantoperations, athletic and physical education facilities, library services, food service, security, studentactivities, maintenance, and bookstores.
Privatize. Privatize those services that can be done more cost effectively by private vendors, e.g., custodial
and food services.
Lacrear,Ltalyaipity
Set institutional expectations for faculty work load. Set expectations that are consistent with mission andmake the most appropriate use of faculty time and talents.
Develop ways to increase the amount ofstudent teaming generated with eadi hour of faculty instruction.Use technology, innovative teaching/leaming methods to enhance student learning.
Educational Delivery Program & Technology.(Ohic University) The Telecommunications Center,with the assistance of Regional Higher Education, has installed a higher education microwave systemlinking all five of the University's regional campuses with the Athens campus. The basic purpose of thesystem is to allow a faculty member on one campus to teach students simultaneously on two or morecampuses. Over 60 hours a week are used for instruction and other microwave times are used to conduct
teleconference meetings, training, and student job interviews. The system is also used for all telephone
trunk lines between the campuses. The cost savings in faculty salaries, travel and telephone tolls are over
$500,000 per year.
Individualized warning Center (ILC). (Sinclair Community College) ILC provides educationalopportunities for students enrolled in eighty different courses. Instruction is delivered in a centrallocation via audio-tutorial, video tape, and computer-assisted instruction. ATesting Center is adjacentto the ILC which enables students to take formative and sum mauve tests as they progress independentlythrough a course.
Conversion from Academic Quarters to Semesters (Edison State CommunityCollege). The College
will convert from quarters to semesters in Fall 1993, thus saving a minimum of $110,000 annually to
register students twice a year instead of three times. This conversion will provide a better learning
environment for students as well as lessen costs.
Membership in the Southwestern Ohio Council for Higher Education. (Sindair CommunityCollege)
The Council, which promotes inter-institutional cooperation and cost effectiveness, provides such
opportunities to the College as 1)cross-registration that permits students to enroll in courses notavailable at Sinclair, but available at other member institutions, 2)cooperative library activities includingacquisitions, cataloging, serials, review, staffdevelopment, and inter-library loanofprint and non-printmaterials,; 3) maintenance ofan office at Wright Patterson Air Force Base to provide college educational
information and services to interested personnel.
Other Strategies:
Use of local health care and human services agencies to provide supervision of college studentpracticums and absorb costs of these teaching/learning opportunities
Curriculum revision to focus on core academic issues and to eliminate specialty courses
Provide incentives. Reward increased productivity in all parts of the institution.
Use Total Quality Management principles. Develop more effective management and instructionalprocesses.
Total Quality Assurance Program (Lorain County Community College) The College is in the second
year of mplementation ofa Total QualityAssurance Program to insurethe effectiveness ofits programs
and services and to promote the process of continuous improvement.
Reform or
Develop "system" goals and structure. Develop "System" goals and structure for higher education in Ohio.
Institute systematic short- and long-range planning. Systematic short- and long-range planning shouldbe instituted on each campus and at the Mite level.
Strategic Planning Process. (Clark State Community College) The College has engaged in a strategicplanning process as a means for evaluation and improving service. Since 1985, the College has reducedannual expenditures by $560,000 while planning for the transition to state community college dramasaccomplished in 1988.
Create a flexible and adaptable organizational structure.
Encourage innovation. Encourage innovation in instruction and management.
Medical Telecommunicationautan. (NEOUCOM) NEOUCOM, with the assistance of theUniversity of Akron, Youngstown State University, Kent State University and the NortheasternEducational Television ofOhio consortium (NETO), has completed the developmentand installationof a two-way interactive color television network among hospitals n the Akron, Canton andYoungstown clinical campuses. The system provides two-way interactive teaching and conferencingactivities among the three consortium universides and eight major teaching hospitals. Associated costsavings include, but are not limited to minimizing the duplication offacultyeffort, reducing the numberand amount of stipend payments associated with visiting professor programs, reducing training costsassociated with faculty/staff development, and providing a system for data transmission.
Health Care Cost (Ohio University). The University operates a self- fundedhealth laenefits program. In January, 1992, changes were made in the plan to provide greater oast savings
and induded: a graduated deductible payment that increases with higher staffsalaries, increased shareof cost of prescription drugs, instituted pre-tax spending accounts to assist the employee in defrayingmedical costs, increased areas covered under the utilization review program. The overall healthcare costavoidance for fiscal year 1993 is projected to be in excess of $500,000.
Pooled Insurance Carrier (Kent State University). Kent State University and 16 other Cleveland-areapublic and private colleges and universities that constitute the Cleveland Commission on HigherEducation are exploring the possibility of jointly purchasing health insurance for their employees (thecombined cost of which has reached a staggering $43 million).
Foster collaboration and partnerships. Foster collaborative efforts between colleges and universities,community organizations, and business and industry.
Community Based Consortium (Northeastern Ohio Universities College of Medicine). As a free-standing community based medical school, NEOUCOM is a leader in collaboration and cooperation.The structure of NEOUCOM enables the College of Medicine to deliver a high quality programwithout enormous capital expenditures typically associated with the development of academic healthsciences centers. The eight major teaching hospitals provide students with access to excellent facilities(approximating $717 million in buildings and equipment) and total operating budgets in excess of$1.151 billion dollars.
In the next decade, NEOUCOM will achieve additional economies through cooperative/collaborativeendeavors such as the Cooperative Regional Library Depository. In this effort, NEOUCOM willconstruct and operate a high density, shared library storage facility combining filing, retrieval, anddelivery services to provide economical storage oflow-activitylibraty books and other boxed materials.
The building will be a shared facility for use by The University ofAkron, Cleveland State University,
Kent State University, the NortheasternOhio Universities College ofMedicine andYoungstown State
University.
NEOUCOM will also construct and operate aClinical and Basic Sciences shared research facility. The
College of Medicine has seven basic medical sciences departments located at the Rcotstown campus
and coordinates nine clinical departments among eight major teaching hospitals comprising clinical
campuses in Akron, Canton and Youngstown. The Collaborative Research Facility will not only
provided needed space, but will encourage collaborative research from all of these campuses.
I I . II I t. .1* I IS AI (Cleveland State University). A consortium of 32
colleges and universities has been formed, using Cleveland State University as the fiscal officer, to save
each school 37% on the cost of maintenance for computers supplied by DEC. For a small ($10,000)
annual fee, Cleveland State University administers the agreement. DEC agreed to steep discounts on
maintenance costs by centralizing their billing. Total savings in 1989 were $574,270 and $606,970
in 1990.
Increase Income From Non-State Source$
Remove caps on tuition and fees. Removing the caps on tuition and fees allows boards of trustees the full
authority to balance institutional budgets in times of fiscal stress.
Charge user fees. Charge user fees for special servicesprovided to students and community groups.
Collect reimbursement for indirect costs. Indirect costs from auxiliary services, grants and contracts can
provide additional revenue.
Increase private support. Foundations, alumni and friends are sources of increased private support.
Encourage donations of goods and services (especiallyequipment). Business and industry are sources of
needed goods and services.
Manage enrollments. Manage enrollments to generate and sustain maximum subsidy, tuition and fee
income while incurring only marginal increases in program expenditures.
Increase Externally Funded Research and SponsoredActivity.
Technology Development. (University ofAkron) The University has been aggressive in seeking patent
protection for discoveries by its faculty and students. In 1991, the University hired an outside firm, on
a commission basis, to actively pursue licensing opportunities possible with University-owned
technology. In less than a year, the arrangement has yielded several new agreements which could
produce significant licensing and royalty income in the future.
Create profit centers from customized training for business and industry.
Secure a better return on institutional investments. This would require changes in Section 135.14 of theOhio Revised Code.
NATIONAL ASSOCIATION OF COLLEGE & UNIVERSITY BUDGET OFFICERS
COST REDUCTION INCENTIVE AWARD WINNERS
OHIO PUBLIC UNIVERSITIES
Several of0hio's universities have received national attention for cost-containment efforts. These programs
serve not only the state but are models of best practice for colleges and universities across the country. Award
winners since 1987 are listed below.
1987
Miami UniversityInternational Mail Service by Means of Remailers
Medical College of Ohio at ToledoInstallation of Blow-Down Meters for Cooling
The Ohio State UniversityIn-House Renovation and Maintenance Program for Parking Garages
1988
Kent State UniversityBoiler Jacket Heat Recovery
Miami UniversityLaboratory Equipment Retrofit
University of CincinnatiState Universities of Ohio Motel/Hotel Discount Rates
1989
Miami UniversityA Shared Installation Plan: The University and the Bank
Miami UniversityComputer-Enhanced Student Athletic Progress Tracking System
Miami UniversityInstrumentation Laboratory Plastics Fabrication Program
1990
The Ohio State UniversityBar-Coded Student Long Distance Service Registration
Bowling Green State UniversityReusable glassware versus Disposable Paperware
Wright State UniversityPaper less Loan Application Process
Miami UniversityReducing Solid Waste Disposal Costs
1991
Appendix GRevenue & Expenditure Sources forOhio Public Colleges 6 Universities
Alder.4,"
'44"15,$,

TA
BL
E 9
- R
even
ues
per
FTE
stu
dent
, per
ful
l-tim
e fa
culty
mem
ber,
and
per
1,0
00 c
apita
, by
sele
cted
sou
rces
and
by
cont
rol a
nd le
vel o
f in
stitu
tion,
198
8-89
Con
trol
&le
vel
Tot
al E
& G
Tui
tion
Fed
eral
Sta
te &
loca
lS
tate
& lo
cal
Fed
eral
gra
nts
Fed
eral
gra
nts
Inco
me
from
of In
stitu
tion
reve
nues
and
fees
appr
opria
tions
ar.o
ropr
latio
nsap
prop
riatio
ns&
con
trac
ts p
er&
con
trac
ts p
erpr
ivat
e so
urce
s
per
stud
ent
per
stud
ent
per
stud
ent
per
stud
ent
per
1,00
0 ca
pita
stud
ent
facu
lty m
embe
rpe
r st
uden
t
Am
ount
Inde
xA
mou
ntIn
dex
Am
ount
Inde
xA
mou
ntIn
dex
Am
ount
Inde
xA
mou
ntIn
dex
Am
ount
Inde
xA
mou
ntIn
dex
Pub
lic8.
942
-22.
730
5762
-18
4,19
4-1
615
7.28
8-2
064
0-3
215
.720
-28
544
15
4-ye
ar-a
nd-a
bove
10.2
34-1
23,
092
4077
-25
4.60
9-2
312
8,84
4-1
383
4-3
919
.482
-31
713
-1
Doc
tora
l with
med
ical
13.7
48-2
83.
241
1416
6-2
75.
982
-32
76.3
4517
1.57
1-4
936
.938
-36
1.33
6-1
8
Doc
tora
l w/o
med
ical
7.49
2-2
43.
131
400
-100
3,45
1-3
343
.411
-124
3-7
75.
882
-74
186
-65
Mas
ter's
6.23
8-1
02.
318
390
-100
3.28
8-2
75.
487
-84
3743
587
3-8
428
311
1
Bac
cala
urea
te6,
345
71.
917
2720
253.
809
43.
602
414
9-4
73.
461
-47
87-1
9
2-ye
ar5.
159
31.
670
7619
-39
2,97
9-1
028
.444
-41
72-6
4.2
.156
-65
479
Inde
xes
ore
bard
on
U.S
. ow
erag
e of
0.
Sou
rce:
Sia
m I,
her
Fata
tatio
n Pr
tele
s; F
eb E
ditio
n (D
raft
),U
.S. D
epar
tmen
tofE
duca
tion,
OE
R1
May
, 199
2
-
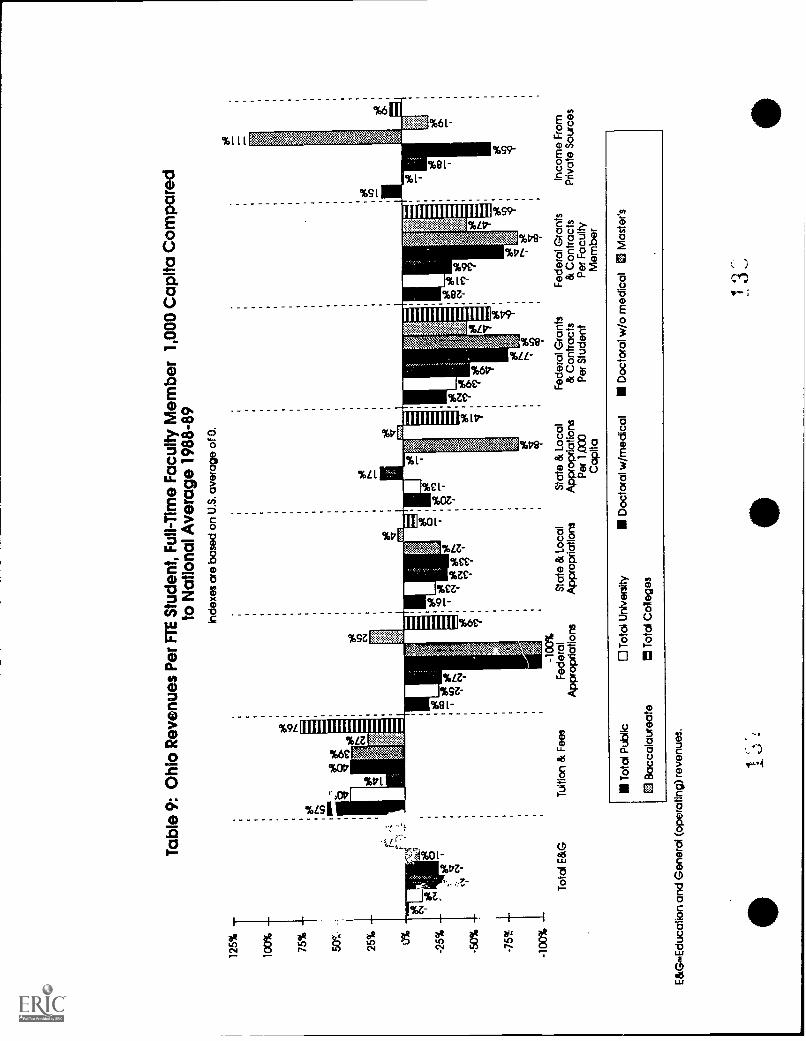
125%
100% 75
%
25% 0%
-25%
-50%
-75%
-100
%
Tab
le 9
: Ohi
o R
even
ues
Per
FT
E S
tude
nt, F
ull-T
ime
Fac
ulty
Mem
ber
1,00
0 C
apita
Com
pare
dto
Nat
iona
l Ave
rage
198
8-89
Inde
xes
are
base
d on
U.S
. ave
rage
of 0
.be
at
be
at CV
aba
lCV
fcih
Tot
al E
&G
Tui
tion
& F
ees
-100
%F
eder
alA
ppro
pria
tions
Sta
te &
Loc
alS
tate
& L
ocal
Fed
eral
Gra
nts
Fed
eral
Gra
nts
App
ropr
iatio
nsA
ppro
pria
tions
& C
ontr
acts
& C
ontr
acts
Priv
ate
Sou
rces
Per
LO
CO
Per
Stu
dent
Per
Fac
ulty
Cap
itaM
embe
r
Inco
me
Fro
m
Tot
al P
ublic
Tot
al U
nive
rsity
0 B
acca
laur
eate
0 T
otal
Col
lege
s
Doc
tora
l w/m
edic
alD
octo
ral w
/o m
edic
alM
aste
r's
E&
G=
Edu
catio
n an
d G
ener
al (
oper
atin
g) r
even
ues.
3
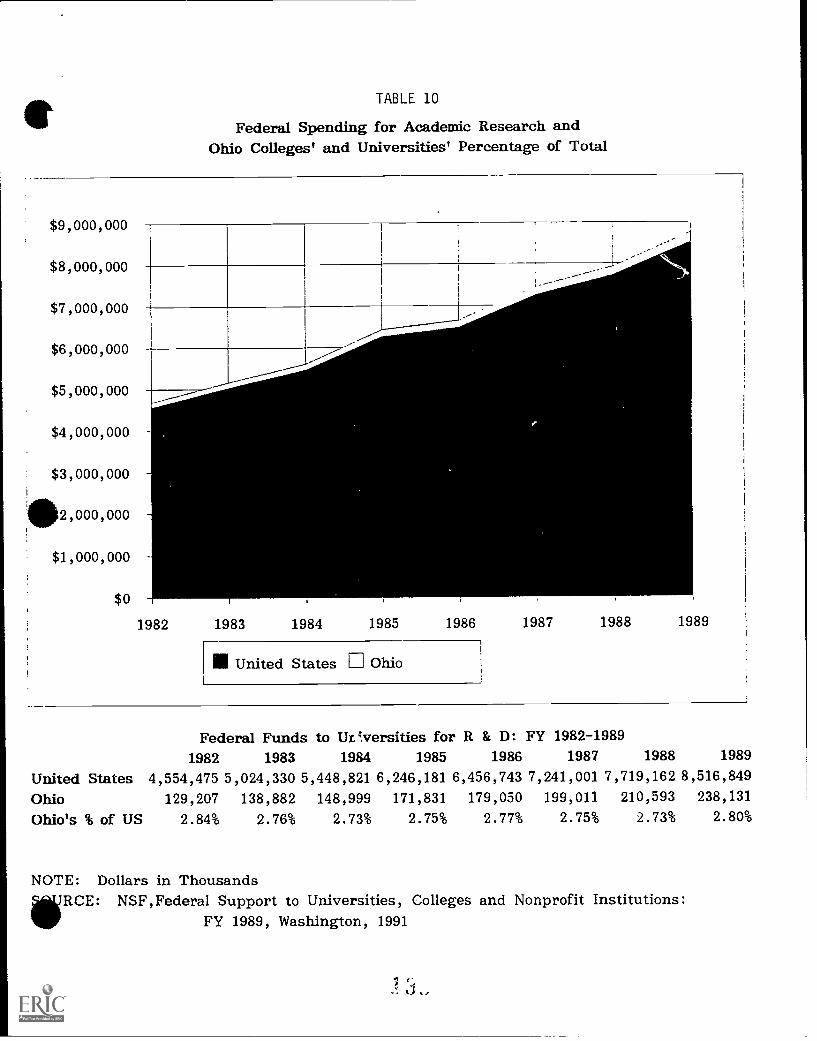
TABLE 10
Federal Spending for Academic Research andOhio Colleges' and Universities' Percentage of Total
$9,000,000
$8,000,000
$7,000,000
$6,000,000
$5,000,000
$4,000,000
$3,000,000
02,000,000
$1,000,000
$0
1982 1983 1984 1985 1986 1987 1988 1989
III United StatesFl Ohio
Federal Funds to UO.versities for R & I): FY 1982-19891982 1983 1984 1985 1986 1987 1988 1989
United States 4,554,475 5,024,330 5,448,821 6,246,181 6,456,743 7,241,001 7,719,162 8,516,849Ohio 129,207 138,882 148,999 171,831 179,050 199,011 210,593 238,131
Ohio's % of US 2.84% 2.76% 2.73% 2.75% 2.77% 2.75% 2.73% 2.80%
NOTE: Dollars in ThousandsNSF,Federal Support to Universities, Colleges and Nonprofit Institutions:
FY 1989, Washington, 1991
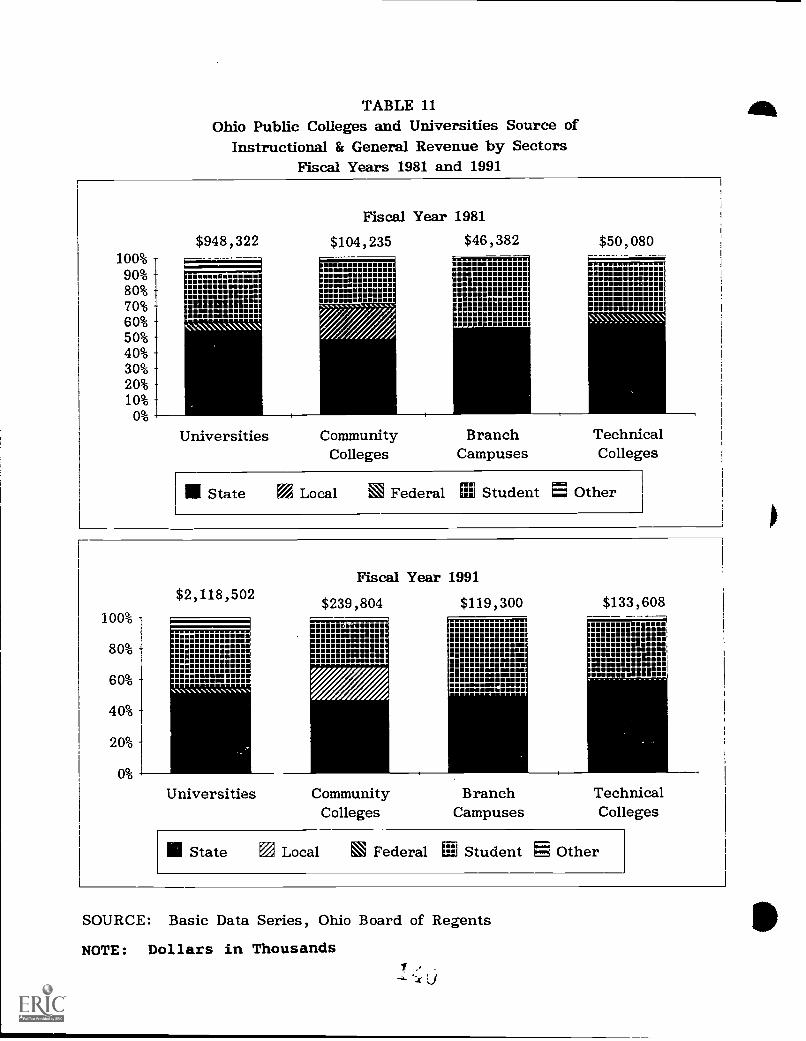
TABLE 11Ohio Public Colleges and Universities Source of
Instructional & General Revenue by SectorsFiscal Years 1981 and 1991
$948,322100%
90%80%70%6096
50%40%30%20%10%
0%
Fiscal Year 1981
$104,235 $46,382 $50,080
E
E
,Z\\\\\\
Universities CommunityColleges
Branch TechnicalCampuses Colleges
State Local E Federal in Student a Other
100%
80%
60%
400
20%
0%
$2,118,502Fiscal Year 1991
$239,804 $119,300
Universities CommunityColleges
1111 State
BranchCampuses
$133,608
TechnicalColleges
Local E Federal Hi Student g Other
SOURCE: Basic Data Series, Ohio Board of Regents
NOTE: Dollars in Thousands-a.

TABLE 12Ohio Public Colleges and Universities Source of Instructional &
General Revenue by Selected UniversitiesFiscal Years 1981 and 1991
100%
80%
6096 1
40%
20%
0%
$37,167
Fiscal Year 1981
$50,032 $258,556
YOUNGSTOWN CLEVELAND OSU
\:\
$136,280
U. OFCINCINNATI
III State it Local M Federal Et Student rE Other
100%90%80%70%60%50%40%30%
20%10%
0%
$75,612
I rrrrrrrrrrrrrl
Fiscal Year 1991
$109,015 $545,465
E
$289,461
NNNVONN\\N\NN\
YOUNGSTOWN CLEVELAND OSU U OFCINCINNATI
U State E.1 Local Federal To Student g Other
SOURCE: Basic Data Series, Ohio Board of Regents
NOTE: Dollars in Thousands
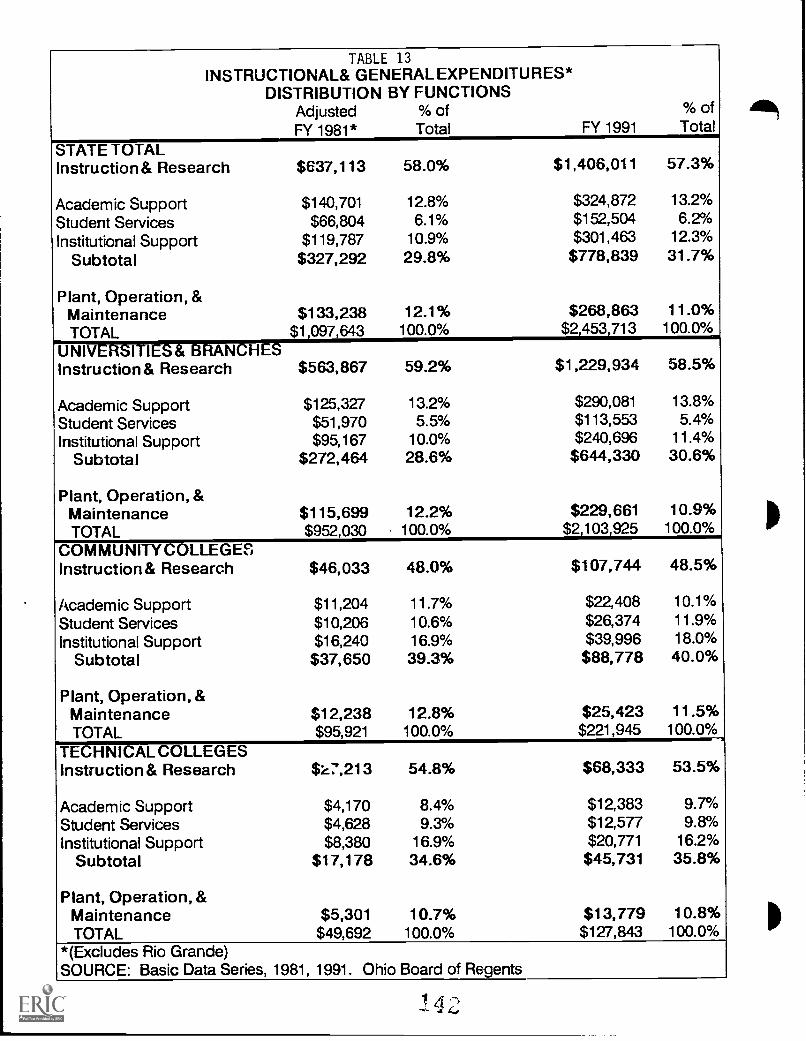
TABLE 13INSTRUCTIONAL& GENERAL EXPENDITURES*
DISTRIBUTION BY FUNCTIONSAdjusted % ofFY 1981* Total FY 1991
% ofTotal
STATE TOTALInstruction & Research $637,113 58.0% $1,406,011 57.3%
Academic Support $140,701 12.8% $324,872 13.2%
Student Services $66,804 6.1% $152,504 6.2%
Institutional Support $119,787 10.9% $301,463 12.3%
Subtotal $327,292 29.8% $778,839 31.7%
Plant, Operation, &Maintenance $133,238 12.1% $268,863 11.0%
TOTAL $1,097,643 100.0% $2,453,713 100.0%
UNIVERSITIES & BRANCHESInstruction & Research $563,867 59.2% $1,229,934 58.5%
Academic Support $125,327 13.2% $290,081 13.8%
Student Services $51,970 5.5% $113,553 5.4%
Institutional Support $95,167 10.0% $240,696 11.4%
Subtotal $272,464 28.6% $644,330 30.6%
Plant, Operation, &Maintenance $115,699 12.2% $229,661 10.9%TOTAL $952,030 100.0% $2,103,925 100.0%
COMMUNITYCOLLEGESInstruction & Research $46,033 48.0% $107,744 48.5%
Academic Support $11,204 11.7% $22,408 10.1%
Student Services $10,206 10.6% $26,374 11.9%
Institutional Support $16,240 16.9% $39,996 18.0%
Subtotal $37,650 39.3% $88,778 40.0%
Plant, Operation, &Maintenance $12,238 12.8% $25,423 11.5%TOTAL $95,921 100.0% $221,945 100.0%
TECHNICAL COLLEGESInstruction & Research $'47,213 54.8% $68,333 53.5%
Academic Support $4,170 8.4% $12,383 9.7%
Student Services $4,628 9.3% $12,577 9.8%Institutional Support $8,380 16.9% $20,771 16.2%
Subtotal $17,178 34.6% $45,731 35.8%
Plant, Operation, &Maintenance $5,301 10.7% $13,779 10.8%TOTAL $49,692 100.0% $127,843 100.0%
*(Excludes Rio Grande)SOURCE: Basic Data Series, 1981, 1991. Ohio Board of Regents
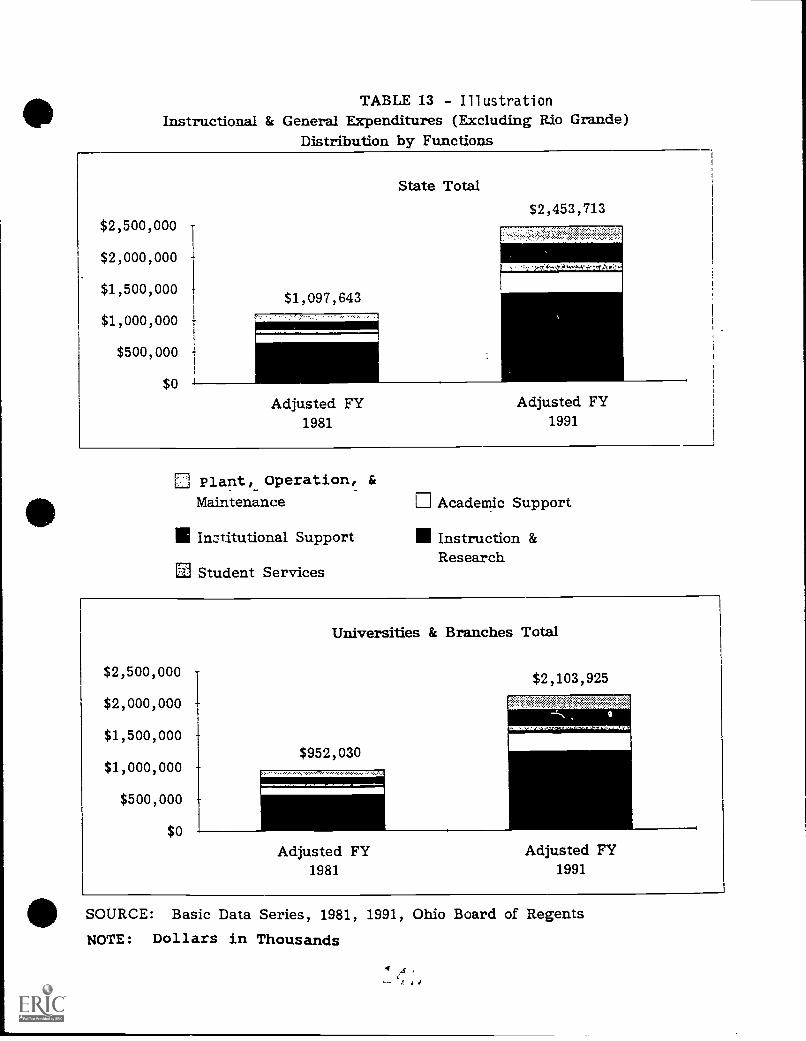
TABLE 13 - IllustrationInstructional & General Expenditures (Excluding Rio Grande)
Distribution by Functions
$2,500,000
$2,000,000
$1,500,000
$1,000,000
$500,000
$0
State Total
$1,097,643
$2,453,713
Adjusted FY Adjusted FY1981 1991
Plant, Operation, &
Maintenance
In3titutional Support
Student Services
Academic Support
II Instruction &Research
$2,500,000
$2,000,000
$1,500,000
$1,000,000
$500,000
$0
Universities & Branches Total
$2,103,925
$952,030
Adjusted FY Adjusted FY1981 1991
SOURCE: Basic Data Series, 1981, 1991, Ohio Board of RegentsNOTE: Dollars in Thousands
4 A
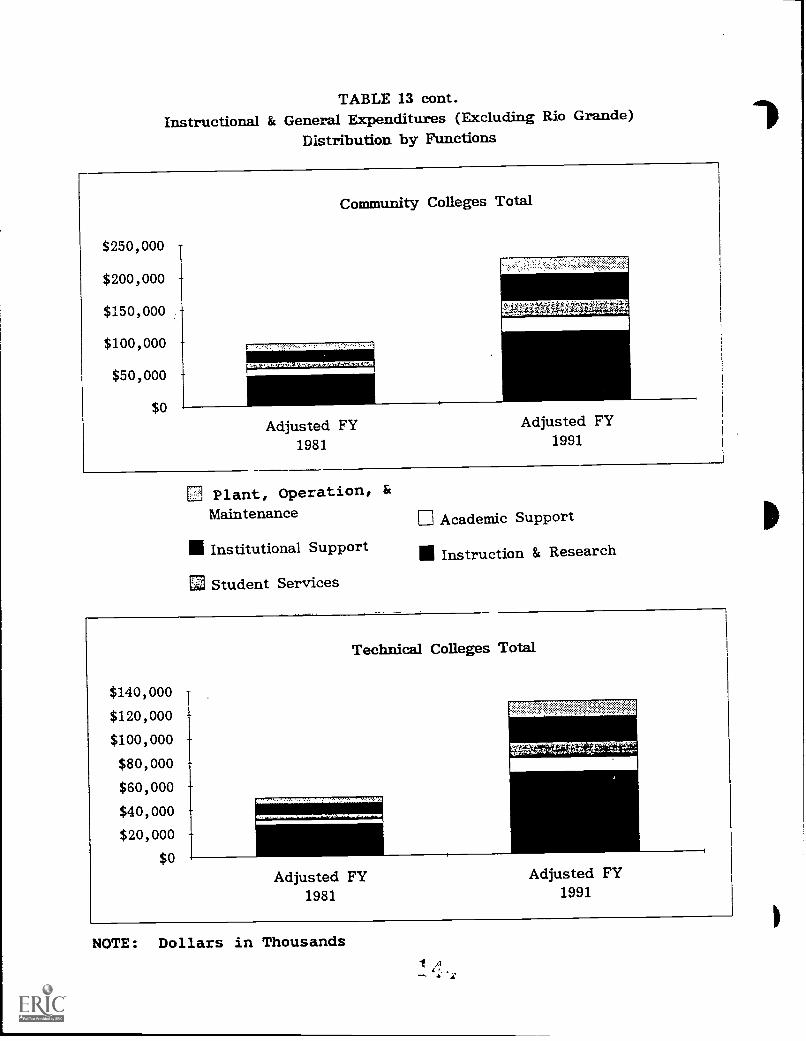
TABLE 13 cont.Instructional & General Expenditures (Excluding Rio Grande)
Distribution by Functions
$250,000
$200,000
$150,000
$100,000
$50,000
$0
Community Colleges Total
i +:41,-Ve44,,A
Adjusted FY1981
Adjusted FY1991
E Plant, Operation, &
Maintenance
1111 Institutional Support
Student Services
Academic Support
111 Instruction & Research
$140,000
$120,000
$100,000
$80,000
$60,000
$40,000$20,000
$0
Technical Colleges Total
IM1Adjusted FY Adjusted FY
1981 1991
NOTE: Dollars in Thousands1
A
1

TABLE 14INFLATION-ADJUSTED EXPENDITURES/STUDENT FTE
INSTRUCTIONAL AND GENERAL(Adjusted to FY 1991 dollars using CPI and HEPI; excludes Rio Grande)
81 -91FY 1981 FY 1991 % Change FY 1981 FY 1991
(CPI) (CPI) (HEPI)
81 -91% Change
(HEPI)
STATE TOTALInstruction & Research $3,278 $4,137 26.2% $3,660 $4,137 13.0%
Academic Support $724 $956 32.0% $808 $956 18.3%Student Services $344 $449 30.5% $384 $449 16.9%Institutional Support $616 $887 43.9% $688 $887 28.9%
Subtotal $1,684 $2,292 36.1% $1,880 $2,292 21.9%
Plant, Operation, &Maintenance $686 $791 15.4% $765 $791 3.4%TOTAL $5,648 $7,220 27.8% $6,305 $7,220 14.5%
UNIVERSITIES& BRANCHESinstruction & Research $3,633 $4,631 27.5% $4,055 $4,631 14.2%
Academic Support $807 $1,092 35.3% $901 $1,092 21.2%Student Services $335 $428 27.7% $374 $428 14.4%Institutional Support $613 $906 47.8% $684 $906 32.4%
Subtotal $1,755 $2,426 38.2% $1,960 $2,426 23.8%
IPPlant, Operation, &Maintenance $745 $865 16.0% $832 $865 3.9%TOTAL $6,133 $7,922 29.2% $6,847 $7,922 15.7%
COMMUNITY COLLEGESInstruction & Research $1,834 $2,436 32.8% $2,047 $2,436 19.0%
Academic Support $446 $507 13.5% $498 $507 1.7%Student Services $407 $596 46.7% $454 $596 31.4%Institutional Support $647 $904 39.8% $722 $904 25.2%
Subtotal $1,500 $2,007 33.8% $1,674 $2,007 19.9%
Plant, Operation, &Maintenance $487 $575 17.9% $544 $575 5.6%TOTAL $3,821 $5,018 31.3% $4,266 $5,018 17.6%
TECHNICAL COLLEGESInstruction & Research $1,941 $2,275 17.2% $2,167 $2,275 5.0%
Academic Support $297 $412 38.6% $332 $412 24.2%Student Services $330 $419 26.9% $368 $419 13.6%Institutional Support $598 $691 15.7% $667 $691 3.6%
Subtotal $1,225 $1,522 24.3% $1,368 $1,522 11.3%
IPPlant, Operation, &Maintenance $378 $459 21.3% $422 $459 8.7%TOTAL $3,544 $4,256 20.1% $3,956 $4,256 7.6%
$ in thousands
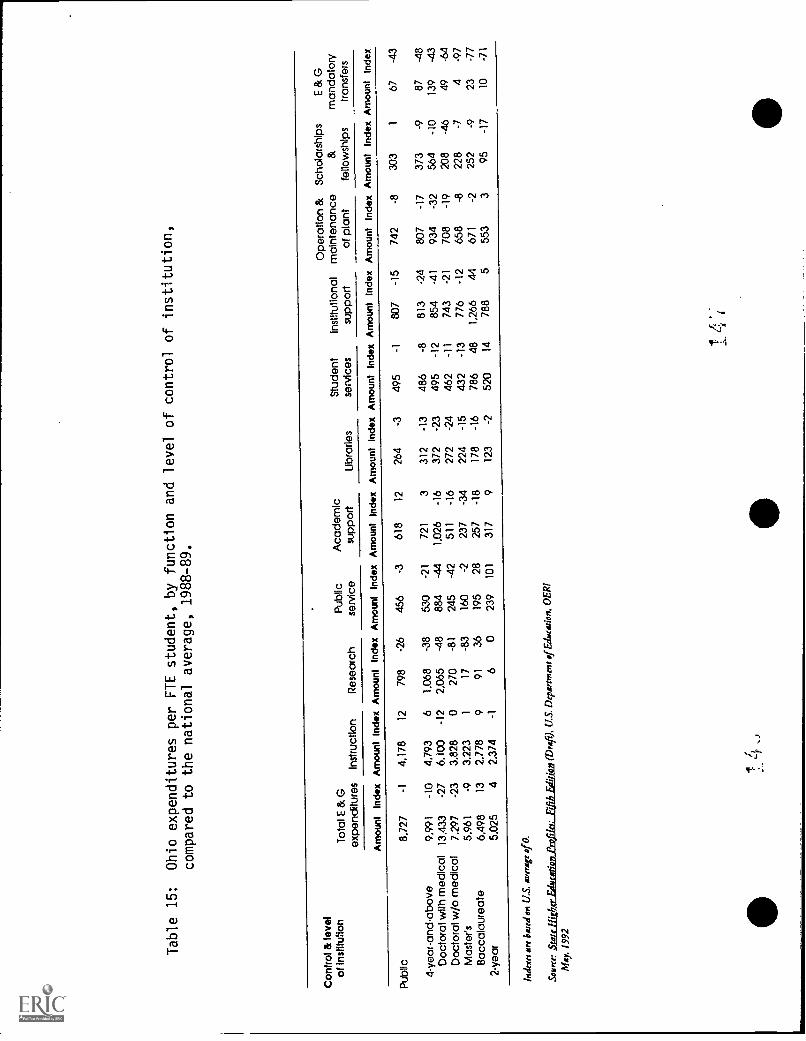
Table 15:
Ohio expenditures per FTE student, by function and level of control of
institution,
compared to the national average, 1988-89.
Con
trol
& le
vel
Ope
ratio
n &
Sch
olar
ship
sE
& G
of In
stitu
tion
Tot
al E
& G
Pub
licA
cade
mic
Stu
dent
Inst
itutio
nal
mai
nten
ance
&m
anda
tory
expe
nditu
res
Inst
ruct
ion
Res
earc
hse
rvic
esu
ppor
tLi
brar
ies
serv
ices
supp
ort
of p
lant
fello
wsh
ips
tran
sfer
s
Am
ount
Inde
x A
mou
nt In
dex
Am
ount
Inde
x A
mou
nt In
dex
Am
ount
Inde
x A
mou
nt In
dex
Am
ount
Inde
x A
mou
nt In
dex
Am
ount
Inde
x A
mou
nt In
dex
Am
ount
Inde
x
Pub
lic8,
727
-14,
178
1279
8-2
645
6-3
618
1226
4-3
495
-180
7-1
574
2-8
303
167
-43
4-ye
ar-a
nd-a
bove
Doc
tora
l with
med
ical
13.4
33-2
76.
100
-12
2.06
5-4
89.
991
-10
4.79
36
1.06
8-3
853
0-2
?88
4-4
41.
026
-16
721
331
2-1
348
6-8
813
-24
934
3127
373
-1-0
9
87-4
8
Doc
tora
l w/o
med
ical
7.29
7-2
33.
828
027
0-8
124
5-4
227
2-2
446
2-1
1
854
-41
708
-19
208
-46
49-6
451
1-1
637
2-2
349
5-1
213
9-4
3
Mas
ter's
5.96
1-9
3.22
31
17-8
316
0-2
237
-34
743
-21
224
-15
432
-13
776
-12
658
-88
-74
-97
Bac
cala
urea
te6.
498
132.
778
95.
025
42.
374
-91
3619
528
257
-18
178
-16
786
481,
266
44
-
671
-2 322
9525
2-1
:923
-77
2-ye
ar1
60
239
101
317
912
32
520
1478
85
553
10-7
1
Inde
xer
are
bead
en
U.S
. .eu
rrag
e
Som
me:
Sta
te H
eer
&tw
ain:
on P
rOkt
: Fifi
h E
ditio
n (D
raft)
. U.S
. Dep
artm
entof
Vac
atio
n. O
ER
1
May
, 199
2
4r
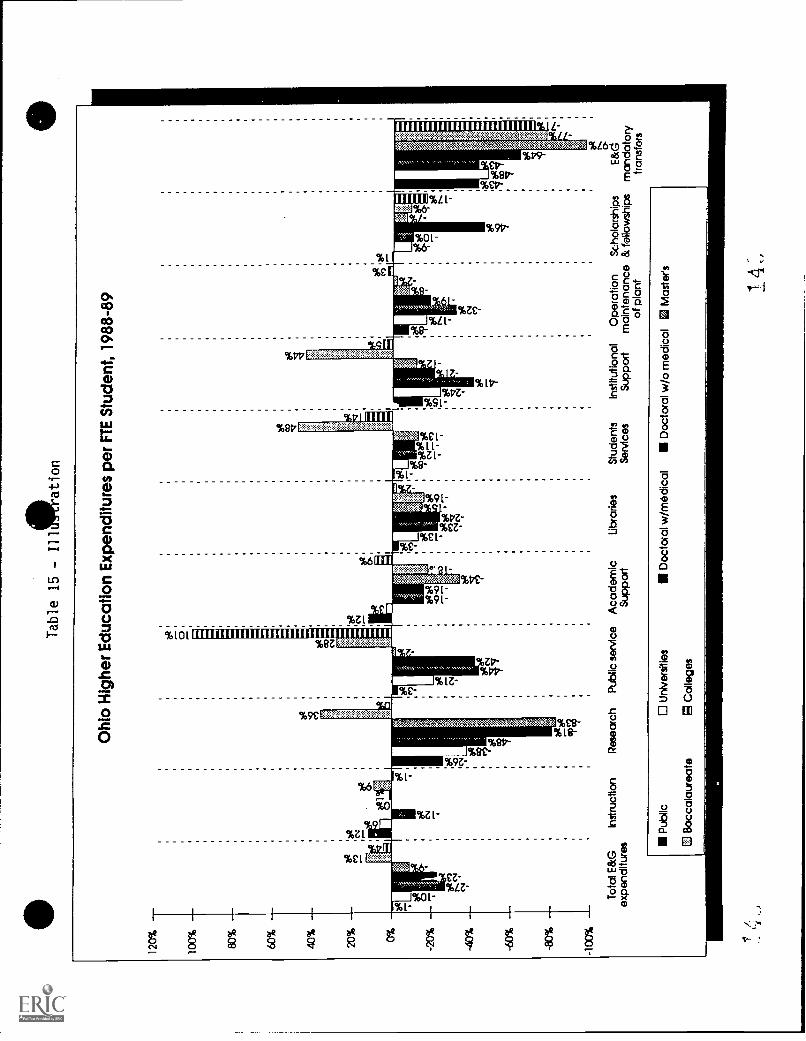
Table 15 -111/tation
Ohi
o H
ighe
r E
duca
tion
Exp
endi
ture
spe
r F
TE
Stu
dent
, 198
8-89
60%
40%
20%
-40%
-60%
-100
%
Tot
al E
&G
Inst
ruct
ion
Res
earc
hP
ublic
ser
vice
Aca
dem
icLi
brar
ies
Stu
dent
sIn
stitu
tiona
lO
pera
tion
Sch
olar
ship
sE
sz.
expe
nditu
res
Sup
port
Ser
vice
sS
uppo
rtm
aint
enan
ce &
fello
wsh
ips
man
dato
ryof
pla
nttr
ansf
ers
Pub
lic0
Uni
vers
ities
Doc
tora
l w/m
edic
alD
octo
ral w
/o m
edic
al M
Mas
ter's
0 B
acca
laur
eate
8 C
olle
ges
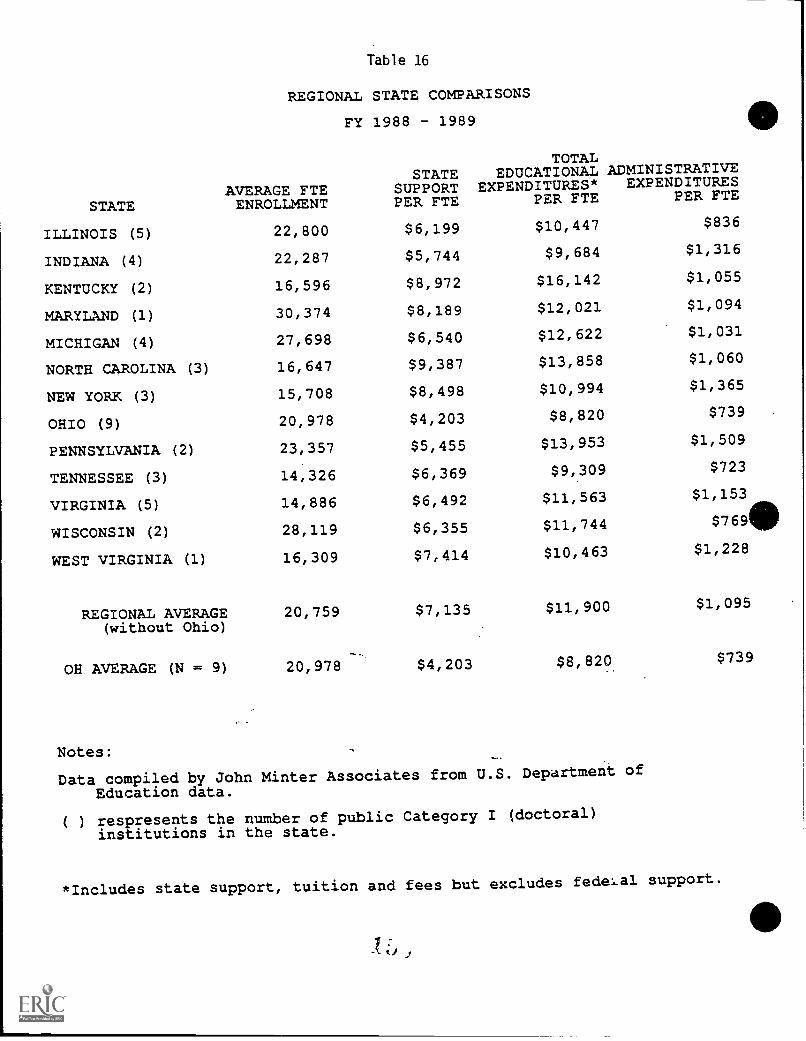
Table 16
REGIONAL STATE COMPARISONS
FY 1988 - 1989
STATEAVERAGE FTEENROLLMENT
STATESUPPORTPER FTE
TOTALEDUCATIONAL ADMINISTRATIVE
EXPENDITURES* EXPENDITURESPER FTE PER FTE
ILLINOIS (5) 22,800 $6,199 $10,447 $836
INDIANA (4) 22,287 $5, 744 $9, 684 $1,316
KENTUCKY (2) 16,596 $8, 972 $16, 142 $1,055
MARYLAND (1) 30,374 $8,189 $12,021 $1,094
MICHIGAN (4) 27,698 $6,540 $12, 622 $1,031
NORTH CAROLINA (3) 16,647 $9,387 $13,858 $1,060
NEW YORK (3) 15,708 $8,498 $10, 994 $1,365
OHIO (9) 20,978 $4,203 $8,820 $739
PENNSYLVANIA (2) 23,357 $5,455 $13,953 $1,509
TENNESSEE (3) 14,326 $6,369 $9, 309 $723
VIRGINIA (5) 14,886 $6,492 $11,563 $1,153
WISCONSIN (2) 28,119 $6,355 $11, 744 $7690
WEST VIRGINIA (1) 16,309 $7,414 $10,463 $1,228
REGIONAL AVERAGE(without Ohio)
20,759 $7,135 $11, 900 $1,095
OH AVERAGE (N = 9) 20,978 $4,203 $8, 820 $739
Notes:
Data compiled by John Minter Associates from U.S. Department of
Education data.
( ) respresents the number of public Category I (doctoral)institutions in the state.
*Includes state support, tuition and fees but excludes federal support.
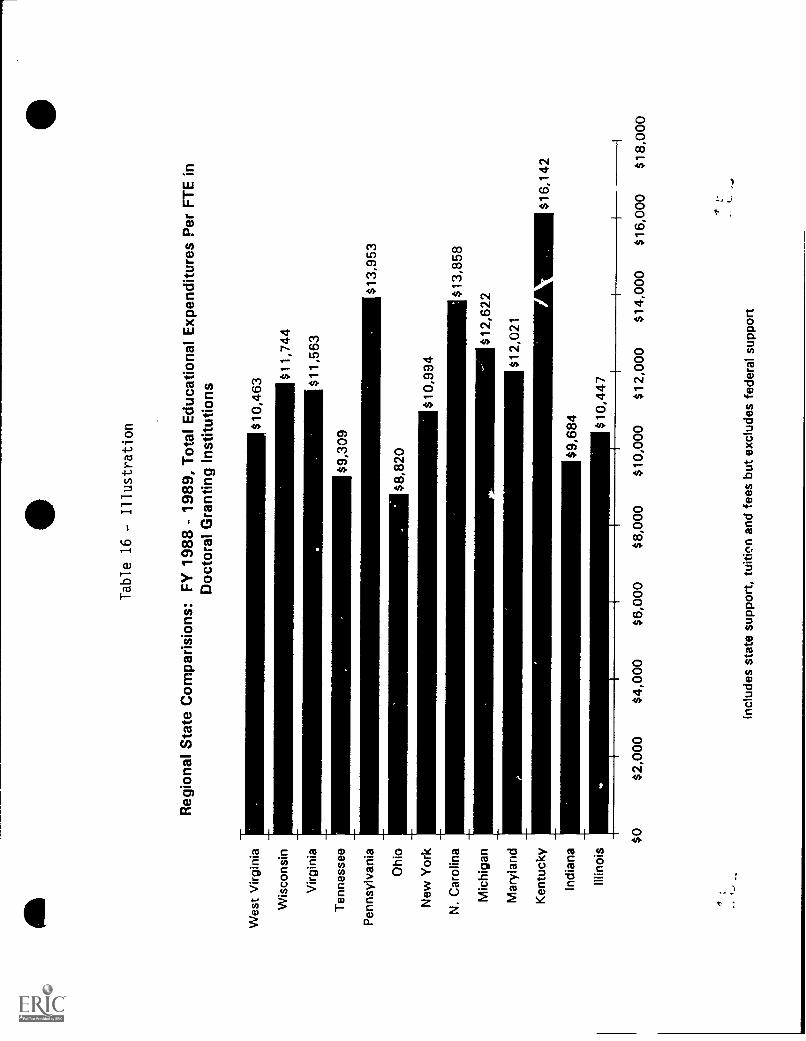
a Wes
t Virg
inia
Wis
cons
in
Virg
inia
Ten
ness
ee
Pen
nsyl
vani
a
Ohi
o
New
Yor
k
N. C
arol
ina
Mic
higa
n
Mar
ylan
d
Ken
tuck
y
Indi
ana
Illin
ois
'I'
Tab
le 1
6 -
Illus
trat
ion
Reg
iona
l Sta
te C
ompa
risio
ns: F
Y 1
988
- 19
89, T
otal
Edu
catio
nal E
xpen
ditu
res
Per
FT
E in
Doc
tora
l Gra
ntin
g In
stitu
tions
$9,3
09
$8,8
20
$10,
463 $1
1,74
4
$11,
563
$10,
994
,
$9,6
84 $10,
447
$13,
953
$13,
858
$12,
622
$12,
021
$16,
142
$0$2
,000
$4,0
00$6
,000
$8,0
00$1
0,00
0$1
2,00
0$1
4,00
0$1
6,00
0$1
8,00
0
Incl
udes
sta
te s
uppo
rt, t
uitio
n an
d fe
es b
ut e
xclu
des
fede
ral s
uppo
rt
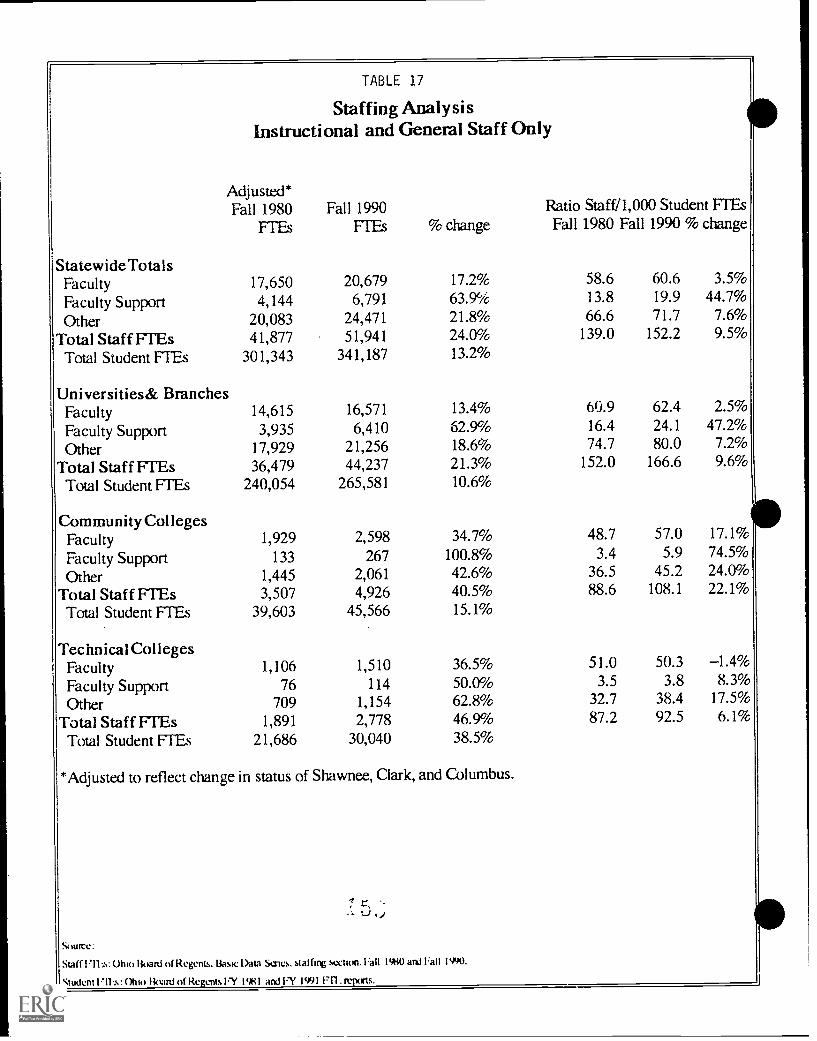
TABLE 17
Staffing AnalysisInstructional and General Staff Only
Adjusted*
StatewideTotals
Fall 1980 Fall 1990% change
Ratio Staff/1,000 Student 1-1EsFall 1980 Fall 1990 % change1- Its 1Ls
Faculty 17,650 20,679 17.2% 58.6 60.6 3.5%
Faculty Support 4,144 6,791 63.9% 13.8 19.9 44.7%
Other 20,083 24,471 21.8% 66.6 71.7 7.6%
Total Staff FIEs 41,877 51,941 24.0% 139.0 152.2 9.5%
301,343 341,187 13.2%Total Student 1- lEs
Universities& BranchesFaculty 14,615 16,571 13.4% 60.9 62.4 2.5%
Faculty Support 3,935 6,410 62.9% 16.4 24.1 47.2%
Other 17,929 21,256 18.6% 74.7 80.0 7.2%
Total Staff I- tEs 36,479 44,237 21.3% 152.0 166.6 9.6%
Total Student 1-1Es 240,054 265,581 10.6%
Community CollegesFaculty 1,929 2,598 34.7% 48.7 57.0 17.1%11)
Faculty Support 133 267 100.8% 3.4 5.9 74.5%
Other 1,445 2,061 42.6% 36.5 45.2 24.0%
Total Staff FTEs 3,507 4,926 40.5% 88.6 108.1 22.1%
Total Student 1-1 Es 39,603 45,566 15.1%
Technical CollegesFaculty 1,106 1,510 36.5% 51.0 50.3 -1.4%
Faculty Support 76 114 50.0% 3.5 3.8 8.3%
Other 709 1,154 62.8% 32.7 38.4 17.5%
Total Staff FFEs 1,891 2,778 46.9% 87.2 92.5 6.1%
Total Student 1- I hs 21,686 30,040 38.5%
*Adjusted to reflect change in status of Shawnee, Clark, and Columbus.
Source:
Staff 1111..s: Ohio Board of Regents. Baste l)ata Stiles. staffing section. Fall 1980 and Fall 1990.
Student 1.11..s: (koo Board of Re tints l Y 1981 and 1 N 199117n.. rr
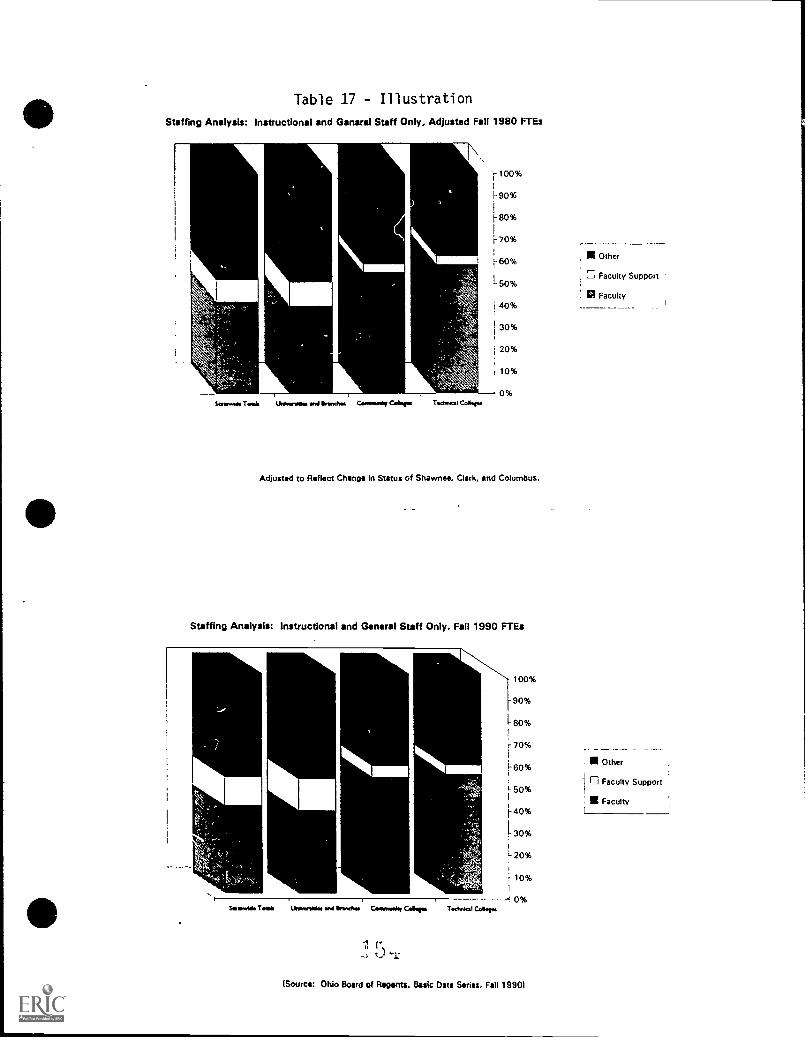
Table 17 - Illustration
Staffing Analysis: Instructional and General Staff Only, Adjusted Fall 1980 FTEs
-100%
1-90%
1- 80%
1
11-70%
i-60%
I-50%
40%
30%
20%
/ 10%
0%Sinew is Thiele Unlvereidee and Ilrenches Camennee Calves Technol Canes
Adjusted to Reflect Change In Status of Shawnee, Clark, and Columbus.
Staffing Analysis: Instructional and General Staff Only, Fail 1990 FTEs
100%
90%
1-80%
r 70%
1- 60%
50%
1-40%
1-30%
1-20%
10%1\4'
-4 0%SI.Olde Temile Unlverellin and ermine Comeeerilay Galeges Technical Collor.
-
(Source: Ohio Board of Repents, Basic Data Series, Fall 19901
Other
S Faculty Support
el Faculty
Other
n Faculty Support
II Faculty1
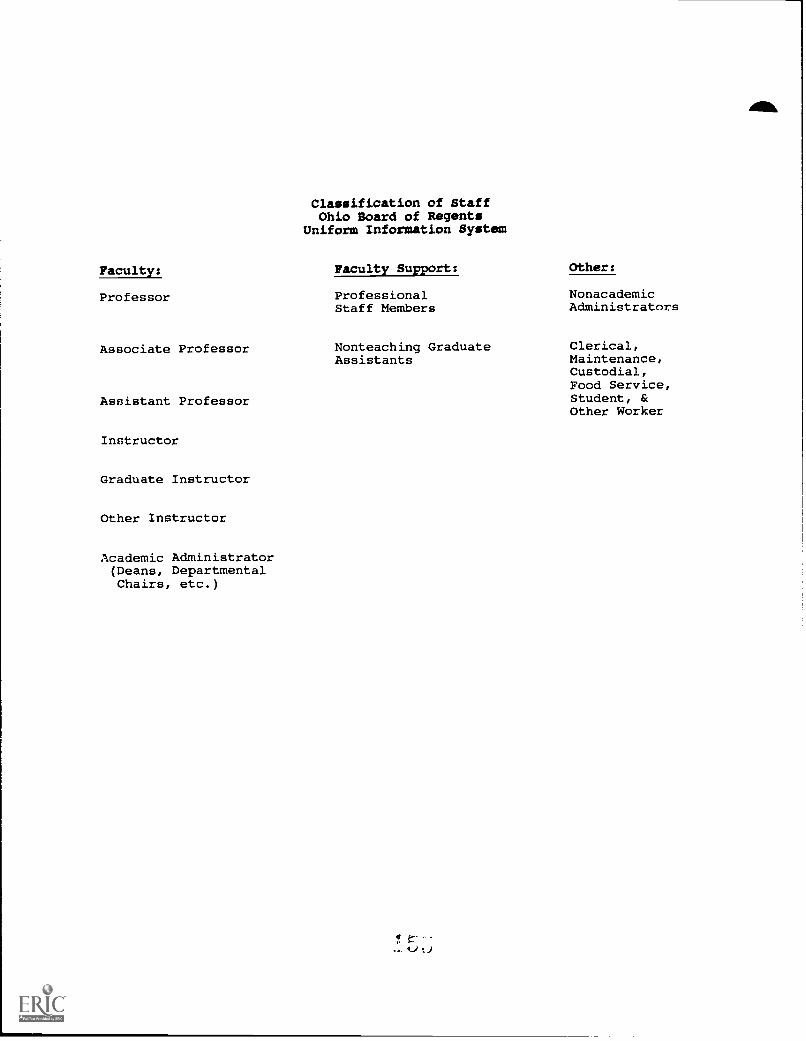
Classification of StaffOhio Board of Regents
Uniform Information System
Faculty: Faculty Support: Other:
Professor Professional NonacademicStaff Members Administrators
Associate Professor Nonteaching Graduate Clerical,Assistants Maintenance,
Custodial,Food Service,
Assistant Professor Student, &Other Worker
Instructor
Graduate Instructor
Other Instructor
Academic Administrator(Deans, DepartmentalChairs, etc.)
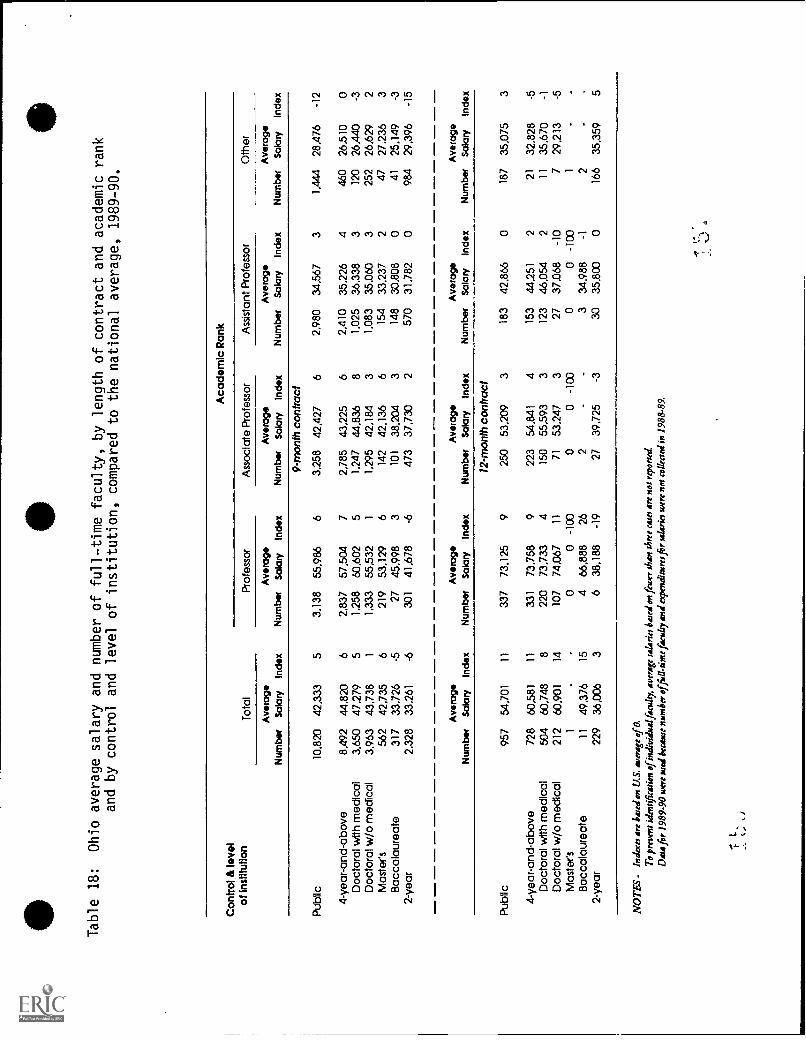
Table 18:
Ohio average salary and number of full-time faculty, by length
of contract and academic rank
and by control and level of institution, compared to the national
average, 1989-90.
Con
trol
& le
vel
of in
stitu
tion
Tot
al
Aca
dem
ic R
ank
Pro
fess
orA
ssoc
iate
Pro
fess
orA
ssis
tant
Pro
fess
orO
ther
Ave
rage
Num
ber
Sal
ary
Inde
xA
vera
geN
umbe
rS
alar
yIn
dex
Ave
rage
Num
ber
Sal
ary
Inde
xA
vera
geN
umbe
rS
alar
yIn
dex
Ave
rage
Num
ber
Sal
ary
Inde
x
9-m
onth
con
trac
t
Pub
lic10
.820
42,3
335
3.13
855
,986
63,
258
42,4
276
2,98
034
,567
31.
444
28,4
76-1
2
4-ye
ar-a
nd-a
bove
8,49
244
,820
62,
837
57,5
047
2,78
543
,225
62.
410
35.2
264
460
26,5
100
Doc
tora
l wtth
med
ical
3,65
047
,279
51.
258
60,6
025
1,24
744
.836
81,
025
36.3
383
120
26,4
40-3
Doc
tora
l w/o
med
ical
3,96
343
,738
11,
333
55,5
321
1,29
542
,184
31.
083
35.0
603
252
26.6
292
Mas
ter's
562
42.7
356
219
53,1
296
142
42,1
366
154
33.2
372
4727
,236
3B
acca
laur
eate
317
33,7
26-5
2745
,998
310
138
,204
314
830
.808
041
25.1
49-3
2-ye
ar2.
328
33,2
61-6
301
41,6
78-6
473
37,7
302
570
31.7
820
984
29,3
96-1
5
Num
ber
Ave
rage
Sal
ary
Inde
xN
umbe
rA
vera
geS
alar
yIn
dex
Num
ber
Ave
rage
Sal
ary
Inde
xN
umbe
rA
vera
geS
alar
yIn
dex
Num
ber
Ave
rage
Sal
ary
Inde
x
12-m
onth
con
trac
t
Pub
lic95
754
,701
1133
773
.125
925
053
,209
318
342
,866
018
735
,075
3
4-ye
ar-a
nd-a
bove
728
60,5
8111
331
73,7
589
223
54.8
414
153
44,2
512
2132
,828
-5D
octo
ral w
ith m
edic
al50
460
,748
822
073
,733
415
055
,593
312
346
.054
211
35,6
70-1
Doc
tora
l w/o
med
ical
212
60.9
0114
107
74,0
6711
7153
,247
327
37.0
68-1
07
29,2
13-5
Mas
ter's
1-
00
-100
00
-100
00
-100
1-
-
Bac
cala
urea
te11
49,3
7615
466
,888
262
334
.988
-12
-
2-ye
ar22
936
,006
36
38,1
88-1
927
39,7
25-3
3035
,8C
00
166
35,3
595
NO
TE
S -
Inde
xes
are
base
d 01
1 U
.S. a
vera
geof
O.
To
prev
ent i
dent
ific
atio
nofin
divi
dual
fac
xky
aver
age
sala
ries
bat
ed o
n fe
wer
than
thre
e ca
se a
re n
ot r
epor
ted
Dat
a fo
r 19
89-9
0 w
ere
wed
bec
ause
num
ber
facu
lty a
nd e
xpen
ditu
res
for
sala
ries
wer
e no
t cal
med
in 1
988-
89.
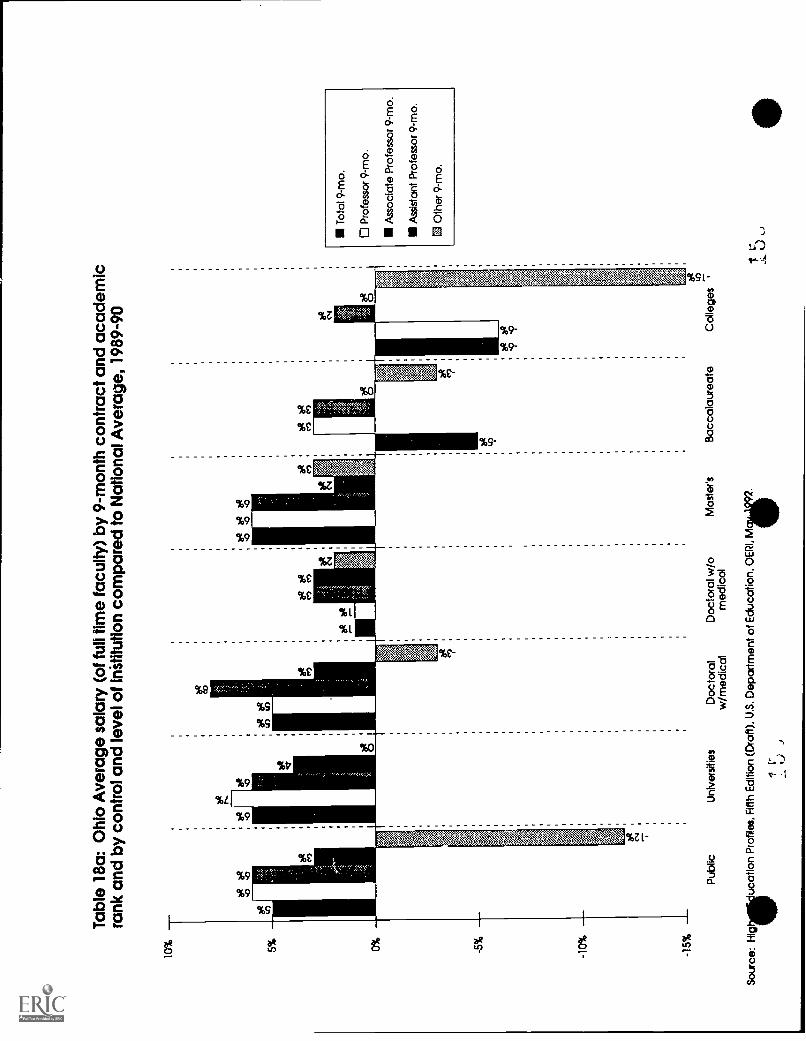
Tab
le 1
8a: O
hio
Ave
rage
sal
ary
(of f
ull t
ime
facu
lty)
by 9
-mon
th c
ontr
act a
nd a
cade
mic
rank
and
by
cont
rol a
nd le
vel o
f ins
titut
ion
com
pare
d to
Nat
iona
l Ave
rage
, 198
9-90
robe
4.3
.4)
43
Pub
lic
ai2 '9
'9
Uni
vers
ities
Doc
tora
lD
octo
ral w
/oM
aste
r'sB
acca
laur
eate
Col
lege
sw
/med
ical
med
ical
11
Sou
rce:
HIg
1uc
atio
n P
rofil
es, F
ifth
Edi
tion
(Dra
ft). U
.S. D
epar
tmen
t of E
duca
tion.
0E
121.
M.
IL-
:...
t..)
J
Tot
al 9
-mo.
0 P
rofe
ssor
9-m
o.
Ass
ocia
te P
rofe
ssor
9-m
o.
Ass
ista
nt P
rofe
ssor
9-m
o.
8 O
ther
9-m
o.
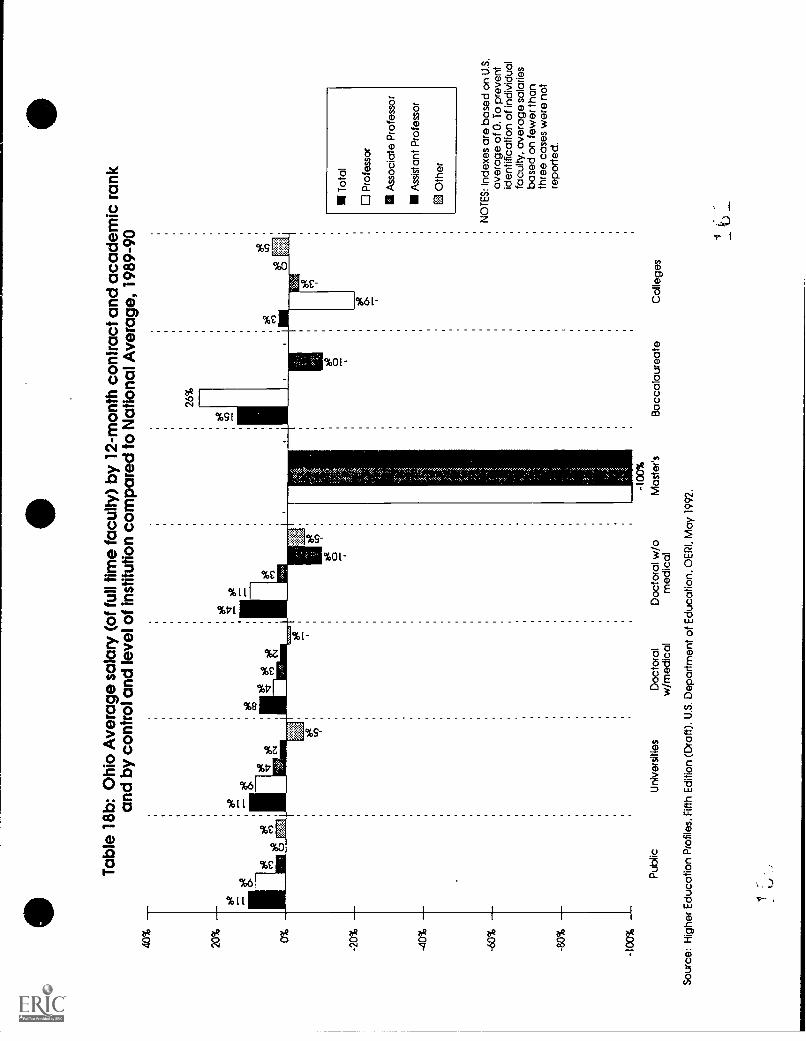
40%
Tab
le 1
8b: O
hio
Ave
rage
sal
ary
(of f
ull t
ime
facu
lty)
by 1
2-m
onth
con
trac
t and
aca
dem
ic r
ank
and
by c
ontr
ol a
nd le
vel o
f ins
titut
ion
com
pare
d to
Nat
iona
l Ave
rage
, 198
9-90
-20%
-40%
-60%
-80%
- 10
0%
Pub
lic
ec)
aezA
be
26%
ae
ae
-100
%
Uni
vers
ities
Doc
tora
lD
octo
ral w
/oM
aste
r'sB
acca
laur
eate
Col
lege
sw
/med
ical
med
ical
Sou
rce:
Hig
her
Edu
catio
n P
rofil
es, F
ifth
Edi
tion
(Dra
ft). U
.S. D
epar
tmen
t of E
duca
tion.
OE
RI,
May
199
2.
tj
Tot
al
o P
rofe
ssor
Ass
ocia
te P
rofe
ssor
Ass
ista
nt P
rofe
ssor
ID O
ther
NO
TE
S: I
ndex
es a
re b
ased
on
U.S
.av
erag
e of
0. T
o pr
even
tid
entif
icat
ion
of in
divi
dual
facu
lty, a
vera
ge s
alar
ies
base
d on
few
er th
anth
ree
case
s w
ere
not
repo
rted
.
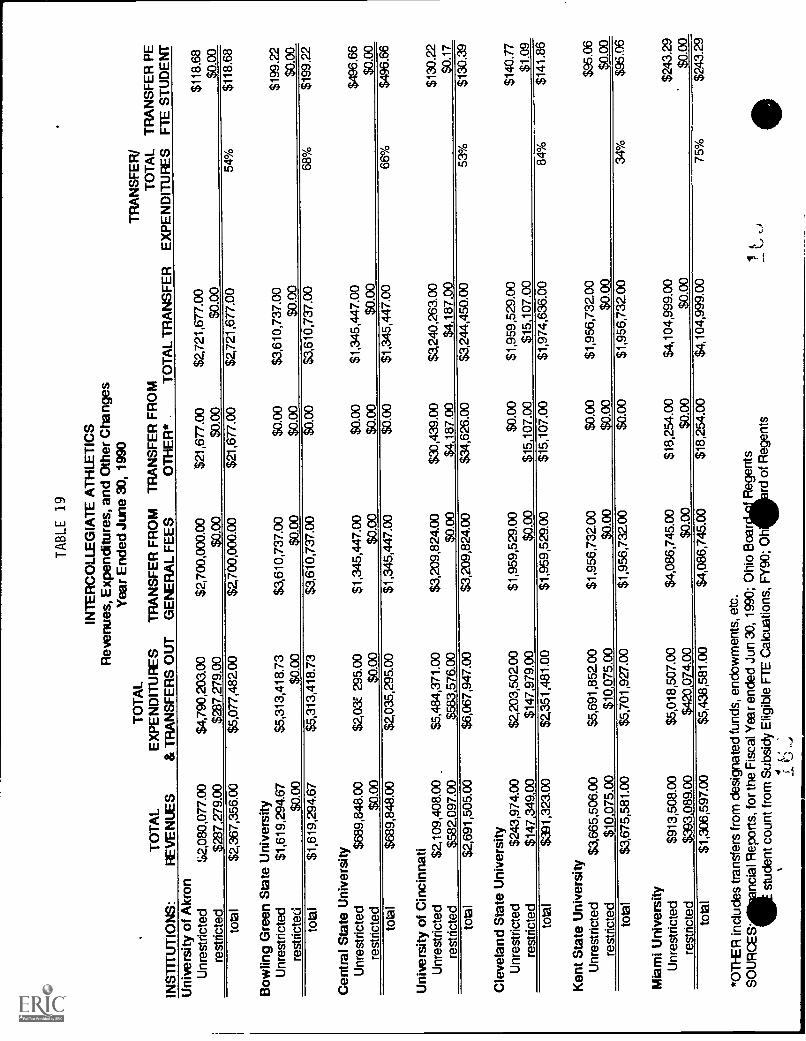
TA
BLE
19
INT
ER
CO
LLE
GIA
TE
AT
HLE
TIC
SR
even
ues,
Exp
endi
ture
s, a
nd O
ther
Cha
nges
Yea
r E
nded
Jun
e 30
, 199
0
TO
TA
LIN
ST
ITU
TIO
NS
:R
EV
EN
UE
S
TO
TA
LE
XP
EN
DIT
UR
ES
& T
RA
NS
FE
RS
OU
TT
RA
NS
FE
R F
RO
MG
EN
ER
AL
FE
ES
TR
AN
SF
ER
FR
OM
OT
HE
R*
TO
TA
L T
RA
NS
FE
R
TR
AN
SF
ER
/T
OT
AL
EX
PE
ND
ITU
RE
ST
RA
NS
FE
R P
EF
IE S
TU
DE
NT
Uni
vers
ity o
f Akr
onU
nres
tric
ted
$2,0
80,0
77.0
0$4
,790
,203
.00
$2,7
00,0
00.0
0$2
1,67
7.00
$2,7
21,6
77.0
0$1
18.6
8
rest
ricte
d23
7 27
9.00
287
279.
00'.6
00x.
00.0
0.0
0
tota
l$2
,367
,356
.00
$5,0
77,4
82.0
0$2
,700
,000
.00
$21,
677.
00$2
,721
,677
.00
54%
$118
.68
Bow
ling
Gre
en S
tate
Uni
vers
ityU
nres
tric
ted
$1,6
19,2
94.6
7$5
,313
,418
.73
$3,6
10,7
37.0
0$0
.00
$3,6
10,7
37.0
0$1
99.2
2
rest
ricte
d$0
.00
$0.0
0$0
.00
$0.0
0$0
.00
$0.0
0
tota
l$1
,619
,294
.67
$5,3
13,4
18.7
3$3
,610
,737
.00
$0.0
0$3
,610
,737
.00
68%
$199
.22
Cen
tral
Sta
te U
nive
rsity
Unr
estr
icte
d$6
89,8
48.0
0$2
,03Z
295
.00
$1,3
45,4
47.0
0$0
.00
$1,3
45,4
47.0
0$4
96.6
6
rest
ricte
d$0
.00
$0.0
0$0
.00
$0.0
0$0
.00
$0.0
0
tota
l$6
89,8
48.0
0$2
,035
,295
.00
$1,3
45,4
47.0
0$0
.00
$1,3
45,4
47.0
066
%$4
96.6
6
Uni
vers
ity o
f Cin
cinn
ati
Unr
estr
icte
d$2
,109
,408
.00
$5,4
84,3
71.0
0$3
,209
,824
.00
$30,
439.
00$3
,240
,263
.00
$130
.22
rest
ricte
d$5
82,0
97.0
0$5
83,5
76.0
0$0
.00
$4,1
87.0
0$4
,187
.00
$0.1
7
tota
l$2
,691
,505
.00
$6,0
67,9
47.0
0$3
,209
,824
.00
$34,
626.
00$3
,244
,450
.00
53%
$130
.39
Cle
vela
nd S
tate
Uni
vers
ityU
nres
tric
ted
$243
,974
.00
$2,2
03,5
02.0
0$1
,959
,529
.00
$0.0
0$1
,959
,529
.00
$140
.77
rest
ricte
d$1
47,3
49.0
0$1
47,9
79.0
0$0
.00
$15,
107.
00$1
5,10
7.00
$1.0
9
tota
l$3
91,3
23.0
0$2
,351
,481
.00
$1,9
59,5
29.0
0$1
5,10
7.00
$1,9
74,6
36.0
084
%$1
41.8
6
Ken
t Sta
te U
nive
rsity
Unr
estr
icte
d$3
,665
,506
.00
$5,6
91,8
52.0
0$1
,956
,732
.00
$0.0
0$1
,956
,732
.00
$95.
06
rest
ricte
d$1
0,07
5.00
$10,
075.
00$0
.00
$ac(
)$0
.00
$0.0
0
tota
l$3
,675
,581
.00
$5,7
01,9
27.0
0$1
,956
,732
.00
$0.0
0$1
,956
,732
.00
34%
$95.
06
Mia
mi U
nive
rsity
Unr
estr
icte
d$9
13,5
08.0
0$5
,018
,507
.00
$4,0
86,7
45.0
0$1
8,25
4.00
$4,1
04,9
99.0
0$2
43.2
9
rest
ricte
d$3
93,0
89.0
0$4
20,0
74.0
0$0
.00
$0.0
0$0
.00
$0.0
0
tota
l$1
,306
,597
.00
$5,4
38,5
81.0
0$4
,086
,745
.00
$18,
254.
00$4
,104
,999
.00
75%
$243
.29
*OT
1-E
R in
clud
es tr
ansf
ers
from
des
igna
ted
fund
s, e
ndow
men
ts, e
tc.
Rep
orts
, for
the
Fis
cal Y
ear
ende
d Ju
n 30
, 199
0; O
hio
Boa
rR
egen
tsst
uden
t cou
nt fr
om S
ubsi
dy E
ligib
le F
TE
Cal
cuat
ions
, FY
90; O
hrd
of R
egen
ts4 f
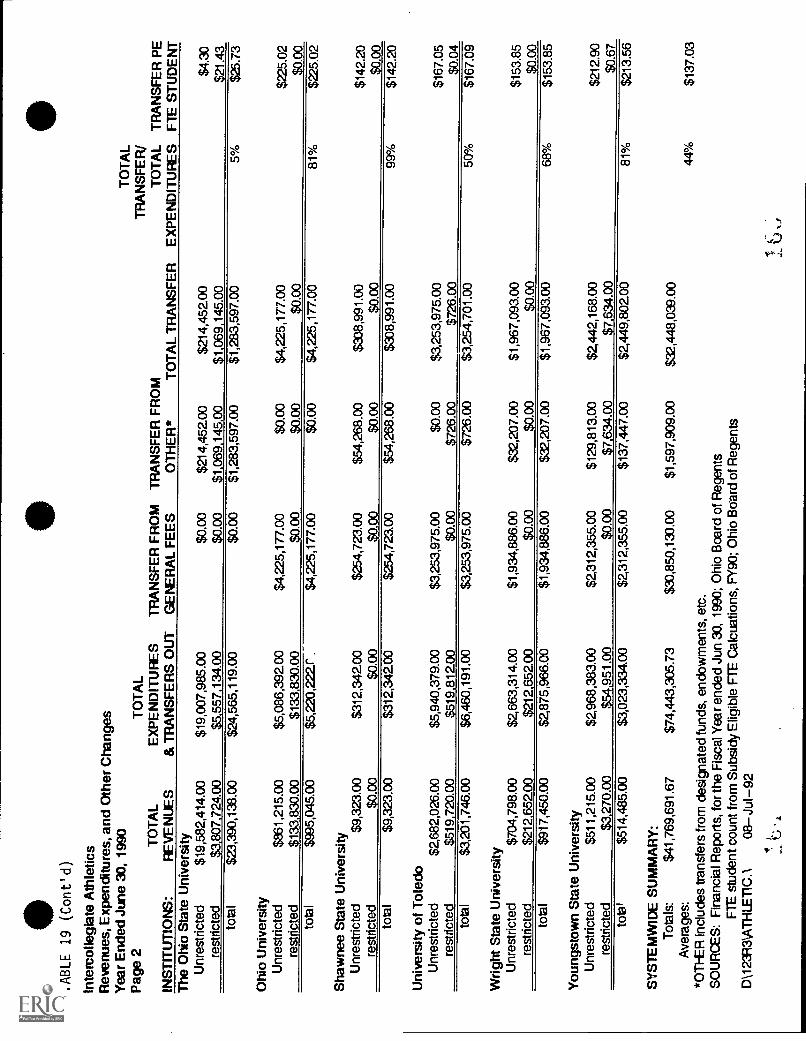
TA
BLE
19
(Con
ti d)
Inte
rcol
legi
ate
Ath
letic
sR
even
ues,
Exp
endi
ture
s, a
nd O
ther
Cha
nges
Yea
r E
nded
Jun
e 30
, 199
0P
age
2T
OT
AL
INS
TIT
UT
ION
S:
RE
VE
NU
ES
The
Ohi
o S
tate
Uni
vers
ity
TO
TA
LE
XP
EN
DIT
UR
ES
& T
RA
NS
FE
RS
OU
TT
RA
NS
FE
R F
RO
MG
EN
ER
AL
FE
ES
TR
AN
SF
ER
FR
OM
OT
HE
R*
TO
TA
L T
RA
NS
FE
R
TO
TA
LT
RA
NS
FE
R/
TO
TA
LE
XP
EN
DIT
UR
ES
TR
AN
SF
ER
PE
FIE
ST
UD
EN
T
Unr
estr
icte
d$1
9,58
2,41
4.00
$19,
007,
985.
00$0
.00
$214
,452
.00
$214
,452
.00
$4.3
0re
stric
ted
$3,8
07,7
24.0
0$5
,557
,134
.00
$0.0
0$1
,069
,145
.00
$1,0
69,1
45.0
0$2
1.43
tota
l$2
3,39
0,13
8.00
$24,
565,
119.
00$0
.00
$1,2
83,5
97.0
0$1
,283
,597
.00
5%$2
5.73
Ohi
o U
nive
rsity
Unr
estr
icte
d$8
61,2
15.0
0$5
,086
,392
00$4
,225
,177
.00
$0.0
0$4
,225
,1T
7.00
$225
.02
rest
ricte
d$1
33,8
30.0
0$1
33,8
30.0
0$0
.00
$0.0
0$0
.00
$0.0
0to
tal
$995
,045
.00
$5,2
20,2
22r
$4,2
25,1
77.0
0$0
.00
$4,2
25,1
77.0
081
%$2
25.0
2
Sha
wne
e S
tate
Uni
vers
ityU
nres
tric
ted
$9,3
23.0
0$3
12,3
42.0
0$2
54,7
23.0
0$5
4,26
8.00
$308
,991
.00
$142
.20
rest
ricte
d$0
.00
$0.0
0$0
.00
$0.0
0$0
.00
$0.0
0to
tal
$9,3
23.0
0$3
12,3
4200
$254
,723
.00
$54,
268.
00$3
08,9
91.0
099
%$1
42.2
0
Uni
vers
ity o
f Tol
edo
Unr
estr
icte
d$2
,682
,026
.00
$5,9
40,3
79.0
0$3
,253
,975
.00
$0.0
0$3
,253
,975
.00
$167
.05
rest
ricte
d$5
19,7
20.0
0$5
19,8
12.0
0$0
.00
$726
.00
$726
.00
$0.0
4to
tal
$3,2
01,7
46.0
0$6
,460
,191
.00
$3,2
53,9
75.0
0$7
26.0
0$3
,254
,701
.00
50%
$167
.09
Wrig
ht S
tate
Uni
vers
ityU
nres
tric
ted
$704
,798
.00
$2,6
63,3
14.0
0$1
,934
,886
.00
$32,
207.
00$1
,967
,093
.00
$153
.85
rest
ricte
d$2
12,6
52.0
0$2
12,6
52.0
0$0
.00
$0.0
0$0
.00
$0.0
0to
tal
$917
,450
.00
$2,8
75,9
66.0
0$1
,934
,886
.00
$32,
207.
00$1
,967
,093
.00
68%
$153
.85
You
ngst
own
Sta
te U
nive
rsity
Unr
estr
icte
d$5
11,2
15.0
0$2
,968
,383
.00
$2,3
12,3
55.0
0$1
29,8
13.0
0$2
,442
,168
.00
$212
.90
rest
ricte
d$3
,270
.00
$54,
951.
00$0
.00
$7,6
34.0
0$7
,634
.00
$0.6
7to
ts'
$514
,485
.00
$3,0
23,3
34.0
0$2
,312
,355
.00
$137
,447
.00
$2,4
49,8
02.0
081
%$2
13.5
6
SY
ST
EM
WID
E S
UM
MA
RY
:T
otal
s:$4
1,76
9,69
1.67
$74,
443,
305.
73$3
0,85
0,13
0.00
$1,5
97,9
09.0
0$3
2,44
8,03
3.00
Ave
rage
s:44
%$1
37.0
3*O
TI-
ER
incl
udes
tran
sfer
s fr
om d
esig
nate
d fu
nds,
end
owm
ents
, etc
.S
OU
RC
ES
: Fin
anci
al R
epor
ts, f
or th
e F
isca
l Yea
r en
ded
Jun
30, 1
990;
Ohi
o B
oard
of R
egen
tsF
TE
stu
dent
cou
nt fr
om S
ubsi
dy E
ligib
le F
TE
Cal
cuat
ions
, FY
90; O
hio
Boa
rd o
fR
egen
tsD
\123
R31
AT
HLE
T1C
.108
-Jul
-92
S.; .
4U
is
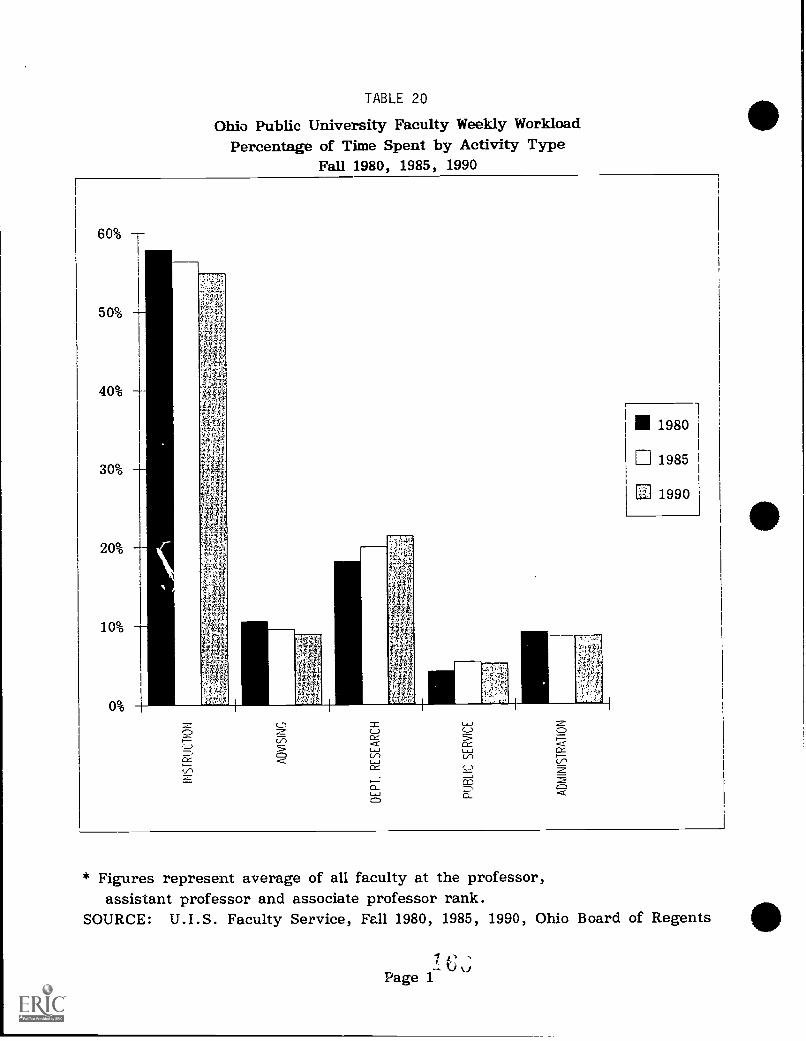
TABLE 20
Ohio Public University Faculty Weekly WorkloadPercentage of Time Spent by Activity Type
Fall 1980, 1985, 1990
60%T
5096
40%
30%
20%
1.0%
0%
c171
1
1980
1985 II 1
El 1990
* Figures represent average of all faculty at the professor,assistant professor and associate professor rank.
SOURCE: U.I.S. Faculty Service, Fall 1980, 1985, 1990, Ohio Board of Regents
si
Page 1
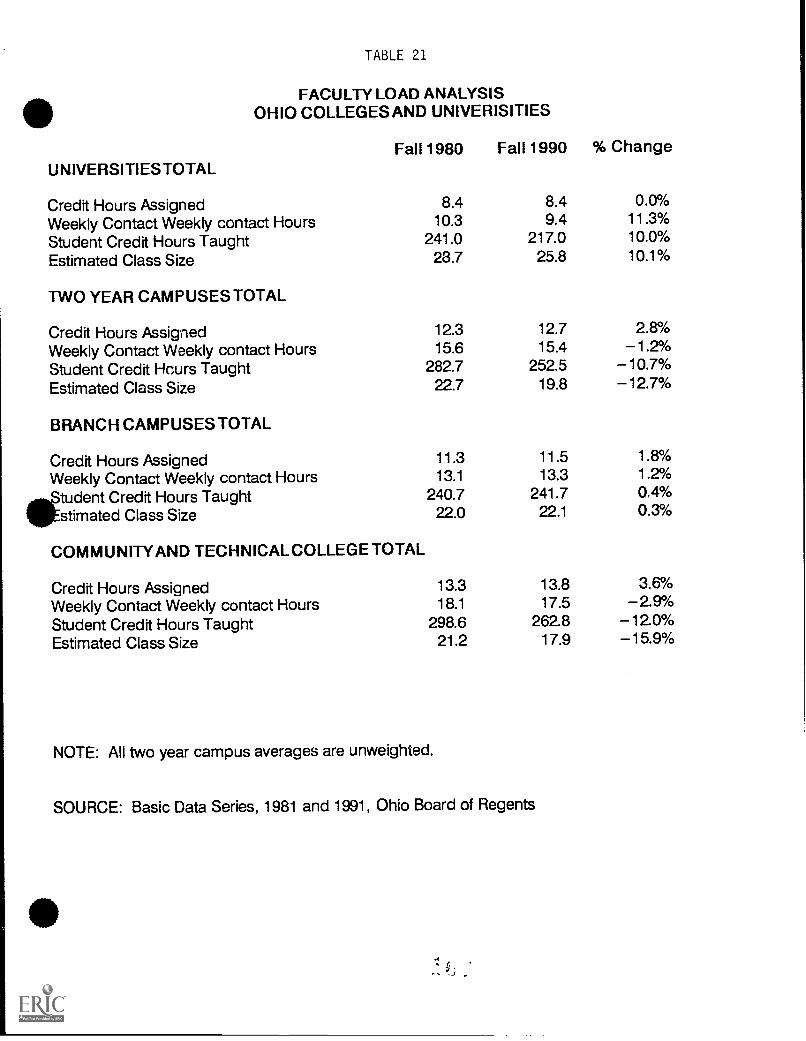
TABLE 21
FACULTY LOAD ANALYSISOHIO COLLEGES AND UNIVERISITIES
Fa111980UNIVERSITIESTOTAL
Fall 1990 % Change
Credit Hours Assigned 8.4 8.4 0.0%
Weekly Contact Weekly contact Hours 10.3 9.4 11.3%
Student Credit Hours Taught 241.0 217.0 10.0%
Estimated Class Size 28.7 25.8 10.1%
TWO YEAR CAMPUSES TOTAL
Credit Hours Assigned 12.3 12.7 2.8%
Weekly Contact Weekly contact Hours 15.6 15.4 -1.2%Student Credit Hours Taught 282.7 252.5 -10.7%Estimated Class Size 22.7 19.8 -12.7%
BRANCH CAMPUSES TOTAL
Credit Hours Assigned 11.3 11.5 1.8%
Weekly Contact Weekly contact Hours 13.1 13.3 1.2%
AmkStudent Credit Hours Taught 240.7 241.7 0.4%
illpstimated Class Size 22.0 22.1 0.3%
COMM UNITYAND TECHNICAL COLLEGE TOTAL
Credit Hours Assigned 13.3 13.8 3.6%
Weekly Contact Weekly contact Hours 18.1 17.5 -2.9%Student Credit Hours Taught 298.6 262.8 -12.0%Estimated Class Size 21.2 17.9 -15.9%
NOTE: All two year campus averages are unweighted.
SOURCE: Basic Data Series, 1981 and 1991, Ohio Board of Regents
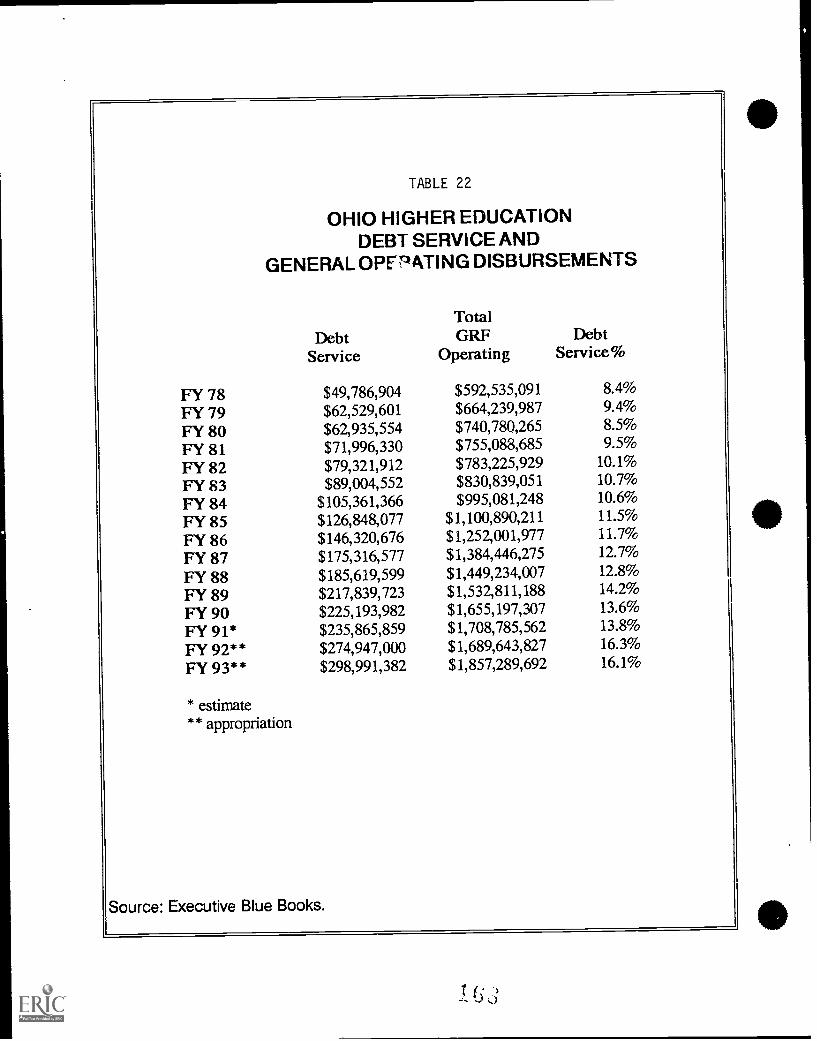
TABLE 22
OHIO HIGHER EDUCATIONDEBT SERVICE AND
GENERAL OPFPATING DISBURSEMENTS
DebtService
TotalGRF
OperatingDebt
Service%
FY 78 $49,786,904 $592,535,091 8.4%
FY 79 $62,529,601 $664,239,987 9.4%
FY 80 $62,935,554 $740,780,265 8.5%
FY 81 $71,996,330 $755,088,685 9.5%
FY 82 $79,321,912 $783,225,929 10.1%
FY 83 $89,004,552 $830,839,051 10.7%
FY 84 $105,361,366 $995,081,248 10.6%
FY 85 $126,848,077 $1,100,890,211 11.5%
FY 86 $146,320,676 $1,252,001,977 11.7%
FY 87 $175,316,577 $1,384,446,275 12.7%
FY 88 $185,619,599 $1,449,234,007 12.8%
FY 89 $217,839,723 $1,532,811,188 14.2%
FY 90 $225,193,982 $1,655,197,307 13.6%
FY 91* $235,865,859 $1,708,785,562 13.8%
FY 92** $274,947,000 $1,689,643,827 16.3%
FY 93** $298,991,382 $1,857,289,692 16.1%
estimatetimate** appropriation
Source: Executive Blue Books.

Tab
le 2
2 -
Illus
trat
ion
Ohi
o H
ighe
r E
duca
tion
Deb
t Ser
vice
and
Gen
eral
Ope
ratin
g D
isbu
rsem
ents
$2,5
00,0
00,0
00-7
$2,0
00,0
00,0
00 -
$1,5
00,0
00,0
00 -
$1,0
00,0
00,0
00 -
$500
,000
,000 $0
FY
78
FY
79
FY
80
FY
81
FY
82
FY
83
FY
84
FY
85
FY
86
FY
87
FY
88 F
Y 8
9 F
Y 9
0 F
Y 9
1 F
Y 9
2 F
Y 9
3
FY
91
is e
stim
ated
. FY
92
and
93 a
re a
ppro
pria
tions
(S
ourc
e: E
xecu
tive
Blu
eB
ooks
)
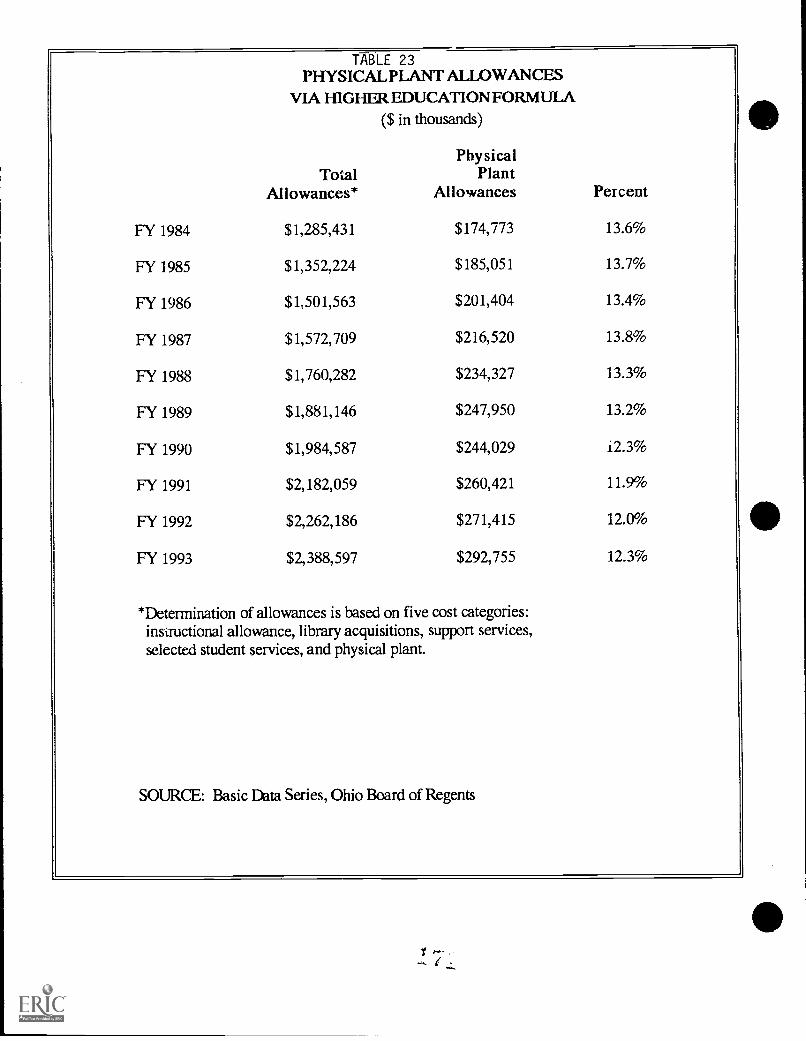
TABLE E 23
PHYSICALPLANT ALLOWANCESVIA HIGHER EDUCATION FORMULA
TotalAllowances*
($ in thousands)
PhysicalPlant
Allowances Percent
FY 1984 $1,285,431 $174,773 13.6%
FY 1985 $1,352,224 $185,051 13.7%
FY 1986 $1,501,563 $201,404 13.4%
FY 1987 $1,572,709 $216,520 13.8%
FY 1988 $1,760,282 $234,327 13.3%
FY 1989 $1,881,146 $247,950 13.2%
FY 1990 $1,984,587 $244,029 i2.3%
FY 1991 $2,182,059 $260,421 11.9%
FY 1992 $2,262,186 $271,415 12.0%
FY 1993 $2,388,597 $292,755 12.3%
*Determination of allowances is based on five cost categories:instructional allowance, library acquisitions, support services,selected student services, and physical plant.
SOURCE: Basic Data Series, Ohio Board of Regents
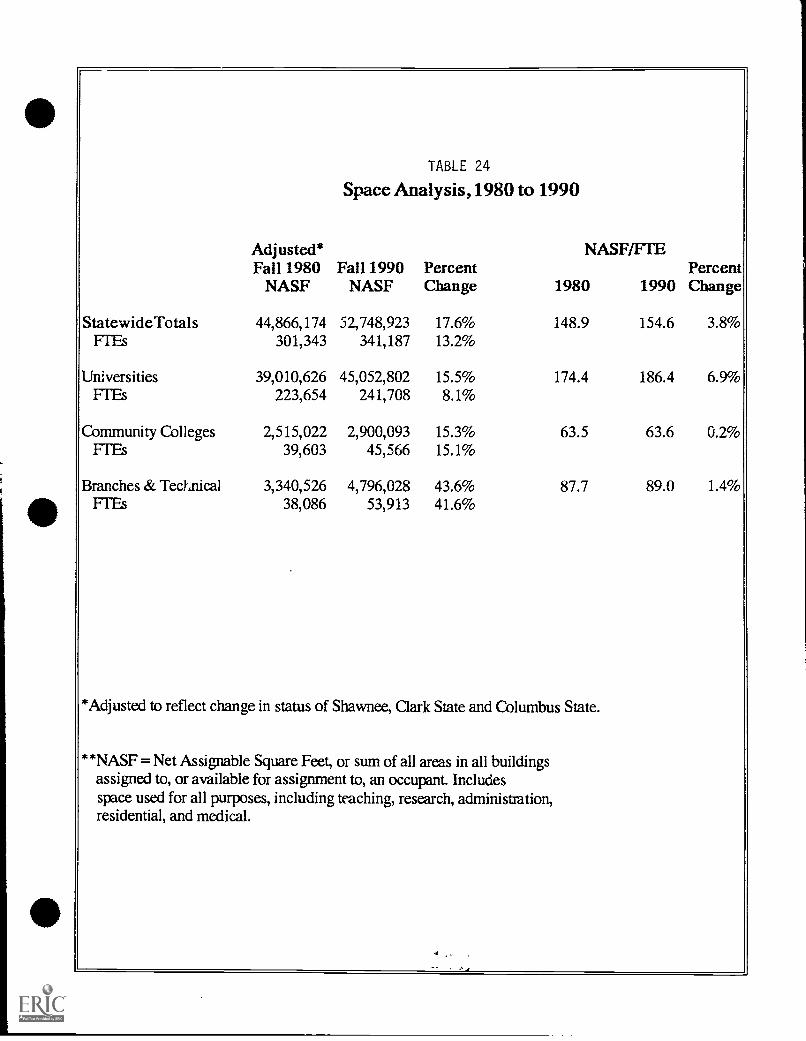
Adjusted*Fall 1980
NASF
TABLE 24
Space Analysis,1980 to 1990
NASF/PTEFall 1990 Percent
NASF Change 1980 1990PercentChange
Statewide Totals 44,866,174 52,748,923 17.6% 148.9 154.6 3.8%1-1]-2s 301,343 341,187 13.2%
Universities 39,010,626 45,052,802 15.5% 174.4 186.4 6.9%1- 1 hs 223,654 241,708 8.1%
Community Colleges 2,515,022 2,900,093 15.3% 63.5 63.6 0.2%Jr' .fcS 39,603 45,566 15.1%
Branches & Tethnical 3,340,526 4,796,028 43.6% 87.7 89.0 1.4%its 38,086 53,913 41.6%
*Adjusted to reflect change in status of Shawnee, Clark State and Columbus State.
**NASF = Net Assignable Square Feet, or sum of all areas in all buildingsassigned to, or available for assignment to, an occupant. Includesspace used for all purposes, including teaching, research, administration,residential, and medical.
Appendix H1. Executive Summary ofthe Faculty
Workload Report; 19922. An Example of Best Practice: Faculty
Productivity at Kent State University -Preliminary Report
REPORT OF THE STUDY COMMITTEE
ON FACULTY WORKLOAD
Prepared for the Managing for the Future Task Force
April 1992
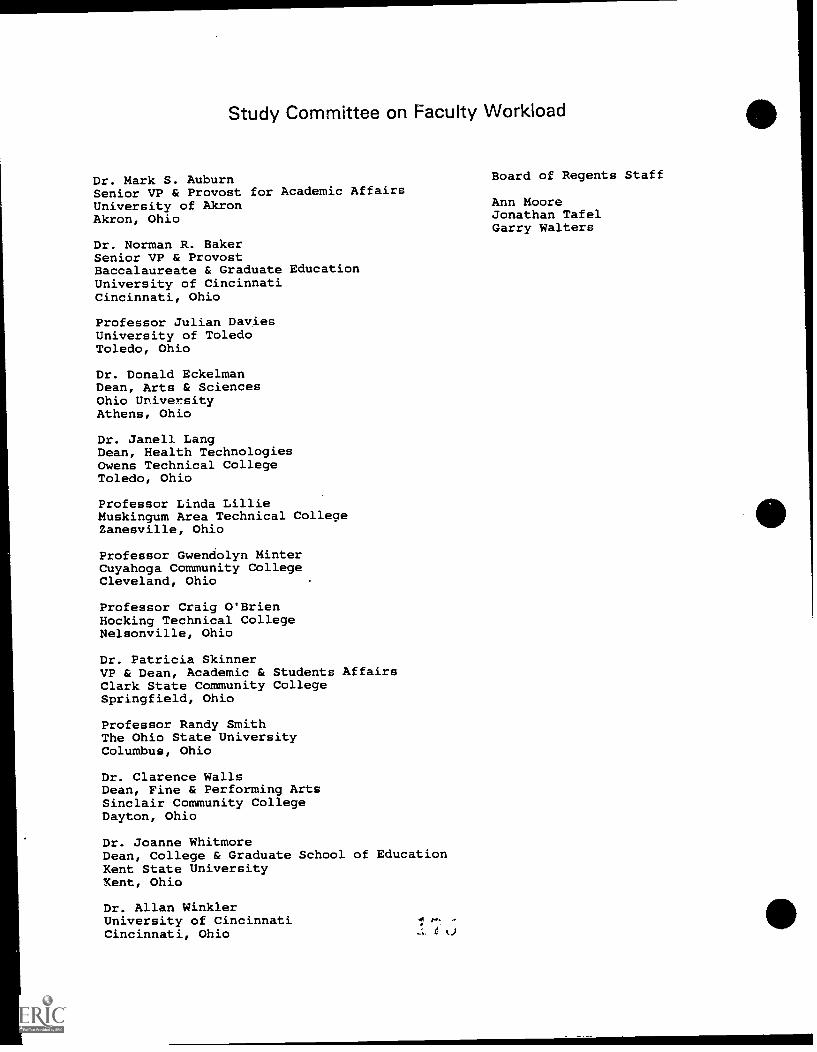
Study Committee on Faculty Workload
Dr. Mark S. AuburnSenior VP & Provost for Academic AffairsUniversity of AkronAkron, Ohio
Dr. Norman R. BakerSenior VP & ProvostBaccalaureate & Graduate EducationUniversity of CincinnatiCincinnati, Ohio
Professor Julian DaviesUniversity of ToledoToledo, Ohio
Dr. Donald EckelmanDean, Arts & SciencesOhio UniversityAthens, Ohio
Dr. Janell LangDean, Health TechnologiesOwens Technical CollegeToledo, Ohio
Professor Linda LillieMuskingum Area Technical CollegeZanesville, Ohio
Professor Gwendolyn MinterCuyahoga Community CollegeCleveland, Ohio
Professor Craig O'BrienHocking Technical CollegeNelsonville, Ohio
Dr. Patricia SkinnerVP & Dean, Academic & Students AffairsClark State Community CollegeSpringfield, Ohio
Professor Randy SmithThe Ohio State UniversityColumbus, Ohio
Dr. Clarence WallsDean, Fine & Performing ArtsSinclair Community CollegeDayton, Ohio
Dr. Joanne WhitmoreDean, College & Graduate School of EducationKent State UniversityKent, Ohio
Dr. Allan WinklerUniversity of CincinnatiCincinnati, Ohio G cj
Board of Regents Staff
Ann MooreJonathan TafelGarry Walters
EXECUTIVE SUMMARYREPORT OF THE
STUDY COMMITTEE ON FACULTY WORKLOAD
BackgroundThe statewide Managing for the Future Task Force has been charged withexamining all of the factors that affect the quality and productivity of Ohio'ssystem of higher education. It is natural, therefore, that particular attentionwould be paid to the role and responsibilities of faculty: faculty are the coreof higher education, and instructional personnel costs comprise more thanthree-quarters of all higher education expenditures.
The Study Committee on Faculty Workload, which was composed of facultyand administrators, equally representing two-year and four-year campuses,approached its task of examining all of the aspects of faculty workload withenergy and determination. The Committee met 6 times between December1991 and April 1992, and developed its recommendations after extensiveconsultation with campus groups.
The Committee's findings make clear that Ohio faculty are effectively andproductively engaged, both with regard to the expectations of the State and incomparison with faculty elsewhere in the nation. Nevertheless, the Commit-tee recommends changes that it believes will enhance the quality of teachingin colleges and universities. In addition, the Committee proposes a mecha-nism for reviewing faculty workload that will likely increase the overallamount of instruction provided by university faculty. In order to understandthese recommendations, it is necessary to have a clear sense of the overallnature of faculty responsibilities and of the organization ofhigher educationin Ohio.
Faculty ResponsibilitiesTeachingThere is widespread agreement that the principal responsibility of faculty isteaching. Unfortunately, we have not conveyed to the general public thecomplex and demanding series of activities that are essential to effectiveteaching. To employ an example that is better understood, the activities ofteachers are analogous to those of surgeons. Surgeons spend a relativelysmall amount of their time in actual surgery; the bulk of their duties includeskeeping current with the latest techniques and technology, organizing andpreparing the surgical team before entering the operating room and followingup with patients. Faculty also must prepare and follow-up:
'LI
Japan, which has oneof the world's best sys-tems of primary andsecondary education,has a national law for-bidding teachers fromspending more thanfour hours a day in theclassroom. The pur-pose Is to make surethat teachers spendadequate time prepar-ing for teaching and inassessing and im-proving the effective-ness of classroomtime.
Before entering a class a faculty member must do the following:
Read and experiment to be sure that his or her knowledge of thesubject matter to be taught is current and valid;
Master the most recent technologies, such as computer hardware/software or laboratory equipment;
Prepare or revise lectures, laboratory materials and assessmentprocedures to be certain that they contain appropriate content andemploy effective methodology;
Work with others (for example, laboratory staff and media supportpersonnel) to ensure that the necessary assistance will be available.
After teaching a class a faculty member must do the following:
Meet with students to follow up on questions and problems;
Grade examinations, laboratory reports or the results of other requiredactivities;
In addition to teaching a class, faculty must engage in the following activities thatare directly related to instruction:
Advise students on general academic issues including, for example,completing an academic major or minor;
Work with other faculty on matters related to curricu-lum and student affairs.
There is a strong consensus in the Committee, one that is widely re-flected in the national literature, that faculty must spend at least twohours preparing for class or following up with students for every hourthey spend working directly in a classroom. The Committee alsostresses the likelihood that this ratio will, over time, increase rather thandiminisn:
the explosion of knowledge makes it increasingly difficult forfaculty to stay abreast of their fields, but the competitivenessof the employment marketplace makes it even more importantthat instruction be at the cutting edge;
the renewed emphasis on teaching critical thinking skills as away to prepare students for a rapidly changing society re-quires extensive out-of-class instructional time for the devel-opment and grading of examinations, papers, and projects;
"Half ofd astronomi-cal research has beendone since I receivedmy Ph.D. in the 70's.... An introductorylevel textbook pub-lished this year will beout of date within threeyears. So reading cur-rent literature and do-ing research is man-datory, because thisfield is constantly re-newing Itself." (Dr.Bernard W. Bopp, Dis-tinguished UniversityProfessor of As-tronomy and Directorof the Ritter Observa-tory - University ofToledo)
the advent of new technologies -- particularly inexpensive multi-media computingand high bandwidth communications -- offers the prospect of more productiveinstruction of high quality in the near future. But preparing for these technologies inthe short-term will be very labor-intensive.
ResearchFaculty also do research. Teaching is the communication of knowledge whileresearch is the advancement of knowledge. It is clear that these two areinterrelated to the point of being inextricable. For example, a principal objec-
tive of teaching is to instill in students a spirit of inquiry, acuriosity about knowledge. These terms define research.Research has, therefore, many dimensions:
Research has manyforms. It can Includebasic research, funda-mental inquiry that hasno applied objectivebut often producesone. For example, thelaser was a side ben-efit of scientific inves-tigation of the micro-wave spectrum of am-monia. Orresearch canbe very applied, as Inthe focused study ofstudent early readingproblems that pro-duced the extraordinar-ily successful ReadingRecovery Program.
A chemistry professorat a technical collegeperforms about 20hours a month In ser-vice activities as thesafety Inspector for hercampus. One of herroles In this activity Isoverseeing the removalof hazardous waste.She also advises localIndustry on these top-ics.
Research is essential to the economic advancement ofour society -- about 60 percent of basic research comesfrom higher education; proximity to research pro-grams is a major factor in corporate location decisions.
Research is integral to teaching.
Research inspires the whole enterprise-- ateaching institution must be a learninginstitution.
ServiceFaculty service includes assistance to the profes-sion, to the institution, and to the community. Allfaculty perform service to the institution, whileparticipation in professional and communityservice varies according to an individual's aca-demic discipline and the type of program. It isimportant to note that public demand for faculty service is increasing inmany disciplines.
The UniversityofNorthCarolina, In its LongRange Plan (1976),notes: Instructioncharacterizes the re-sponsibilities of theUniversity to commu-nicate existing knowl-edge to successivegenerations of stu-dents. Research char-acterizes the respon-sibilities of the Univer-sity for the advance-ment of knowledge.Teaching andresearchare thus complemen-tary, not competitive.Each Is stimulated andstrengthened by theother."
Higher Education in OhioOhio's large and diverse system of higher education represents a range of missions in instruc-tion, research, and service. In the two-year sector, technical and community colleges offerdegree programs designed to prepare students for work in such fields as engineering andmedical technology; these colleges also provide service, for example in job training, to theirlocal communities. Also in the two-year sector, community colleges and branch campusesrovide degree programs and course work that prepare students for transfer to baccalaureateprograms.
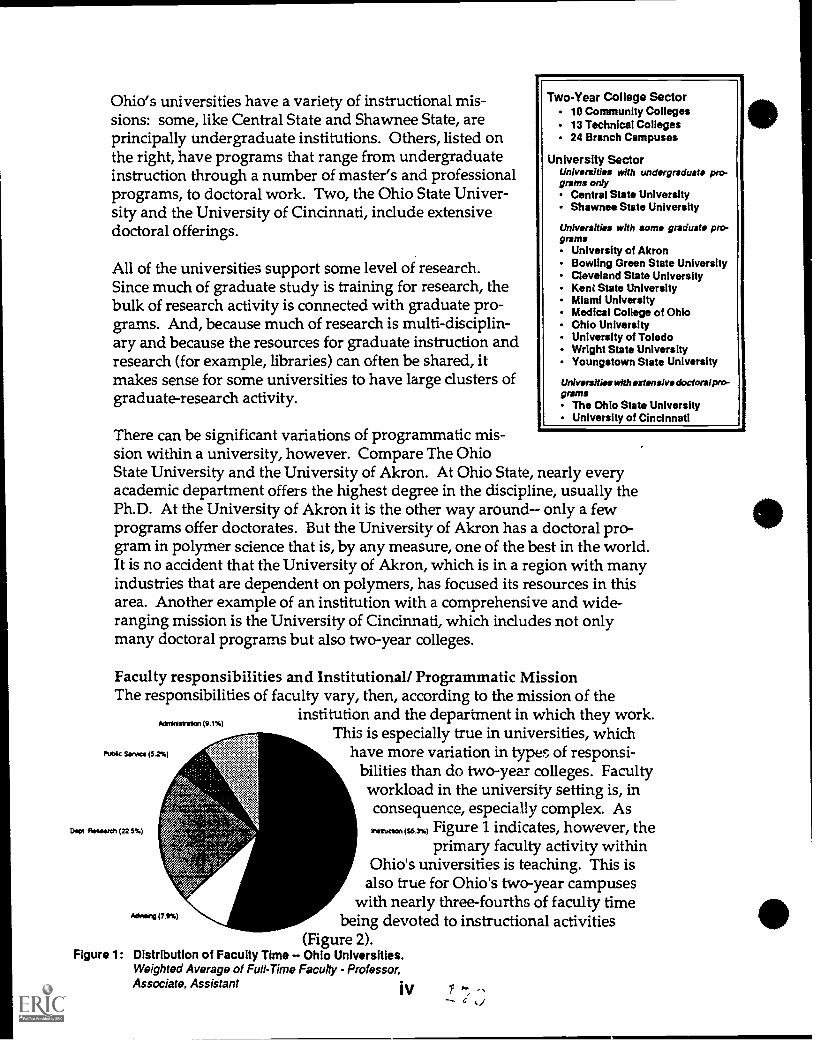
Ohio's universities have a variety of instructional mis-sions: some, like Central State and Shawnee State, areprincipally undergraduate institutions. Others, listed onthe right, have programs that range from undergraduateinstruction through a number of master's and professionalprograms, to doctoral work. Two, the Ohio State Univer-sity and the University of Cincinnati, include extensivedoctoral offerings.
All of the universities support some level of research.Since much of graduate study is training for research, thebulk of research activity is connected with graduate pro-grams. And, because much of research is multi-disciplin-ary and because the resources for graduate instruction andresearch (for example, libraries) can often be shared, itmakes sense for some universities to have large dusters ofgraduate-research activity.
There can be significant variations of programmatic mis-
Two-Year College Sector10 Community Colleges13 Technical Colleges24 Branch Campuses
University SectorUnites:tidos with undorgraduato pro-grams only
Central State UniversityShawnee State University
Universitias with some graduate pro-grams
University of AkronBowling Green State UniversityCleveland State UniversityKent State UniversityMiami UniversityMedical College of OhioOhio UniversityUniversity of ToledoWright State UniversityYoungstown State University
UnivorsitissivithsxtonsIvedoctoral pro-grams
The Ohio State UniversityUniversity of Cincinnati
sion within a university, however. Compare The OhioState University and the University of Akron. At Ohio State, nearly everyacademic department offers the highest degree in the discipline, usually thePh.D. At the University of Akron it is the other way around only a fewprograms offer doctorates. But the University of Akron has a doctoral pro-gram in polymer science that is, by any measure, one of the best in the world.It is no accident that the University of Akron, which is in a region with manyindustries that are dependent on polymers, has focused its resources in thisarea. Another example of an institution with a comprehensive and wide-ranging mission is the University of Cincinnati, which includes not onlymany doctoral programs but also two-year colleges.
Faculty responsibilities and Institutional/ Programmatic MissionThe responsibilities of faculty vary, then, according to the mission of the
institution and the department in which they work.This is especially true in universities, which
lholgc Service (52%) have more variation in types of responsi-
Agkririarslon (9.1%)
Dept liewarch (22 SS)
Acteiling (7.9%)
bilities than do two-year colleges. Facultyworkload in the university setting is, inconsequence, especially complex. As
Figure 1 indicates, however, theprimary faculty activity within
Ohio's universities is teaching. This isalso true for Ohio's two-year campuses
with nearly three-fourths of faculty timebeing devoted to instructional activities
(Figure 2).Figure 1: Distribution of Faculty Time Ohio Universities.
Weighted Average of Full-Time Faculty - Professor,Associate, Assistant iV
""" a iJ
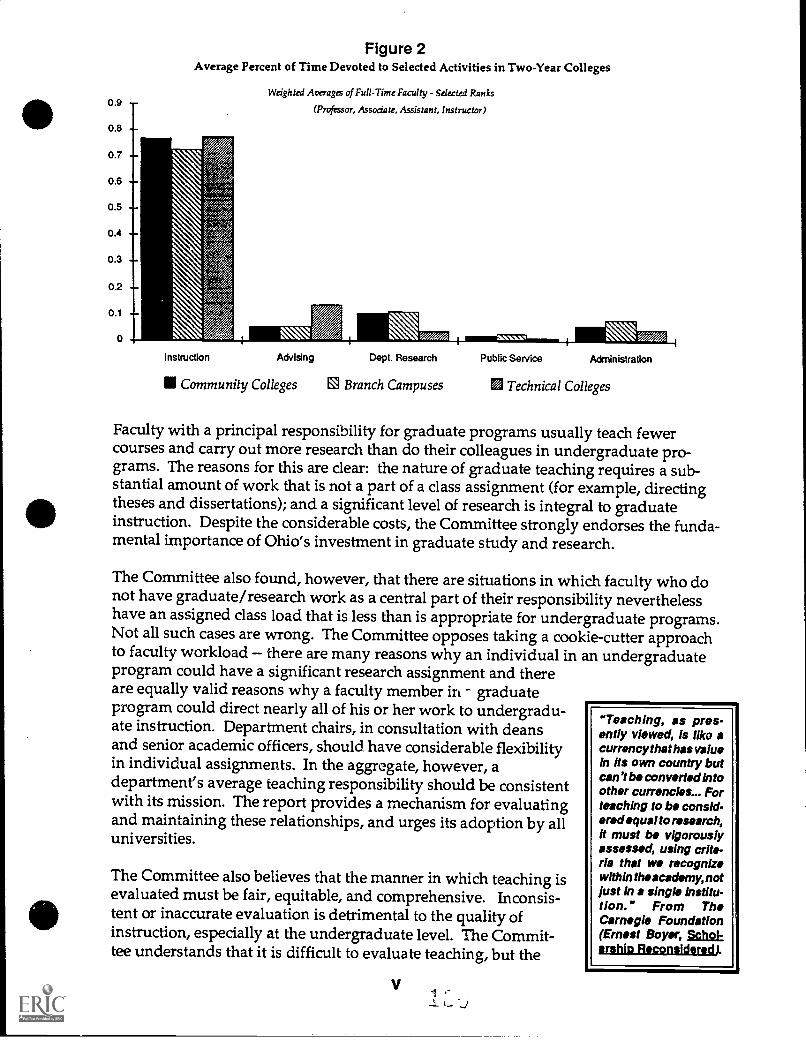
0.9
0.8
0.7
0.6
0.5 ,-
0.4
0.3
Figure 2Average Percent of Time Devoted to Selected Activities in Two-Year Colleges
Weighted Averages of Full-Time Faculty - Selected Ranks
(Professor, Associate, Assistant, Instructor)
Instruction Advising Dept. Research Public Service Administration
Community Colleges El Branch Campuses 'e% Technical Colleges
Faculty with a principal responsibility for graduate programs usually teach fewercourses and carry out more research than do their colleagues in undergraduate pro-grams. The reasons for this are clear: the nature of graduate teaching requires a sub-stantial amount of work that is not a part of a class assignment (for example, directingtheses and dissertations); and a significant level of research is integral to graduateinstruction. Despite the considerable costs, the Committee strongly endorses the funda-mental importance of Ohio's investment in graduate study and research.
The Committee also found, however, that there are situations in which faculty who donot have graduate/research work as a central part of their responsibility neverthelesshave an assigned class load that is less than is appropriate for undergraduate programs.Not all such cases are wrong. The Committee opposes taking a cookie-cutter approachto faculty workload there are many reasons why an individual in an undergraduateprogram could have a significant research assignment and thereare equally valid reasons why a faculty member in graduateprogram could direct nearly all of his or her work to undergradu-ate instruction. Department chairs, in consultation with deansand senior academic officers, should have considerable flexibilityin individual assignments. In the aggregate, however, adepartment's average teaching responsibility should be consistentwith its mission. The report provides a mechanism for evaluatingand maintaining these relationships, and urges its adoption by alluniversities.
The Committee also believes that the manner in which teaching isevaluated must be fair, equitable, and comprehensive. Inconsis-tent or inaccurate evaluation is detrimental to the quality ofinstruction, especially at the undergraduate level. The Commit-tee understands that it is difficult to evaluate teaching, but the
V
"Teaching, as pres-ently viewed, is Him acurrency that has valueIn Its own country butcan't be converted intoother currencies... Forteaching to be consid-ered equal to research,It must be vigorouslyassessed, using crite-ria that we recognizewithin the academy, notlust in a single institu-tion." From TheCarnegie Foundation(Ernest Boyer, Schol-rshic Reconsidered).

problems are too serious to be ignored simply because they are challenging. Administratorsoften seem to base judgements of the quality of teaching primarily on student perceptions ofperformance, which are easily secured but limited in value, rather than on information aboutthe effectiveness of an instructor's ability to present content in a way that promotes studentlearning. Similarly, especially in universities, research (which is more easily quantified andjudged) appears often to be valued over teaching. The Committee recommends that Ohio'scolleges and universities follow those in other states by adopting a comprehensive approach toevaluating instruction that will ensure that faculty are rewarded fully for the quality andeffectiveness of their teaching.
ConclusionsWorkload Should be Derived From Program Mission
While teaching, research, and service are activities common to all Ohio colleges anduniversities, the emphasis given to them varies significantly according to the mis-sion of the program and the institution.
National & State Studies Suggest Workload Is Derived From MissionNumerous national studies confirm that the amount of time spent on various activi-ties currently does vary according to the mission of the program or institution in-volved. Such patterns are consistent throughout the country. State studies corrobo-rate this finding; in every state where a full-fledged study had been conducted, thepatterns are almost precisely those found at the national level.
Ohio's Norms Are Consistent With National PatternsOur own examination of data for Ohio reveals that the practices in this state arevirtually identical to national ones. Faculty service reports that are filled out everyyear support this consistency. In community college programs in Ohio, whereteaching undergraduates in their first two years is the prime component of institu-tional mission, workload expectations emphasize teaching and service, as nationalnorms would predict. Similarly, in programs that involve graduate teaching andrelated research activity, the patterns in Ohio resemble those observed everywhereand show an increased emphasis on research and scholarship.
Workload Includes All Professional Faculty ActivitiesWorkload includes far more than the hours spent in the classroom alone. Workloadexpectations must take into ccount class preparation, grading, and other forms ofstudent evaluation, as well as the full range of service, advising, mentoring, andresearch activities that are interconnected parts of the educ. 'ional and instructionprocess.
Periodic Assessment Is Important in Monitoring ProgramsIf there is significant deviation from workload expectations, that variation can createdifficulties for an institution. Problems do occasionally occur and need to be cor-rected. Periodic review of faculty activity is the responsibility of the college oruniversity, and is an essential part of institutional accountability. If there are incon-sistencies in some faculty members workload patterns, institutions must have pro-grams in place to detect such inconsistencies and correct them. Most campuses inthe state regularly conduct such reviews.
vi.1/t
RecommendationsIdentify and Eliminate Current Inconsistencies
The vast majority of faculty members in Ohio spend as much time teaching, engag-ing in campus and community service, and furthering research and scholarship aswould constitute a full workload in any field of endeavor. Yet, as with any largesystem with scores of institutions and thousands of employees, some inconsistenciesare bound to occur. While Ohio's public colleges and universities may include anoccasional faculty member who performs little productive research or service, andteaches a relatively light load in terms of contact hours in the classroom, our investi-gation demonstrates that such people are a very small exception rather than the rule,and that this charge made by Charles J. Sykes in Prof Scam: Professors and the Demiseof Higher Education is exaggerated and inflated, at least within the state of Ohio. Toensure that Ohio's system of higher education remains vigilant in this regard, wesuggest that each institution in the state system examine its own policies and elimi-nate inequities by following the suggestions outlined below.
Preserve Institutional Decision-Making on WorkloadWe recommend that each institution be responsible for ensuring that faculty activitycontinues to correspond as closely as possible to reasonable standards. All commu-nity and technical colleges already adhere to systematic college-wide workloadstandards. All other colleges and universities have workload policies in place andare currently engaged in monitoring local norms to determine how well, in fact,programs do meet expectations. The University of Cincinnati, for example, has aninternal workload committee actively engaged in the process of establishing thresh-olds or base workloads for all faculty members that will be broad enough to addressthe idiosyncratic natures of the different academic units and their missions. Similargroups are at work on almost all other campuses in Ohio. Such local governance haslong been the hallmark of the entire system, and is the most useful means to guaran-tee that the needs of the state and the interests of the taxpayers are met.
Maintain Existing Institutional Patterns in Two-Year CollegesOhio's two-year community and technical colleges, which are dedicated primarily toteaching, have functioned successfully by adhering to systematic college-wideworkload standards. Programs vary, to be sure, both within institutions and fromschool to school. Still, all faculty members share a common mission that revolvesaround classroom instruction. Each institution generally sets itsown workloadexpectations, which are written, understood, and followed by all faculty membersand administrators throughout the institution. We recommend that this approachbe continued.
Set Departmental Expectations in All Other InstitutionsAll other institutions, including branch campuses, along the higher education con-tinuum that has been described throughout this report seek to fulfill a more complexset of mission requirements. As we move along the continuum, the kind of teachingdone varies dramatically. It may include the special demands of graduate educa-tion, mentoring and research expectations that are closely tied to upper-division
vii

undergraduate and graduate teaching, and one-to-one instruction in the arts andprofessional schools. Within this framework of four-year, baccalaureate, compre-hensive, and research institutions, we strongly recommend that departmentalflexibility be preserved in making workload assignments. We wish to underscorethe appropriateness of the department or degree program as the unit to overseeworkload assignments according to the systematic pattern described earlier, subjectto review for consistency with the mission of the institution and its strategic plan.
Ensure That Incentives and Rewards Follow Mission ExpectationsAt a time when increased national and state attention is being given to faculty teach-ing responsibilities, we strongly recommend that each program or institution withinthe state makes sure that the reward structure reflects such an emphasis. Teachingand research are complementary, not competitive, activities, and excellence in teach-ing needs to be rewarded as does excellence in research as consistent elements of theoverall mission of higher education in the state of Ohio.
The Committee also believes that Ohio's colleges and universities should adopt arigorous and comprehensive approach to the evaluation of instruction. Developingsystematic and rigorous assessment models that engender common acceptance, andfrom which judgments about teaching quality and effectiveness can consistently bemade, will ensure that faculty are routinely evaluated against commonly acceptedcriteria and rewarded fully for their involvement in this activity.
Vitt
FACULTY PRODUCTIVITY AT KENT STATE UNIVERSITYPRELIMINARY REPORT
MAY 1992
FACULTY PRODUCTIVITY AT KENT STATE UNIVERSITYPRELIMINARY REPORT
Background
The "products" that faculty members at American colleges anduniversities are hired to create -- educated, intellectuallysophisticated citizens and ideas for economic development,improving the quality of life, and enhancing understanding of basisknowledge -- by their very nature resist quantification. Themultifaceted acts of "teaching" and "scholarship" are equally, ifnot more, analytically elusive. It is not surprising, therefore,that the accurate and efficient assessment of faculty productivityremains a challenge, as well as a subject of debate, within theacademic community.
Despite the inherent difficulties in documenting the many, variedand changing contributions of faculty members, the availability ofdetails about the "what" and "how much" of faculty life is criticalfor internal planning. Increasingly, such information has beennecessary for responding to taxpayers' questions about the amountof time faculty devote to teaching, as well as time spent pursuingtheir own scholarship and academic interests.
Understandably, appraisals of faculty contributions have focused onthe variable that is most easy to report and collect: time spent inthe classroom and performing other brc,tdly defined academic duties.Kent State University has not been an exception. Each semester, inaccordance with state requirements, individual faculty memberscomplete an Instructional Service Report, which categorizesactivities by credit hour instruction (time spent in the
classroom), and by time spent advising students, conductingdepartmental end personal research, performing public serviceactivities, and serving administrative functions. The data arecompiled, summarized, and published annually by the Ohio Board ofRegents.
Analyses of these data have proven useful in providing an overviewof faculty responsibilities. Further, they oiler indisputableevidence that the vast majority of faculty members devotes thelargest proportion of their professional time to students.
11' -.
-- L.;
For example, data collected during Fall Semester 1991 show that:
Of 1,673 individuals who taught on the Kent Campus, 47 percent
were full-time faculty, 32 percent were part-time faculty, and
21 percent were graduate-student assistants (Attachment 1).
Of all regular course sections taught by full- and part-time
faculty in the seven colleges and schools on the Kent Campus,
an average of 70 percent were taught by full-time faculty. All
colleges and schools had at least 67 percent (and as much as
94 percent) of regular sections taught by full-time faculty,
with the exception of the School of Physical Education,
Recreation and Dance, which offers a wide range of activity
courses requiring part-time specialists (Attachment 2). When
graduate assistants were factored in, the average percentage
of regular sections taught by full-time faculty was 62
percent, with part-time faculty having taught an average of 25
percent, and GAs having taught an average of 12.5 percent of
regular sections (Attachment 3).
Full-time faculty members taught 71 percent of total student
credit hours, or 173,891 hours, versus 29 percent, or 70,760
student credit hours, taught by part-time faculty (Attachment
5). When graduate assistants were factored in, full-timefaculty still were found to have taught the majority ofstudent credit hours (61 percent), with part-time facultyhaving accounted for 25 percent, and GAs having accounted for
15 percent of total student credit hours (Attachment 41.
Distributed across the seven colleges and schools on tae Kent
Campus, full-time faculty taught an average of 75 percent of
total student credit hours, versus an average of 25 percent of
total student credit hours taught by part-time faculty(Attachment 6). When graduate assistants were factored in,full-time faculty still taught the majority of studentcredit hours across colleges and schools (an average of66.5 percent), with part-time faculty having taught anaverage of 21.8 percent, and graduate student assistantshaving taught an average of 11.5 percent of student credits
hours (Attachment 6).
The percentage of student credit hours taught by facultyaccorOing to rank (full, associate, and assistant professor)refutes an all-too-common perception that faculty --particularly higher-ranking faculty -- are prone to spending
the bulk of their time conducting research and pursuingpublication in scholarly journals. Full and associateprofessors taught nearly 40 percent of student credit hours,for a combined total of 93,788 hours (Attachment 8).
Seven hundred eighty-three full-time faculty members at the
Kent Campus taught 173,891 student credit hours. Each
2
full-time faculty member taught an average of 222 studentcredit hours. To determine direct contact of faculty withstudents we might, for example, divide the average 222 studentcredit hours by 3 credit hours per student (the equivalentof one section) to find that each faculty member at the KentCampus had direct and regular contact with an average of 74students during the semester (Attachment 9). When thisstatistical analysis is applied to the 216 full-time, fullprofessors at the Kent Campus, each teaching an average of 213
student credit hours, we find as follows: each full professor
had direct and regular contact with an average of 77 studentsduring the semester (Attachment 10).
* When statistics about student credit hours taught by full- andpart-time faculty were distributed across five very differentdepartments at the Kent Campus and a representative of theUniversity's seven Regional Campuses, an average of 73.3 percent
of all student credit hours w're shown to have been taught byfull-time faculty (Attachment 12). Even when graduate assistants
were factored in, full-time faculty taught an average of two-thirds (66 percent) of all student credit hours, with GAs havingaccounted for an average of about 10 percent (Attachment 11 ).
While these conventional methods of assessing faculty contributionsshow a faculty actively engaged in teaching, they fail to reflectthe richness and variety of faculty life, and the dedication withwhich most faculty tackle their numerous responsibilities.
For this reason, the President commissioned a study to approachquestions about faculty contributions from a new perspective. The
Managing for the Future Task Force concurred that the proposedapproach would serve their purposes. This alternate approach wasto be based on the reality that faculty members are not academic"free agents" who place their individual interests above theirstudents' needs. Instead, faculty members are assigned roles thatcapitalize on their individual talents and that best allow theiracademic departments to fulfill their missions, in concert with themission of the University as a whole. The distribution of functionsis carried out at the departmental level. Thus, the President wascommitted to a study that asked, "What is the department expectedto contribute to the University's mission?" as opposed to thetraditional question, "What does the individual faculty member do?"
Working with the Faculty Senate Steering Committee, it was agreedthat Kent's study should incorporate the expanded concept of"scholarship" presented by Dr. Ernest Boyer in "ScholarshipReconsidered: Priorities of the Professoriate."
Boyer's pivotal work urges that scholarly activity be expanded to
3
2 4
include: (1) The scholarship of discovery, which "contributes tothe stock of human knowledge and to the intellectual climate of a
university." (2) The scholarship of integration, which "givesmeaning to isolated facts, makes connections across the
disciplines, and fits basic research into larger intellectualpatterns." (3) The scholarship of application, which asks "'How canknowledge be responsibly applied to consequential problems?'" and
(4) The scholarship of teaching, which "begins with what theteacher knows, moves through the transmission of knowledge andleads to the transformation and the extension of knowledge."
Process
A review of faculty productivity studies at other institutionsrevealed a dearth of techniques for documenting facultycontributions from the departmental level. This finding, coupledwith the growing interest in "scholarship reconsidered" that hasemerged under the administration of President Carol A. Cartwright,led tc the decision that Kent should seize the opportunity toprovide leadership in this uncharted area. The pilot study that wasproposed was seen as having potential applications not only forKent but for colleges and universities nationwide.
A new format, using the academic department as the unit ofanalysis, was designed, and Lynnette Andresen, an American Councilon Education fellow who spent the 1991-92 academic year as anassistant to President Cartwright. was assigned as project 41,director.
Five units representing a diversity of academic fields plus one ofthe University's seven Regional Campuses were selected for thepilot study: The Department of English, notable for its writing-across-the-curriculum service role, a large undergraduateinstructional load, and distinguished doctoral programs; the Schoolof Art, whose studio classes require a distinctive type of facultypreparation, and whose students are evaluated largely on the basisof juried shows and other presentations; the Department of Physics,which is characterized by a select number of strong research andgraduate programs as well as a comprehensive undergraduate program;the School of Nursing, whose clinical orientation necessitatesinstruction at a wide range of geographical sites and clinicalsettings and whose research is on the "applied" end of thescholarly spectrum; the Department of Psychology, a representativeof the behavioral/slcial sciences with a tradition of excellence inblending teaching and research; and the Salem Campus, which, as aRegional Campus, requires faculty to cooperate across disciplinesin serving freshman, sophomore, and nontraditional students, manyof whom are underprepared for college-level study.
A draft format was developed in February 1992 and submitted to theExecutive 'Committee of the Faculty Senate and the
4

chairs/directors/deans of the selected units for review. In
consultation with these groups, a detailed listing of activities
was formulated for inclusion in the study. The resulting Faculty
Productivity Work Sheet allowed faculty members to itemize their
daily and weekly activities under broad headings consistent with
Boyer's classification scheme: scholarship, teaching, academic
advising, and administrativeactivities. Particular care was taken
to accommodate the myriad of activities that constitute "teaching."
Under this broad category alone, faculty could record their
activity in forty separate areas. A sample Work Sheet is attached
to this report.
Work sheets were distributed to full-time faculty in the
participating units in early March 1992. In addition to completing
the work sheets, selected faculty were asked to submit diaries of
their activities during a week. Data were collected and analyzed
from March-May 1992.
The following full-time faculty participated in the study: Art --
5 assistant professors, 13 associate professors, and 5 full
professors; English -- 7 assistant professors, 15 associate
professors, and 16 full professors; Nursing -- 12 instructors and
assistant professors, 7 associate professors, and 19 full
professors; Physics -- 2 assistant professors, 4 associate
professors, and 11 full professors; Psychology -- 6 assistant
professors, 7 associate professors, and 12 full professors; and
Salem Regional Campus -- 10 instructors, 15 assistant professors,
and 1 full professor (included in assistant professor data). Data
concerning part-time faculty and graduate assistants were
provided by the heads of the departments. These data were included
only in the classroom instruction, clinical supervision, laboratory
instruction, and studio and performance/exhibition supervision
sections under the teaching activity category.
Conclusions
Because of the accelerated timeframe under which Kent's pilot
productivity study was conducted, the University Administration and
Kent's Managing for the Future Task Force consider the project a
"work in progress" that warrants continuing review and refinement.
Nevertheless, data from this new approach to examining faculty
contributions already support the premise that faculty members do
not constitute monolithic groups of "teachers" or "researchers,"
but are actually engaged in a wide and changing variety of
scholarly activities. An individual faculty member is one part of
the departmental mosaic, with a clearly defined place in the
overall mission picture. Where each faculty member fits is very
much a function of departmental needs at a given time and the
unique talents of the individual faculty member.
Preliminary results of the pilot study indicate that:
Contrary to popular perceptions that most faculty members' toppriority is research, full-time faculty in the six unitsstudied devoted an average of 55 percent of their professionaltime to activities classified as teaching and advising, andless than one-third (31 percent), on average, to activitiesclassified under scholarship (Attachment 13).
* By enumerating the diverse activities that constitutescholarly activity, it becomes possible to form a moreaccurate picture of the complexities of faculty life than isachieved with traditional surveys. For example, in addition tothe standard category of classroom instruction, participantscould report the instructional activities of studentevaluation, individualized instruction, classroom preparation,clinical supervision, studio and performance supervision,laboratory instruction, and other student contact. As anindication of how much time and effort precedes each class orstudio session, School of Art faculty (across ranks) spent anaverage of 22.6 percent of their instructional time onclassroom preparation alone. Psychology Department faculty(across ranks) devoted an average of one-third (33.o percent)of their instructional time to classroom preparation(Attachment 14).
* The use of the department as the unit of analysis in assessingfaculty contributions is valid as well as practical. Thecorrelation between departmental mission and time devoted tothe various categories and subcategories of scholarship wasapparent in virtually all units. For example, School ofNursing faculty (across ranks) spent an average of 35.3percent of their instructional time -- the highest percentageof the units studied -- engaged in clinical supervision.The proportion of faculty time spent monitoring students inhospitals and other clinical settings is clearly consistentwith the school's primary mission of providing highly skillednurses for the region and beyond. But while, for example,nursing faculty devoted a substantial amount of time toclinical supervision, an average (across ranks) of 3.3 percentof their instructional time was spent on individualizedinstruction. This can be contrasted with the average of 27percent of instructional time allotted to individualizedinstruction by faculty (across ranks) at the Salem RegionalCampus, whose mission centers on the education of freshman andsophomore students, many of whom arrive underdrepared forcollege work and require a great deal of interaction withfaculty (Attachment 15).
The faculty diaries submitted by several faculty in each ofthe six units studied were a valuable addition to the datagenerated by the Faculty Productivity Work Sheets. The diariesnot only showed that faculty members' work lives are asdistinctive as each individual, but brought to life the fact
6
that scholarly activity is unpredictable -- what is requiredof any faculty member can change from day to day, week to
411 week, and term to term. The diaries also provided compellingevidence of a faculty who are genuinely interested in andpersonally committed to their students' success, theenhancement of their disciplines, and service to theUniversity community.
It is the recommendation of the Task Force that the formatdeveloped by Lynnette Andresen in cooperation with the ExecutiveCommittee of the Faculty Senate be refined through testing withadditional departmental units. In order to ensure the validity ofthe Faculty Productivity Work Sheet as a prototype for use acrossdepartments, several categories must first be defined more clearly,or else eliminated entirely. Case in point: The "academic advising"category generated responses so small as to be insignificant --apparently because advising activities were recorded under the moregeneral "teaching" category.
Kent State University is committed to pursuing this promising meansof illuminating the many and varied contributions made by collegeand University faculty members, and to finding the optimum way ofcommunicating such important data.
7

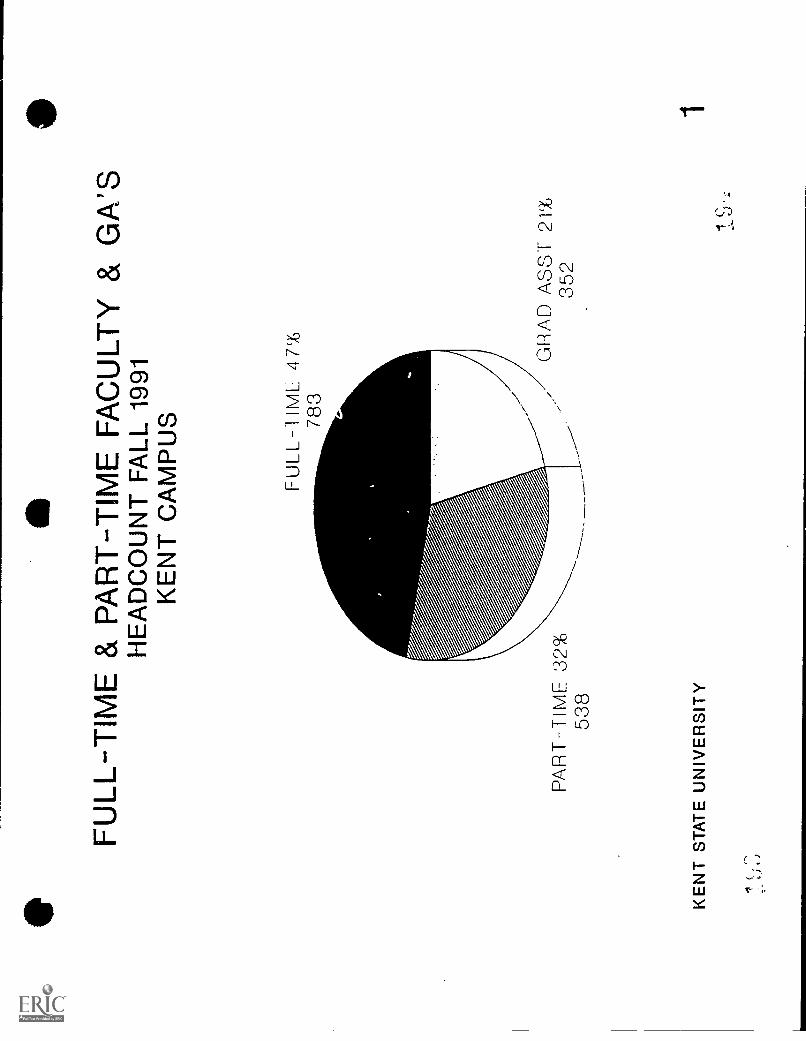
FU
LL-T
IME
& P
AR
T-T
IME
FA
CU
LTY
& G
A'S
HE
AD
CO
UN
T F
ALL
199
1K
EN
T C
AM
PU
S
FU
LL -
] IM
L 47
%78
3
PA
RT
-TIM
E 3
2%53
8
KE
NT
ST
AT
E U
NIV
ER
SIT
Y
GR
AD
AS
ST
21%
352
1
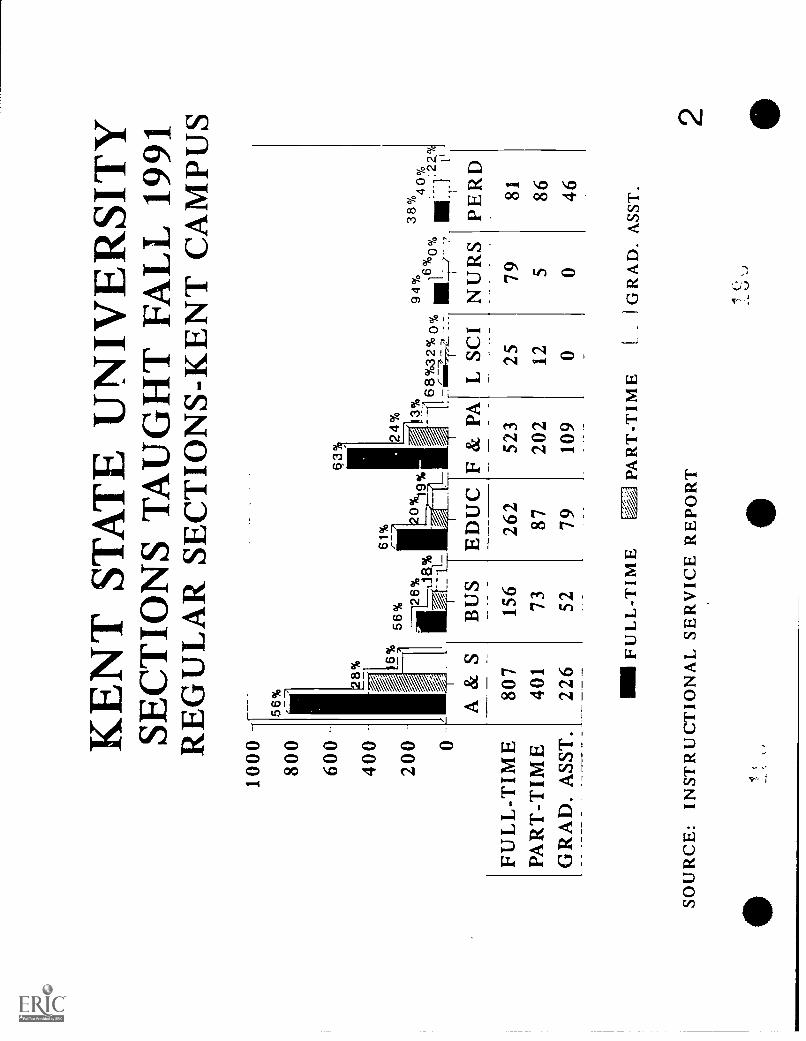
KE
NT
ST
AT
E U
NIV
ER
SIT
YSE
CT
ION
S T
AU
GH
T F
AL
L 1
991
RE
GU
LA
R S
EC
TIO
NS-
KE
NT
CA
MPU
S10
00 -
800
600
-
400
-
200 0
FUL
L-T
IME
PAR
T-T
IME
GR
AD
. ASS
T.
56%
8%
16%
A &
S
807
401
226
56% BU
SE
DU
C
156
262
7387
5279
61%
%
6
24% 3%
94%
-116
E1%
32%
,00/
1.1
6%w
y:7
Ii
-
F &
PA
523
202
109
L S
CI
NU
BS
2579
125
00
38%
40%
lit;1
1;2°
1PE
RD
81 86 46
III
FUL
L-T
IME
PAR
T-T
IME
GR
AD
. ASS
T.
SOU
RC
E: I
NST
RU
CT
ION
AL
SE
RV
ICE
RE
POR
T2
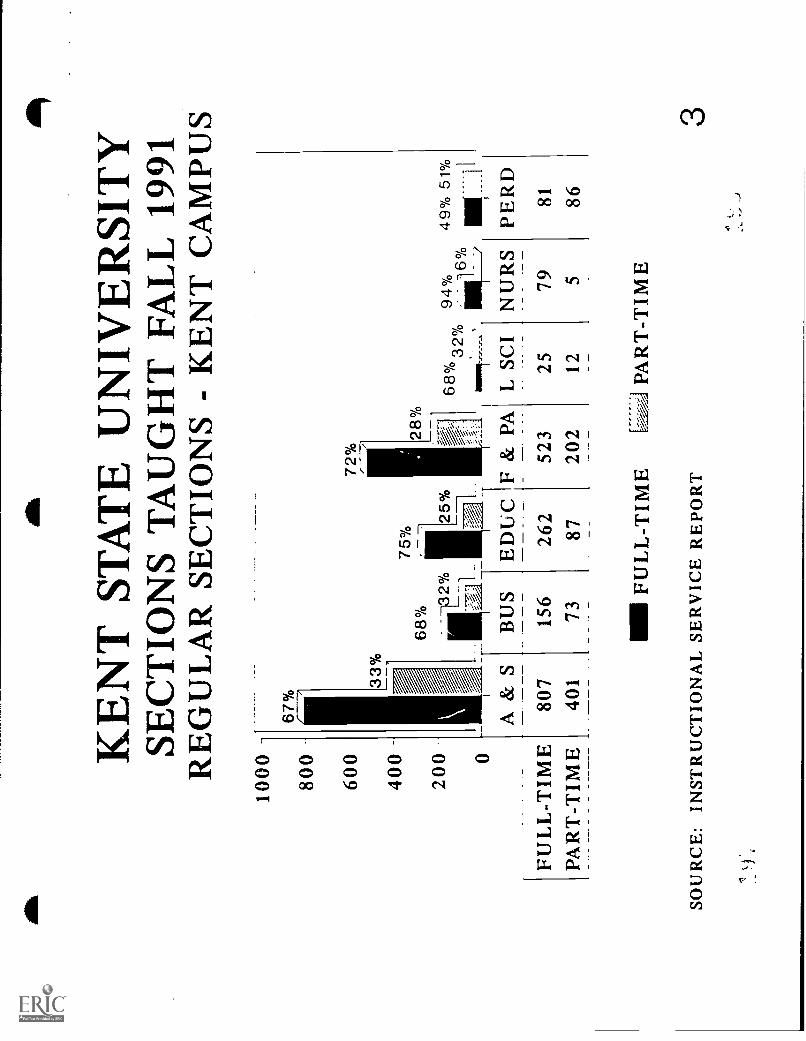
KE
NT
ST
AT
E U
NIV
ER
SIT
YSE
CT
ION
S T
AU
GH
T F
AL
L 1
991
RE
GU
LA
R S
EC
TIO
NS
- K
EN
T C
AM
PUS
1000 80
0
600
400
-
200 0
FUL
L-T
IME
PAR
T-T
IME
67%
33%
68% --
-32%
011M
-1-1
BU
S
75% 12
5%
156
73
ED
IIC
262
87
68%
32%
94%
16%
49%
51%
F &
PA
L S
CI
NU
RS
PER
D
523
2579
81
202
125
86
FUL
L-T
IME
L%
;-A
PA
RT
-T
IME
3

KE
NT
ST
AT
E U
NIV
ER
SIT
YS
TU
DE
NT
CR
ED
IT H
RS
. TA
UG
HT
BY
FA
CU
LTY
KE
NT
CA
MP
US
-F
ALL
199
1
f-l'!
II
IML
891
I'A
lI
HM
I_ 2
53',
71)0
SO
UR
CE
: IN
ST
RU
CT
ION
AL
SE
RV
ICE
RE
PO
RT
S
l\:;;;
Iiy
,t,i
1I
4
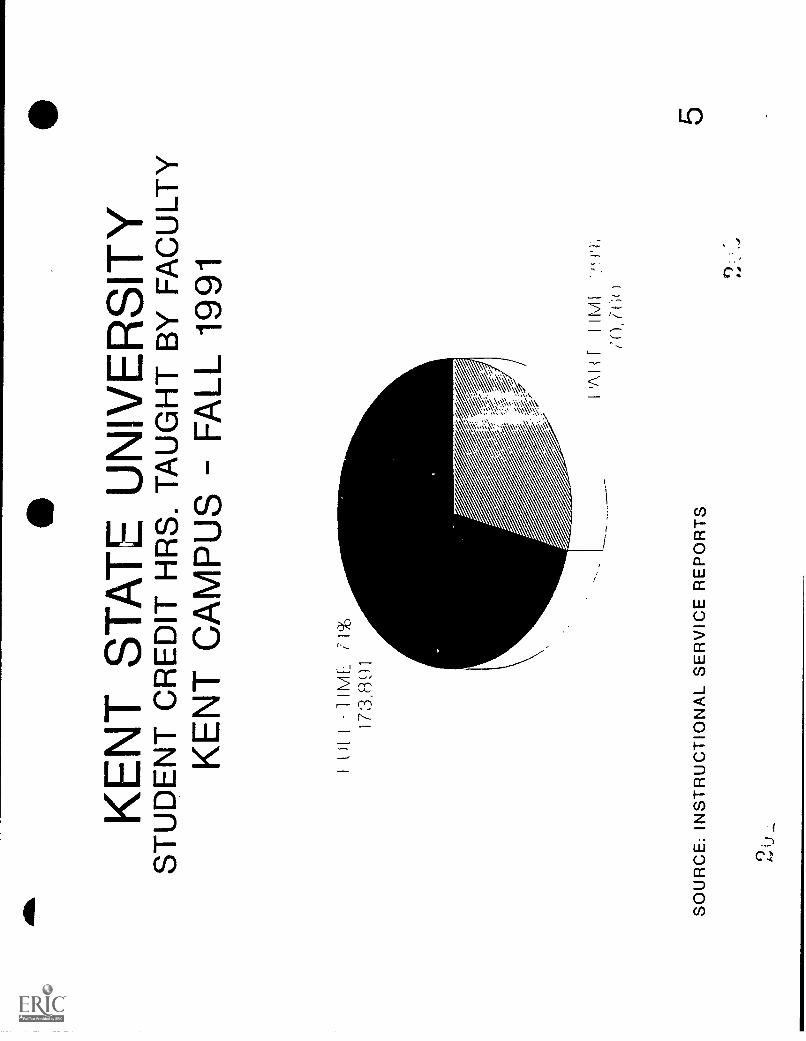
KE
NT
ST
AT
E U
NIV
ER
SIT
YS
TU
DE
NT
CR
ED
IT H
RS
. TA
UG
HT
BY
FA
CU
LTY
KE
NT
CA
MP
US
- F
ALL
199
1
I11
11-
11M
L 71
%17
3,89
1
SO
UR
CE
: IN
ST
RU
CT
ION
AL
SE
RV
ICE
RE
PO
RT
S
PA
H1-
I IM
1,'(
1,7(
;( )
5
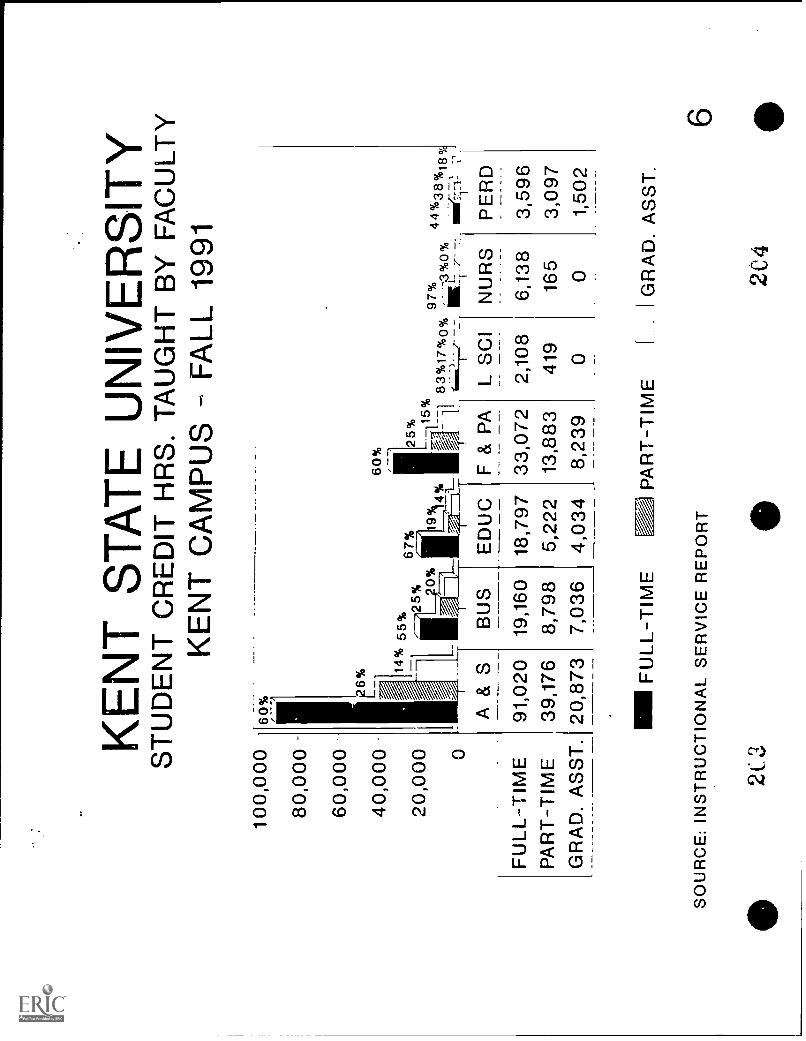
KE
NT
ST
AT
E U
NIV
ER
SIT
YS
TU
DE
NT
CR
ED
IT H
RS
. TA
UG
HT
BY
FA
CU
LTY
KE
NT
CA
MP
US
- F
ALL
199
1
100,
000
80,0
00 -
60,0
00
40,0
00 -
20,0
00
0
FU
LL-T
IME
PA
RT
-TIM
EG
RA
D. A
SS
T.
60% - A&
S_
91,0
2039
,176
20,8
73
55%
67%
&I-
25;
4 0%
60% 15
%%
83°,
17%
0%
BU
SE
DU
C
19,1
6018
,797
8,79
85,
222
7,03
64,
034
L.
F &
PA
L S
CI
33,0
722,
108
13,8
8341
9
8,23
90
97%
/o0
%44
%38
%18
0/
NU
RS
PE
RD
6,13
83,
596
165
3,09
70
1,50
2
FU
LL-T
IME
M P
AR
T-T
IME
GR
AD
. AS
ST
.
SO
UR
CE
: IN
ST
RU
CT
ION
AL
SE
RV
ICE
RE
PO
RT
2( 3
6
2C4
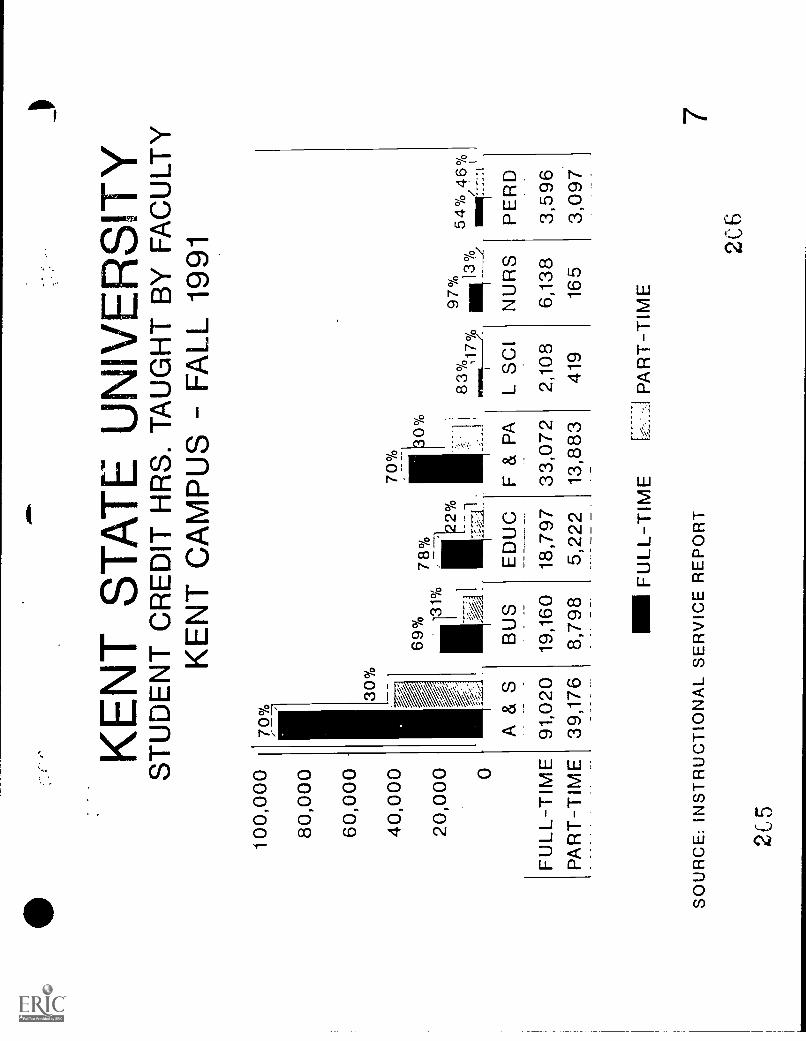
.
KE
NT
ST
AT
E U
NIV
ER
SIT
YS
TU
DE
NT
CR
ED
IT H
RS
. TA
UG
HT
BY
FA
CU
LTY
KE
NT
CA
MP
US
- F
ALL
199
1
100,
000
80,0
00
60,0
00
40,0
00
20,0
00
0
FU
LL-T
IME
PA
RT
-TIM
E
69%
131%
78%
122%
ED
UC
18,7
97
5,22
2
A &
S
91,0
2039
,176
BU
S
19,1
60
8,79
8
70%
0%
83%
97%
i
(3°.
/0/
54%
46%
/it
F &
PA
L S
CI
NU
RS
PE
RD
33,0
722,
108
6,13
83,
596
13,8
8341
916
53,
097
FU
LL -
TIM
EP
AR
T-T
IME
SO
UR
CE
: IN
ST
RU
CT
ION
AL
SE
RV
ICE
RE
PO
RT
2 6
2C5
7
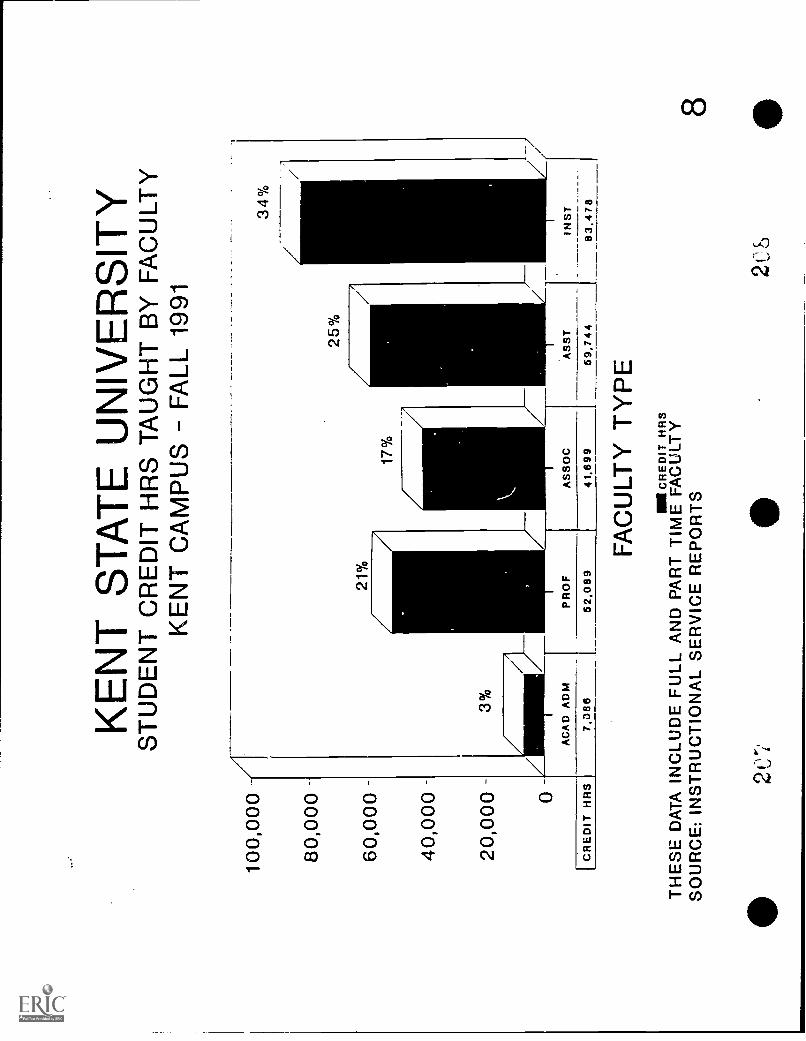
100,
000
80,0
00
60,0
00
40,0
00
20,0
00
KE
NT
ST
AT
E U
NIV
ER
SIT
YS
TU
DE
NT
CR
ED
IT H
RS
TA
UG
HT
BY
FA
CU
LTY
KE
NT
CA
MP
US
FA
LL 1
991
AS
ST
69,7
44
FA
CU
LTY
TY
PE
MI C
RE
DIT
TH
ES
E D
AT
A IN
CLU
DE
FU
LL A
ND
PA
RT
TIM
E F
AC
ULT
YS
OU
RC
E: I
NS
TR
UC
TIO
NA
L S
ER
VIC
E R
EP
OR
TS
2cri
I N S
T
83,4
78
8
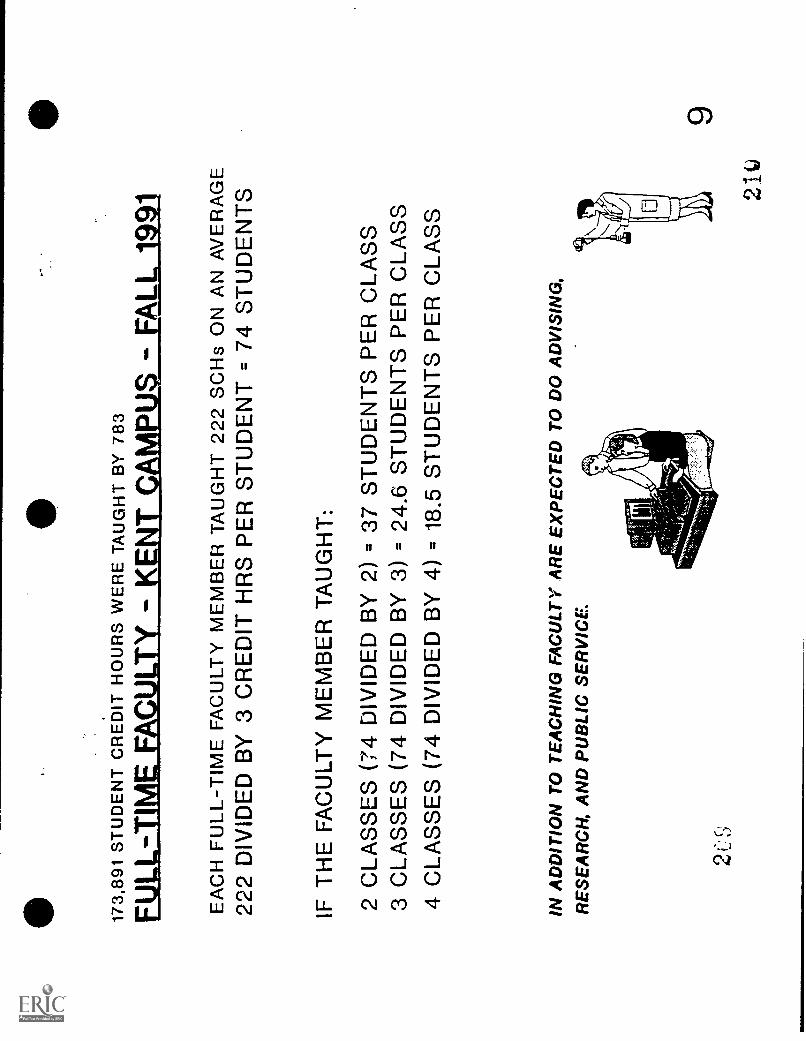
173,
891
ST
UD
EN
TC
RE
DIT
HO
UR
S W
ER
E T
AU
GH
T B
Y 7
83
LLA
a
Li$-
LIA
LL 1
991
EA
CH
FU
LL-T
IME
FA
CU
LTY
ME
MB
ER
TA
UG
HT
222
SC
Hs
ON
AN
AV
ER
AG
E22
2 D
IVID
ED
BY
3 C
RE
DIT
HR
S P
ER
ST
UD
EN
T =
74
ST
UD
EN
TS
IF T
HE
FA
CU
LTY
ME
MB
ER
TA
UG
HT
:
2 C
LAS
SE
S (
74 D
IVID
ED
BY
2)
= 3
7 S
TU
DE
NT
S P
ER
CLA
SS
3 C
LAS
SE
S (
74 D
IVID
ED
BY
3)
= 2
4.6
ST
UD
EN
TS
PE
R C
LAS
S4
CLA
SS
ES
(74
DIV
IDE
D B
Y 4
) =
18.
5 S
TU
DE
NT
S P
ER
CLA
SS
IN A
DD
ITIO
N T
O T
EA
CH
ING
FA
CU
LTY
AR
E E
XP
EC
TE
D T
O D
O A
DV
ISIN
G,
RE
SE
AR
CH
, AN
D P
UB
LIC
SE
RV
ICE
.
2C ,S
21Q
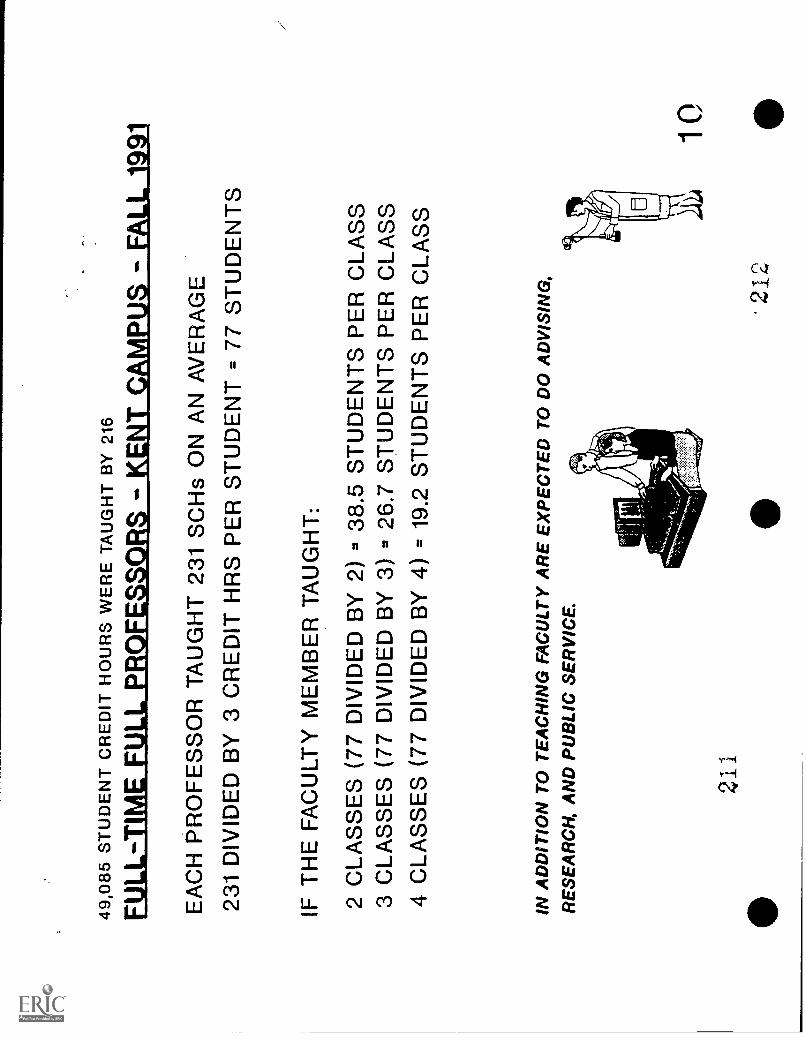
49,0
85 S
TU
DE
NT
CR
ED
IT H
OU
RS
WE
RE
TA
UG
HT
BY
216
...V
P
; 0.
.1
Li.
., a
EA
CH
PR
OF
ES
SO
R T
AU
GH
T 2
31 S
CH
s O
N A
NA
VE
RA
GE
231
DIV
IDE
D B
Y 3
CR
ED
IT H
RS
PE
R S
TU
DE
NT
= 7
7 S
TU
DE
NT
S
IF T
HE
FA
CU
LTY
ME
MB
ER
TA
UG
HT
:
2 C
LAS
SE
S (
77 D
IVID
ED
BY
2)
= 3
8.5
ST
UD
EN
TS
PE
R C
LAS
S3
CLA
SS
ES
(77
DIV
IDE
D B
Y 3
) =
26.
7 S
TU
DE
NT
S P
ER
CLA
SS
4 C
LAS
SE
S (
77 D
IVID
ED
BY
4)
= 1
9.2
ST
UD
EN
TS
PE
RC
LAS
S
IN A
DD
ITIO
N T
O T
EA
CH
ING
FA
CU
LTY
AR
E E
XP
EC
TE
D T
O D
OA
DV
ISIN
G,
RE
SE
AR
CH
, AN
D P
UB
LIC
SE
RV
ICE
.
11
S21
2
10
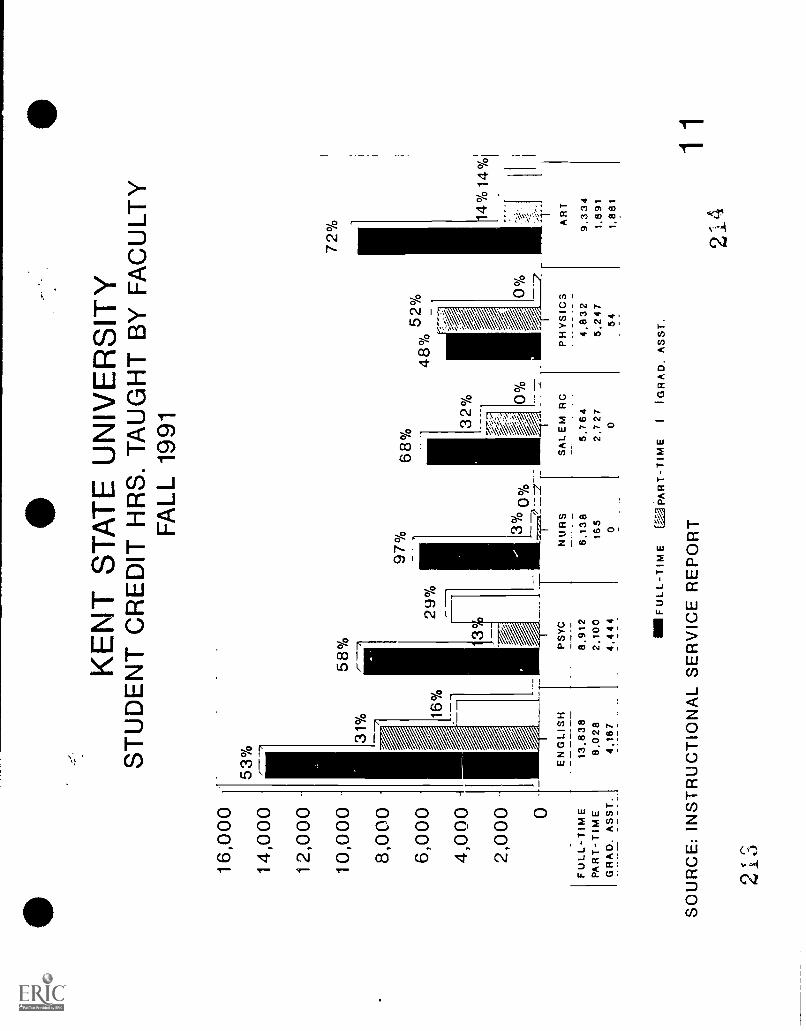
16,0
00
14,0
00
12,0
00
10,0
00
8,00
0
6,00
0
4,00
0 -
2,00
0 0
FU
LL-T
IME
PA
RT
-TIM
EG
RA
D. A
SS
T.
KE
NT
ST
AT
E U
NIV
ER
SIT
YS
TU
DE
NT
CR
ED
IT H
RS
. TA
UG
HT
BY
FA
CU
LTY
FA
LL 1
991
53%
58%
29%
EN
GLI
SH
13,8
388.
028
4,18
7
PS
YC
8,91
22.
100
4,44
4
97% 13
(Y°
%L- N
UB
S
6,13
816
50
68%
SA
LEM
RC
5.76
42.
727
0
52°k
48%
72%
PH
YS
ICS
AR
T
4,83
29.
334
5,24
71,
891
54 - -
1,88
1
//FU
LL-T
IME
{P
AR
T -
TIM
EI
(GR
AD
. AS
ST
.
SO
UR
CE
: IN
ST
RU
CT
ION
AL
SE
RV
ICE
RE
PO
RT
213
1121
4
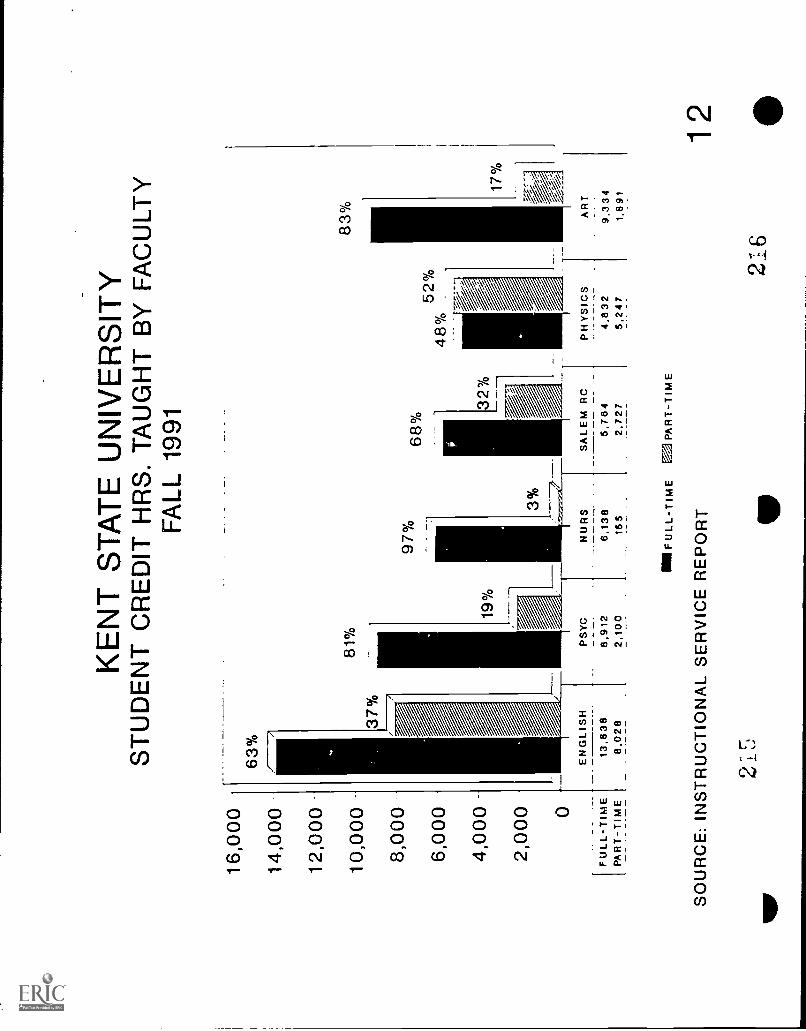
16,0
00
14,0
00
12,0
00 -
10,0
00
8,00
0
6,00
0
4,00
0 -
2,00
0
KE
NT
ST
AT
E U
NIV
ER
SIT
YS
TU
DE
NT
CR
ED
IT H
RS
. TA
UG
HT
BY
FA
CU
LTY
FA
LL 1
991
63%
37%
81%
97%
68%
0
1F
U_LL
-1'1
1.E
PA
RT
-TIM
E
19%
32%
.7%
3%
EN
GLI
SH
13,8
388,
028
PS
YC
N U
RS
8,91
28,
138
2,10
016
5
SA
L E
M R
C
5,76
42,
727
1.11
FU
LL -
TIM
E.F
A P
AR
T-T
IME
SO
UR
CE
: IN
ST
RU
CT
ION
AL
SE
RV
ICE
RE
PO
RT
22_5
11/
PH
YS
ICS
4,83
25,
247
83%
216
AR
T_
.
9,33
41,
891
12
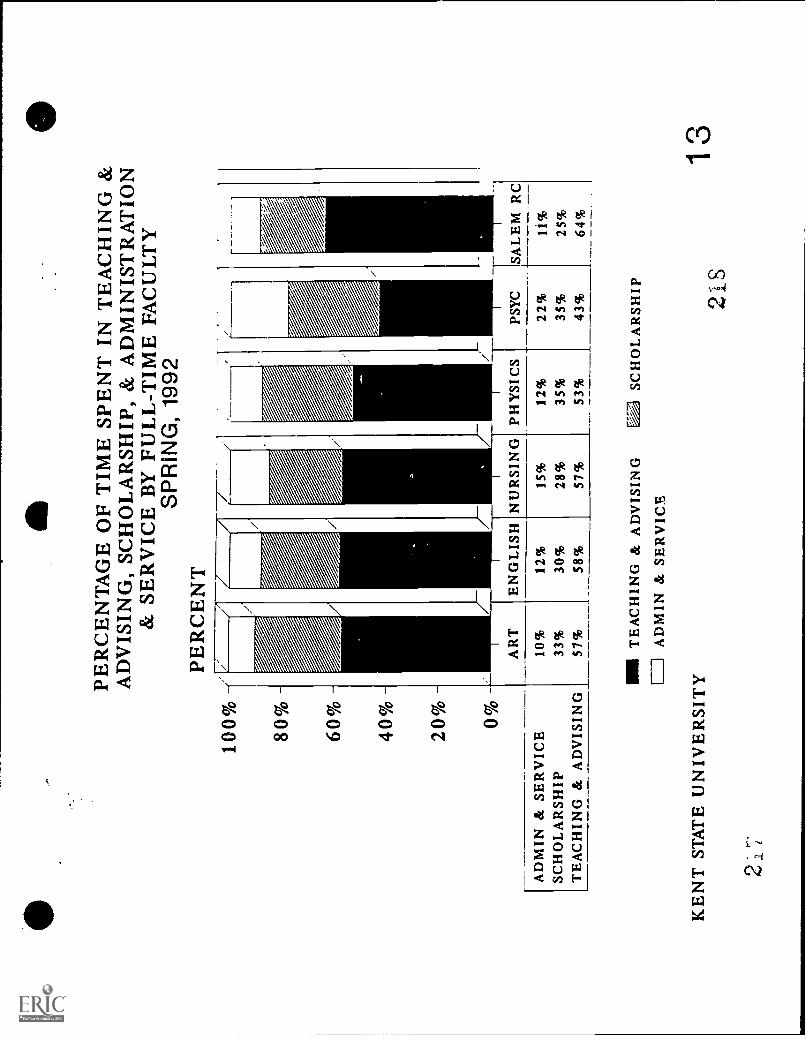
{AD
MIN
& S
ER
VIC
ESC
HO
LA
RSH
IPT
EA
CH
ING
& A
DV
ISIN
G
100% 80
%-
60 %
-
40%
-
20 %
-
0%
aPE
RC
EN
TA
GE
OF
TIM
E S
PEN
T I
N T
EA
CH
ING
&A
DV
ISIN
G, S
CH
OL
AR
SHIP
, & A
DM
INIS
TR
AT
ION
& S
ER
VIC
E B
Y F
UL
L-T
IME
FA
CU
LT
YS
PR
ING
, 199
2PE
RC
EN
T
EN
GL
ISH
NU
RSI
NG
PH
YSI
CS
PSY
C
10%
33%
57%
12%
30%
58%
15%
28%
57%
12%
35%
53%
22%
35%
43%
MN
TE
AC
HIN
G &
AD
VIS
ING
Vgi
SC
HO
LA
RSH
IPL
__J
AD
MIN
& S
ER
VIC
E
KE
NT
ST
AT
E U
NIV
ER
SIT
Y21
8
11%
25%
64%
13
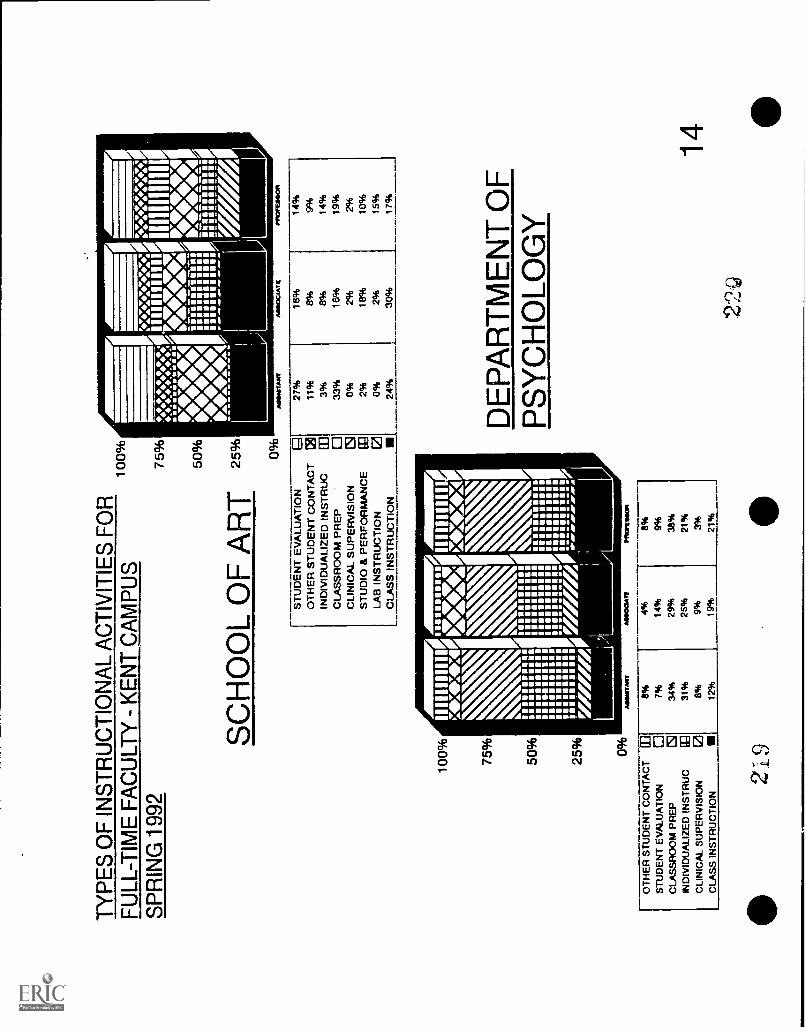
a
''
A
aA
aN
I
I
0' '
i11
110
a
-'"
"
I.O
MIX
IMIM
MIF
,11
1111
1111
1.;
csri
OII
*I1
.11\
N1N
\&
& "&
som
mas
sos
1, 1
owle
ssea
va.
limm
oss
I aaa
aa im
mo.
1 11
1111
1811
OIO
umem
ess
- II ommesos Is
oloo
mes
1111
1111
1111
ON
NO
N
111O
NN
ION
IIIIIN
OO
NN
IIIIII
IIII
INIII
IIMIN
IOrA
rA
IININ
OIN
I111
111/
1111
1111
1111
1111
311O
fte'
VA
r,
Ii-
21
/1I'
I I'
. I'.
104
0
VIP
'VV
I I
1,
'i;L-
I--
I
..
1....
..1...
.M.4
4.0
9 . .
. . .
I=
='40:gig74`4:7417 - IMMW1~6414
hilifill111111111111
10
/:::
:::::1
111
shm
enow
......
....1
0m
emm
e. :a
lms
mm
mm
m ."
:.
-r
IM :: 11 U !! M2
I.
: . 1.
I.
1
I so
MD A
E ll
II
*
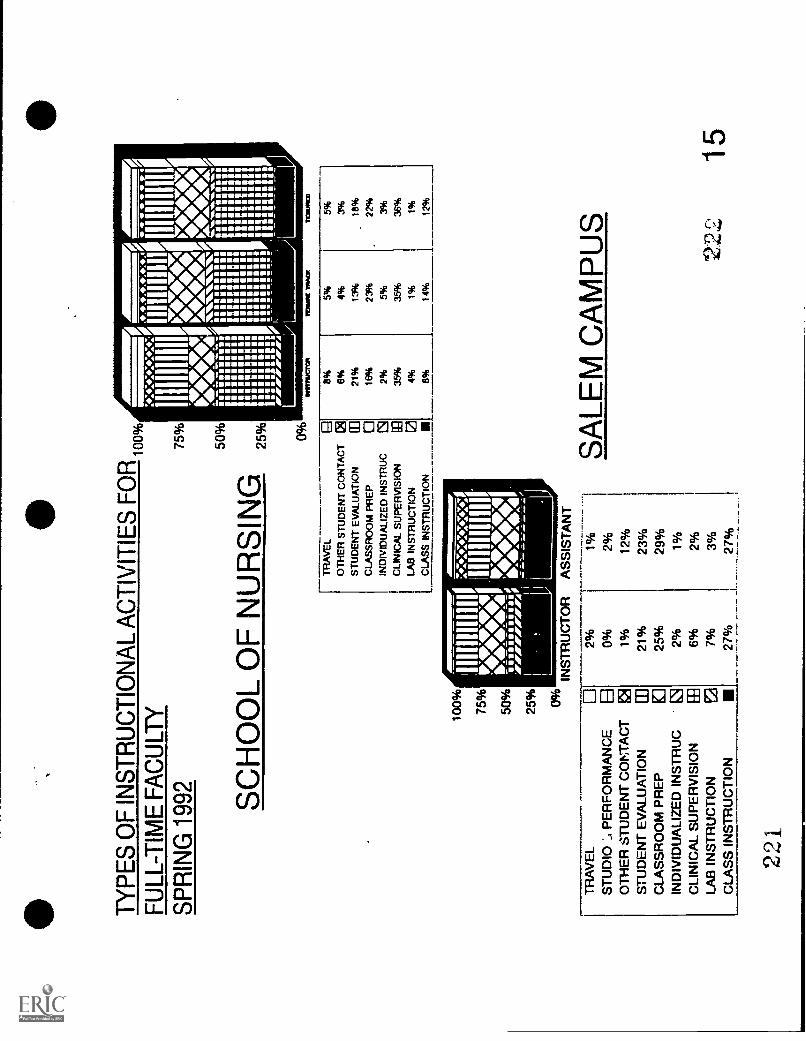
D
1
D
Mr .
D
a
r,
II
'
:16
NM
. Im
o41
411
A
AA
/41
41/4
1/A
onmmiaml imaaammlasa
1111:111:11
in m
ilw11 111111111.
011MVOICIII
OBRIIMIIMOSI MIMES
alammulaaaa
12111811"1, Atin 1 _II
1I, r.Uii A
to)
SAMPLE FACULTY PRODUCTIVITY WORK SHEET
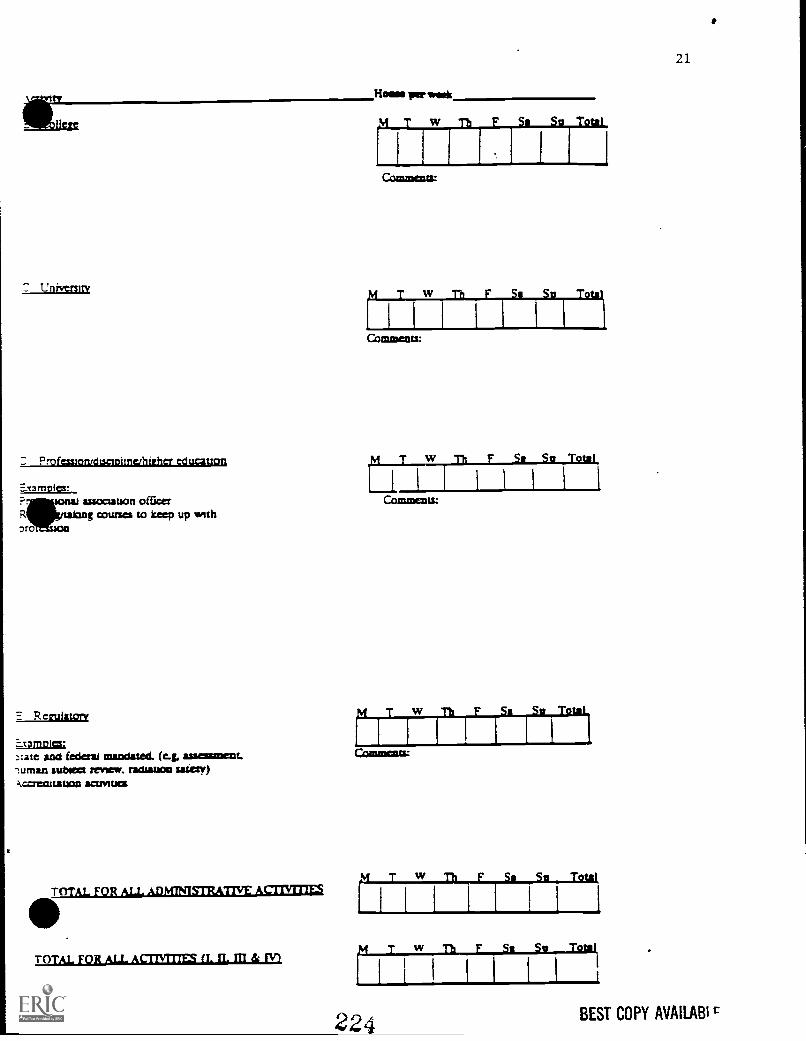
University
Professionrdiscionnefhilher education
. asstxsatson officerg courses to keep up with
E Rezulatort
Lianuagg;:ate and federal mandated. (e.g, asseunamat.
lumen subtext review. radian= suety)C.C.3LCULIWO13 WM=
gra par wok
T w
21
Th F
Comment=
riT w
Comments:
Sa Si Total
I
Th F Si Su To
M T w Th F Si So Total
w Th F Sa
C.ozomend.
rITTOTAL FOR ALL ADMINISTRATIVE A
TTOTAL FOR ALL ACTIVITIES IL III & fVt
224
w
Su
Sa Si Totak
w Th F
I
Sa Sa
I
BEST COPY AVAILABI r
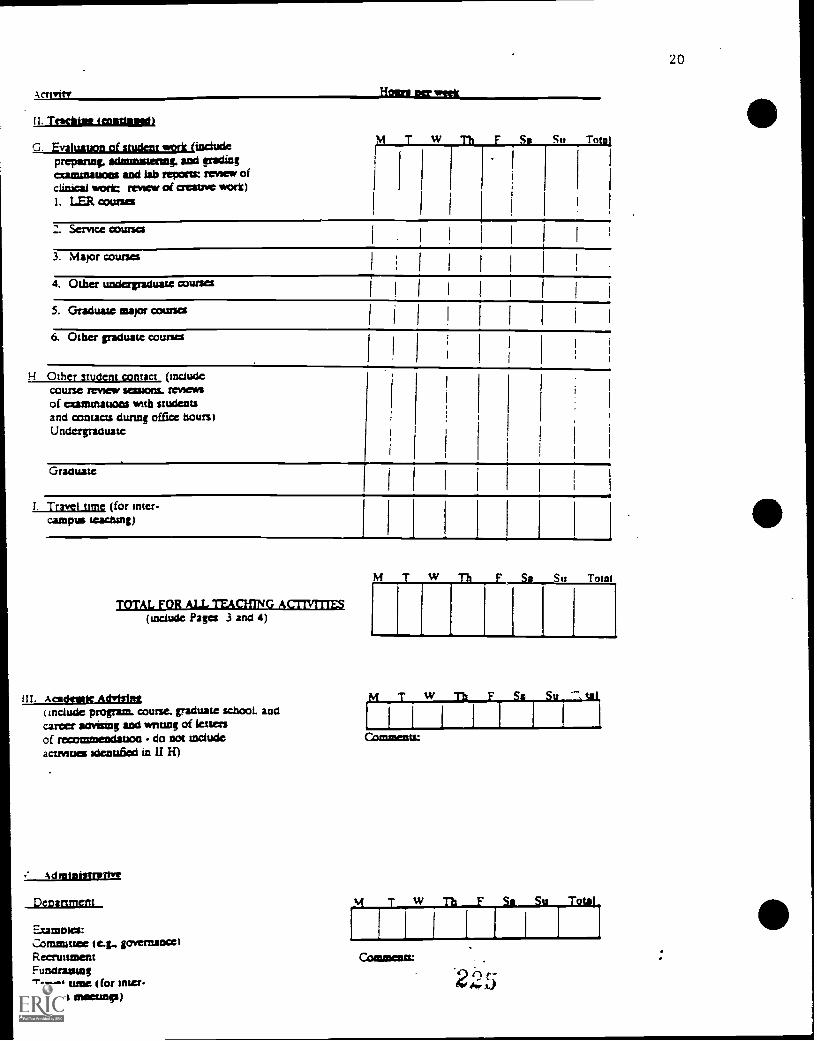
Act
thatigkiegagogaiggl
G. Evaluation of student work (includepreparing. admanstering, and gradingcuminauons and lab repo= review ofclinical wort review of creative work)1. LER COMO
Z. Service courses
3. Major courses
4. Other unnagraduate courses
5. Graduate =apt cimrsei
M T
11
vv Th F Ss Sn Tots(
6. Other graduate courses
H. Other student contact (includecourse review SCSSIOCLL MOWN'of ccammauons with studentsand contacts during office hours)Undergraduate
Graduate
I. Travel time (for inter-campus teaclung)
TOTAL FOR ALL TEACHING ACMMES(include Pages 3 and 4)
(iI. Academie AdvtsInt( include pmgram course, graduate school. andcareer aavaias and wrung of lettersof recommendation do not includeactrnues nienufaed in II H)
Administrative
Department
Examines:.1:dramatise I e.g., governance)RecruitmentFundraisingTravel time (for inter-campus snecusgs)
M Sn TOM)
M T w Th F Ss Su , ial
Comments:
M T w Th F Sa Su ,Total,
1 1
2(1c-A.A)
20
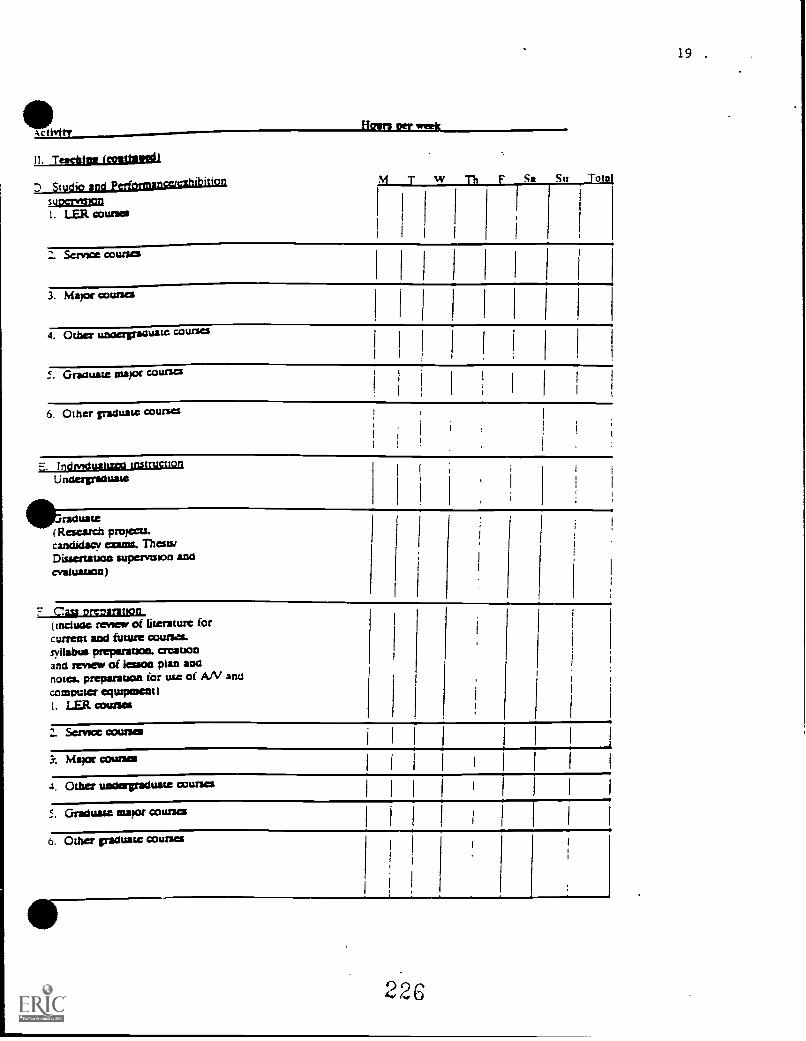
11. Twister (coatissed)
D Studio and PerformancenizhibitiouatismagnI. LER courses
Servsce courses
3. Major courses
4. Other unoergraduate courses
S. Graauase auto, courses
6. Other graduate courses
E. frldrndualizect mstructionUndergraduate
Graduate(Research projects.candidacy mains. Mesa/Dissertsuon supervision andevaluation)
Cass orcharaupn(induce review of literature foramens and future councs.syllabus preparation. creationand review of lama plan andnotes preparsuon for use of AN andcommun. equipment)I. LER causes
Sernoe courses
Mayor comsat
4. Other undergraduate courses
5. Graduate mayor courses
6. Other graduate courses
iiiH I
I 1IIIII
II ;
ill 1 1 1
I I I I f I I
I I I I I 1
22
19
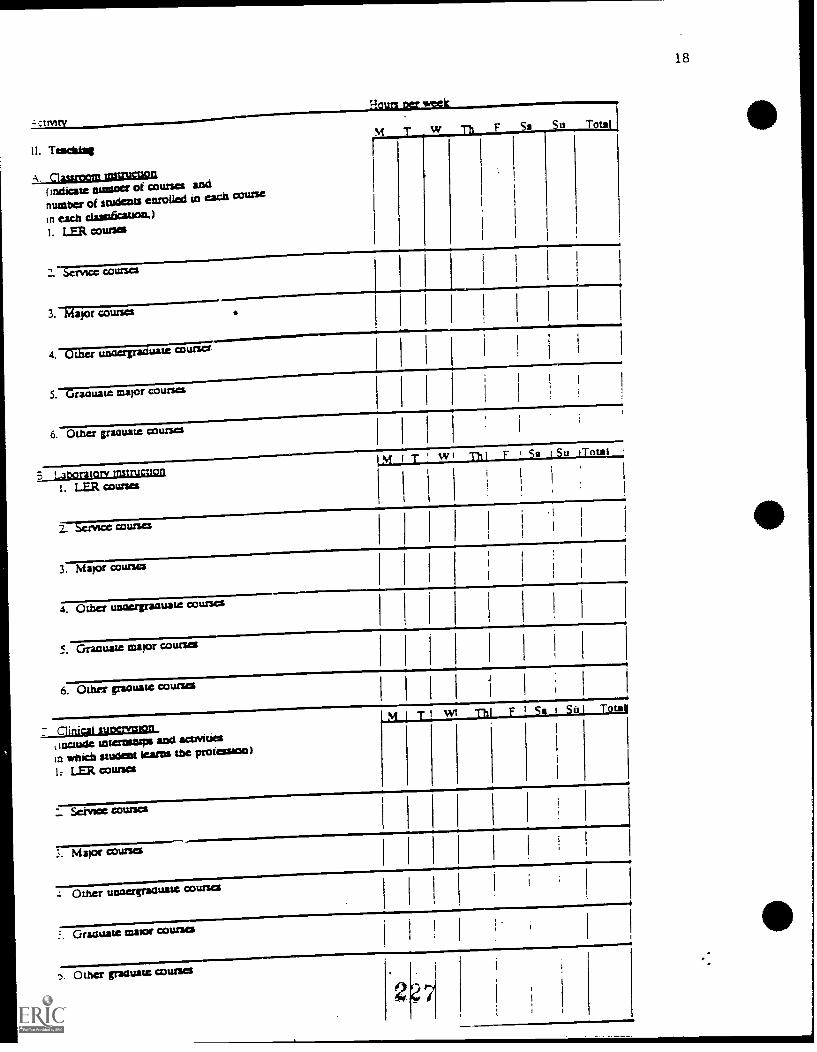
IL Madan
-3,Slagumgamogi(Indicate sumer of courses andnumber of students enrolled to each course
in CAC)! Clialifia1=1.)1. LER courses
2..-Service courses
Hours her week_
3. Major courses
4. Other unaexgraduate courser
5.-traouste outer COWS=
6. Other graduate courses
B Laboratory Instructlog1. LER comes
M T w Thl F Sa t Su iTotal
1 Service courses
3. Major courses
4. Other unaerpactuate COWS=
5. Crractuate major courses
6. Other granuate counts
supervedoninclude internstups and sonnies
in 'mach student learns the profession)LER courses
M I T Th Si SO 1 Tout!
Seivoce courses
3. Major courses
Other unnergrsauate courses
Graduals =tor courses
'3. Other gr./castecow=
18
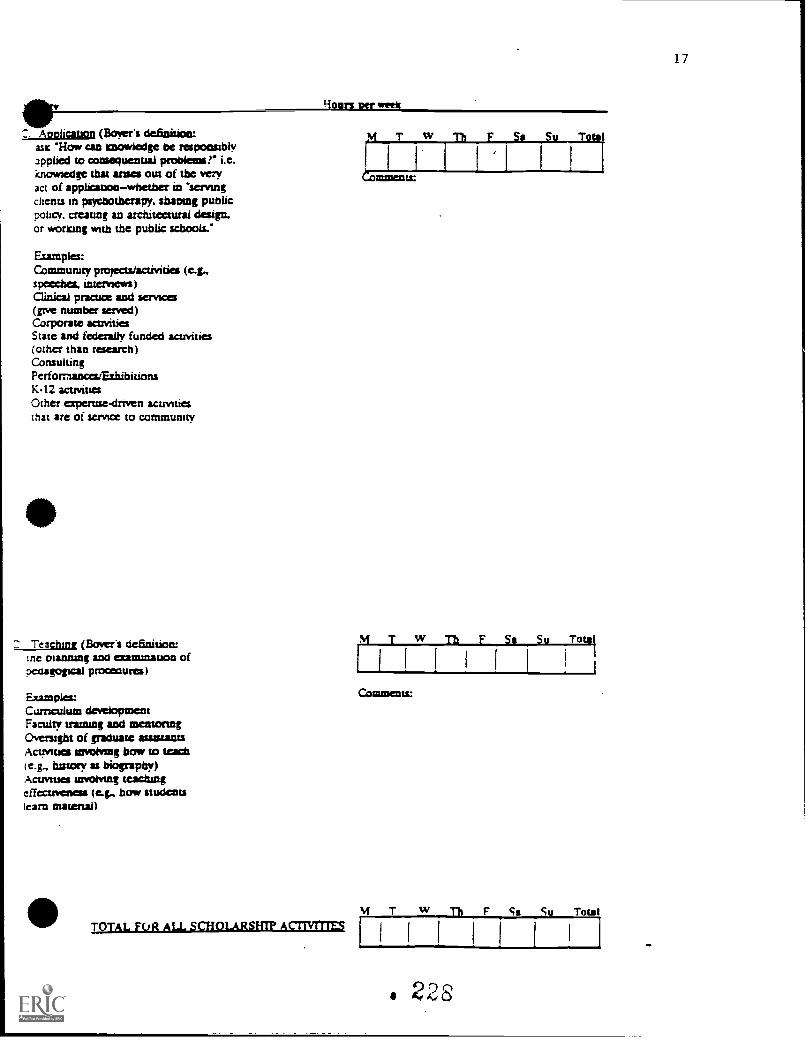
Anlisausla (Boxer's definition:as 'How can knowiedge be responsiblyapplied to consequenual problems? i.e.Knowledge that arum out of the veryact of applicationwhether in 'servingthetas in pSYCnOtileripy, sbaosng publicpolicy. creating an architaaural design.or wonting with the public schools:
Examples:Community projects/activities (e.g..speeches. interviews)Clinical practice and services(give number served)Corporate &cavitiesState and federally funded activities(other than research)ConsultingPerforriancestahibitionsK12 activitiesOther ape:use-dawn activitiesthat are of service to community
Teaching (Borer's definition:tne pianiung and Dam:nation ofpenagogical ma:cures)
Examples:Cumculum developmentFaculty warning and mentonngOversight of graduate *sustainsACtrAUGI arsolvmg bow to teach(e.g.. history as biography)Activities laWeilUlg teachingeffectiveness (e.g., bow students(earn material)
goors Der week
121,&41QEALLICLUNAREILEAM=
M T Th F Sc Si, Tots
I 11
=1:10113:
M T w TIr F
II I I
Comments:
M w Th F Si S Total
2 S
17
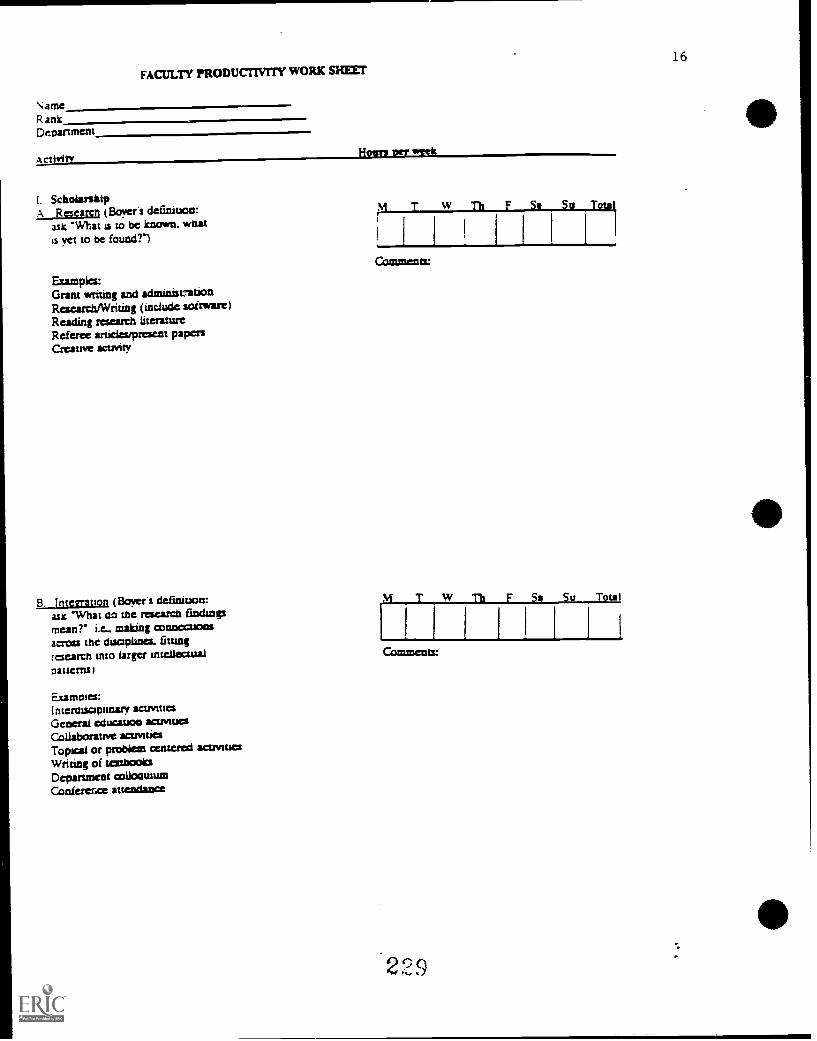
FACULTY FRODUCTIVTlY WORK SHE=
\:ameRantDepartment
ActivitYRah II Per week
1. Sam larskipA Researcn (Bovera definition:
ask 'What is to be known. whatis vet to be found?')
Examples:Grant writing and administrationResearch/Writing (include software)Reading research literatureReferee anickevpresent papersCreative acuvity
B. intonation (Boner's definition:asz 'What do the research findingsmean?' i.e_ making connectionsacross the dtsciplines. fittingresearch into arm unellectualomens: I
Examples:Interassaptinary scums=General education activitiesCollaborative snowlessTopical or problem centered aarnuesWriting of textbooksDepartment orglocunumConferer.ce attendance
tM T w
I
Comments:
M T
F Ss Su
W Th F Ss Su Total
Comments:
22
1 Hi
16
Appendix IOhio Medical School Action Plan
2304.*::::.
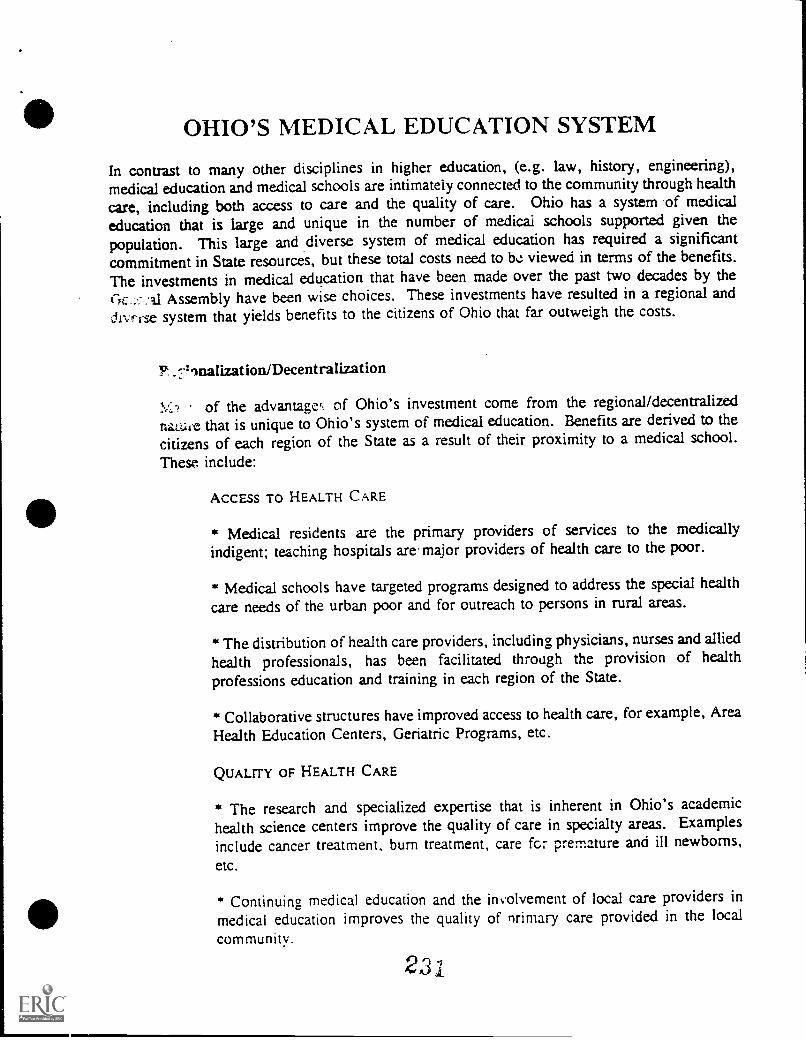
OHIO'S MEDICAL EDUCATION SYSTEM
In contrast to many other disciplines in higher education, (e.g. law, history, engineering),medical education and medical schools are intimately connected to the community through healthcare, including both access to care and the quality of care. Ohio has a system of medicaleducation that is large and unique in the number of medical schools supported given the
population. This large and diverse system of medical education has required a significantcommitment in State resources, but these total costs need to be viewed in terms of the benefits.
The investments in medical education that have been made over the past two decades by the
1-",c Assembly have been wise choices. These investments have resulted in a regional and;-ii-,,rrse system that yields benefits to the citizens of Ohio that far outweigh the costs.
--'Inalization/Decentralization
of the advantage!, of Ohio's investment come from the regional/decentralizednaLthe that is unique to Ohio's system of medical education. Benefits are derived to the
citizens of each region of the State as a result of their proximity to a medical school.
These include:
ACCESS TO HEALTH CARE
* Medical residents are the primary providers of services to the medicallyindigent; teaching hospitals are major providers of health care to the poor.
* Medical schools have targeted programs designed to address the special healthcare needs of the urban poor and for outreach to persons in rural areas.
* The distribution of health care providers, including physicians, nurses and allied
health professionals, has been facilitated through the provision of healthprofessions education and training in each region of the State.
* Collaborative structures have improved access to health care, for example, AreaHealth Education Centers, Geriatric Programs, etc.
QUALITY OF HEALTH CARE
* The research and specialized expertise that is inherent in Ohio's academichealth science centers improve the quality of care in specialty areas. Examplesinclude cancer treatment, burn treatment, care for premature and ill newborns,
etc.
* Continuing medical education and the involvement of local care providers inmedical education improves the quality of nrimary care provided in the localcommunity.
Ohio Medical Deans' Action Plan Page 2
QUALITY OF LIFE IN EACH REGION OF OHIO
* The medical schools and academic health science centers are major employers
in each region. These jobs range from technical and service positions toprofessional and academic positions. This is critically important for Ohio's future
economic development since health care is one of the nation's fastest growing
industries.
* The presence of an academic health science center is a major resource inattracting new businesses to an area.
* A significant source of new economic development may result from research
technology spin-off ventures, for example, biotechnology firms, etc.
* Medical schools and health professions education in each region provideexcellent access to Ohio students in pursuing health professions careers.
* Medical schools have contributed to a higher quality of life in each region of
Ohio through activities that improve the health of the local population such ashealth education programs in elementary and secondary schools, and healthpromotion programs for the community.
Diversity of Ohio's System of Medical Education
Ohio's unique system has allowed each of the medical schools to differentially meet the
unique needs of its own region.
* Each school has developed its own particular abilities and research strengths,some include strong graduate programs in the basic sciences.
* Ohio's diverse medical education system has given students the ability to choose
the type of education that meets their pers-,-nal aspirations, and that prepares a
range of physicians for the various needs of Ohiodas, including primary carephysicians, researchers, osteopathic physicians, etc.
ACTION PLAN
Ohio's regionalized system of medical education has been highly effective. But new devel-
opments in educational technology and in biomedical research, as well as the expanded
challenges presented by the costs of modern health care, make this an appropriate time for
the colleges to extend their existing collaborative effort to a new, more active and more
comprehensive stage.
The deans will work together to develop a joint Action Agenda that addresses the needs of
the State by focussing on the improvement of health care through:
increased cost effectivenessincreased qualityimproved access
The formal Action Agenda will be developed in the next few months, and will continuously
evolve over time, but the deans have already agreed on the following specific activities:
* Ohio's colleges of medicine are committed to increasing the number and improving
the distribution of primary care physicians in the State. Based on evidence nowavailable, the deans agree that actions in this area will improve the quality and costeffectiveness of health care delivery. The Primary Care Task Force that the medical
deans recently established will complete the initial phase of its work by June 4 so that
the medical colleges can begin to implement appropriate changes as quickly as
possible.
* The medical deans will create a medical education consortium to coordinate and
share new methods and technologies in medical education among all of the campuses
and to make more effective use of educational resources. Examples include: joint
development of computer-based instructional programs; sharing of faculty throughtelecommunications; improved evaluation of clinical skills of medical students and
resident physicians.
* Recognizing the diverse strengths of the medical schools in biomedical and health
services research, a consortium will be established to facilitate joint opportunities.
The consortium will explore possibilities such as: shared Liman and material re-
sources; cooperative grant proposals, and others.
* The medical colleges will develop a collaborative program, drawing both on their
own resources and those of other elements of higher education, to research and
develop approaches to the practice of medicine and the delivery of health care that
will lead to improvement in the cost-effective delivery of health care for all citizens.
Ohio Medical Deans' Action Plan Page 4
* The medical deans are deeply concerned about the small number of people from
under-represented and disadvantaged groups who become health professionals. The
core problem in this area is the insufficient number of qualified students coming
through the educational pipeline. The medical colleges will, therefore, expand their
work with communities to increase public awareness of the importance of science and
mathematics education and with schools to increase student interest and help teachers.
A principal focus of these efforts will be active and sustained cooperation with Ohio's
Project Discovery v.hich is building regional consortia to improve science and
mathematics education. The deans agree that, over time, substantially increased
resources will be needed if these activities are to be fully successful.
* Health care issues such as cost ;- id access are too important for medical schools to
ignore. The medical deans will appoint a task force to develop innovative models of
health care delivery with an initial focus and impact on programs and populations
funded through state government, such as: state employees and retirees, workers'
compensation, and public assistance beneficiaries. The medical colleges will also
actively work with other health professions schools to continue to develop team ap-
proaches to health care delivery that will provide new and appropriate responses to
serious problems-- for example, in more effective home care for the elderly.
* The medical colleges will take the lead in working with other agencies and organi-
zations to create a mechanism that will accurately describe the balance between supply
and need for physician services in Ohio. It is especially important that this mecha-
nism consider fully the continually changing context within which medicine is prac-
ticed. For example, the number of licensed physicians is not a true measure of the
physicians available to provide health care since it does not account for many retired
physicians who have kept their licenses. Consideration needs to be given to other
factors such as the number and distribution of specialists, and the number of people
practicing part-time, etc. Previous studies of physician services in Ohio, which are in
any case outdated, failed to consider adequately the entire range of relationships that
determine the need for and access to medical care.
* The me&-al deans will, at their regular meetings, continue to maintain an agenda
for addressing those issues in health care that, while not strictly in the purview of the
medical schools, are ones in which change is needed to achieve the three goals of
their collaboration: increased cost effectiveness; increased quality; and improved
access. In this fashion the State's academic medical centers will be more fully
effective as a resource in the public policy debates on health care delivery and financ-
ing.
Appendix JExecutive Summaries from the Managingfor the Future Task Force
Reports of the Public Colleges 6' Universities
University ofAkronAkron, Ohio
Dr. Charles E TaylorPartnerLamalie.Associates, Inc.
Mr. Benjamin G. AmmonsVice President/Total Quality ControlBridgestone/Firestone, Inc.
Mr. David d L. BrennanChairman lithe BoardThe Breslin Group
Mrs. Marie CovingtonPresidentCovington Commut.ications
Mr. Anthony N. GorantExecutive Vke PresidentOhio Edison Company
Mr. Jack L HeckelPresident è COOGenCorp
Mr. Joseph S. KanferCEOGo-Jo Industries, Inc.
Mr. John S. Steinhauer.Attorney
Mr. Peter TavolierPresidentDarcy Tape and Labels
MANAGING FOR THE FUTURE TASK FORCEThe University of Akron Response
PROCESS
At The University of Akron, we applaud the Ohio Board of Regents for seekingexternal consultation and review of management efficiencies in the state's highereducation system. The University of Akron supports such examination and to this end,former President William V. Muse appointed an external management reviewcommittee in February 1991.
The Management Improvement Task Force, which consisted of 10 business andcommunity leaders, studied University operations and presented a series ofrecommendations to the University Board of Trustees in June 1991. Theserecommendations included both short-term strategies for cost reduction and longer-term issues for further study. The task force's input has been extremely helpful. Thenames and institutional affiliation of task force members appears in Attachment L
In addition to this external group, two internal committees collected informationand provided analysis of various university operations. For the academic sector,information gathering and analysis was prepared by a subcommittee of the StrategicPlanning and Review Committee (SPARC). SPARC is the University's primarystrategic pizz.ning and budgeting committee and is composed of faculty, deans, anddepartment beads. For the administrative sector, reports were prepared by a membersof the President's Cabinet
Given the austere budget outlook for higher education throughout the balance ofthe 1990s, the University's work in this regard will continue in earnest long after thisreport is submitted. The state's current and projected budgetary constraints, as well asthe public's demand for greater accountability, require us to continue to seek ways tooperate at maximum effectiveness and efficiency.
INTRODUCTION
Without question, there is a positive correlation between cost and quality inhigher education. This relationship is becoming even stronger, as program thrusts,requirements, and instructional methods are increasingly affected by technologicaladvances. In addition to increasing demands in the educational process for state-of-artequipment, laboratories, computers, and library resources, university programs of highquality require personalized attention to students.
It could be said that ideally, the highest quality teaching should be done by thebest and highest paid faculty lecturing in expensive state-of-art classrooms to smallgroups of honors students who all receive university funded merit scholarships.
Conversely, it is often the case that low quality education occurs with low-paid, part-
time teachers lecturing in outdated, poorly maintained classrooms to a very large
number of underprepared students. These are, of course, extremes, but they do
illustrate that there is a strong positive correlation between quality and cost in higher
education.
National statistics clearly reflect a pattern of chronic underfunding of higher
education in Ohio. According to the most recent available data, Ohio ranks 40th of the
50 states in terms of per-capita appropriations for higher education. As a result of this
relatively low funding level, Ohio's public universiri tuitions are among the highest in
the nation. According to 1°90-91 figures, Ohio's average tuition ranked seventh highest
in the nation.
However, the state's relatively high tuition rate:. do not offset underfunding by
the state. When both tuition and state appropriations are taken together, Ohio still
ranks 24th in terms of per student spending. Thus, Ohio institutions on average spend
less per student than nearly half of the nation. OBR Chancellor Elaine Hairston
recently noted that statewide, higher education enrollment has increased by 55,000
students in the last five years. During the same period, state support for higher
education has declined.
This suggests that Ohio's public universities are achieving admirable results on
"shoestring" budgets. Ohio's policymakers need to take a hard look at these data and
their implications for quality and access.
It is not our intention or charge to document Ohio's lagging support for higher
education. In this report, we strive to communicate that:
1) The University of Akron is a well managed, productive, and fiscally conservative
institution.
2) The University's faculty, staff, and administration are striving for ever more cost-
conscious decision making.
3) There is a significant gap between .pectations expressed for higher
education in Ohio and the level of public funding required for this essential
enterprise. If Ohio is serious about improving quality and increasing access to
higher education, it must provide the resources to do so.
PRIORITIES OF THE IThrIVERSITY OF AKRON
As an open-admissions, comprehensive, doctoral- granting institution, The
University of Akron offers a full range of programs from developmental work through
the Ph.D.
Since 1985, The University of Akron has been working toward several strategicpnorities relating to improving the quality of education, research, service, andtown/gown relations, and increasing the institution's visibility locally, regionally,nationally and internationally. These efforts contribute in large measure to the vitalityof northeast Ohiospawning economic activity generally and, particularly, in thepolymer areas; strengthening selected academic programs via selective excellenceinitiatives; encouraging educational achievement by creating pre-college programs forat-risk youth as well as the academically talented; instituting higher standards forentering students; and increasing the diversity of The University of Akron's studentbody and workforce.
These objectives, however worthy, have substantial costs. Much of the cost hasbeen covered by non-public external funding, most notably, through substantial growthin external research funding and private gifts. External research support has grownfrom about S3 million in the early 1980s to S14 million in 1990-91. In January 1992,the University reached its $52-million capital campaign goal, the largest in its history,several months ahead of schedule. This strong support despite economically distressedtimes reflects public awareness and support of The University of Akron.
Unfortunately, private support cannot make up the growing gap betweeninstitutional costs and funding provided through state appropriations and student fees.In addition to reduced state funding, the University's income in comparison to otherstate institutions has been limited due to its historical pattern of lower-than-averagetuition rates. This issue will be addressed later under recommended state-levelchanges.
The University's strategic planning committee currently is engaged in the processof reexamining the institution's mission, priorities, and resource allocations. In thisenvironment of constrained resources, the University must set priorities and make hardchoices which may adversely affect the quality of programs, particularly those which arenot of the highest priority or lack access to external sources of funding.
It must be recognized that the state's emphasis on increasing access to highereducation and encouraging a larger proportion of high school graduates, regardless oftheir academic preparation, to go to college without providing the concomitantresources is problematic.
Growing numbers of entering students at The University of Akron areunderprepared for college-level work and, thus, require remedial work, personalizedattention, enhanced advising, tutoring, and other support services. Although suchintervention is costly, it is essential to truly give thee students a realistic opportunity tosucceed. Unfortunately, the state's current funding formula provides the lowest level ofsubvention for students needing' the most help.
Many Ohio universities, perhaps encouraged in part by the funding formula,
have moved toward increasingly selective adrniccion standards in order to target their
resources toward adequately prepared students, who are more likely to succeed. The
University of Akron has maintained open admissions and experienced enrollment
growth, particularly in the number of underprepared students, during much of the
1980s. UA has been forced to meet these burgeoning demands, given its budget
constraints, by utili'ing an increasing number of part-time faculty for undergraduate
instruction.
Belmont Technical CollegeSt. Clairsville, Ohio
Mr. Jim Bronchik
Ms. Ann Carson
Mr. Terry Lee, CPA
Mr. Tim McKelvey
Ms. Deanna Meyer
Mr. Paul Weil
Mrs. Barbara Rush
2 4 1
Executive Summary
Based on its review, the overall conclusion of the Task Force is that BelmontTechnical College is efficiently managed and uniquely serves its three-county
service district. In fact, its S5.7 million (approximate) budget is nearly $1.2
million below the state average used in the OBR cost/subsidy models. Of thetotal budget; 51.5 percent is devoted to instruction, academic support, and
student services staff compensation; 15.7 percent to institutional support, plant
operation and maintenance staff compensation; and 4.9 percent to public
service compensation. The remaining 27.9 percent of the budget is devoted to
operating expenses In excess of 2,200 students are served annually.
The College emphasizes teaching, accessibility, affordability, andemployability for its students. For most, it provides the only opportunity to
train for the evolving job market in Eastern Ohio. Some 300 students graduateannually with 90 percent employment. Therefore, the College generates theequivalent of a major employer in newly employed workers annually.
This is not to suggest Belmont Technical College cannot continue to improve.
It can. However, this review has demonstrated the College is aware of itsweaknesses and is attempting to correct them within an already limitedresource base. (See attached excerpt from "Original Draft - ComprehensiveDevelopment Plan'.) Thus, the Task Force recommendations to the institution
noted herein begin with the strong recommendation to implement the plan.
Recommendation
To the College:
1.) Continue the development process outlined in the
ComprehensiveDevelopment Plan - especially in the area of
computerization of administrative functions.
2.) Consider leasing and/or timesharing computers as an alternative.
3.) Expand marketing of College services to potential students.
4.) Expand offerings in the areas of continuing education and
customized business and industrial training.
5.) Reduce reliance on part-time faculty.
6.) Increase the use of data-based decision-making.
7.) Increase the amount of retraining available for displaced
workers.
8.) Pursue a change of institutional name to include the word
*Community- to more clearly reflect programs and differentiate
from Ohio University.
9.) Continue and expand cooperative ventures with Ohio University
especially in the area of "two plus two" bachelor's degree
programs.
10.) Develop new programs reflective of emerging job market needs
especially in Health, Human Services, and Corrections.
To the State;
1.) Appoint members of the Board of Regents who nave first-hand
knowledge of two-year colleges.
2.) Create a system of Community Colleges uniquely differentiated
from the state's system of Univerl;ties.
3.) Change the funding of all colleges and universities to reflect a
"state share" consistent across all institutions.
4.) Restructure funding of all education (not just postsecondary) toensure equitable funding throughout the state.
5.) Expand the availability of bachelor's and master's degrees inEastern Ohio to serve placeboursd individuals.
6.) Develop some form of statewide health insurance for collegesand universities to help control costs.
The committee recognizes that some of these recommendations will requiremore not less funding. It also notes that some will result in cost savings andothers can be accomplished at no material cost. It is unified in its view thatimproved education incorporating these recommendations is necessary for theeconomic recovery of the region.
3
Bowling Green State UniversityBowling Green, Ohio
Dr. Eloise ClarkVice President for Academic Affairs
Dr. J. Christopher Dalton
4111Vice President for Planning 6. Budgeting
Dr. Karen GouldProfessor of Romance Languages
Mr. Stephen Mc Ewen, PresidentHenry Filters (Pending)
Mr. Richard New lovePresident, Board of Trustees
Ms. Patricia SpenglerVice President for Human ResourcesMid-American National Bank
Dr. Winifred Stone, Associate DeanGraduate College
Dr. Fred Williams, DeanCollege of Business Administration
245
Report of the Bowling Green State UniversityManaging for the Future Task Force
The eight-member Task Force was chosen to reflect breadth of experience and
point of view of the University community as well as the perspective of business.
Its membership consisted of two persons from the local business community Ms.
Patricia Spengler, Vice President/Associate General Counsel, Mid Am, Inc., who
chaired the Committee, and Mr. Stephen McEwen, President, Henry Filters.
Chairman of the BGSU Board of Trustees, Mr. Richard New love, President of
New love Realty, Inc., who is also a local businessman, provided the insights and
perspective of the Board of Trustees. The remaining members were from the
University -- Eioise Clark, Vice President for Academic Affairs; Christopher Dalton,
Vice President for Planning and Budgeting; Fred Williams, Dean of the College of
Business Administration; Winifred Stone, Associate Dean of the Graduate College
and Director of Graduate Admissions; and Karen Gould, Director of Women's
Studies and hofessor of Romance Languages.
The Committee met approximately biweekly beginning in September. The
schedule of agenda topics addressed in the meetings is provided in Appendix A. In
many cases preparation for these discussions was accompanied by appropriate data
and reports concerning the University along with general readings on the topic.
(A sample is given in Appendix B.)
Findings and Recommendations
Although the Committee was dedicated to the task of considering how to
manage limited resources effectively for the future, all members of the Committee
were very concerned about state budget reductions for higher education. The
Committee strongly believes that institutions of higher education in general, and
BGSU in particular, have borne more than their share of budget cuts. Employees
have been faced with increased workloads to offset hiring freezes, higher charges for
health care coverage, uncertainty as to job security, and no increases in salaries.
Tuition has increased while the introduction of new programs has been greatly
curtailed and services have decreased. All these drastic actions have been taken as a
result of state budget cuts.
While the Committee agrees that effectively managing resources for the
future is always a worthy goal, our primary concern is that higher education has
been forced to do more than its fair share already. Even though higher education
receives less than 13% of the state budget, it has absorbed 39% of the total cut in
February of 1991 and 29% of the total cut in December 1991. BGSU has responded to
these cuts by aggressively controlling spending and managing resources. Although
the University is committed to following this course for the future, the Committee
believes that funding cuts to this institution must cease or irreparable harm will
occur
In accordance with its mandate, the Committee began meeting on Septembe10, 1992. We discussed the Managing for the Future Institutional Committee
Charge and the issues to be addressed. We discussed those materials that would be
helpful in providing background for the Committee. We also met with Dr. Philip
Mason, Vice President for University Relations, regarding his thoughts about the
process. We then developed a plan to address the issues before the Committee. The
minutes and supporting materials from our meetings are attached as Appendices.
The Committee reached several conclusions as a result of our meetings.
First, in discussing thc many areas and issues fac:ng the University, we became
convinced that BGSU has done quite well in managing resources and controlling
expenses. In each area discussed, we found that BG was well on its way to managing
effectively for the future. Second, we discussed in:entive systems, especially at the
level of merit/incentive compensation, and believe that significant improvements
could be made to the current incentive system for faculty. Finally, we determined
that BG's success in achieving cost efficiency should be more aggressively promoted
to the public.
Throughout our discussions, the Committee focused on the importance of
appropriate incentive systems systems which stimulate, recognize, and reward
individual and collective achievements that contribute to important University
objectives. Maintaining appropriate incentive systems seems to hold great promi
for addressing a number of our concerns about managing for the future. Time of
time we returned to issues of incentives, both at the individual and collective
levels. Specifically, we discussed the need for appropriate incentive compensation
at the individual level and for appropriate incentives at the department and
collegiate levels. This issue came up in several contexts, including appropriate
incentives for faculty to increase instructional productivity.
In practice, the most critical decisions relating to the quality, efficiency, and
effectiveness of an academic unit are made by its faculty either individually, or
collectively at the department or collegiate level. Individual faculty members,
guided by the department and college policies they have developed, allocate their
time and effort among the three general areas of responsibility; instruction,
scholarship, and service. The congruence of their efforts with university objectives
wall be heavily influenced by the incentive system imbedded in those department
and collegiate policies.
The current reductions in state support bring issues of productivity and
efficiency into sharp focus. Calls for more productivity are typically couched in
terms of instructional productivity, the single dimension of faculty output that is
arguably the most visible and easily understood. However, care must be taken to
avoid drawing premature, and erroneous judgments about overall faculty
productivity and efficiency on the basis of a single measure, without due
consideration of other critically important dimensions of output, such as the
2 0 4*of 44:
breadth of faculty activities and responsibilities and the quality of academic
programs. Since decisions about faculty activity must appropriately remain at the
lowest organizational level, closest to the actual activity, there is a clear need to
develop comprehensive incentive systems compatible with University goals and
objectives, and with appropriate consideration for efficiency and productivity. Short
term economic conditions pose some complications foi immediate changes in the
faculty compensation system, but those difficulties should not inhibit immediate
consideration of structural changes which could be implemented as soon as
conditions permit.
Public relations efforts of the University were also considered by the
Committee. Specifically, we discussed public relations in connection with faculty
involvement in decision-making (i.e., the budget process), cooperative efforts
among higher education institutions, and the quality of service provided even in
the face of increasing budget cuts. We need to make the public more aware of the
quality of service provided in the face of severe and worsening budget cuts.
The Committee believes that BGSU has made great strides in managing its
limited resources effectively. Our greatest concern is that continued decreases in
funding will defeat efforts to continue to provide quality service so vital to our
region and the entire state. We trust the State legislature and administration have
given as much thought to this topic from their perspective, and that they too are
considering ways to assist all institutions of higher education.
The mission of the University and the directions it has taken in the past
decade are presented in Appendix C. Recognizing and endorsing that mission, the
Committee presents the following recommendations:
Recommendation I: Currently, adequate flexibility exists to reorganize
administrative units, academic support services, and auxiliary units to achieve
efficiencies, more effective service, and fiscal economies. While academic decisions
remain the primary province of the faculty, certain organizational changes of
programs that may be considered administrative, i.e., to promote sharing and the
most effective allocation of personnel and financial resources, currently are not
easily accomplished. Progress needs to be made within the academic program areas
to gain organization flexibility. It should be understood that the purposes of such
restructuring would be to reduce administrative overhead and achieve appropriate
use of personnel. Such restructuring generally would not result in loss of faculty
positions. It would, however, allow for the more effective allocation of personnel.
The Task Force recommends that the language of the Charter be
amended with approval of the Trustees to provide the necessary
flexibility to facilitate appropriate restructuring of academic units.
Recommendation 2: The University has undertaken a self-study in preparation for
the reaccreditahon review by the North Central 'scociation. As the final reports are

prepared and reviewed by the University community, attention should be given t
ways in which the University can improve its effectiveness and make the best use
available resources. The review and use of these reports should, in part, attempt to
identify specific ways in which expenditures could be reduced without harming
educational quality. At the College level and throughout the University efforts
should be made to streamline services and academic offerings. A more critical
process to review proposed changes and to evaluate those that occur more gradually
should be established. Answers to the questions "why the change" and "what are its
consequences" must be sought in an environment that does not inhibit theintellectual agenda or the advancement of the University's academic programs.
Given that the University is unlikely to increase faculty and staff for the foreseeable
future, some important activities may be given up in the interest of enhancing the
quality of the even more important ones that must persist.
The Task Force recommends that the NCA self-study be used as aframework for developing plans and processes to improve quality
and to achieve growth or change in the future by substitution rather
than accretion.
Recommendation 3: The existing salary policy for faculty and administrative staff
allows for the distribution of 60% of the annual increment across the board with the
remaining 40% distributed on the basis of merit.
The Committee believes this policy does not provide adequate incentives at the II)individual or department levels. At the individual level, departments varysignificantly in the criteria for merit review and in how the criteria are applied to
individual performance. Department criteria are occasionally inflexible,
discouraging the development and recognition of appropriate differences of
individual talent and interest in terms of scholarship and instructionaleffectiveness. At the unit level, the practice of distributing annual salaryincrements to units as a percentage of the unit's salary base is incompatible, indeed
antithetical, with developing and recognizing outstanding unit performance. By
creating a zero-sum game in the unit, this practice tends to nullify an important
incentive (compensation) for the kind of cooperative activity that might contribute
to outstanding unit performance. This practice can also severely distort the
relationship between individual performance and reward, simply by virtue of an
individual's location within the organizational structure. Small units ofoutstanding performers are especially disadvantaged by this practice. The
committee recognized the highly volatile nature of suggested changes in salary
policy. At the same time, the current salary policy and the practice discussed above,
are ineffective and seriously divisive. They should t.,e modified to forms more
The salary policy for classified staff is not considered in this report. A proposal by
Classified Statf Council to revise that policy with elimination of step and longevity
increases effective July 1994 mas been accepted by the administration.
424,9
compatible with the overall objective of appropriately recognizing and rewardingindividual and unit performance.
The Task Force recommends a change in the salary policy that would:a. require greater uniformity in the criteriab. provide greater incentive for enhancing productivityc. allow individual faculty the option to tailor within limits
the basis for their evaluation to a negotiated assignment(Le., the salary policy should recognize differential facultyassignments with respect to instructional, research andservice activities, and should reward performance on this basis.)
d. develop criteria that more adequately reward exceptionalindividuals or exceptional departments. This might beachieved by enhancing the initial allocation to units, orcould be redressed through additional allocations toindividuals at the collegiate level.
Whatever the final system, there was a compelling belief on the part of the TaskForce that the purposes of the University would be best served if the reward systemcould be structured to provide greater incentives. Formal implementation of anychange, however, should be in the context of full consideration of the impact of theproblems caused by the current financial constraint and recognition of the necessityto improve salaries to a competitive level.
Narrative
As described in the earlier section of this report, the University has currentlybeen adjusting to severe reductions in its budget. The principles that are used toguide these reductions are described in some detail in Appendix D. In general theacademic mission of the University is the highest priority. This includesmaintaining the quality of the instructional programs while at the same timeproviding sustaining support for the critical scholarship of faculty and students.Providing an enhanced quality education for undergraduate students, and highcaliber programs for graduate students, have long been dual goals of the University.(See Appendix C for full description of priorities.) While we work toward academicimprovements. significant effort also has been directed toward achieving costeffectiveness of administrative functions. (Some examples are described briefly inAppendix E.)
The improvement in the availability of microcomputers and the newtelecommunications systems position the University to take optimal advantage ofthe new OhioLINK capabilities. We expect to be on-line with this system bySeptember. The eventual access to library holdings statewide as well as to importantdata resources will be a major advance in providing information for our studentsand faculty In view of the extraordinary escalation of serial purchases and print
costs, we expect to be able to provide this information more efficiently through
shared resources.
Measures of Quality/Assessment/Rewards
Until recently, BGSU was able to provide incentives (i.e., modest increases in
operating and personnel budgets) to those departments that reviewed their
programs, identified educational priorities, and provided clear plans for
improvements and for achieving or sustaining excellence. The opportunity to seek
augmented funding was open to all departments and selections were made on a
competitive basis. In mo=t ca.,es external consultants were used to provide objective
assessments of the quality of the department and the appropriateness of the chosen
academic directions. The opportunity to acquire extra funding was a powerful
ircentive for continuing improvement even the c'epartments that were not
chosen benefited from the review and evaluation of their programs. Program
review and evaluation will continue even though for the immediate future it will
not be possible to provide augmented resources for exceptional departments. The
challenge will be to maintain morale and motiv ion toward excellence in a climate
that cannot provide commensurate rewards.
As part of the NCA accreditation self-study, a special ad hoc committee is
developing a process to improve the assessment of student progress. Details of their
recommendations will be provided when available. In the absence of a university -
wide process for assessing student achievement, the Task Force focused on the re
system in-so-far as it related to faculty performance. (See Recommendation 3)
At BGSU, we strive for balance between excellent teaching and faculty pursuit
of research/scholarly/creative activities. Together they foster the healthy
productivity characteristic of a mature university. As described inRecommendation 3, however, we have not yet achieved a reward system that
provides appropriate recognition of individual performance while balancing
recognition of excellence in teaching and scholarship.
Faculty Productivity
Defining faculty productivity and providing adequate incentives for its
improvement were recurring themes of discussion for the Task Force. There was
general agreement that determinations of productivity must be multifaceted and
should take into consideration the diversity of talents, disciplines, and ethnic
representation.
A mid-size university such as BGSU offers the advantages of a large
institution while attempting to personalize the learning experience of
undergraduates much as would be found at a small liberal arts college. This special
mission places unique demands on the faculty to achieve balance among its
responsibilities for teaching excellence, undergraduate and graduate student
Or -=6
advising, productive scholarship, and university service defined in its broadest
terms.
As measured by the improved academic quality of the undergraduatestudents who enter the university, the rate of their retention, increased enrollment
in its graduate programs, increase in state and national recognition, and externalawards to its faculty, the institution is increasingly successful. In addition, the ten
year program of capital improvement and enhancement of classroom, library,
laboratory and computing facilities, provides yet other measures of commitment to
improving the academic environment for learning.
In summary, Bowling Green State University offers high quality education at
low cost to its students. This low cost policy, combined with efficient management,
has provided educational opportunities for many students who would nototherwise have been able to afford them. The Trustees have been effective in
establishing these directions for the institution and strongly support the concept of
shared governance in executing their authority. The changes recommended by the
Task Force will require clarifying the lines of Trustee authority in relation to the
Academic Charter in order to provide appropriate flexibility and salary incentives to
allow for continuing future improvements in the quality of educational offerings at
BGSU.
7
f-t_)4;
Central Ohio Technical CollegeNewark, Ohio
Mr. Joe J. Bernal ChairmanRetiredFormer V.P. dr Gen. M.Ro4 Bar sir Wire Div.Kaiser Aluminum Corp.
Mr. Randall C IngoldDirector Business d FinancialAffairs/TreasurerCOTC/OSUN
Mr. William S. MooreRetired Business ExecutiveFormer Mayor of Nuvark
Ms. Carol MorrisInstructor, Accounting Tech.COTC
Mr. RobertJ. PondIsutructor, Engineering Tech.COTC
Mr. Barry RileyPresident, Able TransitCOTC Board of Trustees Member
Dr. Paul TreeceAssistant to the PresidentCOTC
Ms. Shelly WeakkyMassager, Computer Operations eiTelecommunicationsCOTCIOSLIN
Mr. John IL WeaverRetiredFormer Ossmer/PruidentFyrepel QmPaNY
Dr. James WoolardManager Facilities/Support ServicesCOT
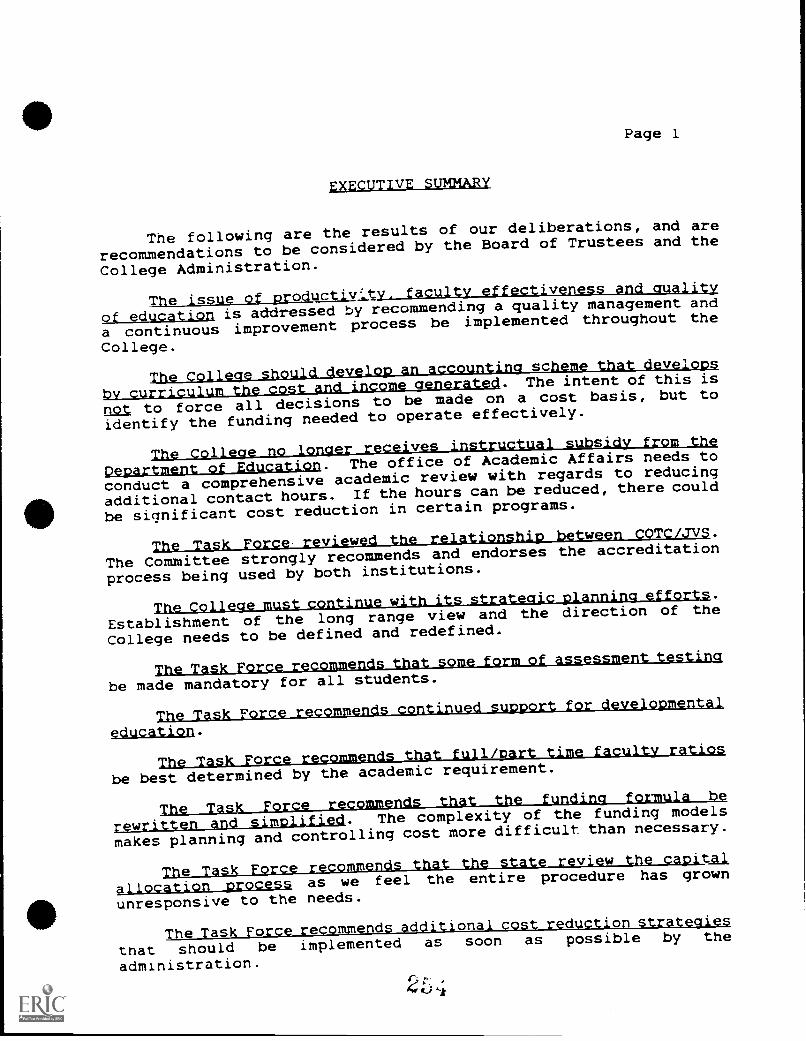
Page 1
EXECUTIVE SUMMARY
The following are the results of our deliberations, and are
recommendations to be considered by the Board of Trustees and the
College Administration.
The issue of productivity, faculty effectiveness and quality
of education is addressed by recommending a quality management and
a continuous improvement process be implemented throughout the
College.
The College should develop an accountina scheme that develops
by curriculum the cost and income generated. The intent of this is
not to force all decisions to be made on a cost basis, but to
identify the funding needed to operate effectively.
-0- I. 0110'.u I
Department of Education. The office of Academic Affairs needs to
conduct a comprehensive academic review with regards to reducing
additional contact hours. If the hours can be reduced, there could
be significant cost reduction in certain programs.
The Task Force. reviewed the relationshin between COTC/JvS.
The Committee strongly recommends and endorses the accreditation
process being used by both institutions.
wEstablishment of the long range view and the direction of the
College needs to be defined and redefined.
The Task Force recommends that some form of assessment testing
be made mandatory for all students.
The Task Force recommends continued support for developmental
education.
The Task Force recommends that fullinart time faclulty_ratios
be best determined by the academic requirement.
The Task Force recommends that the funding formula be
rewritten and simplified. The complexity of the funding models
makes planning and controlling cost more difficult than necessary.
The Task Force recommends that the state review the capital
allocation process as we feel the entire procedure has grown
unresponsive to the needs.
The Task Force recommends additional cost reduction strategies
tnat should be implemented as soon as possible by the
administration.

Page 2
OVERVIEW
The "Managing for the Future Task force" was formed and met
for the first time on January 28, 1992. Prior to the meeting eachparticipant was given three pieces of information to help inorientation to the task. These were 1) COTC Institutional Goalsand Objectives, 2) Management for the Future Task Force Goals and
3) Remarks from Governor Voinovich.
The statewide- goals became our goals factored with a local
view of issues.
1) To understand and communicate the relationship betweenquality and cost in higher education.
2) To plan strategies for managing higher education in aconstrained resource environment.
3) To demonstrate and report to the Governor and GeneralAssembly ways in which colleges and universities areor can be more effectively and efficiently managed, andstrategies identified for improved management.
From the onset of this committee, it became obvious that indepth cost analysis could not be accomplished due to resourceavailability and allocation. We also recognized that there wereongoing cost reduction efforts required by budget constraints and
these appeared to be effective. The task force will make
additional recommendations concerning this issue.
Our efforts, therefore, were directed toward strategies and
recommendations for improved effective use of the resources
available. The task force also raised some issues that the stateshould address or, if already addressing, a need to communicate in
a more effective manner, the status of these issues.
The task force met on 14 separate occasions at the college and
subgroups of the committee meet with individuals away from campus
who were considered as having significant input. These individuals
were:Dr. Robert Barnes, former Pres/DeanMr. Jack Lytle, former trustee and Divison Chair Business
Mr. William Mann, Superintendent of JVS
Some items not included in the body of this report, but itemswe felt to have significant impact on the College are as follows:
A clear communication on the state's position on all co-located campuses.

Page 3
The funding for remedial education needs to be recognized
which also leads to the mission for 2-year colleges and
responsibility to our high school graduates.
The state should review its control system and reporting
requirement, to search for duplication and repetition. We feel
that positive efforts at the various institutions could be negated
by reporting and justification requirement.
The state needs to rev.-
industry. The committee feels
college system to attract and
strong revitalization. A .short
the south brings the point home
I w 11- 1
that the state's use of its tech
hold business and industry need
tour through some state systems in
directly.
41 VI-(..1
Central State UniversityWilberforce, Ohio
Mrs. Blanche I. Mayo, Chair-personVice President for AdministrativeSupport Services
Dr. Thyrsa SvagerExecutive Vice President d Provost
Dr. Willie WashingtonVice President for Academic Affairs
Mr. Dwight JohnsenVice President for Finance 6- BusinessAfisirs et, Treasurer
Mr. Samuel S. JacksonVice President for Statist Affairs
Dr. Charles Showell DeanCollege of Barium Administration
Dr. Lax ley RodneyAcademic Proposal Writer
Mr. James SangsterExecutive Director of Development eiIntV Affairs
Dr. Barbara FlemingDirector of Strategic Planning eh.Institutional Research
Community Members;
Mr. James FrancisExecutive Assistant to the Dayton CityCommission
2
SECTION IV
SUMMARY
Effective management of Central State University in the future willbe guided by implementation of the six key priority areas listedpreviously in this document. Within these six priority areas, theUniversity's operations will focus on strengthening the followingactivities such that they will become exemplary aspects of ourtotal "Managing for the Future" effort.
A.) Enhancement of Undergraduate Studies through:
A strengthened core curriculum with btlilt-in assessment tomore thoroughly prepare our students for graduate !".nd
professional school;
Increased emphasis on undergraduate research as a strategy forpreparing our students for graduate and professional school;
Strengthening of academic programs in scientific and technicalfields where the potential for future professional growth anddevelopment are excellent. The enhanced scientific andtechnical programs will complement activity in ManufacturingEngineering and Water Resources Management. The Universityplans to aggressively pursue expansion and development ofacademic programs in the sciences through research grants,improvement to physical plant in these areas, and through anew $8 million building to house the Center for WaterResources Management.
Development of new undergraduate programs in Airway Scienceand Hospitality Management. The Hospitality Managementprogram has been funded for $103,000 by Title III under theU.S. Department of Education's Strengthening HistoricallyBlack Colleges and Universities Program. It is anticipatedthat the Airway Science program will be funded in part bygrants from the Federal Aviation Administration.
B.) Re-Establishment and Expansion of Graduate Education
Central State University has ade imprPsr've progress in re-45E;71
establishing its graduate program in education leading to the
Master's of Education degree. The University plans to exparill,
graduate education to include the areas of Manufacturing
Engineering and Water Resources Management. Central State plans to
work cooperativelywith The Ohio State University as it develops
its programs of graduate study. Joint committees between the
universities have been established for the purpose of developing
guidelines for the implementation of an array of academic programs.
C.) InternationalizationQf University Programs and Curriculum
Central State i.s placing greater emphases on the
internationalizationof the curriculum via an
interdisciplinaryapproach that coordinates joint programs and
projects in the Institute for International Affairs, the
InternationalCenter for Water Resources management, and the
Department of Manufacturing Engineering. A proposal has been
submitted to the U.S. Department of Education requesting funds
to assist the University in plans to augment the proficiency
of its students in the French and Wolof languages and to
assist them to become better acquainted with the cultures
the West African nations of Senegal and Mali. The increas
proficiency of our students in West African languages and
culture will enhance current university sponsored projects in
Northern Senegal and Ghana. Moreover, preliminary contacts
have been made with Teacher Training Institutions,
universities, and Ministry of Education officials in Namibia
and Jamaica as part of a long range plan to internationalize
the curriculum in the College of Education.
The University's Institute for International Affairs was
established in June, 1987, for the purpose of facilitating
research, development, trade, and economic development in sub-
Saharan African and Caribbean countries. The Developing
Nations Product Center, a component of the Institute for
InternationalAffairs was establisnci in April, 1989, to
promote Ohio-produced equipment and prcducts for both
prototype production and manufacturing training to meet the
needs of developing nations.
72
D.) Development of federal, state, and private sources of revenue
for the University through contracts, grants, and gifts.
The Central State University Foundation's goals include
identifying, cultivating, and soliciting donors for the
purpose of building endowment and general operating funds.
The CSU Foundation has set an ambitious target of raising $3
million over the next five years for student scholarships,
faculty development and enhancement of academic programs. The
University's track record in securing research grants and
contracts has been impressive as the list of funded
grants/contracts appended to this document illustrates.
E.) More efficient academic program operation thA7nugh eliminating
redundancies in individual courses and programs and more cost-
effective administrative operations through reduction and
elimination of operational areas that are no longer effective.
Recent cost-saving initiatives at the University have resulted
in a consolidation of academic programs and reduction of
courses through elimination of programs in Business Education,
Child Development Technology and Fashion Merchandizing. Based
on continuing academic program review, the following programs
are being considered for elimination: Earth Science, Theater,
Literature, Industrial Arts Education, and Anthropology.
Other cost-savings have resulted from the reduction and/or
elimination of specific operational areas and through more
effective collaboration among the remaining operational areas.
,3
RECOMMENDATIONS
The Statewide Managing for the Future Task Force asked each
Institution the following question:
"What state-level changes should be made to ease your
ability to sustain quality and manage costs more effec-
tively and efficiently?"
Central State University submits the following recommendations for
state-level as well as institutional change.
State Level Recommendations
1.) Reassess current subsidy formula for the purpose of revising
the formula to make it more equitable with respect tcc funding
for universities whose enrollment patterns do not fit the
components of the subsidy formula.
2.) Continue and enhance centralized planning process to identify
future economies of scale across the higher education
in Ohio, especially in the areas of purchasing, travel, an
telecommunications.
3.) Restructure process in state architect's office to shift
decision-making to the campus level in order to expedite award
of contracts and completion of capital construction projects.
4.) Review collective bargaining process for the purpose of
streamlining disciplinary and/or termination procedures of
employees for cause.
5.) Establish minimum faculty workload of twelve contact hours
across tLe public higher education system in Ohio.
6.) Develop mechanisms that promote accountability for college
readiness at the K-12 level across Ohio's public elementary,
middle, and secondary schools.
)Increase access to Ohio's four-year publicly-assisted
universities for African-Americans and other minorities b
developing financial and academic support programs at 4-yea
institutions that focus on developing these students withinthe 4-year academic environment. Restricting access to blacksand other minority students with low or marginal high schoolacademic achievement is inconsistent with a policy ofincreased access at the 4-year level. Currently, 45 percentof black headcount enrollment and 55 percent of Hispanicheadcount enrollment in higher education is concentrated atthe 2-year level where completion rates and transfer rates to4-year colleges are minimal, i.e., just 10 percent of blacksat the 2-year level transfer to 4-year institutions. Minorityelementary and secondary enrollment levels are expandingrapidly, especially among the low-income segments of minority
populations. Restricting access to a 4-year liberal artseducation and the baccalaureate degree is incompatible with apolicy that promotes access at the 4-year level for minority
populations. Diverting a disproportionately large number ofminority students into the 2-year system is also incompatiblewith a policy that promotes access to a 4-year liberal artseducation for minority populations.
8.) System-wide, the Ohio Board of Regents should implement thefive strategic goals which were established in its 1988 policystudy, "Student Access and Success in Ohio's Higher Education
System." More specifically, the OBR should target parity inproportional headcount enrollment by racial/ethnic group asthe over-arching goal of its commitment to access. Parity is
defined as a minimum or floor with respect to headcountenrollment across the higher education system that is equal tothe racial/ethnic percentage of elementary and secondaryenrollment in the state of Ohio. Parity is also defined as amoving target that will change from year to year as theelementary and secondary state population changes. The fivegoals enumerated by the 1988 OBR policy study are listed as
follows:
Goal 1: To increase the number of individuals participating
in higher education at each level (associate,
baccalaureate, graduate, professional) with
particular attention to minority students.
Goal 2: To increase the number of returning and continuing
.students in Ohio's colleges and universities, withparticular atter-.ion to minority students.
2 t, 2 75
Soca: 3: To Improve the rate of degree completion at al
levels of higher education and in all colleges ana
universities, with particular attention to minority
students.
Goal 4:
Goal 5:
To increase minority student enrollments, over ato at least proportional
ten-year period
representation for each college and university
service area.
To assure that all students are accorded the
benefit of faculty and a learning environment
generally representative of the racial/ethnic mix
found in the service district of the college or
university.
9.) The Ohio Board of Regents should develop and implement a
minority retention data base for the purpose of tracking and
reporting minority student withdrawals from 4-year publicly-
assisted universities in the state of Ohio to ascertai
withdrawal rates by race by institution as well as reasons f
withdrawing by institution. Currently, 75 percent of blacks
attending 4-year public institutions in Ohio fail to complete
their degrees after 5 years. This data base should also be
designed to track and report completion rates for black7; and
other minorities in the public higher education system of Ohio
to ascertain completion rates vs. admission rates by race by
institution and to track and report the length of time it
takes minority students to complete their degrees across the
4-year system.
76
Institutional Recommendations
1.) Develop implementation plan that allows the University to
track progress toward implementing its strategic goals in a
systematic way.
2.) Develop a course scheduling process that facilitates and
expedites completion of core and major course requirements and
that insures that students will be able to move through their
academic program consistently and to complete their degree
requirements as quickly as possible.
3.) Augment current academic advising program such that all
students receive timely and informed advice with respect to
developing their course schedules.
4.) Implement current Strategic Marketing Plan in the Office of
Admissions.
5.) Enhance process for matriculation through the University
College with an emphasis on strengthening the tutoring and
mentoring services currently provided.
6.) Augment recruitment process at the two-year level via enhanced
articulation agreements with two-year publicly-assisted
colleges in the state of Ohio.
7.) Evaluate the feasibility of implementing Total Quality
Management principles into the University's administrative
operations and into the curriculums of the College of Business
Administration and the Department of Manufacturing
Engineering.
8.) Develop comprehensive strategy for increasing fund-raising
activities in the private sector.
Cincinnati Technical CollegeCincinnati, Ohio
Theodore Maurer (Chair)Vice President, Hum." ResourcesCFsiciassati Milacron, lac.
Howard Bola, PresidentExecuted Coosa haat:, lac.
Gardenia ButlerExecutive Director, M2SE
Henry Christomoa, DirectorEmployment TraiaingCity of Cincinnati
Richard Glover, Vice PresideatEugluesriug
The Procter i# Gamble Company
Daniel G. Gregorie, M.D.President d CEOChoiceCare
Virginia KMember, Board of EducationChichewa' Public Schools
Korea D. HoebExecutive DirectorThe Greater Cinciaaati Foundatioa
W. M. (Bill) JamesDirector, Persoanel AdmiaistrationResearch ck DevelopmentThe Procter d Gamble Company
2 c
Report of the hilazagims Oar the .177.ft...-tt -'arc Pcrer
4 z 7177:IVE S
The Cincinnati Technical College Managing for the Future Task Force included 18 greater Cincir.natians
from business, industry, civic organizations, the media, and government The members were selected by
the College president and approved by the College Board of Trustees.
From November-1991 through May 194: the Task Force held six meetings. The membership broke up
into three subcommittees which met separately. The subcommittees studied the following issues:
Quality Enhancement, Revenue Enhancement, and Expense Reduction.
Each subcommittee presented a report and made recommendations to the full Task Force. Reports andrecommendations were discussed and consensus was reached.
The Task Force agreed that it should meet annually to review progress and offer further assistance.

University of CincinnatiCincinnati, Ohio.
Susan BaconCollege of Arts dr Sciences
Patricia BerlinCollege - Conservatory of Music
Ann 5anoitClermont College
Mary J. BradleyRer toted Walters College
Robe:* BurnhamArchitecture
Lantbam CamblinCollege of Education
Richard DrakeCollege of Medicine
Marvin GarrettUniversity College
William HeinemanCollege of Arts d Sciences
Ronald Hustitt, Faculty SenateCollege of Engineering
Maria Kreppel, Vice Provost
Report to the Managing for the Future Task ForceUniversity of CincinnatiMay 21, 1992
THE PROCESS
EXECUTIVE SUMMARY
Because of reductions to state subsidy and increases inexternally mandated costs, the University of Cincinnati hasforecast an approximate $40 million dollar deficit in its 1994-95general funds operating budget. Thus, when the charge wasreceived in October 1991 from Chancellor Hairston to conduct acampus -based study for the Managing for the Future Task Force,President Steger-decided-to conduct this study within theprocesses already defined to work on budget reductions. Thisdecision was communicated to Chancellor Hairston in an October18, 1991 memorandum. Dr. Norman R. Baker, Senior Vice Presidentand Provost for Baccalaureate and Graduate Education, wasassigned to coordinate the process.
The process involves a number of standing administrativecouncils, standing governance committees, and ad hoc task Zurces.These groups have been at work since June 1991. The charge andmembership of each group was presented as Appendices 1-11 of ourinterim report, submitted April 15, 1992, and will not berepeated in this report.
tandina Councils and Committees
Several administrative councils are an integral part of theUniversity of Cincinnati's organizational structure. Thesecouncils are involved in all aspects of the University'splanning, policy setting, budgeting, and decision-making process.The councils and their membership, in descending hierarchicalorder, are:
1. Policy and Planning CouncilMembership: President, 2 Senior Vice Presidents,Executive Director for Planning
2. Academic and Administrative CouncilMembership: 2 Senior Vice Presidents, 5 Vice
Presidents, Treasurer, Executive Director forPlanning, 5 Deans, 3 Faculty
3. Council of DeansMembership: 17 Deans
In addition to the standing administrative councils, there areseveral standing governance committees. The standing governancecommittees most involved in the budget reduction process are theBudget and Priorities Committee of the Faculty Senate and theStudent Advisory Committee on University Budgets (SACUB). Thus,through these committees, faculty and students are routinelyinvolved in the planning, budgetary, and decision-makingprocesses of the University of Cincinnati. Final decisionresponsibility rests with the central administration afterconsiderable input through the governance committees.
2
Ad Hoc Task Forces
Working jointly with the Faculty Senate, the Academic andAdministrative Councils defined a number of ad hoc task forces toaddress the need for manaqed, focused 'oudget reductions.
The first of these, the Faculty/Administrative Budget Task Force,worked from June to August 1991. Their report was forwarded as
an attachment to President Steger's October 18, 1991 letter toChancellor Hairston. The membership included three academic VicePresidents, three academic. Deans, three faculty from FacultySenate, and three faculty from the faculty union, the AmericanAssociation of University Professors. The final report of thistask force has formed the baseline for .all the effort that
follows.
Shortly after receipt of the final report from the Faculty/Administrative Budget Task Force, a two-day retreat of theCouncil of Deans was hold. The purpose of the retreat was toreview the final report and propose next steps. The Council ofDeans organized the 20 recommendations in the report into 8themes each of which required extensive review and evaluation.The Council of Deans proposed that a joint administrative/faculty/student task force be created and charged to study eachof the 8themes. This recommendation was accepted andimplemented by the Academic and Administrative Councils.
Working collaboratively with Faculty Senate and SACUB, theAcademic and Administrative Council constituted the followingeight task forces:
University Faculty Workload Task Force*Fund Raising Task ForceOff-Loading Task ForceEnrollment Management Task ForceAdministrative and Academic Support Services Task Force*Academic Program Evaluation Task Force*Continuing Education Incentives Task ForceFiscal Policies Review Task Force
Reports have been received from the three task forces whosecharge is most directly related to this report (identified byasterisks). It is our intent to have these reports reviewed bythe governance committees and the Academic and AdministrativeCouncils. We hoped to complete these reviews prior to thepreparation of this report and it was scheduled to meet the May15, 1992 submission date. Unfortunately, we are running behindschedule, primarily due to the need to take large, unexpectedbudget reductions, and the reviews have not been completed.Therefore, this report will present the unreviewedrecommendations.
Clark State Community CollegeSpringfieg Ohio
Mrs. Jane Surd; ChairpersonNew Carlisle, Ohio
Mr. Lewis J. BilottaCable, Ohio
Mr. Thomas Clark, ManagerOhio Ulm,'Springfield, Ohio
Ms. Mary Lee Gecowets, Executive DirectorUrbana Area Chamber of CommerceUrbana, Ohio
Mr. Peter J. Hackett, PartnerClarke, Shaeffer r* HackettSprisegfrels4 Ohio
Mr. Jack R. HagenSpriserek4 Ohio
Ms. Ellen HooverCity of Springgsld
Mrs. Kelly KavanaughSpringfield, Ohio
Ms. Thais Bee'Xenia, Ohio
Mrs. Priscilla]. SmithersClark County Board ofAkobol
Ms. Freda Taylor, ManagerGillespie Oil Company, Inc.
Mrs. Pause& Young, Principal&waybill Ekisserstary School
Mr. Joseph Jackson, Vice PresidentClark State Commussity College
Mr. Albert t A. Salerno, PresidentClark State Community College
EXECUTIVE SUMMARY
As Ohio moves toward the new century, higher education will
be called upon to play an expanded role in providing education andskills to our new workforce. Clark State Community College has
spent the last five years preparing itself to serve this new
challenge. Our task force found significant evidence whichsupports the positioning of the college to meet these new
challenges.
The Board of Trustees has developed a sound management team
and an excellent faculty. Together the faculty, administration,
and associates have been working hard to keep the institutionmoving forward in an era of constrained resources. This team has
done a commendable job in both assessing the educational needs of
its community and the development of programming to meet thoseidentified community needs.
Clark State Community College has developed a broad-basedprocess to evaluate and implement cost-savings measures. . Since1985 the college has reduced annual expenditures by some $560.000
at the same time they were planning for the successful transitionto a state zommunity college. Since becoming a state communitycollege in 1988, the college has experienced an increase inenrollment of approximately 41Z. With an increasing enrollmentand a decreasing state subsidy, the college has had to implementmeasures for productivity improvement among its personnel. In
1991-93 the workload for full-time faculty was evaluated andchanged to a more equitable base.
Our task force found evidence of measures which will help tosustain quality at the college. Reward structures are availablefor all classifications of employees; i.e.. yearly financialrecognition structures, professional development supportactivities for all classes of employees, sabbatical leave forfaculty, etc. The Board of Trustees and college staff definequality measures in much the same way. It appeared evident to our
group that everyone at this college understands and supports theseveral missions of the college.
During the past three years, the college has been able to
manage its transition to a state community college. Even with
reduced state funding it has still managed to move forward with
its original plan to bring increased educational benefits to its
citizens. However, our task ;orce is gravely concerned about
their ability to continue to sustain quality in the years ahead if
the necessary state resources are not made available. Therefore,
our formal recommendations focus on state-wide issues (which have
direct affect on the delivery of services at Clark State) as well
as suggestions for continued improvement at the college.
Columbus State Community CollegeColumbus, Ohio
Timothy R. Stonecipher, Esq.Nichols, Stonecipher cf. RexLondon, Ohio
Dr. Harold M. Nestor, PresidentColarnshais State Community CollegeColumbus, Ohio
Ms. Pew CsdestroExecutive Assistant to the PresidentColumbus State Community CollegeColumbus, Ohio
Napoleon A. Bell, Esq.Beg White, Ross, Lewis d GilbreathColumbus, Ohio
Ms. Frankie L ColemanExecutive DirectorThe Private Industry Council of Colum-bus 4+ Franklin County Inc.Columbus, Ohio
Ms. Sue Doody, OwnerLindey's RestaurantColumbus, Ohio
Mr. Dan S. Morris, Group Mgr.Nationwide Communications, Inc.Columbus, Ohio
Mr. John Schell PresidentCapital Services, Inc.Columbus, Ohio
Mr. Wayne CoccbiColumbus State Community CollegeColumbus, Ohio
Dr. Marvin G. GutterVice President for Student Ssis.Columbus State Community CollegeColumbus, Ohio
Dr. Michael J. LeymasterVice President for Student Svs.Columbus State Community CollegeColumbus, Ohio
Dr. Joyce A. McCabeDirector of Research d PlanningColumbus State Community CollegeColuishus, Ohio
Dr. Shirley A. PalumboVice President for Academie Affairs
Columbus State Community CollegeColumbus, Ohio
Ms. Jeanne PattonAsst. to the PresidentColumbus State Community College
Columbus, OL.eo
Mr. Garfield JacksonColumbus State Community CollegeColumbus, Ohio
n
Columbus Stare Community CollegeManaging For The Future Institutional Committee Report
May 15. 1992Page '7
2. A brief description of the findings and recommendations of the institutionalmanagement review.
Summary: Columbus State Community College is an institution which understands its
customers (students and employers) and provides them with a quality product(education). Sustained and predictable state funding is required for the college's
continued growth, financial well-being, and ability to respond to the needs of its students
and the community. The committee is particularly concerned that Columbus State'sexcellent management record couldbe used as an excuse for further funding reductions,which would seriously imperil the institution.
The overriding conclusion of the Managing for the Future Institutional Committee is
that Columbus State is a well-managed institution, which understands its mission and
constituency and has succeeded in maintaining the highest quality at the lowest possible cost.
Columbus State has experienced a dramatic growth in enrollment over the past five
years: 96%. At the same time, the college has held its costs to a minimum and, in fact, has
reduced by $646 the cost per full-time equivalent (FTE) student over the past three years.
The college's annual per-student FTE cost is currently $1,461 below the state-wide average
for two-year technical and community colleges and $3,661 below the current cost per-student
FTE for all colleges in Ohio.
The college constantly monitors its fiscal status with:
Daily records of student enrollment, inquiries, and applications.
On-line reports of college revenues and department expenditures.
Six-month (rather than annual) budgets.
An annual Financial Self-Assessment, which includes strategies and risks.
Columbus State considers itself a business and uses terminology and management
strategies from the corporate sector. The college believes a successful business understands
its customers and focuses its operation on providing a quality product to those customers while
maximizing efficiency.
2 a
Calumbus State Commur.a,. CatieceNianagtng For The Future Inatitut.onal CJrnm.:ttee Report
Ma* IS 199:Page 8
Columbus State considers its students, their prospective employers, and the community
at large as its customers. To ensure the college's awareness of its constituency, Columbus
State:
Conducts regular studies of whom it serves and how well they are served. A
variety of objective data are generated from over 35 reports and self-studies
each year.
Demonstrates its commitment to students by providing access to anyone who
can benefit from a college education.
Enables traditionally underserved students to obtain a college education by
keeping tuition and fees affordable (the lowest in the region).
Removes opportunities for failure by keeping class sizes and student/faculty
ratios at optimum levels for learning.
Ensures that students understand the education they will receive by defining
course and program outcomes for every academic area and measuring those
outcomes by standardized tests, locally developed assessment instruments, and
student and employer evaluations.
Local employers are involved in developing and monitoring academic programs and
are regularly polled about on-the-job performance of Columbus State's graduates. Dozens of
partnerships and collaborative programs between Columbus State and other companies,
agencies, colleges, and universities operate each year.
Columbus State understands the importance of maintaining a skilled and dedicated
work force to serve the college's customers. The primary mission of faculty is teaching, and
they are evaluated regularly on their performance in the classroom; in fact, regardless of
tenure status or length of service with the college, faculty members never reach a point where
they are not evaluated. Moreover, each academic unit is reviewed annually on seventeen
objective criteria. Units which perform poorly for over two consecutive years are placed on
probation for possible phasing out over the following two years.
The college both expects and rewards quality from its employees and has created a
work environment charactenzed by high morale and espnt de corps. By maintaining
competitive levels of compensation. annual adj.. .:ments, benefits. professional development

Columbus State Community CollegeManaging Fur The Future Insti..,_!iional Committee ReportMay IS. 1992Page 9
fOuestron 2 continued)
opportunities, and a series of awards and recognitions, the college enjoys a very low, college-
wide, annual turnover rate of 4.6%.'
The "unit president" concept is an important strategy endorsed by the American
Management Association ane. one used by Columbus State. Each of the college's 54 unit
presidents (cost center managers) helps to develop the college budget and is informed of and
responsible for all unit expenditures.
Columbus State has created a campus environment which is conducive to quality
education. It is healthy, safe, and secure, with state-of-the-art equipment and laboratories in
facilities that are clean and in good repair.
Despite excellent records of enrollment growth, sound mznagement, and a constant
search to improve quality in every area of college operations, Columbus State is now
threatened by continuing decreases in state funding. The college is both unwilling and legally
unable to raise tuition beyond a 7% increase to augment revenues.
Committee members have also identified a potential political problem with this report:
Columbus State has continued to manage well during significant enrollment increases and
despite decreasing state funding.
Will this good management work against the college?'
Will policy-makers observe that the college has been able to respond to cutswithout compromising its educational excellence and conclude that ColumbusState should be able to accommodate additional cuts as well?
Columbus State is not alone in receiving less money from the state every year. What
makes Columbus State unique, however, has been the college's ability to increase services to
/fit recent study measured the annual turnover rate for full-time, permanent. whitc-cc:llar employees in the executive
branch of the federal government et 9%. (Public Administration Review. March/April 1991. Vol. 51. No. 2, p. 146.) "..Roughly twenty-five percent of all new government huts leave within the first year." (The Washington Post, September 12.
1989) "(Federal) health-care workers had a nineteen percent turnover rate and sixteen percent of all clerical and
support staff left during the year the Government's record was comparable to that of the pnvate sector, where turnover
was 12% in 1987. according to the Bureau of National Affairs ;The New York Times Nattortel. September II. 1989 )
'The committee's concern that a great injustice could occur as a result of Columbus State's efficiency of operation is not
without prcedent Several years ago for example, there were no state funds available to purchase classroom computers.
Ber..aus it believed such equipment was imFortant for its students. Columbus State used money from its operating budges to
purchase these computers When Vale funds were finally made available for computers. Columbus State was, in effect,Inc... ...it
0 BEST COPY AVAILABI r
Columbus State Communto. College
,vtirtaguig F,)r The Future Instituttunal CmmIttec Rcpor.
:5. 199:Page 10
Questnin conitntied)
its community while, at the same time, reducing its student FTE expenditures. Although the
college has experienced significant growth in enrollment, this growth is now funded by the
state at an approximate rate of $0.60 on each dollar earned by formula. Clearly, the college
has already "adjusted" to funding cuts. The question remains, "How much more can it adjust
down?"
This delicate balance -- between showcasing what the college does well and, at the same
time, sounding the alarm that further decreases in state funding will seriously compromise
Columbus State's ability to continue to serve students well--has been a source of much
discussion.
Rather than attempt to resolve this debate, the Managing for the Future Institutional
Committee has decided to report the concern: that an excellent two-year institution is in
danger of having to limit access and compromise opportunities for student success. Ironically,
the sound management that brought Columbus State to this position of prominence and
excellence may be the very argument used against sustaining funding levels in the coming
months.
"'40" OLO
Cleveland State UniversityCleveland Ohio
Mr. Monte AbujaChairman, President, er Chid' Executive OfficerTranstar Industries, Inc.Walton Hills, Ohio
Dr. Arden L Bement, Jr.Vice President, Science dr TechnologyTRW, Inc.Lyndhurst; Ohio
Mr. Kenneth J. SemebbergerPresident dr Chief Operating OfficerScott Fetzer CompanyWestlake, Ohio
Dr. J. Taylor SimsProvost tr Senior Vice PresidentCleveland State UniversityCleveland Ohio
Dr. David C SweetVice Provost ftr Capital Planning tirDean, Maxine Levin College of Urban AffairsCleveland State UniversityCleveland Ohio
Dr. Stuart M. KleinProfessor of Management dr LaborPresident, The Faculty SenateCleveland State UniversityCleeland Obio
Mr. Dennis P. AndersonVice President ftr BusinessCleveland State UniversityCleveland Ohio
2
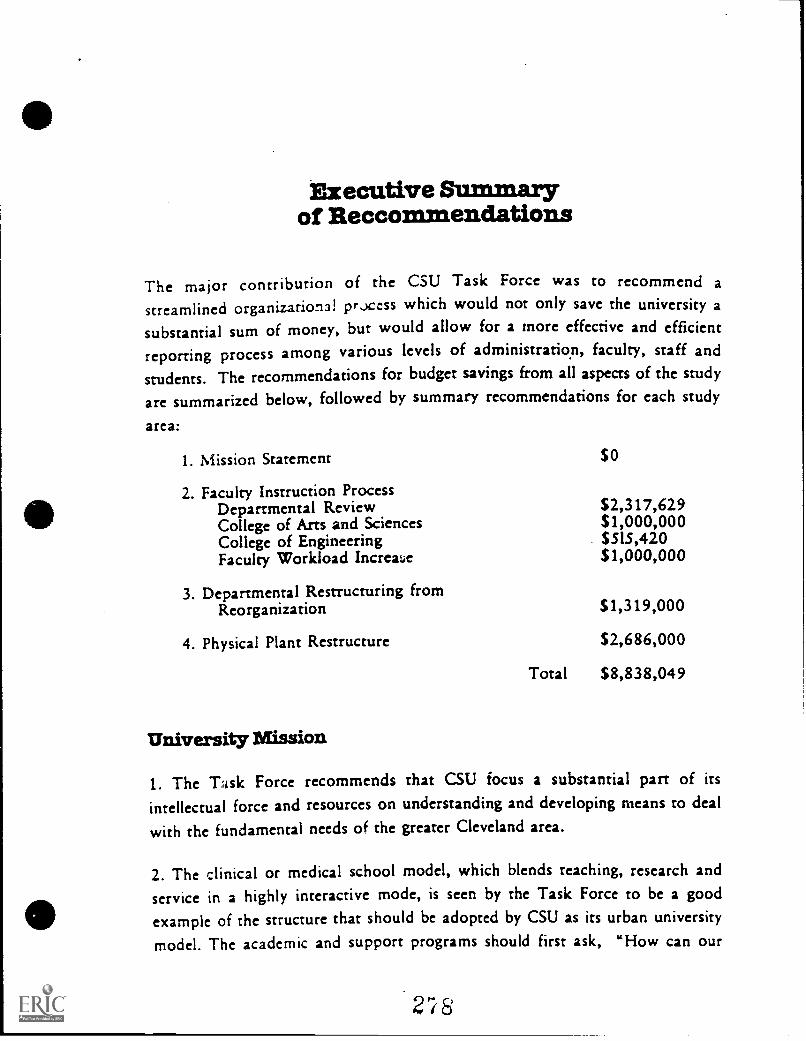
Executive Summaryof Reccommendations
The major contribution of the CSU Task Force was to recommend astreamlined organizarior3! prxess which would not only save the university a
substantial sum of money, but would allow for a more effective and efficient
reporting process among various levels of administration, faculty, staff and
students. The recommendations for budget savings from all aspects of the study
are summarized below, followed by summary recommendations for each study
area:
1. Mission Statement
2. Faculty Instruction Process
SO
Departmental Review $2,317,629College of Arts and Sciences $1,000,000College of Engineering 551.5,420Faculty Workload Incrme S1,000,000
3. Departmental Restructuring fromReorganization S1,319,000
4. Physical Plant Restructure $2,686,000
Total $8,838,049
University Mission
1. The Task Force recommends that CSU focus a substantial part of itsintellectual force and resources on understanding and developing means to deal
with the fundamental needs of the greater Cleveland area.
2. The clinical or medical school model, which blends teaching, research and
service in a highly interactive mode, is seen by the Task Force to be a goodexample of the structure that should be adopted by CSU as its urban university
model. The academic and support programs should first ask, "How can our
programs be delivered in a way that can match one or more needs of the
community?"
3. Since CSU falls within the category of universities in the state which offer
some but not an extensive !Limber of graduate programs the Task Force
recommends that its emphasis be toward a more balanced role between
teaching, research and service with considerable emphasis on undergraduate
education.
4. The conclusion of the Task Force is that the University Mission Statement
must be clearly defined to support tne centrality of its urban missioa with a
clear focus on key colleges: Arts and Sciences, Business, Education,
Engineering, Law and Urban Affairs.
Faculty/Instructional Process
S. The Task Force strongly endorses the program review process outlined in the
University's Strategic Plan and urges the faculty, staff and administration to
follow through with this process to its initial completion and continuance. The
program review process will determine when funds need to be spent, where
they are likely to come from and where they should be allocated. The review
should be continuous and should include both academic and non-academic
units.
6. The Task Force recommends that the Total Quality Management (TQM)
approach be considered as a process to move the quality of CSU programs to
excellence.
7. The Task Force agrees that the evaluative force of the University's Program
Review Criteria (Centrality, Quality, Demand, Comparative Advantage and
Cost) coupled with TQM can yield specific indices for efficient resource
allocation.
8. The Task Fe,rce recommends that the free standing academic centers and
programs in the University be reviewed in terms of self-support capabilities.
Budget reductions or elimination should be considered for those centers
2""
*currently on state funding which are not at least breaking even with respect to
income and expenses.
9. Because of its size, diversity in instructional areas, and difficulty ofmanagement, the Task Force recommends that the College of Arts and Sciences
be restructured into at least two separate colleges. Within this recommendation
the Task Force suggests dividing the current Dean's office budget between the
two new colleges when formed.
10. It is recommended that consideration be given to closing the advising
division of the College of Arts and Sciences and returning this function to the
faculty.
11. Ir is recommended that consideration be given to closing the computer
center in the College of Arts and Sciences and merging its equipment into the
University Computer Center for greater control and centralization of services.
12.. The Task Force recommends that the College of Engineering eliminate the
Division of Engineering Technology . This program more clearly belongs in a
two -year technical college program.
13. The Task Force recommends that the average teaching load be raised to
2.75 sections per department with an overall efficiency/productivity increase of
25%. Such efficiency could result in appr'ximately S1 million of savings in part-
time teaching funding.
14. The Task Force recommends a balanced approach for faculty evaluation
with the true inclusion of teaching and service. Within this recommendation the
Task Force supports a multi-faceted teaching evaluation system as aninducement for improved teaching and its inclusion in the evaluation process.
15. The Task Force recommends that the University administration provide the
resources for faculty to develop and maintain skills in the most current teaching
technology, especially computerized instruction.
16. The Task Force recommends a promotion, tenure and salary review process
that is tied more to performance than across the board evaluations. A modified
"Management by Objective (N1BOr process is recommended for evaluationguideline development.
17. The Task Force is in agreement with University guidelines which state thatmembers of the faculty should not teach more than twelve credit hours perweek. Assignment of research activities should result in some downwardadjustment of load, but IT SHOULD NOT BE EXPECTED THAT EACHFACULTY MEMBER WILL TEACH THE SAME LOAD.
18. The Task Force recommends that the concept of "term tenure" be exploredas a stepping stone toward permanent tenure for a more limited number ofpermanent faculty.
19. If it is economically feasible early retirement options should be explored toeffect faculty turnover among senior faculty with long years of service. Theopportunity to reduce the overall work force through an appropriate PERS-STRS retirement process should not be overlooked.
Organizational/Administrative Functions and Eva/nations
20. The Task Force recommends that an immediate restructuring process beundertaken among administrative departments that will result in theconsolidation and/or elimination of duplicative positions as well as theenhancement of function and efficiency.
21. The functional Chart of Organization shown as Figure 2 in Appendix A isrecommended to replace the current organizational configuration whichreflects several major inefficiencies. It creates four senior vice presidents andprr-,ents a more streamlined organization built upon part:zipative managementwith no more than seven departments reporting through any one administrator.
22. Tht Task Force commends the University a.;ministration for previousactions taken to improve productivity and efficient; prior to this study. The listincludes such results as a more efficient summer school funding program,elimination of university publication, computer controlled energy systems,
2'I V

pooled maintenance of computers and purchasing, and a proposal for a
consortium for savings and health care and other benefit costs.
Physical Plant and Facility Management
23. The Task Force finds that the facilities management program has inherent
organizational and planning weaknesses. Overall reorganization and revamping
is recommended. Strategic planning is urgently needed for efficient
departmental space allocation, classroom space management, examination of
duplicate facilities, overall adequacy of facilities, and to correct a general lack of
control in space allocation. The overall utilization of faculty office space is a
specific concern.
24. The Task Force recommends that the physical plant and operations
departments be reorganized to centralize management functions.
25. The Task Force recommends that the University subcontract as many
operations functions as deemed practical, including custodial, maintenance,
motor pool, groundskeeping and building repairs.
2 s.

Cuyahoga Community CollegeClevelan4 OhioMr. Richard Acton(CCC Board of Trustees)Executive SecretaryCleveland Federation of Labor
Mr. John D. Chiappetta(CCC Board of Trustees)PresidentEuclid d Wickliffe Services, Inc.
Ms. Margot Copelana DirectorLeadership Cleveland
Mr. Keith Curtis, DirectorEaton Corporation
Mr. James Gulick, Executive DirectorCleveland Connnissioss on Higher Education
Ms. Jeri Jackson (CCC Student Trustee)Cuyahoga Community college
Mr. Peter Lawson Jones, AttorneyWeiner d Suit
Ms. Janis Purdy, Executive DirectorThe Citizens League
Mr. Richard Shatten, Executive DirectorCleveland Tomorrow
Dr. Carol K WillenProgram Officer frr Higher EducationThe academes' Fousadatioa
Dr. Frank William ReisExecutive Vice PresidentHuman Resources &AdministrationTask Force Chair
9 %.
QUALITY AND COST AT CUYAHOGA COMMUNITY COLLEGEThe Final Report of the CCC Managing for the Future Task Force
EXECUTIVE SUMMARY
In July, 1991, the Ohio Board of Regents (OBORI urged all state supported two- and four-year educationalinstitutions to establish a Task Force that would guide an internal review of the forces that influence the costat a College, identify cost containment strategies, and report findings and recommendations to the statewide"Managing the Future Task Force." Cuyahoga Community College's "Managing for the Future Task Force"reviewed the College's operations from December, 1991 to May, 1992. The Task Force was made up offifteen (15) individuals--nine corpordt9 And public sector executives, three of the College's trustees, theCollege's President and its two Executive Vice Presidents.
The Task Force was guided by the suggested questions provided by the OBOR for use by the StatewideManaging for the Future Task Force. Because the questions appeared geared primarily to the mission of four-year institutions, each question was adapted to be most applicable to a community college. To address thequestions, the Cuyahoga Community College Task Force received orientation to the College's long-rangefinancial plan, its "Action Agenda for the 1990s," and resource allocation and quality control processes.Initiatives which have resulted in cost efficiencies and effectiveness, condnuing challenges and obstacles toachieving quality and comparative institutional data were also presented. The final report represents thedistilled opinion of the Task Force in addressing its charge.
RNDINGSDuring its deliberations, the Task Force made a number of observations. They pertain to the College'spriorities; its planning systems to achieve these priorities; system to improve organizational efficiencies andeffectiveness and processes which have already been accomplished to improve the College's efficiencies andeffectiveness. Based on its detailed review, and observations concerning key areas of the College'soperations, it is clear that the College has taken significant steps to be prudent in its management of publicresources while maintaining a strong sense of commitment to providing high quality education and trainingservices to the community which it serves.
The Task Force also believes that Cuyahoga Community College can contract the scope and management ofits services without losing its quest for excellence. If the choices facing the College leadership are well made,based on carefully developed criteria and excellence and quality need. not suffer. To attain this goal,the College will need to take specific steps to address targeted courses of action in the immediate years ahead.Board leadership and the recommendations contained in this report provide guidance to these action steps.
RECOMMENDATIONSBased on the data, information and analyses completed over the five month period, the Cuyahoga CommunityCollege Managing for the Future Task Force offers seven recommendations for the College's and Regents'consideration in planning for the future. The Task Force recommends that
Given this era of finite resources, an aggressive FY 1993 review of academic andadministrative staffing patterns be conducted, leading to a 0% reduction in noninstructionalstaffing.
The College seek the highest attainable level of faculty productivity--increasing this by 10% ineach of the next three mars, through en emphasis on teaching and learning.
Program evaluation be implemented immediately to assess and eliminate institutional duplicationof academic programs, administrative and institutional support functions, and excessive costs.
2 c
Consistency and uniformity in all appropriate areas across the College, (e.g., student service.and business operations! be assessed, and unnecessary duplication be eliminated.
A student service focus be implemented utilizing Total Quality Management (TOM1 tech e.that will provide a program of continuing improvement from the counseling office to th,classroom. Through evaluation, programs which only minimally contribute to studendevelopment will be eliminated.
Cost savings and synergistic collabora fives be developed between and among regionaeducational institutions Campus One, Tech Prep) and other inter-institutional cooperative~WM.
These recommendations will call for st.:ite support through:
incentives for collaboration,
improvements in the quality of statewide data available for assessing institutional effectivenessand efficiency, and
greater equity in funding between two-and four-year colleges.
The Cuyahoga Community College Managing for the Future Task Force believes that the College'simplementation of its mission, and its effectiveness in serving the citizens of the Northeast Ohio region willbe greatly enhanced if necessary steps are taken. The results will be an institution of high quality tcontinue to meet the challenges of the next century on an swan mo stable and predictable foundab
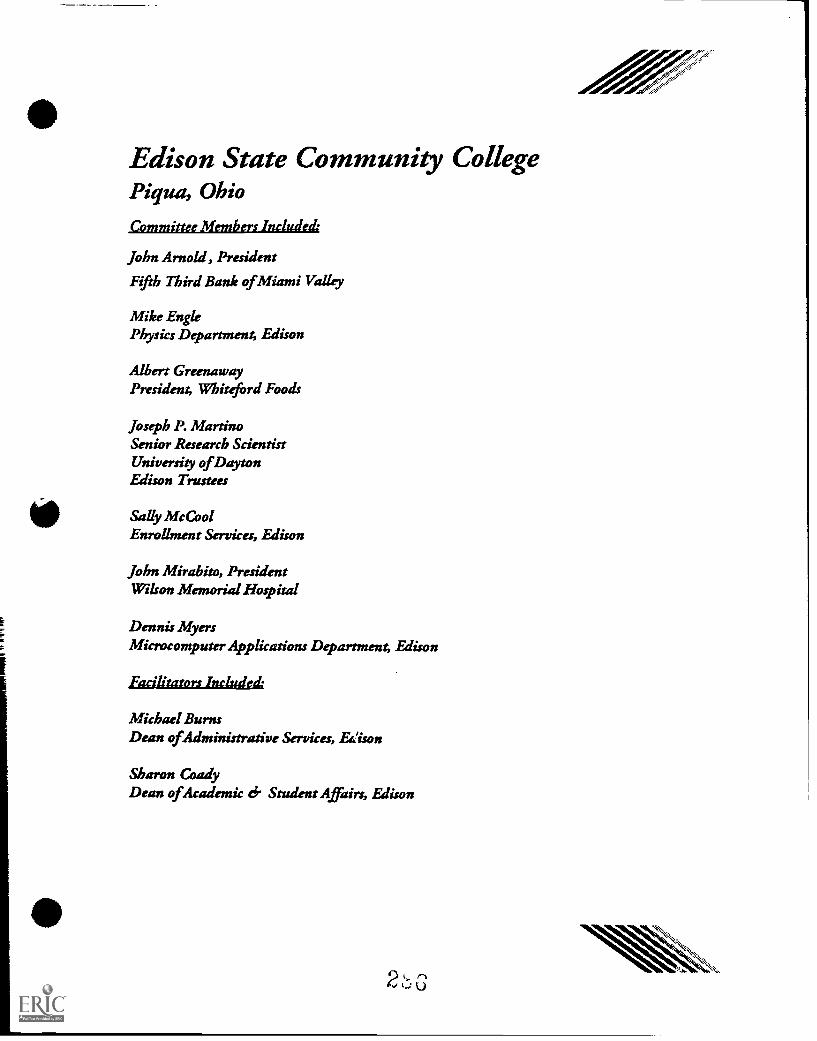
Edison State Community CollegePiqua, OhioCommittee Members Included
John Arnold, President
Fifth Third Bank ofMiami Valley
Mike EnglePhysics Department; Edison
Albert GreenawayPresident, Whiteford Foods
Joseph P. MartinoSenior Research ScientistUniversity of DaytonEdison Trustees
Sally McCoolEnrollment Services, Edison
John Mirabito, PresidentWilson Memorial Hospital
Dennis MyersMicrocomputer Applications Department; Edison
Ezzilitators Include
Michael BurnsDean ofAdministrative Services, Edison
Sharon CoadyDean ofAcademic 6. Student Affairs, Edison
2
Executive Summary
A. Significant Findings
Edison focuses o' learning.
Edison's business is learning. All initiatives areassessed against that mission and faculty workload isassigned accordingly. All faculty by contract teach 15instructional units, equalling four or five courses, eachquarter.
Edison i3 clear in its mission.
Edicon serves Darke, Miami and Shelby counties. Itexists to provide general education, to parallel thefirst two years of a university, to prepare studentsfor immediate career entry, to assist the three-countyarea in economic development through education andtraining and to provide for lifelong learning.
Edison monitors its costs.
The average cost per student credit in 1991-92 was $96,including all indirect costs.
The average faculty salary is $31,899. Of the 41 full-timefaculty currently employed, 6 have doctorates, 31 havemaster's degrees, 20 are completing master's degrees and twohave bachelor's degrees.
Edison is addressing the major concerns of employers.
Both local and national studies indicate that employers wantstudents educated for the modern workplace. To that end,Edison's faculty has committed to teaching the followingcore values in every class:
Communication skillsEthicsCritical thinkingCultural diversityInquiry/Respect for learningInterpersonal skills/Teamwork
Edison Community College9
3

While far from fully implemented, these core values arebeing systematically addressed in every discipline.
Edison initiated the first steps in Total Quality Management 18months ago and is continuing that initiative.
Customer service training has been intensive andcontinuing for all staff except faculty. Processmonitoring training has just begun.
Edison is accomplishing its objectives with one of the state's
lowest subsidy rates.
The following chart provides a very rough picture of statefunding levels since it does not distinguish betweenaraduate and undergraduate or between liberal arts and
technical programs. It does, however, give a generaloverview of how much one full-time equivalent student costs
the state at neighboring and other selected institutions.
FTE Subsidy SubsidyPer FTE
Ohio State University 46,988 256,920,352 5,468University of Cincinnati 23,488 127,967,719 5,448
Wright State 11,838 54,473,753 4,602
Bowling Green 16,591 61,118,614 3,684
Lima 1,138 3,977,681 3,495
Cincinnati Tech 2,513 8,594,913 3,420
Miami 15,758 50,426,042 3,200
Clark 1,489 4,708,027 3,162
Lake Campus, Wright State 537 1,653,715 3,080
Lorain Community College 3,557 10,517,121 2,957
Southern State 899 2,584,029 2,874
Cuyahoga 11,873 33,444,284 2,817
Sinclair 7,501 20,636,196 2,751
Lakeland Community College 3,919 9,972,725 2,545
Columbus State 6,754 16,174,247 2,395
Edison 1,374 3,257,305 2,371
Lima Campus, OSU 1,131 2,564,328 2,267
Rio Grande 1,260 2,762,040 2,192
Edison Community College 4

Edison has accommodated student and faculty growth whilecontaining expansion of non-teaching personnel.
Students Faculty Non-TeachingPersnnel
1988 7,820 37 66.751991 10,215 41 67
Increase 31% 11% 0.004%
B. Significant Recommendations
The following recommendations from Edison's Task Force have thegreatest potential for effecting significant cost reductions,revenue increases and improved quality:
Stress intramural athletics and lifelong physical fitnessand consider dropping competitive athletic teams.
Streamline forms and administrative procedures toeliminate duplication for students, faculty and staff.
Eliminate or revise low demand programs.
Market Edison's emphasis on general education and corevalues.
Capitalize on strengths in Total Quality Management bydeveloping a curriculum for the Nineties -- the corevalues, TQM, foreign languages, environmental issues,community structure and needs.
Form a partnership with local businesses to studystate-of-the-art technology and its potential in thelocal area.
Make more services user-financed and structure fees toreflect the costs of services used.
Increase professors' productivity by providing moreclerical support, test graders, classroom proctors andsupplements such as videos, computers, etc.
Examine ways in which entire classes can be taught insupplemental modes such computer-based instruction.
Edison Community College 5
1. Review Process
Edison's Managing for the Future committee consist-ad of onetrustee, three business representatives from the College'sservice area, two faculty members and one staff member.
Two deans prepared material in response to state guidelines andto committee requests. The material was presented to thecommittee for discussion. Committee members individuallyformulated commendations and recommendations which were compiled
by the deans and submitted to the group. The committee thendiscussed and agreed upon its final report.
The faculty and staff representatives have been asked to share
their experiences with their colleagues.
Committee members included:
John Arnold President, Fifth Third bank of MiamiValley
Mike Engle
Albert Greenaway
Joseph P. Martino
Sally McCool
John Mirabito
Dennis Myers
Facilitators included:
Michael Burns
Sharon Coady
Physics Department, Edison
President, Whiteford Foods
Senior Research Scientist,University of DaytonEdison Trustee
Enrollment Services, Edison
President, Wilson Memorial Hospital
Microcomputer Applications Department,Edison
Dean of Administrative Services, Edison
Dear. of Academic and Student Affairs,Edison
Edison Corrunuruty College 6
Hocking Technical College*Nelsonville, Ohio
No report received at this time
Jefferson Technical CollegeSteubenville, Ohio
Mr. Frank S. Dimi4 ChairmanRetired Superintendent of Maintenance d- Utilities, Weirton Steel CorporationPast Chairman do- Board MemberJefferson Technical College, Board of Trustees
Mr. Scott CampbellMember ofJefferson Technical College Alumni Board, ManagerCove Valley TruValue Lumber d Home Center
Mr. Louis MussoOhio Valley Hospital
Mr. John BeckExecutive Director, BHJ Metropolitan Planning Commission
Mrs. Denny PalmerTeacher, Garfield Elementary School
Mr. Thomas WilsonAttorney, Highland Park Estates
Mr. Lou SimpsonDistrict 23, United Steelworkers ofAmerica
Executive Summary
A number of issues must be kept in view as the process of evaluating Jeff Tech and other
two-year institutions takes shape for the final Managing for the Future's report.
Two key responsibilities for the two-year colleges in the 1990s art: First is to serve as a
"portal" of entry to the higher education system for those who heretofore had not aspired to obtain
further education and training and at the same time improve the retention of those people taking
advantage of the opportunities. Second. the colleges are to continue their involvement and
promotion of additional activity with Ohio industries to build me nation's best workforce training
and retraining capacity. It is against this backdrop that Jefferson Technical College pursues its
institutional goals.
The mission and goals of Jefferson Technical College are obviously different than the goals
and objectives of the universities such as Kent. Ohio State University or Miami. Each type of
institution whether :t be a technical/community col.iegc or university serves to respond to the needs
of various types of people in its service area. Jeff Tech, by definition as a technical college,
awards associate of science and applied business degrees and one-year certificates. The orientation
of the institution's faculty is teaching, advising and human development.
The orientation of the applied science and business programs is "hands-on." The college
carefully blends course content and theory with lab applications so that graduates and certificate
completers can participate in the design, testing and implementation of technology. The technician
serves in a capacity which is clearly not craftsperson but not engineer or physician.
The difference between technical education and baccalaureate education can be defined by
the orientation: hands-on versus more theory; and the extent of English, social science, humanities,
natural science required of people seeking a baccalaureate degree.
Perhaps the most significant difference has to do .g.ith the level of preparation that many
students enrolling at the tv.o-.ear campuses possess %Oen compared to the applicants at
universities There arc some major public policy issues that must be resolved regarding serving all
2bs
the people of Ohio \lari students enrolling at I v.o-.ear colleges today arc not traditionally
:-.ollege age Further. they are no longer in shape to read at the college-level or use colic vtAlimathematics and English. The net result is the college must expend a great deal of time, energy,
personnel, physical and financial resources to help these people raise their level of mastery to a
point where they can do college-level work. In addition, there are many traditionally aged student
18-22 who are not prepared to read, write or compute at the college level.
To date, the state has not taken the position of adequately financing the services needed to
help two-year college students r,iise their basic skill levels to the point where they are adequately
prepared to do college-level work. The state has not yet realized that the technological revolution
which drives the state's economy requires more better educated people to perform jobs formerly
done by less educated citizens.
Finally, it would appear the state must access its current system of two-year education.
Currently, there exist community colleges (two year comprehensive with local tax support), state
community colleges (no local tax support), free standing technical colleges, university branch*and community technical colleges operated by universities in metropolitan areas. In addition, an
issue which further complicatei: the -system- is the matter of eight technical colleges being located
with university branches. The sum total of two-year educational units is 59.
At some point consideration should be given to eliminating the duplication of adult education
services between the joint vocational school and the technical college. This is an issue the state
must ultimately determine, but currently there is a duplication between the college's and JVS
offerings in the evening program.
In addressing the Managing for the Futures issues. Jefferson Technical College believes that
circumstances caused the college Board of Trustees, administration, faculty and staff to examine
operational efficicnc .1.-d effectiveness.
Enrollment dek::Ire, .n :ne mid19Ws s:Jused the rutcheting down mechanism within the
Ohio Board of Regents s,nsid!. sstem :o he :nitiated Added to the reduction in base FTEs was
0 0 ,r
the elimination of practical nursing students who were inadvertently included in the college's base
calculations. Currently. with the state reductions in subsidy, the college actually received 1.5% less
subsidy in 1992 than it did in 1988. At the same time, college enrollment has increased by
29.6%.
Another money issue is the whole capital improvements process including the allocation of
funding for technical equipment. It appear as though there is a philosophy at the Regents at this
time that because the college campuses appear to be so well equipped. there is no real reason for
the institutions to continue to receive a certain level of funding in that area. What the Regents and
the public must understand is that there is a continuing need for new equipment if the college is
going to stay on the cutting edge of technology and provide the students with the essential
experiences they will need to be competitive in the workforce.
By instituting cost-saving actions and increasing tuition to the present level of $30 per
quarter credit hour (the second lowest rate among all two -year colleges in the state), the college
has managed to maintain four centers of service to the community: (1) credit-level education
leading to degrees and certificates; (2) training for business and industry; (3) opportunities for
growth through remedial and developmental education. and avocational programming; and (4)
offering use of facilities free of charge to non-profit community groups.
While the college believes it can always improve efficiency and effectiveness in operations,
clearly the events and circumstances of the past five years required the Board of Trustees,
administration, faculty and staff to begin employing efficient and effective measure to manage the
college. The Managing for the Future's Task Force at Jeff Tech acknowledges the college's efforts
as well as its intent to continue building efficiencies while maintairing overall effectiveness.
Jefferson Technical College's Managing for the Future's Task Force report was developed
along divisional lines of instructional service,. student services, business services and
administrative services Some of the ke. recommendations/observations follow while the entirely
of their reports are located after the executi, oserviey.
The key recommendations from the instructional sen.ices cli,Ision are:
, I 1 The legislature must understand the two-year college concept thoroughly, being able to
differentiate between universityeducation and K through 12. This issue is very important as the
two-year institutions respond to remedial/developmentalneeds 1f its patrons.
(2) The Ohio Board of Regents must identify staff who have experience and knowledge
working in and for two-year institutions and who can work with the institutions as they pursue
rneeurg their goals and objectives
(3) The Collective Bargaining Law and the operation of the State Employees Relations Board
should be evaluated to determine whether the law and the board have achieved and maintained the
balance between labors demands and wants and the institutions ability to respond to employees
while continuing to respond to thc demands for services within the tisca: restraints. Tax supported
institutions chartered by the state to serve the public interest should not be subjected to the same
labor laws and practices which exist in profit-oriented production industries.
(4) The Instructional Services Committee endorses the OTCCA Subsidy Proposal submittli,
on April 16 by the association to the chancellor. This proposal identifies a number of needed
changes. including: (a) calling for the simplification of the funding formulas; (b) resolving
inequities in instructional support among levels: (c) changing the connection between state funding
and student tuition; and (d) refining the funding factors to reflect the current services realities.
The Student Services Division made several recommendations, including:
(1) The college must communicate more often with greater clarity regarding its affirmative
action policy and plan.
(2) The college staff and faculty must make greater effort to expand visibility in the
community.
( 3 The college ,tiff ,hould employ a more assertive approach to recruiting credit level
students from the ranks of people attending hon-,.7edit ,ontinuing education courses
(4) The health technologies programs admissions process should be communicated to the
public to help them understand the prospects/opportunities available, the enrollment caps (based on
clinic?' sites) and the level of performance required of graduates to pass licensing exams.
The Business Services Subcommiree's recommendations, which provide significant
information and data to support the achieved efficient/effective operation of the college as well as
identify opportunities for improvement, include:
(1) Between FY89 and FY92, the college was able to reduce the percentage the
salary/benefits represent to the total budget from 77.93% to 75.58%.
(2) The college has attempted to follow the OBR 60/40 guidelines from the two-year
operating manual where possible providing for 60% of the instruction in a program to be offered
by lull-time faculty and 40% to be done by part -time faculty. Accrediting agency requirements
vary, but can dictate the number of full-time faculty required for a program and the maximum
number of students who can enroll.
(3) During the 1989-92 period, the college averaged paying $49,885 for legal fees associated
with the cost of collective bargaining. For the years 1989 and 1992, when bargaining actually
occurred, the rate was $54,624. In the non-bargaining years of 1990 and 1991, the cost was
$45,147. In addition, the costs do not reflect the cost of time spent by staff members processing
grievances, unfair labor charges and law suits.
(4) Full -time staffing has been assessed continuously over the past few years. In 1989, the
college administration decided that as full-time employees left the college, replacement would be
determined on a case-by-case basis. In 1989, the college employed 99 full-time employees. In
1992. that number had been reduced to 93. This reduction was accomplished as enrollment grew
from 973 FTEs to 1.214 FTEs. The college has employed more part-time employees and increased
productivity through the more extensive u'e ,:omputers
The Administrative Services Subcommittee'i recommendations include:
( I i Establish a labor/management team to address various college problems/concerns and to
make recommendations for the future.
(2) Develop some measure of productivity that can be compared to some national norm.
(3) Review the cost of processing payroll out-house vs. in-house.
(4) Emphasize the high cost of the collective bargaining process.
Kent State UniversityKent, Ohio
Theodore V. BoydUniversity TrusteeRadio Station WFIBC
Robert R. BroadbentUniversity Trustee
Dr. Carol A. CartwrightPresidentKent State University
Vincent A. C.hiarucciPresident d Chief OperatingOfficerFiggie International
Donald Clark, Circulation Mgr.Akron Beacon Journal
R. Douglas Cowan, PresidentDavey Tree Evert Company
Barbara Hiney, OwnerThe Bookhound
Mrs. Ann IL Izant, ChairTrumbull Savings ci Loan
Larry Kelley, Vice PresidentBusiness dr FinanceKent State University
Charles B. Scheuer, ChairV.P., Human Resources drCorporate Service GroupDiebold
REPORT
OF THE KENT STATE UNIVERSITYMANAGING FOR THE FUTURE
TASK FORCE
MAY 1992
EXECUTIVE SUMMARY
REPORT OF THE KENT STATE UNIVERSITYMANAGING FOR THE FUTURE TASK FORCE
Background
Kent State University'sManaging for the Future Task Force embraced
the opportunityprovided 1.y the Ohio Board of Regents to contribute
tp an examination of the forces that influence higher education
costs and an accompanying exploration of cost-containment
strategies. Upon receiving the charge to fov-, An institutional task
force, the newly formed administration ,f President Carol A.
Cartwright had already begun an exhaustive re-evaluation of the
University's structure and resources, an initiative which became
more pressing as the fiscal dilemma facing the state unfolded.
Eight leading members of the northeast Ohio business and civic
comm.nities, including two current members of the board served with
President Cartwright and Vice President for Business and Finance
Lawrence R. Kelley on Kent's Managing for the Future Task Force.
Members conducted site visits to a variety of campus operations and
received extensive background information about the structure and
functioning of the eight-campus Kent State University system, with
particular emphasis on the budget and Ohio's policies for funding
higher education.
Task Force Cites Initiatives as Potential NViaonal Models
Kent's Managing for the Future Task Force deemed the University's
efforts in two areas as holding particular promise for use at the
state and national levels, and as Kent1.1 most important
contributions to the statewide Managing for the Future effort: (1)
A highly sophisticated Energy Management System that uses state-of-
the-art computer technology to control heating, ventilating, and
air conditioning in campus buildings, resulting in savings in
excess of $3.5 million. (2) A "department-centered" approach to
evaluating faculty contributions. Results of the pilot Faculty
Productivity study indicate that this approach yields a far more
accurate portrait of faculty life than the traditional method,
which uses the individual faculty member as the unit of analysis.
Energy Management System: Computerized Conservation Works
Kent's Energy Management System, a Johnson 85/40 Control system
overseeing approximately 3,800 control points in thirty-nine
i
buildings, works via a sophisticated network of sensors inoperation twenty-four hours a day, seven days a week. In additionto controlling HVAC, the computer system monitors critical buildingfunctions, providing the earliest possible alert to fires, floods,and technical problems that could, if undetected, cause significantdamage to facilities and disruption of services.
As of the end of fiscal year 1990-91, the Office of FacilitiesPlanning and Operations reported that the EMS and other energy-related measures set in motion since the mid-seventies haveresulted in a 28 percent reduction in energy use on campus.Conservatively, this translates to a savings of $3.5 million inenergy costs. Given the increase in students, faculty and staffsince then, as well as a dramatic increase in the use of computers,copiers, and other technology, the task force recognized this as arem,rkable accomplishment that warrants consideration as a modelfor institutions in Ohio and nationwide.
New Approach to Assessing Faculty Contributions is Indicated
In view of the fact that personnel costs comprise more than three-quarters of all higher education expenditures (from the Report ofthe Study Committee on Faculty Workload for the Managing for theFuture Task Force), Kent's task force was adamart that a re-evaluation of human resources was equally, if not more, importantthan its examination of physical resources and operations. Thus, aKent State University Faculty Productivity Report was endorsed.The study tested a new means of assessing the many and variedcontributions of faculty members by using the academic departmentas the unit of analysis and by incorporating the broadeneddefinition of scholarship advocated by Dr. Ernest Boyer in"Scholarship Reconsidered: Priorities of the Professoriate."
While the University as a whole pursues a stated mission,individual departments, schools, and, in Kent's case, RegionalCampuses, contribute to that mission in a variety of ways. Blendingand balancing the special talents of individual faculty members inpursuit of the University's mission is carried out at thedepartmental level. This is the most efficient way of ensuring thatall responsibilities to students are met, all accreditationmandates are fulfilled, and that the differing demands of courses-- from small graduate labs to large undergraduate lectures -- arealso taken into account.
The study included the development of a prototype FacultyProductivity Work Sheet for use at Kent and a pilot study of theapproach. Preliminary results indicate that the department is, infact, an effective and valid unit of analysis, one which helpsconvey the complexity and diversity of faculty activities.
ii
3 0 2
The pilot study focused on six units whoseindividual missions vary
greatly: the School of Art, the Department of English, the School',
of Nursing, the Department of Physics, the Department of
Psychology, and the Salem Regional Campus.
Data generated by Kent's faculty productivity study indicate that:
Consistent with well-documented state and national normative
data, faculty members, regardless of rank, devote more than half
of their professional time to instruction-related activities,
with percentagesvarying as a clear function of departmental
miss on.
Contrary to perceptions that most college and university faculty
members hold research, publication, and individual interests
above student instruction, Kent faculty, on average, devoted
less than one-third of their professional time to research and
other activities classified under the broad category of
"scholarship." As expected, differences in research activity
among units varied according to departmental mission.
Kent remains committed to refining and further testing the
promising format introduced in this new approach to documenting
faculty contributions.
Revsnue Enhancament Must Accompany Cost Cutting
Results of the task force's six-month institutional review support
the value of ongoing assessment of the effectiveness and efficiency
of all University resources. The Task Force endorsed a
continuation of efforts to educate the campus community about the
'efficient use of resources.
While the task force was impressed by the scope of recent cost-
cutting measures, members felt strongly that revenue enhancement
efforts must be pursued with equal vigor. The development of a
stable source(s) of revenue was viewed as essential for the long-
term viability of academic programs and services. In short:
Universities such as Kent Are working diligently and creatively to
streamline operations and contain costs. However, Kent and its
counterparts in Ohio and nationwide are rapidly approaching a cost-
cutting threshold beyond which the quality of education will be
compromised.
At the heart of this dilemma is a fundamental public policy issue
that must be resolved at the state-government level, according to
Task Force members. While Ohio's higher education budget shrinks,
public colleges and universities are expected to accept all
qualified students and provide them with high-quality instruction
and services -- without a corresponding mandate to increase
411
3j3
students' share of the cost. Kent's task force members were instrong accord that, if unaltered, this situation will result insignificant erosion of the public higher education system, and willimpede Ohio's ability to compete regionally, nationally, andglobally for years to come.
Because the state's ability to assume a greater share of the costof higher education is not likely to increase dramatically in theforeseeable future, task force members found it imperative thatefforts to make a wide range of scholarships and other financialaid available to Ohio's best and brightest be expanded. Attractingpr:.vate support will be a major factor in keeping access to highereducation open to as many students as possible.
Make Priority Setting a Priority
Drawing on years of experience in the business arena, task forcemembers affirmed the importance of setting priorities as an all-important prelude to budget allocation and cost-cutting action.At Kent, a commitment to priority setting is most evident in theUniversity Priorities and Budget Advisory Committee (UPBAC), acommittee of faculty, administrative, and civil service staff, andstudents who provide feedback to President Carol A. Cartwright ona wide range of budgetary and planning issues. The task forcestrongly endorsed the establishment of such representative groupsas an effective internal resource for colleges and universities.
The task force found the UPBAC particularly suited to the task of"sharpening the focus" of the Kent State University MissionStatement, a current project under the direction of the UniversityProvost and UPBAC Chair. UPBAC members are engaged in an in-depthanalysis of the University's mission; the result of which will bea series of specific goal statements for use in guiding the plansof departments, schools, colleges, and the University as a whole.Task force members were enthusiastic about the utility of such atool in the University's continuing efforts to streamlineoperations.
Balance Rewards for Teaching, Research, and Service
Universities are in the business of preparing citizens forsuccessful, responsible participation in a complex society. Thus,the quest for maximum efficiency in resource allocation must betempered by vigilance in preserving the quality of programs andservices for students. The high quality of the education that Kentand its counterparts provide is, in large part, a function of thevaried skills, zchievements, and dedication of faculty members.
Nevertheless, questions persist about the quality and quantity offaculty work, and about the public perception that research takesprecedence over teaching. To attract, retain, and encourage faculty
iv
304
members of the highest caliber, and to make a definitive statement
about the value placed on teaching, Kent instituted a dual-category
merit review system, which is discussed in this report. The system,
which employs separate "merit pools" for Teaching/Service
(including academic advising) and Research/Scholarly Activity
(including creative performance/showing), recognizes that teaching
and research are equally important and complementary components of
a high-quality educational experience.
Recommendations and Conclusions
While members of Kent's Managing for the Future Task Force were
initially reluctant to give advice outside their areas of
expertise, the extensive background information they received about
Kent and higher education in Ohio, coupled with hours of on-site
examinations of University operations, allowed them to reach a
strong consensus on a number of issues.
The task force felt strongly that the price-controlled economy
under which Ohio's public colleges and universities are forced to
operate should be discontinued (i.e. fee caps are inappropriate).
Instead, the price of higher education should be determined
according to its market value, with due consideration for
maintaining access and enhancing financial aid and scholarship
support.
Another area of strong agreement centered on the critical need for 0revenue enhancement strategies, which were considered as important
as cost-containment measures. Task force members felt this was an
area that has been neglected, and suggested that serious
consideration be given to such measures as a state-tax credit for
contributions to colleges and universities; a variable income-tax
rate to be activated only during state tax-revenue shortfalls; and
a gasoline tax earmarked for higher education. Revenue-enhancement
measures need not be confined to tax matters. For example, it was
suggested that a cap be placed on individual lottery winnings, with
proceeds above the cap assigned to public education.
The task force made recommendations for further consideration by
the University. They noted that from the view of experts outside
of the University, the following ideas appear worthy of further
review and analysis.
Clarify the relationship between the Kent Campus and the
Regional Campuses to eliminate any redundancy of staff
functions.
Consider pooling the University's insurance risk with other
universities, possibly by using a single ca%rier with individual
ratings for each university. For example, Kent and the sixteen
other Cleveland-area public and private colleges and
3
universities that constitute the Cleveland Commission on HigherEducation are exploring the possibility of jointly purchasinghealth insurance for their employees (the combined cost of whichhas reached a staggering $43 million).
Adjust the worker's compensation premium the University mustpay so that the University acts as a reimbursing employer, asit does for unemployment ccmpensation.
Move to a system of employee contributions to group healthinsurance, which would be more in line with emerging industrystandards. Focus on covering catastrophic illness, with lessconcentration on first-dollar type of coverage.
Re-evaluate the credit -hour pricing structure.
Consider using bank lack boxes instead of processing allpayments through the Bursar's Office.
Centralize travel costs.
Upgrade systems wherever possible to realize all efficiencies.
Explore outsourcing of services that might be performedequally, if not more, efficiently off campus.
Reduce and/or phase out any auxiliary unit whose relationshipto the academic and service missions of the University is weak.
Raise charges for the use of facilities that service a largeproportion of nonstudents to market levels.
Create new methods of promoting Kent's numerous successes. Forexample, consider a print-media equivalent of the University'sRadio News Line.
State-level actions advanced by the task force include:
Share physical and human resources among as many colleges anduniversities in the region as possible. For example, task forgemembers cited the success of such interuniversity partnershipsas the Northeastern Ohio Universities College of Medicine, aconsortium of Kent, the University of Akron, and YoungstownState University that enables qualified students to earncombined bachelor of science and doctor of medicine degrees insix years; WNEO/WEAO (public television channels 45/49),operated by the Northeastern Educational Television of Ohio,Inc., another consortium of Kent, the University of Akron, andYoungstown University; and the international business schoolunder joint development by Kent, Cleveland State University, theUniversity of Akron, and Youngstown State University. The taskforce also recommended the expansion of dual-admissions
vi
agreements and other partnerships with area community colleges.0Kent's dual-admissions agreements include Cuyahoga Community
College (the first of its kind in Ohio and a relationship that
has since been extended to include a minority-teacher
recruitment project and a faculty-staff development program),
Lorain Community College, and Lakeland Community College.
12,Streamline the paper-laden, time-consuming capital projects
funding process. Capital bills often include funding for
community projects,resulting in a debt service that draws
against funds available for higher education.
a Involve local business and civic leaders in problem solving
whenever possible.
Encourage state retirement systems to index retirees' benefits
according to inflation. Have retirees pay more for their health
insurance to reduce universities' contributions.
Consolidate data reporting for Board of Regents and frderal data
reporting.
It was concluded that institutionalreviews such as those conducted
as part of the statewide Managing for the Future initiative should
be put into practice on an ongoing, cyclical basis. Such advisory
committees are valuable as long-term, collaborative efforts. The
informational framework, as well as the mutual trust and respect,
developed during such ventures should be maintained and nurtured as
an important source of external insight and support. Kent's task
force members, who came to view themselves as new advocates for
higher education, concluded their six-month association with an
informal agreement to hold regular follow-up meetings.
Lakeland Community CollegeMentor, Ohio
Co-Chairs
Paul J. Beddia, The Lincoln Electric Company
Ellen Cantor, Lake County Department o f Human Services
Dana Dennis, Parker-Hannifin Corporation
Carol Zarlenga, Zarknga Industries, Inc.
Diane Howar4 Lake Hospital Systems
W. R. Moyer, Member, Lakeland Board of Trustees
OLarry Aufderheide, Lakeland Community College
John Kesler, Lakeland Faculty Association
Christine Haskins, Lakeland StaffAssociation
Ex-Officios
Ruth Zollinger, Lakeland Community College
Gerard Reis, Lakeland Community College
Richard Basic& Lakeland Faculty Association
Richard Tomcbak, Lakeland Faculty Association
Nancy McSteen, Lakeland StaffAssociation
Donna inn Lakeland Student Union Board of Representatives
31'
2. ammuy observations
The process for institutional review was comprehensive
wide-ranging, and included significant numbers of C011er0=11
community personnel.Information was. obtained through
methodologies and included responses by trustees, and by unit
administrators,faculty, and staff; in addition, data from
Regents reports and a variety of institutional reports added
substance to observations and policy
Representatives from the community serving on the steering
committee provided external perspectives on issues and
information.The College has already addressed the possibility of a
future of severely constrained financial resources by
developing a set of seven key institutional prioritier'. These
are accompanied by a commitment to plan to maintain the
primary instructionalgoals of the mission. The College
recognizes that cost containment may involve reduction of
services which have contributed to quality opportunities for
students and th. community. All units reporting to the
Institutional Review Committee clearly stated their concept of
service and performance. In each case, commitment to
achieving the goals of the College mission was uppermost and
regarded as appropriate. The definitions of quality resulting
from the review reflect campus-wide recognition that quality
service depends upon a system of operations provided across
all units involving all constituencies. There is a clear
understanding about productivity in the context of
accomplishing the mission, with all units reporting that it
consisted of the effort expended to achieve goals and involved
attention to those measurable results which demonstrate that
goals are being met.It is clear that faculty are committed to the teaching
mission of the College and that their primary responsibility
is quality instruction. Faculty are productive not only in
terms of broad institutional data measures but also in terms
of departmental,institutional, and community service, and
research activities.Faculty productivity to be evaluated
fully must be seen in the context of individual responsibility
within a specific discipline organized for specific purposes,
which vary across disciplines and departments.
Faculty workload is clearly defined and understood
across the campus and there are clear accountability
standards. It is recommended that faculty workload and
productivity are questions properly managed within the context
of this institution.*history and developing culture, and,
moreover, that Lakeland faculty,administratIrr, and trustees
should remain the appropriate parties to give definition to
faculty workload and productivity.
Institutionalgovernance at the College has become well-
established and effective in recent years. Leadership and
Accountabilitybeginning with the Board of Trustees is clearly
ETU COPY AVAILABLE
3u,3
9
defined, as are the authority and responsibilities of the
president, the administrators, and the faculty association.
There are effective structures in place for participative
policy advisement in academic and other institutional areas.
Forces influencing institutional costs have been
identified, with focus on the people-intensive character of
the comprehensive community college mission. Strategies for
revenue enhancement and cost containment have been developed
3rd implemented, and plans for additional strategies are being
considered. Additiona; recommendations are being made by the
Institutional Review Committee for evaluating effectiveness
and efficiency in specific areas.Eight specific
recommendations for change at the state
level have been made, with emphasis on those changes which
would strengthen the College's ability to communicate with the
state, to plan, and to operate in a future of diminishing
financial resources and more complex regulation.
The sections which follow present detailed analysis and
data in support of the points established.
10
3. Narrative
a. Relationship between quality and cost: OverView
The Lakeland Community College mission encompasses six
goals primary among which are those providing for the academic
curricula and technical programs which sustain the padsfor which the College was chartered (Appendix 8). Each unit
of the institution is organized to contribute to the
accomplishment of thd mission goals. The measure of
performance appropriate for the College is how effectively its
units function in accomplishing the mission.Quality is by charter and mission primarily achievable
through effort made to deliver effective educational
opportunities. Delivery involves the degree to which
opportunities are maximized and the .extent to which public
access is made available. Levels of service have
traditionally been determined by the College's ability to
provide financial support.Educational opportunities consist of programs and their
components. Those include curricula, faculty, and
instructional technologies. At Lakeland, "faculty" refers not
only to traditional classroom teactzrs, but also to
counselors, librarians, and developmental specialists.
"Technologies" include equipment for training students as well
as delivery method--i.e., lecture, lab, tutorial. All those
components for the most part expand in direct proportion to
costs. Establishment and maintenance of a well-qualified
faculty, an appropriate array of technologies, and a
responsive curriculum are quality achievements in support of
mission which are primarily dependent on the college's having
adequate financial resources.Also, in direct proportion to cost is effort made to
provide access. Access refers to the kind and degree of
pathways .available for public pursuit of educational
opportunities. The College's role has been to both inviteparticipation and to respond to demand. Demand, from students
at all stages, is typically driven by preferences for times
of service, by academic ability levels, by objectives, by
ability to pay, and, to a lesser extent, by the perception of
safety, reputation, or quality of life aspects. In times of
high demand and strong financial resource support, the College
has made access a key priority. Liberal scheduling of
classes, close attention to entry-level placement,
comprehensive financial aid programs, extended hours for
admission and registration are quality ichicvements in support
of mission whicn are primarily dcramdent on the college's
raving adequate financial resources.Thus far, quality has been discussed in terms of the
-.ids and degrees of services which can incur significant
::sts. However. quality is also demonstrated by efforts made
assess e:fect:veness of de::very components, and efforts
11
In this case do not necessarily expand in direct proportion to
costs. In many cases, heaviest costs are incurred at start-
up points and become negligible during maintenance phases.
For example, an academic probation policy is established by
faculty effort which is generally an addition to primary
workload. Thereafter, this effective quality control
mechanism is maintained at relatively low cost. Again, a
formal transfer articulation agreement between the college and
a state university may incur start-up costs--e.g.
administrative timP--hut thereafter maintenance costs are
negligible. Quality mechanisms of these kinds are highly
economical means of supporting mission.

0
.....
.........
SUMMARY
Recommendations To The State
Our task force recommends that Ohio's state-supported higher education,
to address serious quality and cost issues through the appropriate boards,
agencies and the legislature, should consider the following initiatives:
*Undertake an open-minded study of the potential for a more
cost-effective delivery system through state-funded community colleges, rather
than technical colleges and branch campuses of state universities.
*Increase the actual teaching load for full-time faculty, directly
reversing trends of rising faculty costs and decluAling teaching
responsibilities.
*Link some faculty, staff and administrative compensation to performance,
rather than rolling all increases into base pay.
*Use evolving communications technology on a wider, deeper scale to
deliver higher education in nontraditional and creative ways, with greater
institutional networking and sharing.
*Provide relief from higher costs forced on institutions by legislation
and regulation.
*Review academic programs regularly and honestly, seriously challenging
those that cannot be cost-justified.
*Simplify the requirements state institutions face in dealing with the
state bureaucracy.
*Restore sovereign immunity to state institutions, reducing insurance and
legal expenses.
*Expand the use of pools for such common needs as insurance and
purchasing.
3 4
*Contract additional campus services to outside vendors.
*Change banking laws to relax reserve requirements on state deposits,
producing additional interest revenue
* * *
2
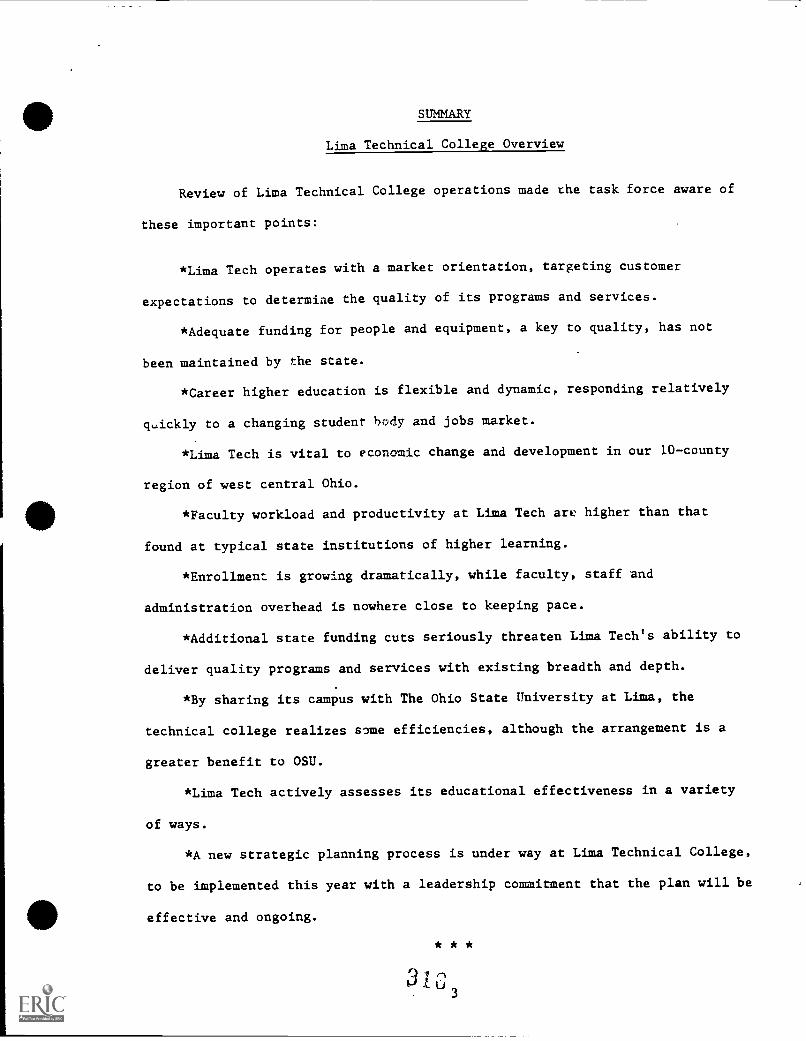
SUMMARY
Lima Technical College Overview
Review of Lima Technical College operations made the task force aware of
these important points:
*Lima Tech operates with a market orientation, targeting customer
expectations to determine the quality of its programs and services.
*Adequate funding for people and equipment, a key to quality, has not
been maintained by the state.
*Career higher education is flexible and dynamic, responding relatively
quickly to a changing student body and jobs market.
*Lima Tech is vital to economic change and development in our 10-county
region of west central Ohio.
*Faculty workload and productivity at Lima Tech are higher than that
found at typical state institutions of higher learning.
*Enrollment is growing dramatically, while faculty, staff and
administration overhead is nowhere close to keeping pace.
*Additional state funding cuts seriously threaten Lima Tech's ability to
deliver quality programs and services with existing breadth and depth.
*By sharing its campus with The Ohio State University at Lima, the
technical college realizes same efficiencies, although the arrangement is a
greater benefit to OSU.
*Lima Tech actively assesses its educational effectiveness in a variety
of ways.
*A new strategic planning process is under way at Lima Technical College,
to be implemented this year with a leadership commitment that the plan will be
effective and ongoing.
* * *
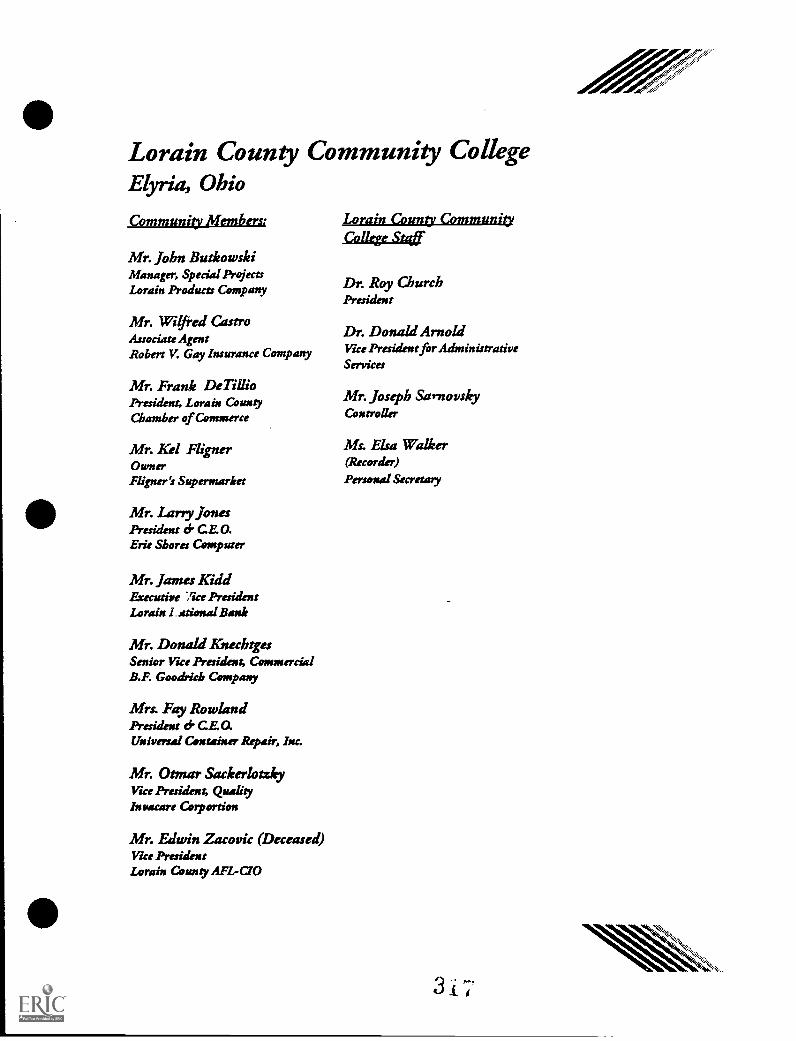
Lorain County Community CollegeElyria, Ohio
Community Members; Lorain County CommunityCollege Staff
Mr. John ButkowskiManager, Special Proj ectsLorain Products Company
Mr. Wilfred CastroAssociate AgentRobert V. Gay Insurance Company
Mr. Frank DeTillioPresident, Lorain CountyChamber of Commerce
Mr. Kel FlignerOwnerFligner's Supermarket
Mr. Lany JonesPresident d' CEO.Erie Shores Computer
Mr. James KiddExecutive ;'ice PresidentLorain I ational Bank
Mr. Donald KnechtgesSenior Vice President, CommercialB.F. Goodrich Company
Mrs. Fay RowlandPresident a CEO.Universal Container Repair, Inc.
Mr. Omar SackerlotzleyVice President, QualityInvacare Corportion
Mr. Edwin Zacovic (Deceased)Vice PresidentLorain County AFL-C10
Dr. Roy ChurchPresident
Dr. Donald ArnoldVice President.* AdministrativeServices
Mr. Joseph SarnovskyController
Ms. Elsa Walker(Recorder)
Personal Secretary
317
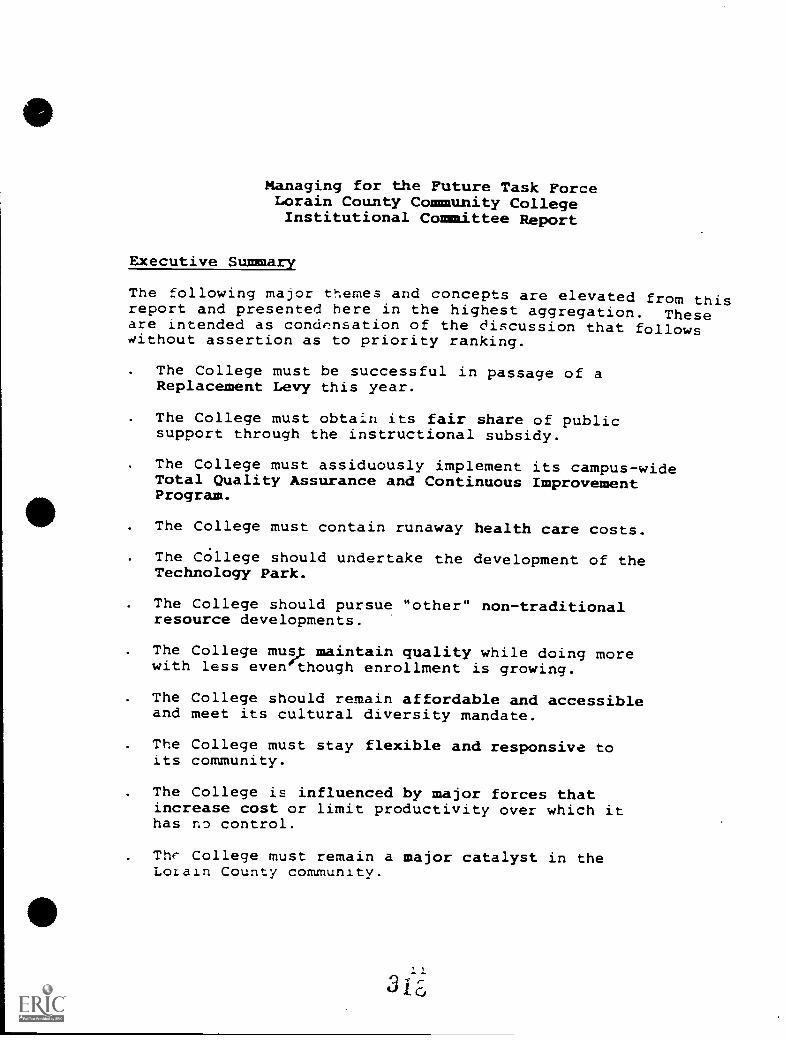
Managing for the Future Task ForceLorain County Community CollegeInstitutional Committee Report
Executive Summary
The following major themes and concepts are elevated from thisreport and presented here in the highest aggregation. Theseare intended as condensation of the discussion that followswithout assertion as to priority ranking.
The College must be successful in passage of aReplacement Levy this year.
. The College must obtain its fair share of publicsupport through the instructional subsidy.
. The College must assiduously implement its campus-wideTotal Quality Assurance and Continuous ImprovementProgram.
. The College must contain runaway health care costs.
. The College should undertake the development of theTechnology Park.
. The College should pursue "other" non-traditionalresource developments.
. The College must maintain quality while doing morewith less even'though enrollment is growing.
. The College should remain affordable and accessibleand meet its cultural diversity mandate.
. The College must stay flexible and responsive toits community.
. The College is influenced by major forces thatincrease cost or limit productivity over which ithas no control.
. Thr College must remain a major catalyst in theLorain County community.
Marion Technical CollegeMarion, Ohio
Mr. James Traveline, SuperintendentMarion County Schools
Mr. Steve Futrea President d CEO.Bank One, Marion
Mr. Paul DumanDirector of Technology d Quality PlanningWhirlpool CorporationMarion Division
Mr. Bill Smith, PresidentCommunity MedCenter Hospital
J. Richard Blyson, PresidentMarion Technical College
Doug Boyer, Vice PresidentAdministrative d Financial ServicesMarion Technical College
3 -; t1

MARION TECHNICAL COLLEGEOHIO BOARD OF REGENTS (OBR) MANAGING FOR THE FUTURE REPORT
TASK FORCE PROCESS
Each vice president gathered information to address task
force questions. The information was presented to a group oflocal leaders from business, industry, service and educationorganizations. Their comments and suggestions were incorporatedat both the draft and final stages.
MARION TECHNICAL COLLEGE MANAGING FOR THE FUTURE TASK FORCEPaul Dittmann, Director of Technology andQuality Planning, Whirlpool Corporation
Thomas Ivory, Area President District Executive, BancOhioPhilip W. Smith, Jr., President, MedCenter Hospital
James Traveline, Superintendent, Marion County Schools
FINDINGS AND RECOMMENDATIONS
1. Since nearly half of those in college in Ohio and the nationattend two-year colleges, obviously they believe we are meetingtheir needs well. For Ohio to attract and keep industry andjobs, we must be responsive to employment needs. Our ability torespond quickly to their needs with appropriate programs andservices is directly related to state policies, guidelines andfunding. Education and the system supporting it should bedynamic to allow for ongoing changes.
2. Public colleges were developed initially to provide low costaccess to an education. First and foremost, teaching andkeeping an education affordable, and therefore accessible, mustbe a priority. If constrained resources threaten access, thenineffective programs must be deleted in favor of effective onesrather than taking a shotgun approach to cutting costs. Two-yearcolleges do a tremendous job of providing access to those whoseriously need it.
3. Sweeping changes are needed in an outdated, inappropriatestate funding system. Two-year colleges are extremely costeffective. The system must not reward inefficiency as itcurrently does. Funding should be directly related to graduateemployment so taxes are used to meet needs as opposed to beingbased on historical costs. Consumer priorities need examined andfunding changes made to meet customer needs. Quality is whatever
our customers say it is and quality is dramatically affected byfunding.
4. Two-year colleges' primary focus is on teaching. At a timewhen the state economy is struggling and large numbers of peopleare out of work, the State should maximize its expenditures byplacing higher priorities on efforts focused at teachingemployable skills.
1
3,4
ON AVAILABLE

5. Rules that applied twenty years ago when two-year collegeswere small must change to reflect the fact that nearly half ofOhio's college students are being educated at two-yearcolleges. Policies must encourage the ability to adapt andrespond to Ohio's needs. Major changes are needed intransferability of credits, program approval processes, andfunding.
6. Consolidate rather than duplicate resources by formingCenters of Higher Education on shared campuses. On sharedcampuses the university branches emphasis should be changed tojunior, senior and graduate level course work and allow the moreefficient two-year colleges to serve as associate degreetransfer/feeder institutions. Why duplicate efforts and wasteresources when this syscem actually would serve a great need toprovide improved local access to upper level higher education?
QUALITY AND COST RELATIONSHIP AT MTC
NTC'S PRIORITIES DURING CONSTRAINED RESOURCE TINES
Marion Technical College is a small institution with limitedopportunities to benefit from economy of scale. As a result,efficiency and effectiveness are basic elements in every partof our philosophy and operation. Quality is essential to meetthe needs of increasingly demanding customers. Costs related tofaculty, class size and services offered have very obviousbearing on the quality of programs offered.
Over the past three years, the State has challenged MTC tocontinuously improve its quality and accessibility to recordnumbers of students with fewer and fewer resources. MTCaccepted the challenge by developing strategic plans which focusall college activities in a unified direction. Programs aredeveloped to address key issues such as customer needs/satisfaction, business/industry partnerships, changing mission(from technical to community college), literacy, growth andresulting space needs.
MOVEMENT TOWARD PRIORITIES
MTC's philosophy is one of continual quality improvement ineverything we do. Our purpose is to provide career centeredtechnical education aimed at employment and as a stepping stonein a lifelong education. MTC continues to grow due to ourability to respond quickly to increasing customer needs despitelimits prescribed by state finances and bureaucracies; however,progress toward its goals has slowed.
HOW DOES MTC DEFINE AND MEASURE DUALITY?
Quality at Marion Technicalby our customers, both studentssatisfaction and success is ourand measurements of quality areCentral Association of Collegesaccrediting organizations.
College is ultimately definedand employers. Theirmeasure of quality. Guidelinesalso defined by the Northand Schools (NCA) and other
2
3() A.
Medical Collegeof OhioToledo, Ohio
Robert E ShowalterTask Force ChairmanMember, Medical College of OhioBoard of Trustees
Ashel BryanCommunity RepresentativeFormer ChairmanMedical College of Ohio Board ofTrustees
James freisheim, Ph.D.Professor d ChairmanDept of Biochemistry dMolecular BiologyMedical College of Obio
Stephen Heater, Ea D., OTR/LAssociate Dean & Professor ofOccupational TherapySchool ofAllied HealthMedical College of Obio
Richard Heymann, Jr.Community RepresentativeFormer MemberMedical College of Ohio Board ofTrustees
James HoffmanCommunity RepresentativeMember, Medical College of Obi.Foundation Board
Richard F. Leighton, M.D.Vice President fisr Academic Affairs &Dean of the School of MedicineMedical College of Obio
Frank S. McCullough, M.D.Vice President for Clinical AffairsMedical DirectorMedical College HospitalsMedical College of Ohio
John MinnickVice President firr FinanceMedical College of Obio
Richard RansomCommunity Representative
Emerson Ross, Jr.Vice ChairmanMedical College of Obio Board ofTrustees
Allan Rubin, M.D., Ph.D.Professor d ChairmanDept of OtelanYWI°DHead & Neck SurgeryMedical College of Obio
John SzucbCommunity Representative
Bernhardt ZeiherCommunity Representative
Richard D. Ruppert, M.D.President
William McMillen, Ph.D.Executive Assistant to the President
MANAGING FOR TEE FUTURE
AT TEE MEDICAL COLLEGE OP OHIO
Executive Summary
The Medical College of Ohio endorses efforts by the State ofOhio to offer guidelines for better management of higher educationthroughout the state. The Medical College's Managing for theFuture Task Force has worked for the past six months to coordinatecampus efforts in crucial areas of management and education. Theseareas include goals, educational quality, and institutionalproductivity.
The Task Force's sub-committee on Goals notes that the Collegehas identified realistic and attainable goals which will serve todirect its efforts to fulfill its mission of education, research,and service, and has established a system to implement these goals.
The Task Force's sub-committee on Quality has delineatedasignificant number of key quality areas in academics and hasexamined how each of these areas is influenced and understood byobjective and subjective criteria. The sub-committee notes thatincreased financial incentives could influence quality in certainareas.
The Task Force's sub-committee on Productivity has examinedhow specific academic jobs and results can benefit from increasedproductivity including but not limited to more thorough evaluationsand the introduction of specific evaluation guidelines.
The efforts that the Medical College now undertakes to examineGoals and Productivity will be monitored on a continuing basis bythe Academic Committee of the Board of Trustees and by the Board asa whole with a complete report due annually from the College'sadministrative staff.
322
S
Miami UniversityOxford Ohio
Mr. Todd H Bailey
Dr. B. Derrell Hart
Mr. Richard R. Jordan
Dr. Si csan A Kay
5 Dr. Richard L. Nat&
Mr. John Weld Peck
Dr. Linda Ale-Ridder
Mr. Stephen A Scovic
Mr. Thomas A Simons, Jr.
Dr. Raymond M. White
S
MIAMI UNIVERSITY MANAGING FORTEE FUTURE TASX FORCE REPORT
Z. ZEDWJECSIQX
The State Task Force charged the Miami University Task Force
with the responsibility of determining the extent to which Miami
University could improve its future use of the institution's
professional, financial and physical resources. The Task Force
was implicitly directed to confirm that the resources of the
State of Ohio were being used wisely and efficiently. Where
opportunities were identified by the Task Force to accomplish
greater savings at Miami, those opportunities were to be explored
and presented for consideration wherever the opportunities for
greater efficiencies appeared to be feasible.
As is reported in this document, this Task Force has
attempted to conscientiously and comprehensively discharge the
assignment received from the State Task Force.
A detailed description of the process used by the Miami
University Task Force and the scope of activity undertaken by the
Task Force since August, 1991 was submitted to the State Task
Force on March 21, 1992. The description of that process will
not be repeated here.
The future of Ohio's commitment to high quality public
higher education at a reasonable cost is at stake. Likewise,
nothing less than the future vitality of Ohio's industrial and
service employment base, with the direct contribution to Ohio's
tax revenues necessary to support future educational, social and
infrastructure needs, is at stake.
3
Miami University and the State of Ohio appear to be at a
critical crossroad -- either Ohio will decide that a gradual
decline toward mediocrity will ensue at all levels throughout the
State gr Ohio will more properly conclude, in its own self
interest, that its future prosperity and success lies with a
continuation of the level of public support for high quality
public university education for its citizens necessary to assure
Ohio'a competitive standing within the United States and
internationally. A well educated work force, supported by an
accessible and high quality public university system, will repay
in tax revenue dividends many times over the amount of the
current investment reflected in State support.
During a period of repeated financial emergencies and
continuing contractions in State support, the professionalism of
Miami's faculty, staff and administration has been, in very large
part, preserved and their commitment to the shared mission of
high quality undergraduate instruction has remained intact. In
short, as the Task Force reported on March 21, 1992 to the State 411
level Task Force, the several millions of dollars in cost
reductions implemented to date at Miami have been
disproportionately absorbed by the nonacademic sectors of the
University. However, Miami's faculty have also made sacrifices
and future sacrifices will regrettably be necessary.
Miami's primary focus and mission, through at least the past
30 years, has been quality undergraduate instruction, rather than
a predominant research orientation or graduate school emphasis;
therefore, it has stayed relatively lean and efficient in its use
of resources. Because instruction has been the predominant
emphasis, Miami has not been in a position to avail itself of
extensive grant monies to support research or other academic
initiatives. Therefore, State revenues have been and continue to
be critical in the support of the primary educational mission.
- 2 -
Miami's Task Force is convinced that future cuts in State
support will have adverse and long lasting, if not potentially
permanent, effects on the quality and value of the Miami
educational "product". As discussed herein, that "product" is
hot easily described or quantified -- but that "product" has been
consistently recognized on the national level as being of
extraordinarily high quality, but "delivered" at a reasonable
This noteworthy and extraordinary State resource is the
ai.rect result of generations of effort by dedicated faculty,
staff and administrators -- based on the receipt, in part, of
adeciv levels of support by the citizens of Ohio. In the face
of accountability to the State, Miami has consistently
Camonated sound management of its financial resources. In
:cordance with those practices and values, as discussed herein,
Miami has preserved the primacy of undergraduate teaching while
Absorbing a substantial decrease in the level of State support
over the last two years. From this point forward, however,
future reductions will directly impact the ability to preserve
the accomplishment of that mission. In fact, that point of
beginning to directly compromise the quality of the Miami
educational experience may already have been reached.
The Miami Task Report consists of five parts. The first
portion of the Report addresses the five questions identified by
the State Task Force. As was reported on March 21, 1992 to the
State Task Force, the Miami University Task Force also undertook
a comprehensive review of the entire Miami community by focusing
particular attention on four key operational and/or topical
components: (1) physical facilities, (2) faculty productivity,
(3) academic support services and (4) governmental and regulatory
oversight.
Muskingum Area Technical CollegeZanesville, Ohio
Ms. Tami AllsupPresident; Student Senate
Dr. Richard BartlettDean, Business Division
Dr. Dolores FloriaVice President fir Instruction
Mr. Edward GeigerDean, Training ti. Consulting
Mr. Gene KingVice President Student Services
Mr. Steve PhillipsChairman, Sta f f Senate
Mr. Ronald PrattVice President for Business Services
Mrs. Kay RoachDean, Health, Public Service 6 General Studies Division
Mr. Steve RostekDean, Engineering cir Science Division
Mr. Mitch StillbergerChairman, Faculty Senate
Dr. Lynn WillettPresident
EXECUTIVE SUMMARY OFMANAGING FOR THE FUTURE AT MUSKINGUM AREA TECHNICAL COLLEGE
MAY, 1992
During 1991-1992, Muskingum Area Technical College conducted an institutional study as aresult of guidelines received from the Ohio Board of Regents' Managing for the Future SteeringCommittee. In addition to input from the President's Cabinet and feedback from full-time collegeemployees, the College utilized advisor, committee members, adjunct faculty, and the College'sBoard of Trustees.
Major areas reviewed during this study included the College's mission, cost containment factors,cost reduction/productivity improvement strategies, and quality of programs and services.
As an outcome of the study, the following recommendations were made for the College and forState leaders:
A. Recommendations for the College
1. Eliminate academic programs which are not productive as determined by the College'sannual programmatic evaluation strategy.
2. Freeze all non-faculty hiring and increase the percentage of classes taught by part-timefaculty.
3. Develop methods of evaluating student academic achievement at critical points inacademic programs.
4. Implement measures (see 3. above) in a consistent manner and utilize results for theimprovement of instruction.
5. Implement and carefully monitor health care cost containment programs such asmanaged care, preferred provider organization, and extended care review. Utilizeemployee cost sharing through increasing deductibles and co-payments.
6. Install and maintain building lights with low wattage fluorescent types.7. Establish a surplus property "clearing house" for internal use.8. Expand use of community facilities for added growth rather than new on-campus
construction.9. Implement a variety of facility changes such as: close Littick Hall, utilize two lab
lamps rather than four, add gas-fired heaters for hot water, replace switches withsensors in classrooms/offices, additional roof insulation, and triple pane the windowsurfaces.
10. Charge user fees for services presently free.
B. Recommendations for State Leaders
1. Simplify the subsidy funding formulas and remove inequities in instructional supportamong various subsidy levels.
2. Change the connection between State funding and student tuition; i.e., eliminate"student fee assumption" nomenclature.
3. Change the current buffer system base from 1980-81 to a current rolling three-yearPeriod.
4. Reduce State-mandated requirements for reporting duplicative data by increasingOBOR's ability to retrieve data from current information systems.
5. Advocate for the two-year colleges to receive their "just share" of the Federal Perkinsmoney which is now largely going to the State's vocational schools.
32 9
PROCESS DESCRIPTION
Muskingum Area Technical College's Managing for the Future Committee was
composed of members of the President's Cabinet which included the following
individuals:
Ms. Tami Allsup - President, Student SenateDr. Richard Bartlett - Dean, Business DivisionDr. Dolores Floria - Vice President for InstrnctionMr. Edward Geiger - Dean, Training & ConsultingMr_ Gene. King,- Vice- President for Student ServicesMr. Steve Phillips - Chairman, Staff SenateMr. Ronald Pratt - Vice President for Business ServicesMrs. Kay Roach - Dean, Health, Public Service & General Studies Division
Mr. Steve Rostek - Dean, Engineering & Science DivisionMr. Mitch Stillberger - Chairman, Faculty SenateDr. Lynn Willett - President
Each of these members reviewed the materials submitted to the institution by the
Ohio Board of Regents' Managing for the Future Steering Committee. In addition a wide
range of institutional documents were reviewed, such as: the College's mission statement,
its "Most Likely Scenario" planning document, the Five-Year Institutional Financial Plan,
the Five-Year Program Development Plan, and the North Central Self-Study Report and
Recommendations, along with a wide variety of anecdotal data available to all College
personnel. The outside perspective was provided by input from the College's advisory
committee members, adjunct faculty, and the nine-member Board of Trustees.
The overall questions provided by the state-wide OBOR Steering Committee were
the beginning focus of each subcommittee activity. To a minor extent the effort required
a North Central-like self-study process. This is a process which consists of collecting a
wide variety of institutional data, writing andsubmitting committee reports, and producing
an institutional draft of the various reports. This draft was then disseminated to the
institution for comment and critique and then final recommendations were developed. A
final draft was tfy,. n prepared and submitted to the Board of Trustees on May 18, 1992,
at which time it was reviewed and approved. The report was then submitted to the Ohio
Board of Regents.
1
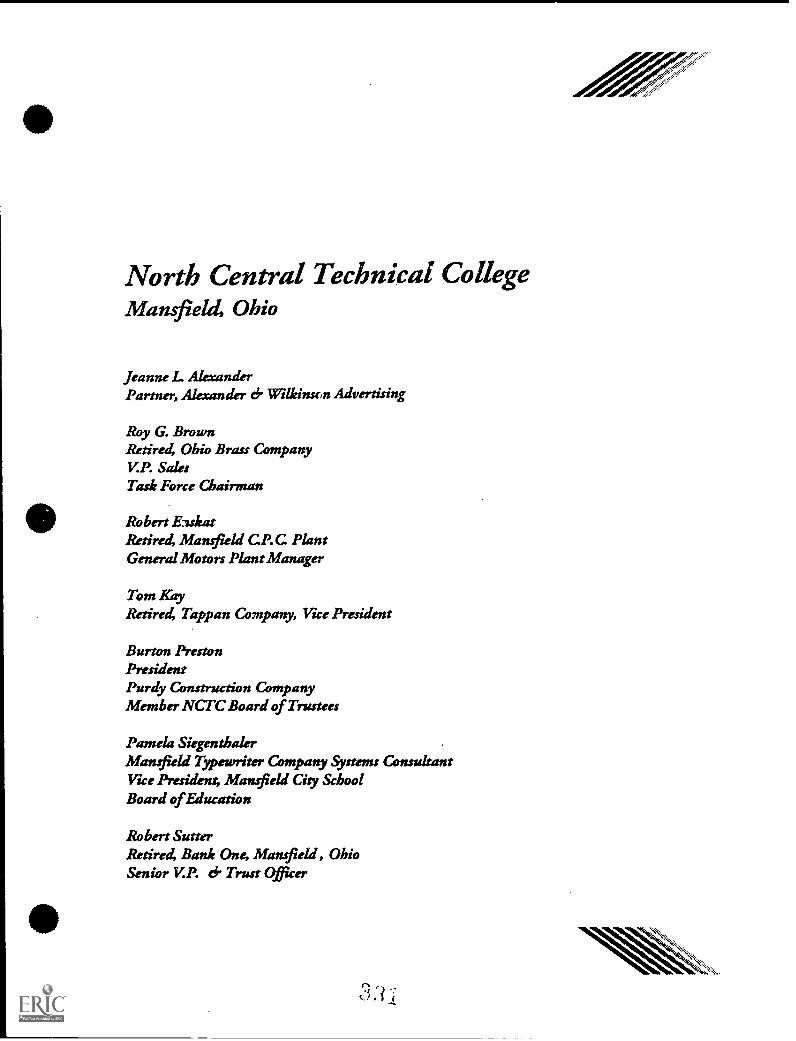
North Central Technical CollegeMansfielt4 Ohio
Jeanne L AlexanderPartner, Alexander Wilkinson Advertising
Roy G. BrownRetire4 Ohio Brass CompanyV.P. SalesTask Force Chairman
Robert ElskatRetire4 Mansfield CP. C PlantGeneral Motors Plant Manager
Tom Kay.Retire4 Tappan Company, Vice President
Burton PrestonPresidentPurdy Construction CompanyMember NCTC Board of Trustees
Pamela SiegenthalerMansfield Typewriter Company Systems ConsultantVice President Mansfield City SchoolBoard of Education
Robert SutterRetire4 Bank One Mansfield, OhioSenior V.P. d Trust Officer
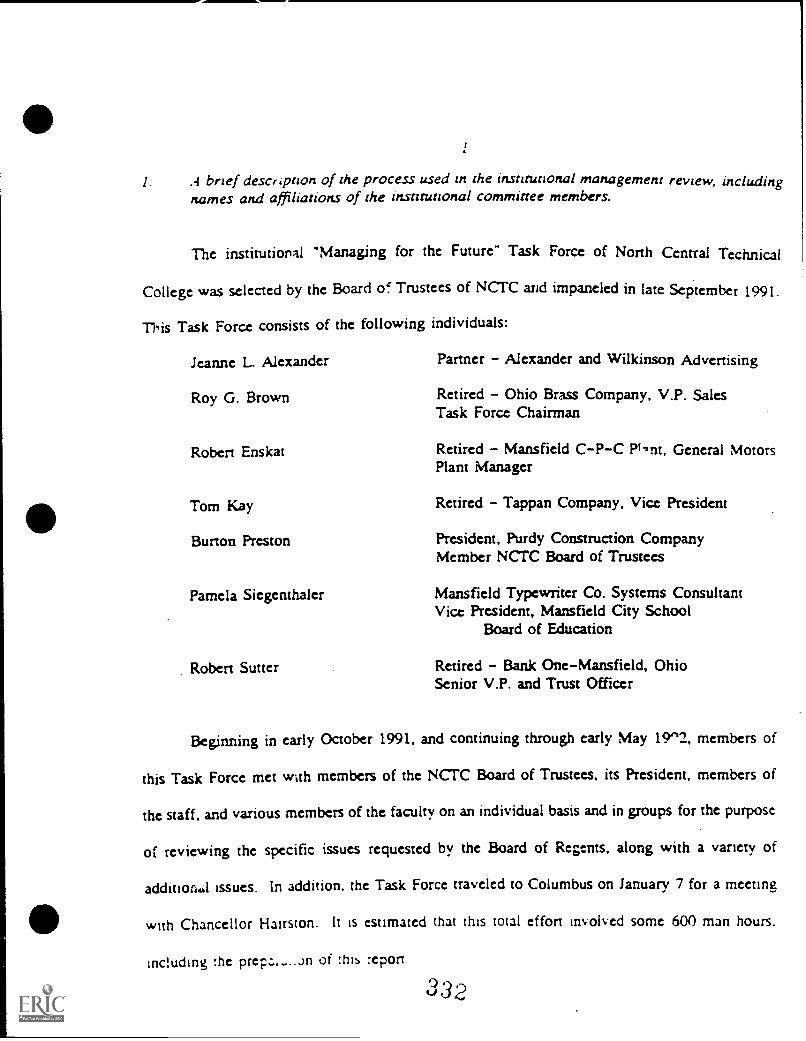
1. .4 brief description of the process used in the institutional management review, includingnames and affiliations of the institutional committee members.
The institutional "Managing for the Future" Task Force of North Central Technical
College was selected by the Board of Trustees of NCTC and impaneled in late September 1991.
This Task Force consists of the following individuals:
Jeanne L. Alexander
Roy G. Brown
Robert Enskat
Tom Kay
Burton Preston
Pamela Siegenthaler
Robert Sutter
Partner - Alexander and Wilkinson Advertising
Retired - Ohio Brass Company, V.P. SalesTask Force Chairman
Retired - Mansfield C-P-C Pi.nt, General MotorsPlant Manager
Retired - Tappan Company, Vice President
President, Purdy Construction CompanyMember NCTC Board of Trustees
Mansfield Typewriter Co. Systems ConsultantVice President, Mansfield City School
Board of Education
Retired - Bank One-Mansfield, OhioSenior V.P. and Trust Officer
Beginning in early October 1991, and continuing through early May 19^2, members of
this Task Force met with members of the NCTC Board of Trustees, its President, members of
the staff, and various members of the faculty on an individual basis and in groups for the purpose
of reviewing the specific issues requested by the Board of Regtnts, along with a variety of
addition.k1 issues. In addition. the Task Force traveled to Columbus on January 7 for a meeting
with Chancellor Hairston. It is estimated that this total effort involved some 600 man hours.
including the preca.....Jn of :his report
332
2
.4 brief description of the findings and recommendations of the institutional managementreview.
NCTC shows by its growth in student enrollment and rebuilding of reserves that it is
providing education to meet the community needs at an economic cost. The Task Force believes
this is essentially due to the trustees having an excellent professional president and qualified staff
all working together. It would be difficult for this Task Force to make specific recommendations
on a further reduction of costs at NCTC that would not have a serious adverse effect on program
quality. The Task Force believes that any major contributions to cost reduction are best
addressed at the state level.
The Task Force understands that the system of higher education, established by the
General Assembly, leaves the Board of Regents in a coordinating rather than a governing
position. We have no desire to take away the independence of individual educational institutions.
However, the Board of Regents must be given authority and must take a more directive role
state edur...-.tinn in many areas. We have outlined our recommendations in the areas of reporting
systems, credit transfer, change to the semester system, and the centralization of services. With
respect to the state's need to achieve maximum utilization of investment in facilities and to make
the best use of closely located campuses and faculties, we have pointed out as an example the
significant duplication of expenditures at NCTC and OSI.J-Ma....field, P^,1 the potential savings
through the utilization of emerging technologies.
The Task Force believes that the existing state system of funding higher education has
no relatioship to what the public expect in the 90's. The industrial and business leadership of
our area need a stronger emphasis on practical skill training necessary to stimulate and promote
economic development, with attention given to programs involved with new jobs, new
technologies, and new business. We believe the public will no longer support tax dollar
expenditures that are not essential to social ind CCOti3illiC development.
The Task Force would like to than:, the Goernor, Board of Regents, and the NCTC
Board of Trustees for the opportunity of serving and the NCTC President aid staff for their
cooperation and assistance in our review of this important matter
Northeastern Ohio UniversitiesCollege of Medicine
Rootstown, OhioTheodore V. Boy4 J.D.Chairman of tbe BoardRadio Station WHBCMember, Board of Trustees
William H. ConsidinePresidentChildren's HospitalMedical Center ofAltron
David E Dixvies PresidentWooster Republican Printing Company 4+PublisherThe Record Courier NewspaperMember, Board of TrusteesMedical Ed. Foundation of the College ofMedicine
.Richard J. Eplawy, M.B.A.Vice President for Business ciFinance
Melvin E Farris, Ph.D.Family Prwctitiosser, ChairmanBoard of Trustees
Barbara A. HineyOwsser,The BooleboundChairman, Board of TrusteesSummer Health Systems
W. Robert Kennedy, Ph.D.Director cfMedical EducationSt. Elisabeth Hospital Medical Center
James R. Boaz, M.B.A.Associate Dean d Special Assistant to thePruidest
Emily P. MackallProfessor 4+ Chair outx EmeritusDept. of EconomicsYoungstown State UniversityFormer Member, Board of TrusteesNortheasters Ohio UniversitiesCollege ofMedicine
Glenn H. MeadowsRetires/ CEOMcNeil CorporationMember, Board of Trustees
Robert E. McArtor, M.D., M.P.H.Professor ChairmanFamily Medicine
J. David SabinePresidentAmbulatory Health Care CorporationMember, Board of TrusteesMedical Education Foundation of theCollege ofMedicine
Michael Schwartz, Ph.D.Professor of Educational AdministrationEducational I've/solve d LeadershipStudiesPresident EmeritusKent State University
Janice M. Spalding, M.D.Assistant DirectorFamily Practice Residency ProgramBarberton Citicesu HospitalAssistant Professor ofantics/FamilyMedicine
Ralph G. Walton, M.D.Chairman, Dept. of PvebiatryWestern Reserve Care System
Ann K Otto, MEdAssistas Vice President
for AdministnetionDirector e Human Services
Barbara F. Sisvittski, M.B.A.Assistant to the President and Demo
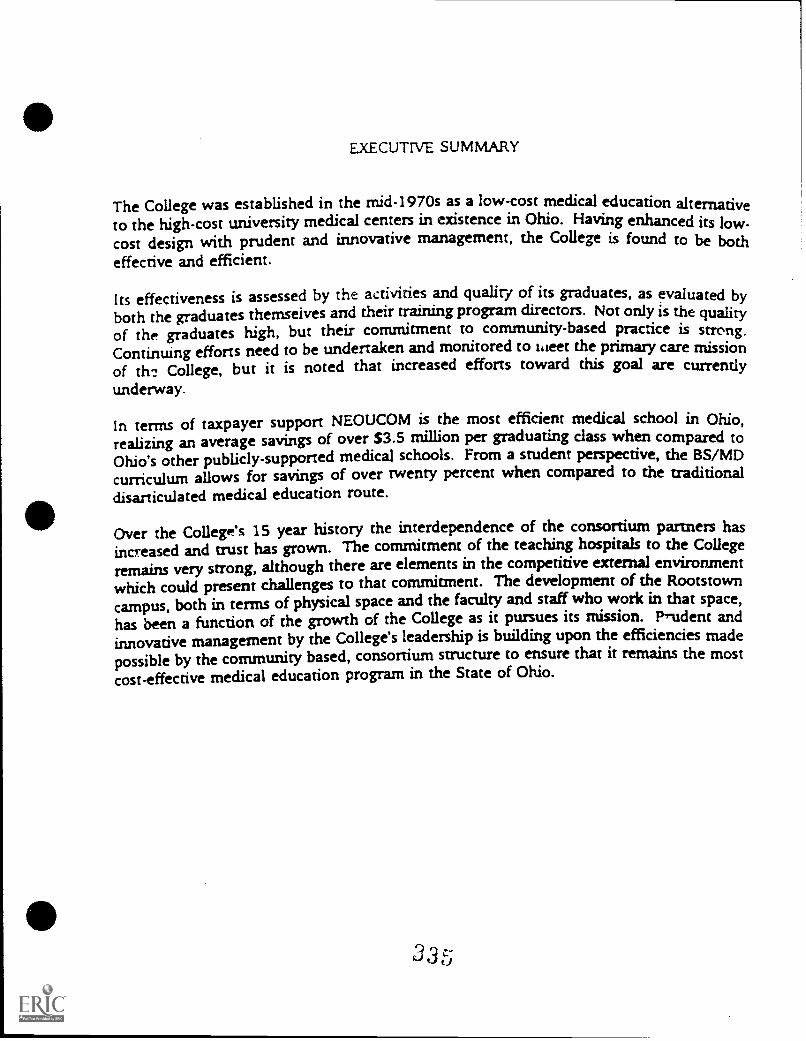
EXECUTIVE SUMMARY
The College was established in the mid-1970s as a low-cost medical education alternativeto the high-cost university medical centers in existence in Ohio. Having enhanced its low-cost design with prudent and innovative management, the College is found to be botheffective and efficient.
Its effectiveness is assessed by the activities and quality of its graduates, as evaluated byboth the graduates themselves and their training program directors. Not only is the qualityof the graduates high, but their commitment to community-based practice is strong.Continuing efforts need to be undertaken and monitored to weer the primary care missionof the College, but it is noted that increased efforts toward this goal are currentlyunderway.
In terms of taxpayer support NEOUCOM is the most efficient medical school in Ohio,realizing an average savings of over $3.5 million per graduating class when compared toOhio's other publicly-supported medical schools. From a student perspective, the BS/MDcurriculum allows for savings of over twenty percent when compared to the traditionaldisarticulated medical education route.
Over the Colleges 15 year history the interdependence of the consortium partners hasincreased and trust has grown. The commitment of the teaching hospitals to the Collegeremains very strong, although there are elements in the competitive external environmentwhich could present challenges to that commitment. The development of the Rootstowncampus, both in terms of physical space and the faculty and staff who work in that space,
has been a function of the growth of the College as it pursues its mission. Prudent andinnovative management by the College's leadership is building upon the efficiencies made
possible by the community based, consortium structure to ensure that it remains the mostcost-effective medical education program in the State of Ohio.
33 c-t)
Northwest Technical CollegeArchbok4 Ohio
Mr. Nelson BellDirector fin. Economic DevelopmentFulton County
Mr. Larry OttoState Bank dr Trust CompanyDefiance, Ohio
Mr. John WilsonSauder Woodworking CompanyArchbole4 Ohio
Mr. Monty CruseWal MartNapoleon, Ohio
Mr. Tim KlineBryan Custom PlasticsBryan, Ohio
Mrs. Debora BarcyDirector, Health Sciences
Mrs. Marken Schumaker, Instructor
Mr. Richard Squire, Instructor
Mr. LeRoy Pool Instructor
Mr. Doug Beck, Supervisor, Buildings dr Grounds
Mr. Kenneth Esterline, Presiden4 NWTCEA, 0EAINEA
Mr. Robert Pfau, Dean of Institutional Advancement
O03
Managing for the Future
A Report of the Task Force at Northwest Technical College
Executive Summary
In March, 1992. President McDougle created a local Managing for the Future task
force, consisting of seven institutional representatives and five area leaders of busi-
ness and industry. On the state level, the task force supports the recommendations
in the letter from Roy Church to Chancellor Elaine Hairston, dated April 10, 1992.
In addition, the task force has developed a series of recommendations for the im-
provement of the efficiency of college operations. The administration of the College
has each of these recommendations and other cost reduction and revenue enhance-
ment possibilities under review and will implement those that appear to be viable, in
an effort to maintain the level of service in the face of potentially severe reductions
in state appropriations.
The quality/cost relationship at Nz.7thwest Technical College has operated to man-
date serious reviews of all programs. Those, like agri-business and construction.
whose demand has been limited, have been placed on inactive status. Growing pro-
grams have been allocated increasing amounts of the increasingly scarce resources
when both the need and the demand have increased. Examples of programs in this
category include early childhood development, nursing, and human services.
A continuous program evaluation and review process assures that quality is main-
tained and the programs are cost effective at the same time. Cost saving measures
already implemented have made possible the absorption of the 1991 subsidy cuts
while maintaining quality and increasing enrollment by about 15 percent. Additional
savings appear to be possible for 1992-93. without reducing faculty positions. Those
savings possibilities, in addition to increasing tuition, to the extent permitted, may
make it possible to operate during the coming fiscal year with minimal effect on
quality. The longer term effects of hiring freezes, elimination of pay raises, elimina-
tion of faculty development funds, reduction in publications and advertising, and
severe limitations on capital equipment spending, remain to be determined, but, if
long continued, will certainly reduce quality and service levels.
In order to insure the most effective and efficient use of available resources, college
administration will continue to involve outside persons by continuing the task force
concept, and will actively seek tne advice and counsel of other groups, such as; (a)
the board of trustees. (b) the Northwest Technical College Foundation board of
directors. (c) area state legislators. (d) alumni and current students. (e) program
advisory committees. and (f) area press and media. In particular. the board of trust-
ees has been supportive of the task force concept, and has agreed to meet as often as
may be required in order to insure adequate and prompt response to changes in state
funding levels and the recommendations of the task force and/or other groups.
33,EST COPY AVAILABLE
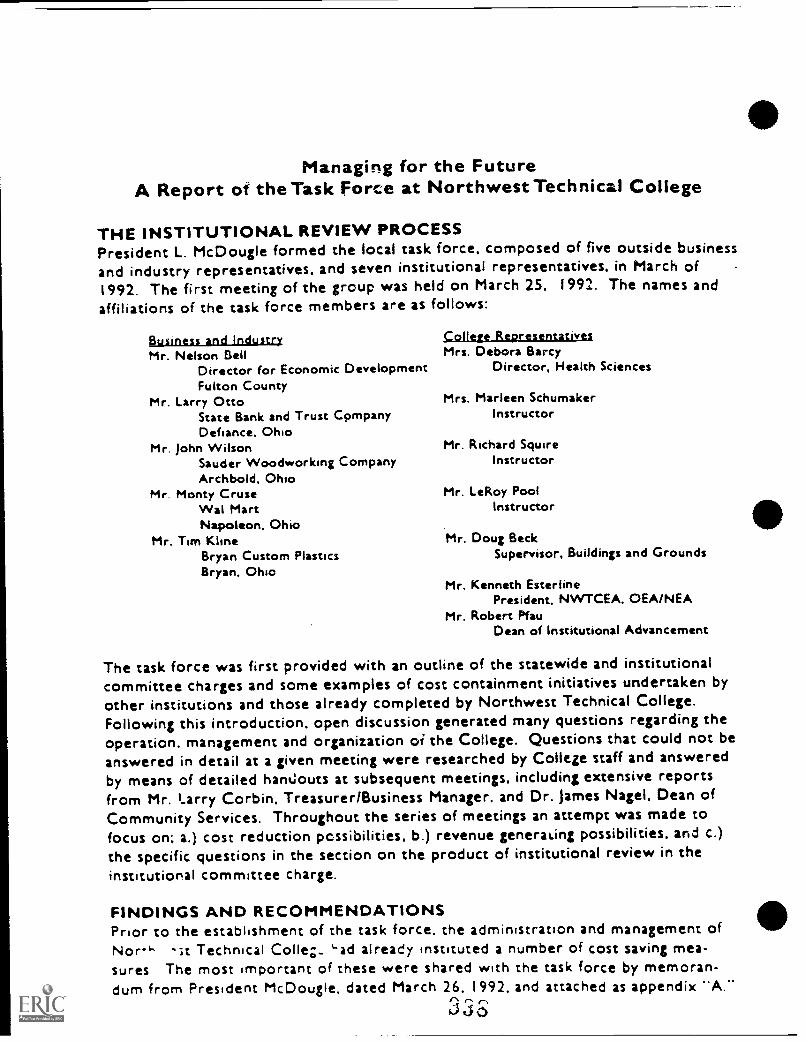
Managing for the FutureA Report of the Task Force at Northwest Technical College
THE INSTITUTIONAL REVIEW PROCESSPresident L. McDougle formed the local task force, composed of five outside businessand industry representatives, and seven institutional representatives. in March of1992. The first meeting of the group was held on March 25. 1992. The names andaffiliations of the task force members are as follows:
Bust/less and IndustryMr. Nelson Bell
Director for Economic DevelopmentFulton County
Mr. Larry OttoState Bank and Trust CompanyDefiance. Ohio
Mr. John WilsonSauder Woodworking CompanyArchbold. Ohio
Mr. Monty CruseWal MartNapoleon. Ohio
Mr. Tim KlineBryan Custom PlasticsBryan. Ohio
College RepresentativesMrs. Debora Barcy
Director, Health Sciences
Mrs. Mar leen SchumakerInstructor
Mr. Richard SquireInstructor
Mr. LeRoy PoolInstructor
Mr. Doug BeckSupervisor. Buildings and Grounds
Mr. Kenneth Ester linePresident. NWTCEA. OEA/NEA
Mr. Robert PfauDean of Institutional Advancement
The task force was first provided with an outline of the statewide and institutionalcommittee charges and some examples of cost containment initiatives undertaken byother institutions and those already completed by Northwest Technical College.Following this introduction, open discussion generated many questions regarding theoperation. management and organization el the College. Questions that could not beanswered in detail at a given meeting were researched by College staff and answeredby means of detailed handouts at subsequent meetings. including extensive reportsfrom Mr. Larry Corbin, Treasurer/Business Manager. and Dr. James Nagel. Dean ofCommunity Services. Throughout the series of meetings an attempt was made tofocus on; a.) cost reduction possibilities. b.) revenue generating possibilities. and c.)the specific questions in the section on the product of institutional review in theinstitutional committee charge.
FINDINGS AND RECOMMENDATIONSPrior to the establishment of the task force, the administration and management ofNor" -;t Technical Collet_ `ad already instituted a number of cost saving mea-sures The most important of these were shared with the task force by memoran-dum from President McDougle. dated March 26. 1992. and attached as appendix "A."
3 3 S.'
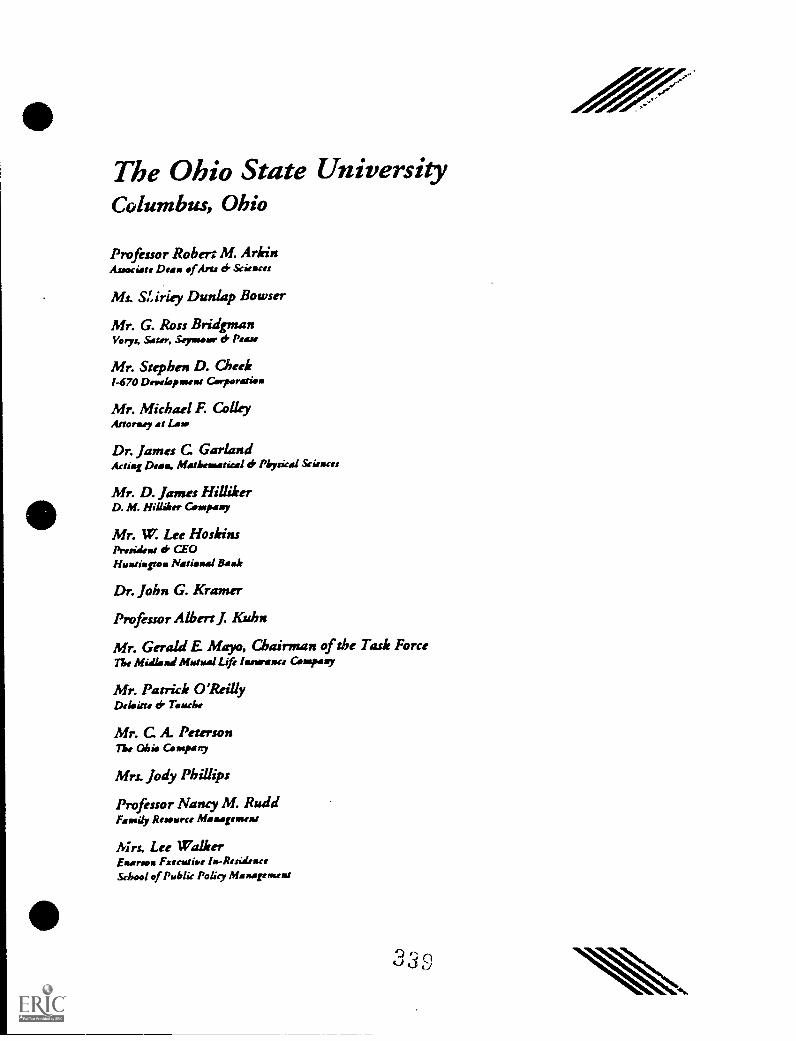
The Ohio State UniversityColumbus, Ohio
Professor Robert M. ArkinAssociate Dean of Arts ti Sciences
Ms. SLiriey Dunlap Bowser
Mr. G. Ross BridgmanVorys, &ter, Screamer d Pease
Mr. Stephen D. Cheek1-670 Development Corporation
Mr. Michael F. ColleyAttorney at Lase
Dr. James C GarlandArting Dean. Mathematical ei Physical Sciences
Mr. D. James MilkerD. M. Hillier Company
Mr. W. Lee HoskinsPresident ek CEOHantington National Rank
Dr. John G. Kramer
Professor Albert J. Kuhn
Mr. Gerald E Mayo, Chairman of the Task ForceThe Midland Mutual Life Insuranct Company
Mr. Patrick O'ReillyDeloitte d Touch*
Mr. C A PetersonThe Ohio Company
Mrs. Jody Phillips
Professor Nancy M. RuddFamily Resource Management
Mrs. Lee WalkerEmerson Executive ImRerislenceSchool of Public Polity Management
Executive Summary
The Ohio State University Managing the Future Task Force
Gerald E. Mayo, Chair
The Ohio State University Managing the Future Task
Force was appointed by President Gee on November 27, 1991.
:t consists of sixteen members, eleven of whom are from the
Central Ohio business community.
Due to the size and complexity of The Ohio StateUniversity, the Task Force elected to focus its efforts on
broad based issues aimed at assisting the President and the
Board of Trustees in leading the University. into the future,
rather than considering the daily operational issues
associated with any given function. The final report, which
will be completed in September, provides specific
recommendations centered around six key areas as identified
by the Task Force. These critical areas of emphasis
include:
1. Mission
The need for a clearly defined mission statementthat can be used as a guide when establishingpriorities and allocating resources.
2. Governance
A process for evaluating and refining the
University's governance structure to insure thatit is supportive of the University's mission yetreflects its many constituencies.
3. Information
Guidelines for developing information systems that
will help insure the allocation of resources isconsistent with established priorities.
4. Academic Achievement
Mechanisms to help define, measure and reward
success, quality and productivity in achieving theUniversity's academic mission.
Page 2
S. Administrative Support
Processes and procedures that identify and rewardimproved administrative support to faculty,students and staff including the elimination ofunnecessary layers of administrative structure.
6. Resources
Identification of the forces influencing
institutional costs as well as potential
strategies for making more effective use of
existing resources.
A complete list of Task Force membership is attached.
3<:1,2
Ohio UniversityAthens, Ohio
Charles J. PingPresidentOhio University
James L BruningProvostOhio University
Frank E BernardProfessor, GeographyObi. University
G. Kenner BushEditorAthens Messenger
Jeanette' G. Grasselli
Thomas S. Hodson&locker, Grins, Hodson ei Diogoardi
Dean W. Jeffers
Gary 0. ModemAssociate ProvostOhio University
Matthew Rosa
Ralph ScheyScott Fetzer Company
John E StinsonProfessor, Management SystemsOhio University
SUMMARY
Ohio University faces its third century with many strengths: an outstanding faculty, a
diverse student population, an impressive array of programs, a residential campus in an
idyllic setting in Athens and regional campuses, a history associated with the development of
the state and the nation, and a pride in a sense of mission and place.
Ohio University has used its resources economically, productively, and effectively.
Its expenditures per student are very cost effective compared to other public universities and
large proportions of expenditures are on instruction and student scholarships. A very low
proportion of expenditures is in administrative support. The University's productivity has
increased in almost every area including faculty teaching productivity, student retention,
degrees granted, and faculty involvement with students. Evidence of effectiveness and
quality growth in students while they are enrolled has been measured and documented by the
University's successful multi-dimensional campus assessment program. Ohio University has
been recognized with numerous excellence awards, research and grant funding has increased,
and there has been a significant growth in alumni gifts and support. Cost containment
programs are in place and the University has re-directed funds into areas critical to the
mission of the University. Strategies for enhancing quality in the period of future financial
uncertainty have been developed as part of this task force review and will be implemented
with the approval of the Ohio University Board of Trustees.
V. Strategies for Enhancing Quality in a period ofConstrained Public Funding
Question: Given the prospect of constrained or even reduced state supportfor university education, what can Ohio University do to maintainaccess, enhance the quality of its services and respond tothe several publics of the University?
Economic indicators and public policy decisions by state government suggest that state
suppe't will at best grow at a slow rate in the decade ahead. If recent trends in state support
cannot be reversed it is-likely there will bea prolonged period of financial stress. The issue
before the university community is: can the University prosper in such an environment and
what strategies will muimize that possibility. Three strategies are suggested: increase
income from non-state sources; contain costs; reform and restructure.
A. Increase Income from Non-state Sources
1. Tuition and Fag
In 1980 Ohio University ranked second in thestate in undergraduate tuition and fees. From1980 to 1990 undergraduate fees increased fromS1,206 per year to $2,721 per year or 125.6percent. Several other universities raised theirfees at a more rapid rate. As a result, OhioUniversity had the 5th highest fees in.the state in1990, a drop of three positions. During this sameperiod the average tuition and fee increase in thestate was 139.8 percent, well above that at OhioUniversity. If Ohio University had maintained its2nd place rank in 1990, fees would be $300higher and an additional S5 million would beavailable to the University.
If there is further erosion in the level of statefunding, tuition and fees need to be examined as areplacement for a portion of lost state funding. Inresponse to sharp cuts in state support in tke early1980's, Ohio University increased fees at a rate toreplace 80 percent of lost state funding. Currentand future reductions in state support will requireincreases at those approximgte levels.
Increases in tuition and fees should be matched atstate and university levels by increases inscholarship and financial aid. Since OhioUniversity already funds a larger percentage of
2,
scholarships and fellowships out of its generalfund budget, new funds should come from privatefunding and endowments.
Earallmsatittanaummi
A change in student mix can also increasesubsidy, tuition, and fee income. Potentialsources for this increase include transfer studentsfrom two-year campuses and relocate studentsfrom the regional campuses who bring higherlevels of state Support; nonresident students whopay the equivalent of state support in non-residentsurcharge. The enrollment management programshould develop goals to increase the diversity ofcampus enrollments and enroll incrementalstudents in programs that can absorb studentgrowth with marginal increases in programexpenditures. Graduate enroi:ments should beincreased by students who are externallysupported by grants, contracts, companies orgovenments. Incremental graduate enrollmentswithout direct cost consequences represent, inpotential growth areas, net increases in operationfunds.
3. Sponsored Activity
Growth in graduate student support, research andservice activity will be primarily dependent onincreased external funding. From 1980 to 1990external funding for research has increased from$2.5 million to $10.2 million or 308 percent.Funding for other sponsored restructured activitieshas increased from $10.1 million to $28.1million. External funding for research shouldexceed $20 million by the end of the decade.Total funding for all sponsored activities shouldreach $60 million during that time period.
4. private Suoport
Private support in the form of annual giving andendowment income can and should providedistinct support for quality in the years ahead.From 1980 to 1990 annual private gifts increasedfrom S2.3 million to $11.2 million. The total
22
340
value of the endowment in the period from 1980to 1990 increased from 525.6 million to $66.4million. It is expected that by the end of thedecade annual giving will be at the S20 millionlevel. Also by the end of the decade the totalendowment should exceed $100 million withannual spendable income in a range of $6-9million.
B. Contain Casts
Every dollar the University spends should serve or support thedistinct educational mission of Ohio University And provideaccess for students across southeastern Ohio through fiveuniversity centers. An undergraduate experience of unusualquality in a residential setting is available in Athens withoportunity for advanced instruction, research, and service.
To enhance quality, to fund continued improvement and reformduring a period of constrained public funding, all segments ofthe University must actively search for ways to reduce orcontain costs. The reduction or containment of costs must bepart of the ongoing institutional planning process, a factor in alldecision making.
The effort to improve quality in an extended period ofconstrained public funding in the opinion of the task forcedictates a number of operating principles.
University goals and priorities established in theeducational plan must be understood and usedconsistently by all planning units.
The enhancement of the academic mission in thecentral reason for any cost containment effort.All planning units must pay particular attention toensuring the human and material resourcesessential to the institution's ability to attract andhold able students, respond to their needs anddemands for courses and programs at both theundergraduate and graduate levels.
The president, the provost, the deans, and thevice presidents must each take a leadership role inoutlining processes and establishing the proceduralguidelii...s for a systematic search for ways tocontain costs while enhancing quality.
233 4 t-3
Special emphasis must be given to recognizingand rewarding quality enhancement in the contextof greater efficiency.
C. Reform and Restructure
To better use limited resources, the review of the University andits activities should be an ongoing rather than a periodicprocess. Three interdependent yet distinct sets of tasks are
ne6essary to continuously reform and restructure the University
in response to changing conditions. The Task Force onManaging. for the Third Century offers three recommendationsto the Board of Trustees and to the University community:
1. Plaaningfraam
The University planning process which has servedthe institution well over a decade-and-a-halfperiod of reductions and increases in state supportshould he reaffirmed with its present structure andcharge.
The planning process combines a broadparticipation with a focused responsibility forestablishing priorities and for decision making inthe several planning units and the University as awhole. It combines a holistic, goal-directedapproach with a strong data base for planning anddecision making.
Two focal points are the planning units and theUniversity Planning Advisory Council (UPAC).The planning units are responsible for establishinggoals and objectives to implement the Universityplan, the allocation of resources committed to theunit, and proposals for change.
The University Planning Advisory Council isresponsible for review of projections ofenrollment and income; evaluation of requests fornew funds or reallocation of existing funds toparticular planning units; topical, timely, short -term (three to five year) action plans; operatifmalplans in the form of recommendations on planningpools and a fiscal plan for each budget year.
'r)24
The council is chaired by the Provost and includesfaculty, student, and administrative staff.Approximately one third of the total membershipis replaced each year. The council submits aplanning report to the president each year and thisin turn provides a basis for review and action bythe Board of Trustees.
The new economic reality suggests that criteriaused in the planning process continue toemphasize the action agenda in resource allocationbut with stronger emphasis on cost containmentand growth by substitution rather than addition insupport of reform.
2. Ouality Ciro
It is recommended that quality circles be formedaround common activities across the wholeuniversity in a range that might include but not belimited to general education courses, departmentalmajors, housekeeping, maintenance, studentservices, and activities. Each of those qualitycircles should be asked to explore what itsmembers as a group do and to consider possiblealternative approaches to doing the tasks so as toimprove performance and contain costs.
It is further recommended that the Universityencourage and reward innovation.. To this end,funds should be made available to encourageresearch, development, experimentation andassessment in educational processes. Programsshould be funded that reform and improve thequality of education and services while at thesame time maintaining or lowering the costs ofdelivering education and services. A similarinnovation fund should be provided for thenonacademic portion of the University to rewardand support proposals to implement improvementsthat will respond to the needs of those whorequire the support service:. while maintaining orlowering costs.
Improvement and reform needs to focus onparticular activities with continuous improvement
L.' G25
programs established in the academic and supportsectors of the University. The programs shouldinclude an education component and amethodology for trans-departmental processanalysis and improvement. The purpose of PP.:.program is to examine any fiumber of tasks to theend of improving service to students, faculty, andstaff.
All deans, vice presidents, and department headsare to seek out individuals and/or groups and toprovide recognition and support for efforts toimprove services while maintaining or loweringcosts. Information about innovations should beshared across the University to let others learnabout practwes they might be able to use. A best-practice consultant from within the Universitycould be used to provide a focus for theexamination and alteration of structure andprocess.
All of these processes and reward systems mustbe established in a context which makes theresponse to constrained public funds a reform-minded activity rather than a budget-drivennecessity. The emphases should not be on costcutting and efficiency at any price but onimprovement and reform.
3. UninnittSalkagum
The Task Force on Managing for the ThirdCentury recommends that a UniversityColloquium be created to examine continuouslythe internal and external environments of theUniversity, the future described by the currenteducational plan together with alternate futures forOhio University.
The charge to the colloquium should include:
(1) A regular review of progress inimplementing the educational planfor the University and periodicwork on preparation of arestatement of the goals and
26
(2)
priorities established for the
University.
The examination of organizationalstructure and decision making atOhio University and a continualeffort at review, assessment, andimprovement of operation and
decision making
(3) Continuous scanning of the externalenvironment and, specifically,expectations addressed to theUniversity by societal needs, byelected officials, by alumni andfriends, and most importantly, byeach succeeding generation ofstudents. The review includesdiscussion of actual and proposedresponses to these changingexpectations.
(4) Examination of both the constantand changing roles of OhioUniversity in its service to thesouthern region of the state, thestate as a whole, the nation, and theworld.
(5) Exploration and assessment ofchange, reform, and innovationthroughout the university world andthe consideration of the implicationof these developments for OhioUniversity.
Membership in the colloquium:
It is recommendation of the task force that the
colloquium should meet three or four times a
year, be chaired by the president, and include in
its membership the Board AdministrationCommittee of the Board of Trustees, two studenttrustees, three faculty members, and three staffmembers appointed by the Chair of the Board ofTrustees on the recommendations of the president.
27
Owens Technical CollegeToledo, Ohio-
Mr. Wendell FryerChairman d CEO of The Centrex CorporationFindlay, OhioChairman of the Board of Trustees of Owens Technical College
Mr. James BeshalskePresidentToledo Area Private Indus-by Council
Mr. Joseph Colturs; Vice PresidentThe Port Lawrence Title d Trust Company of Toledo, Ohio
Mr. Norman LaddIndustrial d Commercial Development ManagerBudolph/Libbe, Inc. of Walbridge, Ohio
Mr. Charles MannVice President for Business AffairsOwens Technical College
35
OWENS TECHNICAL COLLEGEMANAGING FOR THE FUTURE
TASK FORCE
I. Introduction
The Owens Technical College Managing for the Future Task Force milized a study process designed tooptimize committee members' input while minimizing the strain on their already-crowded schedules andthe limited internal resources of the College. A review of the College's 1990 institutional self-study whichhad been prepared for the reaccreditation process of the North Central Association of Colleges and Schools;a review of the 1990/91 - 1994/95 Strategic Plan for Owens Technical College; a review of the agreementbetween the College and the Owens Faculty Association; and examination of statistical and empiricalinformation developed by the College's staff in response to the questions listed in the Managing for theFuture Institutional Committee Charge document yielded the initial drafts of this report.
The Institutional Committee offered refinements and clarifications to the draft at a meeting on May 19,1992. This document reflects that final input.
The committee was chaired by Jan Skunda, Executive Director of College Relations, Owens TechnicalCollege. The committee members were:
Mr. Wendell Fryer - Chairman and CEO of The Centrex Corporation, Findlay, OhioChairman of the Board of Trustees of Owens Technical College
Mr. James Beshaleke - President, Toledo Area Private Industry CouncilMr. Joseph Colturi - Vice President, The Port Lawrence This and Trust Company
of Toledo, OhioMr. Norman Ladd - Industrial and Commercial Development Manager,
Rudolph/Libbe, Inc. of Walbridge, OhioMr. Charles Mann - Vice President for Business Affairs, Owens Technical College
The concepts of examining institutional strategic direction, analyzing the impact of external and internalforces on the College's ability to fulfill its minions, and seeking the valued advice ofcommunity le,aders werein no way new to Owens Technical College. Self - studies are part of the higher education setting; a livingstrategic plan is in place for the College; and advisory committees from the community are very much a partof College operation&
Although self-studies for individual academic programs are conducted as part of scheduled programreaccreditations and program evaluations are completed at the end of each academic year, the most recentinstitution-wide self-study was completed just some eighteen months ago.
e52
Submitted to the Commission on Higher Education of the North Central Association of Colleges andSchools, this self-study (Appendix 1) provided an exhaustive analysis ofthe College.
Beginning with an examination of the College's Mission and Purpose statement, the study furtherexamined the College's governance and administration, programs and curricula, human resources, studentservices, physical resources, financial resources, and other services. The study went on to measureperformance against institutional goals and also sought to determine the College's ability to continue
accomplishing its purpose.
The self-study found an institution with a burgeoning enrollment of students with increasingly diverse
backgrounds and levels of preparedness, generally adequate equipment and facilities for existing pro-
grams, and on-campus support serviceswhich were meeting the varied needs of the students. However,the study also identified some significant concerns; among them - the impact of evolving from a small to a
large institution, the need for allocating additional resources to ensure adequate quantity and quality ofpersonnel, and the widening divergence of students' educational objectives and needs.
Each of the concerns raised in the self-study is exacerbated by the current constraints on the state'sresources. Identifying areas which will requires 4ncreased resources due to higher enrollments onlyaccentuates the problems created by the aforementioned constraints.
The Owens Technical College Strategic Plan for 1990/91-1994/95 was officially approved by the College.Board of Trustees on January 15, 1991. It is designed to be a living' document, keeping to the philosophyof Owens College President Daniel H. Brown that a strategic plan should be a road map not a rut. It servesas a guide for daily activities with the flexibility to evolve as internal and external forces impact the College
and its operations.
The Strategic Plan is included in its entirety in Appendix 2. However, portions of the plan are excerptedin this report's narrative response to the key questions of the Institutional Committee Charge. Theexistence of this strategic plan, this institution-wide agreement on priorities, has been critical in dealingwith the difficult choices which arise in grappling with financial shortfalls.
Critical as well are the College's advisory committees. Advisory committees for each technology programarea are appointed by the Board of Trustees upon the recommendation of the President These committeesare composed of community volunteers from business and industry, health care and social serviceorganizations, and the public sector. Currently, fifty-four advisory committees exist to serve both theToledo and Findlay campuses of Owens Technical College.
These committees help keep the instructional programs realistic, practical and responsive to commuri,and business demands. They provide real-world insights to ensure that the academic insulation thatsometimes develop in higher education settings does not occur. Advisory committee members look at the
programs, curricula, and job placement opportunities within their area of expertise, offeringsuggestions
for change which will help keep the graduates of Owens College well-prepared for productive careers and
successful lives. They also help with equipmentselection, faculty recruitment and, occasionally, equipment
donations.
The commitment of the more than five hundred individuals who serve on the Owens Technical College
advisory committees is exemplary. They havehelped illustrate that shining a light from the outside into
the dimly lighted corners of an institution'soperations is not threatening or dangerous. In fact, the opposite
is true. Shining a light exposes hidden pitfalls. It makes the path to be taken much clearer. It lessens the
dangers.
II. Findings and Recommendations
In brief, with expanded explanations contained within the narrative responses in this report, the review
of Owens Technical College identifies the following findings and ;mikes the following recommendations.
Findings
By virtue of its size and programmatic content, Owens Technical College needs to move forward
with its objective of becoming a community college.
Owens Technical College is seeking to direct limited resources toward accomplishing the highestpriorities as identified in the College's strategic plan.
The gap between the start of each fiscal year and the verification of the actual funds which willbe allocated from the state creates a planning nightmare that few business enterprises would allow
in the private sector. This is particularly true for growing institutions like Owens College whichknow full well that the growth factor will probably not be fully funded but can only guess at the actual
cents on the dollar which will be provided.
With northwest Ohio facing economic difficulties which currently outpace those facing many otherareas of the state, the need to `re-tool* the area'sadults is certain to continue unabated. Even if thestate's revenues increase significantly, Owens Technical College needs to maintain careful steward-ship in allocating fimds based upon strategic priorities, becausethe enrollment projections at Owensfar surpass expected formula reimbursements.
The lack ofa cohesive state system for the tvro-year colleges limits their collective power and blockscreation of systemic efficiencies.
Although the introduction of a transfer module helps eliminate the state's paying twice for somestudents' couraework, articulation and transfer issues remain which aggravate students, frustratecollege officials, and cost the state of Ohio money.
Owens Technical College exercises care in scheduling courses and students so as to maximize
classroom and laboratory utilization. However, capital allocations are not keeping pace with
enrollment-
Some constructive steps have been taken to streamline Owens Technical College operations and
increase efficiency; however,additional steps can be taken, particularly in the areasof processes for
form approvals and decision-making.
In line with the steps mentioned above, the College is conducting an internal examination of paper
flow to identify ways in which computerization could aid in this effort.
Placement rates for Owens Coll ,e graduates provide testament to the quality of education, as
perceived by area employers.
Alternative delivery systems such as in-plant degree programs and satellite locations for
workplace literacy classes provide some relief to strained on-campus facilities but do add to the
demand for human resources. However, the end result seems to be worth the effort as these
programs directly impact the ability of Ohio's companies to czatpete in the global marketplace.
As part of the on-going commitment to quality operations, it's essential to develop programs of
labor/management cooperation; thereby producing quality education with the highest degree of
efficiency.
Recommendations
Encourage the state to pursue a state system of community colleges, unifying a fragmented two-
year college system, increasing the effectiveness of state dollars by funneling more freahman and
sophomore level students into the low cost centers of higher education, and better serving the
taxpayers. The resulting enhanced use ofthe newly developedtrsuasfer programs would encourage
the growth of a strong feeder system for the universities.
Owens Technical College should continue with staff development programs for its administrators
to further enhance individual's managerial abilities, thereby further improving the management
of the College's operations.
Further streamlining of processes and procedures at the College should be pursued to cut out
unnecessary steps andbureaucracy. Care should be taken to maintain appropriate oversight and
clear-cut responsibility.
The College must continue to pursue improvement in quality through a relative increase in the
number of full-time faculty. The ratio offull-time to parttime faculty remains below that set as a
goal by the Ohio Board of Regents.
The College must continue development of aStudent Outcomes Assessment process. It is difficult
to quantify quality when there are isolated statistics and data to support or refute quality
assertions.
Rio Grande Community CollegeRio Grande, Ohio*
*Exempt
3 5
Shawnee State UniversityPortsmouth, Ohio
Robert E Dever, ChairmanAttorney, Partner, Bannon, Howland 6. DeverChairman of the Board of Star BankSouth Central Ohio
Sharon Cornwell Senior Vice PresiderBank One of Portsmouth/NA
Andrew Glockner, PresidentGlockner Chevrolet Company
William PlatzerSuperintendent of Scioto County School System
Thomas Reynold Senior PartnerReynolds d CompanyCertified Public Accountant(Member, SSU Board of Trustees)
Keith Spires, Presideng Osco Industries
Thomas Timion, StockbrokerEdward D. Jones dr Company
Dr. Wayne WheelerPhysician
EXECUTIVE SUMMARY
REPORT OF THE SHAWNEE STATE UNIVERSITYMANAGING FOR THE FUTURE TASK FORCE
This report analyzes issues related to quality, pro-
ductivity, and corts at Shawnee State University in light of
SSU's role as a regional, open admissions, chiefly commuter
institution offering the associate's and bachelor's degrees.
Institutional growth in students is required to make SSU
Independent of its current supplemental funding, but with
that growth must come growth in facilities, degree offer-
ings, and full time, well qualified faculty.
The collective bargaining environment influences and
constrains cost containment and management decisions at SSU,
and this report recommends a review of process and practices
to ensure planning which meets Ohio's needs for the '90s.
Shawnee State University's regional service mission, which
recruits new students and produces revenue and educational
opportunities, can continue to expand. The Task Force notes
that cost cutting measures which apply to mature institutions
with stable enrollments do not apply at a new university en-
3oying 8% yearly growth, and that state universities' local
autonomy for expending instructional subsidy dollars could
reasonably be extended to include capital dollars as well.
3 5 E,
SECTION TWO
The Task Force interviewed members of the Board of
Directors, Administration, Faculty, Supporting Staff, and
Student Body. Interviews were conducted on both an
individual basis and in-group meetings. An anonymous survey
was conducted. Reference information and statistical data
were reviewed relative to Shawnee State University and other
universities. Input was received from several hundred
people, which covered a multitude of topics including (but
not limited to) budget, operations, curricula, mission and
activities.
Sinclair Community CollegeDayton, Ohio
Doug HawthorneChairman & CEOSociety Bank, NADayton, Ohio
Oscar BaccusQuality Improvement ConsultantKettering CenterDayton, Ohio
Beth CraurfirelDirector, Strategic Financial Plan-ning &AnalysisNCR CorporationDayton, Ohio
Dale MedfordCorporate Vice President ofFinance & ChiefFinancial OfficerReynolds & ReynoldsDayton, Ohio
Mike Trigg,Senior Vice President (Retired)Society CorporationSolon, Ohio
Lc-Officio;
Burnell RobertsChairman & CEOThe Mead CompanyDayton, Ohio
Franz HogeManaging PartnerCoopers & LybrandDayton, Ohio
Sinclair Sti
David PonitzPresident
Ned SifferlenProvost
Joe GormanVice President.* Business Opera-tions
Steve JonasVice President for Administration
Edna NealVice President.* Student Services
Herman BrantVice President fin- Instruction
(Acting)
OrC k9
SINCLAIR COMMUNITY COLLFGE
MANAGING FOR THE FUTURE TASK FORCE
EXECUTIVE SUMMARY
Summary Comments and Observations:
1. The College is well focused with a multi-faceted mission directed at theeducational needs of the Dayton region, and with specialized programs
serving the entire state.
2. The College faculty is committed to its direct instructional mission. Thevast majority of faculty load is directed to classroom instruction.
3. The College is well managed and has a variety of sound managementpractices and techniques in place to assure efficient and productive use
of resources.
a. An impressive array of cost containment processes are in place, and avariety of specific cost saving initiatives have been undertaken (seeattached document). It is apparent that efficiency and effectivenessare very much a part of the institutional culture.
b. College average spending per student is well below state and nationalaverages for like institutions.
c. Based on peer comparisons, the College directs a disproportionatelylarge part of its resources to direct instruction and studentservices, and markedly lower spending for administration.
d. The College uses a number of creative strategies to acquire state ofthe art technology (cooperative arrangements with other schools,collaborative ventures, business-industry partnerships, directdonation, etc.) to enhance its resource base and to expose students toexemplary lab training experiences.
e. College planning is long-range, strategic, and linked to resourceallocation.
f. A specific program for Total Quality Management/Continual Improvementis under active implementation.
g. Employee performancr, is continually monitored and compensation ismerit-based. In addition, multiple employee recognition strategiesare employed for both faculty and staff to enhance morale andencourage further achievement.
h. Sinclair student tuition is among the lowest in the state.
i. The College actively and continuously assesses the financial impact ofits various programs.
0 61
j. The College actively monitors its ratio of full-time and part-timefaculty; sufficient part-time faculty (with appropriate selection andquality control procedures) are maintained to promote efficiency andto allow the College to quickly respond in a cost conscious manner toprogram specific enrollment expansion and contraction.
4. Sinclair is an innovator in exploring efficient alternatives to theeducational process; examples include College Without Walls, ExperienceBased Education, TV Sinclair, and extensive use of new technologies (PC,AV, Video, etc.) to broaden access to individualized and self pacedinstruction.
5. The College plays an active role in addressing a variety of the issues andchallenges now confronting Dayton and most urban based communities. Theseinclude:
a. Training and re-training for thejobs of tomorrow. The College'sreacting to the local job market"leads the need" in anticipatingeconomy.
b. Educational access for place-bound students.
c. Educational and technological access for area organizations andemployers.
jobs of today and preparation for therole in researching, acting, andcannot be over-emphasized. It trulythe training needs of the local
d. A forum for the discussion and resolution of community issues.
e. Active linkages with area high schools, universities, and employeri tofacilitate a "total system" orientation for the educational processand its "end users".
f. Efforts directed at specific populations e.g. displaced workers,welfare recipients, the handicapped, the educationally underprepared(of all ages).
6. Sinclair is at the leading edge in its commitment to accountability andoutcome assessment. The "Sinclair Guarantee" for transfer and careerprograms announced for Fall, 1992 is but one element of a broader and wellconceived plan toward a total assessment goal.
7. The College has a talented, dedicated, community oriented, active Boardthat establishes, monitors progress toward, and periodically re-evaluatesmission, direction, and major policy goals for the College. It isabsolutely essential that a strong local Board, operating within theappropriate governance structure, be maintained.
a. Local leadership that provides insight, continuity, commitment, andresponsiveness to a rapidly changing local environment has provencritical to optimizing the College's service to the community.
Further, the fact that Board members are readily recognized by thelocal community as individuals of strong reputation, expertise,personal integrity, and with the community's interest at heart hasgreatly facilitated the College's ability to gain acceptance andsupport from the community's leadership and populace.
b. The Board and College have found it critical to have the authority andflexibility to function autonomously and independently to best meetthe needs of the community and the College's educational mission.
As the Task Force reflected on the importance.of knowledge and marketableskills in keeping individuals out of prison and off public assistanceroles, we cannot help. but.conclude that an open access institution likeSinclair is a vital community resource. Sinclair's impact on the localeconomy and social structure is enormous. Further, since comprehensivecommunity colleges like Sinclair apparently are a relatively recentphenomenon in Ohio, we wonder if there is a general appreciation at thestate level of the critical need for their programs and services.
The Task Force would ask public policy decision makers to consider:
a. A healthy economy and healthy society go hand in hand.
b. Increasingly, knowledge is the key resource and driver in our economy;economic regions must be able to build, sustain, and enhance theirworkers' knowledge base.
c. Knowledge is further the critical skill that people must possess tocope with and to contribute to today's complex society in a positiveway.
d. The state's and nation's fortunes will continue to be buffeted andreshaped as we evolve toward an increasingly global andknowledge-based economy. Indeed, we believe that soma of Ohio's mostpressing current budgetary issues (prisons, youth services, and humanservices) offer compelling evidence that the state must balancetreating today's symptoms against building for a healthy social andeconomic future. The need is becoming increasingly clear. We must beprepared to offer open and affordable access to education, trainingand retraining for the jobs of today and preparation for the jobs oftomorrow.
e. Sinclair has demonstrated, time and again and in many different ways,that an aggressive and well led local community college can be one ofsociety's most effective resources for addressing economic and socialissues.
Specific Recommendations:
1. The educational requirements for Ohio's workforce continue to changedramatically as we move toward an increasingly knowledge driven economy.Older workers must retrain at the College level'and a significantlygreater proportion of high school graduates must go to college to prepare
for the jobs of today and tomcrrow. College training, once a relativeluxury in Ohio's economic structure, is rapidly becoming a necessity forthe majority of Ohio's citizens if the state is to build a financially
sound future. Access to quality and affordable higher education mustbecome a top priority in the state funding process. The State mustbalance the investment between education on the one hand and prisons and
welfare on the other.
2. The Task Force strongly encourages the College's move toward total quality
management. In addition, the Task Force noted the College's merit pay
program for faculty appears to be well conceived and progressive in design
and implementation. It is recommended that the merit program forsupport/profeoional staff, which does contain some excellent features,should be evaluated in light of the recognition/reward philosophyadvocated in total quality management.
3. The Task Force notes that the state process for distributing instructionalfunding appears to be rational and provides good institutional incentiveand flexibility in controlling costs and directing resources to criticalneeds. At the same time, it appears the process needs to be updated torecognize currently unfunded activities critical to local economies and
communities. Examples include support to small businesses and toexpensive health career programs.
The system is also deficient in that it is essentially a cost plus modelusing historical Ohio costs as the benchmark or norm. It is suggestedthat the model needs to incorporate one or more elements that wouldidentify and measure efficiency goals, and would reward progress againstmeeting those goals.
4. The state's student financial aid programs should be modified to supportthe increasing numbers of low income, place-bound adults coming to collegeon a part-time basis.
5. The College appears to be strongly committed to the goals of a) increasingparticipation by adult Ohioans in higher education, b) providing accessand success to underserved populations, and c) enhancing work forceliteracy as well as providing specific technical training.
a. Multiple strategies are employed to further these goals e.g.:o High school linkages, summer institutes, cooperative programs, etc.o Extensive outreach and targeted marketing.o Greatly strengthened entrance assessment, placement,
developmental/remedial efforts, monitoring, tutoring ando Active participation in JTPA, BVR, welfare reform and adult re-entry
programs, etc.o Extensive use of technology and other creative strategies to enhance
the instructional process and learning experience.
b. Costs, especially student services costs, appear to increasedisproportionately for the less prepared student. As a result,adequate funding is key to providing the capacity to serve and toensure success for the academically disadvantaged. Items listed in a)above should provide some intuitive reasons as to why costs escalateso quickly with non-traditional populations.
State funding for academically disadvantaged students needs to beevaluated in light of the increased student support required toenhance student success.
6. Early retirement incentive programs provided through the state retirementsystems are not-adequately flexible to provide cost savings to colleges.As currently structured, the programs must:
a. be offered to all employees within the broad classifications offaculty or staff; thus, there is not ability to direct an earlyretirement offering to specific departments where surplus staffing mayhave developed.
b. utilize total retirement system service credit to determineeligibility priority versus service credit with the current employer.
7 The state!s current approach to economic development is highlyfragmented. The community college role and contribution in this effortcould be considerably strengthened if the state approached this vital areain a more strategic and cohesive way.
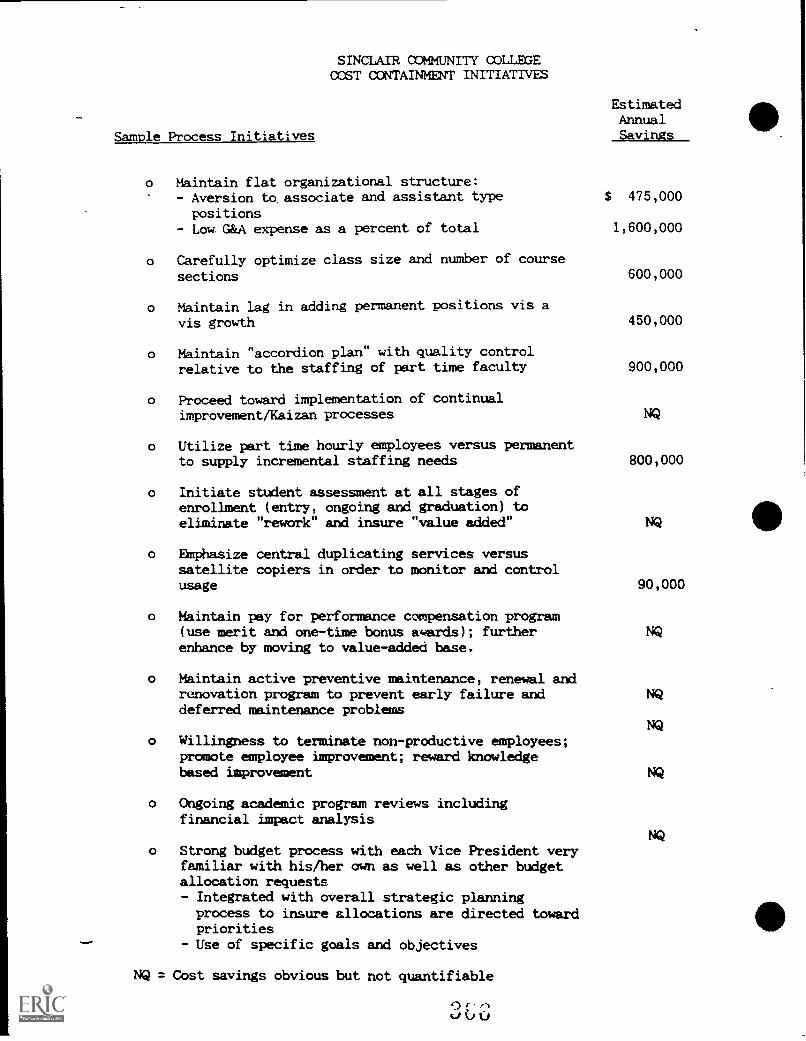
SINCLAIR COMMUNITY COLLEGECOST CONTAINMENT INITIATIVES
Sample Process Initiatives
o Maintain flat organizational structure:- Aversion to. associate and assistant type
positions- Low G&A expense as a percent of total
EstimatedAnnualSavings
$ 475,000
1,600,000
o Carefully optimize class size and number of course
sections 600,000
450,000
900,000
o Maintain lag in adding permanent positions vis avis growth
o Maintain "accordion plan" with quality controlrelative to the staffing of part time faculty
o Proceed toward implementation of continualimprovement/Kaizan processes NQ
o Utilize part time hourly employees versus permanentto supply incremental staffing needs 800,000
o Initiate student assessment at all stages ofenrollment (entry, ongoing and graduation) toeliminate "rework" and insure "value added" NQ
o Emphasize central duplicating services versussatellite copiers in order to monitor and controlusage 90,000
o Maintain pay for performance compensation program(use merit and one-time bonus awards); further NQenhance by moving to value-added base.
o Maintain active preventive maintenance, renewal andrenovation program to prevent early failure and NQdeferred maintenance problems
NQo Willingness to terminate non-productive employees;
promote employee improvement; reward knowledgebased improvement NQ
o Ongoing academic program reviews includingfinancial impact analysis
o Strong budget process with each Vice President veryfamiliar with his/her own as well as other budgetallocation requests- Integrated with overall strategic planningprocess to insure allocations are directed towardpriorities
- Use of specific goals and objectives
NQ = Cost savings obvious but not quantifiable
LIU u
NQ

Sample Process Initiatives
o Review of all major financial issues by highlyqualified Finance Committee and Board of Trustees- Ongoing access to "loaned executive" expertise inspecific areas of concern
o Maintain detailed job description for each staffposition with specific agreed-upon goali andaccountabilities
o Initiate careful evaluation of grant funding forlong term financial impact
o Insist that auxiliary operations "pay their ownway"
o Insist that faculty are focused on classroomteaching; provide release time for other activitiesbut only with very specific review, approval andlink to the College's mission
o Carefully evaluate the financial benefit of usingin-house versus outside services
o Emphasize value based bidding for goods andservices
Sample Specific Initiatives
o Replace building lights with long life (lesschanging), low wattage fluorescent type
o Install energy efficient replacement windowsthroughout the campus
o Implement zip+4 and pre-sort mailings
o Install an integrated computer system to eliminateredundancies and gain efficiencies- Purchase "off the shelf" computer and softwareand minimize customization changes
o Install granite steps to replace pre-cast concrete
Use of referrals to local hospitals and healthagencies versus maintaining on-campus health andpsychological services
o Implement and carefully monitor health care costcontainment programs such as managed care,preferred provider organizations and extended carereview; utilize employee cost sharing (deductiblesand co-payments)
o Migration to new "user friendly" building
automation system to eliminate "technicalinterface" function
NQ = Cost savings obvious but not quantifiable 0,,,%.)
EstimatedAnnualSavings
NQ
NQ
NQ
NQ
$ 400,000
750,000
NQ
NQ
14,000
40,000
9,000
NQ
NQ
NQ
400,000
NQ

Sample Process Initiatives
EstimatedAnnualSavings
o Establish a surplus property "clearing house" for NQ
internal use
o Repaint/refurbish office equipment versus buying 26,000
new- Use of standards
o Where possible, place full-time employees on .9 and
10 month schedules
o Place grant-funded employees on contingentcontracts and evaluate financial impact beforeextending renewals
61,000
NQ
o Utilize secretary/clerical pool versus hiring 8,000
temporary employees
o Implemented employee assistance program to provide NQvital service to employees as well as reduce healthclaims, absenteeism, turnover and increase
productivity
o Close campus or individual buildings at certaintimes in order to save utility and maintenancecosts
o Use of brick pavers, alternate treatment chemicals,etc. to eliminate salt damage to concrete surfaceareas
o Control telephone costs via restricted lines anduse of extensions versus separate lines; furnishdepartment heads with monthly usage detailinformation
o Retrofit the College's HVAC system
o Doubled roof insulation for improved resistance toheat loss
o Change HVAC systems to night and weekend set-backtemperature to save energy during unoccupiedbuilding status
o Install small boiler and chiller to save energyduring low load heat and cooling demand cycles
o Use dual fueled boilers to reduce gas costs
TOTAL QUANTIFIED ESTIMATES
NQ = Cost savings obvious but not quantifiable
3:1;
NQ
NQ
20,000
250,000
10,000
NQ
NQ
9,000
$6,912,000
Southern State Community CollegeHillsboro, Ohio
Dr. S. Ladrach, Academic Dean
William Bus:ea Dean Students
Dr. P. Simmons, Dean Cont. Ed
James Buck, Treasurer
Joyce Day, Dean South Campus
Jane Dye, Dean North Campus
Jim De long, Business
Dr. B. Henry, Agriculture
Jon Davidson, Mathematics
Don Storer, Chemistry
Glenn Robison, Engineering
John Porter, History
Leora Stroup, Business
Vickie Parker, Nursing
Saundra Stevens, Medical Assisting
Mike Mose; Maintenance
Pam Shannon, Administrative Assistant
Sherry Sion; Placement Coordinator
Laura Shive6,, Faculty Secretary
Shirley Corrupt& Systems Analyst
Fernando Garcia, Aboard Affairs
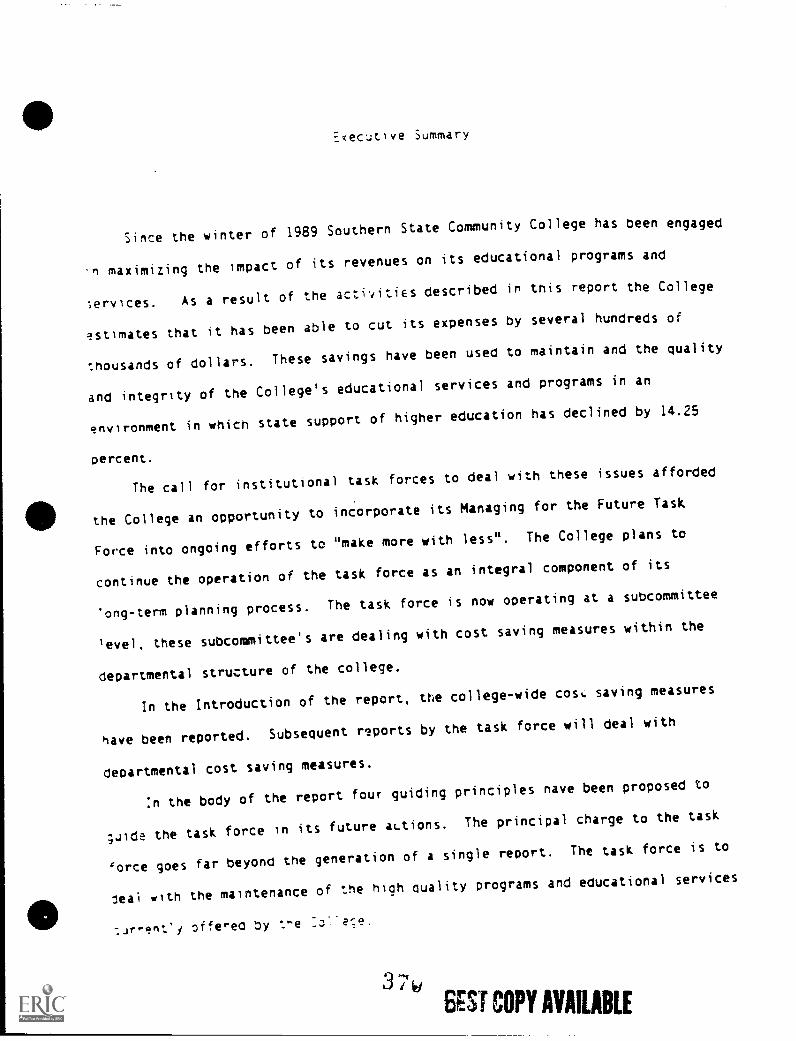
=ctecutive Summary
Since the winter of 1989 Southern State Community College has been engaged
n maximizing the impact of its revenues on its educational programs and
;ervlces. As a result of the activitiesdescribed in this report the College
estimates that it has been able to cut its expenses by several hundreds of
thousands of dollars. These savings have been used to maintain and the quality
and integrity of the College's educational services and programs in an
environment in which state support of higher education has declined by 14.25
percent.
The call for institutional task forces to deal with these issues afforded
the College an opportunity to incorporate its Managing for the Future Task
Force into ongoing efforts tc "make more with less". The College plans to
continue the operationof the task force as an integral component of its
'ong-term planning process.The task force is now operating at a subcommittee
'eves, these subcommittee's are dealing with cost saving measures within the
departmental structure of the college.
In the Introduction of the report, the college-wide cos,: saving measures
have been reported.Subsequent r?ports by the task force will deal with
departmental cost saving measures.
:n the body of the report four guiding principles nave been proposed to
;.side the task force in its future actions. The principal charge to the task
`orce goes far beyond the generation of a single report. The task force is to
leal with the maintenance of the high quality programs and educational services
offerea by :".e
3 7i BES1 COPY AVAILABLE
Stark Technical CollegeCanton, Ohio
Joan Selby, ChairmanAttorney-at-Law
Irving M. Gordon, D.0, ChairmanPerry Family Practice Center, Inc.
Christopher Maurer, DirectorEducation cir OrganizationDevelopment - Diebol4 Inc.
Robert Bobbit4 PresidentTern Paul, Inc.
Dr. Robert Kollin, Vice PresidentDean for Instruction/Student Development
Robert HallierVice President ftr Business d Finance
Rebecca PriestDirector of Development/Report Editor
John Dunlap, PresidentFaculty AssociationAssistant Professor, Communicative Skills
fdirPola 344 Past PresidentInter-Club Council
David Aungs4 Marketing dr Communications PrincipalThe Timken Company
37

Background
On Dec. 4, 1991, Stark Technical College convened its Institutional Committee that wasclarged with the task of studying the relationship between cost and quality on the STCcampus as part of a statewide Managing for the Future Task Force project. The 10-memberCommittee was comprised of the following people:
STC Foundation Board of Directors Joan Selby, ChairmanAttorney -at -Law
Board of Trustees Irving M. Gordan, D.O.ChairmanPerry Family Practice Center, Inc.
Industry Representative Christopher MaurerDirector, Education & OrganizationDevelopment - Diebold, Inc.
hfinority/Busineal Robert lkibbittPresident, Terr-Paul, Inc.
College Administrative Staff Dr. Robert KollinVice President/Dean for Instruction/Student Development
Robert RanierVice President for Business & Finance
Rebel= PriestDirector of Development/Report Editor
Faculty John DunlapPresident, Faculty AssociationAssistant Professor, Communicative Skills
Students Jeff PolandP Prosident, Inter-Club Council
Alumni David AnnptMarketing & Communications PrincipalThe Timken Co.
The Committee met monthly from December through April. The following report is a
summary of its findings. Specific recommendations as to how Stark Technical College and
the State of Ohio may further act to ensure quality in a limited funding environment appear at
the end of the report.
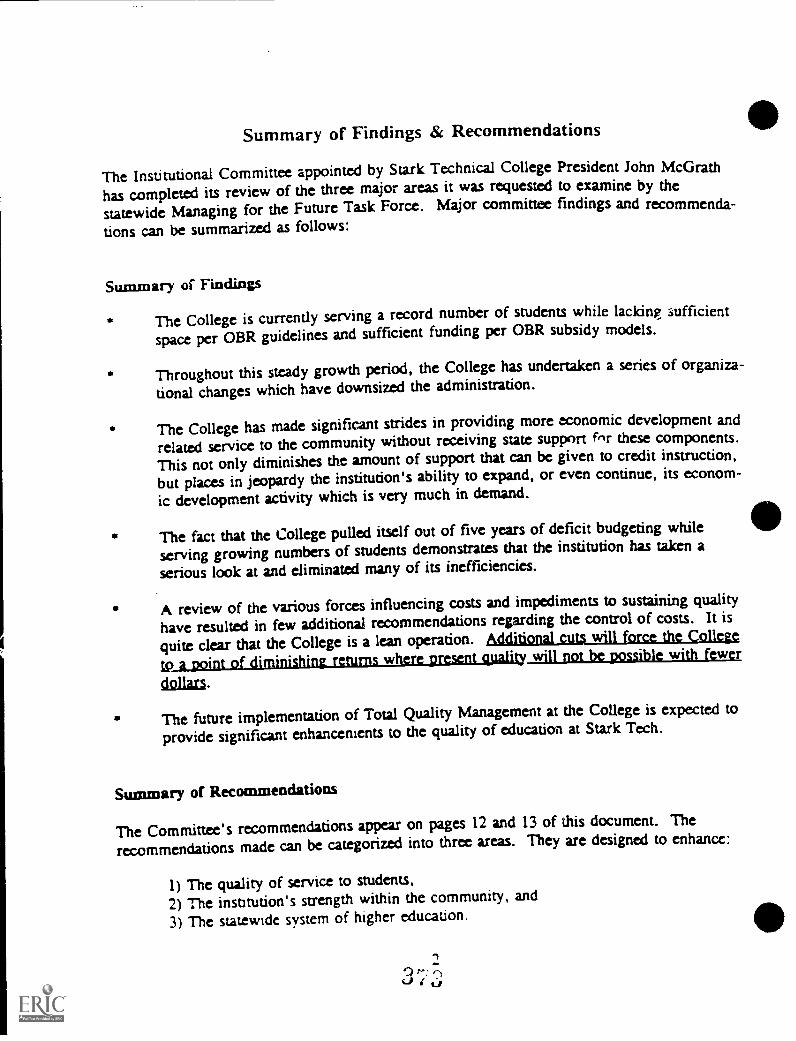
Summary of Findings & Recommendations
The Institutional Committee appointed by Stark Technical College President John McGrath
has completed its review of the three major areas it was requested to examine by the
statewide Managing for the Future Task Force. Major committee findings and recommenda-
tions can be summarized as follows:
Summary of Findings
The College is currently serving a record number of students while lacking sufficient
space per OBR guidelines and sufficient funding per OBR subsidy models.
Throughout this steady growth period, the College has undertaken a series of organiza-
tional changes which have downsized the administration.
The College has made significant strides in providing more economic development and
related service to the community without receiving state support inr these components.
This not only diminishes the amount of support that can be given to credit instruction,
but places in jeopardy the institution's ability to expand, or even continue, its econom-
ic development activity which is very much in demand.
The fact that the College pulled itself out of five years of deficit budgeting while
serving growing numbers of students demonstrates that the institution has taken a
serious look at and eliminated many of its inefficiencies.
A review of the various forces influencing costs and impediments to sustaining quality
have resulted in few additional recommendations regarding the control of costs. It is
quite clear that the College is a lean operation. Additional cuts will force the College
tp a point of diminishing_ returns where gment quality will not be possible with fewer
dollars.
The future implementation of Total Quality Management at the College is expected to
provide significant enhancements to the quality of education at Stark Tech.
Summary of Recommendations
The Committee's recommendations appear on pages 12 and 13 of this document. The
recommendations made can be categorized into three areas. They are designed to enhance:
1) The quality of service to students,
2) The institution's strength within the community, and
3) The statewide system of higher education.
Terra Technical CollegeFremont, Ohio
Mr. Rex DamschroderChairman of the CommitteeFremont; Ohio
Dr. Richard M. SimonPresidentTerra Technical College
Mr. Roy Armes, Vice PresidentWhirlpool CorporationClyde, Ohio
Mr. Tom CameliaChief Operating OfficerCrogban Colonial Bank
Dr. William CasselL PresidentHeidelberg College
Mr. Roger Culbert; AttorneyFremont, Ohio
Mr. Arthur DoustChairman of tbe BoardChemi-Trol Chemical Company
Mr. Fred JacobsVice-President of SalesRoppe Corporation
Mr. Lee Koenig, PresidentCrown Battery Mfg. Company
Mr. Royce Kuhlman,Vice-Presiden4 Industrial Div.Masser Construction
Mr. William LytleRetired MerchantFremont; Ohio
Ms. Barbara MarleyAttorney dr MayorFostoria, Ohio
Mr. James DaubelPublisher-EditorFremont News Messenger
Ms. Christine Schneider-SmithCASS Enterprises
Mr. William ReinekePresidentReineke Tiin Ford- Lincoln-Mercrry, Inc.
3 7
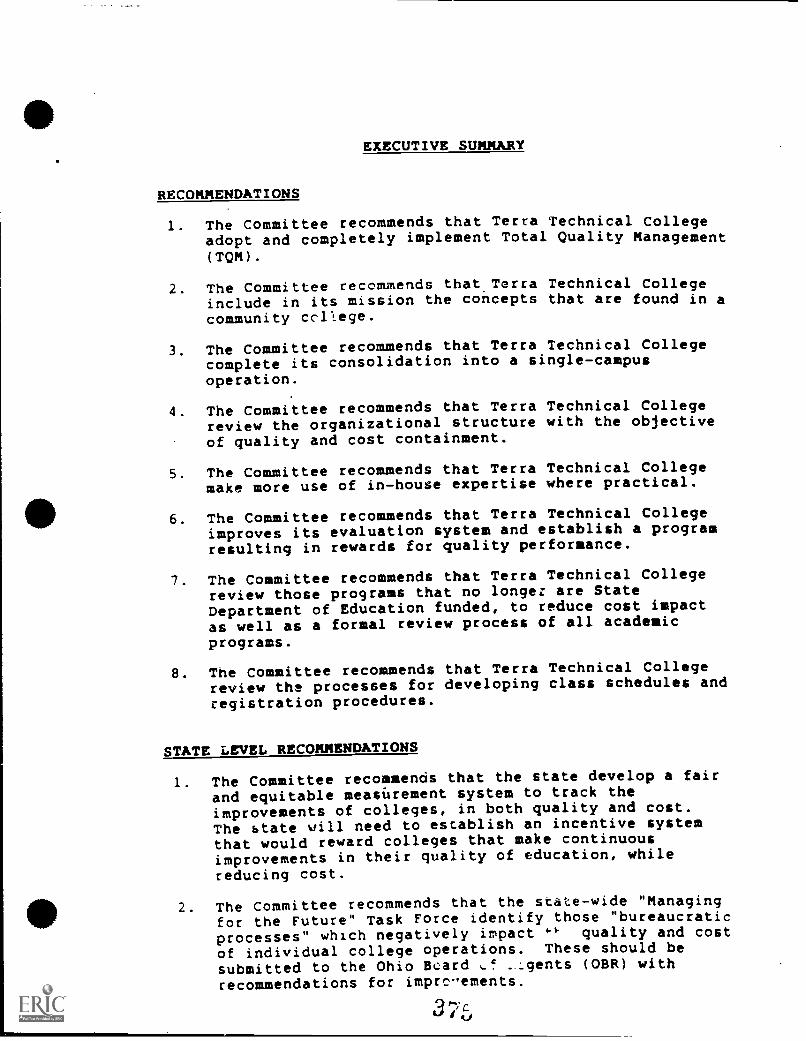
EXECUTIVE SUMMARY
RECOMMENDATIONS
1. The Committee recommends that Terra Technical Collegeadopt and completely implement Total Quality Management(TQM).
2. The Committee recommends that Terra Technical Collegeinclude in its mission the concepts that are found in acommunity college.
3. The Committee recommends that Terra Technical Collegecomplete its consolidation into a single-campus
operation.
4. The Committee recommends that Terra Technical Collegereview the organizational structure with the objectiveof quality and cost containment.
5. The Committee recommends that Terra Technical Collegemake more use of in-house expertise where practical.
6. The Committee recommends that Terra Technical Collegeimproves its evaluation system and establish a programresulting in rewards for quality performance.
7. The Committee recommends that Terra Technical Collegereview those programs that no longer are StateDepartment of Education funded, to reduce cost impactas well as a formal review process of all academicprograms.
8. The Committee recommends that Terra Technical Collegereview the processes for developing class schedules andregistration procedures.
STATE LEVEL RECOMMENDATIONS
1. The Committee recommends that the state develop a fair
and equitable measurement system to track theimprovements of colleges, in both quality and cost.The state will need to establish an incentive systemthat would reward colleges that make continuousimprovements in their quality of education, whilereducing cost.
2. The Committee recommends that the state-wide "Managingfor the Future" Task Force identify those "bureaucraticprocesses" which negatively impact "- quality and cost
of individual college operations. These should besubmitted to the Ohio Board 1/4.f ..:gents (OBR) withrecommendations for imprcements.
University of ToledoToledo, Ohio
Ronald McMaster (Co-Chair)Glastech, Inc.
Ivan W GorrCooper Tire 6. Rubber
Darryl AllenTrinova Corporation
Robert KingFifth Third Bank
Borge R. ReimerDana Corporation
James Caldwell50 Men 6. Women
Carl V. Patton (Co-Chair)Vice Pres. for Academic Affairs
Scott G. McNag DeanArts 6. Sciences
Prof Joseph C SommervilleAdmin. 6. Suprv. Education
Prof Julia BaldwinLibrary Administration
Prtf: Donna AdlerHealth 6 Human Services
Prof Alfred Cave(Prof Larry Wikox, Alternate)Faculty Senate
UNIVERSrTY OF TOLEDOMANAGING FOR THE FUTURE INSTITUTIONAL TASK FORCE
EXECIMVE SUMMARY
The University of Toledo Managing For the Future Task Force reviewedmaterials prepared by staff of the University addressing the many lamesdeveloped by the Statewide Task Force.
The UT task force found that the questions posed by the state task for didnot completely or accurately reflect the most important cons facing theuniversity. The committee answered these questions, however, but focusedon cost drivers and sources of revenue. There was agreement that theUniversity will need to understand better those items whkh drive its costs aswell as its sources of revenue.
UT Task force members included six senior business and coatnumity leaders,the vice president for academic affairs, the drat of the Collage of Arts andSciences, three members of the university faculty, and a representative of theFaculty Senate.
Actions Recommended:The University of Toledo should carry out the following actions:
Develop a state of the art information system for strategic derisionmaking.
Quantify the factors that drive its costs.
Develop a revised mission statement that refers to °quality; whichcan be quantified.
Set priorities for goals in the university's mission statement
Implement a process of directed admissions.
Develop an understanding of the implications of its mix of students.
Give emphasis to achieving diversity, nudntahting access, andretaining minority students, faculty and staff.
Develop self-paced dasses for the underprepared.
Begin a process of dearly articulated program review.
Encourage the University Board of Trustees tt act strategically.
The state of Ohio should carry out the following achy's:
Fund higher education adequately.
Remove the cap on tuition.
Allow universities with uncapped enrollments to set enrollmentlimits.
Respond to me demand for more need-based financial aid.
Washington State CommunityCollege*Marietta, Ohio
*Eicanpt
6
Wright State UniversityDayton, Ohio
Mr. John A. BoschVice President d General ManagerGiddings d Levis Measurement Systems
Mr. Thomas G. BreitenbachPresident d CEOMedAmerica Health Systems Corp.
Dr. Robert D. DixonVice President d Senior ScientistBCD Technology, Inc.
Mr. Daniel W. DuvalPresident d CEORobbins dr Myers, Inc.
Mr. John S. HaddickChair dr CEOThe Duriron Company, Inc.
Mr. Frederick W. SchantzPresident d CEC'First National Bank
,e
INTRODUCTION
The Wright State University Committee on Managing for the Future views thepresent crisis in funding for public higher education as structural rather thantemporary. The cost of pliblic higher education has been growing faster than theeconomy and must be brought within the bounds imposed by limited revenue atthe same time, the state needs to educate more effectively and train a largerproportion of its citizens in order to enhance its economic future. To meet thischallenge, we must implement dramatic changes in the system in such a way so asto break the traditional assertion that quality and higher cost are directly related.
Public higher education is easily politicized both in its governmental support andcontrol and inside its educational institutions. The formation of the Ohio Board ofRegents (OBR) and the introduction in the 1960's of a formula-based subsidy werevery successful efforts to rationalize the budgets and programs of educationalinstitutions. The independence of existing universities and new institutions createdduring that period encouraged the efficient development of a diverse educationalsystem to meet the needs of a diverse state. We strongly support that system andsubmit our recommendations with the advice to avoid the creation of any additionalbureaucracy to administer the Proposed policies.
The state public educational institutions operate independently and form their owngoals, consistent with the intentions of their boards and existing and projectedeconomic constraints. As with any complex system, the constraints on the systemoften strongly affect its output. The specific funding policies set by the OBR shapethe state educational system because the policies provide much of the economicreality in which the individual public educational institutions exist. Thus, we believethe OBR has the power to shape higher education in the state without changing itsbasic structure.
The committee participated in an extensive and effective process conducted byWright State University, in order to reduce expenditures permanently and focusWSU's efforts on essential academic activities. This process, which resulted in $6.5million in reductions, is discussed in Section 2. Even though we are pleased withthis result, accomplished by a very strong and effective effort by both faculty andadministration, we believe this may only be a first step the total evolving economicsituation. The current climate calls for the development of a culture in the universitysystem that is willing to establish true systemic change in the ways the entire Ohiosystem functions.
Some of the questions that this report must answer relate to how universitiesevaluate quality. Wright State University operates through a good faith effort basedon tested academic traditions, but there is much to be done in establishing
measurable goals for quality improvement. Better management techniques have
been introduced over the past decade, and individual university units have been
encouraged to take innovative approaches to cut costs and improve the quality of
the services they provide. These questions are answered in detail in Section 3,
with information provided by the university.
The committee is submitting a set of recommendations to the state which we hope
will help create an environment for quality and change in the state educational
institutions. It is necessary that the state require that each educational institution
put quality procedures in place and establish measurable goals. Atthough the
procedures are fairly standard in academic institutions and expressed standards
are similar, the performance of the institution may not be closely related to
effectiveness of these procedures, and the standards may not be appropriate. In
many ways, academic performance, and hence evaluation, has been on an
individual basis, whereas, the performance of an institution is more than the sum of
these efforts. More importantly, the performance of the state educational system is
more than the sum of the performance of the individual institutions. The state
should institute system wide goals and establish funding and control systems
based on the accomplishment of those goals.
The goals that the state needs to establish should be determined through a public
process. The recommendations given here, and explained in Section 1, speak
more to an environment for attaining those goals. These recommendations must
be considered collectively rather than individually.
1. Eliminate unnecessary and ineffective programs.
2. Define specific roles for each educational institution and institute
selective and tiered admissions.
3. Define system-wide goals and provide incentives for accomplishing those
goals.
4. Institute policies that make the collective state institutions function as a
system.
5. Encourage the use of technology on a system-wide basis to improve the
quality and distribution of education.
6. Encourage and permit local control of those items which will not result in
incompatibilities in the system.
0 <-LI .4t
Youngstown State UniversityYoungstown, OhioMr. Peter A. Fetterog ChairpersonRetired Division Manager, Ohio Edison Company
Ms. Barbara ScbwebeL Vice ChairpersonFormer YSU Publications Director
Mr. William G. MittlerRetired General Manager, Vindicator
Mr. Edgar GiddensPersonnel Department; General Motors; Lordstown
Mr. Charles J. McCrudden, Jr.President; McGrudden Heating d Supply, Inc.
Dr. Robert Pegues, Jr.
411111
Retired Superintendent Youngstown d Warren Schools
Dr. Ralph G. CrumProfessor, Engineering Technology
Dr. Duane F. RostProfissor, Electrical Engineering
Dr. Thomas A. MaraffaAssociate Professor, Geography
Ms. Patricia A. BleidtDirector, Student Developmental Services
Dr. David C GenawayUniversity Librarian
Ms. Eileen. Greaft CPADirector, Internal Audit
Ms. Willa Mattern, Secretor)!
OC.300,),
41Recommendations to Youngstown State University
A. Academic Prot:121s and Administrative Structure
Although changes are made annually in programs. courses and job descriptions, the Univer-
sity has not systematically evaluated its academic programs or its organizational structure for a
number of years. The Report of the Strategic Planning Team offered some ideas for restructur-
ing that stimulated considerable discussion. Consevendy, the University should:
1. Review the academic structure of the University with, at a minimum, the following
goals:
a. Evaluate existing or proposed academic programs and assess their roles inauvancing the University's mission.
b. Evaluate programs and course offerings to insure maximum subsidy without
diminishing the quality of undergraduate education. Such evaluation should inclu...:e
a careful review of University requirements regarding the ratio of lower to upperdivision courses, the role of two-year programs in encouraging the pursuit of bac-calaureate degrees, and remedial course offerings.
c. Offer recommendations resulting from the program review.
d. Evaluate the existing college structure to insure that, given current budget con-
straints. it be meets the needs of programs. Offer recommendations for change
where applicable.
2. Review the administrative structure of the University with special emphasis on:
a. Reorganization of the administrative structure from the top level to department chairlevel with the goal of consolidating responsibilities wherever possible.
b. Continue to review role of athletics in the overall educational mission of the
University.
B. Evaluation Policies
In an era of constrained resources, the University needs to reinforce efforts to sustain
productivity and high-quality instruction among faculty and in its programs. As accountabilitybecomes increasingly important, the University needs to improve and standardize evaluationand reporting techniques. Therefore, the University should:
1. Inrire that evaluations of all University departments are conducted on a regular basis,through outside accreditation and reviews or through mandatory self-evaluations.
2. Require standard annual reports cf activities for all faculty including research and
Fublications.
3. Develop guidelines for required information in annual department reports to facilitateconsistency and compieatness of information.
4. Pursue the establishment of a State-sponsorad Trustee Orienuui program. Supple-ment this type of program with an annual Youngstown State University Board Orienta-tion seminar addressing the responsibilities/roles of Youngstown State University's
board members.
S. Through the Personnel Department, expand the scope of orientation and training semi-
nars for all personnel to:
a. Cover the reasons for pertinent policies and procedures, not just the mechanics.
b. Communicate expectations of performance) c6../
c. Encourage communication upward, downward and laterally.
d. Identify available resources.
6. Intensify and standardize all data collection and reporting efforts especially those
related to productivity a.'d quality, e.g., faculty publications and the progress of
underprepared students.
7. Maintain opportunities for staff/faculty to update knowledge or continue education.
Explore external funding to support research, release time, individual or departmental
merit rewards, etc.
C Class Scheduling
The Task Force recognizes that two of the most attractive features of Youngstown State
University are its small class sections and early exposure of students to full-time faculty in
introductory courses. Nonetheless,-as resources become constrained, the University must seek
ways to continue to serve its varied student population at lower cost, with greater efficiency,
and without undo sacrifices ill quality. Therefore, the University should.
1. Examine class scheduling and class sizes to maximize efficiency. Examples include but
are not limited to:
a. Role of weekend and early morning classes.
b. Increasing class limits in elementary and beginning-level classes to capacity of
MOMS.
c. Reducing number of class sessions per week with corresponding increase in length
of each session.
d. Video lectures in lower division classes where lectures are consistent from quarter
to quarter.
A Budget Policy
Current University policy implicitly encourages a "use-it-or-lose-it" mentality among aca-
demic and non-academic departments. The University should:
1. Develop an approach tc budget planning that is based on establishing priorities, rather
than on across-the-board allocations and cuts.
2. Encourage signature authorities to "underspend" annual budgets by incentives (i.e.,
carryover of a predetermined percentage of unused operating budgets into subsequent
budget periods) and by cost recovery within operating budgets.
E. Marketing, Outreach and Fundraising
The University is seeking to bolster and coordinate its efforts in marketiag, outreach and
fundraising. In conjunction with suggestions of the Five Year Marketing Plan and the Reportof
the Strategic tanning Team, the University should:
1. Hire a full-time, professional lobbyist to provide information about Youngstown State
University and to protect and increase the University's oesources at the State and fed-
eral levels.
2. Develop a more effective fimdraising bards in j on with the Youngstown
State University Foundation, Alumni Association and Penguin Club.
3. Continue to examine the long-term impact on continuing operating expenses when cap-
ital projects are being considered, regardlessof source of capital funds. When capital
gifts are offered, make every attempt to c'lltain adequate endowments for operating
expenses before accepting.p
120
4. Develop and market programs that target future enrollment markets such as the feder-ally funded Upward Bound program offered to high school students.
5. Expand or improve the marketing of our Individualized Curriculum Program (ICP).
6. Encourage the concept that recruitment is a total University commitment. This conceptendorses:
a. The "Each One, Reach One" employee program.
b. Sending recruiting "teams" to area high schools (include representatives fromAdmissions, faculty, administration and current students).
c. Raising faculty awareness of the need for their active participation in marketing,recruitment and retentioninside the classroom as well as outside.
7. Expand minority recruitment/outreach efforts.
8. Continue to encourage.public events on campus for potential students.
9. Encourage expanded solicitation of :menial funding for research.
F. Fee StructureThe University has provided a broad range of services funded by tuition. Recently the
University enacted an across-the-board fee for lab courses to partially recover associated costs.
1. The University should monitor the effectiveness of this policy and evaluate it againstthe alternative of cost-based fees for specific courses/programs. The goal of fee policyshould be to insure that the fee structure recognizes the higher costs of certain courses.
2. The University should evaluate the feasibility of consolidating or replacing the miscel-laneous administrative fees, such as change-of-registration, with an enrollment servicesfee which is assessed each student each quarter. The purpose of the fee would be toprovide streamlined services and to guarantee the stable revenue source necessary toprovide these services. The 'Disk Force recognizes that changes in fee policy may becontingent on revision of the pertinent section of the State Appropriations Act.
3. Any changes in fee policy should enhance revenues or at least be revenue-neutral.
4. The University should .::,plore the feasibility of a financing model based on high tui-tion and high financial aid in order to collect a greater percentage of full educationalcosts from students who can afford to pay, while using a significant portion of theadded tuition revenue for grants to low-income and lower-middle income frunilies tohelp cover the cost of higher tuition.
S. If legally possible, offer reduced out-of-state surcharges to residents of Mercer,Lawrence and Butler counties in Pennsylvania to act as an additional ratraction to theUniversity for these students. The University should pursue any changes in State policynecessary (Appendix I).
G. Personnel
It should be emphasized that Youngstown State University personnel costs are low andemployee productivity high. Howev: ersonnel issues at lbunptown State University are com-plicated by union contracts that bor- meet rights of employees an° establish terms of employ-ment. Such contracts also inhibit u.. Jexibility of the administration to react in times of crisis.
Recent contract negotiations have become increasingly accrimonious and difficult. Resourceconstraints will likely exacerbate this situation. Union representatives and the administrationalike need to cooperate to meet the challenges of the coming years. The University needs toreview all aspects of employee compensation, which represents Fi% of the educational and
133 5 BEST COPY AVAILABLE
general budget, with the goal of containing costs, while also upholding the need to recruit and
retain high-quality faculty and staff. The Task Force offers the following specific recommenda-
tions and acknowledges that many of them speak directly to contract issues.
Foster unity of purpose among faculty and staff by articulating University goalsboth
long- and short-termon a regular basis, e.g., at the State of the University assembly,
in an internal newsletter, through other new or expandc.-A channels of communication.
2 Centinue the early retirement incentive program for STRS members and develop a
similar program for PERS n.- tubers.
3. Review starting and ongoing salary scales. Balance the need to contain costs with the
need to recruit and retain high-quality faculty.
4. Guard against wholesale cutting of limited-service faculty.
5. Modify terms of Extended Teaching Service contracts to develop lower rates of
compensatio:..
6. Provide incentives other than salary increases (e.g., personal days, etc.).
7. Develop policies to measure and distribute workload more equitably among faculty and
staff.
8. Continue to monitor the use of overtime and pursue use of shifts and alternate days-off
to aid in reductions.
9. Establish University-wide staffing guidelines (e.g., FTE support:FTE faculty ratios,
student headcount:staffratios, etc.) and identify imbalances. Redistribute staff accord-
ingly. Do not wait for positions to become vacant before evaluating, and do DOC allow
areas experiencing vacancies to suffer inequitably.
10. Develop procedures to permit the use of short-term employees from outside agencies to
fill temporary vacancies rather than promote multiple moves when current full-time
employees take short-term assignments outside the "home" department.
11. Create more flexibility by offering 9-, 10- and 11-month contract appointments so that
departments which have seasonal "downtimes" are not overstaffed during these
periods.
12. Encourage use of variable work-week schedules in offices which experience highs and
lows in workload (less staff work during downtimes, more staff working more hours at
busy times). Consider the use of four-day work weeks in which staff schedules are
rotated but offices continue to operate as they are presently.
13. Develop a formal procedure for "sharing" support services (e.g., secretarial). Persons
in same job classifications could complete surveys to identify busy and slow times. Per-
sonnel Services could be responsible for coordinating this "emergency pool" This pool
could also be utilized for filling temporary leaves of absence, providing faculty
assistance with research publications, etc.
14. Develop policies to encourage all qualified employees to teach classes as part of their
normal workloads.
15. Increase the use of student employees in order to reduce use of independent contractors
and/or other employees whose jobs do not require specialized skills/training.
H. Operations
The University has always emphasized low operating costs. Recognizing the role of continu-
ous review and feedback to this process, the following recommendations are offered:
kJ u 14
1. Establish an internal University newsletter to replace miscellaneous other suchpublications.
2. Review computer need.. and applications throughout the University on a "contributionto efficiency/cost savings" basis and reestablish priorities as indicated. Examplesinclude: computerization of manual processes. mail bar coding and integration ofsystems.
3. The existing rigorous prog am of energy and utility conservation should include:
a. Ongoing assessmei of the heating. cooling and lighting systems.
b. Ongoing assessments of building and classroom utilization.
c. Expansion of recycling programs which are profitable and enhance the image of the
University.
4. Evaluate the current investment strategy's ability to maximize return on investments.
5. Continue to review current mail policies and procedures, including:
a. Cross-referencing students, employees and alumni to eliminate duplicate mailings.
b. Maximizing use of postal presort services by coordinating and standardizing mail-ia.E,s from the various departments.
c. Reducing overnight mailings and utilizing new Postal Service options for two-daydelivery
6. Continue to review potential benefits of outsourcing. Examples include:
a. Investigate the potential for realizing greater rates of return on endowment invest-ments through external management.
b. Evaluate the potential savings of "phasing out" Motor Pool operations and, instead,bidding out such vehicle requirements to a local leasing or related-type company.Utilize cost-efficient vehicles.
c. Closely monitor the financial stability of the Bookstore and, if not self-supporting,bid service out.
d. Apply for private grants to finance capital cost over-runs for a child-care facility.Consider bidding out the management of the facility to avoid cost to the University.
e. Investigate the use of a service company to administer ,s,11 maintenance agreements.
7. Continue to consolidate services/programs where practical.
8. Other suggestions for reducing operating costs include:
a. Combine all University-wide memos and notices into one weekly notice.
b. Encourage all employees to utilize the Media/Print Center instead of officeauditrons whenever ten or more copies of the same item are required.
c. Consolidate the duties and physical location of the two separate Personnel offices.
d. Standardize equipment, lights, ceiling tiae, water fountains, vehicles, plumbing fix-tures, etc. throughout campus.
9. Consider printing catalogs every two years with annual supplements, if necessary,instead of every year. Instruct readers to "contact the department for the most currentdegree requirements."
10. Solicit and reward employees' ideas which result in increased efficiency/quality.
I
Recommendations to the State of OhioThe Task Force is are that Youngstown State University is part of a comprehensive State
system of higher education. As such, each institution in the system must seek to serve theneeds of its constituent population while minimizing duplication of programs and facilities.With this in mind, the following recommendations address state policies regarding higher edu-cation. They reflect the following concerns:
A. The general level of State support for public higher education in Ohio.
B. The need for each university to establish fee policies to maximize flexibility and torecognize the unique location and mission of each university.
C. The need to avoid duplication of programs, facilities and services and to increaseinteruniversity cooperation.
D. The need to consider changes in operation and governance in public higher education.A. State Funding
1. By new or increased taxes, fund higher education in Ohio at the median level amongall states instead of at the lowest quartile, thereby decreasing the portion of collegecosts provided through tuition.
2. Insure that the subsidy formula clearly reflects the importance of an undergraduateeducation to the economy of Ohio.
3. Examine the role of universities in remedial education, recognize the higher costs ofsuch programs, and fund accordingly.
4. Review State assistance to private institutions (e.g., bond guarantees and Ohio Instruc-tional Grants) to assess whether such assistance is adversely affecting public institu-tions. Instructional grants should be limited to the average OIG awarded to studentsattending public institutions.
5. Assist State universities in their efforts to attract and retain bright and productive non-residents by subsidizing all such students to a greater degree (Appendix I).
6. Develop State financial aid packages that are not predicated upon full-time status sothat part-time students may be helped.
B. University Fee Policies
1. Discontinue tuition caps and allow each institution to adjust its tuition in response tomarket conditions.
If tuition caps remain in place, amend the State Appropriations Act to allow institu-tions to charge each student an enrollment services fee that consolidates miscellaneousand administrative fees (for change-of-registration, transcripts, etc.).
2. Enact legislation to permit Youngstown State University to discount the out-of statesurcharge for students in adjacent Pennsylvania counties.
3. Consider instituting a financing model which is based on high tuition and high finan-cial aid. Current tax subsidies would continue but public policy would be modified tocreate a "secondary subsidy" for needy studentsgrants derived from the increasedtuition revenue.
C. Interuniversity Relations
1. Reduce the number of branch campuses located the service areas of other universi-ties in order to consolidate classroom space and reduce duplication of programs andcosts.
16)

2 Encourage and support expanded inter-institutional linkage through consortiumdegrees and coordinated programming, such as:
a. Coordination of technical training with joint vocational schools.
b. An advanced engineering research center to support Youngstown State University,the University of Akron and Cleveland State University.
c. Inter-institutional program in international business.
3. Establish a State-wide University Quality Management Committee which would reviewcost-saving ideas and suggestions for improved quality and efficiency, then publish itsfindings in a newsletter.
1). Operations and Governance
1. Allow applications for new academic programs to be evaluated on proposed staffingpatterns rather than on staff in place.
2. Review the process by which priorities for capital funding are established to insure thatprojects which contribute to increased efficiencies or reduced costs receive highestpriority.
3. Reduce State invol ..ernent in construction projects by allowing universities to managetheir own projects (as community colleges already do).
4. Continue to encourage the implementation of equipment replacement reserve fund pro-grams similar to the successful program established at Youngstown State University in1982.
5. Consider "pooling" at the State level for:
a. Health insurance (employees and students)
b. Risk insurance
c. Common purchases
6. Encourage the Board of Regents to hold as many briefings and other meetings as possi-ble by teleconference. When it is necessary to hold meetings in Columbus, coordinatetheir so that several swaps (e.g., CEOs, CFOs, chief academic officers) are scheduledat the same time.
7. In the interest of improving the state's business climate, seek amendments to public law(ORC 4117) to provide the best balance between organized labor and m_ :agement.
8. Review the Board of Trustee appointment process and assess its ar,:equacy in achiev'ngbalanced representation. The process should insure a diversified composition in regardto profession, race and sex.
9. Establish a New Trustees' Orientation program to acquaint trustees with their responsi-bilities/roles as board members, board officers and board committee members. Includepresentations by representatives of the Governor, the Attorney General and the EthicsCommission. Initial programs should be attended by all current trustees as well asthose newly appointed.
3s
17