studyreport energy renewable source
DESCRIPTION
renewable energy study reportTRANSCRIPT

Authority for Electricity Regulation, Oman
Study on Renewable Energy Resources, Oman Final Report
May 2008


Renewable Energy Resources in Oman
Page 3 of 134
.
Authority for Electricity Regulation, Oman
Study on Renewable Energy Resources, Oman Final Report
May 2008
COWI and Partners LLC P.O.Box 2115 RUWI Postal Code 112 Sultanate of Oman Tel +968 2460 4200 Fax +968 2460 4788
Report no. 66847-1-1
Issue no. Rev. 0
Date of issue 12.05.2008
Prepared SEM/NBP/KF/SAJ
Checked JHA/DEM
Approved SAJ
This report contains the views of the Consultant which do not
necessarily correspond to the views of the Authority for Electric-
ity Regulation, Oman.

Renewable Energy Resources in Oman
Page 4 of 134
.

Renewable Energy Resources in Oman
Page 5 of 134
.
Table of Contents
1 Introduction 8 1.1 Background to the Study 8 1.2 Study Methodology 9 1.3 Collection of data and information 9 1.4 Report Structure 10 1.5 Acknowledgements 10 1.6 Abbreviations and conversion factors 11
2 Executive Summary 13 2.1 Purpose of the Study 13 2.2 Conclusions 14 2.3 Recommendations 24
3 Key information for Oman 31 3.1 Demography 31 3.2 Industry 31 3.3 Electricity sector in Oman 36 3.4 Renewable energy activities in Oman 48 3.5 Conventional energy resources in Oman 48
4 Renewable energy resources in Oman 53 4.1 Wind energy 54 4.2 Solar energy 57 4.3 Biogas 60 4.4 Wave energy 63 4.5 Geothermal energy 64
5 Renewable energy technologies 67 5.1 Wind turbines 67 5.2 Solar PV panels and heaters 72 5.3 Biogas production 83 5.4 Wave energy absorption units 85 5.5 Geothermal power plants 88 5.6 Non energy benefits 90 5.7 Energy efficiency 91

Renewable Energy Resources in Oman
Page 6 of 134
.
6 Cost of electricity generation in Oman 92 6.1 Generation based on conventional fuels 92 6.2 Generation based on renewable energy 98 6.3 Overview of generation costs in Oman 103
7 Financing mechanisms 106 7.1 Revenue by Renewable Energy production 106 7.2 Environmental Taxes 107 7.3 Tax Credits 109 7.4 Green Marketing 110 7.5 Investment Subsidies 111 7.6 Fixed Prices - Feed in Tariffs 112 7.7 Renewable Quotas - Portfolio Standards 114 7.8 Evaluation of the various schemes 116 7.9 Model suitable for Oman 117 7.10 Level of Subsidy Required 119
8 Market for renewable energy in Oman 121 8.1 Barriers 121 8.2 Renewable energy industry, Market players 125 8.3 Awareness 126
9 Renewable energy pilot projects 127 9.1 Criteria for recommendation of pilot projects 127 9.2 Solar pilot projects 127 9.3 Wind Power Project 130 REFERENCES 134

Renewable Energy Resources in Oman
Page 7 of 134
.
Appendix 1 Summary of meetings Appendix 2 Site visits Appendix 3 Analysis of wind data Appendix 4 Analysis of solar data Appendix 5 Geothermal data Appendix 6 Solar technology Appendix 7 Calculation of wind farm output Appendix 8 Details on electricity cost calculations Appendix 9 List of R&D projects in Oman related to renewable energy Appendix 10 Average production costs RAECO diesel generator stations Appendix 11 Examples of tax credit schemes Appendix 12 Details on 20 kW grid connected solar PV pilot project Appendix 13 Details on 10 kW PV/10kW diesel stand alone pilot project

Renewable Energy Resources in Oman
Page 8 of 134
.
1 Introduction 1.1 Background to the Study The Authority for Electricity Regulation, Oman (the Authority), is responsible for regulating the electricity and related water sector in Oman. The Authority has a range of statutory duties including:
• a duty to secure the provision of electricity in all parts of the Sultanate of Oman (Article (22) para (1)1; and
• a duty to secure and develop the safe, effective and economic operation of the electricity sector, (Article (22) para (3)) and a duty to afford due consideration to the protection of the environment (Article (22) para (11))
The Authority commissioned COWI/SCO (the Consultant) to identify sources of renewable energy in Oman and undertake initial technical and economic assess-ments of the potential use of renewable sources of energy for electricity produc-tion. The scope of work required the Consultant to prepare renewable energy technology profiles that would include, but not be limited to:
• Assessments of available renewable resources; • Technology descriptions; • Potential electricity production (including efficiencies, capacity factor); • Cost of energy (including equipment, installation, operating and mainte-
nance and capital costs); • Life-cycle economics; • Advantages and disadvantages of technology • Non-energy benefits of technology in particular the potential reduction in
greenhouse gas emissions; • Technical, economic, and market potential (next 3, 5, 10, and 20 years) • Market drivers; • Barriers to renewable energy (regulatory, market, information, infrastruc-
ture, technology, financial, economic); and • Recommendations to address barriers.
The Consultant was also asked to review mechanisms used by governments in other jurisdictions to provide financial support for renewable energy and advise the Authority on possible support mechanisms suitable for Oman.
1 references are to Articles in law promulgated by Royal Decree 78/2004

Renewable Energy Resources in Oman
Page 9 of 134
.
1.2 Study Methodology
The study was conducted in three phases. Each phase included the tasks de-scribed below.
Phase 1: Inception and initiation collection of data and information
Task 1 Mobilisation and planning data/information collection
Task 2 Data collection and visits to sites and authorities
Phase 2: Analysis of data and review of previous RE studies in Oman
Task 3 Technology analysis
Task 4 Economic analysis
Task 5 Technology evaluation
Task 6 Market analysis
Task 7 Barriers
Phase 3: Final analysis and reporting
Task 8 Outline cost effective options for use of renewable energy
Task 9 Appraisal of the possible financial mechanisms that could be intro-duced to encourage use of renewable energy
Task 10 Final reporting
1.3 Collection of data and information The study utilises information and data provided by various Ministries, compa-nies within the electricity sector, waste water companies, Sultan Qaboos Univer-sity and the Research Council, meteorological department, Petroleum Develop-ment Oman and the Royal Oman Police. Meetings with these authorities were based on questionnaires prepared prior to the meetings. Almost all the requested data and information was received except for data on wave energy which we un-derstand is not available. To overcome this, the Consultants undertook prelimi-narily analysis using research data derived from the literature. We recommend steps are taken to fill this information gap by collecting wave energy data to as-sist further studies and research.
During the data collection process the Consultant team was afforded the full co-operation and support of the entities we visited, all of whom expressed strong support for the utilisation of renewable energy in Oman.

Renewable Energy Resources in Oman
Page 10 of 134
.
1.4 Report Structure The report is presented in three parts.
• An Executive Summary presents the key results of the study including our assessment of renewable energy potential in Oman and our principal recommendations;
• The Study analysis starting from Section 3; and
• Appendices to the report that provide background information, detailed data, analysis and other documentation.
1.5 Acknowledgements The Consultants would like to express their gratitude to all the officials and indi-viduals who they met during the course of the study, for the kindness, support and valuable information given to the team during its stay in Oman and which has greatly assisted our work.

Renewable Energy Resources in Oman
Page 11 of 134
.
1.6 Abbreviations and conversion factors List of abbreviations AEO Annual Energy Output Authority Authority for Electricity Regulation, Oman AGL Above ground level Bcf Billion Cubic Feet BST Bulk Supply Tariff Btu British Thermal Unit (1 kWh = 3,413 Btu) CDM Clean Development Mechanism CER Certified Emission Reduction CO2 Carbon Dioxide CSP Concentrating Solar Power CCGT Combined Cycle Gas Turbine DPC Dhofar Power Company DGCAM Directorate General of Civil Aviation & Meteorology EU European Union E&P Exploration and Production EOR Enhanced Oil Recovery FIT Feed in tariff ETS Emission Trade Scheme FTZ Free Trade Zone GJ Giga Joules GT Gas Turbine GDP Gross Domestic Product GHG Green House Gas GWh Giga Watt hours HFO Heavy Fuel Oil IEA International Energy Agency IPP Independent Power Producer IRR Internal Rate of Return kV kilo Volt kWp Kilowatt-Peak kWh kilo Watt hours LCV Low Caloric Value LNG Liquid Natural Gas LRMC Long run marginal cost MAR Maximum Allowed Revenue MIS Main Interconnected System MWh Mega Watt hours NPV Net Present Value OGJ Oil & Gas Journal ORC Oman Refinery Company O&M Operation and Maintenance OECD Organisation for Economic Co-Operation and Development OETC Oman Electricity Transmission Company OPEC Organisation of the Petroleum Exporting Countries OPWP Oman Power and Water Procurement OWWC Oman Wastewater Services Company PV Photovoltaic

Renewable Energy Resources in Oman
Page 12 of 134
.
PDO Petroleum Development Oman PPP Purchasing Power Parity RO Rial Omani = 2.6 USD RES Renewable Energy Systems RET Renewable Energy Technology ROP Royal Oman Police RAECO Rural Areas Electricity Company ST Steam Turbine SEI Socio-Economic Impact SPA Sales and Purchase Agreement TS Total Solids Tcf Trillion Cubic Feet TGC Tradable Green Certificate USD US Dollar VS Volatile Solids VAT Value Added Tax W Watt WTO World Trade Organisation WTP Willingness to Pay
Conversion factors 1 barrel 158.9 litre 1 barrel crude oil Equivalent to 1325 MWh 1 barrel crude oil equivalent to 4770 MJ 1 kWh 1055 MJ 1 l crude oil equivalent to 30 MJ 1 cubic feet 0.0283168466 m3 1 m3 gas equivalent to 10.8 kWh

Renewable Energy Resources in Oman
Page 13 of 134
.
2 Executive Summary 2.1 Purpose of the Study The Authority commissioned this study to provide an overview of renewable sources of energy in Oman, and the potential use of such resources for electricity production. The government of Oman is formulating policies to promote the ap-plication of renewable energy technologies. The Authority hopes the results of this study will assist the process of developing renewable energy policies for Oman.
In terms of scope:
• the study covers solar energy, wind energy, biogas, wave energy and geothermal energy;
• the study compares estimates of the cost of electricity produced from re-newable energy and the present cost of fossil fuel (primarily natural gas) based electricity generated in Oman;
• the study presents an assessment of available renewable energy technolo-gies and the Consultant’s view of their technical suitability for use in Oman considering the available renewable energy resources, environ-mental conditions, and cost; and
• the study considers mechanisms used to provide financial incentives for promoting renewable energy projects, and identifies mechanisms which could be applied in Oman.
The technological development of renewable energy technologies is an ongoing process and technologies which are not economically viable today may very soon become relevant for Oman due to the present rapid technological development of renewable energy technologies. The study identifies Concentration Solar Power systems as a technology that may be relevant for future large scale implementa-tion in Oman.

Renewable Energy Resources in Oman
Page 14 of 133
.
2.2 Conclusions
2.2.1 Renewable energy resources in Oman The study finds significant potential sources of renewable energy in the Sultanate of Oman. The findings for each type of renewable energy are as follows:
The level of solar energy density in Oman is among the highest in the world. There is significant scope for developing solar energy resources throughout Oman and solar energy has the potential to provide sufficient electricity to meet all of Oman’s domestic electricity requirements and provide some electricity for export. High solar energy density is available in all regions of Oman: areas of highest density are dessert areas. Areas of lowest density are coastal areas in the southern part of Oman;
The study has identified significant wind energy potential in coastal areas in the southern part of Oman and in the mountains north of Salalah. Wind speeds in these areas are comparable to recorded wind speeds at inland sites in Europe where large numbers of wind turbines are installed and operational. Wind speeds are observed to be highest in summer months which coincide with peak periods of electricity demand in Oman;
Material from waste water and agricultural waste is available in northern parts of Oman. In the south, biogas material is available from waste water, agricultural waste and animal dung. However, a large amount of waste material is presently used as fertiliser. Animal waste is spread over large areas making collection of sufficient quantities of animal waste difficult and expensive. For these reasons the study finds only limited potential for biogas electricity production;
The study reviewed borehole temperature data and found temperatures to be be-low that required to allow the direct use of water for steam plants. On the basis of the data reviewed, the study finds the potential for utilising geothermal en-ergy for electricity production to be limited;
Is available along the Arabian Sea coast but the energy density is relatively low compared to other locations world wide. The potential use of wave energy is considered marginal compared to solar and wind energy resources.
Solar Energy:
Wind Energy:
Biogas:
Geothermal Energy:
Wave Energy:

Renewable Energy Resources in Oman
Page 15 of 134
.
2.2.2 Renewable energy technologies relevant for Oman
Solar energy, photovoltaic (PV) systems Two main types of solar cells are used to make solar modules. The first genera-tion are silicon wafer-based with silicone cells which has been dominating the market. The price of this type of cell has reduced considerably over the years. The advantages of the crystalline solar cells are that they are efficient, reliable with long lifetime and a long record of proven durability. Therefore, they are of-ten the preferred solution for solar based electricity production on buildings.
Thin film solar panels are less efficient and have a shorter lifetime. Thin film is increasingly used in small applications. It is generally expected that in the long term thin film technology with multi layer cells will be widely used and attain efficiencies beyond 25%. The major advantage of thin film is that they use less material and are therefore potentially less expensive than conventional PV tech-nology.
The solar photovoltaic (PV) technology is a well proven technology for produc-ing electricity. PV systems are either grid connected (with electricity fed directly into the grid system) or PV systems used in off-grid applications in small power systems in combination with diesel power gen-sets. Both types of solar PV sys-tem are relevant for Oman.
The solar PV technology is suitable for use in northern parts of Oman for produc-ing electricity for the Main Interconnected System. The solar PV technology is also suitable for electricity generation in off-grid power plants in rural desert ar-eas where the solar energy can reduce diesel fuel use. Solar energy resources are highest in northern parts of Oman and in desert areas.
The efficiency of PV cells is influenced by high air temperature and dust con-tamination. We estimate the environmental conditions in Oman would reduce the efficiency of PV cells by approximately 10 % compared to standard conditions (this does not affect our recommendations for the use of this technology in Oman).
Solar energy, solar thermal plants Solar energy can also be used to sustain solar thermal plants in what are referred to as, Concentration Solar Power (CSP) systems. In CSP systems the solar inso-lation is concentrated and used to produce steam which is converted into electric-ity as in conventional power plant. CSP systems store heat recovered during the day for use at night thereby enabling continuous electricity production. CSP technology is expected to be fully developed within the next decade and may provide capacity ranging from a few MW up to several hundred MW. We believe CSP is very well suited to conditions in Oman.
Wind energy, grid connected wind turbines Modern grid connected wind turbine technology has been developed over the last twenty years. The typical capacity of a modern grid connected wind turbine is in the range of one to five MW. Wind turbine designs can accommodate high wind or low wind conditions.

Renewable Energy Resources in Oman
Page 16 of 134
.
Wind turbines designed for low wind conditions are characterised by a large swept rotor area in relation to the capacity, and an increased hub height. Low wind turbines are suitable for wind conditions in Oman.
Modern wind turbines are equipped with cooling systems enabling operation un-der extreme environmental conditions such as the high air temperatures which occur in Oman.
Utilisation of the wind energy resources in the southern part of Oman should be further investigated. We recommend a detailed wind resource survey and further analysis of the potential connection of wind turbines to the Salalah Power Sys-tem.
Other renewable energy technologies The study finds only limited potential for producing electricity using other re-newable energy resources such as geothermal energy, wave energy and biomass. Consequently, we are not recommending the implementation of large scale elec-tricity production based on these energy resources at this time.
2.2.3 Technical potential of renewable energy
Solar energy, photovoltaic systems The theoretical potential for electricity production in Oman using solar energy is significant.
The technical potential for electricity generation by grid connected PV systems is determined by the area available for installation of PV cells (e.g. on buildings, parking areas etc). Assuming that 50% of the houses in Oman are suitable for installation of PV cells and the area available at each house is 20 m2 the total po-tential area would provide space for an installed capacity in the order of 420 MW, and a potential annual electricity production of 750 GWh/year which corre-sponds to 5 % - 6 % of the present annual electricity demand (13,900 GWh in 2007). PV systems can also be located in the desert. Typical capacity per m2 of land is about 30 Wp (Watt peak) corresponding to 30 MWp per km2.
The technical potential for electricity generation by PV systems operating with diesel gen-sets and battery storage capacity in isolated off-grid power systems is assumed to be 20% of the present electricity generation. This corresponds to 70 GWh/year and a solar PV capacity of 40 MW. By using a fraction of 20% a ma-jor part of the generated electricity can be used directly and only a minor part has to be stored.
The potential for utilising PV cells as power supply for small equipment and lighting is large. Presently the oil industry has PV cell capacity available for op-eration of small equipment in remote areas. Due to the small capacity of this type of power supply the contribution to the total electricity generation by solar power is relatively small, but should not be overlooked.
The potential for producing electricity using PV systems is highest during the summer which coincides with the period of peak electricity demand in Oman.
Renewable Energy Resources in Oman
Page 17 of 134
.
Solar energy, solar thermal plants From a long term perspective the theoretical potential for producing electricity using Concentrating Solar Power (CSP) systems in Oman is significant. CSP plants with storage for continuous supply of electricity as conventional power plants require 1 km2 of land use for 10 MW capacity. Theoretically it would be possible to supply all of Oman's present electricity consumption of 13,900 GWh by utilising about 280 km2 of desert area for solar collectors, corresponding to around 0.1 % of the Sultanate’s land area.
Wind energy, grid connected wind turbines The use of wind turbine capacity in a grid system is generally limited by techni-cal considerations. If wind turbines account for a high percentage of total gener-ating capacity, fluctuations in the energy output of wind turbines may adversely affect power quality in terms of frequency and voltage fluctuations, unless spe-cial measures are implemented to regulate wind turbine output.
The present technical potential for grid connected wind turbines in Oman is ap-proximately up to 50 MW, corresponding to 20 % of the present installed capac-ity of the Salalah Power System (251 MW). In 2014 commissioning of the new Salalah IWPP will increase the amount of generating capacity connected to the Salalah Power System to 580 MW and the potential wind turbine capacity will increase to around 120 MW. The interconnection of the Main Interconnected System and the Salalah Power System would further increase the potential for wind turbine capacity to at least 750 MW. This corresponds to an estimated net annual energy output of at least 2300 GWh/year.
The potential for grid connected wind turbines would be even higher if the inter-connected system had the capacity to transmit electricity to all load centres in Oman from the southern part of the country where wind energy resources appear to be abundant.
Wind energy resources are highest during the summer period which coincides with the period of peak electricity demand.
Wind energy, off-grid wind turbines The study finds the potential for off grid wind turbine applications to be limited. These types of applications may be relevant for electricity supply to consumers in rural areas where wind speeds are high e.g. along the coast in the southern part of Oman and where no grid connection is possible.
Renewable Energy Resources in Oman
Page 18 of 134
.
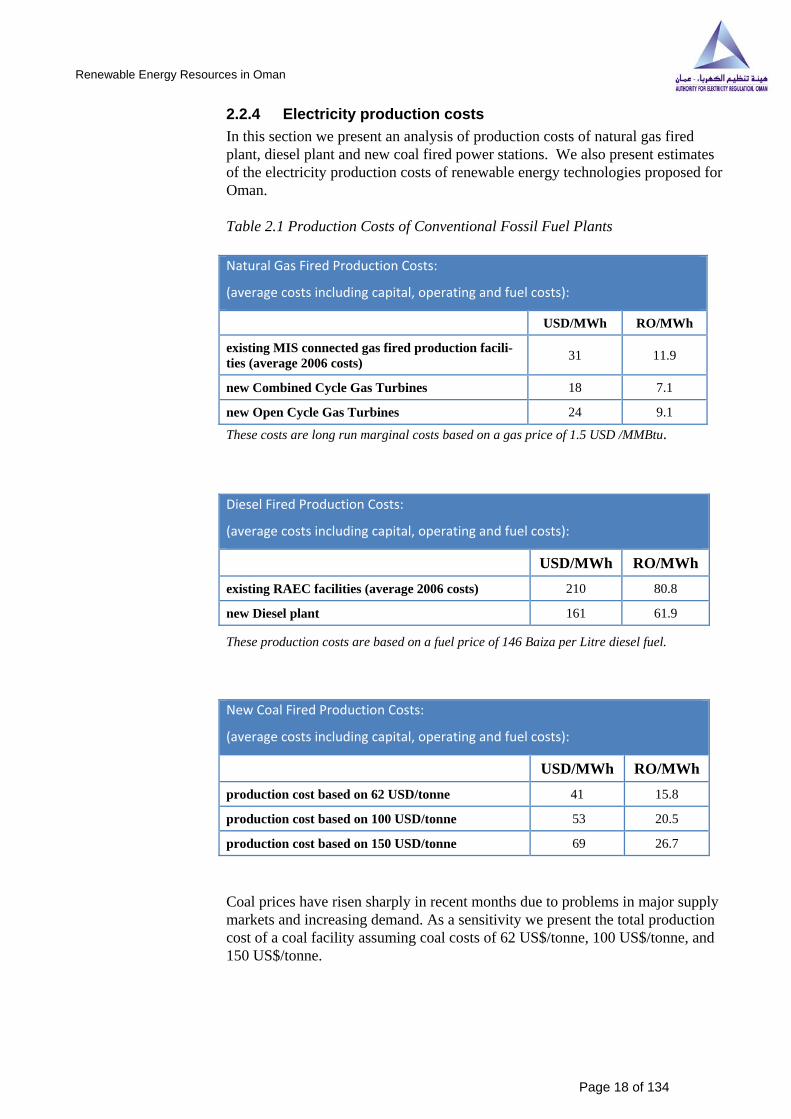
2.2.4 Electricity production costs In this section we present an analysis of production costs of natural gas fired plant, diesel plant and new coal fired power stations. We also present estimates of the electricity production costs of renewable energy technologies proposed for Oman.
Table 2.1 Production Costs of Conventional Fossil Fuel Plants
These costs are long run marginal costs based on a gas price of 1.5 USD /MMBtu.
Diesel Fired Production Costs:
(average costs including capital, operating and fuel costs):
USD/MWh RO/MWh existing RAEC facilities (average 2006 costs) 210 80.8
new Diesel plant 161 61.9
These production costs are based on a fuel price of 146 Baiza per Litre diesel fuel.
New Coal Fired Production Costs:
(average costs including capital, operating and fuel costs):
USD/MWh RO/MWh production cost based on 62 USD/tonne 41 15.8
production cost based on 100 USD/tonne 53 20.5
production cost based on 150 USD/tonne 69 26.7
Coal prices have risen sharply in recent months due to problems in major supply markets and increasing demand. As a sensitivity we present the total production cost of a coal facility assuming coal costs of 62 US$/tonne, 100 US$/tonne, and 150 US$/tonne.
Natural Gas Fired Production Costs:
(average costs including capital, operating and fuel costs):
USD/MWh RO/MWh
existing MIS connected gas fired production facili-ties (average 2006 costs) 31 11.9
new Combined Cycle Gas Turbines 18 7.1
new Open Cycle Gas Turbines 24 9.1

Renewable Energy Resources in Oman
Page 19 of 134
.
The production costs today of electricity generated by renewable energy tech-nologies using renewable energy resources in Oman are shown in Table 2.2.
Table 2.2 Production Costs of Renewable Energy Technologies
Renewable Energy Production Costs:
(average costs including capital and operating costs):
USD/MWh RO/MWh
solar PV, small grid connected 425 163.5
PV/diesel hybrid system, 10% solar energy 245 94.2
solar PV, large grid connected 250 96.2
solar thermal plant 207 79.6
grid connected wind farm (Thumrait) 74 28.3
Comparison of fossil fuel and renewable energy production costs Figure 2.1 compares the production cost of electricity produced using conven-tional fossil fuel technology and renewable energy resources.
Fig. 2.1 Long Run Production Costs: Fossil Fuel & Renewable resources 1).
1) Assumptions:
1) Fuel costs: Natural gas low gas price 1.5 USD/MMBtu, high gas price 6 USD/MMBtu
Diesel Oil 0.38 USD/Litre Coal 62.45 USD/ton, HFO 50 USD/barrel
2) Station life (in cost calculations): Gas (GT & CCGT) 25 years, HFO, Coal & new Diesel 30 years, PV 25 yrs Wind >20 years
3) Operating hours: GT, CCGT, HFO & Coal 7500 hours, New Diesel 5000
4) Discount rate: 7.55%
9.1
26.519.3
28.515.8
61.9
163.5
96.2
79.6
94.2
34.1 28.3
GT (gas cost $1.5 mmBTu) 140MW
GT (gas cost $6 mmBTu) 140MW
CCGT (gas cost $6 mmBTu) 400MW
Heavy Fuel Oil
300MW
Coal Steam 1000MW
New Diesel Unit 1MW
Small PV Grid
connected 20 KW
Large PV Grid
connected 20 MW
Solar Thermal 20 MW
Small hybrid PV‐Diesel system 10kW
Wind Farm Joba area 20MW
Wind Farm Thumrait area 20MW
Fossil Fuel Generation Renewable Energy Resources
Baisa/kWh

Renewable E
Energy Resources in Oman
Our analytechnologusing renemight redu
• in
• remcafo
• addato
Fig 2.2 prthermal an
Fig. 2.2 D
At the prerenewablePV and So
At a gas marginallysume the premium plant is br
The cost higher tha
ysis indicatesgy, at presentewable energuce the obse
ncreases in th
ductions in more widespral progress (nossil fuel tech
djusting the camage' of em renewable e
resents differnd solar PV)
Differences in
esent gas prie resources iolar Therma
price of 6 Uy lower thanopportunity of 3% p.a.,
roadly simila
of electrician gas based
s that the cot fuel pricesgy technologerved differe
he cost of fo
the capital cread applicatnoting that thnology); an
cost of fossimissions (theenergy techn
rentials in th) based elect
n gas costs a
ice in Omanis considerabal is significa
USD/MMBtn that of elecost of natu
the cost ofar.
ity producedd electricity a
st of electric, is lower thgies. There aences in foss
ossil fuels;
cost of renewtion (economtechnical prond
il fuel generese costs counologies).
he cost naturtricity produ
and solar &
n of 1.5 USDbly more coantly more c
tu the cost ectricity genural gas is 3f electricity
d using solaat all gas pri
city generatihan the cost oare howeversil fuel and r
wable technomics of sale)ogress migh
ation to refluld be direct
ral gas and ruction at a ra
& wind energ
D/MMBtu eostly than gacostly.
of electricitnerated using.0 USD/MMproduced b
ar energy rices.
Page 20 of
ion using fosof electricityr several facrenewable en
ologies resul) and advanc
ht also reduc
ect the 'envitly ascribed
renewable (wange of gas p
gy productio
electricity pras based elec
ty from wing natural ga
MBtu and adby wind turb
resources is
f 134
ssil fuel y produced ctors that nergy costs:
lting from ces in technie the cost of
ironmental as a benefit
wind, solar prices.
n costs
roduced usinctricity, Sola
nd turbines as. If we add a depletiobines and ga
significantl
.
:
i-f
ng ar
is s-
on as
ly
Renewable E
Energy Resources in Oman
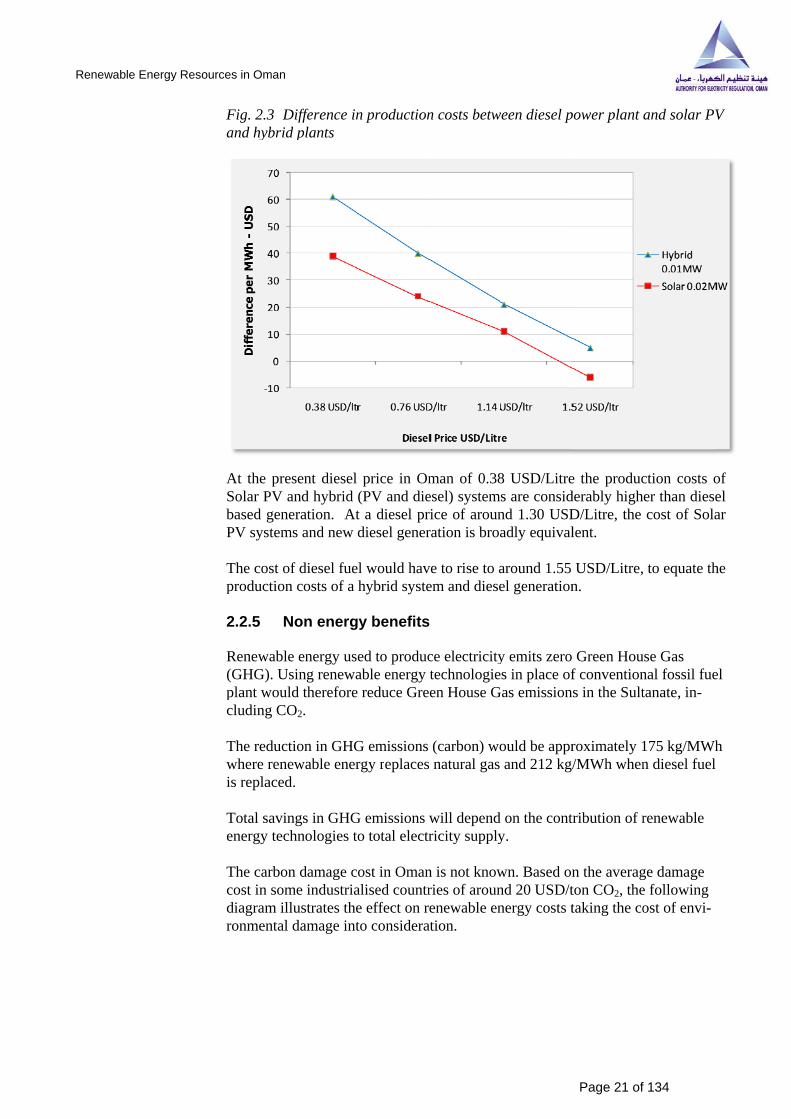
Fig. 2.3 Dand hybrid
At the preSolar PV based genPV system
The cost oproduction
2.2.5 N
Renewabl(GHG). Uplant woucluding C
The reducwhere renis replaced
Total savienergy tec
The carbocost in somdiagram ilronmental
Difference ind plants
esent diesel and hybrid
neration. Atms and new
of diesel fuen costs of a
Non energ
le energy usUsing renewauld thereforeO2.
ction in GHGnewable enerd.
ings in GHGchnologies t
on damage cme industriallustrates thel damage int
n production
price in Om(PV and diet a diesel prdiesel gener
el would havhybrid syste
gy benefits
ed to producable energy
e reduce Gre
G emissions rgy replaces
G emissions o total electr
ost in Omanalised countre effect on rto considera
n costs betw
man of 0.38esel) systemrice of arounration is broa
ve to rise to aem and diese
s
ce electricitytechnologieen House G
(carbon) wo natural gas
will dependricity supply
n is not knowries of arounenewable en
ation.
ween diesel p
8 USD/Litres are considnd 1.30 USDadly equival
around 1.55 el generation
y emits zeroes in place of
Gas emission
ould be apprand 212 kg/
d on the conty.
wn. Based onnd 20 USD/tnergy costs t
Page 21 of
power plant a
e the producderably highD/Litre, the lent.
USD/Litre,n.
Green Houf convention
ns in the Sult
roximately 1/MWh when
tribution of r
n the averagton CO2, thetaking the co
f 134
and solar P
ction costs oer than diescost of Sola
to equate th
use Gas nal fossil fuetanate, in-
175 kg/MWhn diesel fuel
renewable
ge damage e following ost of envi-
.
V
of el ar
he
el
h l

Renewable E
Energy Resources in Oman
Fig. 2.4 Dtaking car
As can beUSD mMCO2 emis
For renewthe figure
Fig. 2.5 Dand hybrid
Solar PV bUSD/Litre
Differences rbon damag
e seen wind eBtu includinsions) is inc
wable technobelow.
Difference ind plants taki
becomes coe, and enviro
in gas costs e into consid
energy becong depletioncluded in the
ologies repla
n productioning carbon d
st effective onmental co
and solar aderation
omes viable an when the ce assessment
acing diesel t
n costs betwdamage into
for RAEC wosts are taken
and wind ene
at a natural gost of envirot.
the cost diff
ween diesel po considerat
when the cosn into consid
Page 22 of
ergy produc
gas price of onmental im
ference is illu
power plant ation
st of diesel rderation.
f 134
tion costs
f app. 3.0 mpacts (only
ustrated in
and solar P
reaches 1.14
.
V
4
Renewable Energy Resources in Oman
Page 23 of 134
.
2.2.6 Future scenario for utilisation of renewable energy in Oman
Our analysis clearly indicates that at present the cost of fossil fuel based electric-ity is below that of electricity produced using renewable energy. In the long term the cost of fossil fuel based electricity generation may increase and the produc-tion costs of renewable energy technologies decrease due to increased efficiency and construction optimisation. The development costs of renewable energy tech-nologies cannot be foreseen in detail and it is not therefore possible to make a precise plan for the economically optimum transition from fossil fuel based elec-tricity generation to production using renewable energy resources. An approach to this challenge might be to integrate wind energy and solar PV into the power system gradually and thereby build up a local capacity to deal with renewable energy. Other advantages of this approach would be that al-though solar PV and wind energy would not fully replace conventional capacity they would a capacity value to the system and may be constructed in shorter timescales than conventional plants. These are important advantages in the con-text of Oman’s requirement for new generating capacity, something in the region of 2,758 MW within the next seven years. If one were to construct a long term (20 – 30 year) scenario for Oman, one could envisage a power system with CSP plants (with heat storage for night produc-tion) supplemented by grid connected wind turbines and PV. From a resource point of view this could be provided using a few hundred km2 of desert and may provided sufficient electricity production to meet conventional demands and electricity for electric cars. This would be a zero carbon electricity supply, and some scientists indicate that this could also be the cheapest option from a traditional cost calculation point of view at that time. The important issue is finding an appropriate starting point and development scenario for the use of renewable energy in Oman that may lead to the zero car-bon scenario described above. The forecast of electricity generation capacity is 5691 MW in 2014. A scenario where 5% of the capacity (285 MW) is covered by renewable energy could e.g. consist of a combination of 125 MW wind turbine capacity, 100 MW solar ther-mal power capacity and the remaining capacity of 50 MW large and 10 MW small solar PV. The investment costs for this scenario would be in the order of 900 Mill USD based on the present market price of renewable energy technolo-gies and corresponds to 3 USD/MW. In comparison the specific investment costs for a gas turbine plant is 0.3 USD/MW and for a coal steam plant 1.6 USD/MW.

Renewable Energy Resources in Oman
Page 24 of 134
.
2.3 Recommendations
2.3.1 Renewable energy activities The analysis and research undertaken in the course of the study provides support for various recommendations that we outline in this section. We recommend the immediate implementation of certain types of renewable pilot projects, the de-velopment of policies to support and encourage renewable energy, and that the Authority and other entities undertake further research and maintain a watching brief on developing renewable technologies. Our recommendations are presented in three categories in the expected sequence of implementation:
1 Recommendations: Small Projects & Further Feasibility Studies Our analysis supports the immediate implementation of small scale renewable energy projects, particularly in rural areas (we provide details of recommended projects below). These initial renewable energy projects would help demonstrate the technical and economic performance of renewable energy technologies under local conditions, and would, if implemented appropriately, facilitate the transfer of knowledge and know how to relevant institutions and entities in Oman.
Projects A and B below are the type of renewable energy projects we believe the Authority could approve for immediate implementation by the Rural Areas Elec-tricity Company SAOC.
Project A: 10 kW off-grid Solar PV/Diesel Hybrid System
Purposes: To demonstrate the technology and compare the performance of hybrid systems with combinations of solar and diesel capacity. Obtain experience of the design to support the subsequent implementation of large PV projects under Omani conditions.
Technology: (i) One plant comprising 10 kWp PV/10 kW diesel engine and battery storage,
(ii) One plant comprising 5 kWp PV /10 kW diesel engine and without battery storage.
Location: Rural area, off grid location.
Annual energy output: 7 - 8 MWh/year (solar PV cells)
Budget: USD 135,000 (tentative)
Energy production cost: 250 - 300 USD/MWh.

Renewable Energy Resources in Oman
Page 25 of 134
.
Project B: 20 kW Grid Connected Solar PV
Before implementing these types of projects, we recommend further detailed technical and economic analysis is undertaken to verify assumptions in this re-port and confirm the suitability of individual project locations.
We also recommend the implementation of a wind monitoring programme in south Oman along the coast and in the mountains north of Salalah to verify and map wind energy resources. This programme should also include detailed grid analysis to determine the amount of wind turbine capacity that could be con-nected to the Salalah Power System (noting that for technical reasons wind tur-bine capacity should normally not exceed 15% to 20% of total system capacity). We expect the wind monitoring programme to support the early implementation of a wind turbine project such as Project C.
Project C: 10 MW Grid Connected Wind Farm
Purposes: Demonstrate the technology and obtain experience of oper-ating the technology under Omani conditions.
Technology: 10 MW Wind farm consisting of 5 x 2 MW wind turbines.
Location: Dhofar, Thumrait/Quiroon Hariti area.
Annual energy output: 25-30 GWh/year.
Budget: USD 20 - 22 mill. (tentative)
Energy production cost: 65 USD/MWh.
Purposes: To demonstrate the technology and obtain experiences with the operation under Omani conditions. The results of this project could be used as a basis for the design of larger PV projects. We recommend undertaking a number of small scale projects for different types of applications: on buildings, park-ing areas etc.
Technology: 20 kW system consisting of 20 kWp solar PV panels (app. 200 m2) and a 20 kW power converter.
Location: Rural area, connected to local grid/power system.
Annual energy output : 34 MWh/year
Budget: USD 150,000 (tentative)
Energy production cost: 425 USD/MWh

Renewable Energy Resources in Oman
Page 26 of 133
.
This project is potentially very significant, as it could provide the basis for a lar-ger scale wind farm of between 500 to 750 MW (assuming interconnection of the Main Interconnected System and the Salalah Power System).
Other Recommendations for immediate implementation
We offer two further recommendations:
1. Interest in CSP technology has increased considerably in recent years and we expect there to be significant growth in the utilisation of this technology in areas with high solar energy potential. In order to evaluate the present po-tential for this technology in Oman we recommend an immediate feasibility study to clarify the present and future technical and economic viability of CSP technology in local conditions. The study should make specific rec-ommendations with regard to timing and location for the introduction of CSP technology in Oman; and
2. We see significant scope for introducing solar thermal collectors in public buildings to produce hot tap water. This measure could be implemented easily and quickly and consideration should be given to stipulating this as a mandatory requirement in all new buildings that have characteristics to sup-port the technology.

Renewable Energy Resources in Oman
Page 27 of 134
.
2 Recommendations: Policies to support Large Scale Projects
The study has identified significant potential sources of renewable energy in the Sultanate of Oman. However, if solar and wind energy resources are to be util-ised on a large scale, as we believe they could, new policies and funding mecha-nisms will be needed to support and encourage renewable energy investment.
Policy Development Recommendations – Financial issues
Table 2.3 summarises policy instruments used in other jurisdictions to facilitate renewable energy projects, and indicates in the final column the suitability of each policy instrument for Oman.
Table 2.3 Policy Instruments to Promote Renewable Energy
Instrument PROs CONs Suitable for Oman?
Environmental Taxes
Creates even playing field for renewable energy
Difficult to esti-mate objectively the optimum level of tax.
Tax would increase supply costs and sub-sidy but not induce change in consumer consumption.
Limited Applicability
Tax Credits Creates incentives for investors
May distort market prices
Applicable
Green Marketing Based on willingness to pay (WTP) and optional schemes
Difficult to control and limited information on con-sumer WTP
Probably very little impact in Oman.
Limited Applicability
Investment subsi‐dies
Increase incentives to establish and invest in renewable energy generation
May result in over-investment
May create new subsidy flow in the system to investors.
Applicable
Feed in Tariffs Efficient in promoting RE if monitored carefully and changed in accordance with technological developments
Investor risk if re-moved for political reasons
Applicable
Renewable Energy Quotas
Effective way to promote renewable energy projects
New tendering procedures required but simple to ad-minister.
Tends to promote established tech-nologies
Easily accommodated in OPWP and RAEC tendering systems.
Applicable

Renewable Energy Resources in Oman
Page 28 of 133
.
The implementation of Tax Credits and Investment Subsidies would be a mat-ter for the tax authorities in Oman and the Ministry of Finance. However, we recommend the Authority in conjunction with relevant government authorities take steps to implement the following measures:
• Renewable energy quotas: the government might require, for example, renewable energy projects to account for X% of total system capacity by 2015. The Authority would then have to ensure that PWP and RAEC complied with the quotas in a cost effective and efficient manner having regard to security of supply considerations and other relevant licence conditions; and
• Feed in tariffs: for large scale projects we recommend the Authority de-velop feed in tariffs to support projects over several stages of develop-ment (in the expectation that tariffs in the latter stages of a project would be lower than in the initial stage due to the technology being proven, economies of scale and so on);
These measures would, we believe, help stimulate interest and investment in re-newable energy projects in Oman. If these measures were implemented in con-junction with existing requirements (competition in tendering, economic pur-chase obligations and so on) we believe renewable energy projects could provide significant long term benefits to Oman.
Feasibility Studies for Large Scale Projects
In conjunction with the policy initiatives outlined above, we recommend further feasibility studies for the large scale utilisation of solar and wind energy re-sources in Oman. In addition to providing further technological and economic justification for large scale projects, these studies would also inform the specifi-cation of targets for renewable energy contributions to system capacity.
Policy Development Recommendations – Legal issues
The study finds that the present market structure and statutory framework of li-censing and regulation can, in several limited respects, facilitate small scale re-newable energy projects. However, we believe certain changes to the regulatory framework would facilitate renewable energy investment on a wider scale. For example, we recommend that:
1. the Authority review and proposes changes to the existing market rules to allow licensed distribution and supply companies to connect renew-able energy projects to their systems and contract for the purchase of capacity and output of such systems. This is not permitted at present (OPWP and RAEC is responsible for the procurement of all connected capacity and output). The Authority would need to ensure economic purchase and security of supply obligations continued to apply. Wide-spread application of ‘distributed generation’ is a feature of electricity markets in other jurisdictions and has been shown to have a range of benefits in addition to environments benefits; and

Renewable Energy Resources in Oman
Page 29 of 134
.
2. we recommend the Authority take immediate steps to specify procedures, technical regulations and standards needed to facilitate the design, plan-ning, connection and operation of small scale and large scale renewable energy projects. This would reduce uncertainty about the scope for im-plementing renewable energy technologies in Oman, and stimulate inter-est on the part of potential investors and renewable energy technology providers.
In summary, we recommend that the Authority act to remove barriers to the utili-sation of renewable energy, whether technical, economic or legal barriers, so as not to hinder policy initiatives that aim to facilitate and promote renewable en-ergy projects.
Clean Development Mechanisms
We recommend that Oman establish a Designated National Authority (DNA) to facilitate and administer incentives for Clean Development Mechanisms (CDM).
This would allow investors promoting renewable energy projects to benefit from cost savings gained through a carbon credit trading scheme. A wind farm, for example, implemented as a CDM project that contributed to reduced carbon emissions by replacing gas consumption would be able to secure a financial benefit equal to the value of reduced carbon emissions (calculated assuming a shadow price of carbon of 25.5 USD/ton). Any such benefit would help to re-duce the cost of the wind farm.
Arrangements such as these have been successfully introduced in other jurisdic-tions.
Table 2.4 Average cost of renewable energy and potential cost savings from Carbon Trading assuming 25.5 USD/ton CO2
Renewable Sources of energy: average costs including capital and operating costs
Potential cost savings per MWh supplied from Carbon
Trading (25.5 USD/ton CO2)
USD/MWh RO/MWh RO/MWh
Solar PV, small grid connected 425 163.5 5.16
Solar PV, large grid connected 250 96.2 5.16
Solar thermal plant 207 79.6 5.16
PV/diesel hybrid system, 10% solar energy
245 94.2 5.49
Grid connected wind farm 74 28.3 5.16

Renewable Energy Resources in Oman
Page 30 of 134
.
3 Recommendations for Further Research
We recommend that Oman undertakes further research into the development of emerging renewable energy technologies such as CSP. The Authority might con-sider seeking advice from international consultants from time to time on the po-tential utilisation of new technologies in Oman. It would be sensible also to educate local staff in installations about the operation and maintenance of renew-able energy systems. We also advise support of R&D activities within the renew-able energy sector and promoting the local development and manufacture of re-newable energy technology.
Energy Efficiency
Renewable energy should always be seen together with efficient use of energy. Energy efficiency should be afforded a high priority. Requirements for buildings regarding insulation, improved windows, shading and recovery of cold air on ventilation systems for cooling should be strengthen and enforced.

Renewable Energy Resources in Oman
Page 31 of 134
.
3 Key information for Oman 3.1 Demography
3.1.1 Population The total population of Oman is 2.6 mill including 0.7 mill non-nationals, Ref./1/. The country is divided into nine administrative districts. Table 3.1 shows the variation of the population for each district.
Table 3.1. Population in different Governorates and Regions.
Administrative District Population Population, %
Muscat Governorate 719,000 28%
Musandam Governorate 31,000 1%
Dhofar Governorate 241,000 9%
Al Buraimi Governorate 88,000 3%
Al Batinah Region 704,000 27%
Adh Dhahirah Region 142,000 6%
Ad Dakhliyah Region 287,000 11%
Ash Sharqiyah Region 338,000 14%
Al Wusta Region 26,000 1%
Total 2,576,000 100%
3.1.2 Housing The total number of housing in Oman is in the order of 425,000, Ref /2/. This number includes apartments in building and individual houses.
3.2 Industry Industrial development in Oman has traditionally focused on relatively small-scale manufacturing. However, with the discovery in the early 1990s of large de-posits of non-associated natural gas, the focus of government efforts has shifted to attracting large investment in capital-intensive gas-based industries.

Renewable Energy Resources in Oman
Page 32 of 134
.
3.2.1 Industrial Estates Manufacturing industry has generally been located on the country’s industrial estates.
Established in 1983, Rusayl is Oman’s flagship industrial estate. From its initial 12 factories, Rusayl is now a bustling estate with over 130 factories in operation, a further five in construction and 40 under consideration.
Factories in operation produce a wide spectrum of consumer as well as industry orientated products, ranging from:
• Chemicals
• Batteries
• Electrical
• Building materials
• Fibre optic cables
• Foodstuff
• Textiles
• Garments
• Stationery
• Paints
Other industrial estates include the Raysut Industrial Estate in Dhofar, as well as those at Sohar, Nizwa, Sur and Buraimi. There is also a free-trade zone (FTZ) in Al Mazunah, near the border with Yemen, and Oman is finally proceeding with plans to create an FTZ in Salalah. However, the Salalah Free Zone will still face stiff regional competition from well-established, successful free-trade zones such as Jebel Ali in Dubai.
Sohar Industrial Estate covers an area of 334 hectares, of which 130 hectares have been developed and subdivided into 226 plots. Established in November 1992, and ideally located mid-way between Muscat (200 kilometres) and Dubai (180 Kilometres) Sohar – Oman’s garden city – offers tenants easy access to do-mestic as well as international markets. The estate is home to 60 businesses, 18 units under construction and a further 44 are expected to come on stream in the near future.
On the estate’s doorstep is Sohar Port, a large three-phase project which began late-1999. Indeed, the Port has helped to generate considerable international in-terest in Sohar Industrial Estate.

Renewable Energy Resources in Oman
Page 33 of 134
.
Production on the estate includes:
• Marble • Paper recycling • Foodstuffs • Detergents • Leather • Furniture • Toothpaste • Beverages • Ice cream • Resins • Glass • Steel bars • Engine oil
3.2.2 Liquid Natural Gas (LNG) The discovery of large reserves of natural gas in the late 1980s and early 1990s paved the way for development of gas-based industry in Oman. The success story has been the LNG facility in Sur, which began exporting in April 2000, driving a sharp rise in the otherwise sedate average growth rate for the manufac-turing sector. Oman LNG is a joint venture between the Omani government (51%), Royal Dutch/Shell (30%), Total (5.54%), Korea LNG (5%), Mitsubishi (2.77%) and Mitsui (2.77%) of Japan, Partex (2%) and Itochu (0.92%, also of Japan). Long-term sale and purchase agreements (SPA) with Korea Gas Corpora-tion, Osaka Gas of Japan and Dabhol Power of India account in theory for most of the facility’s output.
In 2002 the Omani government announced that it had decided to construct a third LNG train to operate alongside the existing two at Sur, ultimately lifting total production to slightly over 10m tonnes/year (t/y). The Qalhat LNG facility, which was formally commissioned in March 2006, is a single train with capacity of 3.7m t/y. The owners of Qalhat LNG are the Omani government (55.8%), Oman LNG (36.8%) and Union Fenosa of Spain (7.4%). Given the government’s 51% stake in Oman LNG, this means that the state (directly and indirectly) owns 78% of shares in Qalhat LNG. Union Fenosa has a 20-year sales and purchase agreement (SPA) for some 1.65m t/y of LNG, or 50% of planned output.
3.2.3 Other gas-based industry Gas-based industrial development is central to Oman’s diversification plans. Much of it will be based in Sohar, where there is a new industrial port with dedi-cated container-handling facilities, and gas is supplied by pipeline from central Omani fields. In 2004 the US Dow Chemical Company agreed to take a 50% stake in a USD 2.6bn polyethylene plant to be constructed in Sohar. OOC and the Omani government jointly took the remaining 50% stake in the Oman Petro-chemical Industries Company, which intends to produce between 800,000 and 1m t/y of polyethylene.

Renewable Energy Resources in Oman
Page 34 of 134
.
In 2005, Sohar Aluminium Company signed an engineering, procurement and construction contract with Bechtel Corporation of the US for its USD 2.2bn pro-ject to build an aluminium smelter. It will have an initial capacity of 325,000 MT/y and is expected to begin commercial production in 2008. OOC and the Abu Dhabi Water and Electricity Authority each hold a 40% stake in Sohar Aluminium Company, with Alcan Corporation of Canada holding the remaining 20%.
Implementation also continues in Sohar of, among other projects, a USD 320m polypropylene plant and a USD 400m methanol plant.
In 2007 a USD 650m fertiliser plant run by Sohar International Urea and Chemi-cals Industries is scheduled to start producing 3,500 MT/d of urea and 2,000 MT/d of ammonia. In the same year, the first USD 350m phase should be com-pleted on the Shadeed Iron and Steel plant, owned by a UAE-based company, Al Ghaith Holdings, which should have an output of 720,000 MT/y of steel alloys and iron.
Finally, in mid-2008, the Liwa Petrochemical Company’s new USD 300m plant should begin producing 300,000 MT/y of ethylene dichloride and 240,000 MT/y of caustic soda. Liwa Petrochemical is a joint venture between OOC, LG Interna-tional of South Korea and the Iranian National Petrochemical Company. LG In-ternational also has a 20% stake in Aromatics Oman (with OOC holding 60% and the Oman Refinery Company the remaining 20%), which in 2005 announced plans for a USD 1.1bn aromatics complex at Sohar, to produce 800,000 MT/y of paraxylene and 210,000 MT/y of benzene.
Away from Sohar, a methanol plant is also planned for the free-trade zone in Salalah, while other gas-based industries are being located at Oman’s second emerging industrial city, Sur site of the country’s LNG facilities. In 2005 the Oman India Fertiliser Company (Omifco) completed its new USD 1bn plant in Sur and began production and export. Omifco is a joint venture between OOC (50%) and two Indian companies, Krishak Bharati Co-operative Limited (25%) and Indian Farmers Fertiliser Co-operative (Iffco, 25%). The Indian government has agreed to purchase the plant’s 5,060 MT/d urea output, and the Indian Agri-culture Fertilisers Company will buy the 3,500 MT/d of ammonia.
3.2.4 Oil refining The Oman Refinery Company (ORC) was established in 1982 with the aim of serving the local market. The refinery, which is in Muscat, currently has a proc-essing capacity of more than 106,000 b/d (late 2006). The refinery’s product mix includes petrol, kerosene, gas oil and butane.
In addition to running the existing Muscat facility, ORC is overseeing the con-struction of the new USD 1.3bn refinery in Sohar, which was completed in 2006/7. The project is being financed through government equity and a syndi-cated loan. When operational, the new refinery will produce gasoline, propylene, liquefied petroleum gas, naphtha, fuel oil, kerosene, and gas oil.

Renewable Energy Resources in Oman
Page 35 of 134
.
3.2.5 Economic Sectors’ Contribution to GDP Mining & Quarrying: The contribution of this sector was very insignificant in 1980 with a share of just RO one million. However, by 1990, the sector’s contri-bution to GDP reached RO 12 million, constituting 0.26%. In 2001, the figure rose to RO 17.8 million. In 2005, the Mining & Quarrying sector’s share in the GDP reached 0.2%.
Agriculture & Fisheries: The fact that around 40% of the national manpower is engaged in agriculture and fisheries sectors make them the most promising sec-tors for diversifying the manufacturing base and raising people's income and liv-ing standards. This sector’s contribution is still low with rates ranging from 2.6% to 2.7% during the last two decades, despite the fact that the prices at current rates were steadily shooting up, starting with RO 116.2 million in 1990 to RO 154.6 million RO in 2001. In 2005, the Agriculture & Fisheries sector’s share in the GDP reached 1.4%.
Converting Industries (manufacturing): In the year 1990, around 3% of the GDP came from this important sector with a share of around RO 131.7 million. The rate increased to 5.7% with a value of RO 640.2 million by the year 2001. In 2005, the Converting Industries sector’s share in the GDP reached 8.3%.
Electricity & Water: This sector did achieve a growth in its share in GDP dur-ing the period from 1991 to 2001. The contribution steadily grew from 0.9% in 1991 (RO 39.3m ) to 1.6% in 2001 (RO 79.7m). In 2005, the Electricity & Water sector’s share in the GDP reached 1.2%.
Building & Construction: This is a vital sector that plays a significant role in Oman’s developments. This sector’s share in GDP in 1991 was around 2.9%. However, by 2001 it dropped to 2.8%. In 2005, the Building & Construction sec-tor’s share in the GDP is only 2.5%.
Oil & Gas Sectors: Crude oil is still the major source of Oman’s economy. Its share along with natural gas stands at around 78.4% of the Government’s gross revenue. However, its share GDP rose from 41.9% in 1991 to 42.6% in 2001. In 2005, the Oil & Gas sector’s share in the GDP reached 48.8% (Oil 45.2%; Gas 3.6%). This shows a continued rise in the contributions of oil sectors to GDP.
Services Activities & Foreign Trade: The Sultanate enjoys full freedom of im-port from and export to the international markets and the degree of openness of the Omani economy reflects the philosophy of the country’s economic policy and the extent of its relations with the outer world. This also underscores the Sultan-ate’s decision to join the World Trade Organisation (WTO). In 2005, the Ser-vices Activities & Foreign Trade sector’s share in the GDP reached 39.0%.

Renewable Energy Resources in Oman
Page 36 of 134
.
3.3 Electricity sector in Oman
3.3.1 Electricity companies In Royal Decree 78/2004 promulgated on 1 August 2004 the current sector and market structure was implemented. The main principles are privatisation of elec-tricity companies and establishment of a regulator (the Authority). Former struc-tures were transferred to the following government owned companies:
• Electricity Holding Company
• Oman Power and Water Procurement Company (OPWP)
• Oman Electricity Transmission Company
• Wadi Al Jizzi Power Company
• Al Ghubrah Power and Desalination Company
• Mazoon Electricity Company
• Majan Electricity Company
• Muscat Electricity Distribution Company
• Rural Areas Electricity Company (RAECO)
In terms of ownership the companies represent a mix of Government and private ownership - the above mentioned are wholly Government owned. The privately owned companies are:
• AES Barka
• SMN Barka
• Al Kamil Power Company
• United Power Company
• Dhofar Power Company
• Sohar Power Company
• Rusail Power Company
These companies have a majority of private shareholders. Further electricity pri-vatisation will be implemented through the sale of the government interest in some of the successor companies listed above. However there are no plans to privatise Electricity Holding Company, OPWP and RAECO
The Governments approach to privatisation has been to allow 100% private own-ership for an initial period, with an obligation to make public offerings of stipu-lated shareholdings through the Muscat Securities Market. This has been a suc-cessful strategy and one that is likely to be adopted for the privatisation of suc-cessor companies.

Renewable Energy Resources in Oman
Page 37 of 134
.
Since 1 May 2005 the Authority has assumed full responsibility for the regula-tion of electricity and related water sector. The following activities in the sector are regulated:
• Generation, Transmission, Distribution, Export, Import or Supply of electricity
• Generation of electricity combined with Desalination of Water
• Generation of electricity co-located with Desalination of Water
• Central dispatching
• Development and/or operation of international interconnections
• Functions of OPWP Company
The regulation is pursued through licensing by the Authority.
The Government approves Permitted Tariffs, further privatisation plans, and lib-eralisation of the sector and approval of interconnections.
The sector law includes provisions to safeguard interest of investors, for instance international arbitration. The sector law also provides that key electricity assets will remain available to service the needs of citizens irrespective of public pri-vate sector ownership. There is no provision for tax exemption for (foreign) in-vestments in the renewable energy activities.

Renewable Energy Resources in Oman
Page 38 of 134
.
3.3.2 Market Structure The sector comprises three separate and distinct markets: Main Interconnected System (MIS), the Rural Systems (RAECO) and the Salalah Power System.
Main Interconnected system (MIS) Production MIS has the generation facilities shown in Table 3.2.
Table 3.2 Generation facilities in the MIS system, Ref /3/.
Name No. of Units/ Technology
Capacity MW
Fuel Production 2005 GWh
Production 2006 GWh
Al Kamil 3 GT 290 Nat. gas 1 210 1,151
Barka* 2 CCGT / 1 ST 427 Nat. gas 2 747 2,624
Ghubrah* 4 ST/13 GT 523 Nat. gas 2 382 2,341
Manah Phase 1 + 2
5 GT 267 Nat. gas 1 046 1,188
Rusail 8 GT 688 Nat. gas 2 170 2,369
Wadi Al Jizzi
11 GT 295 Nat. gas 1 390 1,044
Sohar* 3 GT / 1 ST 585 Nat. gas 1,036
Other Nat. gas 97 29
Total 2865 11, 041 11, 782 *combined desalinated water and power production
OPWP is the single buyer of electricity and power from the licensed production facilities. In 2005 OPWP purchased 10.8 TWh of electricity.
MIS contracted capacity increased to 2,865 MW in April 2006 with the commis-sioning of a new Integrated Water and Power Production facility in Sohar. Sohar has been operating at its full capacity of 585 MW from 2007.
OPWP will contract for a further 700 MW (IWPP) by 2009 from a plant located at Barka which will provide 350 MW of early power in 2008.
Transmission
The Oman Electricity Transmission Company (OETC) is monopoly provider of transmission services to the MIS. OETC own and operate the 220 kV and 132 kV interconnected transmission system in the north of Oman and as system operator is responsible for the central dispatch of generating and desalination facilities connected to the MIS. OETC manages its system operator functions from a re-cently commissioned load dispatch centre in Al Mawalleh. Information about the transmission system is provided in Table 3.3.

Renewable Energy Resources in Oman
Page 39 of 134
.
Table 3.3 Transmission System Data - 2006, Ref /4/
Item Value
Service areas 129,334 km2
220 kV Transmission lines 576 km
123 kV Transmission lines 2,631 km
Sub stations 34
Peak demand 2,639 MW
Units transmitted 10,821 GWh
System Avaliability 98%
Distribution Three licensed distribution and supply companies have monopoly rights to dis-tribute electricity within Authorised Areas as provided for in the following li-censes:
• Muscat, corresponding to Muscat Governorate
• Majan, corresponding to North Batinah, Dhahirah and al Buraimi regions
• Mazoon, corresponding to Sharqiyah, Dakhliah and South Batinah regions
Muscat is supplying the most densely populated area of the three
Regulation of the Sector - MIS The MIS is organised according the Single Buyer Model with OPWP as the sin-gle buyer. The Fig.3.1 summarises the principal regulated transactions in MIS:
Fig. 3.1 Regulatory overview MIS

Renewable Energy Resources in Oman
Page 40 of 134
.
The OPWP purchases capacity and output from the licensed production facilities in accordance with the payment terms of power purchase agreements. These payment terms are established during competitions for market entry, and are not directly regulated by the Authority. The Authority has a duty to ensure the OPWP conducts competitions for new contracted capacity and output in a fair and transparent manner.
OPWP provides bulk supplies of electricity to the distribution companies. These transactions are implemented through cost reflective electricity tariff approved by the Authority. The electricity Bulk Supply Tariff (BST) allows OPWP to re-cover its purchase costs and the direct costs of its procurement functions.
Electricity is purchased by the OPWP at licensed production facility exit points and transported across the transmission system of OETC. The DC purchase elec-tricity from OPWP and are responsible for the cost of transporting electricity across to the customers. The DC pays connection and use of system charges ap-proved by the Authority for connection and use of the system.
Fig. 3.2 Main Interconnected System monthly peak Demand, Ref /3/
MIS electricity demand has a distinct seasonal shape - demand in summer months is significantly higher than in winter. Air condition loads in summer rise in response to higher temperatures resulting in the strong positive correlation of monthly peak demand and maximum monthly ambient temperature.
2006 peak demand was 2,614 MW, and increased to 2,773 MW in 2007.
Daily load profile is also distinct. Daily loads in June, with the highest loads, are almost double of February having the lowest loads. Peak hours are between 3 pm and 5 pm, and again between 11 pm and 4 am in the summer. In the winter there is a small peak hour at 8 pm.
0
500
1,000
1,500
2,000
2,500
3,000
Jan Feb Mar Apr May Jun Jul Aug Sep Oct Nov Dec
MW
2007
2006

Renewable Energy Resources in Oman
Page 41 of 134
.
MIS electricity Demand Forecast
MIS Peak demand will increase from 2,773 MW in 2007 to an expected 4,634 MW in 2013. The annual growth rate is app. 9%. Peak demand is envisaged to continue increasing due to the accelerated growth in Oman.
Fig. 3.3 Capacity Projections for the MIS, Ref /5/
OPWP projection of the peak for the coming 7 years is shown above. The princi-pal drivers behind the increase are population growth, industrial sector growth and growth in the tourism sector.
The figure show the capacity forecast, the already contracted capacity and the potential known capacity that can be contracted. It shows that already from 2010 or earlier OPWP must contract new capacity.
The forecast for electricity generation in 2014 is 24.0 TWh.
Rural Systems RAECO is generating, transmitting and distributing power in its areas. RAECO is also responsible for electrification of rural areas and funds this through a spe-cial mechanism in the Sector law.
Most of the electricity in RAECO is generated in diesel fuelled facilities. The total capacity is 447 MW. The electricity supply was 246 GWh in 2006, Ref /3/.
Demand for electricity in RAECO areas will increase considerably when the de-velopment projects in the Duqum area and Masirah Island take off.
The forecast for RAECO area is approximately 350 GWh in 2012.
Peak Demand and Capacity ProjectionsMIS
0
1000
2000
3000
4000
5000
2006 2007 2008 2009 2010 2011 2012 2013Year
MW
Demand Forecast MW Contracted capacity Potential Capacity

Renewable Energy Resources in Oman
Page 42 of 134
.
Salalah Power System The Dhofar Power Company (DPC) has a concession agreement to generate, transmission, distribution and supply of electricity in its concession area until 2021.
The generation facilities are listed in Table 3.4.
Table 3.4 Generation Capacity Salalah Power System, Ref / 3/
Name Technology/ No. of Units
Capacity MW Fuel Production 2005 GWh
DPC GT / 6 195 Nat. gas 1,057
Frame 6 GT / 1 30 Nat. gas 0
LM 2500 GT / 1 17 Nat. gas 0
RAECO gen 70 Diesel 1
Total 312 1,058
The vertically integrated nature of the Salalah Concession Agreement is in con-tract. OPWP is counterpart in the concession agreement and its activities are regulated by the Authority.
Demand and capacity projections are shown in the diagram below. The diagram shows that Salalah Power Systems is in need of new capacity already from 2007. The RAECO generation capacity is not available after 2008, leaving a short fall in capacity of 70 MW. The strong demand growth is the result of increasing population, new industrial projects in the new Salalah Free Zone, development of tourism and expansion of the system to new areas.
Fig. 3.4 Capacity Projections for the Salalah, Ref /5/
Peak Demand and Capacity ProjectionsSalaleh
0
100
200
300
400
500
600
2006 2007 2008 2009 2010 2011 2012 2013Year
MW
Demand Forecast MW Contracted capacity Potential Capacity

Renewable Energy Resources in Oman
Page 43 of 134
.
The forecast for electricity generation for Salalah is 3.5 TWh in 2014.
The total power capacity and the total electricity generation in Oman in 2007 and respective forecasts for 2014 are shown in Fig. 3.5.
Fig .3.5 Capacity and electricity generation, 2007 and 2014 forecast, Ref /23/
The total additional power capacity required in order to meet the demand in 2014 is 2,758 MW.
3.3.3 Interconnection Projects A 220 kV interconnection between MIS and UAE (Abu Dhabi) was completed in early 2007. This is the first step in an interconnection system linking all GCC members.
Currently the MIS is linked to RAECO through Petroleum Development of Oman systems. The plan is to link the PDO system to the Dhofar areas also.
On a longer term it is likely that a system linking MIS and Dhofar via Duqm will be established.
3.3.4 Current Energy Sector Policy The current sector law for electricity and water implements the Government policies for the electricity sector. The most important elements of the law in-clude:
• A comprehensive restructuring of the electricity sector, whereby opera-tional responsibility for the sector will pass from MHEW to newly created successor entities that will for a time, be wholly owned by the Government.
• Further privatisation of the electricity sector, in accordance with a timetable of the Governments choosing, the Government shareholding in certain suc-cessor companies will be offered to local and international investors thereby extending private sector participation;
0
5,000
10,000
15,000
20,000
25,000
30,000
35,000
40,000MW & GWh
Capacity MW Generation GWh
2007 2014

Renewable Energy Resources in Oman
Page 44 of 134
.
• Public interest regulation of the electricity sector. The sector law estab-lished an Authority to regulate the electricity sector, and a licensing regime through which the Authority can authorize persons wishing to undertake ac-tivities stipulated in the sector law as regulated activities.
• The sector law also ensures that the Government remains responsible for all matters relating to customer tariffs, for the approval of interconnections with neighbouring countries, and for the approval of any further changes to the structure of the electricity market.
Article 18 of the Sector Law implements a mechanism through which the Minis-try of Finance provides electricity subsidies, calculated by the Authority to li-censed suppliers (Muscat, Majan, Mazoon and RAECO) on an annual basis. The Authority undertakes two separate subsidy calculations: the first calculates the subsidy to Muscat, Majan and Mazoon distribution companies and the second calculates the subsidy to RAECO.
The subsidy is defined as the difference between the economic cost of supply (including financing costs) and Permitted tariff (and other) revenue. Economic supply cost are derived from OPWP, OETC and Muscat, Majan, and Mazoon price control Maximum Allowed Revenue (MAR). Subtracting customer tariff revenue (and other sources of income) from the MAR identifies the electricity subsidy required in a particular year.
The maximum tariff (permitted tariff) is approved by the Council of Ministers and shown in Table 3.5. No new permitted tariff was implemented in 2006.
Table 3.5 Permitted Tariff for Electricity Supply - 2006, Ref /3/
A: Permitted Tariffs for Electricity Supply
Industrial1
Com m ercialM inis try of Defence
0-3000 kWh 3001-5000 kWh 5001-7000 kWh 7001-10000 kWh above 10000 kWh10 Bz / kWh 15 Bz / kWh 20 Bz / kWh 25 Bz / kWh 30 Bz / kWh0-3000 kWh 3001-5000 kWh 5001-7000 kWh 7001-10000 kWh above 10000 kWh10 Bz / kWh 15 Bz / kWh 20 Bz / kWh 25 Bz / kWh 30 Bz / kWh
0-3000 kWh 3001-5000 kWh 5001-7000 kWh10 Bz / kWh 15 Bz / kWh 20 Bz / kWh
B: Permitted Tariff fees for Disconnection & Reconnection of accounts
Disconnection fee (all types of metered accounts): 7.500 Rial OmaniReconnection fee (all types of metered accounts): 7.500 Rial Omani
April to July: 24 Baiza per kWh
7001 kWh & above
Tourism 2
1 Customers require a MOCI letter of recommendation and must maintain a power factor of least 0.9
Flat rate @ 20 Baiza per KWhMay to August: 24 Baiza per kWh
Residential
Governm ent
0-7000 kWh
Flat rate @ 20 Baiza per KWh
2 Sub ject to Ministry of Tourism regulations and approval
above 7001 kWh 20 Bz / kWh
Agriculture & Fisheries10 Baiza per kWh 20 Baiza per kWh
Perm itted Tariff Category
All Regions except Dhofar
Tariff Structure
September to April: 12 Baiza per kWh August to March: 12 Baiza perkWh
Dhofar Region
Renewable Energy Resources in Oman
Page 45 of 134
.
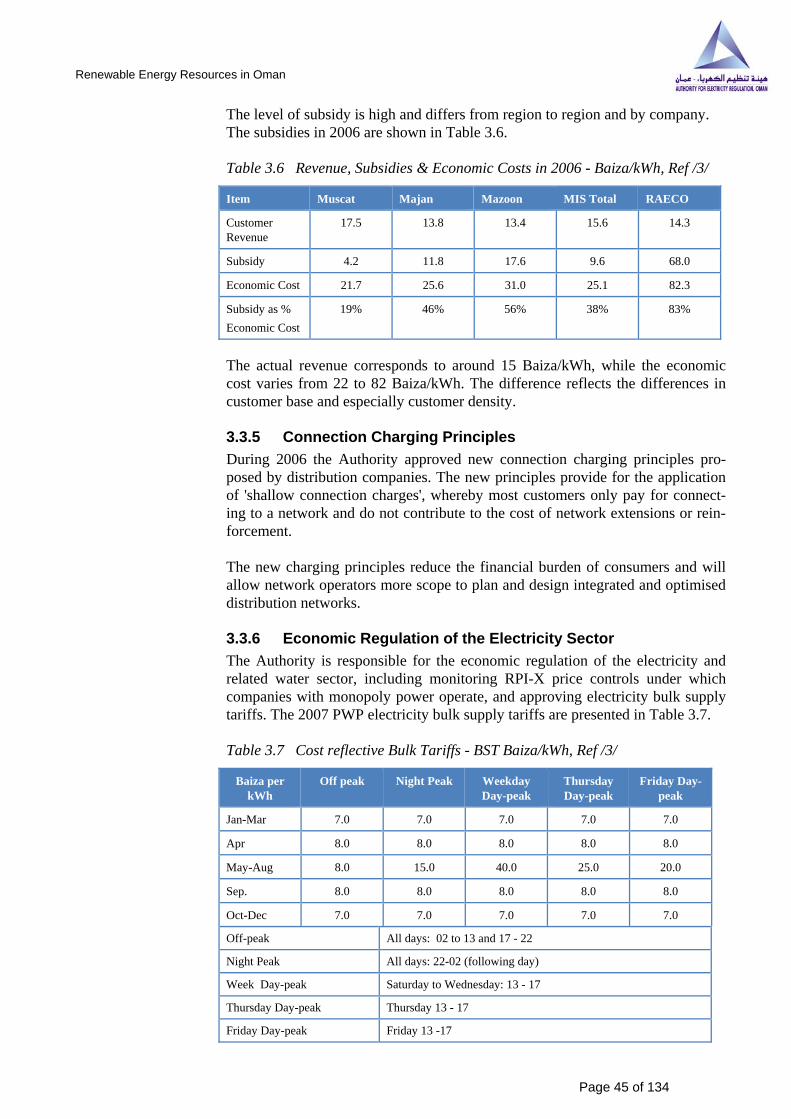
The level of subsidy is high and differs from region to region and by company. The subsidies in 2006 are shown in Table 3.6.
Table 3.6 Revenue, Subsidies & Economic Costs in 2006 - Baiza/kWh, Ref /3/
Item Muscat Majan Mazoon MIS Total RAECO
Customer Revenue
17.5 13.8 13.4 15.6 14.3
Subsidy 4.2 11.8 17.6 9.6 68.0
Economic Cost 21.7 25.6 31.0 25.1 82.3
Subsidy as % Economic Cost
19% 46% 56% 38% 83%
The actual revenue corresponds to around 15 Baiza/kWh, while the economic cost varies from 22 to 82 Baiza/kWh. The difference reflects the differences in customer base and especially customer density.
3.3.5 Connection Charging Principles During 2006 the Authority approved new connection charging principles pro-posed by distribution companies. The new principles provide for the application of 'shallow connection charges', whereby most customers only pay for connect-ing to a network and do not contribute to the cost of network extensions or rein-forcement.
The new charging principles reduce the financial burden of consumers and will allow network operators more scope to plan and design integrated and optimised distribution networks.
3.3.6 Economic Regulation of the Electricity Sector The Authority is responsible for the economic regulation of the electricity and related water sector, including monitoring RPI-X price controls under which companies with monopoly power operate, and approving electricity bulk supply tariffs. The 2007 PWP electricity bulk supply tariffs are presented in Table 3.7.
Table 3.7 Cost reflective Bulk Tariffs - BST Baiza/kWh, Ref /3/
Baiza per kWh
Off peak Night Peak Weekday Day-peak
Thursday Day-peak
Friday Day-peak
Jan-Mar 7.0 7.0 7.0 7.0 7.0
Apr 8.0 8.0 8.0 8.0 8.0
May-Aug 8.0 15.0 40.0 25.0 20.0
Sep. 8.0 8.0 8.0 8.0 8.0
Oct-Dec 7.0 7.0 7.0 7.0 7.0
Off-peak All days: 02 to 13 and 17 - 22
Night Peak All days: 22-02 (following day)
Week Day-peak Saturday to Wednesday: 13 - 17
Thursday Day-peak Thursday 13 - 17
Friday Day-peak Friday 13 -17

Renewable Energy Resources in Oman
Page 46 of 134
.
A basic principle of the market structure is a single point of subsidy injection, i.e. the Government provides subsidies to the licensed suppliers - all other entities are self-sustaining in economic terms and charge fully cost reflective tariffs for the services they provide.
3.3.7 Energy costs in Oman The current natural gas price provided by the Ministry of Oil and Gas Resources is 1.5 USD/MMBtu for all power generators. This is below the current economic opportunity cost of natural gas, assumed to be 3 USD/MMBtu with a 3% deple-tion premium. In combination with the end-user subsidy provided by the Gov-ernment to the DC's, the level of subsidization is quite large.
Cost of Diesel is 146 Baiza per Litre.
3.3.8 Energy supply and consumption Present The annual crude oil production is nearly 300 MN BBL per year and has been slightly declining between 2003 and 2006. Approximately 90% is exported and the remaining used domestically.
The annual natural gas production is approximately 900 000 MNSCF per year and has been increasing over the last years. In 2005 the natural gas production was 918 000 MNSCF. The usage of the natural gas in 2006 is shown in Fig. 3.6.
Fig. 3.6 Usage of natural gas in 2006, Ref /6/
The Government accounts for 19% of total gas, while the remainder is used in oil-production and for export. The largest share (40%) is used for LNG and ex-ported. Oman natural gas resources are constrained due to long-term commit-ments to export LNG to Korea and Japan, and due to the usage in local industry and power stations. The low price of gas charged for local use has been consid-ered important to stimulate and attract of industrial development.
Government, 19%
OLNG, 40%UAE, 4%
OIC, 4%
Oil Fields, 16%
Flared, 6%
Other, 11%

Renewable Energy Resources in Oman
Page 47 of 134
.
The use of natural gas by the Government is shown in Fig. 3.7.
Fig. 3.7 Government of Oman -use of natural gas, Ref /6/
92% of natural gas used domestically is used for power production.
Coal production and usage in Oman is insignificant.
Power Stations, 92%
Mining Activities, 1%
Cement Production, 6%
Other, 1%

Renewable Energy Resources in Oman
Page 48 of 134
.
3.4 Renewable energy activities in Oman
3.4.1 Existing RE systems Solar energy is the sole renewable energy resource which presently is utilised in Oman.
Solar energy is primarily used for house hold water heating by heating water in tanks located on the roofs at private houses.
Solar energy is also utilised by the oil production industry (PDO). Electricity generation by Photovoltaic cells is used for powering small remote located equipment and solar energy is used for steam production which is used for ex-traction of oil from the oil fields in the dessert.
3.4.2 Ongoing initiatives on RE systems Presently there are some discussions and planning activities regarding implemen-tation of renewable energy systems in Oman.
Private initiatives are ongoing regarding distributed power production by small wind turbines. Also small PV systems are considered as power supply for remote areas.
In connection with planning of the development of new industrial and settlement areas in Oman, considerations on large scale utilisation of solar thermal systems for power supply are under consideration.
3.4.3 Research and Development Research and development (R&D) activities within renewable energy have been carried out at Sultan Qaboos University by the Renewable and Sustainable Ener-gies Research Group.
The R&D activities have included theoretical studies as well as experimental studies within the areas PV systems, non PV solar systems, Wind Energy Sys-tems and Energy Planning and Management. Reference list of R&D activities is enclosed in Appendix 9.
3.5 Conventional energy resources in Oman Conventional (non-renewable) resources are as follows:
• Natural Gas (relevant for Oman)
• Petroleum (relevant for Oman)
• Gasoline (relevant for Oman)
• Fossil Fuels (relevant for Oman)
• Coal (not relevant for Oman)
• Nuclear Energy (not relevant for Oman)

Renewable Energy Resources in Oman
Page 49 of 134
.
3.5.1 Background Oman’s economy is heavily reliant on oil and gas revenues, which account for about 84.2% in 2005 of the country’s export earnings and 48.8% of its gross do-mestic product (GDP). All of Oman’s domestic energy consumption is supplied by natural gas and oil, reflecting the country’s relative abundance of oil and natu-ral gas reserves. Refer to Fig. 3.8 for split in 2004.
Fig. 3.8 Total energy consumption in Oman.
3.5.2 Oil sector According to Oil & Gas Journal (OGJ), proven oil reserves in Oman stood at 5.5 billion barrels as of January 2007. Oman's petroleum deposits were discovered in 1962, decades after those of its neighbours. Moreover, Oman's oil fields are gen-erally smaller, more widely scattered, less productive, and pose higher produc-tion costs than in other Arabian Gulf countries. The average well in Oman pro-duces only around 400 barrels per day (bbl/d), about one-tenth the volume per well of those in neighbouring countries. To compensate, Oman uses a variety of enhanced oil recovery (EOR) techniques. The oil reserves in Oman are shown in Fig. 3.9.
Natural Gas, 67%
Oil, 33%

Renewable Energy Resources in Oman
Page 50 of 134
.
Fig. 3.9 Oil reserves in Oman
During 2006, Oman consumed an estimated 64,000 bbl/d of oil, with net exports of 679,000 bbl/d. Oman is not a member of the Organisation of the Petroleum Exporting Countries (OPEC), though it is a significant exporter of oil. Most of Oman’s crude oil exports go to Asian countries, with China, India, Japan, South Korea, and Thailand the largest importers.
3.5.3 Exploration and Production To help offset declining oil output, Oman’s Minister of Oil and Gas announced in April 2006 that the country planned to invest $10 billion in upstream oil and natural gas projects during the next five years. Much of this effort will focus on enhanced oil recovery (EOR) initiatives to improve recovery rates at several of the country’s oil fields. Oman also plans to increase exploration and production (E&P) activities, although the natural gas sector will receive much of this in-vestment.
The oil production and oil consumption in Oman is shown in Fig. 3.10.
2.5
3
4
5.5
15
93
99
115
136
260
0 50 100 150 200 250 300
Syria
Yemen
Dubai
Oman
Qatar
Abu Dhabi
Kuwait
Iraq
Iran
Saudi Arabia
Billion barrels
Selectred Middle East Proven Oil Reserves (January 2007)

Renewable Energy Resources in Oman
Page 51 of 134
.
Fig. 3.10 Oil production in Oman
3.5.4 Natural Gas According to OGJ, Oman’s proven natural gas reserves stood at 30 trillion cubic feet (Tcf) as of January 2007. Expanding natural gas production has become a chief focus of Oman’s strategy to diversify its economy away from the oil sector. Rising natural gas production over the last several years has resulted in the ex-pansion of natural gas-based industries, such as petrochemicals, power genera-tion, and the use of natural gas as a feedstock for enhanced oil recovery projects. However, despite the recent rise in production, additional natural gas reserves have not been located as quickly as the government had hoped. Some industry sources have speculated that, given the country’s long-term liquefied natural gas (LNG) export obligations, natural gas supplies may be overcommitted in Oman.
Natural gas production in Oman stood at 607 billion cubic feet (Bcf) in 2004, up more than threefold since 1999. Oman consumed 239 Bcf of natural gas in 2004 with LNG exports of 324 Bcf. Nearly two-thirds of Oman’s LNG exports went to South Korea, while the remainder went to Japan, Taiwan, Spain, France, and the United States. Oman also pipes some natural gas exports to the United Arab Emirates (UAE), although it has plans to import natural gas in the future.
The estimated natural gas reserves in the Middle East countries for 2007 are shown in Fig. 3.11.
Oman's Oil Production and Consumption, 1998-2008*
0
200
400
600
800
1000
1200
1998 1999 2000 2001 2002 2003 2004 2005 2006 2007 2008
Year
Thou
sand
Bar
rels
per
Day
Production Consumption
Net Exports

Renewable Energy Resources in Oman
Page 52 of 134
.
Fig. 3.11 Natural gas reserves
3.5.5 Exploration and Production Natural gas production has risen significantly since 1999, although increases in production have tapered off during the last two years. The Omani government has intensified its efforts to locate additional natural gas supplies to help meet rising domestic natural gas requirements as well as the country’s LNG export commitments.
Fig. 3.12 Natural gas production and consumption in Oman
4
17
30
54.5
112
199
240
911
974
0 200 400 600 800 1,000 1,200
Dubai
Yemen
Oman
Kuwait
Iraq
Abu Dhabi
Saudi Arabia
Qatar
Iran
Trillion Cubic Feet
Selected Middle East Proven Natural Gas Reserves (January 2007)
Oman's Natural Gas Production and Consumption, 1995-2005*
0
100
200
300
400
500
600
700
1995 1996 1997 1998 1999 2000 2001 2002 2003 2004 2005
Year
Bill
ion
Cub
ic F
eet
Production Consumption

Renewable Energy Resources in Oman
Page 53 of 134
.
4 Renewable energy resources in Oman Renewable energy resources are as follows:
• Solar energy
• Wind energy
• Wave, tidel energy
• Thermal energy
• Bio mass, biogas
• Hydro power
This study includes solar-, wind-, thermal-, wave- and biogas resources. The ba-sis for the estimation of these resources in Oman is data and information col-lected during visits to a number of authorities. The summaries of the meetings held with the authorities and lists of received information are enclosed in Appen-dix 1.

Renewable Energy Resources in Oman
Page 54 of 134
.
4.1 Wind energy
4.1.1 Wind data The assessment of the wind energy resources is based on the wind data measured at twenty one stations in Oman under the responsibility of DGCAM. The wind data is measured at 10 m above ground level. The details of the stations including their locations are included in Appendix 3.
Five stations with the highest wind speeds (in 2005) were identified based on the data from Ref /7/. For these stations the hourly wind speed data for 2006 was re-ceived from DGCAM. The annual mean wind speed in 2005 and in 2006 was almost identical.
The wind conditions at 80 m above ground level were estimated which is equal is to the hub height of a modern large wind turbine, having a capacity in the order of 2-3 MW. The calculation is based on the hourly wind speed data for 2006 re-ceived from DGCAM.
The high wind speeds are found along the coast from Masirah to Salalah. The highest wind speeds are in the Dhofar Mountain Chain north of Salalah. The low wind speed areas are in the north and western part of Oman.
The measured annual mean wind speed at 10 m and the estimated annual mean wind speed at 80 m above ground level at each of the five selected met station is shown in Fig. 4.1. Details on the calculation of the monthly mean wind speed and the wind rose at each of the five selected stations are included in Appendix 3.
Fig. 4.1 Annual mean wind speed at 10 m and at 80 m above ground level at five meteorological stations.
The highest wind energy speeds are observed during the summer period. The summer period is also the period with the highest electricity demand in Oman. The monthly wind speed variation at each of the five stations is included in Ap-pendix 3.
0.0
1.0
2.0
3.0
4.0
5.0
6.0
7.0
8.0
9.0
Qairoon Hariti Thumrait Masirah Joba Sur
Ann
ual m
ean
win
d sp
eed,
m/s
Location
10 m agl 80 m agl

Renewable Energy Resources in Oman
Page 55 of 134
.
The wind monitoring masts at Thumrait and Qairoon Hariti were inspected as part of the study in order to evaluate the measuring conditions. The measuring conditions have been evaluated as acceptable but due to some complexity of the terrain around the masts more detailed wind analysis are required in order to de-termine the wind energy resources more accurately. Photos of the meteorological stations at Thumrait and Qairoon Hariti and the surrounding landscape are in-cluded in Appendix 2.
4.1.2 Wind energy resources A rough estimate of the wind energy content at 80 m above ground level has been made at each of the five selected met stations based on the hourly mean wind speed data for 2006 received from DGCAM. The calculation sheet is en-closed in Appendix 7.
The annual wind energy content at each met mast is indicated on Fig. 4.2. The energy is specified as kWh per year through a vertical area of one m2, kWh/year/m2.
Fig. 4.2 Energy content in the wind at 80 m above ground level at five meteoro-logical stations.
4.1.3 Potential capacity for grid connected wind turbines As a general rule based on experiences the maximum wind power capacity should not exceed approximately 15 % - 20 % of the existing conventional power capacity of the system in order to avoid disturbances in the power quality due to the fluctuating power generation by the wind turbines. In case of sufficient grid capacity a higher percentage of wind turbine capacity can be connected to the grid.
In Oman the future power system will have a total capacity of 5000 MW (2015) and the power system in the north and in the south will be interconnected. The technical future potential for installation of wind turbine capacity in Oman will be at least 750 MW.
Another technical limitation for installation of wind power capacity is the avail-ability of open land without obstacles for erection of the turbines.
0
500
1000
1500
2000
2500
3000
3500
4000
4500
5000
Quiroon Hariti Thumrait Masirah Joba Sur
Ener
gy c
onte
nt, k
Wh/
m2/
year
Location

Renewable Energy Resources in Oman
Page 56 of 134
.
The space required for installation of wind farms with a total capacity of 750 MW is available in the mountains north of Salalah where the highest wind speeds in Oman are measured. Another possibility for installation of wind tur-bines is at Sur where the third highest wind energy resources are observed. The estimated required land area for a 750 MW wind farm is in the order of 100 km2 assuming 375 turbines with a capacity of 2 MW each. A photo of the landscape in the Dhofar Mountains is included in Appendix 2.
4.1.4 Potential electricity generation At different locations A tentative estimate of the energy output by a 2 MW wind turbine erected in the five high wind areas in Oman is shown in Fig. 4.3. The reference wind turbine has a hub height of 80 m and a rotor diameter of 90 m.
Fig. 4.3 Estimated annual energy output by a 2 MW wind turbine at different locations
Total electricity generation The wind conditions at Thumrait and at Quiroon Hariti and a 2MW reference wind turbine with a hub height of 80 m has been used as a n example for estima-tion of the technical potential for electricity generation by wind turbines. The location at Masirah is not considered suitable for installation of large scale wind power capacity as the present power system is an isolated system and the energy consumption on the island is relatively small. In the power system connects to the main system via sea cables Masirah may be relevant for installation of wind turbines. Joba and Sur could be potential sites for wind turbines, however the annual output at these locations is more than 25 % lower than at Quiroon Hariti.
The tentative estimated annual net energy output from a 2 MW wind turbine at Thumrait is 5820 MWh/year and at Quiroon Hariti the net output is 6470 MWh/year. If half of the capacity equal to 375 MW is installed at wind condi-tions corresponding to the wind conditions at Thumrait and the other half of the capacity is installed at wind conditions similar to the conditions at Quiroon Hariti the total annual net output of 750 MW wind turbine capacity will be in the order of 2300 GWh/year. This corresponds to 20 % of the total electricity generation in Oman in 2005.
0
1000
2000
3000
4000
5000
6000
7000
8000
Quiroon Hariti Thumrait Masirah Joba Sur
MW
h/ye
ar
Location

Renewable Energy Resources in Oman
Page 57 of 134
.
4.2 Solar energy
4.2.1 Solar data The solar insolation varies from year to year. It is therefore important to use data covering several years in order to estimate the long term average solar energy resources. Data from 1987 to 1992 for six different locations in Oman has been identified and used for this study in order to base the analyses on long term data, Ref./8 /. These data are global insolation data which is the sum of direct and diffuse radia-tion on a horizontal plane measured with a pyranograph. Only one year data was available from DGCAM, Ref /7/. The locations of the sites where the solar insolation data is measured is shown in Fig. 4.4. Fig.4.4 Locations of the stations from where the long term solar data used in this study have been measured, Ref /8/.

Renewable Energy Resources in Oman
Page 58 of 134
.
4.2.2 Solar energy resources The solar resources at various locations and the monthly variations are presented in Fig. 4.5 and Fig. 4.6.
Fig. 4.5 Global insolation average for 1987-1992 for the stations included in this study.
Fig. 4.6 Global solar insolation (on horizontal) average 1987-1992 for the 6 stations.
Global solar radiation. Average 1987-1992. kWh/m2 per day
4.51 4.53
5.38 5.485.69
6.09
0.00
1.00
2.00
3.00
4.00
5.00
6.00
7.00
Salalah Sur Buraimi Seeb Fahud Marmul
kWh/
m2
per
day
Global solar radiation, average 1987-1992, kWh/m2 per day
0.00
1.00
2.00
3.00
4.00
5.00
6.00
7.00
8.00
Jan. Feb. Mar. Apr. May Jun. Jul. Aug. Sep. Oct. Nov. Dec.
kWh/
m2
per
day Buraimi
SeebFahudSurMarmulSalalah

Renewable Energy Resources in Oman
Page 59 of 134
.
The seasonal variation on a sloped surface will be smaller than on fig 4.6 for horizontal radiation. The monthly average solar insolation for each of the six stations is enclosed in Appendix 4. General evaluation of the data. The solar insolation varies from 4.5 to 6.1 kWh/m2 per day, corresponding to 1,640 to 2,200 kWh per year. The difference between the highest and the lowest daily mean insolation within a month is shown in Appendix 4. The difference is significant when the insolation is low. For a good location like Fahud the global insolation vary from 2 to 5 kWh per day in January, while the variation in July to September is only from 5 to 7 kWh per day. The yearly variation in average amounts to about 4 kWh/m2 per day for January to about 6.5 kWh/m2 per day for May in which the solar insola-tion is highest. Salalah and Sur have a significantly lower insolation than other stations. In Sala-lah it is due to the summer rain period from July to September(Khareef season). For Sur the reason may be due to frequent periods with fog. The insulation in Seeb is high even though it is near the coast. For all stations there is a significant difference between the minimum and maxi-mum values, indicating that on all locations there will be days with little insula-tion and with a need for backup for systems based on solar energy. Generally the highest potential is in the dessert areas and the lowest potential is at the coastal area in the southern part of Oman. The solar resources in Oman are among the highest in the world.
The highest solar irradiation occurs during the summer period where the electric-ity demand is highest. However, the seasonal variation in the demand is much higher than the variation in the solar radiation. A system based on 100 % solar energy in the summer time will therefore give a surplus of power in the winter. The surplus could be exported if possible. Seasonal storage in that magnitude is not available.
The total solar energy resources in Oman are huge and can theoretically cover all energy demands and could provide for an export as well. High solar energy den-sity is available in all regions of Oman. The highest density is found in the des-sert areas and the lowest density is in the coastal areas in the southern part of Oman. The level of the solar energy density in Oman is among the highest in the world.

Renewable Energy Resources in Oman
Page 60 of 134
.
4.3 Biogas
4.3.1 Data Waste water sludge Oman Wastewater Services Company (OWWC) and Salalah Wastewater Ser-vices Company are currently the only commercial entities granted exclusive con-cession rights to build and operate waste water systems in Muscat and Salalah, respectively. The Ministry of Regional Municipalities and Water Resources op-erates several sewer networks and treatment plants in the rest of the country.
In Muscat approximately 15% of the population is connected to the company network and the daily average waste water treatment is 43.000 m3. The waste amounts 8000 m3 which is composted for fertilising. The amount of waste water treated is rapidly increasing according to information given by the OWSC com-pany, Ref /9/.
Table 4.1 Amount of waste water
Year 2007 2010 2015 2020 2025
Waste water m3/day 43,544 72,757 151,128 197,560 218,840
Sludge 20% TS kg/day 54,430 90,946 188,910 246,950 272,550
The amount of organic matter is about 50-70% of total solids (TS). Thus the or-ganic matter collected in the sludge is presently 5-7 ton/day which will increase 5 fold before year 2025. 7 ton organic matter per day corresponds to about 2500 tons per year from which it is theoretically possible to produce about 1 mill Nm3 CH4 (methane) per year, equivalent to 11,000 MWh.
Solid waste (dung) An overview of the type and number of farm animals is presented in Table 4.2.
Table 4.2 Overview of total resource by 2005. Ref /10 /.
Type of Animal
Cows 250 kg
Camels 250 kg
Sheep 30 kg
Goats 25 kg
Estimated population no 301,600 117,300 351,000 1,555,700
Manure Total Solids (TS) ton-nes/year per animal
1.98 1.50 0.18 0.15
Total TS tonnes/year 597,168 175,950 63,180 233,355
VS (Volatile Solids = organic matter) tonnes/year at VS/TS = 0.75
447,876 131,962 47,385 175,016
Percent of total 56 16 6 22

Renewable Energy Resources in Oman
Page 61 of 134
.
4.3.2 Biogas energy resources The theoretic potential biogas production at 100% conversion rate can be esti-mated as follows:
Cows, cattle, sheep and goats 9%TS: 0.21 Nm3 CH4 per kg VS
Waste water sludge 0.25% / 20% TS: 0.4 Nm3 CH4 per kg VS
Sorted organic household waste: 0.35 Nm3 CH4 per kg VS
Vegetable, fruit and grass waste: 0.5 Nm3 CH4 per kg VS
Cereals: 0.22 Nm3 CH4 per kg VS
Vegetable oil e.g. from palm or animal fats: 1.44 Nm3 CH4 per kg VS
It is seen that it is very valuable for the gas production to add a certain amount of fatty wastes.
The practical utilisation rate in the process can vary from 40% to 90% of the po-tential gas production, depending on residence time, pre-treatment, material mix, process temperature, reactor load etc.
The total biogas production for the animals listed in section 5.3.1 is about 150,000,000 Nm3 CH4 per year or 1,650,000 MWh.
Poultry production is rapidly growing and poultry waste can to a certain extent be added to biogas plants. Biogas plants on poultry waste alone is however not possible due to ammonia inhibition of the process.
Waste from vegetables, fruits and field crops from sorted household waste and waste from abattoirs and fish industry can with advantage be added to biogas plants. The amount of added material to the process should not be more than 25% of the base material (i.e. manure or sludge) in order to avoid process inhibi-tion. There is not sufficient data available to estimate the amounts available but it is considered plenty to fulfil the 25% limit.
The practical utilisation of biogas is limited by several factors, such as collection of material to the plant, organisation of the plant if dependent on individual farmers, possible use of the biogas produced both for heat and power.
Biogas plants can be located at wastewater treatment plants at food industries and at big farms. As a rule of thump there should be at least 100-200 milk cows or camels on stable before a biogas plant is worth considering.
Major farms are mostly located in Batinah region. There are to the less extent in Dhofar. It is estimated that there are about 50 farms with more than 500 animals of different species. The largest farms have about 4000 cattle. The rest of the animals are spread amongst minor farmers and shepherds which makes the re-source practically unreachable.

Renewable Energy Resources in Oman
Page 62 of 134
.
If we estimate that there is 50 farms with 500 animals corresponding to an equivalent of 300 milk cows / camel, then the yearly production of biogas can be estimated to approximately 4,200,000 Nm3 CH4 per year or approximately 46,000 MWh. The potential biogas production can be increased by say 50% by adding other mate-rial as described above, but the total practical reachable resource is still very small in the total energy balance of Oman. It will probably be realistic that no more than 5 big farms, 2 sewerage treatment plants and 3 industries establish a biogas plant over the next 15-20 years.
4.3.3 Electricity generation By use of biogas in large gen-sets it is possible to convert about 35-40% of the energy content in the biogas to electric power hereof 10-20% is consumed by the process itself.
It is not unrealistic to estimate a biogas production of 100.000 MWh at year 2020. From this about 35,000 MWh net power can be produced corresponding to a continuous power of about 4 MW.
Summary: Biogas resources material for generation is primarily available in the northern part of Oman in the forms of waste water and agriculture waste and in the southern part of Oman in the forms of waste water, animal dung and agricul-ture waste.
The theoretical potential for biogas generation from waste water is 1,000,000 Nm3 equivalent to 11,000 MWh and from animal dung 150,000,000 Nm3 equivalent to 1,650,000 MWh.
The total technical potential for electricity generation by biogas in Oman is 35,000 MWh/year corresponding to a continuous power capacity of 4 MW.

Renewable Energy Resources in Oman
Page 63 of 134
.
4.4 Wave energy
4.4.1 Wave data Measurements of wave data along the Oman coast have not been performed and data on wave height, wave length and wave period from Oman was not available for this study.
Instead information on wave energy along the Omani coast has been obtained from the European Directory of Renewable Energy, 1991, Ref /11/.
4.4.2 Wave energy resources An estimation of the wave energy in the world oceans has been made and pre-sented in Ref /3/. According to this reference the wave energy flux in the world oceans varies from approximately 10 kW per m wave length and up to approxi-mately 100 kW/m. A map showing the wave resources are presented in Fig. 4.7.
The wave energy potential in the Arabian Sea is among the lowest in the world. The wave energy flux in the open sea is in the order of 17 kW per m wave length, corresponding to 150,000 kWh/m/year- Along the coast to the Arabian Sea the wave energy flux is lower than at the open sea.
Compared to the world wide wave energy resources the wave energy resources at the coast of Oman are relatively small and it is assumed that wave energy can not contribute significantly to the energy generation in Oman.
Fig. 4.7 Wave energy potential world wide, Ref /11/

Renewable Energy Resources in Oman
Page 64 of 134
.
4.5 Geothermal energy
4.5.1 Data Two types of data have been available for this study and were provided by the Ministry of Oil & Gas., Ref /13 /.
Temperature maps for 500 m and 1500 m depths and locations of boreholes within the Petroleum Development Oman (PDO) concession area are shown on the maps in Fig. 4.8. These data is based on Ref /12/.
The locations, the depths and the temperatures for the boreholes having tempera-ture above 100 o C are listed in Appendix 5. The number of the boreholes having a temperature above 100 o C is 55. These boreholes are located within the area shown on the map in Fig. 4.9.

Renewable Energy Resources in Oman
Page 65 of 134
.
Fig. 4.8 Soil temperature at 500 m and 1500 m depts, Ref. /12/

Renewable Energy Resources in Oman
Page 66 of 134
.
Fig. 4.9 Area with boreholes with temperature above 100 deg C.
4.5.2 Electricity generation The highest observed temperatures are located in the northern part of Oman in the Omani mountains.
The highest observed borehole temperature is 174 o C. This temperature is below the temperature required for directly use of the hot water for steam power plants.

Renewable Energy Resources in Oman
Page 67 of 134
.
5 Renewable energy technologies 5.1 Wind turbines Energy conversion principle A wind turbine utilises the kinetic energy of the air flow. The power content in the wind is proportional to the cube of the wind speed and the air density. The energy in the wind is converted into rotational energy by the wind turbine rotor. The conversion can be made either by aerodynamic forces acting on the rotor blades or by the air pressure acting on the rotor blades. The rotational energy can be converted into electrical energy via a generator be utilised for mechanical work. Technology Grid connected wind turbines The technology for grid connected wind turbines is well proven and wind tur-bines have been commercially available for more than twenty years. The capacity of the first commercially available wind turbines in the 1980'es was in the range 15 -55 kW. The capacity has gradually increased and to day the wind turbine ca-pacity is in the range between 1 and 5 MW.
The wind turbine industry invests large amount in R&D activities in order to im-prove the cost effectiveness of wind turbines. This is done in order to optimise the design to reduce the use of material and to improve the reliability of the tech-nology in order to reduce the O&M costs. The modern grid connected wind turbine is a three bladed, pitch regulated tur-bine with the nacelle mounted on the top of a tubular tower. The hub height of a modern wind turbine is in the order of 60 to 90 m and the rotor diameter is between 60 and 90 m depending on the capacity of the wind turbine.

Renewable Energy Resources in Oman
Page 68 of 134
.
Fig.5.1.Modern grid connected wind turbine.
Fig. 5.2 Nacelle of a grid connected wind turbine.
Main shaft
Rotor
Gearbox Tower
Generator
Transformer

Renewable Energy Resources in Oman
Page 69 of 134
.
The total energy conversion system for a grid connected wind turbine is installed in the nacelle. The main components are the rotor connected to the gearbox via a main shaft and the generator connected to the gearbox via a high speed shaft. The power generated by the generator is transmitted to the grid eventually through a step up transformer. In 2006 the total installed wind power capacity worldwide was 75 GW of which 15 GW was installed in 2006. In some countries the wind turbines contribute up to 20 % of the total electricity production. The development of the global wind power capacity is shown in Fig. 5.3, Ref /14 /. Fig. 5.3. Development of global wind power capacity, Ref /14/
An annual increase in wind turbine capacity world wide is expected to be 15-20 %. In 2020 the world wide installed wind turbine capacity is expected to reach approximately 1000 GW. Off shore located wind turbines have been erected during recent years. This is relevant for countries where land availability is limited. Stand alone wind turbines Stand alone wind turbines for electricity generation can be divided into three categories: Micro systems: 100 W or less. Mini systems: 100 W - 10 kW Small systems: 10 kW to 50 kW. Stand alone wind turbines can been used as an inexpensive water pumping source, either as a mechanical pump or as power source for an electrical pump system.

Renewable Energy Resources in Oman
Page 70 of 134
.
Fig. 5.4 Wind turbine for mechanical water pumping
Applications The electricity generating wind turbines can be either grid connected or non-grid connected. For the grid connected wind turbines the generated electricity is fed into the grid system. As a general rule wind turbine capacity up to approximately 15 % - 20 % of the conventional power capacity in a grid system can be connected to the grid without requirements of special measures in order to maintain stable grid condi-tions. Otherwise the fluctuating power generated by the wind turbines would have an impact on the power quality of the grid system. Detailed grid analysis are required in order to determine the accurate maximum wind power capacity which can be connected to a specific grid system. The planned future interconnection of the northern and the southern grid systems will improve the technology preconditions for large scale utilisation of wind en-ergy in Oman. Up to 15 % of the total capacity within a power system can be wind power. For Oman this corresponds to maximum wind power capacity up to 750 MW.
Stand alone systems Small off grid wind turbines are relevant for remote areas and villages for power supply of small electrical equipment and lighting in connection with battery charging/backup.
The micro systems are typically used for power supply for small equipment and energy supply for lighting. Mini systems are suitable for off grid application as power supply for house holds radios and small appliances. Small systems are suitable as off grid application as stand alone power system or as integrated sys-tem in a hybrid power systems where the wind energy replaces fuel oil in isolated diesel power systems.
Fig. 5.5 Stand alone wind turbine for electricity genera-

Renewable Energy Resources in Oman
Page 71 of 134
.
Wind turbines providing mechanical output are typically used for water pumping purposes or for mill of corn. The capacity of this type of wind turbines is few kWs. Electricity generation The power output generated by a wind turbine is a function of the wind speed at the location where the turbine is erected. The electricity generation starts at a wind speed of approximately 4 m/s at hub height and at 12-13 m/s the output is equal to the rated power. At wind speeds between 13 m/s and 25 m/s the output is almost equal to the rated power. At 25 m/s the wind turbine is stopped in order to limit the loads on the wind turbine. Economic key figures The price for grid connected wind power plants on land is in the order of 1.9 mill USD/MW installed capacity. This includes the wind turbine costs as well as other project costs but excluding costs for land. For off shore wind turbines the price is approximately 40 % higher. The annual operation and maintenance costs are typically 2% of the construction costs of the wind turbine. The cost per kW installed capacity for stand alone systems is in general relatively higher compared to grid connected turbines. Advantage/disadvantage The advantages by utilising wind energy are:
• short implementation period compared to conventional power plants
• less dependant on fossil fuel
• pollution free electricity generation
The disadvantages are:
• Possible visual impact on the landscape as they are visible in the open ar-eas where the wind speed is high
• In case wind turbines are erected close to settlements the noise emission may have a negative impact. Siting of wind turbines shall be made care-fully to avoid noise nuisance.
• The rotating rotor blades cause shade effects due to the interaction with
the sunrays. The flicker can be reduced or eliminated by carefully siting of the turbines

Renewable Energy Resources in Oman
Page 72 of 134
.
5.2 Solar PV panels and heaters
Technology Solar photovoltaic There are two main types of solar cells used to make solar modules. The first generation are the silicon wafer-based with silicone cells (mono and multi crys-talline) which has been dominating and take up 93% of the market in 2005. The price of these has been reduced considerably over the years. The other type is the thin film cells, which today cover the last 7 % of the market. The thin film solar cells exist in many different types and are under constant development. As the technology stay today, the advantages with the crystalline solar cells are that they are more efficient, more reliable with longer lifetime and a longer record of proven durability. Therefore, they are often the preferred solution for power pro-duction on buildings.
The thin film solar panels are less efficient today and have a shorter lifetime and stability. The thin film is dominating as a power source for small appliances'. Very advanced thin film panels with high efficiency is used in space today but not commercially. It is generally accepted that on the longer term (beyond 2020) thin film technology with multi layer cells will dominate. These will have effi-ciency beyond 25%. The major advantage with the thin film is that they use less material and can therefore potentially be very cheap
Photovoltaic systems (PV) are commercially available and are based on reliable and tested technology. PV systems are suitable for use in rural areas in hybrid applications in combination with diesel power units and for electricity generation to the main grid, either as small building integrated systems or large grid con-nected systems located in the desert. The capacity will typically be in the order from few kW to 20-50 MW.
PV systems are best suited to feed electricity into the grid in the same way as wind energy with a certain percentage without storage. This possible percentage seems to be in the range of 20 % for Oman with the present load pattern. A higher percentage will give surplus production in the winter time. The percentage can be increased if the load pattern is changing, for example as a result of savings on cooling demand and use of excess heat for cooling purposes. The PV capacity can be achieved by a large number of smaller PV systems on buildings or it can be larger systems in the desert. That depends on the cost considering that PV on buildings or parking places also serves other purposes, shadow, architectural ideas as well as roofing and façade covering.
Solar PV has since it was introduced in space technology developed rapidly with increasing production and decreasing costs. It is, however, still marginal for power production as compared to other energy sources, including wind energy - mainly due to the cost.
Solar PV • Typical max capacity per m2 of panel, today, 100 Wp per m2. • Typical max capacity per m2 of panel, future, 300 Wp per m2.

Renewable Energy Resources in Oman
Page 73 of 134
.
Solar Thermal Power system Solar Thermal Power, also called Concentrating Solar Power (CSP) produces steam which can be used either directly for electricity generation or the heat can be stored for continued operation during the night. CSP plants can therefore sup-ply electricity as a conventional power plant, all the time, except for regular maintenance etc. Excess heat from the steam cycle can be utilized for heat driven cooling and desalination and this can make CSP a very attractive technology for Oman on the longer term.
CSP is not a fully developed technology. Plants without storage have been in op-eration for many years, development of systems with storage are ongoing and efficiency increase and cost reductions is expected that will eventually make such plants more attractive than conventional power plants from a commercial point of view.
It is important to notice that the size or capacity of a solar electricity plant is in-dicated as electricity capacity. For photovoltaic the capacity is called kWp (kW peak) to avoid misunderstandings. A 100 kWp PV plant means that the plant will deliver 100 kW at the standard conditions with 25o C cell temperature and an insolation of 1000 W/m2 corresponding to the maximum during the day. On a yearly basis such plant will in Oman deliver about 1800 kWh for each kW in-stalled PV.
A 20 MW CSP plant delivers 20 MW electricity from the generator. The capacity of the solar collectors are much higher as more than half of the heat is lost in the steam cycle. A 20 MW CSP plant with storage for night operation will deliver 20 MW (almost) constantly and the solar capacity will be even higher as some of the heat produced during the day will be stored for night operation.
CSP was in a period in the last part of last century almost a forgotten technology and the development had stopped. This has changed dramatically over the recent years in which the technology and marked development in certain countries (Spain and others) has been very positive.
Solar thermal power • Typical max capacity per m2 of panel, today, 150 W per m2. • Typical max capacity per m2 of panel, future, 200 W per m2.
An advantage of solar thermal power, as compared with PV, is that a solar ther-mal power plant can be made to provide electricity constantly. This can be done in two ways. The first is that the heat (high temperature) can be stored for shorter periods (for the night) to produce electricity after sunset. Another way is to use gas (or other) to heat the steam when the sun is not available. The first option, the storage, is still on the experimental stage while the use of gas as the backup is widely used.
Solar heating Electricity is often used to heat water for domestic use and/or for use by the in-dustry. Solar thermal collectors can replace part of the electricity consumption, especially in sunny climates like in Oman. In this way solar thermal produces electricity indirectly. See Appendix 5 for more information on solar thermal.

Renewable Energy Resources in Oman
Page 74 of 134
.
Solar heat • Typical max capacity per m2 of panel, today, 600 W per m2. • Typical max capacity per m2 of panel, future, 600 W per m2.
Electricity generation PV cells Today's PV module converts from 5-15 percent of the solar energy directly to DC electricity. This DC electricity can be stored in batteries and converted to AC electricity in a converter to be used in conventional appliances. With a typical maximum solar insolation of 800 W/m2 a PV module produces maximum about 100 W per m2 of collector.
The efficiency of a solar PV module depends on the environmental impact such as the surrounding air temperature and the dust contamination of the surface of the PV cells. The reduction of the efficiency of a solar PV cell due to high air temperature is estimated to 8% for Omani conditions and the reduction in effi-ciency due to dust contamination is assumed to be 2%. Details on the influence of air temperature on the PV cell efficiency is enclosed in Appendix 6.
Fig. 5.6 Solar PV panel.
Solar thermal plants In a solar thermal plant the solar energy is used to produce high temperature steam which is used in turbines to generate electricity.
The efficiency of a solar thermal power plant depends on the concentration ratio of the collector as higher temperatures give higher conversion efficiency in a steam turbine. Three different concepts of solar thermal plant exist:
• Parabolic trough system (one dimensional concentration, 400 o C)
• Dish system (two dimensional concentration)
• Solar tower with mirrors directing solar radiation to a tower, representing the highest concentration ratios giving up to 1000 o C.

Renewable Energy Resources in Oman
Page 75 of 134
.
The parabolic trough has been dominating but the solar tower is under rapid de-velopment and may be dominating in the long term. The dish system is typically made with a stirling engine and generator in the focal point of the dish to produce power directly. Fig. 5.7 Solar thermal concepts: parabolic trough, dish system and solar tower for production of high temperatures for solar thermal power.
Solar thermal power or Concentrating Solar Power (CSP) produces heat which is easier to store than electricity and therefore the system can be made to supply electricity as a conventional power plant. With the storage the power supply can be varied over the day according to the need. The CSP can be made with or without conventional fuel (gas) as backup.
For Oman an interesting option is a CSP where the heat from the condenser in the steam cycle is utilized for desalination. Systems with storage are being dem-onstrated today but the combination with desalination has not been made.
As mentioned this technology can together with PV develop to be the main tech-nology for electricity in Oman and even give the basis for export. The potential for production of solar energy is more or less independent on the season in Oman with a slight decrease in winter time. The consumption is higher in summer due the need for air condition. It is too costly to oversize renewable energy systems to be able to supply 100 % renewable energy. It is therefore feasible to export the surplus production in the winter to Europe where the need is highest in winter. Seasonal storage can only be considered on the very long term.
Demonstration projects under construction today with this technology is about 10 to 50 MW but it is expected that the future optimum size will be much higher, perhaps 200 or 300 MW.

Renewable Energy Resources in Oman
Page 76 of 134
.
A Concentrating Solar Power plant should be located in the desert not too far from the coast and sufficient main grid. Water is needed for cooling and for de-salination as well as for cleaning of panels. Another important aspects is to con-sider the delivery of the desalinated water which need to be piped.
The SOLAR TRES plant under development in Spain is interesting for Oman. It is a system with central receiver (tower) and heat storage in molten salt with a cold and hot tank. The storage is for 15 hours of operation and the system can also be supplemented with a gas boiler. See Fig. 5.8.
Fig. 5.8 The SOLAR TRES concentrating Solar Power plant under development in Spain. Ref /15 /.

Renewable Energy Resources in Oman
Page 77 of 134
.
Fig. 5.9 Main data for the SOLAR TRES concentrating Solar Power plant under development in Spain.
Fig. 5.10 The SOLAR TRES concentrating Solar Power plant under develop-ment in Spain. View of the mirrors. Ref /15/.
Applications The typical applications of solar energy systems are illustrated in Fig. 5.11. Off grid PV systems are typically in the range between few W and up to 100 kW. Grid connected PV systems are typically in the range between few kW and up to 10-20 MW. Solar thermal power plants are only relevant where the solar insola-tion is high. According the Fig. 6.11 solar thermal power is applicable in Oman having a solar insolation of about 2200 kWh/m2 per year. It also appears that solar thermal plants are preferred for large capacity.

Renewable Energy Resources in Oman
Page 78 of 134
.
Fig. 5.11 Application of solar thermal power plants and photovoltaic systems as function of the installed capacity and the annual global solar insolation, Ref /16/.
Examples of applications in
• large cities connected to national grid • in rural off grid large cities with a number of diesel units for production
of electricity • in rural small villages and in isolated settlements • in desert areas
Solar energy can in principle be used for desalination in two ways, with PV elec-tricity for a reverse osmosis process and in a number of ways where heat is used to evaporate the water in a distillation process. Another heat source can be used in this respect for example from conventional power production, a steam cycle or a diesel engine. Further data is needed to analyse this. Electricity generation The technical potential for electricity generation by grid connected PV systems is determined by the area suitable for installation of PV cells (e.g. on buildings, parking areas etc). Assuming that 50% of the houses in Oman are suitable for installation of PV cells and the area available at each house is 20 m2 in average the total potential area for installation of PV cells on houses is 4,250,000 m2. This area of PV cells corresponds to a potential annual electricity generation of 750 GWh/year and an installed capacity of 420 MW, or about 15% of the total capacity today. On top of that PV can be located in the desert. Typical capacity per m2 of land is about 30 Wp (Watt peak) corresponding to 30 MWp per km2.
In the long term perspective the theoretical potential for electricity generation by Concentrating Solar Power (CSP) systems in Oman is huge. CSP plants with storage for supply of electricity as conventional power plants will require 1 km2 of land use for 10 MW capacity. Theoretically it is possible to supply Oman's present consumption of 13,100 GWh by utilising about 280 km2 of the desert for solar collectors, corresponding to 0.1 % of the area of the country.

Renewable Energy Resources in Oman
Page 79 of 134
.
The technical potential for electricity generation by PV systems operating with diesel gen-sets and battery storage capacity in isolated off-grid power systems is assumed to be 20% of the present electricity generation. This corresponds to 70 GWh/year and a solar PV capacity of 40 MW. By using a fraction of 20% a ma-jor part of the generated electricity can be used directly and only a minor part has to be stored.
The potential for utilising PV cells as power supply for small equipment and lighting is large. Presently the oil industry has PV cell capacity available for op-eration of small equipment in remote areas. Due to the small capacity of this type of power supply the total potential for this type of solar power supply is rela-tively small.
Economic key figures Solar PV A typical way of showing cost projections for solar PV has three generations of solar PV, see below Fig. 5.12. The present stage of development is stage II, the second generation, where the cost is reduced considerably compared to first gen-eration. The efficiency has also dropped due to introduction of thin film PV. Dur-ing this decade, up to 2010 it is expected that the cost will decrease further and thin film PV will take over. In the next decade, up to 2020, it is expected that III generation PV cells with much higher efficiency will be further developed and commercialised. This generation is based on multilayer cells, the higher effi-ciency is important in order to reduce cost of material for the panel as well as for support structures.
The life time of solar PV panels is 25 years. Other minor component in a solar PV system such as converter, batteries etc. have shorter life time approximately between 5 - 15 years.
This development will bring the cost below 0.5 USD per installed W which will make PV directly competitive on the grid making PV the first choice for roof cover material worldwide.

Renewable Energy Resources in Oman
Page 80 of 134
.
Fig. 5.12 Efficiency and cost of the three generations of solar cells. I is wafers. II is thin-films and III is advanced thin-films. Cost in 2007 USD. Ref /17/.
• Typical installation cost 5000 to 10000 USD/kW • Current energy cost 0.25 to 1.60 USD/kWh (for Oman the low value) • Future energy cost, down to 0.05 USD/MWh

Renewable Energy Resources in Oman
Page 81 of 134
.
Solar thermal plant
Fig. 5.13 shows a typical learning curve for CSP solar thermal power plants in Euro per kWh, Ref /17/. Today the levelized cost is about 0.15 Euro per kWh corresponding to about 210 USD per MWh.
Fig. 5.13 Learning curve for expected levelized cost of solar thermal power. Cost in Euro per kWh. Ref /18/.
• Typical installation cost 2500 to 6000 USD/kW • Current energy cost 0.12 to 0.34 USD/kWh • Future energy cost, down to 0.04 USD/kWh
At present the levelized cost of CSP power varies from 120 to about 210 USD per MWh for a location like Oman. The low cost is for combined plants where most of the power is by gas and the high cost for those with solar only. As it ap-pears from the above learning curve a significant cost reduction is expected over the coming decade, bringing the cost down to well below 100 USD per MWh.
Solar heating collectors Solar thermal energy, solar collectors for heating of water, is a fairly developed technology. At present China is developing the production capacity for the vac-uum collectors rapidly and has established effective production lines. But solar thermal collectors are still not mass produced in the same way as consumer goods and there is still space for large cost reductions.
• Typical installation cost 300 to 1700 USD/kW • Current energy cost 0.02 to 0.25 USD/kWh (Oman in the low end) • Future energy cost 0.02 to 0.01 USD/kWh
It is important to notice that already today the cost of producing heat by solar is much lower than the cost of producing electricity and use this for heating of wa-ter.

Renewable Energy Resources in Oman
Page 82 of 134
.
Advantages/disadvantages The advantages and disadvantages for solar thermal power plants and large PV plants are compared in below Table 5.1.
Table 5.1 Advantages and disadvantages for solar PV and CSP
Solar PV CSP ‐ Concentrating Solar Power Advantages Disadvantages Advantages Disadvantages
Low or no pollution The high cost at present. Low or no pollution The high cost at present
Very flexible from small to very large plants.
Only produce electricity when the sun is shining.
Can be made with heat storage to supply electricity constantly as a base load plant.
Only for larger plants, in the future more than 100 MW or per-haps 200 MW.
Cost reductions ex-pected to make PV di-rectly competitive to conventional power sometimes with in the next few decades.
Electricity is produced directly and electricity is difficult (expensive) to store.
Cost reductions in the same magnitude as for PV expected or possi-ble.
Certain parts (storage and heat transfer me-dia) still under devel-opment.
Used off grid as well as on-grid.
Suitable for desert location.
Longer implementa-tion time than PV.
Can serve other purpos-es if integrated into buildings, shading, roofing etc.
Excess heat from power production can be used for desalina-tion.
Uses only direct rad-iation. Potential con-verted percentage of solar insolation lower than with PV. But excess heat can be used.
Feed into the grid in urban areas give less losses.
Proven technology with long life time
Low maintenance and simple to apply.

Renewable Energy Resources in Oman
Page 83 of 134
.
5.3 Biogas production Energy conversion principle Organic matter in effluent water from sewage treatment plants and other biomass (e.g. organic household waste or waste from food industry or manure/dung from animals etc) is converted biological to biogas by bacteria under anaerobic condi-tions i.e. without presence of oxygen. Ideally the substance processed should have an organic content of about 8-10% weight VS (volatile solids) which is max. for pumping, but plants are seen with operation up to 30% VS (dry process) and down to 2-3% VS (biofilter plants).
The degassed material can be used as fertiliser and soil conditioner, provided that it does not contain to high content of environmental harm full substances.
The biogas produced consists of 60-70% CH4 (Methane) and 30-40% CO2 (Car-bon Dioxide) plus traces of other gasses hereunder H2S (Hydrogen Sulphide) typically 300-3000 PPM, which smells and is poisonous. The process tempera-ture is typically 35oC or 52-55 o C. At high temperature the process is faster but also more sensitive and less reliable.
Biogas can also be extracted from old landfills with large depths and more than 200,000 tonnes tipped. But the production of landfill gas is very dependent on the composition of waste and age of the landfill and the principles of operation.
Applications The production and utilisation of biogas can be based both on small and large plants.
Maximum size is in the range of 30,000 Nm3 biogas per day delivered at a con-stant level. The size of plant possible is normally limited by the amount of or-ganic waste available. Gas production is normally in the range of 25-60 Nm3 per m3 raw material.
The biogas with 65% CH4 has a lower calorific value (LCV) of about 23 MJ per m3. Landfill gas has normally only 40-60% CH4 due to some 10% mixture with air.
Parasitic energy demand is about 2.8 MJ per m3 and 0.14 kWh electricity per m3 biogas produced.
The gas can be used directly for heating purpose e.g. production of hot water or steam for industry. The gas can also be cleaned and compressed for use in vehi-cles, e.g. waste lorries, taxies, busses, normal cars etc. Finally the gas can also be fed into gas distribution pipes and used several kilometres from site of produc-tion.
Technology Biogas technology is considered well proven and fully commercial and devel-oped technology for the wet processes, but for semidry and dry processes used for processing organic household waste, the experience is mixed with room for improvements.

Renewable Energy Resources in Oman
Page 84 of 134
.
Most reliable and economical plants are anaerobic sewage treatment plants where additional organic matter can be added.
If a landfill is considered for extraction of gas, then drills and test pumping is needed to evaluate the potential of construction.
Electricity generation Gas can after little cleaning be used in a gas-engine to produce electric power preferably in combination with utilisation of the surplus heat i.e. in a CHP com-bined heat and power plant.
In a gen-set utilising biogas about 40% electricity can be gained from the energy content in the gas. Overall efficiency for heat and power depends on the cooling of the flue gasses, but can be up to about 90%.
Economic key figures Biogas plants are expensive and are normally only built for solving an environ-mental problem.
The investment costs is about 315 - 940 USD per m3 biogas produced per day and the yearly O&M cost is about 62 USD per m3 biogas produced per day (1995 cost level). Technical lifespan is about 20 years.
Advantages/disadvantages Advantages
• caption of biogas containing CH4 (CH4 has a high impact on climate change)
Disadvantages
• Biogas smells, is toxic and is highly explosive (Traditional proper pre-cautions must be taken in order to avoid hazards in the operation).
• Risks for emissions of TOC, CH4, CO and NOx

Renewable Energy Resources in Oman
Page 85 of 134
.
5.4 Wave energy absorption units Energy conversion principle A wave energy absorption unit utilises the kinetic and the potential energy of the sea waves. The power content in the waves is proportional with the square of the wave height multiplied by the wave length. In principles there are three different types of utilising the wave energy. One type utilises the vertical movement of the water surface. A floating device absorb the vertical movement and transform this movement into a rotation. Another type is based on sluicing the water. By this mechanism the potential en-ergy of water is collected and stored. By letting the stored water fall through a turbine the potential energy is converted into rotational energy. Third type is based on oscillating of an air column. The variation of the water level due to the waves actuate an air column in a chamber. The fluctuating air column acts on a rotor which absorbs the kinetic energy in the air and transform this into a rotational movement. In all the types the movement of the rotational movement is converted into elec-tricity by a generator. Technology A number of different wave energy absorption concepts have been designed and tested as prototypes. Examples of tested concepts representing each of the three types are illustrated below. Fig. 5.14 System utilising vertical movement of the water.

Renewable Energy Resources in Oman
Page 86 of 134
.
Fig. 5.15 System based on sluicing water
Fig. 5.16 System utilising fluctuating air column
Test results regarding the reliability of such systems in operation under real ocean environmental conditions are still collected. According to achieved ex-periences the main challenge is to design the wave energy units to withstand the environmental impact in the sea water. Commercially available systems with documented successful long term track records are not yet available on the market. Thus this technology is still consid-ered as being at the development stage even recent performance test results are promising.

Renewable Energy Resources in Oman
Page 87 of 134
.
Applications The rotational energy generated by a wave energy absorption unit is used for electricity generation. The generator is installed as an integrated part of the wave energy absorption unit. The generated electricity is transmitted to the shore via a sea cable. The power is fed to the main grid on land. Electricity generation The test results of prototype systems indicate that the efficiency of wave energy absorption systems is approximately 10 %, Ref/10/. The efficiency of the conver-sion to electricity is in the order of 80 %. Thus the total net overall efficiency is in the order of 8 % The wave energy flux in the Arabian Sea is 17 kW/m. At this energy flux the net annual energy production by a wave energy system in the Arabien Sea is 15 MW/m/year. The production by a system installed closer to the Omani coast will generate less energy. Economic key figures According to the example in Ref /19/ the installation cost per kW installed capac-ity is approximately 2,800 USD/kW. Advantages/disadvantages Advantages
• no land requirement for installation of the plant
• no visual impact in the landscape
Disadvantages
• difficult environment to perform maintenance

Renewable Energy Resources in Oman
Page 88 of 134
.
5.5 Geothermal power plants Energy conversion principle Geothermal heat originates from weak radioactive activity of volcanic activity in the underground. The temperature in the ground normally raise with 30o C per kilometres depth meaning that a borehole normally need to be more than 3 km in order to be able produce steam or superheated water, that can be used to drive a low pressure steam turbine or other equipment.
If volcanic activity is present usable heat at higher temperature and less depth will be available.
Technology The water from geothermal wells is normally extreme saline and contains many salts solutions, particles and compounds. Clogging and corrosion problems are therefore often seen and need to be considered. Used water from the geothermal well can be drained off or re-infiltrated in the ground, which also can create problems with clogging of re-infiltration wells.
Applications Geothermal is used in different applications depending on the temperature of the soil water.
In a temperature range between 60o C and 100o C the energy can be used for dis-trict heating. Via a heat exchanger the energy content in the hot water from the well is transferred to the circulated water in the district heating system.
In a temperature range between 100o C and 170o C the energy can be utilised for electricity generation. The heat from the hot water is transferred through a heat exchanger to another liquid with a low boiling point and is used for electricity generation in a power plant.
At temperatures above 170o C the hot water can be utilised directly in steam plants after the water is cleaned. When the hot water is pumped up from the un-derground the pressure decreases and the water is transferred into steam.
The hot water could also be used to desalinate seawater in thermally driven de-salination systems based on vapour compression cycles. This implies that the well is located close to the coast line.
Electricity generation If steam is generated from the well, it can be used to drive a low pressure con-densing steam cycle to generate electricity at low efficiency depending
An alternative is to use an ORC plant (Organic Rankine Cycle), which would be able to produce electricity based on superheated water of around 120oC with an electricity production of typically 8-12% electricity of the incoming energy be-fore subtraction of pumping energy for the wells. Pumping energy has to be con-sidered from case to case. It is not unusual that electricity consumption for pump-ing energy amounts to 5-10% of the usable heat in the well water.

Renewable Energy Resources in Oman
Page 89 of 134
.
Economic key figures The cost of pre-investigations is high unless needed data are already available from the oil industry.
If clogging or corrosion problems occur then the O&M costs can be consider-able. Size of plants is typical around 15 MW thermal and above. Investment costs for a 15 MW thermal plant is about 50 mill USD.
If the used well water is re-infiltrated at same depth as the filter of the production well, then the environmental impact is very little.
Advantages/disadvantages Advantages
• steady power supply
Disadvantages
• saline hot water may have negative impact on the environment

Renewable Energy Resources in Oman
Page 90 of 134
.
5.6 Non energy benefits The potential renewable energy (at least wind and solar) technologies analysed in this report will all replace natural gas ( in MIS and Salalah) or diesel (in RAECO) as fuels. Renewable energy projects have zero green house gas emis-sions so the replacement will result in a reduction of the emissions of CO2.
Key to the carbon emission reduction is the properties of the various fuels ana-lysed. The table below summarizes these properties as defined by the UN's In-ternational Governmental Panel on Climate Change (IPCC).
Table 5.2 shows the assumed fuel properties and the carbon content per unit. The top four rows shows 'clean' contents of the fuels, while the last four shows the carbon content in electricity production assuming 10% T&D losses and the effi-ciencies indicated.
The column Carbon Content per MWh shows the carbon emission per MWh electricity replaced by carbon neutral renewable energy production. The most interest in the Oman context is mainly natural gas and to a smaller extent diesel. As the table shows carbon emission the emissions from natural gas are compara-ble smaller than for HFO, diesel and coal. These values are used latter in the study to calculate the potential carbon emission reductions.
Table 5.2 Assumed Fuel Properties and carbon emissions
Fuel type Heat Content IPCC Carbon Content
Carbon emission per MWh consumed
Efficiency in use
Coal, high-grade* 28 MJ/kg 25.8 tC/TJ
Fuel oil
40.3 and 42 MJ/L
21.1 tC/TJ
Natural gas 40 MJ/Nm3 15.3 tC/TJ
Diesel 50 MJ/L 20. tC/TJ
Electricity - Gas fired 3.6 MJ/kWh 48.7 tc/TJ 175 kg/MWh 34%
Electricity - Fuel Oil Fired
3.6/kWh 61.7 tC/TJ 222 kg/MWh 38%
Electricity - Coal fired 3.6 MJ/kWh 86.9 tC/TJ* 312 kg/MWh 33%
Electricity - Diesel 3.6 MJ/kWh 59.0 tC/TJ 212 kg /MWh 38%

Renewable Energy Resources in Oman
Page 91 of 134
.
5.7 Energy efficiency
Renewable energy should always be seen together with efficient use of energy as the cost of supply is expensive and efficient use therefore important. Ideally en-ergy efficiency should have a priority until the cost of saving equals the cost of producing. For Oman probably the most important in this respect is standards and requirements related to cooling, insulation of flat roofs and walls, improved windows and shading is essential. It also includes labelling, requirements for pe-riodic mandatory check, standards etc. The European Unions actions in this re-spect can be used as an inspiration. These aspects is not included into the present study but should always be kept in mind.

Renewable Energy Resources in Oman
Page 92 of 134
.
6 Cost of electricity generation in Oman In this section we compare the cost of electricity generation using conventional fossil fuel generation technologies to the cost of electricity produced using re-newable energy technologies.
The methodology used is levelised cost and the comparison focuses on Long Run Marginal Costs (capital, fixed and variable o&m, fuel costs and financing costs).
6.1 Generation based on conventional fuels
6.1.1 Investments in new power capacity Investments in the power market/sector are typically connected with the follow-ing characteristics:
• Investments require much capital;
• Investments are long-term investments;
• The time from plant decision until the plant is ready for operation is long (particularly for major thermal power plants);
• The market/sector is heavily influenced by political conditions (taxes, regulation etc.) which normally change over time.
This means that calculations on new investments are often connected with large uncertainties. During a 20-30 year period, which is a typical investment horizon for a power plant, substantial changes may occur in the market/sector. The main risks for generators are the uncertainty about fuel and electricity prices, and the risks of increased environmental restrictions or other restrictions from the regula-tors. The higher risk there is in the market/sector, the higher risk premium the investors or project developers will take, and the higher electricity prices the consumers will have to pay (assuming that the electricity prices are based on market prices).
In order to estimate the feasibility of investments in new power capacity, it is necessary to have an overview of the expected annual income and costs. The main income comes from sale of electricity, whereas a supplementary income may come from sale of system services (e.g. voltage regulation) or from sale of by-products (e.g. gypsum from de-sulphuring equipment). These supplementary income source are not considered here.

Renewable Energy Resources in Oman
Page 93 of 134
.
The main costs include the following elements:
• Fuel costs;
• Environmental costs, e.g. taxes;
• Variable O&M costs;
• Fixed O&M costs;
• Investment costs.
In order to evaluate an investment, the investor or project developer has to set up requirements to the investment horizon and to the rate of return. A typical in-vestment horizon in the power sector is 20-30 years, which in some cases is shorter than the actual life time of a new plant. The cost estimates in the follow-ing sections are the levelised cost of the total life of the investment. A typical required rate of return including risk premium is 10%. In this study a discount factor of 7.55% p.a. is used as agreed with the Authority. In some cases sensitiv-ity calculations with discount rates from 5 to 13% p.a. have been made.
6.1.2 Short- and long-term marginal costs When estimating costs, it is relevant to differ between short- and long-run mar-ginal costs. The short-run marginal costs include only variable costs such as fuel costs and variable O&M costs (including environmental taxes, if any). In addi-tion to this, the long-run marginal costs include capital/investment costs and fixed O&M costs.
In this section, the short- and long-term marginal costs for new generation capac-ity based on fossil fuel are estimated: for two different gas technologies, one HFO technology, and one coal technology. This comparison is the most relevant in terms of deciding if renewable energy should be included in the future fuel mix. However, in order to determine the financial impact on the subsidy expendi-ture in Oman current average cost in the power production of Oman is also con-sidered at the end of this section.
The long-term marginal costs are estimated assuming an annual number of full load hours of thermal power plants of 5000 and 7500 hours, respectively. Table 6.1 below shows the main assumptions and the calculated marginal short- and long-run costs for the four different plants/technologies.
The assumed price used is 1.5 USD MMBtu (595 USc/Gcal), the crude oil price 50 USD/barrel and the coal price 62.45 USD per ton.

Renewable Energy Resources in Oman
Page 94 of 134
.
Table 6.1 Assumptions and calculation of short- and long-term marginal costs, USD /MWh -low gas price (595 US c/Gcal)
Gas tur‐bine, 140 MW
Combined Cycle, 400 MW
HFO Steam, 300 MW
Coal Steam, 1000 MW
Power capacity, MW 140 400 300 1000
Economic Lifetime, years 25 25 30 30
Investment costs, million USD 45 184 289 1640
Specific investment costs, million USD/MW
0.32 0.46 0.96 1.64
Fuel efficiency, % 33.9% 48.4% 38.2% 38.0%
Fuel costs, US c/Gcal 595 595 2519 880
Variable O&M costs, USD/MWh 0.55 0.70 0.80 0.05
Short run marginal costs, USD/MWh 15.64 11.28 57.50 19.97
Fixed annual O&M costs, USD Mill 4.26 5.04 12.65 18.60
Annual capital/investment costs, USD Mill
4.09 16.58 24.59 139.54
Long run marginal costs, USD/MWh (5.000 h)
27.57 22.09 82.33 51.59
Long run marginal costs, USD/MWh (7.500 h)
23.59 18.49 74.05 41.05
It appears from the table that short-run marginal costs at the conventional gas plants differ from around 11 USD/MWh to 16 USD/MWh. The short-run mar-ginal costs are lowest for the combined cycle plants because these plants have larger fuel efficiencies than the gas turbines. With the assumed oil and coal prices conventional gas plants have the lowest economic cost.
The results with respect to long-run costs are shown in Fig. 6.1.

Renewable Energy Resources in Oman
Page 95 of 134
.
Fig. 6.1 Long-run marginal costs for conventional technologies (two annual full load hours scenarios) - Low Gas Price
The assumed number of annual full load hours influences long-run marginal costs. Increasing the assumed number of full load hours per year from 5000 to 7500, acts to reduce the long-run marginal cost per unit.
The long-run costs of the gas turbine are least sensitive towards number of full load hours because this technology has the lowest specific investment costs. If the annual number of full load hours was decreased to below approximately 2000 hours, the long-run costs for the gas turbines would be lower than for the com-bined cycle plants. This is one reason why gas turbines are suitable as peak load units with only few operational hours per year.
The tables 6.2 and 6.3 below show the short- and long-run marginal costs, if fuel prices were 3 USD per MMBtu and 6 USD per MMBtu. The low gas price (1.5 USD per MMBtu) corresponds to the price currently charged the power plants, i.e. actual cost, not economic costs. Economic costs are assumed to be 3 USD/MMBtu with a depletion premium of 3% p.a. Table 6.2 shows the marginal cost with a natural gas price of 3 USD/MMBtu and Table 6.3 the cost with a natural gas price of 6 USD/MMBtu.
Table 6.2 Assumptions and calculation of short- and long-term marginal costs, USD /MWh -( medium gas price 1190 US c/Gcal)
Gas tur-bine, 140 MW
Combined Cycle, 400 MW
HFO Steam, 300 MW
Coal Steam, 1000 MW
Fuel costs, US c/Gcal 1190 1190 2519 880
Short run marginal costs, USD/MWh 30.73 21.86 57.50 19.97
Long run marginal costs, USD/MWh (5.000 h)
42.66 32.67 82.33 51.59
Long run marginal costs, USD/MWh (7.500 h)
38.68 29.06 74.05 41.05
0
10
20
30
40
50
60
70
80
90
GT 140MW CCGT 400MW HFO 300MW Coal 1000MW
USD
/MWh
5000 Hours
7500 Hours

Renewable Energy Resources in Oman
Page 96 of 134
.
Table 6.3 Assumptions and calculation of short- and long term marginal costs, USD /MWh - (high gas price (2380 US c/Gcal)
Gas tur-bine, 140 MW
Combined Cycle, 400 MW
HFO Steam, 300 MW
Coal Steam, 1000 MW
Fuel costs, US c/Gcal 2380 2380 2519 880
Short run marginal costs, USD/MWh 60.91 43.02 57.50 19.97
Long run marginal costs, USD/MWh (5.000 h)
72.84 53.83 82.33 51.59
Long run marginal costs, USD/MWh (7.500 h)
68.86 50.22 74.05 41.05
The results are summarised in comparing the long run marginal cost of the two conventional gas technologies, and different gas prices, with conventional HFO and coal technology.
Fig. 6.2 Long run marginal cost of generation with conventional gas technology and varying gas price.
Note: All technologies 7500 annual full load hours
0
10
20
30
40
50
60
70
80
Gas turbine (140MW)
Combined Cycle GT (400MW)
HFO Steam (300MW)
Coal Steam (1000MW)
USD
per M
Wh
1.5 USD
3 USD
6 USD

Renewable Energy Resources in Oman
Page 97 of 134
.
Average Generation Cost in Oman The current average generation cost for MIS and Salalah can been found in Ref /20/, Oman Power and Water Procurement, annual Report 2006.
Fig. 6.3 Average cost of generation in Oman by plant 2006
Figure 6.3 shows the average cost in 2006 by power plant. There are large varia-tions between the plants with Manah and Dhofar as the most expensive and Al Ghubra and Barka having the lowest cost. The average for the country, excluding RAECO, is 0.031 USD/kWh. 50% of the average costs are fuel cost, and natural gas is currently supplied at the price of 1.5 USD/MMBtu to the power plants on long term contracts with duration of 15 years.
6.1.3 Diesel power plants Method and assumptions Power generation in RAECO' s are is mainly diesel based. The price of diesel is 146 Baiza/Litre, corresponding to 0.38 USD per Litre.
Production cost of existing capacity The average generation costs in RAECO have been calculated by The Authority to 0.21 USD/kWh in 2006. The cost variation is large and the highest recorded costs were 0.67 USD/kWh and even higher at some locations with little produc-tion, as can be seen in Appendix 10.
Because of the dispersed population in the rural areas the production cost per unit are significantly higher than those of the MIS and Salalah systems. The higher cost improves the competitive position of renewable energy, and in order to find suitable candidates a list of the cost at various plants is provided in Appendix 10. The data is based on information for Jan to June 2006 and full year 2006.
Production cost of new diesel capacity The calculation of the production cost for a new diesel capacity has been based on the assumed that the capacity is 1 MW and the operation hours is 5000. Costs of generation in diesel plants are very dependent on the number of operating hour, due to the high fuel and other variable cost.
9.1
11.5
13.3
10.6
14.0
16.1
10.011.6
14.7
12.1
Al Ghubra
Al Rusail
Wadi Al Jizzi
Barka Al Kamil Manah Sohar MIS Dhofar Oman
Baisa/kWh

Renewable Energy Resources in Oman
Page 98 of 134
.
It has further been assumed that the efficiency is 38%. The data for this calcula-tion is based on World Bank Energy Unit Discussion Paper: 'Technical and Eco-nomic Assessment: Off-grid, Mini-Grid and Grid Electrification Technologies' from November 2005, Ref /21/. Prices are updated to 2007 level with adding 6.09%.
Table 6.4 Assumptions for calculation of new diesel capacity, Ref /21/ Item Value Comment
Capacity 1.0 MW 1.0 MW
Capital Cost 0.6 Mill USD 0.6 Mill USD
O&M Cost Fixed 0.1 Mill USD 0.1 Mill USD
O& M Cost Variable 30 USD/MWh 30 USD/MWh
Fuel cost 4450 USc/Gcal 4450 USc/Gcal 146 Baiza/Litre diesel
Operating hours 5000 hours 3000 hours
Power Production (Useful) 5000 MWh 3000 MWh
Efficiency 38% 38%
Lifetime 30 years 30 years
Discount Factor 7.55% 7.55%
Short Run Marginal Cost 130.7 USD/MWh 130.7 USD/MWh
Long Run Marginal Cost 160.9 USD MWh 181.1USD MWh
Table 6.4 shows the results of this calculation. Long Run Marginal Cost of new diesel capacity is estimated to 160.9 USD/MWh at 5000 operating hours and 181.1 USD/MWh at 3000 operating hours.
6.2 Generation based on renewable energy The production cost of electricity based on the solar and wind energy resources in Oman has been calculated for four specific types of plant:
• 20 kW grid connected solar PV plant
• 20 MW grid connected solar PV plant,
• 20 MW grid connected solar thermal plant
• 10kW off grid PV-diesel plant
• 20 MW grid connected wind farm
6.2.1 Small grid connected solar PV plant, 20kW Description of the technology and the solar insolation assumptions regarding a small grid connected solar PV is described in Appendix 12. This application is foreseen to be implemented in an urban environment and comprises 200 m2 con-ventional panels. It is an end-user application and replace electricity from the grid at the customer level. In terms of comparison of cost it should therefore be compared with the end-user tariff (Permitted Tariff). The result of the cost calcu-lation is shown below in Table 6.5. The costing and optimisation of the applica-tion is made in HOMER -Version 2.19 and summarised in Appendix 12.

Renewable Energy Resources in Oman
Page 99 of 134
.
Table 6.5 Cost data for Solar PV plant - 20 kW
Item Value
Capacity 0.02 MW
Capital Cost 0.15 Mill USD
O&M Cost 0.001 Mill USD per year
Power Production (Useful) 34 MWh
Lifetime 25 years
Discount Factor 7.5%
Short Run Marginal Cost 0
Long Run Marginal Cost 425 USD/MWh
The Long Run Marginal Costs are estimated to 425 USD/MWh.
6.2.2 Large grid connected solar PV plant, 20 MW Description of the technology and the solar insolation assumptions regarding a large grid connected solar PV is described in Appendix 8, including detailed cost estimate.
This application is in principle identical to the previous, except for the capacity scale. The panels will cover an area of about 200 000 m2 and be among the larg-est in world. The application will supply the grid and is the result of the cost cal-culation is shown below in Table 6.6. The cost calculation is made in HOMER-version 2.19.
Table 6.6 Cost data for a new grid connected PV plant - 20 MW
Item Value
Capacity 20 MW
Capital Cost 89 Mill USD
O&M Cost 0.5 mill USD per year kWh
Power Production (Useful) 36 GWh/year
Lifetime 25 years
Discount Factor 7.5%
Short Run Marginal Cost 0
Long Run Marginal Cost 250 USD/MWh
The Long Run Marginal Costs are estimated to 250 USD/MWh for this applica-tion.

Renewable Energy Resources in Oman
Page 100 of 134
.
6.2.3 Solar thermal plant, 20 MW The economic calculation for the Solar Thermal plant in below table 6.7 is valid for a plant without storage and with data from Ref /15/ and Ref /22/. There are a number of plants under construction which includes storage of up 15 hours ca-pacity. The solar TRES plant mentioned in chapter 5 (fig 5.9) is planned to gen-erate 96 GWh of electricity per year with an investment cost not much higher than in the example below.
Table 6.7 Solar Thermal Plant - 20 MW
Item Value Comment
Capacity 20 MW
Collector Area 130 000 m2
Capital Cost 72.5 Mill USD 3.6 USD/W, includes connection cost to transmission system
O&M Cost 0.8 mill USD per year
Solar insolation 2 200 kWh/m2
Power Production (Useful) 35 GWh/year
Lifetime 25 years
Discount Factor 7.5%
Long Run Marginal Cost 207 USD/MWh
The economic result depends on the lifetime of the plant, which is estimated to 25 year. Assuming a life time of 40 years, and a discount rate of 4% the eco-nomic cost of Solar Thermal Plane is 126 USD/MWh.
6.2.4 Small off-grid solar PV -diesel system, 10 kW The system is configured with one10 kW diesel engine, 2 kW PV and 50 batter-ies with a storage capacity of about 25 kWh. The key figures in the cost calcula-tion are shown below in Table 6.8.
Table 6.8 10 kW off grid solar PV system
Item Value Comment
Capacity 0.01 MW
Capital Cost 32 800 USD
Capital Replacement Cost 1900 USD per year Lifetime varies per item
O&M Cost 4 600 USD per year
Power Production (Useful) 78 MWh year
Lifetime 15 - 25 years Varies by item in the system
Diesel Price 146 Baiza per Litre
Discount Factor 7.5%
Short Run Marginal Cost 127 USD/MWh
Long Run Marginal Cost 245 USD/MWh

Renewable Energy Resources in Oman
Page 101 of 134
.
The Long Run Marginal Costs are estimated to 245 USD/MWh. Approximately 5% of the electricity produced by the system will be solar.
6.2.5 Grid connected 20 MW wind farm Method and Assumptions The following Table 6.9 shows the assumptions regarding the construction costs for a 20 MW wind farm in Oman. It has been assumed that the construction costs are independent of the wind farm site.
Table 6.9 Construction cost of a 20 MW wind farm in Oman
Mill USD USD
Item Unit price Quantity Amount
WIND TURBINE
Wind turbine, 2.0 MW 3.00 10 30.0
Monitoring system 0.20 1 0.2
CIVIL WORKS
Wind turbine foundation 0.15 10 1.5
Access roads (5 km) 0.30 1 0.3
Control room, facilities 0.50 1 0.5
ELECTRCAL WORKS
Main substation 1.00 1 1.0
Feeder 0.05 4 0.2
Transformer 0.30 15 4.5
Distribution net work 0.50 1 0.5
OTHER COSTS
Insurance 0.10 1 0.1
Shipment 0.10 1 0.1
Design, supervision 0.20 1 0.2
TOTAL, 20 MW wind farm 38.6
TOTAL per MW installed 1.9
The lifetime is assumed to be 20 years and the O&M cost 0.5 Mill USD per year. Like for the other plants the used discount rate is 7.5% p.a.

Renewable Energy Resources in Oman
Page 102 of 134
.
Annual energy output The annual energy output depends on the wind resource at the site. The annual energy output of the five selected stations is shown in table 6.10.
Table 6.10 Annual Energy Output 20 MW wind farm by station
Station Wind speed 10 m agl Capacity factor
Annual Energy Output 20 MW wind farm
m/s % MWh/year
Quiroon Hariti 6.2 0.39 67,595
Thumrait 5.8 0.33 58,416
Masirah 5.8 0.35 60,870
Joba 5.2 0.29 50,528
Sur 5.2 0.27 47,387
Production cost Table 6.11 Wind energy - levelised cost per MWh by site
Station USD/MWh USD/MWh USD/MWh USD/MWh
Discount Factor (Base Case) 7.5% 5% 10% 13%
Quiroon Hariti 67.2 56.4 79.0 94.0
Thumrait 73.5 61.7 86.3 102.8
Masirah 70.6 59.3 82.9 98.7
Joba 88.7 77.0 101.3 117.5
Sur 88.5 74.3 103.9 123.8
Wind Energy cost varies according the wind speed at the site. The most efficient production site is Qairoon with average cost of 67.2 USD/MWh, while Joba is the most expensive production site with 88.7 USD/MWh.

Renewable Energy Resources in Oman
Page 103 of 134
.
6.3 Overview of generation costs in Oman Fig. 6.4 shows the relation between the cost of generation for conventional plants, wind turbines at five specific sites, a 20 MW solar thermal plant and the grid connected 20 MW PV plant. The figure also shows the current average cost of 0.31 USD/kWh, excl. RAECO areas. The assumed gas price is 1.5 USD/MMBtu also for new generation capacity.
Fig. 6.4 Overview of generation cost for new capacity in Oman USD/MWh
The figure indicates that Gas Turbines or Combined Cycles plants have the low-est average production cost. However the table also shows that based on the pre-sent costs of solar systems wind power is the most competitive of the renewable energy sources. It has significantly lower cost than CSP and PV power plants.
6.3.1 Impact of Wind Farm on Generation Expansion In OPWP's 7 year statement for 2007-13, Ref /5/ a number of scenarios has been analysed. Common for all scenarios is that the new generation units will be gas turbines and combined cycle units.
The economic effects by replacing a minor part of the planned capacity by wind turbine capacity are illustrated by the following example. It is assumed that 40 MW wind power plant replaces 40 MW gas power plant.
The establishment of 40 MW wind farm will have the following main effects on the Omani power system:
• The electricity generation from the wind farm will reduce electricity gen-eration (GWh) at other plants in the system, and thereby lead to de-creased fuel costs, variable O&M costs, and emissions
• The wind farm will contribute to the installed capacity in the system (MW). Due to wind speed variation the net capacity contribution by wind turbines is less than the installed capacity.
37 31
76
4867 74 71
89 89
207
250
35 28
70
39
GT 140MW
CCGT 400MW
HFO 300MW
COAL 1000MW
Wind (Qairoon)
Wind (Thumrait)
Wind (Masirah)
Wind (Joba)
Wind (Sur) Solar Thermal 20MW
PV 20MW
USD/MWh
5000 hrs
7500 hrs

Renewable Energy Resources in Oman
Page 104 of 134
.
The system effects by a wind farm connected to a power system can be analysed by a system modelling tool (e.g. WASP), which can estimate the effects in the form of substituted electricity (MWh), and in the form of substituted capacity (MW) assuming that the level of security of supply is the same as in the base-case situation. The system effects can also be estimated from the base-case situa-tion by doing some assumptions/considerations on what conventional units that may be substituted. The second approach is used for an evaluation of the system effect of establishing the wind farm in the power system.
Economic effects It is assumed that the 40 MW installed wind power capacity can substitute 40 MW gas turbine capacity. In the calculation it is assumed that a 140 MW GT (natural gas fired) is replaced by a 100 MW GT and a 40 MW Wind Farm erected in the Quiroon and Thumrait areas. It is assumed that the wind farm can be ready for operation in 2011 and one of the 140 MW gas turbines in 2009 will be replaced by a 100 MW gas turbine and 40 MW wind farm.
It is furthermore assumed that the electricity generation from the wind farm sub-stitutes the electricity generation from the planned gas turbine corresponding to the production by 40 MW. By this assumption the annual savings in fuel cost and variable O&M costs can be calculated.
Table 6.12 below shows the net present value of the wind farm costs and the saved costs at conventional plants, assuming that the wind farm substitutes gas turbine capacity both with respect to the capacity and the generation. The costs are calculated for the four different gas prices previously used. Furthermore, the NPV's are calculated, assuming a real discount rate of 7.5% and a lifetime of 25 years for conventional technologies and 20 year for the wind farm.
Table 6.12 Discounted economic net costs of wind farms, million USD, compared to Gas Turbines
Low gas price
Medium gas price,
Gas Opportunity Cost plus deple-tion premium
High Gas price
1.5 USD/MMBtu
3.0 USD/MMBtu
3.0 USD/MMBtu
6.0 USD/MMBtu
Costs of wind farm - capital costs - O&M costs
69 61 8
69 61 8
69 61 8
69 61 8
Saved costs at con-ventional power - saved capital costs - save fuel costs - saved O&M costs
24 8 15 1
39 8
30 1
54 8
45 1
69 8
60 1
Net costs 45 30 15 0
Concerning the wind farm capital costs, it is assumed that half of the investment is made in 2009 and the other half in 2010. In order to assess what requirements it takes for wind power to become completely competitive with natural gas, the break even price for natural gas has been calculated below in Fig. 6.5.

Renewable Energy Resources in Oman
Page 105 of 134
.
Fig. 6.5 Break- even Natural Gas price compared to 40 MW Wind Farm
Fig. 6.5 shows that a gas price of 6 USD/MMBtu balances the net costs of wind energy. The opportunity cost of gas which is assumed to 3 USD/MMBtu with a depletion premium of 3% p.a. returns discount ed net wind farm costs of USD 15 Mill in this case. If a wind farm can be implemented as a CDM project, and the avoided carbon emissions from gas consumption sold, the price obtained for the Certified Emission Reductions (CER) can be calculated based on the shadow price of CER of 25.5 USD/ton. This is considerably higher than current level ob-tained on the European markets which is between 3 - 5 EUR/ton. However, it is expected that the carbon prices will increase when the market becomes more ma-ture and organised over the coming years and a future price of 12 -15 EUR/ton is not considered unlikely.
6.3.2 Small Electricity Generation Fig. 6.6 shows a comparison of the production cost of PV, PV-diesel and diesel generation systems. The cost of diesel generation is based on the current Oman diesel price. It can be seen that the diesel generation has the lowest cost, followed by the PV-Diesel hybrid.
Fig. 6.6 Cost of Small Applications - New Capacity
0
10
20
30
40
50
60
70
80
Gas cost: 1.5$ mmBTu
Gas cost: 3$ mmBTu
Gas cost: 3$ mmBTu + depletion
Gas cost: 6$ mmBTu
$US million NPV of wind
farm costs
NPV of gas cost savings
Net cost of wind farm
425
245
161
PV 0.2 kW Hybrid 0.01 kW New Diesel 1 MW
$US/MWh
Average cost of RAEC Diesel generaiton

Renewable Energy Resources in Oman
Page 106 of 134
.
7 Financing mechanisms 7.1 Revenue by Renewable Energy production The costs of most renewable energy technologies are higher than conventional power generation. This is also the case in Oman, as demonstrated in the previous chapter. The cost difference is however decreasing and will further decrease in the future. Due to this, renewable energy should receive special attention and support in order to find a place in the power production portfolio.
The objective of this section is to introduce commonly used economic incentives tools to introduce and develop renewable energy production. There are a number of models that have been introduced in different countries and in this section the mechanism and the experience with these models are summarised.
Many of these models are designed to work in a liberalised power sector and at-tempts to make use of the market mechanism to select the most efficient technol-ogy and producer of renewable energy. However none of them are perfect in this respect - all of them have their advantages and drawbacks. This chapter will try to identify these.
This section will also make an attempt of relating these models to an Omani con-text where the power sector is unbundled, not liberalised and the network organ-ised in three (nearly) independent supply systems with limited interconnections and limited international interconnection.

Renewable Energy Resources in Oman
Page 107 of 134
.
7.2 Environmental Taxes
7.2.1 External Costs No electricity generation technology exists that is completely devoid of pollution or negative environmental impacts. Energy supply has impacts on the environ-ment, e.g. from emissions of chemical pollutants into air, water and soil both at construction and during operation. Many of these emissions cause accountable damage, such as to human health, natural ecosystems and the built environment. This is termed external effects and is not paid by owners of the energy system, and not passed on to the consumers.
However there is true expenditure involved in these impacts, which has to be paid by those affected. Such costs represent a cost to society that are not paid for by the polluter that causes the emissions. If the polluter does pay adequately for the damage caused, then this is referred to as 'internalisation of external cost'. As long as the external costs are not internalised the market mechanism cannot se-cure an optimal allocation of resources. The prices of goods with high associated external costs, are less than if such costs were internalised, so there is overcon-sumption of these goods, as compared to the optimal consumption for the welfare of the society.
The fossil fuels that represent the largest specific costs are: coal, HFO, diesel oil, and natural gas; of which gas has the lowest environmental costs. Electricity generated from renewable energy has less specific external cost compared to natural gas generation.
The external cost imposed on society differs from country to country, and they must be specifically evaluated in a national context. The following external cost estimates are from industrialised countries and China and provided by the World Bank.
• Average abatement cost in the industrialised countries is 20 USD per tonne CO2
• Abatement cost of SO2 emissions are estimated to 100 USD per tonne
• Abatement cost Particles emissions are estimated to 35 USD per tonne
• NOx emission abatement costs are 240 USD per tonne, but emission is very plant specific and difficult to generalise
7.2.2 Environmental Tax An environmental tax is a tax on electricity production that reflects the environ-mental impact of the various fuels and technologies; it can be imposed on the producers or the purchasers of the electricity. It will in any case have to be brought forward to the end-users, who will pay the tax at the end of the day.
Based on emission factors for the various fuels a levy corresponding to the abatement cost per unit of fuel is imposed.

Renewable Energy Resources in Oman
Page 108 of 134
.
Adding the levy will improve the competitive position of the renewable energy sources in the market place. Environmental Tax makes the 'shadow price' of competing energy sources visible for the users and thereby provides incentives to optimise the energy consumption fuel mix.
Environmental taxes are currently in use in many European countries, including Denmark, Netherlands, Germany, Sweden and Norway.
Environmental taxes are a meaningful way to level the playing field in the elec-tricity markets, but they are (politically) difficult to agree on the level (abatement costs are difficult to estimate) and often they, over time, provide a fiscal revenue for the Government and can be difficult to change, as the abatement cost changes due to technological changes.
7.2.3 Application in Oman Oman could apply an environmental tax related to abatement cost on electricity production based on the emissions of CO2, SO2, NOx, and particulates, either at the production level (Generating facilities) or at the purchase level (OPWP). In both cases it would - ceteris paribus - increase the producer's and/or the pur-chaser's incentive to produce more renewable energy or purchase more renew-able energy, due the reduced cost difference between natural gas based produc-tion and renewable energy production.
Auto-generators would also get incentives to include renewable energy in their production, like other end-users would get an incentive to apply small solar ap-plication and purchase less electricity from the Distribution Companies.
However, it would require that cost of the environmental tax could be passed on to the end-users. In the present set-up, the Permitted Tariff is determined without taking the cost basis into consideration, this will not happen. As long as the Permitted Tariff is applied without consideration of the actual cost of electricity production, it will not be possible to apply an environmental tax efficiently.

Renewable Energy Resources in Oman
Page 109 of 134
.
7.3 Tax Credits Tax credits are preferential taxations schemes for investments in renewable en-ergy or renewable energy production facilities. They are aimed at providing in-centives for investments, normally by lowering taxation in the first years after the investment either in the form of deductions in taxable income and/or accelerated depreciation schemes. In many countries the VAT is also lower than the general level.
The mechanism is basically the same as a direct subsidy to the renewable energy producers. Whether an incentive is a credit or a cash payment makes no differ-ence from the investor perspective. However, politically it can be important whether an incentive is paid by the consumer as a levy or by the taxpayer within the general taxation.
The schemes are parallel to the tax credits provided in a number of countries to foreign investors in order to attract foreign investments.
Tax credits are very common world wide. Examples of countries using credits are: Netherlands, Portugal, US, Greece, Spain, Ireland and Germany. Examples of tax credit schemes in the EU are presented in Appendix 11. The schemes typi-cally comprise a maximum reduction in the taxable income, either of the income earned from investments or fractions of the investment made in renewable en-ergy production. The schemes are typically effective during the first years after investment.
The United States also have a very comprehensive tax credit system, the so-called federal Production Tax Credit (PTC), which currently have a value of ap-proximately 2 USc per kWh produced.
Tax credits provides incentives for investment, but also have the general disad-vantages that they distort competition and pricing and they can end being pro-vided to investments that would has taken place anyway.
7.3.1 Application in Oman Oman does not have tax credit schemes in the energy sector today. It is a meas-ure that Oman could pursue in order to attract investments in renewable energy facilities. Tax incentives for wind energy producers could close the current gap between wind energy production cost and gas turbines that will be the choices in the future expansion of electricity production in Oman and if applied also for production of renewable energy equipment, it would also support development of a local industry.
The exact design must be adapted to the current company and tax regulations. Financing of the credits is provided by the Government.

Renewable Energy Resources in Oman
Page 110 of 134
.
7.4 Green Marketing Green Marketing is based on the assumption that consumers Willingness to Pay (WTP) is higher for environmentally friendly produced electricity than tradition-ally produced. Therefore green energy can obtain a premium price at the market, even if the product is identical to the consumer in all other respects. In combina-tion with other measures - green electricity - has proved to be a success espe-cially in the Netherlands, where the first and most comprehensive schemes have been implemented. Ireland is another example of a successful Green Marketing scheme.
Currently Green electricity is also marketed in Denmark and Germany at a sur-charge.
Green marketing requires a concerted marketing effort to promote the products, either from power companies or from specialised authorities. Surveys in Europe confirm that there is a market for green electricity, i.e. some consumers are will-ing to pay the surcharge, in Europe, it is - however- limited in size. Surveys in Denmark show that nearly 60% of the population is willing to pay 5-10% more for documented green electricity. Surveys and experience in the US show similar results. However, actually only 0.5% of the customers having access actually purchased this product in Denmark. There seems to be a large discrepancy be-tween attitude and actual demand of these products.
The 'sustainability' of the production method is documented through certificates of origin.
The disadvantage with Green Marketing is seen from a resource allocation point of view, suggesting that green energy that would have been produced anyway can obtain the premium price. One example of this is hydropower produced in Norway and Sweden at very low cost, way below thermal and nuclear produc-tion, has been put on the market as green electricity and sold at a surcharge. This production would have taken place anyway and the surcharge does not reflect increased production cost. Similar experiences have been obtained in the Nether-lands with wind energy production replacing traditional electricity production on cost terms in some instances.
The consumer WTP is also uncertain and unstable over time. Whether green marketing has proven to be a successful concept in US and Europe is very diffi-cult to say, because they are often backed by a politically determined framework for investment in renewable energy.
7.4.1 Application in Oman Green marketing of electricity probably requires a mature market for sustainable products and standard of living in order to generate any impact of magnitude and can probably not stand alone. Therefore green marketing is not recommended as the first measure that should be taken to increase use of renewable energy re-sources in Oman.

Renewable Energy Resources in Oman
Page 111 of 134
.
7.5 Investment Subsidies Investment subsidies are very often used as an incentive to investors in renew-able energy production. We will here use wind energy as an example, but in-vestment subsidies can be applied to all types of renewable energy production.
Investment subsidies directly to producers are normally based on the rated power production capacity (in kW) of the wind farm. The subsidy decreases cost and makes the investment more feasible. An investor in a wind farm will automati-cally receive a subsidy corresponding to capacity established. The power pro-duced is sold directly to suppliers or directly to the customer at the commercial rate.
They have been widely used in India and Great Britain, but have been abandoned as the only means in an incentive system. In Great Britain it is still in use in combination with other incentives. The reason for abandoning the investment subsidies is because it encourages the establishment of less efficient wind tur-bines. The experience with investment subsidies in Great Britain and India was that they resulted in:
• poor siting, less efficient sites were used;
• disproportionately large generators. These large generators improved project viability but produced less kWh than could have been obtained from an optimal generator size;
• they attracted manufactures with dubious products;
These experiences have lead to the general understanding that efficient produc-tion depends on a number of factors and that efficient provision of subsidies should be related to the production (kWh) rather than rated capacity. At least for wind energy the trend is to reject investment subsidies as the only incentive, be-cause it is considered economically inefficient.
In combination with feed-in-tariffs it is still in used in Great Britain, but now only for off-shore wind mills. The British government offers investment subsi-dies to off-shore wind farm only as a (small) supplement to the renewable energy quota system that is in place.
7.5.1 Application in Oman Investment subsidies could be applied in Oman, the source of the subsidy could be the Government already providing subsidies to the power sector through the DC's in MIS and to RAECO. Taking the current set-up at least in the MIS into consideration, investment subsidies would open a new subsidy stream to the sec-tor at least in MIS. This subsidy flow should either be directed to the investors in generation capacity, the IPP's, or through OPWP.

Renewable Energy Resources in Oman
Page 112 of 134
.
7.6 Fixed Prices - Feed in Tariffs FIT are fixed and guaranteed prices for energy sales from renewable sources. The prices are fixed by legislation. This system is widespread in Europe. The extra cost of this mechanism - the difference between the feed-in-tariff and the market price - is borne by Government (taxpayers) or the electricity consumers.
Currently FIT is used in Denmark, Austria, France, Greece, Spain, Luxembourg, Portugal and other countries. FIT is the preferred means of the EU Commission in its new plan to increase renewable energy consumption and reduce carbon emissions in the coming years.
The precise mechanism depends, in some cases the FIT is a fixed premium over the current market price, and the total price obtained by the producers varies. In other cases it is the total price per kWh supplied that is fixed. Fig. 7.1 below shows some examples of the FIT for wind energy in EU countries.
Fig. 7.1 Examples of Feed in Tariffs for Onshore Wind Plants
Source: Wind Energy – The Facts: Volume 5 Market Developments
FIT optimal level defined as the level that will attract the production that is de-fined politically or from power system considerations. Due to technology changes this FIT is highly dynamic and needs to be monitored and adjusted con-tinuously in order not to over subsidise or attract excessive production.
FIT is simple as there are no Power Purchase Agreements to be concluded and no possibility of defaulting counterparts. There are however political risks for the investors by way of lowering or removing the FIT.
Feed in Tariffs (2003) for Onshore Wind Plants (Baiza/kWh at 2003 Euro-Rial Exchange Rate)
0 5 10 15 20 25 30 35 40 45
Austria (new plant)
Denmark
France
Germany
Greece
Luxembourg (premium)
netherlands
Portugal
Spain (fixed price)
Spain (premium)
Baiza/kWh

Renewable Energy Resources in Oman
Page 113 of 134
.
7.6.1 Application in Oman Application of an FIT in Oman could be an option. The FIT should compensate the renewable energy generator for the additional cost he has. The tariff could be paid either directly to the producers or to the purchaser OPWP. It will require that the renewable energy production capacity established is given priority.

Renewable Energy Resources in Oman
Page 114 of 134
.
7.7 Renewable Quotas - Portfolio Standards In fixed quantity systems or 'Obligated Renewable Quota' system - in US Re-newable Portfolio Standards', the government sets a quota for the amount of re-newable energy that should be produced or traded. It is then up to the market to determine the price. Where the Government under FIT determines the price and the markets subsequently determine the produced quantities, it is the opposite under the Quota system: quantities are fixed and the market determines the price.
Two types of mechanisms have been used to control the uptake of capacity to meet the aims of the renewable quota systems: Tendering and Green Certificates
7.7.1 Tendering Tendering or competitive bidding is used to promote renewable energy in Ire-land, France and was previously used in Great Britain. Authorities tender renew-able energy capacity according to the quota it has been politically decided to pur-sue.
Developers submit their project proposals with a wholesale price for electricity for a given period. The companies that bid to supply electricity at the lowest price win contracts to do so and can start construction and production. Usually 15-20 years power purchase agreements are entered into. The difference between the contracted price and the wholesale price of conventional power is paid to the developers/owners from a levy, which represents the additional cost of producing green electricity.
In Great Britain, the system was abandoned because of some drawbacks: Con-tract winner in some cases delayed their projects considerably in order to apply new and cheaper technology or the winning projects did not materialise at all. In other cases the system resulted in very bad siting in terms of environment, espe-cially of wind farms. The targets for renewable energy production were therefore no met.
7.7.2 Tradable Green Certificates (TGC) TGC is a mechanism that in some ways resembles the tendering system. As in the tendering system a target for the share of renewable energy to be produced is politically formulated and the corresponding amount of TGC's is issued by the authorities.
The main difference compared to the tendering system is that the price of power and TGC's are settled on a daily basis on the electricity market and on a separate market for tradable certificates, while tendering is based on long-term PPA's. With daily setting of the prices it is more risky for the investor than tendering, as the selling price will be volatile.
A tradable green certificate market working effectively will reflect the difference between market cost of electricity and the generating cost of new renewable pro-duction facilities. The value of the certificate represents the additional costs of producing renewable electricity compared to conventional sources.

Renewable Energy Resources in Oman
Page 115 of 134
.
The TGC market works as follows:
1 The Government sets a specific gradually increasing quantity for the amount of renewable energy in the supply portfolio.
2 An obligation to hold certificates is placed on either the electricity suppliers or the end-users of electricity.
3 The generators, wholesalers, retailers or consumers are obliged to consume a certain percentage of electricity from renewable energy sources.
4 At the settlement date, the operators have to submit the required number of certificates to demonstrate compliance.
Certificates can be obtained the following ways:
• from production of renewable energy at his own plants;
• purchasing certificates from other renewable energy producers;
• purchasing from other actors in the market with an obligation to hold cer-tificates.
The gradually increasing obligation creates a demand for TGCs. It is left to the market to deliver the supply of certificates. TGC's are issued to producers of re-newable electricity in proportion to the volume of green electricity they generate. A TGC serves as evidence that a specific amount of green power has been pro-duced and fed into the grid. The equilibrium price of the TGC corresponds to the level that satisfies investors return requirements and new capacity will be in-stalled to meet the quota. There are a number of different certificate models.
The complexity of the TGC models gives it some problems for renewable gen-eration owners and the fact that the market is not perfect also provides some challenges for the operators. The main deficiency being that it is only the most efficient technologies that are promoted, i.e. there is a barrier for emerging tech-nologies with higher cost to enter the market.
7.7.3 Application A renewable energy quota model could be applied in Oman, based on the tender-ing system. The political system defines the renewable energy targets and in the MIS the OPWP has an obligation to ensure that the quota is purchased for re-newable energy purchased is fulfilled either by the existing generator supple-menting their existing facilities with renewable energy or establishment of IPP's using renewable energy. The additional cost OPWP pays for the renewable en-ergy will be passed on the DC's and through the existing subsidy mechanism based on the Permitted Tariff be refunded by the Government. This would be a very simple mechanism that could fit into the existing system.

Renewable Energy Resources in Oman
Page 116 of 134
.
7.8 Evaluation of the various schemes A comparison and evaluation of the various schemes in relation to renewable en-ergy is summarised in Table 7.1. It lists the general advantages and disadvan-tages of the various models. It also summarises the discussion of each measure in relation to application in Oman.
Table 7.1 Overview of Renewable Energy subsidy measures
Instrument PROs CONs Suitable for Oman?
Environmental Taxes
Creates even playing field for renewable energy
Difficult to esti-mate objectively the optimum level of tax.
Tax would increase supply costs and sub-sidy but not induce change in consumer consumption.
Limited Applicability
Tax Credits Creates incentives for investors
May distort market prices
Applicable
Green Marketing Based on willingness to pay (WTP) and optional schemes
Difficult to control and limited information on con-sumer WTP
Probably very little impact in Oman.
Limited Applicability
Investment subsi-dies
Increase incentives to establish and invest in renewable energy generation
May result in over-investment
May create new subsidy flow in the system to investors.
Applicable
Feed in Tariffs Efficient in promoting RE if monitored carefully and changed in accordance with technological developments
Investor risk if re-moved for political reasons
Applicable
Renewable En-ergy Quotas
Effective way to promote renewable energy projects
New tendering procedures required but simple to ad-minister.
Tends to promote established tech-nologies
Easily accommodated in OPWP and RAEC tendering systems.
Applicable

Renewable Energy Resources in Oman
Page 117 of 134
.
7.9 Model suitable for Oman In this section a proposed suitable financial mechanism for Oman is described.
Secondly the required support of different forms of renewable energy (wind and solar) in terms of the cost is estimated.
7.9.1 Large Applications In Oman electricity usage is subsidised at the end-user level. Licensed suppliers receive subsidy from the Government corresponding to the difference between their actual costs and revenue generated from Permitted Tariffs. In other words the end-user tariffs do not reflect actual electricity production costs, but have been set at levels to achieve political objectives. Oman already uses a payment mechanism to disperse subsidies, which can be exploited in promoting renewable energy, if there is political support to a more sustainable development.
Generation, transmission, supply and distribution are at least in MIS unbundled. Generation is already privatised and the production purchased from IPP's. New capacity is tendered directly by OPWP, when required.
In MIS, a model for application of larger wind and solar system that are feeding the transmission grid could provide OPWP with the obligation to purchase cer-tain amounts, or to establish certain capacities for demand of renewable energy.
The purchase process should be the competitive international tendering of a wind farm or alternatively a renewable energy capacity/production of a certain size, where the bidders decide the technology and the OPWP select the tender with the lowest cost per unit. Not much different from the current process for purchase of new capacity.
OPWP purchases the production at the full cost from the successful bidder on terms defined in a PPA. The additional cost of renewable energy will be passed on to licensed suppliers, who would receive subsidy corresponding to the differ-ence between their Maximum Allowed Revenue and Permitted Tariff revenue. All elements in the current regulation can be maintained under this framework, as shown in Figure 7.2, where renewable energy production facilities are added to the existing model.
A similar model can be applied in Salalah, it will, however, require a revision of the concession agreement with DPC. When the concession agreement terminates, it is expected that the Salalah system will be regulated under the same model as MIS, and a similar model can be implemented.

Renewable Energy Resources in Oman
Page 118 of 134
.
Fig. 7.2 Sector overview, including renewable energy facilities, MIS
Other measures that could be used by the Government of Oman to reduce the cost for renewable energy installation are:
• Long Term power purchase agreement, including priority to renewable energy production;
• Free provision of land for wind farms and solar applications;
• Grid connection free of charge;
• Preferential loans for investments from Oman Development Bank;
• Exemptions of local taxes, customs and import duties for a period.
7.9.2 RAECO - Rural Areas RAECO is a fully integrated vertically integrated company covering generation, transmission and distribution. The production and consumption in RAECO is small compared to the other areas. The cost of supplying the rural areas is very high with large variations. There is probably room for inclusion of small scale renewable energy at some of the locations. Experience shows, however, that there is also a need for a mechanism ensuring efficient operations in general and also of possible renewable energy sources.
Given its cost structure, RAECO should be motivated to identify opportunities to substitute or combine diesel generation with solar applications. It must be ex-pected that there are systems/locations where it is viable with current cost levels to use hybrid applications instead of diesel generation. The cost level in some of the system indicates that there might be economic benefits from using PV or hy-brid applications in this system and it should be considered using stand alone so-lar systems to supply the most remote customers instead of extending grid struc-tures.

Renewable Energy Resources in Oman
Page 119 of 134
.
It is concluded that a financial mechanism is not required in RAECO as there seems to be economicaly viable opportunities to utilises renewable energy with-out subsidization. It is recommended to initiate a process that identifies the sys-tems with highest cost and investigate the reasons why. It is also recommended that RAECO introduce a standard procedure when designing new systems and purchasing new capacity to make a comparison between diesel and a hybrid sys-tem to ensure that the consideration it always done.
7.10 Level of Subsidy Required In order to asses the cost of exploiting the renewable resources in Oman with to-day cost structures, this section combine the resource assessment from Chapter 5 with the cost evaluation in Chapter 6.
The methodology is to compare the LRMC of the cheapest power generation technology, i.e. natural gas fuelled GT, with the LRMC of wind power and solar thermal. The cost difference is the required subsidy per MWh, which must be provided to the system in order to attract investments. In Table 7.2 this calcula-tion has been made depending on the gas price and with a discount factor of 7.5% p.a. The table shows the subsidy required to equalise the return for an in-vestor in a gas turbine and in a 20 MW wind farm, respectively.
Table 7.2 Subsidy scenario for wind power
Natural Gas Price
USD/MMBtu
Generation Cost per MWh
Gas Turbine USD
Generation Cost per MWh
Wind Power USD
Difference Subsidy per
MWh USD
Annual subsidy required to sup-
port 750 MW
Mill USD
1.5 28 67 39 90
3.0 43 67 24 55
3.0 with depletion
premium
56 67 11 25
6 .0 73 67 -6 -14
Total costs are sensitive to actual installed capacity. It is assumed that 750 MW of wind power capacity could be established with an annual production of 2300 GWh. The annual subsidy to support this capacity is shown in the right hand col-umn. It varies between USD 25 Mill and USD 90 Mill depending on the natural gas price, used in the calculation. If the natural gas price is above 6 USD per MMBtu, electricity based on gas is more expensive than the proposed wind en-ergy scenario.

Renewable Energy Resources in Oman
Page 120 of 134
.
Table 7.3 below shows the similar calculation for Solar Thermal Power (CSP).
Table 7.3 Subsidy scenario for Solar Thermal Power
Natural Gas Price USD/MMBtu
Generation Cost per MWh Gas Turbine USD
Generation Cost per MWh Solar USD
Difference Subsidy per MWh USD
Annual subsidy required to support 1450 MW Mill USD
1.5 28 207 179 453
3.0 43 207 164 415
3.0 with depletion premium
56 207 151 382
6.0 73 207 134 339
Total costs are sensitive to actual installed capacity. It is assumed that 1450 MW of solar thermal power capacity can be established with an annual production of 2,530 GWh. The annual subsidy to support this capacity is shown in the right hand column. It varies between USD 339 Mill and USD 453 Mill per year de-pending on the natural gas price.
In comparison the annual subsidy to MIS licensed suppliers in 2006 was around USD 250 Mill. This subsidy is the difference between the economic cost of the companies and Permitted Tariff Revenue.

Renewable Energy Resources in Oman
Page 121 of 134
.
8 Market for renewable energy in Oman 8.1 Barriers Developers of renewable energy projects face a number of barriers. These con-cern several factors, some of which relate to the underlying technology and asso-ciated cost structures others relate to the structure of the power market where their outputs is sold.
The barriers include among others:
• Cost competitiveness and cost structures
• Intermittency
• Scale
• Legal Framework
For each of these potential barriers the key issues are identified and commented in the following section.
8.1.1 Cost competitiveness Cost competitiveness is a barrier for widespread use of renewable energy in Oman. It has been demonstrated in the previous section, that all the renewable energy technologies analysed have higher cost than conventional power produc-tion in Oman with prevailing prices of natural gas of 1.5 USD/MMBtu.
In the following paragraphs the cost competitiveness is analysed at two levels: production and end-user level.
Cost at generation level Currently conventional generators are provided with gas at a low price from the Ministry of Oil and Gas. The price is low in economic terms, because it does not include all the external cost of production of power based on gas, i.e. the cost of emissions, as previously explained. The revenue is also lower than the alternative revenue that could be obtained from export of the gas. The spot LNG price is and has been much higher than the 1.5 USD/MMBtu for a long time and represents higher revenue for the society, which should be taken into consideration when comparing cost of conventional production and renewable production.

Renewable Energy Resources in Oman
Page 122 of 134
.
In practical terms the natural gas provision price for the power plants is deter-mined in long term contracts. However through indexation of the price it is pos-sible to transfer to the international LNG price to the natural gas contracts. The economic price is somewhere between the production costs in Oman and the spot LNG price. As mentioned earlier a gas price 3 USD/MMBtu with 3% annual es-calation, would make wind power competitive provided carbon emission reduc-tions can be sold at 25 USD/ton.
Using a price of natural gas, reflecting the cost of economic use of the gas, would increase the room for renewable energy in the planning of new power produc-tion. It might also provide current producer with incentives to consider renewable energy as a supplement in the production operations with a cost reducing impact.
The changes in cost of energy production are in a well functioning market, trans-ferred to the end-users thus impacting their behaviour in terms of energy use. However, in Oman this mechanism is not operating because the Permitted Tariff currently is settled below cost.
Price at End-user level End-user electricity tariffs are settled in a political process and are below the economic cost of power as an average, due to the subsidy provided to the distri-bution companies. From economic theory it is well known that the consequences are: consumption of energy is not efficient, over investments in production ca-pacity/depletion of the natural gas resources quicker than optimal for the society. In the longer term this will lead to the requirement import of natural gas / oil, at market costs and a lower security of supply.
It is also directly a barrier to the introduction of renewable energy applications at the end user level. Introduction of renewable energy applications in an industry or in a household are costly and require investments. The return of investing in e.g. a solar application will be lower and the payback time will be longer if elec-tricity is priced below its real cost. This will therefore have an adverse impact on investment in production and installation of renewable energy in the country. Cost reflective end-user prices are necessary to encourage the end-users to make the decision regarding energy use and invest in renewable energy applications.
The Authority is presently recommending an introduction of Cost Reflective end-user tariffs. Steps in this direction, would also assist in removing an important barrier for renewable energy and other improvements in the use of energy.
Possible increases of the power tariff should must take place gradually in order to mitigate the impacts on the poorest household.
8.1.2 Scale Conventional power plants can be very large - thousand of MW in size. Renew-able generators are much smaller in size. The smaller size of renewable energy technologies has advantages and disadvantages.
The principal disadvantage is that the cost of participating in the market (transac-tion costs) are high per unit produced. This accounts for the whole project cycle.

Renewable Energy Resources in Oman
Page 123 of 134
.
A number of cost items in the project cycle are to some extent independent of the size of the project: investigations, pre-feasibility studies, feasibility studies, siting considerations, land purchase, detailed design, creating access to the site plant, establishing connection to the grid, insurances, negotiating of power sales agreements, obtaining licenses and permits and the tendering process. This cost can't be avoided and in some countries special programmes with support meas-ures are established to assist investors overcoming this barrier.
Further during operation, unless a developer of renewable energy project has a diversified portfolio of generators, renewable energy operators are unable to net off imbalances with the company. For instance when operating a wind farm sup-plying the grid, the transmission company - or organisation responsible for bal-ancing the system - can obtain difficulties in ensuring the balance because of the volatility of the wind farm production. For the system operator, this might result in additional purchase or cancellation of already purchased power, which means additional costs that in principle are transferrable to the wind energy producer. These situations are less costly to handle if you operate a diversified portfolio of facilities. There needs to be a set of market regulations that the markets access for renewable energy producers, before investors will consider investing.
In more mature renewable energy set-up special services and facilities have been developed to deal with these issues. In Oman, where renewable energy is emerg-ing these programmes and rules have to be defined before a development on a commercial scale can be expected.
8.1.3 Power Sector Set-up and Legal Framework The present legal framework for the power sector is formulated in the Law for the Regulation and Privatisation of the Electricity and Related Water Sector and described in Section 4.3 of this report.
The legislation lack formal arrangements and statuary mechanisms to accommo-date renewable energy or facilitate its introduction, some examples are discussed below. These examples do not mean that isolated renewable energy project can-not be undertaken, but should be seen as barriers for the broader market to take off. In the energy legislation in most countries, you will find specific regulations regarding inclusion of renewable in the power supply in order to have a basis for the practical arrangements and in order to support the process.
The lack of a strong interconnection, between MIS, RAECO and Salalah makes introduction of renewable energy less economic than in an interconnected sys-tem. The intermittency of say wind energy adds system imbalances easier to cope with in a system with strong interconnections and of some size. Wind resources are located mainly in the Southern part of Oman, but the Northern part of the country cannot benefit from wind energy production from the South in situation of overproduction. This goes of course for all production resources, but is espe-cially important with a volatile resource such as wind.
The current legislation stipulates that the DC's in MIS must purchase all their power from OPWP. They are not allowed to establish their own 'embedded' pro-duction facilities - local power generation inside their own distribution areas - based on for instance small scale renewable resources, if found to be cost effec-tive compared to purchase from OPWP.

Renewable Energy Resources in Oman
Page 124 of 134
.
A parallel issue is generation at the end-user, for instance an industry, which de-cides to establish renewable auto-generation and might have capacity to export to the grid during some parts of the day. This industry cannot sell the surplus pro-duction to the local DC or to OPWP under the current legislation. There is no mechanism defined in the legislation to make the transaction and no tariff/price regulation defined for such a transaction. In many countries there exist an estab-lished buy-back system (net-banking), where auto-generators buy and sell at the (same) prevailing price/tariff, instead of buying at the prevailing tariff and selling at a much lower rate. This mechanism has been effective in supporting small scale local renewable energy production.
Finally, the usage of the permitted tariff - where it is below economic cost - is discouraging end-users to use solar applications and similar, as supplement to their purchases from the grid, because the pay back time of the investment be-comes too long, as previously mentioned.

Renewable Energy Resources in Oman
Page 125 of 134
.
8.2 Renewable energy industry, Market players A few companies in Oman working with renewable energy (solar) related activi-ties have been identified. Their characteristics are:
Growth International LLC
Business type: manufacturer, retail sales, wholesale supplier, importer Product types: solar street lighting, photovoltaic modules, solar traffic
lighting systems, solar water pumping systems, photovoltaic systems. Service types: consulting, design, installation, construction, engineering,
education and training services, maintenance and repair services
Oman Solar Systems Co. LLC
Business type: Projects and Retail sales Product types: Solar Photovoltaic Power Systems for Oil & Gas and
Telecom Applications, Solar PV Industrial Systems, Solar-Wind Hybrid Systems, Solar Grid connected Systems, Total Renewable Energy Solu-tions, Solar Water Heating Systems, Solar Home Systems, Passive Cooled Enclosures, UPS, Rectifier Systems, Voltage Stabilisers etc.
Service types: design, installation and commissioning
OMASY Co., LTD
Business type: retail sales, wholesale supplier, importer Product types: solar electric power systems, solar water pumping sys-
tems, wind energy systems (small), solar water heating systems, photo-voltaic systems, solar outdoor lighting systems.
Service types: consulting, design, installation, construction, engineering, research services, site survey and assessment services, contractor ser-vices, maintenance and repair services, recycling services

Renewable Energy Resources in Oman
Page 126 of 134
.
8.3 Awareness Presently solar energy is used for water heating purposes in households and for power supply of remote located equipment, primarily within the oil and gas in-dustry. The awareness of other types of renewable energy resources is limited in Oman and large scale utilisation of renewable energy resources has not yet been considered as a serious supplement to the use of conventional energy resources.
Research and development activities related to utilisation of renewable energy are carried out at the Sultan Qaboos University in Muscat. However the alloca-tion of financial resources for these activities is limited.
Several initiatives can be implemented in order to increase the awareness of re-newable energy:
• implementation of demonstration projects for testing of the most promis-ing renewable energy technologies for Oman
• increase the R&D activities related to renewable energy utilisation
• integration of renewable energy systems (primarily solar PV) in public buildings where the technology can be presented for many people (i.e. power supply at public buildings and for lighting)
• education of renewable energy in the schools
The awareness by decision makers and the public regarding the potential of re-newable energy resources in Oman is important for the development of the utili-sation of these domestic energy resources.
Renewable Energy Resources in Oman
Page 127 of 134
.
9 Renewable energy pilot projects 9.1 Criteria for recommendation of pilot projects The technologies for utilisation of solar and wind energy resources for electricity generation are commercially available and have demonstrated technical reliabil-ity in many countries.
In order to demonstrate the technical and economical performance of renewable energy plants in Oman it is recommended to establish a number of pilot projects. One or several of the following types of projects are recommended as pilot pro-jects.
The criteria for selection of the recommended type pilot projects include:
• demand for the type of project is expected in the future
• the type of project is expected to be economically viable in the future as-suming high conventional fuel prices in the future
• the project shall contribute to the awareness of renewable energy in Oman
• the project shall be based on well proven and reliable technology
9.2 Solar pilot projects Two types of solar energy systems are recommended as pilot projects. A 20 kW system for installation on a building in an urban environment and a 10 kW solar PV / diesel hybrid system.
9.2.1 PV pilot project, grid connected 20 kWp system Outline design and technology The 20 kW system consists of the following components:
• 20 kWp solar PV panels (approximately 200 m2 conventional panels) mounted in an urban environment.
• A 20 kW power converter to convert the DC from the panels to AC voltage for the grid.
• A connection to the grid including a power meter.

Renewable Energy Resources in Oman
Page 128 of 134
.
Budget The following budget represents the market cost for the technology and does not include design, project management, monitoring, evaluation, reporting and cam-paigning etc. which should be a part of a pilot project.
Break down of construction costs:
Component Initial Capital USD
PV Array including mounting 136,000
Converter and connections 14,000
Totals 150,000
Action plan Realisation of the pilot project will have the following steps:
• Prepare a total budget including project expenses for the following steps. • Ensure financing. • Project planning • Identification of host for project • Design of installations • Procurement, installation, commissioning and testing • Monitoring of results • Evaluation, reporting and presentation of results and conclusions. For the pilot project the monitoring could incorporate hourly data collection which could be utilized by researchers and for demonstration. A display with in-dication of production could also be included.
9.2.2 10 kW stand alone system Location The capacity corresponds to the capacity need of a small off grid settlement with few houses, perhaps with small service function, restaurant, shop or gasoline sta-tion.
This type of energy supply is typically made by diesel engines. This will be compared with alternative supply with hybrid systems including solar energy, diesel and battery storage.
At a first phase it is suggested to make a pilot project including two different concepts.
Concept 1 - One system with 10 kW solar PV, 10 kW diesel and battery storage.
Concept 2 - One system with 5 kW solar PV, 10 kW diesel and without battery.
The second one can not give a 100 percent cover of the demand as defined above. There will be periods with low level in batteries where people will have to make priorities, for example reduce the air conditioning in order to have power for lighting and cooking.

Renewable Energy Resources in Oman
Page 129 of 134
.
Break down of construction costs:
Concept 1
Component Initial Capital USD
PV Array including mounting 68,000
Generator 7,800
Battery 8,000
Converter and connections 7,000
Totals 90,800
Concept 2
Component Initial Capital USD
PV Array including mounting 34,000
Generator 7,800
Converter and connections 3,500
Totals 45,300

Renewable Energy Resources in Oman
Page 130 of 134
.
9.3 Wind Power Project It is recommended to implement a small pilot wind farm project in order to give demonstration the performance of the modern wind turbine technology under Omani conditions and to evaluate the interaction between the turbines and the grid.
Technology The wind farm should consist of five 2 MW wind turbines with hub height of approximately 80 m and rotor diameter of 90 m.
Wind turbine specifications:
Description Unit
WT Capacity MW 2.0
Tower height m 80 - 85
Rotor diameter m 90
Generator Asynchronous
Type of power regulation pitch
Rated generator voltage Volt 690
Wind farm specifications:
Description Unit
Plant Capacity MW 10
Number of Wind Turbines 5
Layout wind farm Micro siting
Wake losses % 2 -5 %
Life time Years 20
The wind farm should be connected to the high voltage grid system in Dhofar. The total power capacity of the Salalah system is 350 MW. The 10 MW wind farm capacity will be 3 % of the total power capacity in the Salalah power sys-tem.

Renewable Energy Resources in Oman
Page 131 of 134
.
Location The project should be implemented in the Thumrait/Quiroon Hariti area where the highest wind energy potential in Oman is observed. Exact locations of the individual turbines should be made based on detailed micro siting.
The landscape in this area is suitable for erection of wind turbines. There are no vegetation or obstacles.
Fig. 9.1 Representative landscape in the Quiroon Hariti area

Renewable Energy Resources in Oman
Page 132 of 134
.
Budget Based on the present market price the cost per MW installed capacity for on shore wind farms is in the order of 2 mill USD. For the proposed pilot project the total construction cost will be USD 20 - 22 mill.
Break down of the construction costs:
Mill USD USD
Item Unit price Quantity Amount
WIND TURBINE
Wind turbine, 2.0 MW 3.00 5 15.0
Monitoring system 0.20 1 0.2
CIVIL WORKS
Wind turbine foundation 0.15 5 0.65
Access roads (5 km) 0.30 1 0.3
Control room, facilities 0.50 1 0.5
ELECTRCAL WORKS
Main substation 1.00 1 1.0
Feeder 0.05 2 0.1
Transformer 0.30 5 1.5
Distribution net work 0.50 1 0.5
OTHER COSTS
Insurance 0.10 1 0.1
Shipment 0.10 1 0.1
Design, supervision 0.20 1 0.2
TOTAL, 10 MW wind farm 20.2
TOTAL per MW installed 2.0

Renewable Energy Resources in Oman
Page 133 of 134
.
Action plan The following activities should be made for implementation of the project: Planning phase
• Set up project organisation • Power purchase agreement • Determine financing sources
Design
• Detailed wind analysis for the area, including possible wind measure-ments
• Site selection based on land and grid availability • Micrositing of the wind turbines for optimum location • Conceptual design of the wind farm • Design of power system on site • Design grid connection, incl. transform and sub station • Design civil works (roads, facility buiildings)
Implementation
• Tendering • Supervision • testing
Operation
• training of operation and maintenance staff • performance monitoring

Renewable Energy Resources in Oman
Page 134 of 134
.
REFERENCES Ref. no.
Title
/1/ Ministry of National Economy, 2006
/2/ Ministry of National Economy, Socio-Economic Atlas, September 2006
/3/ Authority for Electricity Regulation, Annual Report 2006
/4/ Oman Electricity Transmission Corporation, Annual Report 2006
/5/ Oman Power and Water procurement, Seven Years Statement, 2007-2013
/6/ Ministry of National Economy, Statistical Yearbook, October 2006
/7/ Directorate General of Civil Aviation & Meteorology, Dept. of Meteorology, Annual Climate Summary 2005
/8/ "Typical Solar Radiation Data for Oman", H.A. Al-Hinai og S. M. Al-Alawi, Department of Mechanical Engineering, Sultan Qaboos University. Published in Ap-plied Energy 52, (1995), page 153-163.
/9/ Oman Wastewater Service Company. Letter dated 03 November 2007, Ref.no.OWSC/PE/SA/014/2007
/10/ Ministry of Agriculture, Yearbook 2006
/11/ European Directory of Renewable Energy, 1991
/12/ "The role of Hydrogeology in Petroleum Development Oman" by Al Lamki, M. and Terken, Jos, GeoArabia, Vol.I, no.4, 1996
/13/ Ministry of Oil & Gas, letter dated 13 February 2008, Ref. 478
/14/ Global Wind Energy Council, 15 Februiary 2007
/15/ "Concentrating Solar Power, From Research to Implementation", European Com-mission, 2007.
/16/ From Volker Quaschning, VGB Congress Power Plants 2001 · Brussels · October 2001
/17/ "THE FUTURE OF THIN FILM SOLAR CELLS", Martin A. Green, ARC Photo-voltaic Centre of Excellence, University of New South Wales, Sydney Australia 2052
/18/ "INTERNATIONAL MARKET INTRODUCTION OF CONCENTRATED SOLAR POWER-POLICIES AND BENEFITS", Michael Geyer, IEA Solar PACES Imple-menting Agreement
/19/ International Energy Agency (IEA), Ocean energy systems, 2003
/20/ Oman Power and Water Procurement, Annual Report 2006
/21/ "Technical and Economic Assessment: Off-grid, Mini-grid and grid Electrification Technologies", World Bank Energy Unit, November 2005
/22/ "life-cycle Analysis of Energy Systems", Bernd Kuemmel, Stefan Krüger Nielse, Bent Sørensen, 1997
/23/ Oman Power and Procurement, 7-Year Statement (2008 - 2014), Dec. 2007

Appendix 1 Summary of meetings 1. Ministry of Fisheries H.E. Hamed Said Al-Oufi, Undersecretary Date: 24.09.07 at 13:00 hrs A. Basis for the meeting Subject: Biogas
1. Location of major fish industry in Oman 2. Present mode of handling waste management 3. Fuels from waste, especially on dried waste 4. Main fishing season in Oman (region) 5. Type and amount of available wastes from fish industry 6. Attitude to renewable energy supply
B. Comments received
Waste from fishing industry is nearly 100% which is transferred to the Fish Meal Company in Muscat. The large part of it is used for agriculture and cattle breeding. Renewable energy supply could be investigated for the Shrimps Fabrication, close to Al Duqm which is actually powered by diesel generator now. Two other projects have been suggested:
1. Algae farming in the sea for biogas production 2. Algae farming based on well water production of oil drilling
C. Documents received No documents received

2. Mazoon Electricity Company Eng. Abdullah Al-Badri, General Manager Date: 24.09.07 at 09:00 h A. Basis for the meeting Subject: General information
1. Location and capacity for existing power stations, main transmission and distribution lines
2. Location and capacity for present isolated grid system. 3. Load centres including min., max. and average electricity demand.
Information for main grid and for isolated grid systems 4. Number of present and future consumers in main grid and isolated
grids 5. Plans for extension of power system, including capacity of plants,
transmission and distribution lines 6. Information, e.g. annual reports. historic data (technology, efficiency,
fuel consumption and age), maps and production cost (split in fuel, fixed and variable cost) of generation, transmission and distribution facilities.
7. Generation and transmission system expansion plans. Current and foreseen bottlenecks in the system. Load curves and factors.
8. Attitude to include renewable energy supply in the plans B. Comments received The questionnaire was discussed in detail. Answers will be prepared in writing. There are several unconnected villages in the area of Mazoon’s district. One of them is SALMAH close to Muscat in the mountains (about 30 inhabitants). The Company, Bahwan Group installed there a PV system for a common room. The electrical power is used for ventilators and refrigerator. Mazoon Electricity mentioned a special report regarding rural areas in the district that will be handed over with the annual reports and the answers to the questionnaire. C. Documents received
Answers on questions Annual report 2005 and 2006 Report on rural areas

3. Oman Power&Water Procurement Company Eng. Saleh Al-Rasdi, CEO Date: 25.09.07 at 10:00 h A. Basis for the meeting Subject: Biogas
1. Plan for new power generation of electricity (MW) 2. Types and amount of fuel of existing and future power generation
plants 3. Efficiency of existing and future power generation plants 4. Cost for generation of electricity 5. Cost of fuel at present and forecast (next 20 years) 6. Annual reports 7. Attitude to include renewable energy supply in the plans
B. Comments received Actually there are 7 gas fired power generation plants in Oman. All of them are backed-up by diesel power generation. The installed capacity amounts to 3600 MW. New capacity is planned for Salalah with 400 MW for Dhofar Power Company. Regarding the development of Al Duqm, the connection to the main grid is under planning and shall be finalized end of 2009 till 2010. Along with the growing demand of electric power in Al Duqm a local power generation plant will probably be implemented. Future plans are to connect Dhofar grid with MIS via the existing mini-grid of PDO. Eng. Saleh Al-Rasdi mentioned about potential for renewable energy in Salalah with wind energy and on other locations with hydropower plants. Due to the relatively low electrical power consumption in the winter period the balance capacity of the installed power generation plants could be used to pump water up in dams. Power consumption in winter period decreases to 1/3 of the peaks in summer period. The stowed water could thus power hydropower turbines in the hot season. For detailed meeting it was decided to meet with Mr. Alan Davis (Planning & Pricing Manager). C. Documents received
Annual report 2006 Strategy report 2007 – 2013 (available on homepage)

4. Oman Waste Water Company Eng, Omar Khalfan Al-Wahibi, CEO Date: 25.09.07 at 13:00 h A. Basis for the meeting Subject: Biogas
1. Waste management structure 2. Waste management documents 3. Current waste accumulation, quantity development and composition 4. Which type of industry/consumers produce the waste water 5. Present mode of handling of waste water: how is the waste water
transported to the waste water plant, what is it used for? 6. What are the expenditures for handling the waste water? 7. Have there been any considerations for utilizing waste water for biogas
production? 8. Attitude to include renewable energy supply in the plans
B. Comments received OWWC is only responsible for waste water in the area of Muscat. All the rural areas are under the responsibility of the Ministry of Regional Municipalities. A third company is responsible for Salalah. Solid waste is managed by other authorities. The infrastructure of waste water management is under development. It is targeted to reach 80% coverage in 2013. The today’s yearly amount of waste water is around 43,000 m3. The activities are actually concentrated on the higher populated areas. There is no biogas production due to small amount of waste. Waste is partly used for fertilizer production. A new composting facility shall start operation in 2010. The capacity was not communicated. The yearly operational cost of OWWC amounts to 2.6 m USD. The attitude to renewables was very positive. The shortage of gas should especially taken into consideration when talking about renewables. C. Documents received
Annual report 2006

5. Royal Oman Police (ROP) Colonel Ahmed Darwsh Al-Zadjali Khalid Al-Shabibi, Director of Projects Ahmed Mohd. Hatim Al-Balushi, Project Maintenance Eng. Bashir Al-Farsi, Electrical Engineer Date: 26.09.07 at 10:00 h A. Basis for the meeting Subject: Wind, Solar, Geothermal
1. Type of renewable energy technology, date of installation and capacity 2. Operation and performance experience (generated output, technical
availability, type of problems) 3. Local operation and maintenance skills for this type of renewable
energy technology 4. Implementation and operation costs for the systems 5. Attitude to include renewable energy supply in the plans
B. Comments received ROP is very interested to implement renewables in their power supply concept. BOT projects are the most favourable projects in this regard. They mentioned that solar could be still too expensive for feed-in solutions compared to the gas generated electrical power in Oman which is subsidised. ROP purchases electric power on a basis of 50% of the official tariffs in Oman. They are interested to investigate more on the feasibility of wind power generation (for example for the island of Masirah). ROP is only looking to supply power for there own buildings like prisons, academies etc. The average power demand of these buildings lies between 500 and 1000 kW. The new prison next to Nizwa (name???) is planned to have 1.8 MW. ROP is ready to invest in renewables even if the power production is more cost intensive than comparable gas fired power generation. The amortisation period can be up to 20 years. ROP asked for the delivery time of one 5 MW wind power station and of smaller systems with around 600 kW. ROP operates one solar power unit on Daymaniyat Islands for radio base and radar stations with installed capacity of 2.0 kW. C. Documents received
Wind date (measurements in 50 m height)

6. Ministry of Regional Municipalities Eng. Abdul Hakim Al-Zadjani, Director General Technical affairs Date: 26.09.07 at 12:00 h A. Basis for the meeting Subject: Biogas Questions related to biogas
1. Information on landfills: locations, size, depth, age, type of content 2. Locations of industries generating waste water (e.g. food industry, palm oil
and slaughter houses) 3. Locations of major farms and number/type of animals 4. Data on waste water from the industries with effluents with high organic
content (solid organic material after vaporisation) 5. Locations waste water treatment plants and amount of flow of biological
waste water 6. Legislation regarding handling of waste water 7. Previous reports on the landfills and biogas potential in Oman
General
1. Attitude to include renewable energy supply in the plans B. Comments received MRM operates around 300 trop-off sites for domestic waste. A new landfill is planned for Sur with the local Municipality of Sur. A similar project will be established in Adan area in 2009 (Dakhla region). 8 major locations with 7000 m3/day are: Sur, Ibra, Sumail, Nizwa, Ibri, Saham, Rustakh, Khasab and Barka. The waste treatment plants in all other cities (approximately 75) are very small and have capacity between 120 and 200 m3/day. Data about the food industry, slaughter houses etc. have to be collected from the Ministry of Industry and Commerce. Further information about waste of farms, numbers of animals and so on can be collected from the Ministry of Agriculture. Industrial waste is not under the responsibility of MRM. Regarding the handling of waste, the legislation for OWWC and MRM are identical. Regarding landfill no reports are available and no studies are done right now. Positivity about renewables. Eng. Abdul Hakim Al-Zadjani mentioned to visit the oldest wind powered water pump in Oman in Matrah (Muscat) which was installed between 50 to 60 years ago. C. Documents received - No documents received

7. Sultan Qaboos University Dr. Ali Salim Al-Alawi, Dr. Hilal Al-Ismaily, Dr. Nabeel Al-Rawahi Dept. of Mechanical & Industrial Engineering Date: 29.09.07 at 09:00 h A. Basis for the meeting Subject: R&D, studies
1. Overview of existing renewable energy systems in Oman including date of installation, owners, locations and types
types year of installation owners, energy generation
2. Information on performance of existing renewable energy systems including energy output and operation reliability
3. Types of R&D activities within renewable energy and R&D budget for this sector 4. Are there any plans for new, future R&D activities regarding renewable energy in
Oman? If any, within which area and why are these areas prioritized 5. Which type of renewable energy technology is most suitable for Oman 6. Are there any norms and standards regarding installation of renewable energy (e.g.
documentation solar panel efficiency, installation requirements ) 7. Norms, standards regarding renewable energy (e.g. documentation solar panel
efficiency) 8. Attitude to renewable energy supply
B. Comments received Several student projects in wind, solar (PV and thermal) identified, such as a PV solar car; research activities in combined solar thermal and seawater desalination. Wind study on the island of Masirah. PDO utilises hot steam for processing; Possibility for concentrator thermal systems for hot steam generation. Further information could eventually be collected from the Solar Conference at SQU in 2001. Data are available at the library. Project hot water systems for remote areas powered by wind energy. The following steps are focused:
1. Data collection 2. WASP and installation of measurement device 3. Search of sponsors for wind turbine installation
Step 1 and 2 together requires approx. 10,000 to 20,000 OMR Wind conditions at the coastal line between Sur and Salalah during summer season (mid of June till mid of September) very strong. Inhabitants are leaving the coastal villages and are moving inside Oman at this time. Fishing is to dangerous due to high waves like in Ras Al-Hadd. For more reliable data higher measurement masts need to be installed.

According to SQU studies, wind and solar power are the only feasible options in Oman subject to the location. Important to meet also Dr. Adel from the electrotechnical department. Research program together with Electricity Technology Japan since approx. 9 years which will be determined next year. The subject: Impact on PV cells under the specific environmental conditions in Oman. The following internet link was recommended for more data about solar radiation and wind of Oman: www.sciencedirect.com Dr. Al-Alawi made its doctoral thesis in “An integrated PV-Diesel Hybrid Water and Power Supply System for Remote Arid Regions”. Dr. Saleh Suleimani published a paper on wind turbine for water pumping in Hayma (located close to Thumrait). C. Documents received
Published articles about renewable energy Viability of Hybrid Wind-Diesel Power Generation in Fossil Fuel Rich Countries : A
Case Study of Masirah Island, Oman

8. Ministry of Transport & Telecommunication Directorate for Transport and Ports Eng. Hamed Saud Al-Ramdani Date: 29.09.07 at 12:00 h A. Basis for the meeting Subject: Wave, Wind Wave energy related questions
1. Positions where wave data has been measured 2. Measured wave characteristics at the sea of Oman: wave length, wave height, wave
directions (frequency), since the measuring started. Estimated max wave height (50 year wave)
3. Average water depth along Oman coast, preferably indicated on sea map. 4. Restrictions for installation of wave power stations in the sea
Wind energy related questions
1. Locations of off shore/on shore wind monitoring stations, specified by coordinates and shown on map
2. Height above sea level of the wind speed and wind direction sensors at each station 3. Measurement period since Gov. started measuring (start date - end date (if any) for
each mast. 4. By which frequency is the wind data measured (each second, each 10 minutes, each
hour) 5. In which format are the raw data for wind speed, wind direction and temperature
available (manual registration or digital registration) 6. Results of data analyses:
Hourly mean wind speed variation during a day Monthly mean wind speed variation during a year Annual mean speed variation (year to year variations) Annual wind direction frequency (wind rose) Annual wind speed frequency distribution (histogram) Hourly, monthly and annual mean air temperature
7. Restriction for installation of wind power plants at harbours/on shore/off shore General
1. Attitude to include renewable energy supply in the plans B. Comments received Directorate General for Transport and Ports doesn’t have any marine data. It was proposed to meet with Royal Oman Navy (RON). C. Documents received - No documents received

9. Ministry of Transport and Telecommunications Directorate General of Civil Aviation & Meteorology (DGCAM) Ahmed Hamoud Mohammed Al-Harthy, Director of Meteorology Dr. Juma Al-Maskari (Ass. DG for Meteorological Affairs) Date: 30.09.07 at 11:30 h A. Basis for the meeting Subject: Wind
1. Locations of met. stations/wind monitoring masts - shown on map and specified by
coordinates and by height above sea level 2. Height above ground level of the wind speed and wind direction sensors at each mast 3. Measurement period since Gov. started measuring (start date - end date (if any)) for
each mast. 4. Type of terrain surrounding the masts (open flat area, mountain and hills, built-up area) 5. By which frequency is the wind data measured (each second, each 10 minutes, each
hour) 6. In which format are the raw data for wind speed, wind direction and temperature
available (manual registration or digital registration) 7. Results of data analyses:
Hourly mean wind speed variation during a day Monthly mean wind speed variation during a year Annual mean speed variation (year to year variations) Annual wind direction frequency (wind rose) Annual wind speed frequency distribution (histogram) Hourly, monthly and annual mean air temperature
8. Restriction for installation of wind power plants at harbours/on shore/off shore 9. Reports on wind energy studies and surveys in Oman
General
1. Attitude to include renewable energy supply in the plans B. Comments received Wind and solar data are available hourly since 1942 for some masts. Fees for data collection from DGCAM (Civil Aviation) as follows:
Hourly data basis: 30 OMR per parameter per station per month Daily data basis: 20 OMR per parameter per station per month Monthly data basis: 60 OMR per parameter per station per year
C. Documents received
Map with locations of measurement station in Oman (approx. 30 stations) Parameter and criteria of stations

10. Ministry of Environment and Climate Affairs Eng. Naeem Salim Al-Musharroti, Section Environmental Impact (EIA) Dr. Barry P. Jupp, Marine Ecologist Date: 30.09.07 at 10:15 h and 15:00 h A. Basis for the meeting Subject: Wind, Solar Wind related questions
1. Locations of met stations/wind monitoring masts - shown on map and specified by coordinates and by height above sea level
2. Height above ground level of the wind speed and wind direction sensors at each mast 3. Type of terrain surrounding the masts (open flat area, mountain and hills, built-up area) 4. Measurement period for each mast (start date - end date (if any)) 5. By which frequency is the wind data measured (each second, each 10 minutes, each
hour) 6. In which format are the raw data for wind speed, wind direction and temperature available
(manual registration or digital registration) 7. Results of data analyses:
Hourly mean wind speed variation during a day Monthly mean wind speed variation during a year Annual mean speed variation (year to year variations) Annual wind direction frequency (wind rose) Annual wind speed frequency distribution (histogram) Hourly, monthly and annual mean air temperature
8. Reports on wind energy studies and surveys in Oman Solar related questions
1. Available climatic data : solar radiation, air temperature, air humidity from Jan. to Dec. 2005, 2006, 2007
2. Reports on solar energy studies and surveys in Oman General
1. Attitude to include renewable energy supply in the plans B. Comments received Discussion about renewables in Oman, potentials of wind and solar. Regarding marine data, Eng. Naeem provided link to Dr. Barry Jupp. C. Documents received
Several excerpts of environmental law and procedures

11. Supreme Committee for Town Planning, H.E. Muneer Baker Al-Musawi, Secretary General Contact: Eng. Fahad Mohammed A. Nabi Macki (D.G. of Technical Developments) Consultant: Klaus Friedl, V.R.Prasad Date: 22.10.07 A. Basis for the meeting Subject: General information
1. Development plans for existing and new towns: locations population 2. What type and amount of energy supply is planned for the new towns 3. Building density and residential area 4. Attitude to include renewable energy supply in the plans
B. Comments received Major town planning project located in Duqm. The development of Duqm is being overseen by the Ministry of National Economy and the Ministry of Transport and Communications. The development of Duqm and surround area will create a major new city in the Al Wusta region that will serve as an administrative, industrial and commercial centre. The government is developing the necessary infrastructure and facilities required (e.g. schools, hospital, airport, telecom) plus the amenities necessary to attract companies, service providers and people to what will be an important centre for continuing the development and diversification of our economy. This major new city will bring employment and increased prosperity to Oman in general and to the Al Wusta region in particular. It is very difficult to provide an accurate assessment, but in the medium to long term it is expected that private and government expenditure will be in the billions of Omani rials. Duqm is expected to grow into a town of more than 50,000 people and almost everything is yet to be built – by government, companies and the public. The cost of the development of the town and infrastructure can be expected to be very significant. The development of the city of Duqm is a major undertaking and it will be the first time in Oman’s recent history that a completely new city has been created. Energy projects are planned by the Authority of Electricity Regulation Oman and the Rural Area Electricity Company. A coal fired power generation plant with a capacity of 1000 MW is under consideration but also the opportunity of implementing 50 MW of solar thermal or photovoltaic energy. Connection Duqm with MIS planned until 2010/2011. C. Documents received
Map of Master Town Planning Duqm View of coastal highway Muscat to UAE incl. street lighting

12. Ministry of Agriculture H.E. Eng. Khalfan bin Saleh Al Naebi, Undersecretary Date: 30.09.07 at 09:30 h A. Basis for the meeting Subject: Biogas
1. Location of major farms and number/type of animals (visits of big farms in Dhofar, Batinah, Sharkya, Dakhlia)
2. Present handling of waste 3. Fuels from waste, respectively dried waste 4. Approximately amount of available waste from agriculture activities (bagasse, citrus fruit
peels, straw) 5. Main crops in Oman (region, harvest time) 6. Type and amount of available waste from fish industry 7. Attitude to include renewable energy supply in the plans
B. Comments received The questionnaire was discussed and hand out. The questionnaire and the introduction letter will be forwarded internally to the technical department. They will provide reply by next week. In case of open questions a further meeting with the technical department should take place. Positivity about renewables. Offered support to arrange visits with big farms in the north and the south of Oman. C. Documents received
Bulletin of Agriculture and Fisheries 2004 Bulletin of Agriculture and Fisheries 2005 Bulletin of Agriculture and Fisheries 2006

13. Ministry of National Economy H.E. Sheik / Al Fadil bin Mohammad bin Ahmed Al-Harthy, Undersecretary Consultant: Niels Bisgaard Petersen, V.R.Prasad Date: 11.11.07 A. Basis for the meeting Subject: General information, Census and Social Statistics
1. Demographic information: the population, distribution on cities, villages and in rural areas
2. Population on a communal level 3. Employment 4. Social-economical structure 5. Household (national data or data from target areas) 6. Poverty, livelihoods and well-being 7. Location of cities and villages 8. Building density and residential area 9. Maps of Oman (digital, hardcopy) 10. Statistics on income, average on each location/region 11. Attitude to include renewable energy supply in the plans
B. Comments received A number of statistical demographic and economic information relevant for the study was received. C. Documents received
Year book 2006 of Oman

14. Ministry of Oil and Gas H.E. Nasser bin Khamis Al Jashmi, Undersecretary Date: 29.09.07 at 13:00 h A. Basis for the meeting Subject: Geothermal energy Questions related to geothermal energy
1. Locations of bore holes: along the northen coast (from Khasab to Quriyat) (appr. within a
20 km belt along the coastline) along the southern coast (from Dalkut to Sadah) (appr. within a 20 km belt along the coastline) on the island Masirah at Ibri, Hayma and Thumrayt
2. Data form the boreholes: depth temperature gradient presence of water/steam temperature of water/steam
3. Seismic activities in Oman 4. Domestic fuel Subject: oil, coal and gas. 5. Attitude to include renewable energy supply in the plans
B. Comments received Positivity about renewables. Oman has to take into consideration alternatives to fossil fuel due to limited gas reserves. All power generation plants in Oman are gas fired. The gas is sold for 1.5 USD per million BTU to the Omani power generation plants. The export prices are situated between 3 and 10 USD per million BTU depending on the product specifications. For the renewable energy study he suggested to generate different scenarios of future gas prices or equivalent gas prices for coal. Regarding specific data about oil field operations the Undersecretary suggested to meet with PDO. He offered support to provide additional introduction letter for data collection if required. C. Documents received
Reply on questionnaire received

15. Petrol Development Oman (PDO) Corporate Planning Steve J. Van Rossem, Corporate Planning Manager (UCPM) Richard R. Terres Ph.D, Corporate Strategy & Portfolio Manager (UCS) Date: 29.09.07 at 14:15 h A. Basis for the meeting Subject: Wind, Solar, Geothermal General questions
1. Type of renewable energy technology, date of installation and capacity 2. Operation and performance experiences (generated output, technical availability, type of
problems) 3. Local operation and maintenance skills for this type of renewable energy technology 4. Implementation and operation costs for the systems 5. Basis for determination of fuel cost for domestic users and for export 6. Actual costs of fuel and their forecasts
Questions related to geothermal energy
1. Locations of bore holes: along the northern coast (from Khasab to Qurayyat) (app. within a 20 km belt along
the coastline) along the southern coast (from Dalkut to Sadah) (app. within a 20 km belt along the coastline) on the island Masirah at Ibri, Hayma and Thumrait
2. Data form the boreholes: depth temperature gradient presence of water/steam temperature of water/steam
3. Seismic surveys in Oman 4. Domestic fuel subject: oil, coal and gas. 5. Attitude to include renewable energy supply in the plans
B. Comments received Both managers pointed out that the right of property of all data belong to PDO and its shareholders and are subject to approval. PDO operates over 5000 well drillings in more than 120 oil fields in Oman. All oil fields are located in block 6. Some of them pump less than 500 bpd. PDO operates actually app. 600 MW installed electric power generation plants. Till end 2007 the capacity will be extended up to 900 MW (One power plant with more than 100MW; the others are smaller power stations with 30 to 50MW). These power plants are fired by non-associated gas (natural gas). This capacity is nearly exclusive used by PDO.

The power grid of PDO grew along with the development of the drilling activities. Therefore the grid is actually not adapted for high load. PDO is producing 7 barrels of well water per barrel of crude oil (5 to 6 million barrels of water a day). Most of the produced well water is re-injected in the same or new wells. The average temperature of the well water was estimated to 86C°. Regarding geothermal power it was mentioned that hot springs in the mountain region and around Muscat could be more suitable. On some locations in a depth of 5000 m the temperature of the well water was only 10K hotter than the outside temperature with around 55C°. In order to analyse the geothermal potentials and the data available with PDO it was recommended to plan a meeting between a geothermal expert of COWI and a geologist of PDO. The existing implementations of solar energy systems are minor. PDO uses hot steam for production process which is generated by gas firing. If solar thermal systems are competitive a combined solution (gas/solar) could be possible. PDO is interested in wind power generation and in the results of our study. Under certain conditions PDO would be a co-investor in a wind power generations station. C. Documents received
Facts sheet as of July 2007

16. Scientific Research Council H.E. Dr. Hilal bin Ali Al Hinai Date: 26.09.07 at 13:00 h A. Basis for the meeting Subject: R&D, strategy in Renewables
1. Overview of previous and existing renewable energy systems in Oman: types year of installation owners, energy generation
2. Types of present R&D activities within renewable energy and R&D budget for this sector 3. Are there any plans for new, future R&D activities regarding renewable energy in Oman? If
any within which area and why are these areas prioritized 4. Which type of renewable energy technology is most suitable for Oman 5. Are there any policy regarding involvement of industry in developing renewable energy
sector 6. Are there and norms and standards regarding installation of renewable energy (e.g.
documentation solar panel efficiency, installation requirements ) 7. Attitude to renewable energy supply
B. Comments received The policy of the research council is to provide fund mechanism for R&D projects. Two main sections are targeted; the section of Energy and of Education & Culture. The official strategy and program of the research council will be declared in October/November 2007. Subsidies in power supply are considerably higher in other AGCC countries than in Oman. The question for Oman is, if renewables are able to supply enough energy and in a cost efficient way. Dr. Hilal recommended solar energy prior for remote areas or combined with water desalination or treatment. The cost of desalinated water in urban areas lies around 1.5 USD / m3, but in remote areas over 25 USD / m3. Wind energy is most suitable for the coast line in the south, from Sur to Salalah. The RE study should take into consideration the today’s greenhouse gas emission of Oman and the potential of RE/solar energy export, Dr. Hilal said. Dr. Hilal discussed his paper about solar chimney for power generation and water desalination. Referring to this he mentioned the lower impact of dust on solar thermal systems as on photovoltaic systems. He also mentioned to study the possibility of “Ocean Thermal Conversion”. The necessary temperature difference and depth of the sea seems to be sufficient in Salalah. C. Documents received
A high efficiency Solar Chimney for Power Generation and Water Desalination

17. Authority for Electricity Regulation Oman Eng. Hilal Al-Ghaithi Date: 09.09.07 at 10:00 h A. Basis for the meeting Subject: Power Industry Oman, Subsidy system in Oman Questions related to the energy sector
1. Energy related legislation and regulations, i.e. energy law, electricity law, renewable energy law, energy efficiency law and similar.
2. Energy policy documents regarding electricity sectors, oil and gas sectors, energy and environment, targets for renewable energy share and energy policy tools under consideration, status in relation to Kyoto and climate change (energy taxes, environmental taxation (CO2), subsidies to renewable energy etc).
3. Energy sector structure and possible plans to privatise restructure and unbundle, especially electricity supply.
4. Information, i.e. annual reports, from energy/electricity suppliers. Historic data (technology, efficiency, fuel consumption and age), maps and production cost (split in fuel, fixed and variable cost) of generation, transmission and distribution facilities. Generation and transmission system expansion plans. Current and foreseen bottlenecks in the system. Load curves and factors.
5. Information about and annual report from Regulation Authority. Regulations regarding renewable energy production and licensing of electricity producers.
6. Information material and annual report from Ministry of Energy including annual energy statistics like Energy balance, Energy trade, Demand and Supply forecasts.
7. Survey and reports on the knowledge, attitude and acceptance of renewable energy among consumers and in industry.
8. Current retail and bulk prices for electricity by tariff, HFO, diesel, kerosene and LPG. 9. Information about taxes and subsidies to electricity and other energy sources. 10. Current generation cost for electricity, i.e. average short term generation cost and long
run cost. Future expansion in electricity generation, what technologies and fuels are envisaged at what cost.
11. Domestic fuel Subject, oil, coal and gas. 12. Information (historic, current, forecast) about exchange rates toward USD, electricity
and fuel prices, interest, inflation, economic growth, taxation of domestic companies, tax credits for foreign companies, depreciation rules, import duties and possible exemptions for re technology.
13. Attitude to include renewable energy supply in the plans
B. Comments received General info Electrical power system in Oman, including capacity, type and location of power plants? The following information and documentation were provided by Mr. Hilal:
Report AER 2005 on CD Annual report 2006, Oman Power and Water Procurement Co. Annual report 2005, Rural Areas Electricity Co. Annual report 2005, Muscat Electricity Distribution Co. Annual report 2005, Mazoon Electricity Co. Annual report 2005, Majan Electricity Co. Annual report 2006, Oman Electricity Transmission Co.
The main interconnection system (MIS) included all areas of Oman except of Salalah region and RAECO areas. Oman runs actually 7 gas fired power stations. Other power stations are in existence but basically used for industry or PDO. Surplus production is feed in the national grid depending on availability of grid. Transmission is based on 50 Hz, 132 – 220 Volt Some information about the AGCC grid was discussed. There are 3 phases of implementation of an AGCC grid interconnection. Discussions are going on for more than 10 years. Some connections between UAE and Oman are realised but the related contracts are still not finalised. The AGCC interconnection grid is managed by Saudi Arabia GCCIA (www.gccia.com.sa)
1. Phase: interconnection of Saudi / Qatar / Bahrain / Kuwait 2. Phase: interconnection of Oman / UAE (grid operates on 400 Volt basis) 3. Phase: integration of phase 1 + 2
Location of transmission lines and their voltage level Mr. Hilal will try to provide a detailed map of the Omani national grid Information on typical electrical distribution systems in main cities and in rural areas
• See annual report 2005, Rural Areas Electricity Co. • Rural areas are shown in the annual report of AER. Musandam is also identified as rural
area. These areas are supplied by diesel power generation. • Oman counts approximately 250 such power stations with totally 415 MW installed capacity. • Mr. Hilal provided a projection for electrification for rural areas. These projects are under
planning. Renewable power could be added or substitute conventional solutions. Maps of Oman (digital, hardcopy) Digital maps could be collected from the Ministry of Tourism as well as the Ministry of Defense Renewable energy resources

Solar energy Copies of relevant studies of similar nature already prepared. Studies for wind energy and solar energy have been handed over during the kick-off meeting on Sept. 5th. Copies of relevant government strategies and plans, if any There are no governmental strategies or plans to integrate renewable energy in Oman. This study will play an important roll for integration of RE in Oman. Mr. Kevin Cleary will give an account of power generation strategy considered in the Omani government. Relevant norms, standards, quality assurance systems. The electricity norms are based on British standard. Recently they have been homologised in GCC and are reflecting basically European standards. Availability of test station for solar systems, PV and thermal and solar thermal. Details on them. Mr. Hilal provided a summary of reference projects of OMAN SOLAR SYSTEMS Co. (www.omansolar.com). This summary can be downloaded. Energy sector, policy, legislation, prices and demand Energy related legislation and regulations, i.e. energy law, electricity law, renewable energy law, energy efficiency law and similar.
• Mr. Hilal provided “The Law for Regulation and Privatisation of the Electricity and Related Water Sector”.
• All power stations need environmental approval (EIA) • There is no renewable energy law • Important for the final report of RE in Oman is to advise about the establishment of a
Renewable Energy Sources Act. That act makes it compulsory for operators of power grids to give priority to feeding electricity from renewable energies into the grid and to pay fixed prices for this.
Energy policy documents regarding electricity sectors, oil and gas sectors, energy and environment, targets for renewable energy share and energy policy tools under consideration, status in relation to Kyoto and climate change (energy taxes, environmental taxation (CO2), subsidies to renewable energy etc).
• Oman signed and ratified the Kyoto convention • There is actually no DNA (designated national authority) in Oman to organise for example
carbon credits for carbon trading certificates. • AES (Barka I) proposed the implementation of carbon credits what couldn’t be determined

because of missing DNA in Oman. Energy sector structure and possible plans to privatise restructure and unbundled, especially electricity supply. Oman plans to privatise the power market in the following phases:
1. phase: Power Stations 2. phase: Transmission Companies 3. phase: Distribution Companies
Information, i.e. annual reports, from energy/electricity suppliers. Historic data (technology, efficiency, fuel consumption and age), maps and production cost (split in fuel, fixed and variable cost) of generation, transmission and distribution facilities. Generation and transmission system expansion plans. Current and foreseen bottlenecks in the system. Load curves and factors. See provided reports as mentioned above Information about and annual report from Regulation Authority. Regulations regarding renewable energy production and licensing of electricity producers. Report 2005 and 2006 have been provided digital Information material and annual report from Ministry of Energy including annual energy statistics like Energy balance, Energy trade, Demand and Supply forecasts. See provided reports as mentioned above Information about taxes and subsidies to electricity and other energy sources. The electricity market in Oman is officially subsidised only at the supply level.
Generation Transmission Distribution Supply
(Probably there is an additional subsidy in the system which is not officially shown. It’s masked in the prices of gas. Both the Omani gas production and purchased gas). Current generation cost for electricity, i.e. average short term generation cost and long run cost. Future expansion in electricity generation, what technologies and fuels are envisaged at what cost.
• See provided reports as mentioned above • Especially for this point the prior study of the provided reports is recommended.

C. Documents received
Report AER 2005 on CD Annual report 2006, Oman Power and Water Procurement Co. Annual report 2005, Rural Areas Electricity Co. Annual report 2005, Muscat Electricity Distribution Co. Annual report 2005, Mazoon Electricity Co. Annual report 2005, Majan Electricity Co. Annual report 2006, Oman Electricity Transmission Co. Project list of Oman Solar Systems LLC
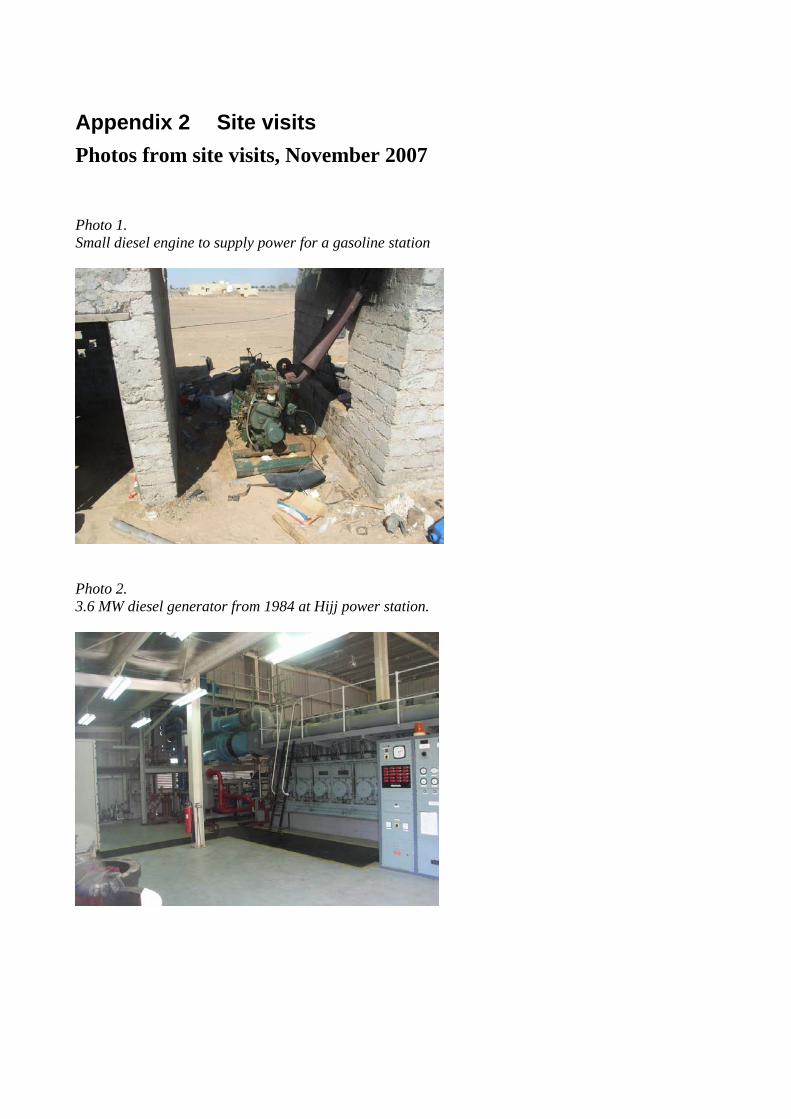
Appendix 2 Site visits Photos from site visits, November 2007 Photo 1. Small diesel engine to supply power for a gasoline station
Photo 2. 3.6 MW diesel generator from 1984 at Hijj power station.

Photo 3. Cooling of 3.6 MW diesel engine. The heat could be used for desalination of heat driven cooling.
Photo 4. Diesel meter at power station. On the visited plants only the total diesel consumption for all engines together is recorded. This does not allow for optimum operation of individual engines on basis of fuel consumption.

Photo 5. View towards Masirah island approaching from west.
Photo 6. 10 m wind monitoring mast at Quiroon Hariti

Photo 7. Potential area near Quiroon Hariti for installation of wind farm
Photo 8. Representative landscape in the mountains north of Salalah

Authority for Electricity Regulation, Oman Study on Renewable Energy Resources
\\Mailserver\general\RE Study Final report\Master_Final_draft_report_Rev_M_Appendix_3_A_only_saj.DOC
Page 1 of 9
.
Appendix 3 Analysis of wind data

Authority for Electricity Regulation, Oman Study on Renewable Energy Resources
\\Mailserver\general\RE Study Final report\Master_Final_draft_report_Rev_M_Appendix_3_A_only_saj.DOC
Page 2 of 9
.

Authority for Electricity Regulation, Oman Study on Renewable Energy Resources
\\Mailserver\general\RE Study Final report\Master_Final_draft_report_Rev_M_Appendix_3_A_only_saj.DOC
Page 3 of 9
.
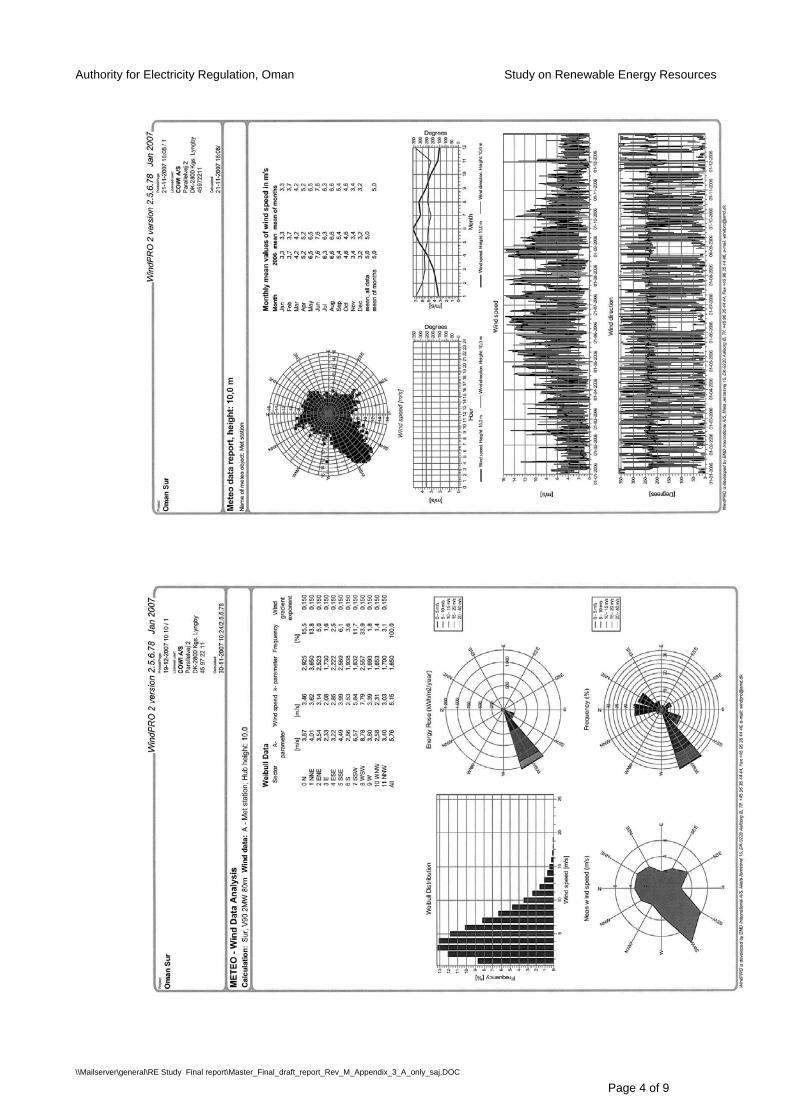
Authority for Electricity Regulation, Oman Study on Renewable Energy Resources
\\Mailserver\general\RE Study Final report\Master_Final_draft_report_Rev_M_Appendix_3_A_only_saj.DOC
Page 4 of 9
.

Authority for Electricity Regulation, Oman Study on Renewable Energy Resources
\\Mailserver\general\RE Study Final report\Master_Final_draft_report_Rev_M_Appendix_3_A_only_saj.DOC
Page 5 of 9
.

Authority for Electricity Regulation, Oman Study on Renewable Energy Resources
\\Mailserver\general\RE Study Final report\Master_Final_draft_report_Rev_M_Appendix_3_A_only_saj.DOC
Page 6 of 9
.

Authority for Electricity Regulation, Oman Study on Renewable Energy Resources
\\Mailserver\general\RE Study Final report\Master_Final_draft_report_Rev_M_Appendix_3_A_only_saj.DOC
Page 7 of 9
.

Authority for Electricity Regulation, Oman Study on Renewable Energy Resources
\\Mailserver\general\RE Study Final report\Master_Final_draft_report_Rev_M_Appendix_3_A_only_saj.DOC
Page 8 of 9
.

Authority for Electricity Regulation, Oman Study on Renewable Energy Resources
\\Mailserver\general\RE Study Final report\Master_Final_draft_report_Rev_M_Appendix_3_A_only_saj.DOC
Page 9 of 9
.

Appendix 4 and 5 Appendix 4 Analysis of solar data 4.1 The mean, the minimum and the maximum values of the daily global insolation for each month for the period 1987-1992.
Global solar radiation, 1987-1992, Average and mean maximum and minimum each month.
Buraini
0.00
1.00
2.00
3.00
4.00
5.00
6.00
7.00
8.00
Jan. Feb. Mar. Apr. May Jun. Jul. Aug. Sep. Oct. Nov. Dec.
kWh/
m2
per
day
Max
Min
Ave
Global solar radiation, 1987-1992, Average and mean
maximum and minimum each month.Fahud.
0.00
1.00
2.00
3.00
4.00
5.00
6.00
7.00
8.00
Jan. Feb. Mar. Apr. May Jun. Jul. Aug. Sep. Oct. Nov. Dec.
kWh/
m2
per d
ay
Max
Min
Ave
Global solar radiation, 1987-1992, Average and mean
maximum and minimum each month.Seeb.
0.00
1.00
2.00
3.00
4.00
5.00
6.00
7.00
8.00
Jan. Feb. Mar. Apr. May Jun. Jul. Aug. Sep. Oct. Nov. Dec.
kWh/
m2
per d
ay
Max
Min
Ave

Global solar radiation, 1987-1992, Average and mean maximum and minimum each month.
Sur.
0.00
1.00
2.00
3.00
4.00
5.00
6.00
7.00
8.00
Jan. Feb. Mar. Apr. May Jun. Jul. Aug. Sep. Oct. Nov. Dec.
kWh/
m2
per
day
Max
Min
Ave
Global solar radiation, 1987-1992, Average and mean maximum and minimum each month.
Marmul
0.00
1.00
2.00
3.00
4.00
5.00
6.00
7.00
8.00
Jan. Feb. Mar. Apr. May Jun. Jul. Aug. Sep. Oct. Nov. Dec.
kWh/
m2
per d
ay
Max
Min
Ave
Global solar radiation, 1987-1992, Average and mean maximum and minimum each month.
Salalah
0.00
1.00
2.00
3.00
4.00
5.00
6.00
7.00
8.00
Jan. Feb. Mar. Apr. May Jun. Jul. Aug. Sep. Oct. Nov. Dec.
kWh/
m2
per
day
Max
Min
Ave

Appendix 5 Geothermal data

Appendix 6

Appendix 6 Solar technology, applications and efficiency
6.1 Solar thermal systems For production of solar thermal energy at temperatures below 100 C there are two types of technology typically applied. One is a flat plate collector with an absorber covered by a special selective surface and a low iron glass cover, sometimes additional cover as well. The other is evacuated tubular collects in which the absorber is integrated into a glass tube with vacuum. The latter is more efficient for temperatures close to 100 C, but the flat plate is best for lower temperatures. These collectors convert up to 80 percent of the solar insolation to heat with a yearly average of up to 50% of the solar insolation. A popular system for a family consist of about 2 m2 of collector with an integrated storage tank located on top of the collectors so that a pump is not necessary to circulate the fluid in the collectors. Larger systems are made with collectors on the roof and a piping system for transfer of the heat to a storage tank in the building. Fig. A 6.1 Flat plate collector, evacuated tubular collector and the same with integrated storage tank for hot tap water.
Another important application of solar thermal energy is for cooling. As cooling is most often provided with conventional electric compressors solar energy will also in this case replace electricity. The most typical system here is to use a higher temperature collector (often evacuated tubular collector, up to about 100 C) to produce heat for an absorption chiller. An important aspect here is that the system still uses electricity for pumping and other things which is sometimes significant.
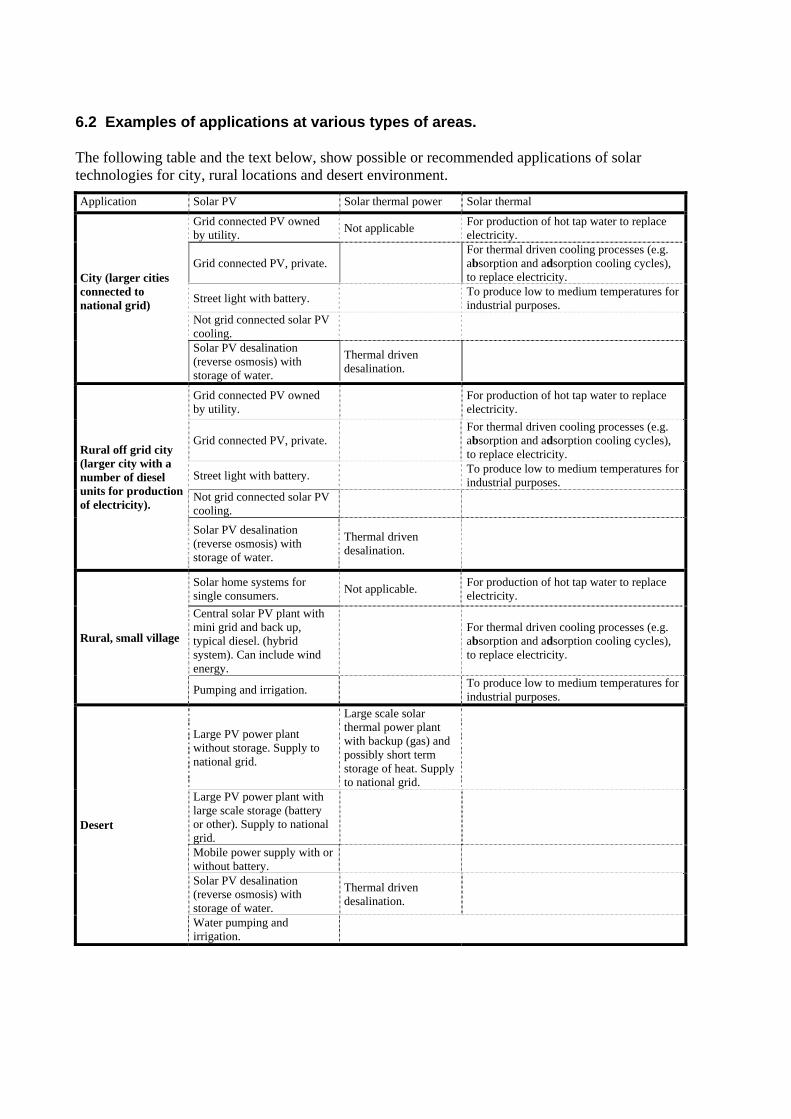
6.2 Examples of applications at various types of areas. The following table and the text below, show possible or recommended applications of solar technologies for city, rural locations and desert environment.
Application Solar PV Solar thermal power Solar thermal
City (larger cities connected to national grid)
Grid connected PV owned by utility. Not applicable For production of hot tap water to replace
electricity.
Grid connected PV, private. For thermal driven cooling processes (e.g. absorption and adsorption cooling cycles), to replace electricity.
Street light with battery. To produce low to medium temperatures for industrial purposes.
Not grid connected solar PV cooling.
Solar PV desalination (reverse osmosis) with storage of water.
Thermal driven desalination.
Rural off grid city (larger city with a number of diesel units for production of electricity).
Grid connected PV owned by utility. For production of hot tap water to replace
electricity.
Grid connected PV, private. For thermal driven cooling processes (e.g. absorption and adsorption cooling cycles), to replace electricity.
Street light with battery. To produce low to medium temperatures for industrial purposes.
Not grid connected solar PV cooling.
Solar PV desalination (reverse osmosis) with storage of water.
Thermal driven desalination.
Rural, small village
Solar home systems for single consumers. Not applicable. For production of hot tap water to replace
electricity. Central solar PV plant with mini grid and back up, typical diesel. (hybrid system). Can include wind energy.
For thermal driven cooling processes (e.g. absorption and adsorption cooling cycles), to replace electricity.
Pumping and irrigation. To produce low to medium temperatures for industrial purposes.
Desert
Large PV power plant without storage. Supply to national grid.
Large scale solar thermal power plant with backup (gas) and possibly short term storage of heat. Supply to national grid.
Large PV power plant with large scale storage (battery or other). Supply to national grid.
Mobile power supply with or without battery.
Solar PV desalination (reverse osmosis) with storage of water.
Thermal driven desalination.
Water pumping and irrigation.

Application 1. City A major application here is grid connected solar PV. This will feed into the grid in the same way as wind energy does. The PV can be located anywhere and be privately owned is the legal set up making this possible. The PV is connected to the grid via a converter and the surplus of electricity can be transferred to the grid. For this a tariff for selling and for buying is needed. In some countries the tariffs are the same for selling and buying in order to promote PV. As long as the peak power demand coincides with the solar insulation (mid day) the solar PV can represent a real capacity on the grid. One MW solar PV will replace one MW conventional power plant. An important aspect here is that the time for realising solar PV capacity is much shorter than for conventional power (perhaps 1 year instead of 10 years). In Oman there seems to be two peaks in the use of electricity, midnight and midday. If the midnight peak is the biggest the PV will not represent a capacity. A way to deal with this could be to do other things to reduce the midnight peak through other measures. PV street light with battery can be an option in parts of a city and will reduce the midnight peak. Solar PV desalination can operate when the sun is shining and the water stored. Solar thermal power is not applicable as an integrated part of the city. The solar thermal applications which include solar thermal energy for heating of water and for cooling are essential for the city. These are demand side applications where it is the consumers who do the investment. The advantage with these technologies is that they reduce the consumption of electricity and also the demand for capacity of power plants. Possible approaches to promote these technologies are regulations and encouragements. For example it could be made forbidden to use electricity for heating of water and a grant could be provided for solar cooling. Application 2. Rural off grid city It is here considered that there is a supply based on a number of smaller units (e.g. diesel) to supply the city but that it is not connected to the national grid. For this purpose the applications mentioned under "city" are all relevant. As the cost of electricity is higher the demand side applications will be more favourable and a higher percentage of solar will be feasible. Diesel engine can be made of more than one unit and a smaller battery bank can be included for improved fuel efficiency. Heat from diesel engines (cooling and exhaust gas) can be used for operation of heat driven cooling (adsorption or absorption machine). The cooling from this could be supplied to larger consumers (office, shops etc.) via district cooling.
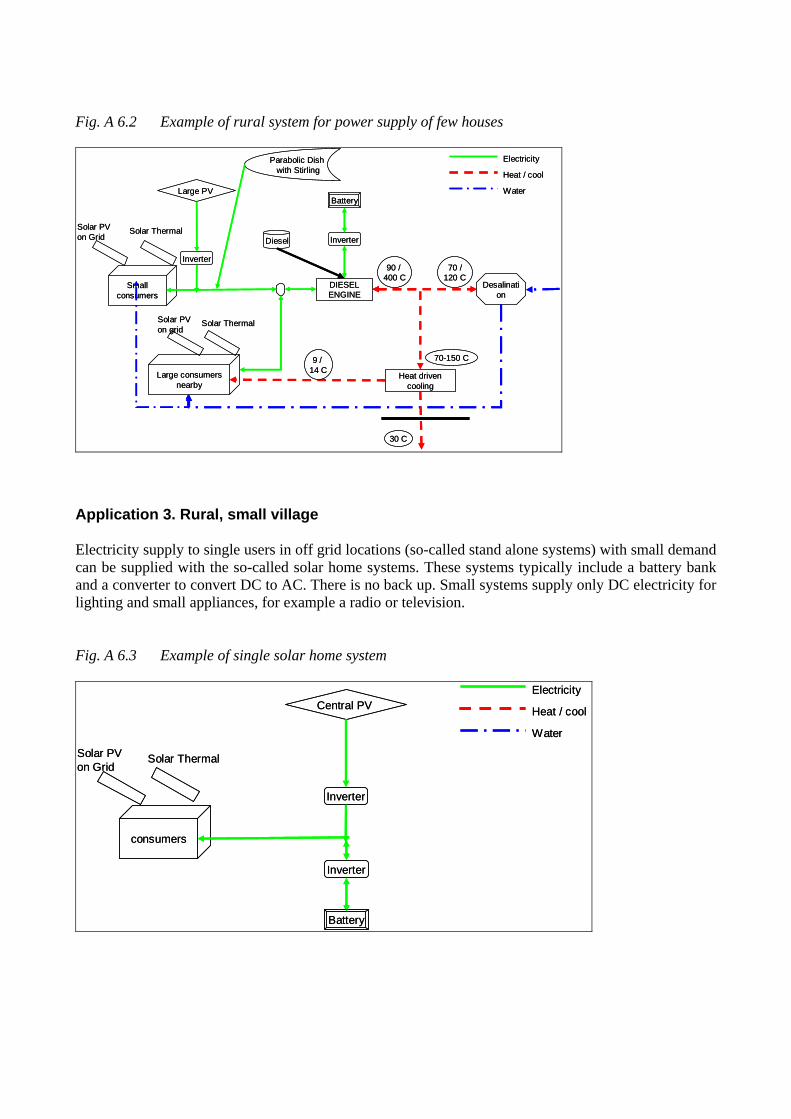
Fig. A 6.2 Example of rural system for power supply of few houses
DIESEL ENGINE
Desalination
Inverter
Heat driven cooling
Small consumers
Large consumers nearby
Solar PV on Grid
Solar Thermal
Solar ThermalSolar PV on grid
BatteryLarge PV
Inverter90 /
400 C
9 / 14 C
70-150 C
30 C
70 /120 C
Diesel
Parabolic Dish with Stirling
Electricity
Heat / cool
Water
DIESEL ENGINE
Desalination
Inverter
Heat driven cooling
Small consumers
Large consumers nearby
Solar PV on Grid
Solar Thermal
Solar ThermalSolar PV on grid
BatteryLarge PV
Inverter90 /
400 C
9 / 14 C
70-150 C
30 C
70 /120 C
Diesel
Parabolic Dish with Stirling
Electricity
Heat / cool
Water
Application 3. Rural, small village Electricity supply to single users in off grid locations (so-called stand alone systems) with small demand can be supplied with the so-called solar home systems. These systems typically include a battery bank and a converter to convert DC to AC. There is no back up. Small systems supply only DC electricity for lighting and small appliances, for example a radio or television. Fig. A 6.3 Example of single solar home system
Inverter
consumers
Solar PV on Grid
Solar Thermal
Battery
Central PV
Inverter
Electricity
Heat / cool
Water
Inverter
consumers
Solar PV on Grid
Solar Thermal
Battery
Central PV
Inverter
Electricity
Heat / cool
Water

Renewable electricity supply to off grid locations with higher demand (small villages) are often referred to as a hybrid system. There will be a mini grid, solar PV panels, diesel engine a central battery bank, a bi-directional DC-AC converter and sophisticated control. In Oman, the system could not be made without diesel backup due to the large difference between summer and winter consumption. As indicated below the system could include parabolic dish with Stirling engine. The heat from the diesel engine could be used for desalination or cooling. Fig. A 6.4 Example of system for rural village
DIESEL ENGINE
Inverter
consumers
Solar PV on Grid
Solar Thermal
Battery
Large PV
Inverter
Diesel
Parabolic Dish with Stirling
Electricity
Heat / cool
Water
DIESEL ENGINE
Inverter
consumers
Solar PV on Grid
Solar Thermal
Battery
Large PV
Inverter
Diesel
Parabolic Dish with Stirling
Electricity
Heat / cool
Water
Application 4. The desert The desert with its favourable solar conditions has a potential of developing into the major source of energy supply for a country like Oman. The resources available are enormous and might be a major export to Europe sometimes in the future, export of clean energy following depletion of the oil resources. With a high percentage of solar electricity (and wind electricity) there will be a surplus in the winter which could be exported to Europe where the consumption is highest in the winter. The technologies to apply are large scale solar PV and in the future the large scale solar thermal power. The advantage with the latter is that power can be supplied all the time, not only when the sun is shining. In order to do this either the supplementary fuel should be renewable (e.g. biomass) or the technology for storage of high temperature heat should be applied. Geothermal energy may be an option at places. Alternatively solar desalination plants would allow for production of biomass to supplement the solar thermal power plant at night. Calculations show that using only 1 % of the desert and semi desert areas of the world for such technologies could provide the present electricity consumption for the entire world. The future perspective in the diagram below, shows the power plant running on solar or on the heat storage (molten salt). Surplus electricity can be used for production of hydrogen for transport or directly used for charging batteries in electric cars during off peak periods. The heat is used for heat driven cooling in local area and for desalination to produce piped water.

Fig. A 6.5 Example of large scale solar based energy supply system
Power plant
Desalination
Hydrogen
Heat storage
Heat driven cooling
Electric cars
Fuel cell cars
Fuel cells
Electricity
Heat / cool
Water
Hydrogen
Main grid
Irrigation
local cooling
Mirrors
Piped water
6.3 Environmental impact on PV cell efficiency The efficiency of solar PV modules are measured under standard conditions that are supplied by the manufacturers. These conditions are:
• A solar insolation of 1000 W/m2 on the module.
• A surrounding air temperature of 25 C.
• No dust on the module.
Under operation these conditions are not met, the insulation is on average smaller and the temperature higher and there will be some amount of dust on the module.
Calculation programmes for calculation of output from PV system always take into account the variation in insolation and the angle of radiation. The influence of the temperature and the dust is in most programmes counted for as a derating factor. In the programme HOMER, used in this analysis, a derating factor of 90% (10 % losses) has been used. This includes reduction for higher temperature and for dust and other minor losses.
For Oman the influence of the temperature is of particular interest as the temperature is very high. Therefore this has been analysed further.
On the basis of laboratory tests and mathematical analysis it has been established that the drop in efficiency for solar modules amount to about 0.4 percent per increase in module temperature.
The module temperature depends on the surrounding temperature, the insulation as well as on the way the module is mounted. A module mounted freely will be cooled by the air and the efficiency higher.
The analysis has been made with a linear temperature model. This model determines module temperature through linear dependence, from solar irradiation (G) as follows:
TModule = Ta + k * ( G / GSTC ).

The value of the constant “k” is dependent on the type of module installation and a measurement for the maximum possible temperature at maximum insolation (GSTC = 1000 W/m2) compared with the external temperature “Ta”:
• Free-standing: k = 20°C.
• Roof-mounted, with ventilation space: k = 30°C.
• Roof or façade-integrated, without ventilation space: k = 45°C.
With this model and on the basis of hourly values for insolation and external temperature from SEEB in Oman the following table has been prepared. Table A 6.1 Influence on the efficiency of solar PV modules by the cell temperature for different types of mounting
Average outside air temperature during PV operational hours Degree C
Average Module temperature during operation Degree C
Average drop in efficiency, Percentage 1)
Free-standing 31 44 7.9 Roof-mounted, with ventilation space
31 51 10.6
Roof or facade-integrated, without ventilation space
31 60 14.5
1) Compared to standard test conditions for PV modules. Insolation of 1000 W/m2 a and surrounding air temperature of 25 C. Table A 6.1 shows that the reduction in efficiency and output is about 8, 11 and 15 percent for the three different mounting. The corresponding maximum temperature (on the hottest day) is about 70 C, 80 C and 100 C for the three different mounting systems. The influence of dust depends naturally on the environmental conditions as well as on the cleaning frequency. In climates with frequent rain there will after some time be a steady state where dust and dirt is removed by the rain in the same speed as it is coming. The percentage reduction will then depend on the slope and is believed to be about 10% for a slope of 15 degree and smallest with a slope of 45 degree, where the rain is still effective. In Oman the slope should not be higher than 15 degree (for freely mounted modules) as this will reduce the output considerably. With the low and unpredictable rainfall it will be necessary to clean the PV panels from time to time in order not to reduce the output too much. For larger systems the efficiency will be continuously monitored and will indicate when a cleaning is necessary. Methods with use of water as well as without water exist. Also new materials and coatings for the glass have been developed that should reduce the problem. For the purpose of the analysis in this report the reduction as a result of temperature has been set to 8 percent and the reduction caused by dust to 2 percent.

Appendix 7
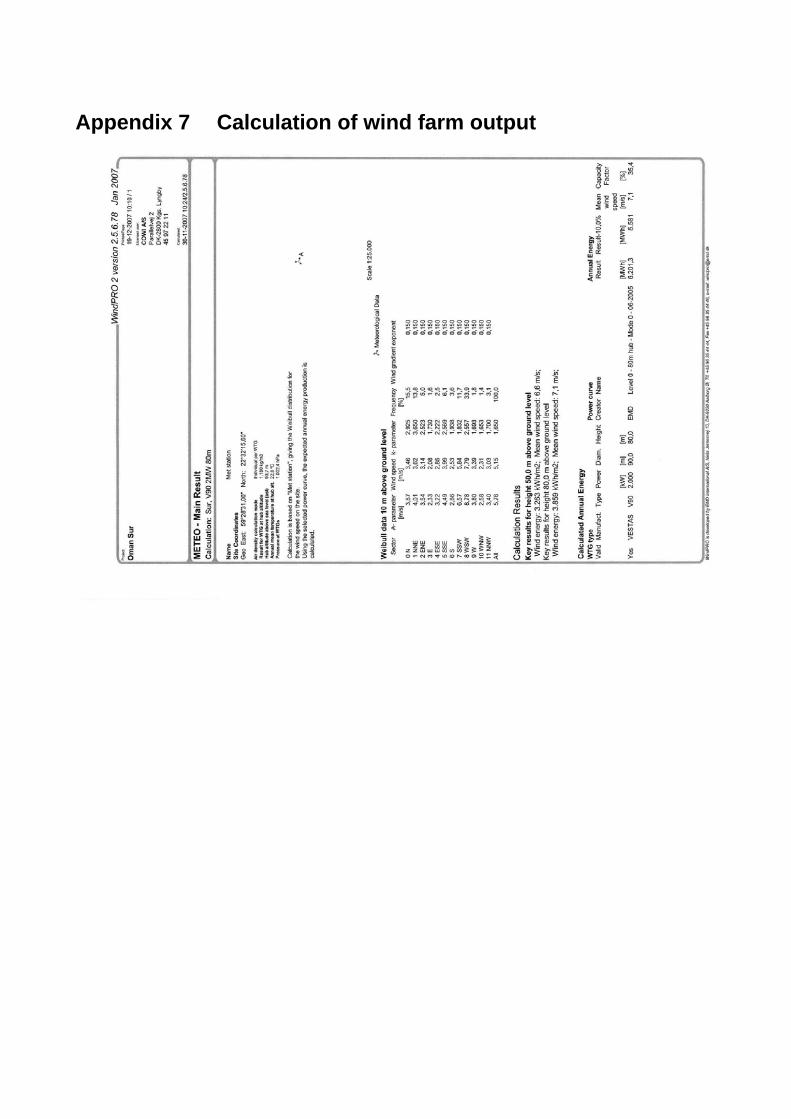
Appendix 7 Calculation of wind farm output


Appendix 8 and 9

Appendix 8 Electricity cost calculations
8.1 Cost analysis 20 MW solar PV system The size of 20 MW corresponds to the largest plants made in worldwide so far and represents of course a major investment, but very few risks as the technology is proven with a long record of results.
A plant of this size will not only provide a measureable input to the grid, but also stimulate the market and can be part of a strategy to introduce local production and build up an export capacity in the area, on hardware as well as on know how.
Further a plan of this size can play a major role as part of public awareness campaign as it will make renewable energy very visible.
Fig. 10.3 20 MW solar PV in Beneixama (Spain), Province Alicante
Outline design and technology The 20 MW PV system consist in principle of the following components:
• 20 MWp solar PV panels (approximately 200,000 m2 conventional panels) mounted in rows in a environment in the dessert.

• A 20 MW power converter to convert the DC from the panels to AC voltage for the grid.
• A connection to the grid including a power meter.
With a panel of 200,000 m2 the land area will be more than 500,000 m2, corresponding to more than 700 x 700 m.
Budget The following budget represents the market cost for the technology and does not include design, project management, monitoring, evaluation, reporting etc.
Action plan A small PV plant can be demonstrated in Oman on the basis of imported components. A major demonstration project like a 20 MW PV plant should incorporate development of local production and build up of local capacity on the various expertises involved in such plant in some kind of international business set up.
Oman has very many favourable locations for such PV plant which of course need to be located not too far from a sufficient grid connection.
Analysis The analysis below has been made with the PC programme HOMER ( Version 2.19, refer to https://analysis.nrel.gov/homer/) with the following assumptions.
• For the analysis of the performance the following has been used. • Cost of PV, 4000 USD per kW • Maintenance of PV, 0,5 % of investment per year. • Lifetime of PV, 25 years • Derating factor, 90% (10% losses due to high temperature, dust etc.) • Cost of converter, 350 USD per kW • Converter efficiency, 95 % • Life time of converter, 15 years, replacement cost 200 USD per kW. • Operation and maintenance cost of converter, 4 USD/year per kW • Scaled annual global insolation, 5.44 kWh/m2 • Calculation interest rate, 8 %. • Project life time, 25 years • Slope of panels, 25 degree. • Azimuth of PV, south facing. • Ground reflection, 20%
Component Initial Capital
USD
PV Array including mounting 80,000,000
Converter and connections 8,750,000
Totals 88,750,000

The cost break down is shown in below table. The major cost is the annualised cost of PV.
Component Initial
Capital Annualized
Capital Annualized
Replacement Annual O&M
Annual Fuel
Total Annualized
($) ($/yr) ($/yr) ($/yr) ($/yr) ($/yr) PV Array 80,000,000 7,494,302 0 400,000 0 7,894,302
Converter 8,750,000 819,689 124,859 100,000 0 1,044,549 Totals 88,750,000 8,313,992 124,859 500,000 0 8,938,851
The annual production of electricity with this system is calculated to 35850 MWh, corresponding to 1792 kWh per installed kW peak power. The production corresponds to about 0.3 % of the consumption in Oman.
This lead to a unit cost of 8,938,851 / 35,850 = 250 USD per MWh.

Appendix 9 List of R&D references and activities on renewable energy


Appendix 10, 11, 12 and 13

Appendix 10 Average production cost RAECO diesel generation stations
2006 Jan - Jun 2006
Al Wusta RO /kWh USD/kWh RO/kWh USD/kWh
Abu Mudabi 0,092 0,238 0,085 0,222
Al Kahal 0,081 0,210 0,077 0,201
Al khaluf
Al Khuiaima 0,077 0,200 0,075 0,195
Al Lakbi 0,078 0,203 0,075 0,195
Alajaiz 0,338 0,880
Al Najdah
Alnuhaidah
Al Zhalah 0,153 0,397 0,128 0,333
Hij 0,058 0,150 0,053 0,137
Hitam
Masirah 0,077 0,200
Masrooq 0,484 1,258
Ras Madraka 0,099 0,258 0,090 0,234
Sawgrah 0,104 0,272 0,092 0,239
Surab 1,435 3,732
Al Duqm 0,064 0,168 0,065 0,170
Total 0,077 0,200 0,069 0,180
Dhofar
Al Halaniyat 0,146 0,378 0,153 0,397
Al-Mathfa 0,317 0,824 0,311 0,808
Ayboot-1 0,181 0,470 0,190 0,494
Ayboot-2 0,220 0,572
Ayun 0,154 0,399 0,155 0,402
Barbazum 0,100 0,260 0,098 0,255
Dalkut A 0,065 0,168 0,065 0,169
Dalkut B
Dhahabun 0,077 0,199 0,079 0,205
Fakthat 0,299 0,777 0,315 0,819
Hasik 0,071 0,184 0,072 0,187
Hirweeb 0,094 0,244 0,090 0,235

Horaat 0,189 0,490 0,172 0,447
Mahwice 0,283 0,736 0,244 0,635
Maqshan 0,090 0,233 0,087 0,226
Mazyunah 0,065 0,170 0,057 0,148
Mitan 0,078 0,202 0,075 0,196
Mothorah
Mudhai 0,065 0,170 0,072 0,187
Rakbut 0,139 0,361 0,149 0,386
Raysut A+B
Saih Alkirat 0,049 0,127
Shahb Asayb 0,058 0,151 0,060 0,155
Sharbatat 0,084 0,220 0,083 0,215
Shasir 0,058 0,151 0,059 0,153
Tushnat 0,058 0,150 0,113 0,294
Total 0,072 0,187 0,044 0,115
Musandam
Al Rawda 0,131 0,340 0,119 0,310
Dibba 0,053 0,139 0,051 0,134
HB Hameed 0,265 0,690 0,259 0,674
Khasab 0,051 0,133 0,048 0,126
Kumzar 0,200 0,521 0,215 0,560
Madha 0,055 0,144 0,055 0,143
Total 0,053 0,137 0,050 0,130
Total RAECO 0,061 0,160 0,050 0,131

Appendix 11 Examples of Tax Credit Schemes Examples of national tax incentives for renewable energy Austria Private investors get tax credits for investments in using renewable energies (personal income tax). The amount is generally limited to about 3,000 € per year. Belgium 13.5 – 14% of RES-investments deductible from company profits, regressive depreciation of investments. Reduced VAT on building refurbishing if energy efficiency is included (6% instead of 21%). Denmark The first 3,000 DKK of income from wind energy are tax free. France A deduction of 15% investment costs with a maximum of 3000 € per person and reduced VAT (5.5%) on renewable equipment (not applicable to installation costs) is available. Germany Losses of investments can be deducted from the taxable income. This fact increases return on investments into wind projects. Greece Up to 75% of RES-investments can be deducted. Ireland Corporate Tax Incentive: tax relief capped at 50% of all capital expenditure for certain RES-investments. Portugal Up to 30% of any type of investments on RES can be deducted with a maximum of 700 € per year. A reduction in VAT (12%) on renewable equipment. Spain Corporation Tax: 10% (up to 20% in some autonomous regions) tax liability instead of 35% for investments in environment friendly fixed assets. The Netherlands EIA scheme: RES-investors (most renewable energy systems) are eligible to reduce their taxable profit with 55% of the invested sum. Lower interest rates from Green Funds: RES-investors (most renewable energy systems) can obtain lower interest rates (up to 1.5%) for their investments. Moreover, dividends gained are free of income tax for private investors.

Appendix 12 Details on 20 kW grid connected solar PV pilot project Analysis The analysis below has been made with the PC programme HOMER ( Version 2.19, refer to https://analysis.nrel.gov/homer/) with the following assumptions.
• For the analysis of the performance the following has been used. • Cost of PV, 6800 USD per kW • Maintenance of PV, 0 % • Lifetime of PV, 25 years • Derating factor, 90 % (10% losses due to high temperature, dust etc.) • Cost of converter, 700 USD per kW • Converter efficiency, 90 % • Life time of converter, 15 years, reinvestment cost 500 USD per kW • Operation and maintenance cost of converter, 7 USD/year per kW • Scaled annual global insolation, 5.44 kWh/m2 • Calculation interest rate, 8 %. • Project life time, 25 years • Slope of panels, 25 degree. • Azimuth of PV, south facing. • Ground reflection, 20%
The cost break down is shown in below table. The major cost is the annualised cost of PV.
The annual production of electricity with this system is calculated to 33962 kWh, corresponding to 1698 kWh per installed kW peak power.
This lead to a unit cost of 14442 / 33.962 = 425 USD per MWh.
The cost of PV is expected to drop significantly. The following graph show the influence of the cost on a reduction to 25 percent of today's cost.
Fig. A 12.1 Cost of electricity from a 20 kW PV system as a function of a drop in cost of PV and components.
Component
Initial Capital
Annualized Capital
Annualized Replacemen
t
Annual O&M
Annual Fuel
Total Annualiz
ed ($) ($/yr) ($/yr) ($/yr) ($/yr) ($/yr)
PV Array 136,000 12,740 0 0 0 12,740Converter 14,000 1,312 250 140 0 1,701
Totals 150,000 14,052 250 140 0 14,442

The production of electricity from PV panels depends of course of the orientation and slope of the panels. The following graph shows the influence of this on the levelised cost of electricity. The reference is the red circle. For Oman a slope from 0 to 30 degree is optimum. The slope should never be less than 15 so that water can drain off and clean the panels. For this small slope the production is rather independent on the azimuth meaning that the PV panels can be oriented freely. Only through north there is an increased cost. For vertical PV (on facades for example) it appears that the cost of production (the solar output) is increased considerably, in particular on north facades.
This calculation only consider the yearly production, the distribution over the year is also very dependent on the slope and orientation. Sloped PV panels tend to giver lower production in the summertime when demand is highest.
Fig. A 12.2 Levelized cost of electricity from a 20 kW grid connected PV system as a function of the slope (Y-axis, 0=horizontal, 90=vertical) and the azimuth (y-axis, 0=south, -90=Vest, 180= north).
0.4 0.6 0.8 1.00.0
0.1
0.2
0.3
0.4
0.5
$
Levelized Cost of Energy vs. PV Capital Multiplier
PV Capital Multiplier
FixedPV Slope = 25 degPV Azimuth = 0 deg

Appendix 13 Details on 10 kW PV/10 KW diesel hybrid pilot project Outline design and technology The demand is defined as an average of 10 kW over the year giving a total of 87600 kWh per year. The yearly load profile from Rural Area Electricity Company is used. There is no daily load profile available for rural areas and a load profile from the main grid on the 2nd of January and on the 25th of July has been used to represent the winter and the summer situation in rural areas. See below figure. In the summertime the peak is in night and late afternoon (air conditioning), in the "winter" time the much smaller peak is mid day and early evening (cooking).
Jan Feb Mar Apr May Jun Jul Aug Sep Oct Nov Dec2
4
6
8
10
12
14
16
18
Elec
tric
Loa
d (k
W)
Electric Load

July 270 6 12 18 24
2
4
6
8
10
12
14
16
18Electric Load
January 20 6 12 18 24
2
4
6
8
10
12
14
16
18Electric Load
Fig. A 13.1 Load profile for analysis of 10 kW off grid system. The top graph show yearly distribution with monthly max and minimum value of demand. The middle graph the daily profile for July 27 and the bottom graph for January 2nd.
The analysis is made on a number of assumptions listed below.
PV Capital cost 6800 USD per kW Operation and maintenance 68 USD per year per kW Lifetime: 25 yr Derating factor: 90% (10% losses) Slope: 25 Azimuth: 0 deg (south facing) Ground reflectance: 20% Generators Capital cost 780 USD per kW Replacement cost 500 USD per kW Sizes to consider: 1) 0, 5, 10, 15, 20 kW, 2) 0, 7, 12 Lifetime: 25,000 hrs Min. load ratio: 50% Fuel used: Diesel Fuel curve intercept: 0.08 L/hr/kW Fuel curve slope: 0.25 L/hr/kW

Diesel Price: $ 0.38, 0.57, 0.76, 1.52/L Lower heating value: 43.2 MJ/kg Density: 820 kg/m3 Battery: Willard RT9d - 50% DOD Capital cost 200 USD per battery Replacement cost 100 USD per battery Quantities to consider: 0, 5, 10, 20, 50, 100 Voltage: 2 V Nominal capacity: 254 Ah Lifetime throughput: 490 kWh Converter Capital cost 700 USD per kW Replacement cost 500 USD per kW Operation and maintenance 13 USD per year per kW Sizes to consider: 0, 2, 5, 10, 20, 30, 50 kW Lifetime: 15 yr Inverter efficiency: 90% Inverter can operate parallel with AC generator: Yes Rectifier relative capacity: 75% Rectifier efficiency: 85%
Economics Annual real interest rate: 8% Project lifetime: 25 yr Capacity shortage penalty: $ 0/kWh System fixed capital cost: $ 0 System fixed O&M cost: $ 0/yr Generator control Check cycle charging: Yes Setpoint state of charge: 80% Allow multiple generators to operate simultaneously: Yes Grid Extension Capital cost: $ 70,000/km O&M cost: $ 1,200/yr/km Power price: $ 0.04/kWh
For the operation of diesel systems it is important to consider that the fuel efficiency of the engine depends on the load. It is therefore important to run engines on full load and therefore often better to have two smaller engines or to include a battery storage wish will allow the engine to run on full load while charging the batteries. See Fig. A 13.2.

Fig. A 13.2 . Assumed fuel efficiency curve for diesel engines. It is further assumed that engines will not run on less than 50 % load.
The analysis made with HOMER identifies the combination of components (size and/or number) that will give the lowest levelized cost of energy. The optimum depends mainly on the specifications of the technologies involved, on the cost of these technologies, the cost of maintenance and replacements of equipment and on the fuel used. Not to mention the natural conditions and the demand that is typically kept constant for the analysis.
The cost of diesel in Oman is low and does not represent the cost of fuel for the 25 years of project lifetime which is considered here. Therefore a cost increase will be considered.
It is further expected that the cost of renewable energy will be reduced in the future. The analysis therefore includes cost reductions in order to be able to analyse the potential of these technologies sometimes in the future.
Optimal system type With today's cost and with the assumptions used in this case the optimum system is a combination with two diesel engines ( a 5 kW and a 12 kW engine, electric output) with 5 batteries and a 2 kW power converter. The levelized cost of energy is 236 USD/MWh. With 2 kW of PV providing 4 % of the power the levelized cost will increase to 242 USD/kWh and with 5 kW PV providing 10% of the power to about 260 USD per MWh.
With higher cost of diesel and with lower cost of PV solar PV will be part of the optimum solution. With for example a diesel cost of 1.5 USD per litre (as in Europe) PV will in the optimum system cover 12 percent of the demand even with today's cost of PV. With a reduction in cost of PV the percentage will increase to about 40% in the optimum system.
Cost break down As an example Table A 13.1 shows the cost break down for the system with 2 diesel engines, 5 kW PV and 20 batteries with a storage capacity of few hours of consumption. The total initial investment is 54,760 USD while the yearly annualized cost is 22,768 USD. The annualized cost per MWh is 260 USD and the PV covers 11 percent of the electricity.
Table A 13.1 Cost break down and production for the system Componen
t Initial
Capital Annualized
Capital Annualized
Replacement Annual O&M
Annual Fuel
Total Annualized
($) ($/yr) ($/yr) ($/yr) ($/yr) ($/yr) PV Array 34,000 3,185 0 340 0 3,525 Generator 1 7,800 731 866 2,694 6,372 10,662 Generator 2 5,460 511 700 2,117 4,131 7,460 Battery 4,000 375 251 40 0 666 Converter 3,500 328 62 65 0 455 Totals 54,760 5,130 1,880 5,255 10,503 22,768

Optimum without diesel If diesel is not included the installed PV capacity and battery capacity need to be very high in order to supply 100 % at any time. A shortage of more than 10 percent is probably not acceptable and the corresponding cost is about 1.0 USD/kWh of electricity. This is 4 times more expensive than the optimum system which include diesel. The reason for this is that the match between solar production and consumption is not optimal. Most important is that the consumption is much higher during the summer while the PV production is rather equal over the year. Therefore a large amount of PV produced in the winter time will not be utilized. For the system with 10 % shortage (cost 1.08 USD/kWh) the PV capacity is 75 kW, producing 141,000 kWh per year of which 28 percent is not used. A huge battery bank with 1500 batteries is included costing almost as much as the PV panels.
At an allowed capacity shortage of 70 %, meaning that 30% is supplied by solar the levelized cost is only half of the cost at 10% shortage allowed.
The conclusion is that such a system without diesel backup is not feasible technically as well as economically as the only system for supply of electricity with the demand defined. Only with a better match between production and consumption the system may be applicable.
Fig. A 13.5 Levelized cost of electricity supplied by a system with only solar PV and batteries as a function of the allowed capacity shortage.
0.0
0.5
1.0
1.5
2.0
0 20 40 60 80 1000.0
0.5
1.0
1.5
2.0
$
Levelized Cost of Energy vs. Max. Annual Capacity Shortage
Max. Annual Capacity Shortage (%)
Levelized Cost of Energy ($/kW
h)
Levelized Cost of EnergyLevelized Cost of Energy
FixedPV Capital Multiplier = 1