study the flow behind a semi-circular step cylinder (laser...
TRANSCRIPT

energies
Article
Study the Flow behind a Semi-Circular Step Cylinder(Laser Doppler Velocimetry (LDV) andComputational Fluid Dynamics (CFD))
S. M. Sayeed-Bin-Asad *, Tord Staffan Lundström and Anders Gustav Andersson
Division of Fluid and Experimental Mechanics, Luleå University of Technology, SE-971 87 Luleå, Sweden;[email protected] (T.S.L.); [email protected] (A.G.A.)* Correspondence: [email protected]; Tel.: +46-920-492-886
Academic Editor: Bjørn H. HjertagerReceived: 1 February 2017; Accepted: 6 March 2017; Published: 9 March 2017
Abstract: Laser Doppler Velocimetry (LDV) measurements, flow visualizations and unsteadyReynolds-Averaged Navier-Stokes (RANS) Computational Fluid Dynamics (CFD) simulations havebeen carried out to study the turbulent wake that is formed behind a semi-circular step cylinder ata constant flow rate. The semi-circular cylinder has two diameters, a so-called step cylinder. Theresults from the LDV measurements indicate that wake length and vortex shedding frequency varieswith the cylinder diameter. This implies that a step cylinder can be used to attract fish of differentsize. By visualizations of the formation of a recirculation region and the well-known von Kármánvortex street behind the cylinder are disclosed. The simulation results predict the wake length andshedding frequency well for the flow behind the large cylinder but fail to capture the dynamics ofthe flow near the step in diameter to some extent and the flow behind the small cylinder to a largerextent when compared with measurements.
Keywords: laser doppler velocimetry (LDV); computational fluid dynamics (CFD); fish migration;step cylinder; shedding; vortex street
1. Introduction
Hydro and nuclear power are the major sources of electricity in Sweden. Swedish Energy [1]has recently published some statistics regarding power production in Sweden showing that hydroand nuclear power stand for 47% and 34% of the total electricity in Sweden, respectively. In order toincrease the percentage renewable energy overall, to keep the target of greenhouse gas emission [2],systems are constantly developed to harvest wind, wave, tidal, and solar energy. These sources ofenergy are typically irregular and continuous power production is required to cover for this irregularity.The availability, storage capacity, and flexibility of hydropower make it a perfect contender for thepower regulation role. However, hydropower has some local impacts on the environment, such ascreating dams in rivers and changing water flow directions, which lead to some problems for faunapassage, in general, and migrating fishes, in particular. Fish migration issues are mostly studied froma biological point of view and more detailed studies from a fundamental fluid mechanics point of viewcould lead to new insights and solutions.
Some hydropower dams have fishways or fish ladders to allow fish to migrate past dams,as well as past rotating turbines and, during swimming or passing this fishway or fish ladder, fishhave to tackle different flow obstructions or disturbances, like turbine intakes, stones, and concretestructures. Fluid flow characteristics in fish ladders or fishways during fish migration are crucial whendesigning effective fishways so that fishes migrate in an efficient way. Studies [3–7] have shown thatcylindrical obstructions can be used to create favorable conditions for upstream migrating fishes of
Energies 2017, 10, 332; doi:10.3390/en10030332 www.mdpi.com/journal/energies

Energies 2017, 10, 332 2 of 13
appropriate size. The concept is to create periodic vortices that the fish uses in an energy efficient way(less energy than in a free stream) to maintain a position in the flow. Liao [8] describes the structureof the flow around a half cylinder and the positions of fish swimming within the wake behind andaround the cylinder. It was found that the fishes exploit the flow conditions created by the semicircularcylinder when swimming upstream around it. Apart from this, Liao discovered the altered sheddingfrequencies and wakes for various cylinder diameters. Different sizes of fish exploit vortices withdifferent shedding frequencies. Therefore, it is important to have proper shedding for appropriatesizes of fish to swim past obstructions.
There are many applications for step full cylinders, including airport control towers, street lampposts, antenna members and radio communication towers. Hence, there are several driving forces forengineers to examine this type of flow phenomena, both numerically and experimentally.
Dunn et al. [9] carried out velocity measurement with laser doppler velocimetry (LDV) and flowvisualization around a step cylinder. One result is that the recirculation near a step has significanteffects on the shedding frequencies as compared to locations away from the step. Similarly, anotherstudy from Dunn et al. [10] also found significant effects of free-stream shearing on vortex-sheddingcharacteristics from a step-cylinder. Chris Morton et al. [11–16] carried out several studies usingboth numerical and experimental with 2D and 3D particle image velocimetry (PIV) investigationson step cylinders, such as single step dual step, etc. Detailed studies of the wake vortex dynamicsbehind step-cylinder are provided. He [17] has recently used tomographic-PIV (3D-PIV) behind a stepcylinder for three-dimensional (3D) information of vortex shedding. Rafati [18] conducted a series ofexperimental studies with various diameters of step cylinders using tomographic-PIV measurement.One result is that for high flow (higher velocity than free stream velocity), streamwise vortices areintroduced into the wake that complicates the vortex dynamic, and vortex interactions. Rafati [18] alsoproduced a table of studies on step cylinders available (Table 1).
Table 1. Previous studies on flow behind step cylinders. Reproduced from [18].
Study ReD D/d
N.Ko et al. [19] 8 × 10⁴ 2Yagita et al. [20] 8 × 10²–104 1.25–5Lewis et al. [21] 67–200 1.14–1.76Dunn et al. [10] 62–1230 2
Norberg [22] 3 × 10³–13 × 103 1.25–2N.Ko et al. (1984, 1990, 1992) [23–25] 8 × 10⁴ 1.33–2.78
Chua et al. [26] 4.72 × 10³ 3Morton et al. [11,27,28] 150–2100 2
Dunn et al. [9] (span-wise sheared flow) 152–764 1.92
Despite having some investigations of flow behavior around stepped cylinders, little or noscientific works, especially experimental, on half cylinders with steps has been performed. Therefore,in the current study the flow around such an object is studied with LDV and computational fluiddynamics (CFD). The flow dynamics of the step and diameter change is interesting from a fluidmechanics point of view but as the half cylinders also have shown to be interesting for fish migration,the difference in wake formation and shedding of vortices behind the different cylinder diameterscould also be designed to fit different sizes and species of fish.
2. Experimental Arrangement
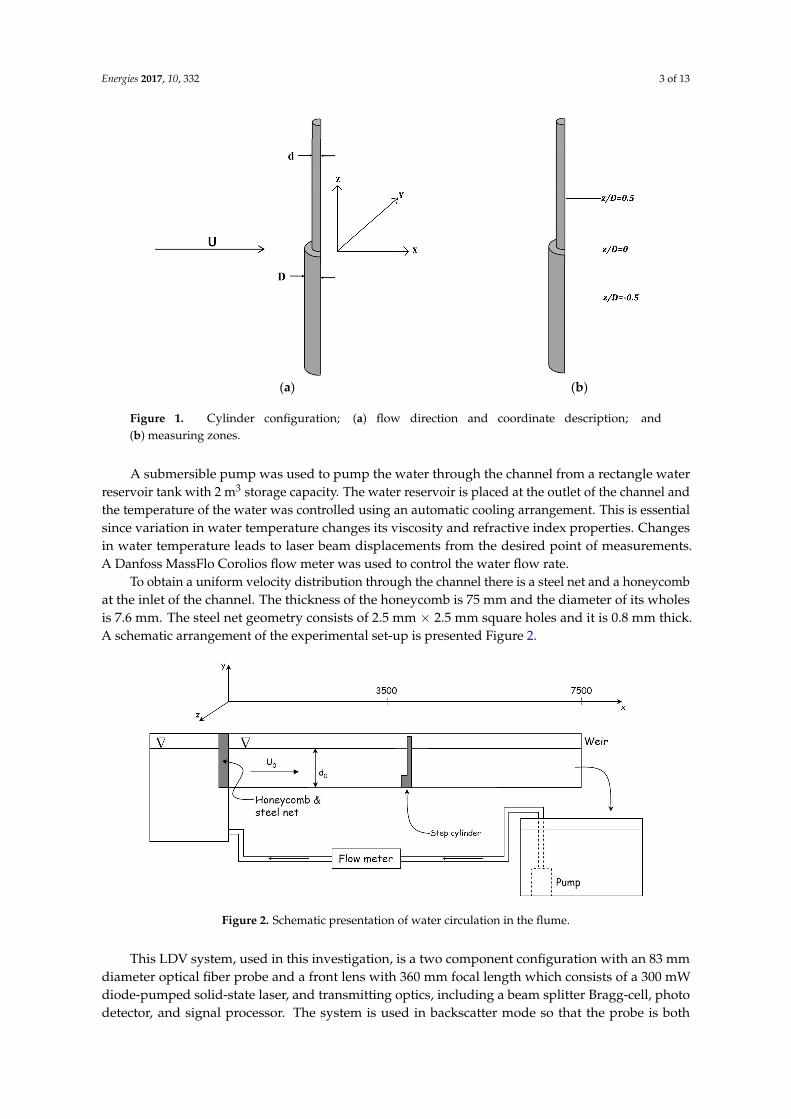
Experiments were carried out in a water flume at the John Field Laboratory at Luleå Universityof Technology, Sweden. The flume is 7.5 m long with a cross-section of 0.295 m × 0.310 m. Thesemi-circular step cylinder employed in this investigation is made of acetal (POM) and the diameterof the small (d) and large (D) cylinders are 50 mm and 100 mm, respectively. Figure 1 describes theconfiguration and measuring zones of the cylinder centerline.
Energies 2017, 10, 332 3 of 13
Energies 2017, 10, 332 3 of 13
and the temperature of the water was controlled using an automatic cooling arrangement. This is essential since variation in water temperature changes its viscosity and refractive index properties. Changes in water temperature leads to laser beam displacements from the desired point of measurements. A Danfoss MassFlo Corolios flow meter was used to control the water flow rate.
(a) (b)
Figure 1. Cylinder configuration; (a) flow direction and coordinate description; and (b) measuring zones.
To obtain a uniform velocity distribution through the channel there is a steel net and a honeycomb at the inlet of the channel. The thickness of the honeycomb is 75 mm and the diameter of its wholes is 7.6 mm. The steel net geometry consists of 2.5 mm × 2.5 mm square holes and it is 0.8 mm thick. A schematic arrangement of the experimental set-up is presented Figure 2.
Figure 2. Schematic presentation of water circulation in the flume.
This LDV system, used in this investigation, is a two component configuration with an 83 mm diameter optical fiber probe and a front lens with 360 mm focal length which consists of a 300 mW diode-pumped solid-state laser, and transmitting optics, including a beam splitter Bragg-cell, photo detector, and signal processor. The system is used in backscatter mode so that the probe is both transmitting and receiving signals. The laser has two channels with a wavelength of 532 and 561 nm, respectively. The laser power is 300 mW for each channel. The smallest dimensions of the measurement volume are approximately 0.123 × 0.117 mm2 for both colors, and the system is operated in coincidence mode, which ensures correlated velocity components. The water was seeded with polyamide particles with a diameter of 5 μm (Dantec’s PSP-5). TSI’s FlowSizer 64
Figure 1. Cylinder configuration; (a) flow direction and coordinate description; and(b) measuring zones.
A submersible pump was used to pump the water through the channel from a rectangle waterreservoir tank with 2 m3 storage capacity. The water reservoir is placed at the outlet of the channel andthe temperature of the water was controlled using an automatic cooling arrangement. This is essentialsince variation in water temperature changes its viscosity and refractive index properties. Changesin water temperature leads to laser beam displacements from the desired point of measurements.A Danfoss MassFlo Corolios flow meter was used to control the water flow rate.
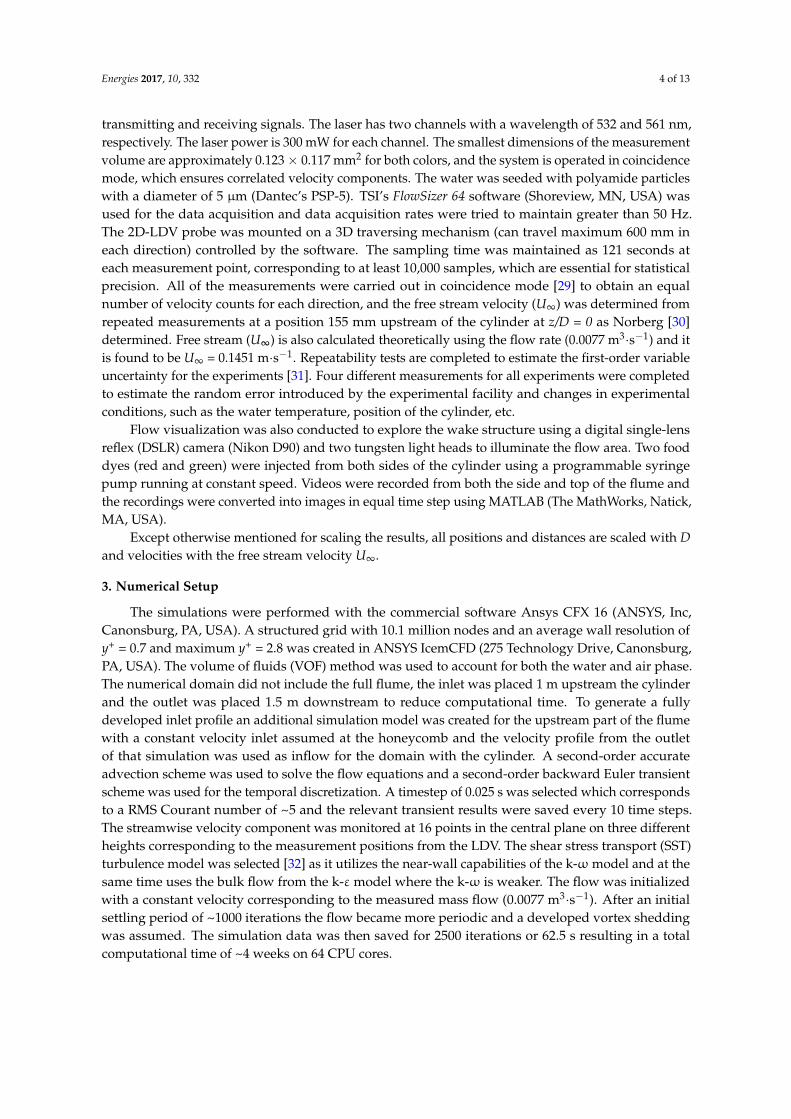
To obtain a uniform velocity distribution through the channel there is a steel net and a honeycombat the inlet of the channel. The thickness of the honeycomb is 75 mm and the diameter of its wholesis 7.6 mm. The steel net geometry consists of 2.5 mm × 2.5 mm square holes and it is 0.8 mm thick.A schematic arrangement of the experimental set-up is presented Figure 2.
Energies 2017, 10, 332 3 of 13
and the temperature of the water was controlled using an automatic cooling arrangement. This is essential since variation in water temperature changes its viscosity and refractive index properties. Changes in water temperature leads to laser beam displacements from the desired point of measurements. A Danfoss MassFlo Corolios flow meter was used to control the water flow rate.
(a) (b)
Figure 1. Cylinder configuration; (a) flow direction and coordinate description; and (b) measuring zones.
To obtain a uniform velocity distribution through the channel there is a steel net and a honeycomb at the inlet of the channel. The thickness of the honeycomb is 75 mm and the diameter of its wholes is 7.6 mm. The steel net geometry consists of 2.5 mm × 2.5 mm square holes and it is 0.8 mm thick. A schematic arrangement of the experimental set-up is presented Figure 2.
Figure 2. Schematic presentation of water circulation in the flume.
This LDV system, used in this investigation, is a two component configuration with an 83 mm diameter optical fiber probe and a front lens with 360 mm focal length which consists of a 300 mW diode-pumped solid-state laser, and transmitting optics, including a beam splitter Bragg-cell, photo detector, and signal processor. The system is used in backscatter mode so that the probe is both transmitting and receiving signals. The laser has two channels with a wavelength of 532 and 561 nm, respectively. The laser power is 300 mW for each channel. The smallest dimensions of the measurement volume are approximately 0.123 × 0.117 mm2 for both colors, and the system is operated in coincidence mode, which ensures correlated velocity components. The water was seeded with polyamide particles with a diameter of 5 μm (Dantec’s PSP-5). TSI’s FlowSizer 64
Figure 2. Schematic presentation of water circulation in the flume.
This LDV system, used in this investigation, is a two component configuration with an 83 mmdiameter optical fiber probe and a front lens with 360 mm focal length which consists of a 300 mWdiode-pumped solid-state laser, and transmitting optics, including a beam splitter Bragg-cell, photodetector, and signal processor. The system is used in backscatter mode so that the probe is both
Energies 2017, 10, 332 4 of 13
transmitting and receiving signals. The laser has two channels with a wavelength of 532 and 561 nm,respectively. The laser power is 300 mW for each channel. The smallest dimensions of the measurementvolume are approximately 0.123 × 0.117 mm2 for both colors, and the system is operated in coincidencemode, which ensures correlated velocity components. The water was seeded with polyamide particleswith a diameter of 5 µm (Dantec’s PSP-5). TSI’s FlowSizer 64 software (Shoreview, MN, USA) wasused for the data acquisition and data acquisition rates were tried to maintain greater than 50 Hz.The 2D-LDV probe was mounted on a 3D traversing mechanism (can travel maximum 600 mm ineach direction) controlled by the software. The sampling time was maintained as 121 seconds ateach measurement point, corresponding to at least 10,000 samples, which are essential for statisticalprecision. All of the measurements were carried out in coincidence mode [29] to obtain an equalnumber of velocity counts for each direction, and the free stream velocity (U∞) was determined fromrepeated measurements at a position 155 mm upstream of the cylinder at z/D = 0 as Norberg [30]determined. Free stream (U∞) is also calculated theoretically using the flow rate (0.0077 m3·s−1) and itis found to be U∞ = 0.1451 m·s−1. Repeatability tests are completed to estimate the first-order variableuncertainty for the experiments [31]. Four different measurements for all experiments were completedto estimate the random error introduced by the experimental facility and changes in experimentalconditions, such as the water temperature, position of the cylinder, etc.
Flow visualization was also conducted to explore the wake structure using a digital single-lensreflex (DSLR) camera (Nikon D90) and two tungsten light heads to illuminate the flow area. Two fooddyes (red and green) were injected from both sides of the cylinder using a programmable syringepump running at constant speed. Videos were recorded from both the side and top of the flume andthe recordings were converted into images in equal time step using MATLAB (The MathWorks, Natick,MA, USA).
Except otherwise mentioned for scaling the results, all positions and distances are scaled with Dand velocities with the free stream velocity U∞.
3. Numerical Setup
The simulations were performed with the commercial software Ansys CFX 16 (ANSYS, Inc,Canonsburg, PA, USA). A structured grid with 10.1 million nodes and an average wall resolution ofy+ = 0.7 and maximum y+ = 2.8 was created in ANSYS IcemCFD (275 Technology Drive, Canonsburg,PA, USA). The volume of fluids (VOF) method was used to account for both the water and air phase.The numerical domain did not include the full flume, the inlet was placed 1 m upstream the cylinderand the outlet was placed 1.5 m downstream to reduce computational time. To generate a fullydeveloped inlet profile an additional simulation model was created for the upstream part of the flumewith a constant velocity inlet assumed at the honeycomb and the velocity profile from the outletof that simulation was used as inflow for the domain with the cylinder. A second-order accurateadvection scheme was used to solve the flow equations and a second-order backward Euler transientscheme was used for the temporal discretization. A timestep of 0.025 s was selected which correspondsto a RMS Courant number of ~5 and the relevant transient results were saved every 10 time steps.The streamwise velocity component was monitored at 16 points in the central plane on three differentheights corresponding to the measurement positions from the LDV. The shear stress transport (SST)turbulence model was selected [32] as it utilizes the near-wall capabilities of the k-ω model and at thesame time uses the bulk flow from the k-εmodel where the k-ω is weaker. The flow was initializedwith a constant velocity corresponding to the measured mass flow (0.0077 m3·s−1). After an initialsettling period of ~1000 iterations the flow became more periodic and a developed vortex sheddingwas assumed. The simulation data was then saved for 2500 iterations or 62.5 s resulting in a totalcomputational time of ~4 weeks on 64 CPU cores.
Energies 2017, 10, 332 5 of 13
4. Results and Discussion
Migrating fishes swimming around cylindrical obstructions face vortices and, interestingly, thesevortices provide extra energy to fishes to improve their swimming abilities. These vortices areinfluenced by wake and shedding frequency, but these wake and vortex shedding frequencies aregreatly dependent on the cylinder diameter [8]. A cylinder with different diameters, such as a stepcylinder, could generate an interesting flow behind it and variable wake and shedding frequencies.This warrants this study of wake and vortex shedding behind a semicircular step cylinder with LDVand CFD.
4.1. Wake
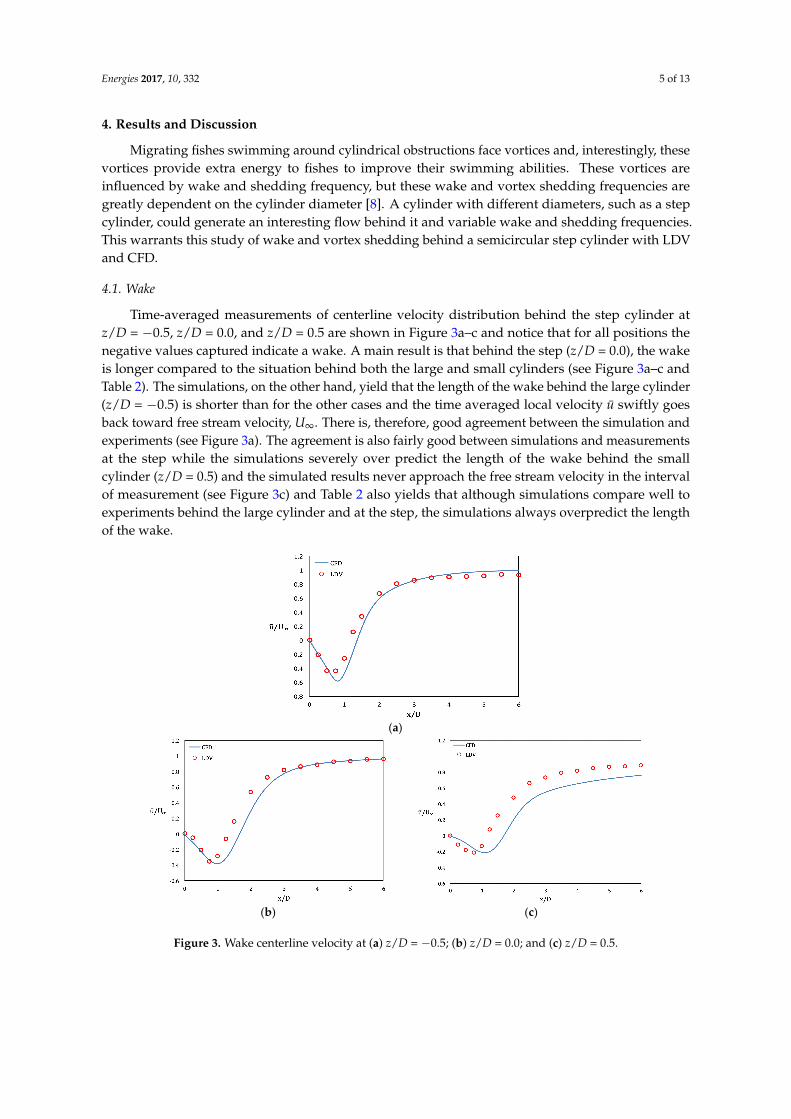
Time-averaged measurements of centerline velocity distribution behind the step cylinder atz/D = −0.5, z/D = 0.0, and z/D = 0.5 are shown in Figure 3a–c and notice that for all positions thenegative values captured indicate a wake. A main result is that behind the step (z/D = 0.0), the wakeis longer compared to the situation behind both the large and small cylinders (see Figure 3a–c andTable 2). The simulations, on the other hand, yield that the length of the wake behind the large cylinder(z/D = −0.5) is shorter than for the other cases and the time averaged local velocity u swiftly goesback toward free stream velocity, U∞. There is, therefore, good agreement between the simulation andexperiments (see Figure 3a). The agreement is also fairly good between simulations and measurementsat the step while the simulations severely over predict the length of the wake behind the smallcylinder (z/D = 0.5) and the simulated results never approach the free stream velocity in the intervalof measurement (see Figure 3c) and Table 2 also yields that although simulations compare well toexperiments behind the large cylinder and at the step, the simulations always overpredict the lengthof the wake.
Energies 2017, 10, 332 5 of 13
4.1. Wake
Time-averaged measurements of centerline velocity distribution behind the step cylinder at z/D = −0.5, z/D = 0.0, and z/D = 0.5 are shown in Figure 3a–c and notice that for all positions the negative values captured indicate a wake. A main result is that behind the step (z/D = 0.0), the wake is longer compared to the situation behind both the large and small cylinders (see Figure 3a–c and Table 2). The simulations, on the other hand, yield that the length of the wake behind the large cylinder (z/D = −0.5) is shorter than for the other cases and the time averaged local velocity ū swiftly goes back toward free stream velocity, U∞. There is, therefore, good agreement between the simulation and experiments (see Figure 3a). The agreement is also fairly good between simulations and measurements at the step while the simulations severely over predict the length of the wake behind the small cylinder (z/D = 0.5) and the simulated results never approach the free stream velocity in the interval of measurement (see Figure 3c) and Table 2 also yields that although simulations compare well to experiments behind the large cylinder and at the step, the simulations always overpredict the length of the wake.
(a)
(b) (c)
Figure 3. Wake centerline velocity at (a) z/D = −0.5; (b) z/D = 0.0; and (c) z/D = 0.5.
Table 2. Wake length behind the step cylinder.
Description Position (z/D) Case Position (x/D) Wake Length (mm)
Downward 50 mm −0.5 CFD 1.4 139 LDV 1.25 125
Along step 0 CFD 1.7 169 LDV 1.5 150
Upward 50 mm 0.5 CFD 1.76 176 LDV 1.25 125
The wake behind the cylinder can be qualitatively visualized by the average of streamwise velocity as derived in the simulations, as seen in Figure 4. The wake is symmetrical in the horizontal
Figure 3. Wake centerline velocity at (a) z/D = −0.5; (b) z/D = 0.0; and (c) z/D = 0.5.
Energies 2017, 10, 332 6 of 13
Table 2. Wake length behind the step cylinder.
Description Position (z/D) Case Position (x/D) Wake Length (mm)
Downward 50 mm −0.5CFD 1.4 139LDV 1.25 125
Along step 0CFD 1.7 169LDV 1.5 150
Upward 50 mm 0.5CFD 1.76 176LDV 1.25 125
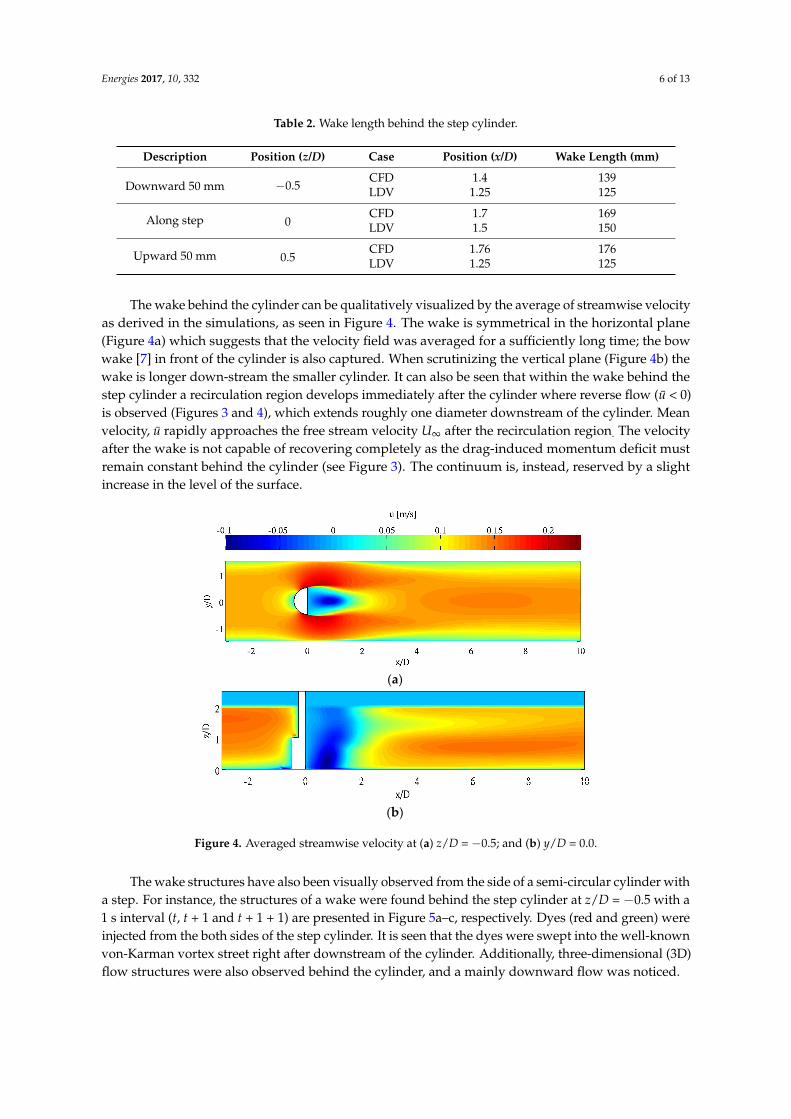
The wake behind the cylinder can be qualitatively visualized by the average of streamwise velocityas derived in the simulations, as seen in Figure 4. The wake is symmetrical in the horizontal plane(Figure 4a) which suggests that the velocity field was averaged for a sufficiently long time; the bowwake [7] in front of the cylinder is also captured. When scrutinizing the vertical plane (Figure 4b) thewake is longer down-stream the smaller cylinder. It can also be seen that within the wake behind thestep cylinder a recirculation region develops immediately after the cylinder where reverse flow (u < 0)is observed (Figures 3 and 4), which extends roughly one diameter downstream of the cylinder. Meanvelocity, u rapidly approaches the free stream velocity U∞ after the recirculation region. The velocityafter the wake is not capable of recovering completely as the drag-induced momentum deficit mustremain constant behind the cylinder (see Figure 3). The continuum is, instead, reserved by a slightincrease in the level of the surface.
Energies 2017, 10, 332 6 of 13
plane (Figure 4a) which suggests that the velocity field was averaged for a sufficiently long time; the bow wake [7] in front of the cylinder is also captured. When scrutinizing the vertical plane (Figure 4b) the wake is longer down-stream the smaller cylinder. It can also be seen that within the wake behind the step cylinder a recirculation region develops immediately after the cylinder where reverse flow (ū < 0) is observed (Figures 3 and 4), which extends roughly one diameter downstream of the cylinder. Mean velocity, ū rapidly approaches the free stream velocity U∞ after the recirculation region. The velocity after the wake is not capable of recovering completely as the drag-induced momentum deficit must remain constant behind the cylinder (see Figure 3). The continuum is, instead, reserved by a slight increase in the level of the surface.
(a)
(b)
Figure 4. Averaged streamwise velocity at (a) z/D = −0.5; and (b) y/D = 0.0.
The wake structures have also been visually observed from the side of a semi-circular cylinder with a step. For instance, the structures of a wake were found behind the step cylinder at z/D = −0.5 with a 1 s interval (t, t + 1 and t + 1 + 1) are presented in Figure 5a–c, respectively. Dyes (red and green) were injected from the both sides of the step cylinder. It is seen that the dyes were swept into the well-known von-Karman vortex street right after downstream of the cylinder. Additionally, three-dimensional (3D) flow structures were also observed behind the cylinder, and a mainly downward flow was noticed.
(a)
Figure 4. Averaged streamwise velocity at (a) z/D = −0.5; and (b) y/D = 0.0.
The wake structures have also been visually observed from the side of a semi-circular cylinder witha step. For instance, the structures of a wake were found behind the step cylinder at z/D = −0.5 with a1 s interval (t, t + 1 and t + 1 + 1) are presented in Figure 5a–c, respectively. Dyes (red and green) wereinjected from the both sides of the step cylinder. It is seen that the dyes were swept into the well-knownvon-Karman vortex street right after downstream of the cylinder. Additionally, three-dimensional (3D)flow structures were also observed behind the cylinder, and a mainly downward flow was noticed.

Energies 2017, 10, 332 7 of 13
Energies 2017, 10, 332 6 of 13
plane (Figure 4a) which suggests that the velocity field was averaged for a sufficiently long time; the bow wake [7] in front of the cylinder is also captured. When scrutinizing the vertical plane (Figure 4b) the wake is longer down-stream the smaller cylinder. It can also be seen that within the wake behind the step cylinder a recirculation region develops immediately after the cylinder where reverse flow (ū < 0) is observed (Figures 3 and 4), which extends roughly one diameter downstream of the cylinder. Mean velocity, ū rapidly approaches the free stream velocity U∞ after the recirculation region. The velocity after the wake is not capable of recovering completely as the drag-induced momentum deficit must remain constant behind the cylinder (see Figure 3). The continuum is, instead, reserved by a slight increase in the level of the surface.
(a)
(b)
Figure 4. Averaged streamwise velocity at (a) z/D = −0.5; and (b) y/D = 0.0.
The wake structures have also been visually observed from the side of a semi-circular cylinder with a step. For instance, the structures of a wake were found behind the step cylinder at z/D = −0.5 with a 1 s interval (t, t + 1 and t + 1 + 1) are presented in Figure 5a–c, respectively. Dyes (red and green) were injected from the both sides of the step cylinder. It is seen that the dyes were swept into the well-known von-Karman vortex street right after downstream of the cylinder. Additionally, three-dimensional (3D) flow structures were also observed behind the cylinder, and a mainly downward flow was noticed.
(a)Energies 2017, 10, 332 7 of 13
(b)
(c)
Figure 5. Wake structures around step cylinder at z/D = −0.5; (a) [t = 0]; (b) [t + 1]; (c) [t + 1 + 1].
4.2. Vortex Shedding
The vortex shedding behind the cylinder cannot be described with averaged data. Therefore, Figure 6 shows an instant velocity field captured at the final time step of the simulation (t = 87.5 s) for the horizontal planes in the center of the large cylinder, small cylinder, and at the cylinder step, respectively. As seen there is a clear shedding for all planes. The impacts of channel blockage, i.e., the ratio of the cylinder diameter (D or d) to channel width (W) should be taken into consideration. The blockage ratio, D/W and d/W, are 0.34 and 0.17 for large and small cylinders, respectively, in this study.
(a)
(b)
Figure 5. Wake structures around step cylinder at z/D = −0.5; (a) [t = 0]; (b) [t + 1]; (c) [t + 1 + 1].
4.2. Vortex Shedding
The vortex shedding behind the cylinder cannot be described with averaged data. Therefore,Figure 6 shows an instant velocity field captured at the final time step of the simulation (t = 87.5 s)for the horizontal planes in the center of the large cylinder, small cylinder, and at the cylinder step,respectively. As seen there is a clear shedding for all planes. The impacts of channel blockage, i.e.,the ratio of the cylinder diameter (D or d) to channel width (W) should be taken into consideration.The blockage ratio, D/W and d/W, are 0.34 and 0.17 for large and small cylinders, respectively,in this study.
Energies 2017, 10, 332 8 of 13
Energies 2017, 10, 332 7 of 13
(b)
(c)
Figure 5. Wake structures around step cylinder at z/D = −0.5; (a) [t = 0]; (b) [t + 1]; (c) [t + 1 + 1].
4.2. Vortex Shedding
The vortex shedding behind the cylinder cannot be described with averaged data. Therefore, Figure 6 shows an instant velocity field captured at the final time step of the simulation (t = 87.5 s) for the horizontal planes in the center of the large cylinder, small cylinder, and at the cylinder step, respectively. As seen there is a clear shedding for all planes. The impacts of channel blockage, i.e., the ratio of the cylinder diameter (D or d) to channel width (W) should be taken into consideration. The blockage ratio, D/W and d/W, are 0.34 and 0.17 for large and small cylinders, respectively, in this study.
(a)
(b)
Energies 2017, 10, 332 8 of 13
(c)
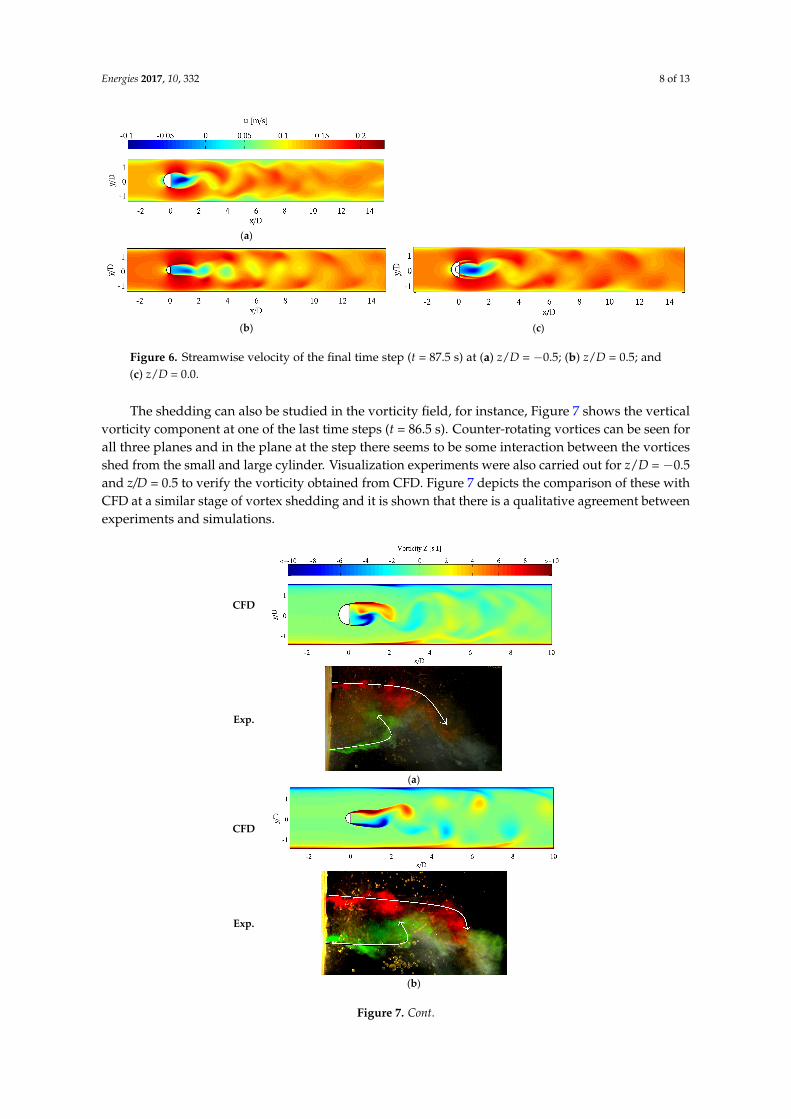
Figure 6. Streamwise velocity of the final time step (t = 87.5 s) at (a) z/D = −0.5; (b) z/D = 0.5; and (c) z/D = 0.0.
The shedding can also be studied in the vorticity field, for instance, Figure 7 shows the vertical vorticity component at one of the last time steps (t = 86.5 s). Counter-rotating vortices can be seen for all three planes and in the plane at the step there seems to be some interaction between the vortices shed from the small and large cylinder. Visualization experiments were also carried out for z/D = −0.5 and z/D = 0.5 to verify the vorticity obtained from CFD. Figure 7 depicts the comparison of these with CFD at a similar stage of vortex shedding and it is shown that there is a qualitative agreement between experiments and simulations.
Another interesting variable is the fluid pressure. Figure 8 shows the pressure in the final time step at z/D = −0.5 and z/D = 0.5. Zones where the pressure is lower than the surrounding pressure can be found throughout the vortex street, which could be of some importance when predicting and describing fish movement in this type of flow.
CFD
Exp.
(a)
CFD
Exp.
(b)
Figure 6. Streamwise velocity of the final time step (t = 87.5 s) at (a) z/D = −0.5; (b) z/D = 0.5; and(c) z/D = 0.0.
The shedding can also be studied in the vorticity field, for instance, Figure 7 shows the verticalvorticity component at one of the last time steps (t = 86.5 s). Counter-rotating vortices can be seen forall three planes and in the plane at the step there seems to be some interaction between the vorticesshed from the small and large cylinder. Visualization experiments were also carried out for z/D = −0.5and z/D = 0.5 to verify the vorticity obtained from CFD. Figure 7 depicts the comparison of these withCFD at a similar stage of vortex shedding and it is shown that there is a qualitative agreement betweenexperiments and simulations.
Energies 2017, 10, 332 8 of 13
(c)
Figure 6. Streamwise velocity of the final time step (t = 87.5 s) at (a) z/D = −0.5; (b) z/D = 0.5; and (c) z/D = 0.0.
The shedding can also be studied in the vorticity field, for instance, Figure 7 shows the vertical vorticity component at one of the last time steps (t = 86.5 s). Counter-rotating vortices can be seen for all three planes and in the plane at the step there seems to be some interaction between the vortices shed from the small and large cylinder. Visualization experiments were also carried out for z/D = −0.5 and z/D = 0.5 to verify the vorticity obtained from CFD. Figure 7 depicts the comparison of these with CFD at a similar stage of vortex shedding and it is shown that there is a qualitative agreement between experiments and simulations.
Another interesting variable is the fluid pressure. Figure 8 shows the pressure in the final time step at z/D = −0.5 and z/D = 0.5. Zones where the pressure is lower than the surrounding pressure can be found throughout the vortex street, which could be of some importance when predicting and describing fish movement in this type of flow.
CFD
Exp.
(a)
CFD
Exp.
(b)
Figure 7. Cont.

Energies 2017, 10, 332 9 of 13Energies 2017, 10, 332 9 of 13
CFD
(c)
Figure 7. Vertical vorticity component (t = 86.5 s) at (a) z/D = −0.5; (b) z/D = 0.5; and (c) z/D = 0.0 along with the experimental visualization for z/D = −0.5 and z/D = 0.5.
(a)
(b)
Figure 8. Fluid pressure at the final time step (t = 87.5 s) at (a) z/D = −0.5; and (b) z/D = 0.5.
The shedding frequency (f) was determined from the velocity spectra using the fast Fourier transform (FFT). The concept of LDV is that measurements are carried out if a particle travels through the volume of measurement, meaning that often there is, no signal available [33–35]. Thus, sampling data from LDV are random offering challenges for the estimation of the power spectrum. Nobach [29,31,36] described the details of up-to-date available methods to analyze the frequency spectrum from arbitrarily sampled data acquired by LDV measurements.
The estimation of power spectra presented in this paper is the interpolation of the arbitrarily or randomly sampled LDV data to obtain a uniform velocity over time, which is then re-sampled in equal steps with a known sampling frequency close to the average sampling frequency. The mean velocity for each signal was then subtracted as the fluctuations around the mean u’ describing the periodicity. The dominant peak in each spectrum is then assumed to correspond to the vortex shedding frequency (f).
The shedding frequency for the large cylinder and step are evaluated at x/D = 2.5, y/D = 0.75 and the shedding frequency from the small cylinder at x/d = 2.5 and y/d = 0.75, see Figure 9. For the shedding behind the large cylinder the dominating peak gives f = 0.34 Hz for the experiments and f = 0.38 Hz for the simulations corresponding to Strouhal numbers StLDV = fD/U∞ ≈ 0.234 and StCFD ≈ 0.262 which can be considered to be in good agreement. For the shedding behind the smaller cylinder the simulation gives the same frequency as behind the large cylinder whereas the LDV gives a peak at f = 0.6 Hz which is more consistent with other studies [37–39] behind fully-circular stepped cylinders. For the shedding behind the step, the experiments yield two dominant peaks, one at f = 0.36 Hz,
Figure 7. Vertical vorticity component (t = 86.5 s) at (a) z/D = −0.5; (b) z/D = 0.5; and (c) z/D = 0.0along with the experimental visualization for z/D = −0.5 and z/D = 0.5.
Another interesting variable is the fluid pressure. Figure 8 shows the pressure in the final timestep at z/D = −0.5 and z/D = 0.5. Zones where the pressure is lower than the surrounding pressurecan be found throughout the vortex street, which could be of some importance when predicting anddescribing fish movement in this type of flow.
Energies 2017, 10, 332 9 of 13
CFD
(c)
Figure 7. Vertical vorticity component (t = 86.5 s) at (a) z/D = −0.5; (b) z/D = 0.5; and (c) z/D = 0.0 along with the experimental visualization for z/D = −0.5 and z/D = 0.5.
(a)
(b)
Figure 8. Fluid pressure at the final time step (t = 87.5 s) at (a) z/D = −0.5; and (b) z/D = 0.5.
The shedding frequency (f) was determined from the velocity spectra using the fast Fourier transform (FFT). The concept of LDV is that measurements are carried out if a particle travels through the volume of measurement, meaning that often there is, no signal available [33–35]. Thus, sampling data from LDV are random offering challenges for the estimation of the power spectrum. Nobach [29,31,36] described the details of up-to-date available methods to analyze the frequency spectrum from arbitrarily sampled data acquired by LDV measurements.
The estimation of power spectra presented in this paper is the interpolation of the arbitrarily or randomly sampled LDV data to obtain a uniform velocity over time, which is then re-sampled in equal steps with a known sampling frequency close to the average sampling frequency. The mean velocity for each signal was then subtracted as the fluctuations around the mean u’ describing the periodicity. The dominant peak in each spectrum is then assumed to correspond to the vortex shedding frequency (f).
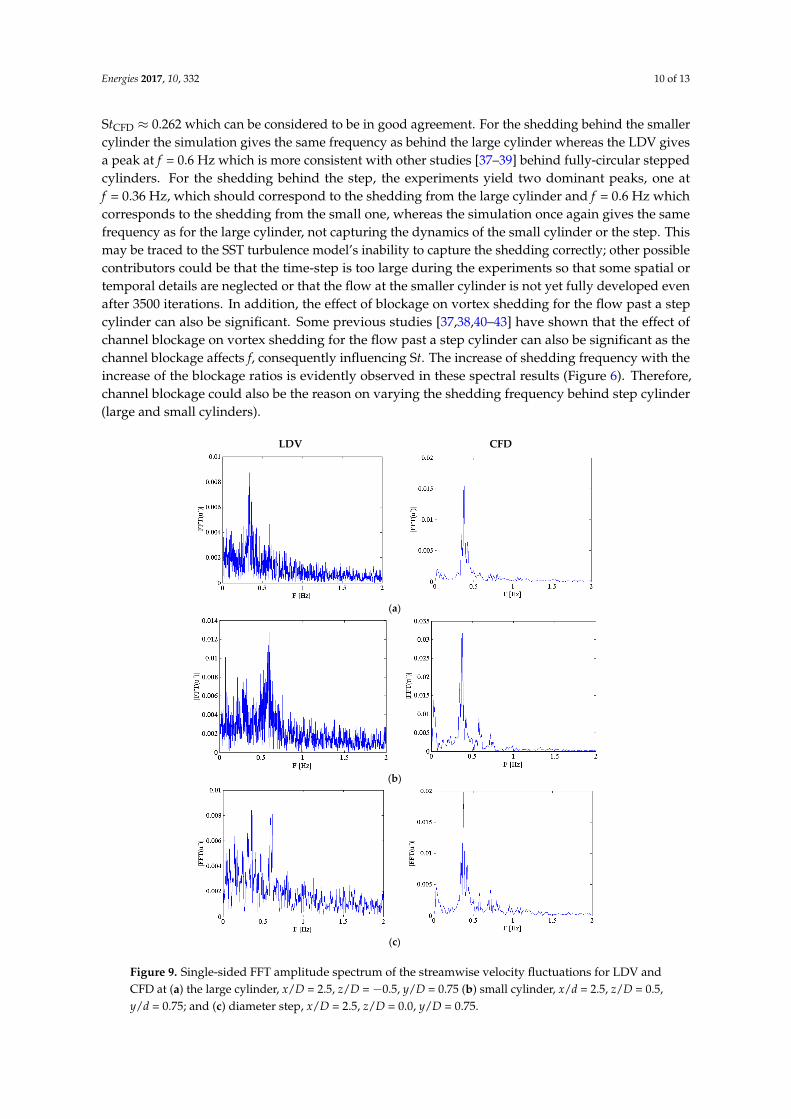
The shedding frequency for the large cylinder and step are evaluated at x/D = 2.5, y/D = 0.75 and the shedding frequency from the small cylinder at x/d = 2.5 and y/d = 0.75, see Figure 9. For the shedding behind the large cylinder the dominating peak gives f = 0.34 Hz for the experiments and f = 0.38 Hz for the simulations corresponding to Strouhal numbers StLDV = fD/U∞ ≈ 0.234 and StCFD ≈ 0.262 which can be considered to be in good agreement. For the shedding behind the smaller cylinder the simulation gives the same frequency as behind the large cylinder whereas the LDV gives a peak at f = 0.6 Hz which is more consistent with other studies [37–39] behind fully-circular stepped cylinders. For the shedding behind the step, the experiments yield two dominant peaks, one at f = 0.36 Hz,
Figure 8. Fluid pressure at the final time step (t = 87.5 s) at (a) z/D = −0.5; and (b) z/D = 0.5.
The shedding frequency (f ) was determined from the velocity spectra using the fast Fouriertransform (FFT). The concept of LDV is that measurements are carried out if a particle travelsthrough the volume of measurement, meaning that often there is, no signal available [33–35]. Thus,sampling data from LDV are random offering challenges for the estimation of the power spectrum.Nobach [29,31,36] described the details of up-to-date available methods to analyze the frequencyspectrum from arbitrarily sampled data acquired by LDV measurements.
The estimation of power spectra presented in this paper is the interpolation of the arbitrarilyor randomly sampled LDV data to obtain a uniform velocity over time, which is then re-sampled inequal steps with a known sampling frequency close to the average sampling frequency. The meanvelocity for each signal was then subtracted as the fluctuations around the mean u’ describing theperiodicity. The dominant peak in each spectrum is then assumed to correspond to the vortex sheddingfrequency (f ).
The shedding frequency for the large cylinder and step are evaluated at x/D = 2.5, y/D = 0.75and the shedding frequency from the small cylinder at x/d = 2.5 and y/d = 0.75, see Figure 9. For theshedding behind the large cylinder the dominating peak gives f = 0.34 Hz for the experiments andf = 0.38 Hz for the simulations corresponding to Strouhal numbers StLDV = fD/U∞ ≈ 0.234 and
Energies 2017, 10, 332 10 of 13
StCFD ≈ 0.262 which can be considered to be in good agreement. For the shedding behind the smallercylinder the simulation gives the same frequency as behind the large cylinder whereas the LDV givesa peak at f = 0.6 Hz which is more consistent with other studies [37–39] behind fully-circular steppedcylinders. For the shedding behind the step, the experiments yield two dominant peaks, one atf = 0.36 Hz, which should correspond to the shedding from the large cylinder and f = 0.6 Hz whichcorresponds to the shedding from the small one, whereas the simulation once again gives the samefrequency as for the large cylinder, not capturing the dynamics of the small cylinder or the step. Thismay be traced to the SST turbulence model’s inability to capture the shedding correctly; other possiblecontributors could be that the time-step is too large during the experiments so that some spatial ortemporal details are neglected or that the flow at the smaller cylinder is not yet fully developed evenafter 3500 iterations. In addition, the effect of blockage on vortex shedding for the flow past a stepcylinder can also be significant. Some previous studies [37,38,40–43] have shown that the effect ofchannel blockage on vortex shedding for the flow past a step cylinder can also be significant as thechannel blockage affects f, consequently influencing St. The increase of shedding frequency with theincrease of the blockage ratios is evidently observed in these spectral results (Figure 6). Therefore,channel blockage could also be the reason on varying the shedding frequency behind step cylinder(large and small cylinders).
Energies 2017, 10, 332 10 of 13
which should correspond to the shedding from the large cylinder and f = 0.6 Hz which corresponds to the shedding from the small one, whereas the simulation once again gives the same frequency as for the large cylinder, not capturing the dynamics of the small cylinder or the step. This may be traced to the SST turbulence model’s inability to capture the shedding correctly; other possible contributors could be that the time-step is too large during the experiments so that some spatial or temporal details are neglected or that the flow at the smaller cylinder is not yet fully developed even after 3500 iterations. In addition, the effect of blockage on vortex shedding for the flow past a step cylinder can also be significant. Some previous studies [37,38,40–43] have shown that the effect of channel blockage on vortex shedding for the flow past a step cylinder can also be significant as the channel blockage affects f, consequently influencing St. The increase of shedding frequency with the increase of the blockage ratios is evidently observed in these spectral results (Figure 6). Therefore, channel blockage could also be the reason on varying the shedding frequency behind step cylinder (large and small cylinders).
LDV CFD
(a)
(b)
(c)
Figure 9. Single-sided FFT amplitude spectrum of the streamwise velocity fluctuations for LDV and CFD at (a) the large cylinder, x/D = 2.5, z/D = −0.5, y/D = 0.75 (b) small cylinder, x/d = 2.5, z/D = 0.5, y/d = 0.75; and (c) diameter step, x/D = 2.5, z/D = 0.0, y/D = 0.75.
Figure 9. Single-sided FFT amplitude spectrum of the streamwise velocity fluctuations for LDV andCFD at (a) the large cylinder, x/D = 2.5, z/D = −0.5, y/D = 0.75 (b) small cylinder, x/d = 2.5, z/D = 0.5,y/d = 0.75; and (c) diameter step, x/D = 2.5, z/D = 0.0, y/D = 0.75.
Energies 2017, 10, 332 11 of 13
5. Concluding Remarks
An investigation with LDV measurements and CFD simulations behind a semi-circular cylinderwith a step has been conducted. Additional flow visualization was also carried out to explore the wakestructure. A summary of key features of the wake flows obtained in this study is given below:
1. The main result is that the measured vortex shedding frequency is, f = 0.34 Hz behind the largecylinder and f = 0.6 Hz behind the small cylinder, while it has two dominating frequencies acrossthe step, f = 0.36 Hz and f = 0.6 Hz. This implies that a step cylinder can be used to attract fish ofdifferent sizes and facilitate their motion up-stream the fishway.
2. Experiments yield that the wake length is longer along the step (z/D = 0.0) and it reduces for thelarge cylinder (z/D = −0.5), as well as the small cylinder (z/D = 0.5). The simulation over-predictsall of these wake lengths.
3. Flow visualization finds the development of three-dimensional (3D) flow structures along withwell-known Von Karman vortex street.
4. Simulation results show acceptable agreement with the experimental measurements behind thelarge cylinder, but fail to capture the dynamics of the small cylinder diameter.
Future studies with tomographic-PIV would enable the detailed vortex dynamics of the flowbehind the stepped half-cylinders to be investigated. Additional simulations with more advancedmodels, such as the Reynolds stress models and large eddy simulations, could also provide additionalinsights into this type of problem.
For the application of fish migration, it would also be interesting to test these configurations onfish in laboratory studies, as well as in the field, to see how different species and sizes of fish respondto different geometries and flow conditions.
Acknowledgments: This work has been funded by the collaboration initiative StandUp for Energy. The researchprogram is a part of the Swedish government’s commitment to high quality research in areas ofstrategic importance.
Author Contributions: S. M. Sayeed-Bin-Asad, Tord Staffan Lundström and Anders Gustav Andersson conceivedand designed the experiments; S. M. Sayeed-Bin-Asad performed the experiments and analyzed the data;Anders Gustav Andersson performed the simulation; S. M. Sayeed-Bin-Asad wrote the paper; All authorsread and approved the final manuscript.
Conflicts of Interest: The authors declare no conflict of interest.
References
1. Swedenergy. Svensk Energi—Swedenergy—AB. Available online: http://www.svenskenergi.se/(accessed on 12 October 2016).
2. Kaveh, A. Experimental Investigation of a Kaplan Runner under Steady-State and Transient Operations.Ph.D. Thesis, Luleå University of Technology, Luleå, Sweden, 2016.
3. Liao, J.C.; Beal, D.N.; Lauder, G.V.; Triantafyllou, M.S. Fish exploiting vortices decrease muscle activity.Science 2003, 302, 1566–1569. [CrossRef] [PubMed]
4. Liao, J.C. A review of fish swimming mechanics and behaviour in altered flows. Philos. Trans. R. Soc. BBiol. Sci. 2007, 362, 1973–1993. [CrossRef] [PubMed]
5. Stewart, W.J.; Tian, F.B.; Akanyeti, O.; Walker, C.J.; Liao, J.C. Refuging rainbow trout selectively exploit flowsbehind tandem cylinders. J. Exp. Biol. 2016, 219, 2182–2191. [CrossRef] [PubMed]
6. Akanyeti, O.; Thornycroft, P.J.M.; Lauder, G.V.; Yanagitsuru, Y.R.; Peterson, A.N.; Liao, J.C. Fish optimizesensing and respiration during undulatory swimming. Nat. Commun. 2016, 7, 11044. [CrossRef] [PubMed]
7. Sayeed-Bin-Asad, S. Velocity Distribution Measurements in A Fishway Like Open Channel by Laser DopplerAnemometry (LDA). EPJ Web. Conf. 2016. [CrossRef]
8. Liao, J.C.; Beal, D.N.; Lauder, G.V.; Triantafyllou, M.S. The Kármán gait: Novel body kinematics of rainbowtrout swimming in a vortex street. J. Exp. Biol. 2003, 206, 1059–1073. [CrossRef] [PubMed]
9. Dunn, W.; Tavoularis, S. Vortex shedding from a step-cylinder in spanwise sheared flow. Phys. Fluids 2011,23, 035109. [CrossRef]

Energies 2017, 10, 332 12 of 13
10. Dunn, W.; Tavoularis, S. Experimental studies of vortices shed from cylinders with a step-change in diameter.J. Fluid Mech. 2006, 555, 409–437. [CrossRef]
11. Morton, C.; Yarusevych, S. Vortex shedding in the wake of a step cylinder. Phys. Fluids 2010, 22, 083602.[CrossRef]
12. Morton, C.; Yarusevych, S. Three-dimensional flow and surface visualization using hydrogen bubbletechnique. J. Vis. 2015, 18, 47–58.
13. Morton, C.; Yarusevych, S. On vortex shedding from low aspect ratio dual step cylinders. J. Fluids Struct.2014, 44, 251–269. [CrossRef]
14. Morton, C.; Yarusevych, S. Vortex dynamics in the turbulent wake of a single step cylinder. J. Fluids Eng.2014, 136, 031204. [CrossRef]
15. McClure, J.; Morton, C.; Yarusevych, S. Flow development and structural loading on dual step cylinders inlaminar shedding regime. Phys. Fluids 2015, 27, 063602. [CrossRef]
16. Morton, C.R.; Yarusevych, S. A combined experimental and numerical study of flow past a single stepcylinder. In Proceedings of the ASME 2010 3rd Joint US-European Fluids Engineering Summer MeetingCollocated with 8th International Conference on Nanochannels, Microchannels, and Minichannels, Montreal,QC, Canada, 1–5 August 2010; American Society of Mechanical Engineers: New York, NY, USA, 2010.
17. Morton, C.; Yarusevych, S.; Scarano, F. A tomographic particle image velocimetry investigation of the flowdevelopment over dual step cylinders. Phys. Fluids 2016, 28, 025104. [CrossRef]
18. Rafati, S. Investigating Step Cylinder Wake Topology with Tomographic PIV; Delft University of Technology:Delft, The Netherlands, 2014.
19. Ko, N.; Leung, W.; Au, H. Flow behind two coaxial circular cylinders. J. Fluids Eng. 1982, 104, 223–227.[CrossRef]
20. Yagita, M.; Kojima, Y.; Matsuzaki, K. On vortex shedding from circular cylinder with step. Bull. JSME 1984,27, 426–431. [CrossRef]
21. Lewis, C.; Gharib, M. An exploration of the wake three dimensionalities caused by a local discontinuity incylinder diameter. Phys. Fluids A Fluid Dyn. 1992, 4, 104–117. [CrossRef]
22. Norberg, C. An experimental study of the flow around cylinders joined with a step in diameter. InProceedings of the 11th Australasian Fluid Mechanics Conference, Hobart, Australia, 14–18 December 1992.
23. Ko, W.-M.; Chan, S.-K. Pressure Distributions on Circular Cylinders with Stepwise Change of the Diameter;American Society of Mechanical Engineers: New York, NY, USA, 1984.
24. Ko, N.; Chan, A. In the intermixing region behind circular cylinders with stepwise change of the diameter.Exp. Fluids 1990, 9, 213–221. [CrossRef]
25. Ko, N.; Chan, A. Wakes behind circular cylinders with stepwise change of diameter. Exp. Therm. Fluid Sci.1992, 5, 182–187. [CrossRef]
26. Chua, L.; Liu, C.; Chan, W. Measurements of a step cylinder. Int. Commun. Heat Mass Transf. 1998, 25,205–215. [CrossRef]
27. Morton, C.; Yarusevych, S. Modeling Flow over a Circular Cylinder with a Stepwise Discontinuity. InProceedings of the 39th AIAA Fluid Dynamics Conference, San Antonio, TX, USA, 22–25 June 2009.
28. Morton, C.; Yarusevych, S. Cross flow over cylinders with two stepwise discontinuities in diameter.In Proceedings of the Turbulence and Shear Flow Phenomena Conference, Ottawa, ON, Canada,28–30 July 2011.
29. Nobach, H. Present Methods to Estimate the Cross-Correlation and Cross-Spectral Density for Two-ChannelLaser Doppler Anemometry. In Proceedings of the 18th International Symposium on the Application ofLaser and Imaging Techniques to Fluid Mechanics, Lisbon, Portugal, 4–7 July 2016.
30. Norberg, C. LDV-Measurements in the Near Wake of a Circular Cylinder. Available online: http://www.ht.energy.lth.se/fileadmin/ht/Norberg-FEDSM98-5202.pdf (accessed on 12 October 2016).
31. Hirt, C.W.; Nichols, B.D. Volume of fluid (VOF) method for the dynamics of free boundaries. J. Comput. Phys.1981, 39, 201–225. [CrossRef]
32. Menter, F.R. Review of the shear-stress transport turbulence model experience from an industrial perspective.Int. J. Comput. Fluid Dyn. 2009, 23, 305–316. [CrossRef]
33. Morton, C.; Yarusevych, S. An experimental investigation of flow past a dual step cylinder. Exp. Fluids 2012,52, 69–83. [CrossRef]

Energies 2017, 10, 332 13 of 13
34. Velte, C.M.; George, W.K.; Buchhave, P. Estimation of burst-mode LDA power spectra. Exp. Fluids 2014, 55,1–20. [CrossRef]
35. Müller, E.; Nobach, H.; Tropea, C. A refined reconstruction-based correlation estimator for two-channel,non-coincidence laser Doppler anemometry. Meas. Sci. Technol. 1998, 9, 442. [CrossRef]
36. Nobach, H. Laser Doppler Data Processing. Available online: http://ldvproc.nambis.de/programs/pyLDV.html (accessed on 10 October 2016).
37. Turki, S.; Abbassi, H.; Nasrallah, S.B. Effect of the blockage ratio on the flow in a channel with a built-insquare cylinder. Comput. Mech. 2003, 33, 22–29. [CrossRef]
38. Zong, L.; Nepf, H. Vortex development behind a finite porous obstruction in a channel. J. Fluid Mech. 2012,691, 368–391. [CrossRef]
39. Morton, C.R. Experimental and Numerical Investigations of the Flow Development over Circular Cylinderswith Stepwise Discontinuities in Diameter. Master’s Thesis, University of Waterloo, Waterloo, ON,Canada, 2010.
40. Sahin, M.; Owens, R.G. A numerical investigation of wall effects up to high blockage ratios ontwo-dimensional flow past a confined circular cylinder. Phys. Fluids (1994–Present) 2004, 16, 1305–1320.[CrossRef]
41. Mettu, S.; Verma, N.; Chhabra, R. Momentum and heat transfer from an asymmetrically confined circularcylinder in a plane channel. Heat Mass Transf. 2006, 42, 1037–1048. [CrossRef]
42. Okajima, A.; Yi, D.; Sakuda, A.; Nakano, T. Numerical study of blockage effects on aerodynamiccharacteristics of an oscillating rectangular cylinder. J. Wind Eng. Ind. Aerodyn. 1997, 67, 91–102. [CrossRef]
43. Park, C.-W.; Lee, S.-J. Free end effects on the near wake flow structure behind a finite circular cylinder.J. Wind Eng. Ind. Aerodyn. 2000, 88, 231–246. [CrossRef]
© 2017 by the authors. Licensee MDPI, Basel, Switzerland. This article is an open accessarticle distributed under the terms and conditions of the Creative Commons Attribution(CC BY) license (http://creativecommons.org/licenses/by/4.0/).