study the effect of welding joint location on the fatigue strength
TRANSCRIPT

Asian Transactions on Engineering (ATE ISSN: 2221 - 4267) Volume 02 Issue 04
1 ATE-80212044©Asian-Transactions September 2012
Study the Effect of Welding Joint Location on the Fatigue Strength and
Fatigue Life for Steel Weldment
Dr.Ali Sadiq Yasir
Kufa University / Faculty of Engineering
Mechanical Engineering Department IRAQ
E-mail:[email protected] / [email protected] Abstract: The welding process is one of the oldest joining processes between the materials, this paper try to
find the effect of welding joint location in the steel on the fatigue strength of steel.
The welding process done by electrical arc welding to joining steel samples at different locations at
(X/L=0.25, X/L=0.5, and X/L=0.75), where (X) the location of welding zone centre and sample
subjected to fully reversed bending stress, then comparing the fatigue test results with un-welded
sample. The experimental results show that the welding joint decrease the tensile strength of steel and
the fatigue failure strength also decreased specially for that with (X/L=0.5 and X/L=0.75) and failure
occur at welding zone, but the sample with (X/L=0.25) had less effected by welding joint and the
failure occur at the support not at welding zone. The results show fatigue life affected by the welding
joint when draw (S-N) diagram for each sample especially for sample with (X/L=0.5 and X/L=0.75).
Keywords: welding of steel, fatigue, S-N diagram, finite element analysis, fatigue behavior of steel
weldment.
1. Introduction: Welding fabrication is one of the most
common joining procedures of metallic structure.
The vast majority of component fatigue
failures take place at the welded connections
when the welded structures subjected to fatigue
and impact loading. [1]
Fatigue of materials is a very complex
process, which is still today not fully
understood and it is known as (material
subjected to a repetitive fluctuating load and will
eventually fail at load much lower than that
required to cause fracture on single application
of the load ) .[2]
The damage of the material in fatigue starts
in the crystalline structure and becomes visible
in a later stage by plastic deformation, formation
of micro-cracks on slip bands, coalescence of
micro cracks and finally propagation of a
main crack . Many influence factors complicate
the subject. The behavior of different materials
and the effect of these influence factors
has been extensively investigated. Very often,
the phenomena are analyzed and further
evaluated with the aim of wider application,
figure (1), show sample of fatigue crack surface
Fatigue of welds is even more complex.
Welding strongly affects the material by the
process of heating and subsequent cooling as
well as by the fusion process with additional
filler material, resulting in inhomogeneous
and different materials. Furthermore, a weld is
usually far from being perfect, containing

Asian Transactions on Engineering (ATE ISSN: 2221 - 4267) Volume 02 Issue 04
2 ATE-80212044©Asian-Transactions September 2012
inclusions, pores, cavities, undercuts etc. The
shape of the weld profile and non-welded root
gaps create high stress concentrations with
widely varying geometry parameters. Last but
not least residual stresses and distortions due to
the welding process affect the fatigue behavior.
Therefore, fatigue failures appear in welded
structures mostly at the welds rather than in the
base metal, even if the latter contains notches
such as openings or re-entrant corners. For this
reason, fatigue analyses are of high practical
interest for all cyclic loaded welded structures,
such as ships, offshore structures, cranes,
bridges, vehicles, railcars etc. In view of the
complexity of the subject and the wide area of
application, it is not surprising that several
approaches for fatigue analysis of welded joints
exist. However, it is almost impossible to follow
up the great amount of related literature dealing
with fatigue testing and the development
or application of approaches to consider all the
different influence parameters.[3]
The welds consist of base material, heat
affected zone (HAZ) and deposited metal, figure
(2.) shows the schema of the weld
microstructure. The filler material and part of the
base material meltdown during welding and form
solidified weld metal, while the base material in
the close vicinity undergoes a transformation.
The (HAZ) formation is result of an applied
thermal cycle caused by the heat source
movement which necessary to melt the material.
The effects of the thermal cycle diminish with
distance from the fusion line. Materials close to
the weld metal are heated almost to melting point
and the high temperature produces a grain
growth. The result is the formation of coarse-
grained microstructure in the so-called coarse-
grain heat-affected zone (CGHAZ) adjacent to
the fusion line. This microstructure influences
the mechanical properties such as impact
toughness and fatigue strength. [4]
2. The aim and scope : The aim of this work is the study the effect of
the location of welding joint on the fatigue life
and fatigue strength of rotating steel shaft and
finding the best location for welding joint. The
scope of this work is applied mechanics and the
design of welding joint location.
3. Determining fatigue performance of welded structures: [5]
Welded components are less tolerant to
fluctuating loads than their non-welded
counter-parts for three reasons:
a) Welds contain internal flaws, which act as
the initiation site for crack propagation.
b) Welds create external stress raisers, which
act as the initiation site for crack propagation.
c) The process of welding introduces residual
stresses in the region of the weld
exacerbating the applied fluctuating stress.
The fatigue tolerance of welded structures can
be classified into “detail categories” according
to the type of weld and its orientation with
respect to the applied fluctuating loads. The
detail categories for steel structures are found
in AS 4100 and AS 5100 and are used by
structural steel designers when fluctuating
loads occur during service. The detail
category for any given weld configuration is a
number between 36 and 180 that represents the
Asian Transactions on Engineering (ATE ISSN: 2221 - 4267) Volume 02 Issue 04
3 ATE-80212044©Asian-Transactions September 2012
stress range in (MPa) that can be tolerated for
two million (2x10⁶) fluctuating load cycles,
figure (3) show the (S-N) diagram for steel .
4. Stress concentration factor: [6,7]
The fatigue fracture of structural details
subjected to cyclic loads mostly occurs at a
critical cross section with stress concentration. In
a welded joints fatigue crack initiates at the
weld toe and propagates through the main
sample to a final fracture.
The local weld geometry affect the stress
concentration factor and welding process create
crack like defects, which together cause a large
scatter in fatigue life depending on differences in
these factors. Stress concentration factors should
be use for parent metal as well as weld. There is
often a trade off between stress concentration
and over all size of weld. As the size of the weld
grow so does the strength; unfortunately so dose
the stress concentration, so the over all strength
may be about the same.
5. Experimental Work :
4.1 Tensile test:
The samples of experimental work for tensile
and fatigue tests were cutting from steel that had
chemical composition shown in table (1).
Table.1
Chemical composition of steel samples (tensile and
fatigue sample) Component C Mn Si P S
Percentage
%
0.29 1.8 0.55 0.04 0.04
The steel samples will tested according to
specification DIN 50125 to find the properties of
sample like (young modulus, yield strength, and
ultimate strength) via tensile test with using
universal test machine that shown in figure (4).
[8]
The sample was prepared by using lather
machine until reach to the required dimensions
as shown in figure (5).
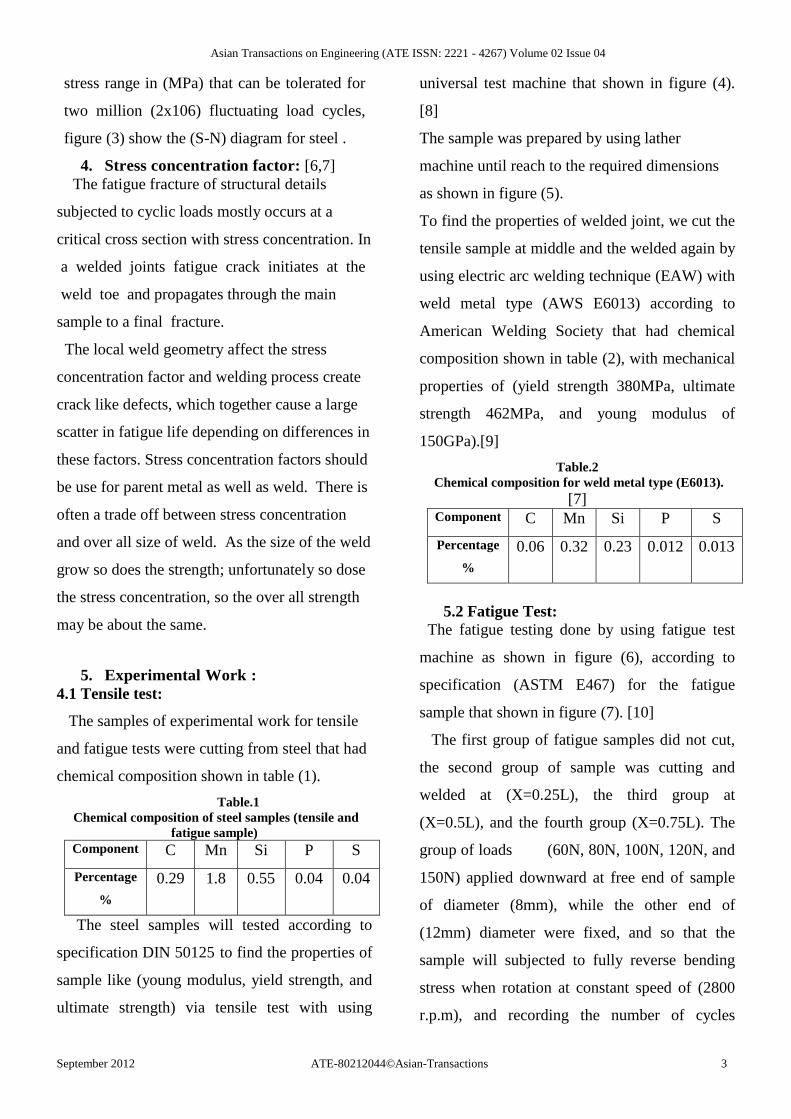
To find the properties of welded joint, we cut the
tensile sample at middle and the welded again by
using electric arc welding technique (EAW) with
weld metal type (AWS E6013) according to
American Welding Society that had chemical
composition shown in table (2), with mechanical
properties of (yield strength 380MPa, ultimate
strength 462MPa, and young modulus of
150GPa).[9]
Table.2
Chemical composition for weld metal type (E6013). [7]
Component C Mn Si P S
Percentage
%
0.06 0.32 0.23 0.012 0.013
5.2 Fatigue Test:
The fatigue testing done by using fatigue test
machine as shown in figure (6), according to
specification (ASTM E467) for the fatigue
sample that shown in figure (7). [10]
The first group of fatigue samples did not cut,
the second group of sample was cutting and
welded at (X=0.25L), the third group at
(X=0.5L), and the fourth group (X=0.75L). The
group of loads (60N, 80N, 100N, 120N, and
150N) applied downward at free end of sample
of diameter (8mm), while the other end of
(12mm) diameter were fixed, and so that the
sample will subjected to fully reverse bending
stress when rotation at constant speed of (2800
r.p.m), and recording the number of cycles

Asian Transactions on Engineering (ATE ISSN: 2221 - 4267) Volume 02 Issue 04
4 ATE-80212044©Asian-Transactions September 2012
(fatigue life) for each sample till failure. For
each test, we used two samples and take the
average value for them.
6. Calculations:[11]
In most laboratory fatigue testing, the
specimen is loaded so that stress it is cycled
either between a maximum and minimum tensile
stress or between a maximum tensile stress and
specific level of compressive stress. The letter of
the two, considered a negative tensile stress, are
given an algebraic
minus sign and called the minimum stress.
The mean stress (σm) is algebraic average of
maximum stress and minimum stress in one
cycle :
2
minmax
m equ.(1)
The range of stress (σr) is algebraic difference
between maximum stress and minimum stress in
one cycle:
minmax
r equ.(2)
The stress amplitude (σa) is one-half the range
of stress in one cycle:
22
minmax
r
a equ.(3)
The stress ratio is the algebraic ratio of two
specific stress values in stress cycle :
max
minR equ.(4)
The nominal stress in fully reversed bending
loading test is:
d
Mb 3
*
32
equ.(5)
M= P*L equ.(6)
d----- Sample diameter (m)
P-----Bending load (N)
The stress concentration factor (Kt) for
stepped shaft depend on the dimension of
stepped sample as shown in figure (10). [12]
According to ratio ( )5.18
12
d
D and
( )25.08
2
d
rwith using the stress
concentration factor curves as shown in figure
(9), can find that the (Kt=1.41).
The fatigue stress concentration factor (Kf)
depend on the value of stress concentration (Kt)
and the notch sensitivity factor (q), that can
found from notch sensitivity curve as shown in
figure(10) and according to radius of notch
(r=2mm) and ultimate strength for sample
(σult=715MPa) , can find the value of notch
sensitivity (q=0.83).
The value of fatigue stress concentration
according to equation (7).
Kf =1+ q (Kt -1) equ.(7)
So that value of fatigue stress concentration
factor(Kf) can find by equation (7) as:
Kf =1+ 0.83 (1.41 -1) =1.34
So the value of actual fatigue stress is now equal
to = Nominal fatigue stress *Fatigue stress
concentration factor.
K fff Nomact
* equ.(8)
7. The Results and Discussion :
1- Figure (11) show the experimental stress-
strain diagram for steel samples, and from this
figure, can find the yield strength of sample is
(465MPa), the ultimate tensile strength is equal
to (715MPa), and the young modulus is (201MP)

Asian Transactions on Engineering (ATE ISSN: 2221 - 4267) Volume 02 Issue 04
5 ATE-80212044©Asian-Transactions September 2012
and these properties give good idea about the
behavior of the samples under loading.
2- Figure (12) , show the experimental stress-
strain diagram for steel sample that welded at
middle point by using weld metal type (AWS
E6013) , and the maximum stress for sample is
decreased from (715MPa) to (425MPa) because
the grains in fusion area been bigger than grains
in base material and the carbon content increased
in fusion area, so that the strength of the weld
joint will be less than base material.
3-Figure (12) show the fatigue bending stress for
welded and un-welded sample, and its show that
the un-welded sample had behavior better than
the welded samples and it need more load to
failure under fatigue stress , so that it so clear the
welded joint will make sample weaker than
sample without welded joint.
4- Figures (13 to 16) show the (S-N) diagrams
for welded and un-welded samples, and from this
figures, can find the value of endurance strength
for these samples.
-The endurance strength for sample welded at
(X/L=0.25) is (170MPa) but failure happened at
the support end not at welding zone with fatigue
life is (210365 cycles) as shown in figure (13).
- The endurance strength for sample welded at
(X/L=0.5), is (61MPa) and failure happened at
the welding zone with fatigue life
(156321cycles) as shown in figure (14).
- The endurance strength for sample welded at
(X/L=0.75), is (88MPa) and failure happened at
the welded zone with fatigue life (40883cycles)
as shown in figure (15).
- The endurance strength for un-welded sample
the endurance strength is (190MPa) and failure
happened at the supported with fatigue life
(281019 cycles) as shown in figure (16).
From these results, can notice that the welded
joint in steel sample decreasing the endurance
limit and fatigue life for welded samples with
respect to un-welded sample.
5-Figure (17) show the failure location for
fatigue samples that loaded at different location ,
and can notice that the failure occur at welding
zone accept the sample welded at (X/L=0.25) ,
the failure occur at the support.
8. The Conclusion :
The welding joint in steel will reduce the
fatigue life about (25%) for sample welded at
(X/L=0.25) ,but failure occur at the support not
at the welding zone by bending stress of
(400MPa) , fatigue life reduces about (40%) for
sample welded at (X/L=0.5) and the failure
occur at (X/L=0.5) by bending stress of
(61MPa) , and fatigue life reduces about (84%)
for sample welded at (X/L=0.75) and failure
occur at(X/L=0.75) by bending stress of
(89.54MPa) . The stress failure affected by the
location of welding zone and especially for
samples that welded far of the point of load
applying. The better location for welding is
closest to point of load applying (bending load)
to reduce the bending moment at welding zone
and that reduce the fully reversed bending stress
at welding zone. The tensile strength of steel
decreased about (40%) when it welded and it
behave as brittle material. For future work may
can study the effect of welding joint location on

Asian Transactions on Engineering (ATE ISSN: 2221 - 4267) Volume 02 Issue 04
6 ATE-80212044©Asian-Transactions September 2012
the another materials like brass, aluminum and
etc , and may be study the effect another factors
that affected by welding joint location.
9. References:
1- C. Rubio-Gonzalez, Effect of Fatigue
Damage of The Dynamic Tensile Behavior of
Carbon Steel Welded joints, 2010.
2- Sindo Kou, Welded Metallurgy, 2nd
Edition,
WILEY INTERSCIENCE, 2003.
3-Wolfgang Fricke, Fatigue Analysis of
Welded Joints: State of Development, Elsevier,
Marine Structure, Vol.16, 2003, p (185-200).
4-T. Vuherera, A.Godina, Fatigue Crack
Initiation From Microstructurally Small
Vickers Indentations, Metabk Vol.46, p.(237-
243) , 2007.
5-Introduction to Fatigue of Welded Steel
Structure and Post-Weld Improvement
Techniques, Welding Technology Institute of
Australia, 2006.
6-Zoran D.Perovic, The Weld Profile Effect
On Stress Concentration Factors in
Weldments, 15th
International Research
/Expert Conference (Trends in The
Development of Machinery and Associated
Technology) Czech Republic, 2011.
7-Eric Sawyer, Weld Poster Explanation,
Dagmar Customs, 2012.
8-Tensile Testing Data, G.U.N.T Geratebau
GmbH, Hamburger, 2007.
9-Basic Welding Filler Metal Technology,
Corresponding Course Lesson 1, ESAB Group,
2000.
10- Fatigue Testing Data, G.U.N.T Geratebau
GmbH, Hamburger, 2007.
11-Bruce Boardman, Fatigue Resistance of
Steels, ASM Handbook, vol.1, p(673-688) ,
1990 .
12- Walter D.Pilkey, Petersons Stress
Concentration Factors, 2nd
Edition, WILEY
INTERSCIENCE, 1997.
13- Module 3, Design for Strength, Stress
Concentration, Lesson 2, Version 2 ME,
Kharagpour, 2010.

Asian Transactions on Engineering (ATE ISSN: 2221 - 4267) Volume 02 Issue 04
7 ATE-80212044©Asian-Transactions September 2012
Figure.1. Fatigue crack surface. [2]
Figure.2. The microstructure across the weld. [4]
Figure .3. S-N Diagram for steel. [5]

Asian Transactions on Engineering (ATE ISSN: 2221 - 4267) Volume 02 Issue 04
8 ATE-80212044©Asian-Transactions September 2012
Figure .4 Tensile test machine.
Figure .5. Tensile test sample
Figure .6.Fatigue test machine
Φ6mm
30mm
Φ10mm

Asian Transactions on Engineering (ATE ISSN: 2221 - 4267) Volume 02 Issue 04
9 ATE-80212044©Asian-Transactions September 2012
Figure .7.Fatigue test sample
Where: (X) is the location of welded joint.
Fig.8. Stress concentration factor curve. [12]
Φ8mm
L=100mm 40mm
Φ12mm
P
X/L=0.25
X/L=0.5
X/L=0.75
R=2mm

Asian Transactions on Engineering (ATE ISSN: 2221 - 4267) Volume 02 Issue 04
10 ATE-80212044©Asian-Transactions September 2012
Fig.9. Variation of Notch sensitivity (q) with notch radius (r) for steel of different
ultimate tensile strength (UTS) . [13]
Fig.10. Stress-strain diagram for steel sample.
Strain%
Stress
MPa

Asian Transactions on Engineering (ATE ISSN: 2221 - 4267) Volume 02 Issue 04
11 ATE-80212044©Asian-Transactions September 2012
Fig.11. Stress-strain diagram for welded steel sample
Fig.12. Experimental fatigue bending stress at welding zone
for welded and un-welded samples.
Strain %
Stress MPa
0
50
100
150
200
250
300
350
400
450
0 20 40 60 80 100 120 140 160
Bending Load(N)
Ben
din
g S
tress a
t W
eld
ing
Jo
int(
MP
a)
X/L=0.25
X/L=0.5
X/L=0.75
Without WeldingAt support

Asian Transactions on Engineering (ATE ISSN: 2221 - 4267) Volume 02 Issue 04
12 ATE-80212044©Asian-Transactions September 2012
0
50
100
150
200
250
300
350
400
450
0 50000 100000 150000 200000 250000
No. of Cycles
Fati
gu
e S
tress (
MP
a)
X/L=0.25
Fig.13. (S-N) diagram for (X/L=0.25) sample
0
20
40
60
80
100
120
140
160
0 20000 40000 60000 80000 100000 120000 140000 160000 180000
No. of Cycles
Fa
tig
ue
Str
es
s(M
Pa
)
X/L=0.5
Fig.14. (S-N) diagram for (X/L=0. 5) sample
S-N Diagram
0
50
100
150
200
250
0 5000 10000 15000 20000 25000 30000 35000 40000 45000 50000
No. of Cycles
Fti
gu
e S
tre
ss
(MP
a)
X/L=0.75
Fig.15. (S-N) diagram for (X/L=0. 75) sample

Asian Transactions on Engineering (ATE ISSN: 2221 - 4267) Volume 02 Issue 04
13 ATE-80212044©Asian-Transactions September 2012
0
50
100
150
200
250
300
350
400
450
0 50000 100000 150000 200000 250000 300000 350000
No.of Cycles
Fati
gu
e S
tress (
MP
a)
Without Welding
Fig.16. (S-N) diagram for un-welded sample
Fig.17. The fatigue failure of steel samples at different location of welding.
X/L=0.25
X/L=0. 5
X/L=0.75