study on the evaluation of hepatic microvascular perfusion
TRANSCRIPT

Instructions for use
Title Study on the evaluation of hepatic microvascular perfusion and hepatic fibrosis using ultrasonography in dogs with liverdisease
Author(s) 田村, 昌大
Citation 北海道大学. 博士(獣医学) 甲第14105号
Issue Date 2020-03-25
DOI 10.14943/doctoral.k14105
Doc URL http://hdl.handle.net/2115/78430
Type theses (doctoral)
File Information Masahiro_TAMURA.pdf
Hokkaido University Collection of Scholarly and Academic Papers : HUSCAP

Study on the evaluation of hepatic microvascular perfusion and
hepatic fibrosis using ultrasonography in dogs with liver disease
(⽝の肝疾患における超⾳波検査を⽤いた肝微⼩循環および
肝線維化の評価に関する研究)
Masahiro Tamura

GENERAL ABBREVIATIONS
2D-SWE Two-dimensional shear wave elastography
ARFI Acoustic radiation force impulses
AUC Area under the curve
CEUS Contrast-enhanced ultrasonography
CI Confidence interval
CV Coefficient of variation
HA Hyaluronic acid
PV/Ao Portal vein-to-aorta ratio
ROC Receiver operating characteristic
ROI Region of interest
RR Rising-rate
RT Rising-time
SWV Shear wave velocity
Tchol Total cholesterol
TIC Time-intensity curve
TTP Time-to-peak
ΔHP-PV Portal vein-to-hepatic parenchyma transit time
TABLE OF CONTENTS
GENERAL INTRODUCTION ..........................................................................................................1
CHAPTER 1
QUANTITATIVE EVALUATION OF HEPATIC MICROVASCULAR PERFUSION IN DOGS
WITH EXTRAHEPATIC CONGENITAL PORTOSYSTEMIC SHUNT USING CONTRAST-
ENHANCED ULTRASONOGRAPHY .............................................................................................5
1. INTRODUCTION .............................................................................................................................6
2. MATERIALS AND METHODS .......................................................................................................7
2.1 Study population ..........................................................................................................................7
2.2 CEUS ...........................................................................................................................................8
2.3 Assessment of repeatability .........................................................................................................9
2.4 Statistical analysis .......................................................................................................................9
3. RESULTS ........................................................................................................................................11
3.1 Study population ........................................................................................................................11
3.2 Assessment of repeatability .......................................................................................................11
3.3 CEUS analysis ...........................................................................................................................11
3.4 ROC analysis .............................................................................................................................13
4. DISCUSSION .................................................................................................................................22
5. SUMMARY .....................................................................................................................................27
CHAPTER 2
EVALUATION OF LIVER AND SPLEEN ELASTIC MODULUS OF HEALTHY DOGS BY
USE OF TWO-DIMENSIONAL SHEAR WAVE ELASTOGRAPHY .........................................28
1. INTRODUCTION ...........................................................................................................................29
2. MATERIALS AND METHODS .....................................................................................................30
2.1 Animals .....................................................................................................................................30
2.2 Measurement of 2D-SWE ..........................................................................................................30
2.3 Statistical analysis .....................................................................................................................32
3. RESULTS ........................................................................................................................................34
3.1 Assessment of repeatability and reproducibility ........................................................................34
3.2 2D-SWE analysis between the right lobe of the liver and spleen ................................................34
3.3 Comparison between the right and left lobes of the liver ............................................................34
4. DISCUSSION .................................................................................................................................41
5. SUMMARY .....................................................................................................................................46
CHAPTER 3
USEFULNESS OF NONINVASIVE SHEAR WAVE ELASTOGRAPHY FOR THE
ASSESSMENT OF HEPATIC FIBROSIS IN DOGS WITH HEPATIC DISEASE .....................47
1. INTRODUCTION ...........................................................................................................................48
2. MATERIALS AND METHODS .....................................................................................................49
2.1 Animals .....................................................................................................................................49
2.2 Measurement of SWV ...............................................................................................................49
2.3 Histopathological examination and scoring of fibrosis or necroinflammation of liver ...............50
2.4 Measurement of serum HA concentration ..................................................................................51
2.5 Statistical analysis .....................................................................................................................51
3. RESULTS ........................................................................................................................................53

3.1 Study population ........................................................................................................................53
3.2 Laboratory findings and serum HA concentration .....................................................................53
3.3 Comparison of SWV among hepatic fibrosis stages ..................................................................54
3.4 Comparison of SWV among different amounts of necroinflammatory activity .........................54
4. DISCUSSION .................................................................................................................................61
5. SUMMARY .....................................................................................................................................65
GENERAL CONCLUSION .............................................................................................................66
JAPANESE SUMMARY ..................................................................................................................69
REFERENCES ..................................................................................................................................73
ACKNOWLEDGEMENTS .............................................................................................................83

1
GENERAL INTROCUCTION
Ultrasonography is non-invasive, free of radiation, and easy to use. It is commonly used as the first
imaging modality to diagnose dogs with liver disease. However, conventional ultrasonography has
some disadvantages including a demand of highly experienced and skilled operator. Additionally, the
conventional ultrasonography such as B mode and color Doppler is difficult to assess images
quantitatively.
To resolve this issue, two major categories of ultrasonography are recently developed:
Contrast-enhanced ultrasonography (CEUS) and elastography. CEUS takes advantages of
microbubble technology to improve the echogenicity of blood and evaluate quantitatively tissue
perfusion. Second-generation contrast agents (Sonazoid®, Daiichi-Sankyo, Tokyo, Japan) comprise
microbubbles with higher stability and resistance to pressure, providing minimal variability in clinical
performance.1,2 In liver perfusion studies, CEUS can detect small vessels and evaluate quantitative
hemodynamic indices that relate to tissue perfusion. Many studies in humans have evaluated liver
perfusion of various hepatic parenchymal disorders, such as viral hepatitis and alcoholic hepatitis.3-5
The results of these studies indicated the potential of CEUS in enhancing the diagnostic accuracy,
understanding pathophysiology, or monitoring and predicting response to treatment of various hepatic
disorders.
Congenital portosystemic shunt is a vascular anomaly that connects the portal vein to the
systemic circulation and is common diseases in veterinary medicine. A single extrahepatic congenital
portosystemic shunt is reported in 75% of affected dogs, whereas dogs with congenital intrahepatic
portosystemic shunts accounted for 8%.6 The clinical diagnosis of extrahepatic congenital
portosystemic shunt is supported by signalment, clinical history, and serum biochemistry (e.g., liver

2
enzyme activity, hypoalbuminemia, and an increase of serum bile acid or ammonium). Conventional
B-mode ultrasound imaging is also commonly used as the first imaging modality to diagnose dogs
with extrahepatic congenital portosystemic shunt. However, it is occasionally difficult to detect the
abnormal vessels by ultrasonography due to the specific limiting factors, such as gastrointestinal gas,
patient conformation, and operator-dependent function.
The liver is a unique organ that receives its blood supply from two sources: the portal vein
and the hepatic artery. In a healthy animal, approximately 70%–80% of the blood entering the liver is
poorly oxygenated and supplied by the portal vein. This is venous blood flowing from the intestines,
pancreas, spleen, and gallbladder. The remaining 20%–30% of the blood supply is well oxygenated
and delivered by the hepatic artery.7 It is well known that hepatic parenchymal disorder, abnormal
vasculature, and various other factors such as the production of vasoactive substances and cytokines,
lead to change of hepatic microvascular perfusion.8,9 In dogs with extrahepatic congenital
portosystemic shunt, vascular anomaly connecting the portal vein to the systemic circulation decreases
the portal vein blood flow supply to the liver. Consequently, it is thought that changes in hepatic
microvascular perfusion (arterialization) caused by arteriovenous shunting or capillarization of the
sinusoid occurs in dogs with extrahepatic congenital portosystemic shunt. Thus, detecting the hepatic
microvascular perfusion change using CEUS can help understand the pathophysiology and additional
diagnostic tests in dogs with extrahepatic congenital portosystemic shunt.
Ultrasound elastography is a relatively recent imaging technique that can be used to
noninvasively evaluate tissue elastic modulus.10,11 Similar to conventional B-mode ultrasound imaging,
elastography is noninvasive, does not involve radiation, and can be easily learned. Two major
categories of elastography techniques are currently widely used in clinical settings for humans.12 Strain
imaging is an elastography technique in which stress is applied by external compression with an
ultrasound transducer or internal physiologic pulsation, such as a heartbeat or respiration. Strain

3
imaging is used to measure the amount of lesion deformation relative to the surrounding normal tissue;
it involves use of a color display and provides qualitative or semiquantitative evaluations. In veterinary
medicine, strain imaging has been performed on the liver, spleen, and kidneys of clinically normal
dogs13 and cats.14 However, strain imaging cannot be used to quantitatively evaluate tissue elastic
modulus. A more recently developed and more quantitative elastography technique is shear wave
imaging, which overcomes the limitation of strain imaging and consists of ultrasonographic-based
transient elastography and shear wave elastography (SWE). Shear wave imaging involves the use of
dynamic stress to generate shear waves in parallel or perpendicular dimensions. Measurements of the
shear wave propagation speed result in qualitative and quantitative estimates of tissue elasticity.
Furthermore, SWE by use of acoustic radiation force impulses (ARFI) has been developed. For SWE,
shear wave propagation speed is measured within tissues and allows tissue elastic modulus to be
evaluated as shear wave velocity (SWV; reported in meters per second) or the Young modulus
(reported in kilopascals). Two types of SWE are currently used in human medicine: point SWE and
two-dimensional SWE (2D-SWE). Point SWE is used to measure tissue elastic modulus with the shear
wave generated from a fairly limited area of an ROI, which needs to be in a homogeneous area. In
contrast, 2D-SWE generates a 2D image of elastic modulus over a larger region of tissue. An arbitrarily
sized region of interest (ROI) may be used in 2D-SWE. Furthermore, 2D-SWE provides 2D color
velocity maps and also has the advantage of the placement of arbitrary ROIs during real-time
imaging.10-12
Hepatic fibrosis is histopathologically characterized by the progressive accumulation of
extracellular matrix in the liver parenchymal tissue, which subsequently leads to distortion of hepatic
architecture. Hepatic fibrosis in dogs usually is caused by chronic diffuse liver diseases, such as
chronic hepatitis and cholangiohepatitis.15,16 Progression of hepatic fibrosis involves an increase in the
liver elastic modulus and resistance of hepatic blood flow, which consequently result in liver cirrhosis

4
and portal hypertension. In humans with hepatic fibrosis, the stage of hepatic fibrosis and its
progression are essential for determination of optimal treatment and prediction of prognosis.17
Liver biopsy is the gold standard for diagnosing the severity of hepatic fibrosis in dogs and
humans. However, the limitations of liver biopsy include the risk of bleeding and anesthesia,
invasiveness, and possibility of sampling errors.18,19 Hence, non-invasive and easily accessible
methods of predicting stages of hepatic fibrosis have been developed in human medicine. Many
studies in human patients with hepatic fibrosis have indicated that SWV is correlated with the stage
of hepatic fibrosis, and SWE is widely applied in the clinical setting to predict the stage of hepatic
fibrosis in humans.20-24 However, to the best of our knowledge, no reports have evaluated the use of
2D-SWE for the diagnosis of hepatic fibrosis in dogs with spontaneous hepatic disease.
With the above background, this study was performed in 3 stages to determine the usefulness
of quantitative CEUS in dogs with extrahepatic congenital portosystemic shunt to understand the
pathophysiology and the feasibility of 2D-SWE in dogs with hepatic fibrosis. In the first stage, I have
investigated the perfusion changes of the hepatic artery, portal vein, and hepatic parenchyma in dogs
with extrahepatic congenital portosystemic shunt using CEUS. In the second stage, I have established
the repeatability and reproducibility of SWV using 2D-SWE in healthy beagle dogs. In the third stage,
I have investigated the usefulness of 2D-SWE in detecting hepatic fibrosis in dogs with chronic diffuse
liver disease.

5
CHAPTER 1
QUANTITATIVE EVALUATION OF HEPATIC MICROVASCULAR PERFUSION IN
DOGS WITH EXTRAHEPATIC CONGENITAL PORTOSYSTEMIC SHUNT USING
CONTRAST-ENHANCED ULTRASONOGRAPHY

6
1. INTRODUCTION
So far, in dogs, it is often difficult to diagnose with congenital portosystemic shunt by using the
conventional B-mode ultrasound imaging due to the specific limiting factors, such as gastrointestinal
gas, patient conformation, and operator-dependent function. Assessment of the perfusion changes of
the liver in dogs with extrahepatic congenital portosystemic shunt using CEUS would help understand
the pathophysiology and additional diagnostic test in dogs with extrahepatic congenital portosystemic
shunt.
The present study hypothesized that (1) CEUS can detect the change in hepatic
microvascular perfusion in dogs with extrahepatic congenital portosystemic shunt, (2) dogs with
extrahepatic congenital portosystemic shunt show an arterialization of the liver and a subsequent
compensatory increase in hepatic artery blood flow caused by a decrease in the portal vein blood flow,
and (3) the characterization of the simultaneous hepatic microvascular perfusion change, including
hepatic artery, portal vein, and hepatic parenchyma, is an additional diagnostic test that can distinguish
dogs with extrahepatic congenital portosystemic shunt from healthy dogs.
7
2. MATERIALS AND METHODS
2.1 Study population
The study was a prospective, exploratory design. Ten client-owned dogs with suspected extrahepatic
congenital portosystemic shunt were consecutively enrolled between June 2017 and May 2018 at the
Hokkaido University Veterinary Teaching Hospital. Informed owner consent was obtained in all cases.
Complete blood count, serum biochemistry, and urinalysis were obtained in all the dogs. In addition,
all the dogs had the PV-to-aorta (PV/Ao) ratio measured using abdominal ultrasonography by three
trained operators with over 10 years of experience performing liver ultrasound examinations. The
inclusion criteria in this study were dogs with morphologic characteristics consistent with an
extrahepatic congenital portosystemic shunt that was identified on computer tomography, and dogs
receiving surgical treatment. Exclusion criteria were dogs with an acquired shunt or portal
hypertension from diagnostic imaging, surgical findings, or measurement of portal vein pressure. Dogs
with liver tumor were also excluded.
As a control population, eight healthy beagles were included; three intact males and five
intact females. Median (range) of age and body weight were 31 (22–52) months of age and 10.5 (9.4–
15) kg, respectively. All the dogs were confirmed to be healthy based on physical examination,
complete blood count, serum biochemical panel, echocardiography, and abdominal ultrasonography.
All the animal experimental procedures were conducted in accordance with the standard operation
protocols of the institutional animal experimental committee reviewed by the Association for
Assessment and Accreditation of Laboratory Animal Care International (AAALAC International). The
Animal Experimentation Committee, Graduate School of Veterinary Medicine, Hokkaido University
approved all the animal experiments (Accession No. 18-0075).

8
2.2 CEUS
I performed the CEUS preoperatively without sedation in all the dogs. The ultrasound equipment
(Aplio 500, Canon Medical Systems, Tochigi, Japan) using a 5–11 MHz broadband linear transducer
(PVT-704 AT, Canon Medical Systems, Tochigi, Japan) was optimized for pulse subtracting imaging.
The CEUS procedure was performed by the author to ensure consistent imaging conditions throughout
the study. All the dogs were positioned in left lateral recumbency for imaging of the liver. The
transducer was placed in the intercostal space parallel to the ribs with sufficient gel to minimize rib
shadowing. The right division in liver was identified under visual control in B-mode. In a quantitative
analysis using a contrast agent, hepatic artery, portal vein, and hepatic parenchyma at the level of porta
hepatis were simultaneously scanned in a transverse section via the intercostal approach (Figure 1A).
The CEUS examination was performed with a low mechanical index of 0.20, a frame rate of 15
frames/s, a Doppler gain of 80, a dynamic range of 45, and a focus of 3–5 cm in depth. The
microbubble contrast agent used was perfluorobutane within a hydrogenated egg phosphatidylserine
shell (Sonazoid®). All the dogs received a 22-gauge intravenous catheter in the cephalic vein with a
21-gauge butterfly catheter. Perfusion imaging was evaluated after a contrast agent (0.01 ml/kg) was
intravenously injected through catheter, and 3 ml of heparinized normal saline was flushed. This was
performed by one person throughout this study. The dose of microbubbles was determined according
to methods from our previous reports.25 The data generated for the first 30 s were saved as raw data in
the system hardware.
The ROI was placed at hepatic artery, portal vein, and hepatic parenchyma and adjusted
manually to maintain the same position when respiratory motion was present. An analysis of time-
intensity curve (TIC) was performed using a Contrast Harmonic Imaging Quantification (CHI-Q)
RAW Data package (Canon Medical Systems, Tochigi, Japan) installed on ultrasound equipment, and
the smoothing function for the TIC was set to 19. The time-to-peak (TTP) in hepatic artery, portal vein,

9
and hepatic parenchyma was defined as the time interval (in seconds) from the onset of the injection
to the peak of the TIC. For the TIC characterizations, the rising-time (RT) was defined as the time
interval (in seconds) from the first arrival of contrast agents to the peak of the TIC, and the rising-rate
(RR) was defined as an average increase of the signal (in decibels (dB)/s) between the first arrival
time of contrast agents and the peak of TIC (Figure 2). In addition, the PV-to-HP transit time (ΔHP-
PV) (in seconds) was calculated.
2.3 Assessment of repeatability
Eight healthy beagles were also used for the assessment of repeatability. The CEUS procedure was
performed on three different days (minimum one-week interval) in all the dogs without sedation.
Repeatability of all the CEUS parameters described above was assessed in this study.
2.4 Statistical analysis
A commercially available software (JMP Pro®, version 13.1.0, SAS Institute Inc, North Carolina,
USA) was used to perform statistical analyses. All the data were expressed as median values with
range. Repeatability was assessed by coefficient of variation (CV), and a small CV indicated a highly
reliable measurement. In this study, the Shapiro-Wilk test was used to evaluate normal distribution. If
the data distribution of measured parameter from healthy and extrahepatic congenital portosystemic
shunt dogs was normal, the Student’s t-test was used. If the data were not normally distributed, the
Wilcoxon rank sum test was used. Spearman’s rank correlation coefficient was used to assess the
correlation between the perfusion parameters and the PV/Ao ratio in dogs with extrahepatic congenital
portosystemic shunt. Receiver operating characteristic (ROC) curves with the Mann-Whitney U-test
were used to evaluate the accuracy of the parameters in distinguishing extrahepatic congenital

10
portosystemic shunt dogs from healthy dogs. Additionally, the area under the curve (AUC) was
calculated for each parameter. A P value less than 0.05 was considered statistically significant.

11
3. RESULTS
3.1 Study population
Eighteen dogs were initially included in the study, and no side effects were noticed in any of the dogs.
One dog was excluded because it was impossible to perform quantitative analysis due to poor image
quality. Finally, 17 dogs, including eight healthy dogs and nine dogs with extrahepatic congenital
portosystemic shunt were enrolled in the present study. Dogs in the extrahepatic congenital
portosystemic shunt group were three intact males, one castrated male, one intact female, and four
spayed females. The median age was 38 (range, 6–111) months, and weight was 2.4 (1.3–7.0) kg. The
extrahepatic congenital portosystemic shunt dog breeds included two each of mixed-breed dogs and
Yorkshire terriers, and one each of Miniature Schnauzer, Shiba, Toy Poodle, Maltese, and Chihuahua.
Shunt morphology was classified based on a previous report26 and included three each of spleno-caval
and spleno-azygos, and one each of spleno-phrenic, right gastric-caval, and right gastric-azygos with
caudal loop. The median PV/Ao ratio in the extrahepatic congenital portosystemic shunt group was
0.55 (range, 0.41–0.91).
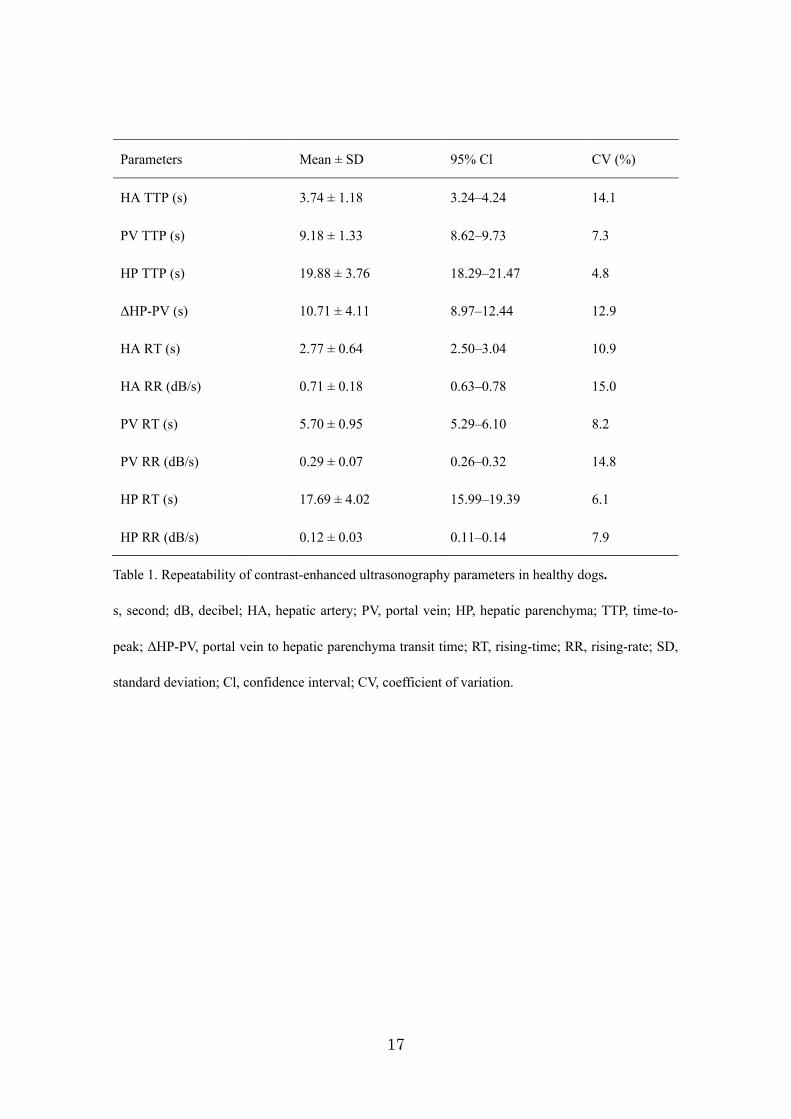
3.2 Assessment of repeatability
I initially assessed the repeatability of CEUS parameters in all healthy dogs without sedation. Table 1
presents the CV and 95% confidence interval (CI) in the present study. The CVs of all the parameters
in hepatic microvascular perfusion were 4.8–15.0% with moderate to high (relatively low CV)
repeatability.
3.3 CEUS analysis
12
In the healthy dogs, after the contrast agent administration, the microbubbles first reached the hepatic
artery (Figure 1B) and, then, immediately reached peak enhancement. After a delay of several seconds,
the microbubbles reached portal vein and hepatic parenchyma. They reached peak enhancement in
portal vein (Figure 1C). Then, the microbubbles gradually reached peak enhancement in hepatic
parenchyma (Figure 1D). Conversely, in the dogs with extrahepatic congenital portosystemic shunt,
immediately after the microbubbles reached the hepatic artery (Figure 3A), they reached the hepatic
parenchyma and rapidly reached peak enhancement (Figure 3B). Then, the microbubbles finally
reached peak enhancement in portal vein (Figure 3C).
The TIC was made for the healthy and extrahepatic congenital portosystemic shunt dogs. In
the healthy dogs, the TTP of hepatic parenchyma was long, and the TIC of hepatic parenchyma showed
a gradually rising curve (Figure 4A). On the other hand, the TTP of hepatic parenchyma in dogs with
extrahepatic congenital portosystemic shunt was earlier than in healthy dogs, and the TIC of hepatic
parenchyma in extrahepatic congenital portosystemic shunt dogs showed a rapidly rising curve (Figure
4B).
The TTP and ΔHP-PV measured from TIC were compared between healthy and extrahepatic
congenital portosystemic shunt dogs and are shown in Table 2. The TTP of hepatic artery in
extrahepatic congenital portosystemic shunt dogs was significantly different from healthy dogs (P =
0.0023). Furthermore, the TTP of hepatic parenchyma in extrahepatic congenital portosystemic shunt
dogs was significantly earlier than in healthy dogs (P = 0.0018). Conversely, the TTP of the portal
vein was not different between extrahepatic congenital portosystemic shunt and healthy dogs. The
ΔHP-PV in extrahepatic congenital portosystemic shunt dogs was shorter compared with that in
healthy dogs (P = 0.0018).
Table 3 shows the characteristics of TIC in hepatic artery, portal vein, and hepatic
parenchyma. In the extrahepatic congenital portosystemic shunt dogs, a rapidly rising form of TIC of

13
hepatic parenchyma was like that of portal vein. The RT of the hepatic artery in the extrahepatic
congenital portosystemic shunt dogs was significantly earlier than in the healthy dogs (P = 0.0153).
The RR of hepatic artery in extrahepatic congenital portosystemic shunt dogs was significantly higher
compared to that in healthy dogs (P = 0.0033). In the hepatic parenchyma, the RT in extrahepatic
congenital portosystemic shunt dogs was significantly earlier than that in healthy dogs (P = 0.0024).
Additionally, the RR of hepatic parenchyma in extrahepatic congenital portosystemic shunt dogs was
significantly higher compared to that in healthy dogs (P = 0.0007). On the other hand, the RT and RR
in portal vein were not significantly different between dogs with extrahepatic congenital portosystemic
shunt and healthy dogs. In addition, the RT in hepatic parenchyma (r = 0.8703, P = 0.0023) and ΔHP-
PV (r = 0.8167, P = 0.0072) showed good correlation with PV/Ao ratio in dogs with extrahepatic
congenital portosystemic shunt. However, the TTP and RR in hepatic parenchyma did not significantly
correlate with PV/Ao ratio.
3.4 ROC analysis
Sensitivity and specificity were determined by selecting the cut-off point along each ROC curve that
maximized sensitivity and maintained maximal or near maximal accuracy to avoid excessively
reducing specificity. According to the ROC analysis, AUC was 0.94 on RT of hepatic parenchyma,
0.99 on RR of hepatic parenchyma, and 0.95 on ΔHP-PV, and there was a significant difference (P
value of all parameters < 0.0005). The cut-off value was < 14.8 s on RT of hepatic parenchyma,
providing 100% sensitivity and 75.0% specificity for distinguishing extrahepatic congenital
portosystemic shunt dogs from healthy dogs. The cut-off value was > 0.16 dB/s on RR of hepatic
parenchyma, providing 100% sensitivity and 87.5% specificity for distinguishing extrahepatic
congenital portosystemic shunt dogs from healthy dogs. The cut-off value was < 7.3 s on ΔHP-PV,

14
providing 100% sensitivity and 75.0% specificity for distinguishing extrahepatic congenital
portosystemic shunt dogs from healthy dogs.
15
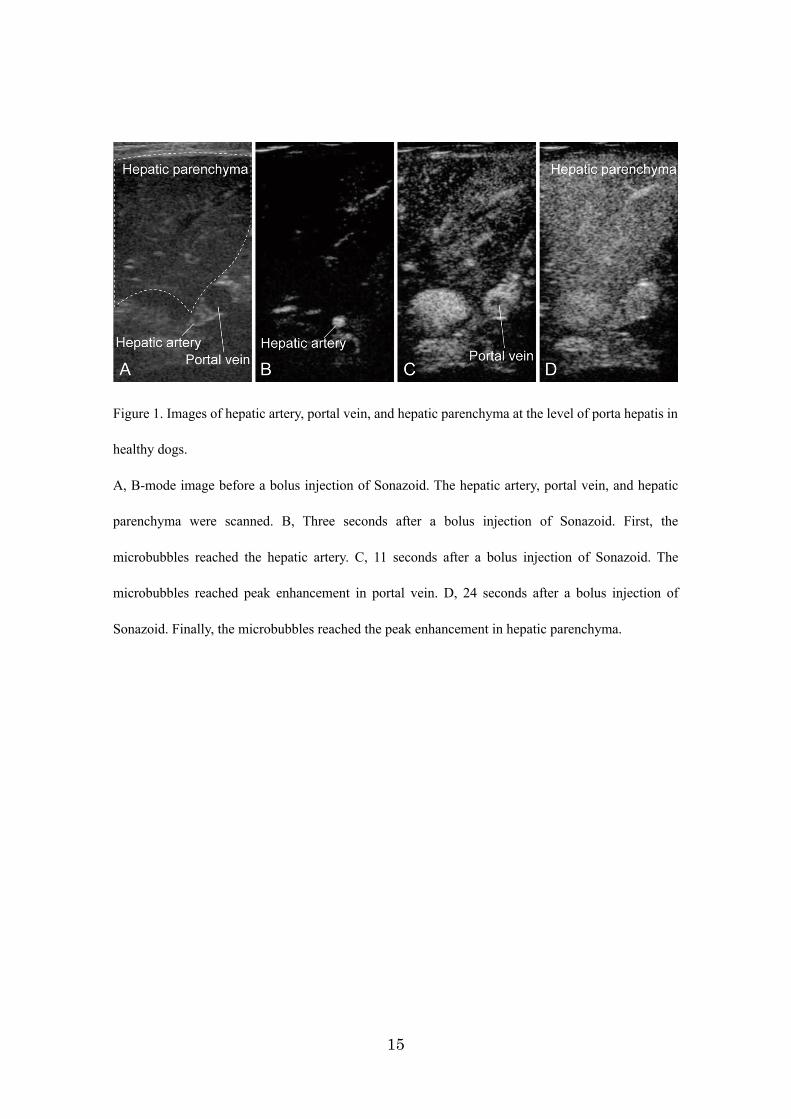
Figure 1. Images of hepatic artery, portal vein, and hepatic parenchyma at the level of porta hepatis in
healthy dogs.
A, B-mode image before a bolus injection of Sonazoid. The hepatic artery, portal vein, and hepatic
parenchyma were scanned. B, Three seconds after a bolus injection of Sonazoid. First, the
microbubbles reached the hepatic artery. C, 11 seconds after a bolus injection of Sonazoid. The
microbubbles reached peak enhancement in portal vein. D, 24 seconds after a bolus injection of
Sonazoid. Finally, the microbubbles reached the peak enhancement in hepatic parenchyma.

16
Figure 2. Schematic illustration of contrast-enhanced ultrasonography parameters measured from
time-intensity curve.
17
Table 1. Repeatability of contrast-enhanced ultrasonography parameters in healthy dogs.
s, second; dB, decibel; HA, hepatic artery; PV, portal vein; HP, hepatic parenchyma; TTP, time-to-
peak; ΔHP-PV, portal vein to hepatic parenchyma transit time; RT, rising-time; RR, rising-rate; SD,
standard deviation; Cl, confidence interval; CV, coefficient of variation.
Parameters Mean ± SD 95% Cl CV (%)
HA TTP (s) 3.74 ± 1.18 3.24–4.24 14.1
PV TTP (s) 9.18 ± 1.33 8.62–9.73 7.3
HP TTP (s) 19.88 ± 3.76 18.29–21.47 4.8
ΔHP-PV (s) 10.71 ± 4.11 8.97–12.44 12.9
HA RT (s) 2.77 ± 0.64 2.50–3.04 10.9
HA RR (dB/s) 0.71 ± 0.18 0.63–0.78 15.0
PV RT (s) 5.70 ± 0.95 5.29–6.10 8.2
PV RR (dB/s) 0.29 ± 0.07 0.26–0.32 14.8
HP RT (s) 17.69 ± 4.02 15.99–19.39 6.1
HP RR (dB/s) 0.12 ± 0.03 0.11–0.14 7.9
18
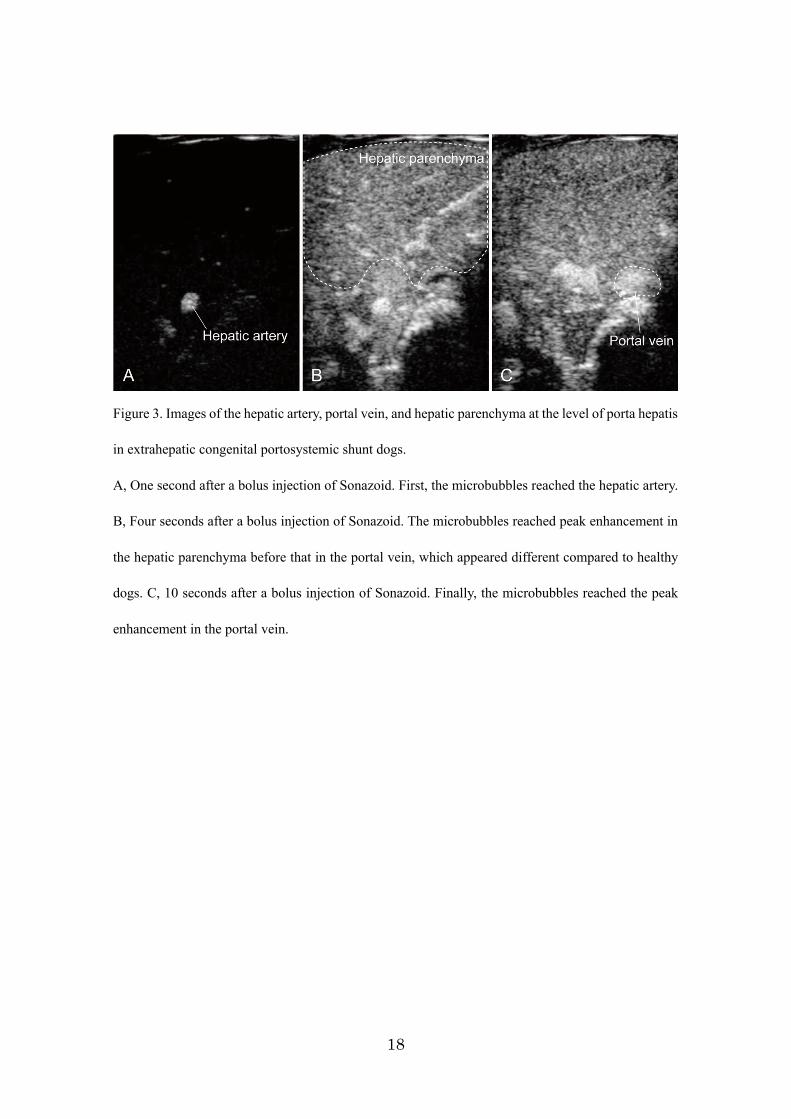
Figure 3. Images of the hepatic artery, portal vein, and hepatic parenchyma at the level of porta hepatis
in extrahepatic congenital portosystemic shunt dogs.
A, One second after a bolus injection of Sonazoid. First, the microbubbles reached the hepatic artery.
B, Four seconds after a bolus injection of Sonazoid. The microbubbles reached peak enhancement in
the hepatic parenchyma before that in the portal vein, which appeared different compared to healthy
dogs. C, 10 seconds after a bolus injection of Sonazoid. Finally, the microbubbles reached the peak
enhancement in the portal vein.

19
Figure 4. Time-intensity curve (TIC) of the hepatic artery (HA; chain line), portal vein (PV; dotted
line), and hepatic parenchyma (HP; solid line) in a healthy (A) and an extrahepatic congenital
portosystemic shunt dog (B).
In the healthy dog, TIC showed the gradually rising curve, and the microbubbles reached the peak
intensity of hepatic parenchyma (arrow) after that of portal vein. On the other hand, in an extrahepatic
congenital portosystemic shunt dog, TIC showed the rapidly rising curve and the microbubbles
reached the peak intensity of hepatic parenchyma (arrow) before that of portal vein. The time-to-peak
of hepatic parenchyma in an extrahepatic congenital portosystemic shunt dog was markedly earlier
than that in a healthy dog.

20
Table 2. Time-to-peak differences among the hepatic artery, portal vein, and hepatic parenchyma in
healthy and extrahepatic congenital portosystemic shunt dogs.
Letters in superscript within a row are expressed as median (range). s, second; HA, hepatic artery; PV,
portal vein; HP, hepatic parenchyma; TTP, time-to-peak; ΔHP-PV, portal vein to hepatic parenchyma
transit time; EH-CPSS, extrahepatic-congenital portosystemic shunt.
Parameters Healthy Dogs (n = 8) EH-CPSS (n = 9) P Value
HA TTP (s)a 3.9 (3.1–4.6) 2.4 (1.3–3.3) 0.0023
PV TTP (s) a 9.3 (7.7–10.9) 8.6 (5.0–10.3) 0.1346
HP TTP (s) a 19.9 (13.5–24.4) 8.5 (5.5–16.5) 0.0018
ΔHP-PV (s) a 10.6 (3.8–15.1) 0.1 (−4.8–7.3) 0.0018

21
Table 3. Time-intensity curve characteristics in the hepatic artery, portal vein, and hepatic parenchyma.
Letters in superscript within a row are expressed as median (range). s, second; dB, decibel; HA, hepatic
artery; PV, portal vein; HP, hepatic parenchyma; RT, rising-time; RR, rising-rate; EH-CPSS,
extrahepatic-congenital portosystemic shunt.
Parameters Healthy Dogs (n = 8) EH-CPSS (n = 9) P Value
HA RT (s)a 2.6 (2.4–3.5) 2.2 (1.2–2.7) 0.0153
HA RR (dB/s) a 0.84 (0.47–0.93) 1.20 (0.74–1.70) 0.0033
PV RT (s) a 5.9 (4.0–6.8) 6.0 (4.7–8.6) 0.4998
PV RR (dB/s) a 0.33 (0.24–0.43) 0.38 (0.30–0.66) 0.0825
HP RT (s) a 16.7 (11.8–22.0) 7.7 (4.1–14.8) 0.0024
HP RR (dB/s) a 0.14 (0.08–0.16) 0.33 (0.16–0.62) 0.0007

22
4. DISCUSSION
Portal venous hypoperfusion in dogs with congenital portosystemic shunt causes stereotypical
histological responses of the liver, which include a reduction or absence of portal vein profile in portal
tracts and an increased number of arteriolar profiles. Particularly, an increased number of arterioles
would reflect a compensatory increase in hepatic artery blood flow due to a decrease in the portal vein
blood flow.27,28 However, detecting these mechanical alterations is difficult because assessing liver
perfusion requires real-time and high-resolution diagnostic imaging techniques. Therefore, changes in
hepatic microvascular perfusion in dogs with extrahepatic congenital portosystemic shunt have not
been demonstrated using diagnostic imaging techniques. A previous pilot study was the first to report
changes in hepatic parenchymal perfusion in three dogs with extrahepatic congenital portosystemic
shunt using CEUS.29 However, this study did not examine the simultaneous hepatic microvascular
perfusion change including hepatic artery, portal vein, and hepatic parenchyma. Therefore, a
compensatory increase in hepatic artery blood flow has not yet been demonstrated. In the present study,
I assessed the perfusion of hepatic artery and portal vein, as well as that of hepatic parenchyma.
Additionally, I also determined whether assessing microvascular perfusion using CEUS can contribute
as an additional diagnostic test to diagnose dogs with extrahepatic congenital portosystemic shunt.
In the present study, I initially evaluated the repeatability of CEUS parameters because one
of the disadvantages of CEUS is its relatively high degree of variability, which may ca use diagnostic
uncertainty in humans. A previous study has reported that patient variables such as body temperature,
heart rate, cardiac output, blood pressure, and respiratory rate, and physiologic factors such as
phagocytosis ability will affect the number of circulating microbubbles and their characteristics.30
Meanwhile, little is known about the factors affecting CEUS parameters in dogs and cats. To the best
of our knowledge, there are only two studies investigating the TTP in hepatic artery and portal vein in
23
anesthetized healthy dogs. One of these studies described that TTP in the aorta (instead of hepatic
artery) and portal vein were 13.5 ± 3.37 s and 27.5 ± 4.09 s, respectively, using Levovist® (Schering
AG, Berlin, Germany) as a contrast agent. 31 The other study showed that TTP in hepatic artery and
portal vein were respectively 10 s and 30 s, using the same contrast agent as that used in the current
study.32 In my study, TTP of hepatic artery and portal vein in healthy dogs is 3.74 ± 1.18 s and 9.18 ±
1.33 s, respectively, which are much earlier than that of the previous two reports. For hepatic
parenchyma, two reports described that TTP of hepatic parenchyma was 45 ± 26.63 s, which is also
slower than my data (19.88 ± 3.76 s).32,33 These different results in TTP may be caused by many factors,
such as the injected speed of the contrast agent or saline, type of contrast agent, setting of ultrasound
machine, difference of dog’s body size, or use of anesthesia. Therefore, to reduce this variability, I do
not use anesthesia, and the contrast agent is injected by the same person throughout the study in
addition to standardizing image acquisition and data processing. However, I cannot control the
variability caused by the physiological or physical factors of the dog and the contrast agent. For
example, differences in a dog’s body size may influence the TTP in terms of distance to the liver from
the cephalic vein where the contrast agent is administered. Hence, I propose RT, RR, and ΔHP-PV to
reduce the influence of these other factors. The RT and RR directly reflect perfusion within the liver,
because they show from first arrival of the echogenic bubbles of contrast agent to peak enhancement.
In the ΔHP-PV, the portal vein serves as an in vivo reference. Additionally, I initially investigate the
repeatability for the hepatic microvascular perfusion with the same dog on different days. A CV < 25%
has been considered clinically acceptable based on previous study of CEUS in human and animals.34,35
Consequently, parameters of hepatic parenchyma show highly repeatability (CVs; ≤ 7.9%). On the
other hand, parameters of the hepatic artery and portal vein are moderately repeatable, because
parameters within the vessel may be more directly affected by a dog’s condition. However, the interday
24
CVs for all the parameters are ≤15%, and all the parameters are feasible for assessing hepatic
microvascular perfusion in dogs.
CEUS with a single contrast agent (Sonazoid®) was conducted to characterize the
simultaneous hepatic microvascular perfusion in the hepatic artery, portal vein, and hepatic
parenchyma in healthy dogs. The TIC of hepatic parenchyma in healthy dogs shows a gradually rising
curve characterized by a long TTP and RT and low RR findings. First, contrast injected via the cephalic
vein reaches the liver through the hepatic artery blood flow. The hepatic artery forms the peribiliary
capillary plexus network around bile ducts to nourish the biliary system, and finally, some of the
capillaries enter directly into sinusoids or occasionally the terminal portal venules. Furthermore, portal
vein supplied from the intestines, pancreas, spleen, and gallbladder enters the sinusoids. The mixture
of both hepatic artery and portal vein blood penetrates through the sinusoids and collects in a central
vein that drains into the hepatic veins. The gradually rising curve of hepatic parenchyma likely is
reflecting the extensive vascular bed characterized by slow, continuous flow.
The TIC of hepatic parenchyma in extrahepatic congenital portosystemic shunt dogs showed
a difference from that of healthy dogs. The TIC of hepatic parenchyma in extrahepatic congenital
portosystemic shunt dogs shows rapidly rising curve characterized by a short TTP and RT and high
RR. Furthermore, parameters of the hepatic artery in extrahepatic congenital portosystemic shunt dogs
also showed a difference from that of healthy dogs. ΔHP-PV in extrahepatic congenital portosystemic
shunt dogs is fairly early compared with healthy dogs, which supports a previous pilot study in which
the perfusion of hepatic parenchyma was evaluated in three dogs with extrahepatic congenital
portosystemic shunt using CEUS.29 In a normal liver, it is known that the portal vein provides
approximately 70%–80 % of the blood supply, carrying nutrients and various other substances to the
liver.7 However, in extrahepatic congenital portosystemic shunt dogs, portal vein blood flow is reduced,
leading to an increase in arterial blood flow to the liver, in other words ‘arterialization’.36,37 The rapid

25
enhancement of hepatic parenchyma and parameters of hepatic artery reflect a compensatory increase
in the hepatic arterial blood flow (arterialization) in the livers of dogs with extrahepatic congenital
portosystemic shunt. Interestingly, PV/Ao ratio in extrahepatic congenital portosystemic shunt is
significantly correlated with the RT of hepatic parenchyma and ΔHP-PV. From these findings, PV/Ao
ratio not only indicates the decreased portal vein blood flow, but also may indirectly reflect the degree
of arterialization.
One of the most difficult ultrasonographic challenges in veterinary medicine is the diagnosis
of extrahepatic congenital portosystemic shunt. Sensitivity and specificity of conventional
ultrasonography for the diagnosis of extrahepatic congenital portosystemic shunt has been reported to
be 74% to 98% and 67% to 100%, respectively.38-40 However, due to the specific limiting factors such
as gastrointestinal gas, patient conformation, and operator-dependent nature, it is occasionally difficult
to detect abnormal vessels by ultrasonography. Therefore, several reports have described the
usefulness of additional diagnostic tests, such as PV/Ao ratio or portal vein flow velocity for the
diagnosis of extrahepatic congenital portosystemic shunt.40-43 In this study, I evaluate whether the
assessment of hepatic microvascular perfusion using CEUS can reliably distinguish dogs with
extrahepatic congenital portosystemic shunt from healthy dogs. As a screening test, it is important that
the test has high sensitivity. Therefore, I selected a cut-off point along each ROC curve that maximizes
sensitivity and maintains maximal or near maximal accuracy to avoid excessively reducing specificity
in the present study. However, a compensatory increase in the hepatic arterial blood flow
(arterialization) may be caused by other liver disease. Several reports have described that human
patients with cirrhosis or portal hypertension have reduced portal vein blood flow to the liver and
increased hepatic artery blood flow.44-47 In dogs, our previous study described that dogs with portal
hypertension experimentally induced by intraportal injection of microspheres showed the hepatic
hemodynamic change by using CEUS with a single contrast agent (Sonazoid®).48 However, portal

26
hypertension may be distinguishable with a thorough sonographic examination. Cirrhosis, which is
the end stage of hepatic fibrosis, is caused by chronic liver disease such as chronic hepatitis or
cholangiohepatitis. Cirrhosis can also be easily distinguished, because the liver may be small and
irregular in shape with regenerative nodules. In addition, a dog with cirrhosis will have an abnormal
liver function and a large amount of free peritoneal fluid.15 For this reason, the assessment of hepatic
microvascular perfusion using CEUS in addition to conventional B-mode ultrasound imaging may be
useful in distinguishing dogs with extrahepatic congenital portosystemic shunt from healthy dogs.
This study has several limitations. First, this study does not include dogs with various
parenchymal liver diseases leading to changes in hepatic microvascular perfusion. Further study is
needed to establish CEUS characteristics in dogs with various parenchymal liver diseases. Second, a
histopathological examination of the liver in healthy dogs was not performed. Third, this study
enrolled extrahepatic congenital portosystemic shunt dogs that were mainly small- to medium-sized
dogs. In Japan, small- to medium-sized dogs, including Miniature Schnauzer, Toy Poodle, or Yorkshire
terrier were reported to have a high risk for extrahepatic congenital portosystemic shunt,42 which is
similar to reports in North America and the Netherlands.26,49 Although the difference in the dog’s body
size may influence CEUS parameters (especially TTP) in terms of distance to the liver from cephalic
vein, this study showed that the TTP of portal vein was similar for healthy dogs and extrahepatic
congenital portosystemic shunt dogs. Furthermore, blood pressure may affect CEUS parameter and
was not measured in both the groups of this study. Therefore, the RT, RR, and ΔHP-PV were assessed
to reduce the influence of these limitations. Thus, it is likely the changes in hepatic microvascular
perfusion in this study are caused by the existence of shunt vessels. Last, this study is not undertaken
by a blinded operator. Further blinded study is needed to confirm the accuracy of this study.

27
5. SUMMARY
In this chapter, hepatic microvascular perfusion was characterized by simultaneously evaluating the
perfusion of the hepatic artery, portal vein, and hepatic parenchyma in dogs with extrahepatic
congenital portosystemic shunt using CEUS. The enhancement of hepatic artery and hepatic
parenchyma in dogs with extrahepatic congenital portosystemic shunt was significantly more rapid
than that in healthy dogs. These results reflect a compensatory increase in the hepatic artery blood
flow (arterialization) caused by a decrease in portal vein blood flow. The results of the present study
will help enhance the understanding of pathophysiology of dogs with extrahepatic congenital
portosystemic shunt. Moreover, the RT and RR of hepatic parenchyma and ΔHP-PV for dog in this
study showed the highest discretionary accuracy. The assessment of hepatic microvascular perfusion
using CEUS may help distinguish dogs with extrahepatic congenital portosystemic shunt from healthy
dogs.

28
CHAPTER 2
EVALUATION OF LIVER AND SPLEEN ELASTIC MODULUS OF HEALTHY DOGS BY
USE OF TWO-DIMENSIONAL SHEAR WAVE ELASTOGRAPHY

29
1. INTRODUCTION
Chronic liver damage results in an increase in the extracellular matrix produced by fibroblast-like cells,
and the progression of liver fibrosis leads to stiffer liver parenchyma.50 Additionally, portal
hypertension, which is caused by fibrotic hepatopathies, often results in splenomegaly and a stiffer
spleen in humans.51 Severity of liver fibrosis and portal hypertension may be evaluated by the
quantification of liver and spleen elastic modulus by use of 2D-SWE in human patients with chronic
liver disease.52-55 In contrast to the literature for humans, no reports have evaluated the feasibility of
using 2D-SWE for the evaluation of severity of liver fibrosis in dogs with chronic liver disease.
Assessments of repeatability (intraday variability) and reproducibility (interday variability)
of 2D-SWE in the evaluation of liver and spleen elastic modulus are important prerequisites before
2D-SWE can be used in clinical settings. Therefore, the objective of chapter 2 was to evaluate the
applicability, repeatability, and reproducibility of 2D-SWE of the liver and spleen in healthy dogs.
Furthermore, results of the study could provide reference values for tissue elastic modulus that might
be used in the evaluation of dogs with liver and splenic diseases.
30
2. MATERIAL AND METHODS
2.1 Animals
Eight healthy beagles (5 sexually intact females and 3 sexually intact males) were included in the study.
Dogs were between 1 and 4 years of age, and body weight was between 9.7 and 15 kg. All dogs were
confirmed to be healthy on the basis of results of a physical examination, CBC, serum biochemical
analysis, echocardiography, and abdominal ultrasonography. All animal experimental procedures were
conducted in accordance with standard protocols of the institutional animal experimental committee
reviewed by the Association for Assessment and Accreditation of Laboratory Animal Care
International. All animal experiments were approved by the Animal Experimentation Committee of
the Graduate School of Veterinary Medicine at Hokkaido University (Accession No. 18-0075).
2.2 Measurement of 2D-SWE
Food was withheld from dogs for 12 hours, and conventional B-mode ultrasonography and 2D-SWE
then were performed with an ultrasound scanner (Canon Medical Systems) as described in chapter 1.
The author performed examinations to ensure consistent imaging conditions throughout the study.
Conventional B-mode ultrasonography with a 7.0-MHz convex transducer (PVT-712 BT, Canon
Medical Systems, Tochigi, Japan) was performed before 2D-SWE; it was used for general imaging of
the liver and spleen. The ultrasonographer performed 2D-SWE with a 3.5-MHz convex transducer
(PVT-375 BT, Canon Medical Systems, Tochigi, Japan) 3 times in 1 day (4-hour intervals) and on 3
separate days (1-week interval). Dogs were not sedated for ultrasonography or 2D-SWE.
In accordance with recommended guidelines for the clinical use of elastography in humans11,
all dogs were initially positioned in left lateral recumbency for imaging of the right lobe of the liver.
The probe was placed parallel to and within the intercostal space with a sufficient amount of gel to

31
minimize rib shadowing. The probe was positioned to acquire images of the parenchyma of the right
lobe of the liver during visual assessment in 2D B-mode ultrasonography; measurements were
obtained at depths of up to 45 mm. All dogs were positioned in dorsal recumbency for acquisition of
spleen images. The probe was maintained perpendicular to the curve of the body surface, and
measurements were obtained in the parenchyma of the main portion of the spleen at depths of up to
35 mm. The 2D-SWE of the liver and spleen was performed during the end-expiratory phase or
respiration to minimize effects of respiratory motion.
The display mode could be changed among 3 options after data acquisition: speed mode,
elasticity mode, and propagation mode (Figure 5). The speed mode displayed SWV with a map (range,
0.5 to 6.5 m/s). In contrast, the elasticity mode displayed the Young modulus with another map (range,
0 to 120 kPa). Both maps were obtained so that I could display distributions of shear wave propagation
speed in semitransparent 2D color images, which was overlaid on the B-mode image. SWV and the
Young modulus were displayed as a gradation of colors on the 2 maps, with increasing elastic modulus
in an ascending order of blue, green, yellow, and red. Regions that were not color coded on elasticity
images indicated absence of a shear wave.
The propagation mode could be used to provide guidance to evaluate whether ROI
placement was accurate in the speed or elasticity mode. A tissue ROI generally needs to be placed in
an area with parallel contour lines. The ROI was set at 8 to 10 mm in diameter and excluded regions
that were not color coded. The ROI was positioned in the parenchyma of the right lobe approximately
10 mm deep to the liver capsule and in the parenchyma of the spleen approximately 5 mm deep to the
spleen capsule (Figure 6). At least 10 valid measurements were obtained for each dog. Mean values
of SWV and the Young modulus were considered representative of elasticity values in the liver and
spleen.
To compare liver elastic modulus between the right and left lobes of the liver, the left lobe

32
of the liver of each dog was evaluated by use of 2D-SWE. All dogs were positioned in right lateral
recumbency for imaging of the left lobe of the liver, and liver elastic modulus was measured by use
of the same protocol used for the right lobe of the liver. Assessment with 2D-SWE was performed 3
times in 1 day (4-hour intervals).
2.3 Statistical analysis
All data of continuous variables were expressed as mean ± SD. Statistical analyses were performed
with commercially available software (as described in chapter 1). A fixed-effect linear model was used
to analyze intraday and interday variabilities as follows:
Yijk = μ + dogi + dayj + (dog X day)ij + εijk
where Yijk is the first value measured for dog i on day j, μ is the overall mean, dogi is the differential
effect of dog i, dayj is the differential effect of day j, (dog X day)ij is the interaction between dog i and
day j, and εijk is the model error. The SD of intraday variability was estimated as the residual SD of
the model, and the SD of interday variability was estimated as the SD of the differential effect of day.
The CV was obtained by dividing each SD by the mean. A small CV indicates a highly reliable
measurement, and a CV < 30% was considered clinically acceptable on the basis of a study56 on SWE
in humans. The 95% CI was calculated by multiplying SD by 2.069.57 The CIs provided an estimated
range of values that were likely to include an unknown population parameter from the data obtained,
and they represented a probability of < 0.05 that a true change for an individual dog would be detected.
Comparison between the right lobe of the liver and spleen elastic modulus was conducted by use of a
linear mixed model, with the measurement number (6 measurements) for each dog, organ (right lobe
of the liver and spleen), and interaction term as categorical fixed effects and dog as a fixed effect. An
F test was performed to assess effects of measurement number and organ. A t test was performed to
assess significant differences between organs. Bland-Altman analysis with modifications for repeated

33
measures was performed to assess the agreement of liver elastic modulus between the right and left
lobes of the liver.58 Mean of the difference (bias) and the 95% CI for bias were calculated. The 95%
CI for bias was compared with 0 and was considered significant when it did not contain 0. The 95%
limits of agreement (mean of the difference ± [1.96 X SD]) were also calculated. For all statistical
comparisons, values of P < 0.05 were considered significant.

34
3. RESULTS
3.1 Assessment of repeatability and reproducibility
The 2D-SWE was successfully performed on the liver and spleen of all 8 dogs. All variables were
summarized (Table 4). There was high repeatability and reproducibility (ie, low CVs) for 2D-SWE of
the right lobe of the liver. Intraday and interday CVs for SWV in the right lobe of the liver were 3.9%
and 4.6%, respectively, whereas intraday and interday CVs for the Young modulus in the right lobe of
the liver were 8.7% and 10.0%, respectively. There was also high repeatability and reproducibility for
2D-SWE of the spleen. Intraday and interday CVs for SWV in the spleen were 8.0% and 6.1%,
respectively, whereas intraday and interday CVs for the Young modulus in the spleen were 20.7% and
12.2%, respectively.
3.2 2D-SWE analysis between the right lobe of the liver and spleen
Mean ± SD values for 2D-SWE of the right lobe of the liver were 1.51 ± 0.08 m/s and 6.93 ± 0.79 kPa.
Mean values for 2D-SWE of the spleen were 2.18 ± 0.27 m/s and 14.66 ± 3.79 kPa. Elastic modulus
was compared between the right lobe of the liver and spleen by use of a linear mixed model and
reported as the least squares mean and 95% CI (Figure 7). Results of 2D-SWE for both SWV and the
Young modulus were significantly (P < 0.001) higher in the spleen than in the right lobe of the liver.
3.3 Comparison between the right and left lobes of the liver
Elastic modulus was compared between the right and left lobes of the liver. Mean ± SD values for 2D-
SWE of the left lobe of the liver lobe were 1.42 ± 0.07 m/s and 6.02 ± 0.61 kPa. Results of Bland-
Altman analysis with modifications for repeated measures were graphically illustrated (Figure 8).
Mean bias for 2D-SWE between the right and left lobes of the liver by use of SWV was 0.09 m/s (95%

35
CI, 0.02 to 0.17 m/s). Mean bias for 2D-SWE between the right and left lobes of the liver by use of
the Young modulus was 0.83 kPa (95% CI, 0.15 to 1.51 kPa). Elasticity values for both the SWV and
Young modulus were significantly higher in the right lobe of the liver than in the left lobe of the liver.

36
Figure 5. Images of the right lobe of the liver of a dog for the speed mode (A and B) and
elasticity mode (C and D) of 2D-SWE.
Images for the speed mode are the shear wave velocity map (A) and map for the propagation
mode (B); images for the elasticity mode are the shear wave elasticity map (C) and map for
the propagation mode (D). Notice the consistent parallel contour lines for the speed and
elasticity modes.

37
Figure 6. Images of the right lobe of the liver (A and B) and spleen (C and D) of a dog used to
measure elastic modulus for the speed mode of 2D-SWE.
Elastic modulus was measured as shear wave velocity (meters per second) in the parenchyma
of the right lobe of the liver and as the Young modulus (kilopascals) in the parenchyma of the
spleen. Notice the ROIs (T1, T2, and T3; 10 mm) used for the measurements (circles).

38
variable Mean ± SD Intraday Interday
Cl* SD† CV (%) Cl* SD‡ CV (%)
Liver
Shear wave velocity (m/s) 1.51 ± 0.08 0.17 0.08 3.9 0.17 0.08 4.6
Young modulus (kPa) 6.93 ± 0.79 1.61 0.78 8.7 1.66 0.80 10.0
Spleen
Shear wave velocity (m/s) 2.18 ± 0.27 0.62 0.30 8.0 0.52 0.25 6.1
Young modulus (kPa) 14.66 ± 3.79 8.83 4.27 20.7 7.12 3.44 12.2
Table 4. Results of 2D-SWE for the right lobe of the liver and spleen of 8 healthy dogs.
For all 8 dogs, 2D-SWE was performed 3 times in 1 day (4-hour intervals) to determine intraday CV and on 3 separate days (1-week interval) to determine
interday CV. *Calculated as SD X 2.069. †Estimated as the residual SD of the model. ‡Estimated as the SD of the differential effect of day.

39
Figure 7. Comparison between the elastic modulus of the right lobe of the liver and spleen of 8 dogs
measured as the shear wave velocity (A) and Young modulus (B) of 2-D SWE.
Data represent least squares mean and 95% CI. *Value differs significantly (P < 0.001) from the value
for the right lobe of the liver.

40
Figure 8. Bland-Altman plots with modifications for repeated measures of differences in elastic
modulus between the right and left lobes of the liver of 8 dogs measured as the shear wave velocity
(A) and Young modulus (B) of 2-D SWE.
The mean of the difference (bias; solid horizontal line) and 95% CI for the bias (mean ± [1.96 X SD];
dashed horizontal lines) are indicated.

41
4. DISCUSSION
Histologic examination of liver biopsy specimens is the criterion-referenced method for diagnosis and
monitoring of chronic hepatitis and cirrhosis, but it is sometimes difficult to obtain biopsy specimens
because of a patient’s poor condition and complications associated with the procedure.18,19 For humans,
investigators of many studies53-55 have reported that shear wave imaging is an alternative noninvasive
diagnostic modality to liver biopsy and is useful in noninvasively assessing the severity of liver
fibrosis through evaluation of liver elastic modulus. Although the cause of chronic hepatitis in dogs
currently remains unknown, some histopathologic features of chronic hepatitis in dogs are similar to
those of humans with chronic hepatitis, such as mixed inflammatory cell infiltration and fibrosis.59
The usefulness of shear wave imaging for the diagnosis of liver fibrosis has been investigated in
veterinary medicine. Investigators of 1 study60 reported that transient elastography is applicable for
dogs with experimentally induced hepatic disease. Those authors concluded that the best
measurements of liver elastic modulus are obtained in the right lobe of the liver with a dog positioned
in left lateral recumbency.60 However, transient elastography, which is a 1-D modality, cannot display
an anatomic B-mode image, and its performance is inferior to techniques that involve the use of ARFI.
Investigators reported that transient elastography is less accurate than 2D-SWE for the assessment of
severe fibrosis in humans with chronic hepatitis C.61 In another study that involved the use of 2D-
SWE, liver elastic modulus obtained in the right lobe of the liver was positively correlated with the
stage of liver fibrosis in dogs with CCl4-induced liver fibrosis.62 However, 2D-SWE was performed
on anesthetized dogs in that study, which did not provide reference values for liver elastic modulus in
healthy dogs. In accordance with the recommended guidelines for the clinical use of elastography in
humans11 and results for studies of dogs,60,62 I initially evaluated the feasibility of 2D-SWE for use on
the abdomen of conscious dogs, including assessing repeatability and reproducibility of measurements,

42
and also obtained reference values for tissue elastic modulus for both the SWV and Young modulus
of the right lobe of the liver and spleen in healthy dogs.
Mean SWV for the right lobe of the liver of the healthy dogs of the present study was 1.51
m/s, which is similar to findings obtained by use of 2D-SWE for the right lobe of the liver of healthy
humans (1.4 m/s).55 The liver is a highly vascular organ with large-diameter capillaries lined by
endothelial cells between rows of plates or cords of hepatocytes. The sinusoids also contain Kupffer
cells of the reticuloendothelial system. This arrangement imparts relative softness to the liver.
Results obtained in the study reported here indicated that SWV of 2D-SWE was highly
repeatable and reproducible in conscious dogs; the CV for all variables was < 10%. I speculated that
the clinically acceptable high repeatability and reproducibility of SWV of 2D-SWE in the present
study relied on the proper propagation mode, which is a component of the novel technology for 2D-
SWE. The proper propagation mode was displayed as arrival time contours with the shape of contour
lines. This mode allowed operators to preliminarily confirm whether shear waves propagated as
expected and verify the reliability of the data obtained. When the contour lines were nearly straight
and consistently parallel to each other, reliability of the data was high. In contrast, when the contour
lines were irregularly distorted and chaotic, the reliability of data was low. When the latter was
encountered, elastography had to be repeated to yield reliable results. Because shear wave propagation
speed becomes faster as tissue elastic modulus increases, the distance between contour lines is wider
(ie, blue to green) in regions with greater tissue elastic modulus and narrower (ie, blue to red) in
regions with lower tissue elastic modulus. The reliability of data may be verified by examining the
propagation map. In chronic liver disease, the shear wave propagation speed does not change, and the
intervals between the contour lines are constant. Thus, use of this novel technology may allow
objective assessment of the reliability of data simply by the examination of contour lines and may
enable investigators to select suitable areas for measurements of shear wave propagation speed.

43
On the other hand, intraday and interday CVs were higher for the Young modulus than for
the SWV of 2D-SWE and indicated moderate repeatability and reproducibility. The elastic modulus
of tissue may be estimated and expressed in kilopascals by a physical quantity called the modulus of
elasticity (ie, the Young modulus), which is defined as the ratio of the applied stress to the introduced
strain from the Hooke law.12 However, accurate data on the modulus of elasticity have not yet been
obtained because it cannot directly measure applied stress. On the other hand, shear wave propagation
speed may be calculated as the displacement of localized tissue under short-duration ARFI; therefore,
SWE may be used to measure the elasticity of tissue by use of the following formula: E = 3ρcs2, where
E is tissue elastic modulus measured in kilopascals, ρ is density of the tissue, and cs is SWV measured
in meters per second. By use of this principle, SWV of 2D-SWE is proportionally related to E, and it
also offers quantitative elastic information. The value for E may be calculated by use of the
aforementioned formula when the density of tissue is the same as that of water (ie, 1 g/mL); however,
soft tissues are inherently nonlinear, viscoelastic, and heterogeneous.11 In addition, because E is
calculated by use of the value for SWV, I speculated that all CVs were higher for the Young modulus
of 2D-SWE than for the SWV of 2D-SWE. Authors of a recent report10 advocate the reporting of
findings for humans as the SWV as part of a standardized approach to enable comparison among
modalities and machines. Results of the present study also supported the use of SWV of 2D-SWE
from the aspect of repeatability and reproducibility.
Elastic modulus of the spleen also was evaluated in the present study. The spleen is a good
target for the assessment of elastic modulus by ultrasonographic elastography. There is a change in
spleen elastic modulus with portal hypertension because human patients commonly have
splenomegaly secondary to portal hypertension.52,63 Spleen elastic modulus measured by use of
transient elastography is increased in patients with hepatitis C virus–induced cirrhosis and portal
hypertension, and transient elastography values may be used to predict the onset or severity of portal

44
hypertension.64 On the other hand, splenomegaly is a rare finding in dogs with portal hypertension.65
However, splenic congestion may occur secondary to portal hypertension and lead to an increase in
spleen elastic modulus. Thus, similar to the situation for humans, evaluations of spleen elastic modulus
may predict the onset or severity of portal hypertension in dogs with chronic hepatitis and cirrhosis.
The value of E for the spleen of healthy dogs in the present study was similar to that in the spleen of
healthy humans.66 Anatomically, the spleen comprises the parenchyma, including red and white pulp,
and also fibroelastic supporting tissue that forms the capsule, trabeculae, and a fine reticulum. This
arrangement causes the spleen to be a relatively stiff organ. Elasticity values for both the SWV and
Young modulus were significantly higher in the spleen than in the right lobe of the liver of the dogs
of the present study.
In the present study, elastic modulus in the left lobe of the liver was measured to enable us
to evaluate the feasibility of this technique for assessment of the left lobe of the liver and to compare
liver elastic modulus between the right and left lobes of the liver. Values for both the SWV and Young
modulus were significantly higher in the right lobe of the liver than in the left lobe of the liver. Studies
of humans have revealed differences in liver elastic modulus between sides, and those investigators
suggested that imaging of the left lobe in humans is often influenced by the movement of body organs,
such as the heart, lungs, diaphragm, and stomach.20,67 Furthermore, findings of that study67 indicate
that ARFI elastography of the right lobe of the liver is more accurate for diagnosing liver fibrosis in
humans than is ARFI elastography of the left lobe of the liver. However, that type of study has not
been performed in veterinary medicine. Although 2D-SWE can be used to assess liver elastic modulus
in the right and left lobes of the liver of dogs, differences in tissue elastic modulus between the right
and left lobes of the liver should be expected, and the same lobe of the liver should be evaluated
throughout follow-up assessments in dogs.
The present study had several limitations. Cytologic or histologic examinations of the liver
45
of the dogs were not performed. Thus, a possibility of the existence of liver disease cannot be
completely excluded. However, the laboratory beagles used in the present study had no clinical signs
of illness or abnormalities at the time physical examination, clinicopathologic examinations (including
measurement of fasting and postprandial total bile acid concentrations), and abdominal
ultrasonography were performed for the study. Additionally, occult disease was ruled out on the basis
of follow-up examinations conducted for 6 months. Furthermore, all dogs used in the study were
beagles. Additional studies with smaller and larger breeds are needed to characterize liver and spleen
elastic modulus in dogs of various body sizes.
46
5. SUMMARY
In this chapter, the feasibility, repeatability, and reproducibility of variables obtained by 2D-SWE in
healthy dogs were established. Results of this chapter indicated that intraday and interday CVs for
elasticity values obtained for healthy conscious dogs by use of a novel 2D-SWE technique were
clinically acceptable. Elasticity values obtained for healthy dogs in the present study may serve as
reference values for the assessment of liver fibrosis and for predicting the onset or severity of portal
hypertension in dogs with hepatic diseases.

47
CHAPTER 3
USEFULNESS OF NONINVASIVE SHEAR WAVE ELASTOGRAPHY FOR THE
ASSESSMENT OF HEPATIC FIBROSIS IN DOGS WITH HEPATIC DISEASE

48
1. INTRODUCTION
Therapeutic management and prognosis of chronic diffuse liver disease in humans generally depend
on the extent and progression of hepatic fibrosis. Although the etiology of chronic liver disease in dogs
is different from that in humans, both species have the similar histological appearance and progression
of hepatic fibrosis.15, 59 Therefore, the evaluation of hepatic fibrosis is highly likely of importance to
small animal veterinarians.
Instead of invasive liver biopsy, non-invasive and easily accessible methods of predicting
stages of hepatic fibrosis have been developed in human medicine. Hyaluronic acid (HA), which is an
essential component of the extracellular matrix, is widely used as a direct marker for the assessment
of hepatic fibrosis in human medicine.68-70 Similarly, several studies in veterinary medicine have
reported that the blood HA concentration is increased in dogs with hepatic disease.71,72 However,
another report did not find a positive correlation between serum HA concentration and the stage of
hepatic fibrosis in dogs with hepatic disease.73
2D-SWE is widely used for the evaluation of stage of hepatic fibrosis in human patients,
because many studies in human patients with hepatic fibrosis have indicated that SWV is correlated
with the stage of hepatic fibrosis.20-24 In chapter 2, I described that 2D-SWE is a feasible technique
for assessing SWV in healthy dogs. However, to the best of our knowledge, no reports have evaluated
the use of 2D-SWE for the diagnosis of hepatic fibrosis in dogs with spontaneous hepatic disease.
The aim of this chapter was to evaluate the usefulness of 2D-SWE for the detection of
clinically relevent hepatic fibrosis (≥ F2) in dogs with hepatic disease. I hypothesized that SWV
measured by 2D-SWE would be different between dogs without clinically relevant hepatic fibrosis
(F0-1) and dogs with clinically relevant hepatic fibrosis (≥ F2).
49
2. MATERIALS AND METHODS
2.1 Animals
This study was a prospective, cross-sectional observational study. From June 2017 to January 2019,
32 client-owned dogs with histopathologically diagnosed acute or chronic hepatobiliary disease
examined at the Hokkaido University Veterinary Teaching Hospital were included. Signalment which
consisted of age, breed, sex, and body weight were recorded at the time of recruitment. Laboratory
findings, including CBC and serum biochemistry, were extracted from the medical records of all the
included dogs. Dogs with congenital portosystemic shunt, rupture of the gallbladder, obstructive
jaundice, or hepatic tumors were excluded based on abdominal ultrasound and computed tomography
findings. Informed owner’s consent was obtained in all cases.
Eight healthy beagles were included in the study: 3 were intact males and 5 were intact
females. Their age range was 1–4 years and body weight was 9.7–15 kg. All dogs were confirmed
healthy based on physical examination, CBC, serum biochemistry, echocardiography, and abdominal
ultrasonography. All animal experimental procedures were conducted in accordance with the standard
operation protocols of the institutional animal experimental committee reviewed by the Association
for Assessment and Accreditation of Laboratory Animal Care international (AAALAC International).
All animal experiments were approved by the Hokkaido University Veterinary Teaching Hospital.
2.2 Measurement of SWV
The ultrasound equipment used in this chapter was the same as described in chapter 2. According to
the chapter 2 and the recommended guidelines for the clinical use of elastography in humans,11 all
dogs were positioned in left lateral recumbency for imaging of the right liver lobe. The probe was
placed parallel to and within the intercostal space, and sufficient gel was applied to minimize rib

50
shadowing. Liver image acquisition was positioned within the right lobe parenchyma using the
intercostal approach under visual control in the two-dimensional B mode. If gas in the duodenum,
colon, or lung hindered imaging of right liver lobe, the probe was positioned more dorsally. Dogs with
ascites also were included in the study. Subsequently, 2D-SWE of the liver was performed during the
normal end-expiratory phase to minimize the effects of respiratory motion. The reliability of data
obtained by 2D-SWE was confirmed by use of the proper propagation mode as described in the chapter
2 (Figure 9A, C). Data reliability is high when the contour lines are nearly straight and regularly
parallel to each other, but when the contour lines are irregularly distorted and chaotic, data reliability
is low. Additionally, the map of the SWV (range, 0.5–6.5 m/s) displayed as the speed mode was
displayed by gradual colors, with increasing elastic modulus indicated in an ascending order of blue,
green, yellow, and red (Figure 9B, D). Regions that were not color-coded on the elasticity images
reflected the absence of a shear wave. The diameter of the ROI was set as 10 mm and placed on the
areas with parallel contour lines in the hepatic parenchyma. At least 10 validated measurements were
made for each dog. The median values of the SWV were representative of the liver modulus values.
The SWV of all dogs with hepatic disease was measured using 2D-SWE before liver biopsy
or euthanasia and necropsy. The measurements of SWV were performed by a single sonographer to
ensure consistent imaging conditions throughout the study. The SWV of dogs with hepatic disease was
compared to those of 8 clinically healthy beagle dogs; the latter were obtained from the chapter 2 study
evaluating the feasibility of 2D-SWE.
2.3 Histopathological examination and scoring of fibrosis or necroinflammation of liver
Liver biopsy samples in all dogs were collected by surgical laparotomy, laparoscopy, or necropsy.
Liver biopsy specimens were fixed in 10% formalin and embedded in paraffin, and the paraffin section
was stained with hematoxylin and eosin. All histological examinations were performed by an

51
American College of Veterinary Pathologists board-certified veterinary pathologist according to the
criteria developed by the World Small Animal Veterinary Association Liver Standardization Group.74
After routine histopathological examination, hepatic fibrosis and necroinflammatory activity were
evaluated semiquantitatively according to a histological scoring scheme that was adapted from the
Ishak scheme used in human medicine; this procedure was performed by a single pathologist, who
was blinded to the SWV variable.74,75 In this scoring scheme, hepatic fibrosis is staged as follows: 0:
absent, 1: mild, 2: moderate, 3: marked, or 4: very marked. Furthermore, all dogs were divided into
the following groups: dogs without clinically relevant hepatic fibrosis (F0–1) and dogs with clinically
relevant hepatic fibrosis (≥ F2). Necroinflammatory activity was graded as follows: 0: absent, 1: slight,
2: mild, 3: moderate, 4: marked, or 5: very marked. Additionally, all dogs were divided into those
without necroinflammatory activity (A0) and those with necroinflammatory activity (≥ A1).
2.4 Measurement of serum HA concentration
The serum HA concentrations were compared between dogs with and without clinically relevant
hepatic fibrosis. Serum samples were obtained from dogs with hepatic disease before surgical
laparotomy, laparoscopy, or necropsy and stored at -80 °C until HA measurement. Serum HA
concentrations were measured using a commercially available enzyme-linked immunosorbent assay
kit (Hyaluronan ELISA Kit, Echelon Biosciences, Utah, USA), which was used for the measurement
of serum HA concentration in dogs in a previous study.73 Absorbance was read at 405 nm using a
microplate reader (Benchmark Microplate Reader, BIO-RAD, California, USA). All samples were
examined in duplicate, and the mean optical density was calculated.
2.5 Statistical analysis
Statistical analyses were performed using a commercially available statistical program (described in

52
chapter 1). All continuous variables are presented as median and ranges. The Mann-Whitney U-test
was used to compare laboratory findings and HA concentrations between dogs with and without
clinically relevant hepatic fibrosis. The Kruskal-Wallis test was used to analyze the overall difference
among the 3 group dogs, and post-hoc multiple comparisons were determined by the Steel-Dwass test.
The difference was considered statistically significant when P values were < 0.05.

53
3. RESULTS
3.1 Study population
Thirty-two dogs with hepatic disease initially were enrolled in the study, but 4 dogs were excluded
because of poor ultrasound image quality (i.e. unable to obtain proper contour lines in the propagation
mode) for the measurement of SWV; imaging of the right liver lobe was interfered with because of
shadowing of gas in the duodenum, colon, or lung in 2 dogs and because of uncontrollable panting in
2 dogs. Finally, 28 dogs with hepatobiliary disease were included in the study (Table 5). The following
breeds were presented: 4 miniature schnauzers, 3 miniature dachshunds, 3 beagles, 3 toy poodles, 3
Shih Tzus, 2 American cocker spaniels, 2 Chihuahuas, 2 mixed dogs, and 1 each of Cairn terrier,
Scottish terrier, pug dog, Border collie, Pomeranian, and Yorkshire terrier. Histopathological diagnosis
of 20 of the 28 dogs with hepatic disease was as follows: 11 cases of cholangiohepatitis; 3, vacuolar
hepatopathies; 3, chronic hepatitis; and 3, primary hypoplasia of the portal vein. The last 8 of the 28
dogs were diagnosed with minimal non-specific changes, including mildly scattered lipogranulomas
or mononuclear infiltrates with hydropic or histologically normal liver. All hepatic samples were
considered adequate and the stages of hepatic fibrosis and necroinflammatory activity grades were
evaluated (Table 5). Three dogs that had clinically relevant hepatic fibrosis also had mild ascites.
3.2 Laboratory findings and serum hyaluronic acid concentration
The results of laboratory findings and serum HA concentrations in all dogs with hepatic disease are
presented in Table 6. The laboratory findings were measured in all dogs, whereas serum HA
concentration was measured in 20 of the 22 dogs without clinically relevant hepatic fibrosis and 5 of
the 6 dogs with clinically relevant hepatic fibrosis. Only serum albumin and total cholesterol
concentrations were significantly lower in dogs with clinically relevant hepatic fibrosis than in those

54
without clinically relevant hepatic fibrosis (P = 0.0010 and P = 0.023, respectively). Serum HA
concentration was not significantly different between dogs with (median, 192 ng/mL; range, 151–305
ng/mL) and without clinically relevant hepatic fibrosis (median, 162 ng/mL; range, 117–211 ng/mL,
P = 0.11).
3.3 Comparison of SWV among hepatic fibrosis stages
SWV results were compared among healthy dogs (n = 8), dogs without clinically relevant hepatic
fibrosis (n = 22), and dogs with clinically relevant hepatic fibrosis (n = 6). The speed map of SWV of
dogs without clinically relevant hepatic fibrosis is displayed in blue (Figure 9B), and that of dogs with
clinically relevant hepatic fibrosis is displayed in green in the major parts and blue in minimal parts
(Figure 9C). Figure 10 shows the box plots of SWV measured by 2D-SWE in healthy dogs, dogs
without clinically relevant hepatic fibrosis, and dogs with clinically relevant hepatic fibrosis. The
median SWV in healthy dogs, dogs without clinically relevant hepatic fibrosis, and dogs with
clinically relevant hepatic fibrosis was 1.51 (range, 1.44–1.66) m/s, 1.56 (range, 1.37–1.67) m/s, and
2.04 (range, 1.81–2.26) m/s, respectively (Kruskal-Wallis test, P < .001). The SWV measured by 2D-
SWE in dogs with clinically relevant hepatic fibrosis was significantly higher than those in healthy
dogs (P = 0.0067) and dogs without clinically relevant hepatic fibrosis (P < 0.001). Conversely, SWV
in dogs without clinically relevant hepatic fibrosis was similar to those of healthy dogs (P = 0.95).
3.4 Comparison of SWV among different amounts of necroinflammatory activity
Figure 11 shows the SWV measured by 2D-SWE for the 3 groups: healthy dogs (n = 8), dogs without
inflammatory activity (n = 17), and dogs with inflammatory activity (n = 11). The data obtained for
healthy dogs are the same as shown in Figure 10. The median SWV was 1.57 (range, 1.37–2.26) m/s
for dogs without inflammatory activity and 1.61 (range, 1.45–2.24) m/s for dogs with inflammatory

55
activity. No significant difference was found in the values among healthy dogs, dogs without
inflammatory activity, and dogs with inflammatory activity (Kruskal-Wallis test, P = 0.11).

56
Figure 9. (A) Representative images of the right lobe of the liver via the intercostal approach for the
speed mode in a dog without clinically relevant hepatic fibrosis (F0, A0; A and B) and a dog with
clinically relevant hepatic fibrosis (F3, A0; C and D).
Images for the speed mode are the map for the propagation mode (A, C) and the shear wave velocity
map (B, D). Notice the consistent parallel contour lines for the speed modes, and the region of interest
(T1, T2, and T3; 10 mm) used for the measurements (circles).

57
Table 5. Age and body weight are reported as medians with the ranges in parentheses.
Numbers in the fibrosis staging and necroinflammatory activity grading indicate number of dogs.
Characteristics Dogs with hepatic disease (n = 28)
Age (years) 11 (1–15)
Sex (number of dogs) 3M, 4MC, 4F, 17FS
Body weight (kg) 6.1 (2.2–22.2)
Fibrosis staging
F0 (absent)
F1 (mild)
F2 (moderate)
F3 (marked)
F4 (very marked)
17
5
2
1
3
Necroinflammatory activity grading
A0 (absent)
A1 (slight)
A2 (mild)
A3 (moderate)
A4 (marked)
A5 (very marked)
17
6
4
1
0
0

58
F0–1 dogs (n = 22) ≥ F2 dogs (n = 6) P value
Platelet (14.8–48.4×10⁴/µL) 41.9 (23.6–132) 38.9 (27.5–57) 0.54
ALT (17–44 IU/L) 261 (46–>1000) 708 (164–952) 0.093
Albumin (2.6–4.0 g/dL) 3.4 (2.7–4.3) 2.6 (2.2–3.1) 0.0010
Glucose (75–128 mg/dL) 103 (84–119) 108 (95–117) 0.38
T-Bil (0.1–0.5 mg/dL) 0.1 (0.1–1.0) 0.2 (0.1–2.6) 0.58
Tchol (111–312 mg/dL) 265 (129–451) 179 (63–258) 0.023
HA (ng/mL) 162 (117–211) 192(151–305) 0.11
Table 6. Routine laboratory findings and hyaluronic acid concentration are reported as medians with
the ranges in parentheses.
Reference intervals are listed after each laboratory finding in the first column. Abbreviations: ALT,
alanine aminotransferase; T-Bil, total bilirubin; Tchol, total cholesterol; HA, hyaluronic acid.

59
Figure 10. Shear wave velocity in healthy dogs (n = 8), dogs without clinically relevant fibrosis (F0–
1, n = 22), and dogs with clinically relevant hepatic fibrosis (≥ F2, n = 6).
The box extends from 25% to 75% percentile with the median and the whiskers extend to limits of the
data.

60
Figure 11. Shear wave velocity in healthy dogs (n = 8), dogs without significant necroinflammatory
activity (A0, n = 17), and dogs with necroinflammatory activity (≥ A1, n = 11).
The box extends from 25% to 75% percentile with the median and the whiskers extend to limits of the
data.
61
4. DISCUSSION
Liver biopsy is a criterion-referenced method for the definitive diagnosis and monitoring of hepatic
disease and hepatic fibrosis. Repeated liver biopsies are required to evaluate the progression of disease
and monitor treatment efficacy, but it is sometimes difficult to perform liver biopsy because of the
patient’s clinical condition and the risk of life-threatening complications. Conventional B-mode
ultrasound imaging would be useful for diagnosing hepatic parenchymal disorders such as chronic
hepatitis, especially in the advanced stage, because of its ability to detect surface irregularity and
regenerative nodules in the liver. However, it is considered a non-specific and insensitive method for
the diagnosis of hepatic fibrosis. Thus, more specific and sensitive methods are needed.
I investigated whether 2D-SWE could differentiate between dogs with clinically relevant
hepatic fibrosis (≥ F2) and dogs without clinically relevant hepatic fibrosis (F0–1). Consequently,
SWV in dogs with clinically relevant hepatic fibrosis was significantly higher than that in dogs without
clinically relevant hepatic fibrosis. Similar to findings in human patients, this result indicated that the
liver elastic modulus assessed by 2D-SWE in dogs successfully reflected the severity of hepatic
fibrosis secondary to hepatic parenchymal disorders such as chronic hepatitis or cholangiohepatitis.
However, no significant difference was found between healthy dogs and dogs without clinically
relevant hepatic fibrosis, even though all dogs without clinically relevant hepatic fibrosis were
clinically diagnosed with hepatic disease and had increased hepatic enzyme activity. In humans, a
report indicated that SWV measured using 2D-SWE overlapped among F0, F1, and the healthy control
group.66 Thus, my results indicated that it is difficult to predict the absence of or mild hepatic fibrosis
(F0 or F1 stage) using 2D-SWE in dogs.
On the other hand, no significant difference was found in the SWV among healthy dogs,
dogs with necroinflammatory activity, and dogs without necroinflammatory activity. Accordingly, I

62
presume that the necroinflammatory activity has a much lesser effect on SWV than does hepatic
fibrosis. However, several previous studies in humans have reported that the SWV would be affected
by conditions of severe liver inflammation such as acute hepatitis, and this finding is attributed to the
presence of inflammatory cells infiltrates, tissue edema, and hepatocyte swelling in the liver with
severe necroinflammatory activity.76,77 In my study, the majority of dogs with hepatic disease were
graded as having only mild necroinflammatory activity (A0 to A2), and only 1 dog was graded as A3.
Thus, it was difficult to determine the effect of necroinflammatory activity on SWV because of the
small number of cases. Further studies with a larger sample of dogs with severe necroinflammatory
activity are warranted.
Serum albumin and total cholesterol concentrations were significantly lower in dogs with
clinically relevant hepatic fibrosis than those in dogs without clinically relevant hepatic fibrosis,
although the concentrations in most dogs with hepatic disease were within reference ranges. In dogs
with hepatic disorders, hypoalbuminemia tends to occur when approximately 70% of liver function
has been lost. Hypocholesterolemia also could be detected in end-stage hepatic disease in dogs.78 In
humans, several indirect markers of hepatic failure have been reported for predicting the presence of
hepatic fibrosis in clinical settings. In patients with chronic hepatitis B, serum albumin concentrations
have been reported to be significantly lower in patients with clinically relevant hepatic fibrosis (≥ F2)
than in patients without clinically relevant hepatic fibrosis (F0–1).79 Although the decreases in albumin
and total cholesterol concentrations could help predict the presence of severe hepatic fibrosis in dogs
as an indirect indicator, these changes are not specific for hepatic disorders.
Conversely, HA was not significantly different between dogs with and without clinically
relevant hepatic fibrosis in this study. Hyaluronic acid is a high molecular weight glycosaminoglycan
primary synthesized by hepatic stellate cells and degraded by sinusoidal endothelial cells. It had been
reported to possess high diagnostic accuracy for the non-invasive evaluation of hepatic fibrosis and

63
cirrhosis in human patients.68-70 However, in veterinary medicine, only 3 reports have investigated the
usefulness of HA in predicting hepatic fibrosis. One report indicated that plasma HA concentration
was significantly increased in dogs with cirrhosis,71 whereas another report indicated that the serum
HA concentration correlated with hepatic fibrosis stage.72 One study however found no positive
correlation between serum HA concentration and hepatic fibrosis stage,73 which is similar to the results
of this study. Discrepancy in results may be caused by differences in assay types, sample size, or
histological sample population.
This study had several limitations. First, sample size was small, especially for dogs with
clinically relevant hepatic fibrosis. However, despite small sample size, these results indicated the
usefulness of 2D-SWE as a non-invasive diagnostic tool for the assessment of hepatic fibrosis. Further
studies with larger sample size are needed to determine the sensitivity, specificity, and the cut-off value
of 2D-SWE for distinguishing among fibrosis groups. Second, sampling errors might have occurred
in some dogs with hepatic diseases, possibly because the region measured by 2D-SWE may not have
completely coincided with that of liver biopsy. Additionally, it was impossible to collect biopsy
specimens from multiple liver lobes because of the high risk of the bleeding. In the previous study of
70 dogs undergoing necropsy, some histological changes such as hepatic fibrosis were nonuniformly
distributed among lobes.80 Conversely, several previous reports in humans indicated that minimal or
no significant differences in hepatic lesion were detected among hepatic lobes.81-83 Further studies are
needed to elucidate the effect of histopathological variations among liver lobes and the result of SWE
measurement. Third, although this study included 3 dogs with mild ascites secondary to clinically
relevant hepatic fibrosis, mild ascites did not separate the right liver lobe from the abdominal wall in
these 3 dogs. Transient elastography is limited to patients that do not have perihepatic ascites or fluid
in the abdomen surrounding the liver, and cannot be performed in patients with ascites. On the other
hand, the recommended guidelines for the clinical use of elastography in humans indicated that SWE

64
can measure the SWV of patients with ascites because the ultrasound push beam, which generates the
shear waves, propagates through fluids and appears not to be influenced by the presence of ascites.11
Because the influence of ascites on the measurement of SWV using 2D-SWE is not well understood
in veterinary medicine, further studies also are needed to evaluate the influence of ascites on SWV in
dogs.

65
5. SUMMARY
In this chapter, the usefulness of 2D-SWE in the detection of the clinically relevant hepatic
fibrosis (≥ F2) in dogs with hepatic disease was investigated. It was shown that SWV measured by
2D-SWE is increased in dogs with clinically relevant hepatic fibrosis compared to dogs without
clinically relevant hepatic fibrosis and healthy dogs. These results indicated that 2D-SWE is a useful
method for non-invasively predicting clinically relevant hepatic fibrosis in dogs.

66
GENERAL CONCLUSION
The goal of this study was to establish the clinical usefulness in the assessment of hepatic
microvascular perfusion and hepatic fibrosis using a novel ultrasonography in dogs with liver disease.
The findings of the present study indicate that CEUS is useful methods to evaluate the hepatic
microvascular perfusion in dogs with extrahepatic congenital portosystemic shunt and 2D-SWE is a
feasible method for non-invasively evaluating the hepatic fibrosis in dogs with chronic diffuse liver
diseases.
In chapter 1, I have characterized perfusion images and parameters of hepatic parenchyma,
hepatic artery, and portal vein in healthy and extrahepatic congenital portosystemic shunt dogs. Briefly,
all dogs underwent CEUS without sedation, and a TIC was generated. Sonazoid was used as the
contrast agent. The TTP, RT, and RR in the hepatic parenchyma, hepatic artery, and portal vein as well
as the ΔHP–PV were calculated and compared between healthy and extrahepatic congenital
portosystemic shunt dogs. The relationship between the PV/Ao ratio and each perfusion parameter
was also examined. The TTP, RT, and RR of hepatic parenchyma were significantly shorter in
extrahepatic congenital portosystemic shunt dogs than in healthy dogs. In contrast, the TTP, RT, and
RR of portal vein did not significantly differ between the two groups. ΔHP-PV was fairly earlier in
extrahepatic congenital portosystemic shunt dogs than in healthy dogs. Furthermore, the RT of hepatic
parenchyma and ΔHP-PV correlated well with the PV/Ao ratio in dogs with extrahepatic congenital
portosystemic shunt. CEUS effectively revealed changes in hepatic microvascular perfusion in
extrahepatic congenital portosystemic shunt dogs. In extrahepatic congenital portosystemic shunt dogs,
the rapid enhancement of hepatic artery and parenchyma appears to reflect a compensatory increase
in hepatic arterial blood flow (arterialization) secondary to a decrease in portal vein blood flow.
Furthermore, the PV/Ao ratio reflects not only decreased PV blood flow, but also indirectly reflects

67
the degree of arterialization. The results of the present study suggested the applicability of CEUS as
an additional diagnostic test to distinguish extrahepatic congenital portosystemic shunt dogs from
healthy dogs.
In chapter 2, I have determined the feasibility, repeatability, and reproducibility of SWV
using 2D-SWE in healthy beagle dogs. The interday and intraday CVs for 2D-SWE in liver and spleen
were clinically acceptable. On the other hand, SWV measured by 2D-SWE was significantly different
between the right and left lobe of the liver. These findings indicated that 2D-SWE can be used to assess
the elastic modulus in the right and left lobes of the liver and in the spleen of dogs, but differences in
elastic modulus between the right and left lobes of the liver should be considered, and the same lobe
of the liver should be assessed throughout follow-up evaluations in dogs.
In chapter 3, I have investigated the usefulness of 2D-SWE for the detection of clinically
relevant hepatic fibrosis in dogs with hepatic disease. Briefly, SWV measurement was performed in
all dogs using 2D-SWE before liver biopsy or euthanasia and necropsy. Hepatic fibrosis stages and
necroinflammatory activity grades were histopathologically evaluated. All dogs were divided into
dogs without clinically relevant hepatic fibrosis (F0–1) and those with clinically relevant hepatic
fibrosis (≥ F2). Additionally, all dogs were divided into those without necroinflammatory activity (A0)
and those with necroinflammatory activity (≥ A1). Consequently, the median SWV was significantly
higher in dogs with clinically relevant hepatic fibrosis than those without clinically relevant hepatic
fibrosis, and in healthy dogs. However, there was no significant difference in the SWV between dogs
without clinically relevant hepatic fibrosis and healthy dogs. On the other hand, the median SWV was
not significantly different among groups, indicating that the necroinflammatory activity has a much
lesser effect on SWV than hepatic fibrosis. These findings suggested that 2D-SWE would be a useful
method for non-invasively predicting significant hepatic fibrosis in dogs.
Future study plans should include a bigger population, with multiple institution involvement

68
for validation of these CEUS and 2D-SWE data. Further research of hepatic fibrosis is also needed to
classify among each fibrosis stage. Moreover, additional research should include comparison between
quantitative histological fibrosis area and SWV measured by 2D-SWE.
In conclusion, through this study I was able to detect the changes in the hepatic
microvascular perfusion of extrahepatic congenital portosystemic shunt dogs by CEUS. Moreover, I
was able to establish a suitable 2D-SWE protocol for measuring SWV and have clarified that 2D-SWE
would be useful for noninvasively predicting the presence of hepatic fibrosis in dogs with chronic
diffuse liver disease.

69
JAPANESE SUMMARY(要旨)
Study on the evaluation of hepatic microvascular perfusion and hepatic fibrosis
using ultrasonography in dogs with liver disease
(⽝の肝疾患における超⾳波検査を⽤いた肝微⼩循環および
肝線維化の評価に関する研究)
⾼い空間・コントラスト分解能を有し⾮侵襲的に⽣体内部を描画できる超⾳波検査は、⽝
の肝疾患において最も重要な検査法の 1 つとして広く普及している。しかし、これまでの超
⾳波画像による診断は、臓器の断⾯画像から得られる形態的特徴および画像輝度パターン
の定性的評価が中⼼となり、定量性の⾯では不⼗分であった。そこで近年、より客観性を持
った定量診断法として造影超⾳波検査(CEUS)と Shear Wave Elastography(SWE)が開発
され、新たな診断のブレイクスルーとして⼈医療において様々な研究が⾏われている。
CEUS は、造影剤の⾎管内投与により⾮侵襲的に⾎流動態や組織灌流動態をリアルタイム
に観察できる画像診断検査法である。CEUS による造影増強効果は組織灌流と良好に相関す
るため、組織内の微⼩⾎管の灌流状態をリアルタイムに評価することができる。
肝外性先天性⾨脈体循環シャント(EH-CPSS)は、⾨脈系と体循環系の間に⽣じた異常な
側副⾎管により⾨脈⾎が直接体循環に流⼊する疾患である。肝機能低下に関連した臨床症
状を呈し、無症状から肝不全、肝性脳症とその症状は多岐にわたる。EH-CPSS は症例数の
多さと早期診断・早期治療の必要性から獣医学の肝疾患分野において⾮常に重要な疾患で
ある。EH-CPSS は、先天性の⾎管奇形の疾患であるため、肝臓の⾎流動態(肝微⼩循環)
の評価は病態⽣理のみならず診断にも有⽤である。しかしながら、肝微⼩循環の評価には⾮
常に優れた時間分解能が必須となり、古くから造影剤が使⽤されてきた CT や MRI 検査を
もってしても時間分解能に乏しい⽋点を理由に、評価することは困難であった。第 1 章で

70
は、この問題を解決するために CEUS に着⽬し、CEUS による定量的評価が⽝の EH-CPSS
に伴う肝微⼩循環の変化を捉えるのに有⽤か検討した。
各種画像検査で確定診断された EH-CPSS の⽝ 9頭を前向きに本研究に組み込み、健常⽝
と⽐較した。右肋間アプローチにて右肝実質、⾨脈本幹、肝動脈を描出し CEUS を実施し、
画像所⾒を⽐較した。また時間輝度曲線を作成し、最⾼輝度到達時間(TTP)、流⼊時間(RT)、
上昇率(RR)の 3 つの値を算出した。まず画像所⾒において、健常⽝では造影剤投与直後
すぐに肝動脈が造影増強され、次に⾨脈、その後、肝実質が造影増強された。⼀⽅、EH-CPSS
罹患⽝では、肝動脈が造影増強された後すぐに、肝実質が造影増強された。その後、数秒遅
れて⾨脈が造影増強された。次に各種パラメーターの⽐較では、EH-CPSS 罹患⽝では健常
⽝に⽐べ、肝動脈および肝実質の TTP および RT の有意な短縮と、RR の有意な上昇を認め
た。CEUS では、EH-CPSS 罹患⽝において短絡⾎管の存在により肝臓に流⼊する⾨脈⾎流
が減少し、代償性に肝動脈⾎流が増加する“肝臓の動脈化”を捉えることができた。
第 2 章および第 3 章では、⽝の肝疾患における SWE の有⽤性について検討した。SWE と
は、組織に剪断波を発⽣させてその伝播速度から組織の弾性を定量的に測定できる画像検
査法である。肝線維化は、慢性肝炎をはじめとするびまん性肝疾患などによって引き起こさ
れる持続的な炎症により⽣じる病理組織学的な変化である。持続的な肝線維化は、肝実質の
再⽣性結節を伴い終末像である肝硬変へと進⾏し、⾨脈⾼⾎圧症や肝性脳症などの重篤な
合併症を引き起こす。既に医学領域では肝線維化の進⾏が予後と強く相関する事が多くの
研究で⽰され、肝線維化評価は治療適応の決定および予後予測に極めて重要とされている。
そして近年、⽝おいても肝線維化の重症度と予後との関連性が報告され、獣医療においても
肝線維化評価の重要性が指摘されている。
肝線維化評価のゴールドスタンダードは肝⽣検による病理組織学的な評価とされてきた
が、疼痛や出⾎などの合併症のリスクが問題となる。⼈医療において、SWE による肝硬度
測定が病理組織学的な肝線維化ステージと強く相関することが⽰され、SWE は⾮侵襲的な

71
肝線維化診断法として広く臨床応⽤されている。さらに近年登場した最新鋭の 2D-SWE は、
これまでの SWE と⽐較し⾼い再現性および汎⽤性が明らかになっている。⼀⽅で、⽝にお
ける SWE を⽤いた肝硬度測定の情報は乏しく、臨床応⽤の可能性は明らかにされていない。
第 2 章および第 3 章では、2D-SWE を⽤いて⽝の肝線維化に対する⾮侵襲的診断法の可能
性について検討した。
第 2 章では、8頭の健常⽝を⽤いて測定値の再現性、および測定部位間における肝硬度の
差について検討した。肋間アプローチにて、それぞれ肝右葉および肝左葉の肝硬度を測定
し、左右の肝硬度を⽐較した。さらに⽇内および⽇間変動に関しても、変動係数を算出して
評価した。その結果、左右ともに測定の再現性は⾼く、臨床応⽤可能であった。⼀⽅、左右
の肝硬度は Bland-Altman 解析で固定誤差が認められたため、臨床現場で 2D-SWE を使⽤し
て経時的に症例の肝硬度を評価する場合には同じ領域で測定することが推奨された。
第 3 章では臨床例を⽤いて、2D-SWE による⾮侵襲的肝線維化予測法の可能性について
検討した。本研究では、最終的に肝⽣検により肝疾患と診断された 28頭の⽝を前向きに組
み⼊れ、肝⽣検実施の前に全ての⽝の肝硬度を測定した。 Ishak 分類を使⽤し、病理組織学
的に肝線維化(Fibrosis: F)ステージを 5段階、炎症(Necroinflammatory activity: A)グレー
ドを 6段階に分類した。対照群として健常なビーグル⽝ 8頭(健常群)を使⽤した。臨床上
有意な肝線維化である F2 を基準に有意な肝線維化なし(F0–1群)とあり(≥ F2群)の 2群
に分類し、さらに健常群を加えて 3群で⽐較検討した。炎症についても、炎症なし(A0群)
と炎症あり(≥ A1群)に分類して 3群で⽐較した。その結果、≥ F2群の肝硬度は、F0–1群
および健常群と⽐較して有意に⾼値を⽰した。⼀⽅、F0–1 群と健常群では統計学的に有意
差は認められなかった。炎症に関しては、3 群間で統計学的な有意差は認められなかった。
以上の結果より、⼈の報告と同様に、⽝においても 2D-SWE による肝線維化予測が可能で
あることが明らかになった。SWE による肝硬度測定は、組織の弾性と粘性の両者(粘弾性)
を計測し定量化している。組織学的な肝線維化の進⾏が組織の弾性を増加させ、肝硬度が上

72
昇したと推察される。⼀⽅、肝硬度に対する炎症の影響は低いことが明らかになった。
今後の研究課題として、EH-CPSS に対する CEUS の診断精度を検証するため、さらなる
症例の蓄積および多施設での検討が必要である。また 2D-SWE による⾮侵襲的な肝線維化
診断に関しても、症例を蓄積して肝線維化ステージ毎の診断精度(感度および特異度)を明
らかにする必要がある。さらに、本研究における病理組織学的な肝線維化ステージは定性的
な⼿法を⽤いたが、今後線維化の特殊染⾊により定量化した線維化⾯積率と肝硬度との関
連についても検討したい。
最後に、本研究により CEUS を⽤いることで EH-CPSS の肝微⼩循環の変化を捉え、診断
へ応⽤できる可能性が⽰された。また 2D-SWE は、⽝においても⾮侵襲的に肝線維化を検
出できることが明らかになった。今後、⽝の肝疾患における早期診断や適切な病態把握およ
び治療効果判定への寄与が期待される。

73
REFERENCES
1. Ostlund A, Sporrong A, Linnarsson D, Lind F. Effects of sulphur hexafluoride on
psychomotor performance. Clin Physiol 1992;12:409-418.
2. Bokor D. Diagnostic efficacy of SonoVue. Am J Cardiol 2000;86:19-24.
3. Fujita Y, Watanabe M, Sasao K, Wakui N, Shinohara M, Ishii K, Sumio Y. Investigation of
liver parenchymal flow using contrast-enhanced ultrasound in patients with alcoholic liver
disease. Alcohol Clin Exp Res 2004;28:169-173.
4. Shi Y, Wang XH, Xia GC, Lei CG. Quantitative diagnosis of early-stage liver cirrhosis with
contrast-enhanced ultrasound--a clinical study. Adv Clin Exp Med 2012;21:385-390.
5. Wakui N, Takayama R, Kanekawa T, Ichimori M, Otsuka T, Shinohara M, Ishii K, Kamiyama
N, Sumino Y. Usefulness of arrival time parametric imaging in evaluating the degree of liver
disease progression in chronic hepatitis C infection. J Ultrasound Med 2012;31:373-382.
6. Winkler JT, Bohling MW, Tillson DM, Wright JC, Ballagas AJ. Portosystemic shunts:
diagnosis, prognosis, and treatment of 64 cases (1993-2001). J Am Anim Hosp Assoc
2003;39:169-185.
7. Kleber G, Steudel N, Behrmann C, Zipprich A, Hübner G, Lotterer E, Fleig WE. Hepatic
arterial flow volume and reserve in patients with cirrhosis: use of intra-arterial Doppler and
adenosine infusion. Gastroenterology 1999;116:906-914.
8. Hales MR, Allan JS, Hall EM. Injection-corrosion studies of normal and cirrhotic livers. Am
J Pathol 1959;35:909-941.
9. Zoli M, Magalotti D, Bianchi G, Ghigi G, Orlandini C, Grimaldi M, Marchesini G, Pisi E.
Functional hepatic flow and Doppler-assessed total hepatic flow in control subjects and in
patients with cirrhosis. J Hepatol 1995;23:129-134.

74
10. Barr RG, Ferraioli G, Palmeri ML, Goodman ZD, Garcia-Tsao G, Rubin J, Garra B, Myers
RP, Wilson SR, Rubens D, Levine D. Elastography assessment of liver fibrosis: Society of
radiologists in ultrasound consensus conference statement. Radiology 2015;276:845-861.
11. Ferraioli G, Filice C, Castera L, Choi BI, Sporea I, Wilson SR, Cosgrove D, Dietrich
CF, Amy D, Bamber JC, Barr R, Chou YH, Ding H, Farrokh A, Friedrich-Rust M, Hall
TJ, Nakashima K, Nightingale KR, Palmeri ML, Schafer F, Shiina T, Suzuki S, Kudo M.
WFUMB guidelines and recommendations for clinical use of ultrasound elastography: Part
3: liver. Ultrasound Med Biol 2015;41:1161-1179.
12. Sigrist RMS, Liau J, Kaffas AE, Chammas MC, Willmann JK. Ultrasound elastography:
Review of techniques and clinical applications. Theranostics 2017;7:1303-1329.
13. Jeon S, Lee G, Lee SK, Kim H, Yu D, Choi J. Ultrasonographic elastography of the liver,
spleen, kidneys, and prostate in clinically normal beagle dogs. Vet Radiol Ultrasound
2015;56:425-431.
14. White J, Gay J, Farnsworth R, Mickas M, Kim K, Mattoon J. Ultrasound elastography of the
liver, spleen, and kidneys in clinically normal cats. Vet Radiol Ultrasound 2014;55:428-434.
15. Eulenberg VM, Lidbury JA. Hepatic fibrosis in dogs. J Vet Intern Med 2018;32:26-41.
16. Harrison JL, Turek BJ, Brown DC, Bradley C, Callahan Clark J. Cholangitis and
cholangiohepatitis in dogs: a descriptive study of 54 cases based on histopathologic diagnosis
(2004–2014). J Vet Intern Med 2018;32:172-180.
17. Horowitz JM, Venkatesh SK, Ehman RL, Jhaveri K, Kamath P, Ohliger MA, Samir AE, Silva
AC, Taouli B, Torbenson MS, Wells ML, Yeh B, Miller FH. Evaluation of hepatic fibrosis: a
review from the society of abdominal radiology disease focus panel. Abdom Radiol (NY)
2017;42:2037-2053.
18. Cadranel JF, Rufat P, Degos F. Practices of liver biopsy in France: results of a prospective

75
nationwide survey. Hepatology 2000;32:477-481.
19. Bravo AA, Sheth SG, Chopra S. Liver Biopsy. N Engl J Med 2001;344:495-500.
20. Osaki A, Kubota T, Suda T, Igarashi M, Nagasaki K, Tsuchiya A, Yano M, Tamura
Y, Takamura M, Kawai H, Yamagiwa S, Kikuchi T, Nomoto M, Aoyagi Y. Shear wave
velocity is a useful marker for managing nonalcoholic steatohepatitis. World J Gastroenterol
2010;16:2918-2925.
21. Takeda T, Yasuda T, Nakayama Y, Nakaya M, Kimura M, Yamashita M, Sawada A, Abo
K, Takeda S, Sakaguchi H, Shiomi S, Asai H, Seki S. Usefulness of noninvasive transient
elastography for assessment of liver fibrosis stage in chronic hepatitis C. World J
Gastroenterol 2006;12(48):7768-7773.
22. Ferraioli G, Tinelli C, Lissandrin R, Zicchetti M, Dal Bello B, Filice G, Filice C. Point shear
wave elastography method for assessing liver stiffness. World J Gastroenterol 2014;20:4787-
4796.
23. Zhuang Y, Ding H, Zhang Y, Sun H, Xu C, Wang W. Two-dimensional shear-wave
elastography performance in the noninvasive evaluation of liver fibrosis in patients with
chronic hepatitis B: comparison with serum fibrosis indexes. Radiology 2017;283:873-882.
24. Frulio N, Trillaud H. Ultrasound elastography in liver. Diagn Interv Imaging. 2013;94:515-
534.
25. Lim SY, Nakamura K, Morishita K, Sasaki N, Murakami M, Osuga T, Ohta H, Yamasaki
M, Takiguchi M. Qualitative and quantitative contrast enhanced ultrasonography of the
pancreas using bolus injection and continuous infusion methods in normal dogs. J Vet Med
Sci 2013;75:1601-1607.
26. Nelson NC, Nelson LL. Anatomy of extrahepatic portosystemic shunts in dogs as determined
by computed tomography angiography. Vet Radiol Ultrasound 2011;52:498-506.

76
27. Hanson KM, Johnson PC. Local control of hepatic arterial and portal venous flow in the dog.
Am J Physiol 1966;211:712-720.
28. Cullen JM, van den Ingh TSGAM, Bunch SE, Rothuizen J, Washabau RJ, Desmet VJ.
Morphological classification of circulatory disorders of the canine and feline liver. In:
WSAVA, ed. Standards for Clinical and Histological Diagnosis of Canine and Feline Liver
Diseases. 1st ed. Philadelphia: Saunders Elsevier, 2006:41-59.
29. Salwei RM, O’Brien RT, Matheson JS. Use of contrast harmonic ultrasound for the diagnosis
of congenital portosystemic shunts in three dogs. Vet Radiol Ultrasound 2003;44:301-305.
30. Tang MX, Mulvana H, Gauthier T, Lim AK, Cosgrove DO, Eckersley RJ, Stride E.
Quantitative contrast-enhanced ultrasound imaging: a review of sources of variability.
Interface Focus 2011;1:520-539.
31. Kutara K, Asano K, Kito A, Teshima K, Kato Y, Sasaki Y, Edamura K, Shibuya H, Sato
T, Hasegawa A, Tanaka S. Contrast harmonic imaging of canine hepatic tumors. J Vet Med
Sci 2006;68:433-438.
32. Kanemoto H, Ohno K, Nakashima K, Takahashi M, Fujino Y, Tsujimoto H. Vascular and
Kupffer imaging of canine liver and spleen using the new contrast agent Sonazoid. J Vet Med
Sci 2008;70:1265-1268.
33. Johnson-Neitman JL, O’Brien RT, Wallace JD. Quantitative perfusion analysis of the
pancreas and duodenum in healthy dogs by use of contrast-enhanced ultrasonography. Am J
Vet Res 2012;73:385-392.
34. Schneider AG, Goodwin MD, Schelleman A, Bailey M, Johnson L, Bellomo R. Contrast-
enhanced ultrasonography to evaluate changes in renal cortical microcirculation induced by
noradrenaline: a pilot study. Crit Care 2014;18:653.
35. Leinonen MR, Raekallio MR, Vainio OM, Ruohoniemi MO, Biller DS, O'Brien RT.

77
Quantitative contrast-enhanced ultrasonographic analysis of perfusion in the kidneys, liver,
pancreas, small intestine, and mesenteric lymph nodes in healthy cats. Am J Vet Res
2010;71:1305-1311.
36. Lamb CR. Ultrasonography of portosystemic shunts in dogs and cats. Vet Clin North Am
Small Anim Pract 1998;28:725-753.
37. Mathie RT, Blumgart LH. The hepatic haemodynamic response to acute portal venous blood
flow reductions in the dog. Pflugers Arch 1983;399:223-227.
38. Holt DE, Schelling CG, Saunders HM, Orsher RJ. Correlation of ultrasonographic findings
with surgical, portographic, and necropsy findings in dogs and cats with portosystemic shunts:
63 cases (1987-1993). J Am Vet Med Assoc 1995;207:1190-1193.
39. Tiemessen I, Rothuizen J, Voorhout G. Ultrasonography in the diagnosis of congenital
portosystemic shunts in dogs. Vet Q 1995;17:50-53.
40. Lamb CR. Ultrasonographic diagnosis of congenital portosystemic shunts in dogs: results of
a prospective study. Vet Radiol Ultrasound 1996;37:281-288.
41. d’Anjou MA, Penninck D, Cornejo L, Pibarot P. Ultrasonographic diagnosis of portosystemic
shunting in dogs and cats. Vet Radiol Ultrasound 2004;45:424-437.
42. Fukushima K, Kanemoto H, Ohno K, Takahashi M, Fujiwara R, Nishimura R, Tsujimoto H.
Computed tomographic morphology and clinical features of extrahepatic portosystemic
shunts in 172 dogs in Japan. Vet J 2014;199:376-381.
43. Sakamoto Y, Sakai M, Watari T. Portal vein/aorta ratio in dogs with acquired portosystemic
collaterals. J Vet Intern Med 2017;31:1382-1387.
44. Sugimoto H, Kaneko T, Hirota M, Tezel E, Nakao A. Earlier hepatic vein transit-time
measured by contrast ultrasonography reflects intrahepatic hemodynamic changes
accompanying cirrhosis. J Hepatol 2002;37:578-583.

78
45. Giuseppetti GM, Argalia G, Abbattista T. Liver cirrhosis: evaluation of haemodynamic
changes using an ultrasound contrast agent. Eur J Radiol 2004;51:27-33.
46. Maruyama H, Shiha G, Yokosuka O, Kumar A, Sharma BC, Ibrahim A, Saraswat V, Lesmana
CR, Omata M. Non-invasive assessment of portal hypertension and liver fibrosis using
contrast-enhanced ultrasonography. Hepatol Int 2016;10:267-276.
47. Ridolfi F, Abbattista T, Busilacchi P, Brunelli E. Contrast-enhanced ultrasound evaluation of
hepatic microvascular changes in liver diseases. World J Gastroenterol 2012;18:5225-5230.
48. Morishita K, Hiramoto A, Michishita A, Takagi S, Hoshino Y, Itami T, Lim SY, Osuga
T, Nakamura S, Ochiai K, Nakamura K, Ohta H, Yamasaki M, Takiguchi M. Assessment of
contrast-enhanced ultrasonography of the hepatic vein for detection of hemodynamic changes
associated with experimentally induced portal hypertension in dogs. Am J Vet Res
2017;78:465-471.
49. Van den Bossche L, van Steenbeek FG, Favier RP, Kummeling A, Leegwater PA, Rothuizen
J. Distribution of extrahepatic congenital portosystemic shunt morphology in predisposed dog
breeds. BMC Vet Res 2012;8:112.
50. Iredale JP, Thompson A, Henderson NC. Extracellular matrix degradation in liver fibrosis:
Biochemistry and regulation. Biochim Biophys Acta 2013;1832:876-883.
51. Sanyal AJ, Bosch J, Arroyo V. Portal hypertension and its complications. Gastroenterology
2008;134:1715-1728.
52. Grgurevic I, Puljiz Z, Brnic D, Bokun T, Heinzl R, Lukic A, Luksic B, Kujundzic
M, Brkljacic B. Liver and spleen stiffness and their ratio assessed by real-time two
dimensional-shear wave elastography in patients with liver fibrosis and cirrhosis due to
chronic viral hepatitis. Eur Radiol 2015;25:3214-3221.
53. Lee SM, Lee JM, Kang HJ, Yang HK, Yoon JH, Chang W, An SJ, Lee KB, Baek SY. Liver

79
fibrosis staging with a new 2D-shear wave elastography using comb-push technique:
Applicability, reproducibility, and diagnostic performance. PLoS One 2017;12:e0177264.
54. Sporea I, Bota S, Gradinaru-Taşcău O, Sirli R, Popescu A, Jurchiş A. Which are the cut-off
values of 2D-Shear Wave Elastography (2D-SWE) liver stiffness measurements predicting
different stages of liver fibrosis, considering Transient Elastography (TE) as the reference
method? Eur J Radiol 2014;83:e118-122.
55. Schellhaas B, Strobel D, Wildner D, Goertz RS, Neurath MF, Pfeifer L. Two-dimensional
shear-wave elastography: a new method comparable to acoustic radiation force impulse
imaging? Eur J Gastroenterol Hepatol 2017;29:723-729.
56. Yoon JH, Lee JM, Woo HS, Yu MH, Joo I, Lee ES, Sohn JY, Lee KB, Han JK, Choi BI.
Staging of hepatic fibrosis: comparison of magnetic resonance elastography and shear wave
elastography in the same individuals. Korean J Radiol 2013;14:202-212.
57. Richard K. Confidence intervals and p-values: Confidence intervals for a single mean. In:
Statistical Thinking for Non-Statisticians in Drug Regulation. 1st ed. Chichester: John Wiley,
2007;39-55.
58. Bland JM, Altman DG. Statistical methods for assessing agreement between two methods of
clinical measurement. Lancet 1989;8:307-310.
59. Spee B, Arends B, van den Ingh TS, Roskams T, Rothuizen J, Penning LC. Major HGF-
mediated regenerative pathways are similarly affected in human and canine cirrhosis. Comp
Hepatol 2007;6:8.
60. Rivero-Juarez A, Morgaz J, Camacho A, Muñoz-Rascón P, Dominguez JM, Sánchez-
Céspedes R, Torre-Cisneros J, Rivero A. Liver stiffness using transient elastography is
applicable to canines for hepatic disease models. PLoS One 2012;7:e41557.
61. Ferraioli G, Tinelli C, Dal Bello B, Zicchetti M, Filice G, Filice C. Accuracy of real-time
80
shear wave elastography for assessing liver fibrosis in chronic hepatitis C: a pilot study.
Hepatology 2012;56:2125-2133.
62. Feng YH, Hu XD, Zhai L, Liu JB, Qiu LY, Zu Y, Liang S, Gui Y, Qian LX. Shear wave
elastography results correlate with liver fibrosis histology and liver function reserve. World J
Gastroenterol 2016;22:4338-4344.
63. Jansen C, Bogs C, Verlinden W, Thiele M, Möller P, Görtzen J, Lehmann J, Vanwolleghem
T, Vonghia L, Praktiknjo M, Chang J, Krag A, Strassburg CP, Francque S, Trebicka J. Shear-
wave elastography of the liver and spleen identifies clinically significant portal hypertension:
A prospective multicentre study. Liver Int 2017;37:396-405.
64. Colecchia A, Marasco G, Taddia M, Montrone L, Eusebi LH, Mandolesi D, Schiumerini
R, Di Biase AR, Festi D. Liver and spleen stiffness and other noninvasive methods to assess
portal hypertension in cirrhotic patients. A review of the literature. Eur J Gastroenterol
Hepatol 2015;27:992-1001.
65. Buob S, Johnston AN, Webster CR. Portal hypertension: pathophysiology, diagnosis and
treatment. J Vet Intern Med 2011;25:169-186.
66. Leung VY, Shen J, Wong VW, Abrigo J, Wong GL, Chim AM, Chu SH, Chan AW, Choi
PC, Ahuja AT, Chan HL, Chu WC. Quantitative elastography of liver fibrosis and spleen
stiffness in chronic hepatitis B carriers: comparison of shear-wave elastography and transient
elastography with liver biopsy correlation. Radiology 2013;269:910-918.
67. Toshima T, Shirabe K, Takeishi K, Motomura T, Mano Y, Uchiyama H, Yoshizumi T, Soejima
Y, Taketomi A, Maehara Y. New method for assessing liver fibrosis based on acoustic
radiation force impulse: a special reference to the difference between right and left liver. J
Gastroenterol 2011;46:705-711.
68. Parise ER, Oliveira AC, Figueiredo-Mendes C, Lanzoni V, Martins J, Nader H, Ferraz ML.

81
Noninvasive serum markers in the diagnosis of structural liver damage in chronic hepatitis C
virus infection. Liver Int 2006;26:1095-1099.
69. Saitou Y, Shiraki K, Yamanaka Y, Yamaguchi Y, Kawakita T, Yamamoto N, Sugimoto
K, Murata K, Nakano T. Noninvasive estimation of liver fibrosis and response to interferon
therapy by a serum fibrogenesis marker, YKL-40, in patients with HCV-associated liver
disease. World J Gastroenterol 2005;11:476-481.
70. Orasan OH, Ciulei G, Cozma A, Sava M, Dumitrascu DL. Hyaluronic acid as a biomarker of
fibrosis in chronic liver disease of different etiologies. Clujul Med 2016;89:24-31.
71. Kanemoto H, Ohno K, Sakai M, Nakashima K, Takahashi M, Fujino Y, Tsujimoto H. Blood
hyaluronic acid as a marker for canine cirrhosis. J Vet Med Sci 2009;71:1251-1254.
72. Glińanemoto K, Orłowska A, Spuzak J, Jankowski M, Kubiak K. Suitability of using serum
hialuronic acid concentrations in the diagnosis of canine liver fibrosis. Pol J Vet Sci
2015;18:873-878
73. Lidbury JA, Hoffmann AR, Fry JK, Suchodolski JS, Steiner JM. Evaluation of hyaluronic
acid, procollagen type III N-terminal peptide, and tissue inhibitor of matrix
metalloproteinase-1 as serum markers of canine hepatic fibrosis. Can J Vet Res 2016;80:302-
308.
74. Van den Ingh TSGAM, Van Winkle T, Cullen JM, Charles JA, Desmet VJ. Morphological
classification of parenchymal disorders of the canine and feline liver. In: WSAVA, ed.
Standards for Clinical and Histological Diagnosis of Canine and Feline Liver Diseases, 1st
ed. Philadelphia: Saunders Elsevier, 2006:85-101.
75. Lidbury JA, Hoffmann RA, Ivanek R, Cullen JM, Porter BF, Oliveira F, Van Winkle
TJ, Grinwis GC, Sucholdolski JS, Steiner JM. Interobserver agreement using histological
scoring of the canine liver. J Vet Intern Med 2017;31:778-783.
82
76. Yoshioka K, Kawabe N, Hashimoto S. Transient elastography: applications and limitations.
Hepatol Res 2008;38:1063-1068.
77. Arena U, Vizzutti F, Corti G, Ambu S, Stasi C, Bresci S, Moscarella S, Boddi V, Petrarca
A, Laffi G, Marra F, Pinzani M. Acute viral hepatitis increases liver stiffness values measured
by transient elastography. Hepatology 2008;47:380-384.
78. Cocker S, Richter K. Hepatobiliary disease. In: Ettinger SJ, Feldman EC, eds. Textbook of
Veterinary Internal Medicine, 8th ed. Philadelphia: WB Saunders, 2017:1611-1621.
79. Hongbo L, Xiaohui L, Hong K, Wei W, Yong Z. Assessing routine and serum markers of liver
fibrosis in CHB patients using parallel and serial interpretation. Clin Biochem 2007;40:562-
566.
80. Kemp SD, Zimmerman KL, Panciera DL, Monroe WE, Leib MS. Histopathologic variation
between liver lobes in dogs. J Vet Intern Med 2015;29:58-62.
81. Giesen CP, Koepsell JE, Hastings EV, Lindert MC. Correlation of punch liver biopsy with
autopsy material. Am J Dig Dis 1951;18:304-307.
82. Mallory TB. The pathology of epidemic hepatitis. J Am Med Assoc 1947;134:655-662.
83. Waldstein SS, Szanto PB. Accuracy of sampling by needle biopsy in diffuse liver disease.
Arch Pathol 1950;50:326-328.

83
ACKNOWLEDGEMENTS
The PhD journey is not one that can be achieved alone. Along the way, countless people
have contributed to its contents, supported, and encouraged me.
First and foremost, I wish to thank the person who made it all possible, my supervisor, Dr.
Mitsuyoshi Takiguchi (Graduate School of Veterinary Medicine, Hokkaido University) for giving me
the opportunities to achieve my goals and aspirations, and for his constant encouragement and
guidance. Without him, I would have never learnt experienced as much as I did.
I would like to express my gratitude to Drs. Takashi Kimura (Graduate School of Veterinary
Medicine, Hokkaido University) and Kenji Hosoya (Graduate School of Veterinary Medicine,
Hokkaido University) for their time and effort to provide advice and critical comments in making this
dissertation a better one.
I am also greatly indebted to my mentor Dr. Hiroshi Ohta (Graduate School of Veterinary
Medicine, Hokkaido University), who had taken his time and effort to critically evaluate my research,
papers, and presentations. Without his insightful guidance, my work would not have been improved
to its current state.
I also thank Drs. Keitaro Morishita (Graduate School of Veterinary Medicine, Hokkaido
University), Noboru Sasaki (Graduate School of Veterinary Medicine, Hokkaido University), Yumiko
Kagawa (North Lab), Kim Sangho (Graduate School of Veterinary Medicine, Hokkaido University),
Tomohito Ishizuka (Graduate School of Veterinary Medicine, Hokkaido University) Genya Shimbo
(Graduate School of Veterinary Medicine, Hokkaido University), and Tatsuyuki Osuga (Graduate
School of Veterinary Medicine, Hokkaido University) for their constant support and assistance. My
gratitude also extends to my wonderful comrades; Drs. Khoirun Nisa, Kazuyoshi Sasaoka, and
Noriyuki Nagata for their priceless advice and support. In addition, I also wish to thank the Laboratory

84
of Internal Medicine of Hokkaido University for helping me with my experiments.
I also with to thank all sweet dogs in my laboratory for contributions to my PhD study.
Last but not least, my utmost gratitude goes to my family, wife and friends for their
encouragement and supports.