study on the contribution of the gambling industry to the ... · study on the contribution of the...
TRANSCRIPT

Study on the Contribution of the Gambling Industry to the Funding of
Sports in Two Member States – the UK and France
Final Report
Issued: 18 November 2008
Prepared for:
European Gaming and Betting Association
Prepared by:
Contact: David Henwood, Director +44(0)7958 712764

Page 2 of 71
CONTENTS
Executive Summary
Page 3
1. Background - Context for the Study
Page 7
2. Methodology
Page 9
3. UK – Sports Funding Model
Page 11
4. France – Sports Funding Model
Page 37
5. UK and France – Sports Funding Model Comparison
Page 55
6. Lessons From Other Markets – Recent Examples
Page 62
7. Analysis and Conclusions
Page 66
Appendices
Page 69

Page 3 of 71
Executive Summary
Background – Context for the Study
In its „White Paper on Sport 2007‟, the European Commission (EC) recently acknowledged the essential
role of sport in European society. One of the key issues outlined was “Putting Public Support for Sport
on a More Secure Footing”.
The EC concluded that in many Member States, sport is at least partly financed through a tax or levy on
state-run or state licensed gambling or lottery services. It went on to invite Member States to reflect
upon how best to maintain and develop a sustainable financing model for providing long term support to
sports organisations.
In support of this request, the French government recently commissioned its own study - begun in May
2008 - on the public and private financing of sports generally across Europe. The summary of this study,
by Amnyos Consulting, was recently made available to a Meeting of EU Sport Directors General on 30-
31 October in Versailles; and it is expected that it will also be presented to the EU meeting of all 27
Ministers responsible for Sport on the 27-28 November in Biarritz.
In recognition of the above context, the EGBA asked Sportsbusiness to run its own independent data
check, initially in two Member States (the UK and France) – chosen because of their perceived
differences as opposite ends of a continuum that represents a state-run monopoly on the one hand, and
a competitive gambling market on the other - to present the facts as it finds them, and also to comment
on the data collected from a qualitative perspective.
Objective of the Study
The objective of the study agreed was:
Objective of the Study
An analysis of the funding models of the gambling industries of France and the United Kingdom and
their overall contribution to sports (including, grassroots sports) provision;
A comparative analysis of the two jurisdictions reviewed – on a true, „like for like‟ basis;
An identification of the extent to which grassroots sport benefits from the other, multiple sources of
funding at the disposal of both Member States (eg sports advertising, commercial sponsorships, TV
rights issues etc); and
A conclusion on whether the arrival of further competition in the online gambling sector will, or will
not, be considered detrimental to the above funding models.

Page 4 of 71
Findings Sportsbusiness analysed the Sports Funding Models of both the UK and France from both a ‘top down’
and ‘bottom up’ perspective. ‘Top down’ to establish the contribution, scale, destination and the type of
funding by the gambling industry of all sport in each country; and ‘bottom up’ to confirm the importance
of the funding derived from the gambling industry (and indeed, other key stakeholders) to a targeted 8 to
10 of the most popular sports - common to both nations.
In the final analysis - 13 UK, and 9 French, sports were assessed. Together, they represented almost
80% of all lottery funding expended on sport in both Member States at the moment.
7 main Quantitative, and 5 main Qualitative, findings were discovered:
‘7 Quantitative Findings’
1. Major Structural Differences Between the UK and France Sports Funding Models - There are
vast structural differences between the UK and France sports funding models. The former is open,
‘entrepreneurial’, and benefiting from investment via some 44 different funding bodies; while the
latter puts a strong emphasis on state run support, and indeed the ‘official’ contribution made by
the ménages at €15,180m per annum (or 1.59% of all household spending).
(Paragraph 4.39, p44)
2. Similar Overall Spending Pictures - Despite the structural differences, the overall amount of
funding on a true ‘like for like’ basis is roughly similar – at €25,735m per annum in the UK and
€28,770m in France. Household spending represents the biggest contributor at 2.8% of average
annual spend in the UK, and 1.59% in France. Support when expressed by per head of population
is €421 in the UK, and €451 in France.
(Graphic 6, p21 and Graphic 30, p45)
3. Similar Lottery Contributions to Sport - During the period 2004 to 2007, 4.5% of UK National
Lottery Sales were allocated directly to sport. La Francaise des Jeux’s (FDJ) contribution to sport
over the same time period was 3.8%.
(Graphic 50, p55)
4. Different ‘Type’ of Lottery Contributions to Sport – While most lottery funding is routed through
structured programmes of support in both countries, the French model also accommodates the
direct employment by the State (on behalf of the Federations) of some 7,292 staff - including 1,571
coaches at a combined cost during 2007 of approximately €99.0m.
(Paragraph 4.51, p48)
5. ‘Top Down’ Analysis Shows Marked Differences in Grassroots and Performance Sport
Lottery Contribution – From our ‘top down’ analysis, we found that an average of €4.8m per
annum in lottery funding was received by each of the French Federations analysed, with 33.3% of
this sum allocated for grassroots sport and 66.7% on performance. In the UK, NGBs benefited by
a higher amount at €6.4m each - with 56.3% allocated to grassroots, and 43.7% on performance.
(Graphic 54 and Paragraph 5.8, p57)

Page 5 of 71
6. ‘Bottom Up’ Analysis Shows UK Sports Are Much ‘Better Off’ – From our ‘bottom up’ analysis,
we found that the average annual budget per UK NGB was €80.1m compared to €46.4m in France.
Of this, commercial funding represented the most important income source at 67.4% of revenue in
France, and 65.4% in the UK; with lottery funding accounting for 10.2% of revenue in France, as
opposed to 7.9% in the UK.
(Graphic 59, p59 and Paragraph 5.11, p59)
7. Additional Commercial Operators’ Contribution in the UK – Finally, the UK commercial
gambling industry contributed approximately €164m of additional funds to sport (or €41m per
annum) during the period 2004 to 2007. The majority of this spending was on football which was in
receipt of an estimated €133m over period, or €33m per annum.
(Paragraph 3.81, p35)
‘5 Qualitative Findings’
1. ‘Flexible’ Use of Lottery Funds in Support of French Sport - Although a separate lottery ‘pot’
exists within France – the Centre National pour le Development du Sport (CNDS) – its funds are
effectively used by the Ministère de la Jeunesse, des Sports et de la Vie Associative to ‘top up’
existing exchequer funding of sport, rather than as a source for any ‘stand alone’ funding bid
applications.
(Paragraph 4.18, p40 and Paragraph 4.45, p47)
2. Over Reliance on State Funding of Sport In France Set to Change - In relation to the French
sporting system, there is an increasing desire to develop more external revenue for the leading
French Sports Federations (particularly in the wake of Beijing 2008) – called for by:
La Ministère de la Jeunesse, des Sports et de la Vie Associative – because it believes its
subvention to the sports is increasing in real terms; while Federation membership is decreasing
(particularly as a result of more participants now taking part in sport informally, haphazardly, and
without recourse to their governing body);
The professional sports (particularly football and basketball) – because they require greater funding
support in order to retain the best players (and coaches) within the French club system; and when
they play for the French national team, to cover the players‟ insurance premiums in the event of
serious injury;
INSEP (Institut National du Sport et de l‟Éducation Physique) – because although it is already benefiting
from new private sector backing in relation to the financing of its current facilities refurbishment
programme, it is concerned that greater revenues will be needed over and above the current level of
State funding in order to preserve its reputation as a beacon of excellence and not fall behind world
standards.
Olympic sports (particularly table tennis) – because they are seeking to develop their athletes by
establishing innovative talent development ‘twinning’ programmes with leading countries in their field
(eg China).
(Paragraph 4.38, p44 and Paragraph 4.33, p43)

Page 6 of 71
3. Italy – ‘No Noticeable’ Change in the Context of the Regulated Opening of the Market - Of
relevance to the above, we established during our desk research that in Italy - since its
sportsbetting market was deregulated last year - there has been no, noticeable cannibalisation
of existing lottery products.
(Paragraphs 6.8-6.11, pp62-63)
4. UK – ‘Modest and Temporary’ Change in the Context of the Regulated Opening of the Market
– Similarly, we found that the introduction of the UK National Lottery in the mid 1990s demonstrated
that even where there is an initial cannibalisation of a product’s sales by a new one; it is likely to be
modest and that much change can be due to novelty, with the majority of players returning to their
longer term habits over time.
(Paragraphs 6.14-6.15, p63)
5. UK Gives Higher Percentage of Lottery Sales to Sport than Both France and Germany – In a
three way comparison with Germany as the other major nation briefly analysed as part of our
summary overview of 16 European lottery playing nations, we found that the UK model gives the
highest percentage of lottery sales to sport at 4.5% (in comparison to France on 3.8%; and
Germany on 0.6%).
(Graphic 64, p64)

Page 7 of 71
1. BACKGROUND – CONTEXT FOR THE STUDY
1.1 Sportsbusiness is a leading independent sports consultancy based in the United Kingdom (UK).
Established since 1999, it has in recent years - through an associate relationship with a former
partner of Global Betting and Gaming Consultants and now Director of new company, H2
Gambling Capital - developed a unique expertise in the supply of gambling and its inter-
relationship with the funding of sport across the European Union (EU).
1.2 Following the publication of the European Commission (EC) „White Paper on Sport 2007‟,
Sportsbusiness was approached by the European Gaming and Betting Association (EGBA) in
June 2008 to undertake an independent fact finding study and assessment into the ‘Contribution
of the Gambling Industry to the Funding of Sport in Two Member States – the UK and France’.
1.3 The EGBA is the leading association for European online gaming and betting operators. It
represents major European operators established and regulated within the EU such as Bet-at-
home.com, bwin, Digibet, Carmen Media Group, Expekt, Interwetten, PartyGaming, and Unibet.
The EGBA promotes the right of private gaming and betting operators that are regulated and
licensed in one Member State to have fair market access throughout the whole of the EU.
1.4 In its White Paper on Sport, the EC has recently acknowledged the essential role of sport in
European society. One of the key issues outlined was “Putting Public Support for Sport on a More
Secure Footing”. The EC highlighted that it understands the importance of public support for
‘grassroots’ sport, and confirmed that it is in favour of such support provided it is granted in
accordance with EC competition law. In addition, the European Parliament resolution on the
White Paper voiced its concern at the possible “deregulation” of gambling services and its impact
on the continued financing of professional and grassroots sports.
1.5 It was concluded that in many Member States sport is at least partly financed through a tax or
levy on state-run or state licensed gambling or lottery services. The EC went on to invite Member
States to reflect upon how best to maintain and develop a sustainable financing model for
providing long term support to sports organisations.
1.6 In support of this request, the EC also called for an independent study into the financing of
‘grassroots’ sport from both public and private sources in all 27 Member States, and on the
impact of on-going changes in this area. It is expected that this study will be completed during the
French Presidency of the EC, and will be published by the end of the financial year 2008/09. In
parallel, the French government recently commissioned its own study - begun in May 2008 - on
the public and private financing of sports generally across Europe. The summary of this study, by
Amnyos Consulting, was recently made available to a Meeting of EU Sport Directors General on
30-31 October in Versailles; and it is expected that it will also be presented to the EU meeting of
all 27 Ministers responsible for Sport on the 27-28 November in Biarritz.
1.7 In recognition of the above context, the EGBA has asked Sportsbusiness to run its own
independent data check, initially in two Member States (the UK and France) – chosen because of

Page 8 of 71
their perceived differences as opposite ends of a continuum that represents a state-run monopoly
on the one hand, and a competitive gambling market on the other - to present the facts as it finds
them, and also to comment on the data collected from a qualitative perspective. The objective of
the study agreed was:
Graphic 1 - Objective of the Study
An analysis of the funding models of the gambling industries of France and the United
Kingdom and their overall contribution to sports (including, grassroots sports) provision;
A comparative analysis of the two jurisdictions reviewed – on a true, „like for like‟ basis;
An identification of the extent to which grassroots sport benefits from the other, multiple
sources of funding at the disposal of both Member States (eg sports advertising, commercial
sponsorships, TV rights issues etc); and
A conclusion on whether the arrival of further competition in the online gambling sector will,
or will not, be considered detrimental to the above funding models.
1.8 In achieving the above, it was agreed that consideration should be given to the following:
The total scale of the contribution;
Where the funding is directed (ie ‘grassroots’, ‘performance’, ‘people/places’);
The types of sports that benefit (‘professional’ versus ‘amateur’ sports);
The level of funding towards amateur versus professional sports;
The level of other types of funding (ie sponsorship, advertising, marketing).

Page 9 of 71
2. METHODOLOGY
2.1 In order to validate the data collected and provide as accurate a funding picture as possible in the
quickest timeframe, the optimum methodology agreed was to conduct the study in two
components across three carefully scheduled stages. The two components comprised a ‘top
down’ perspective to establish the contribution, scale, the destination and the type of the funding
of all sport by the gambling industry. This was conducted in parallel to a ‘bottom up’ analysis of
the importance of the funding derived from the gambling industry (and indeed, other key
stakeholders) to a targeted 8 to 10 of the most popular sports - common to both nations.
2.2 The three stages were designed to redress a number of potential outcomes experience had
taught can weaken studies of this kind, such as the possibility of traditional data questionnaires
either not being filled in correctly; or indeed, being completed and returned by the wrong person
within the organisation targeted. In addition, the methodology chosen was also designed to take
into account a timescale that had to accommodate the height of European summertime (August);
and the clash with the staging of the Beijing 2008 Olympic and Paralympic Games.
2.3 One key tactic was for Sportsbusiness to utilise its in house team of desk researchers in order to
draw together as much data as possible early on in the study, prior to engaging its network of key
contacts throughout the EU, and the various UK and French sports federations targeted, in order
to set up face to face field meetings with the key personnel directly responsible for validating and
confirming all data collected. In summary, the three stages were:
Graphic 2 – Study ‘Three Stage’ Process
Stage 1 – Template Design and Data Search
w/c 18 June 2008 Desk Research/Logistics
4 Weeks
Stage 2 – Fact Finding and Data Validation
w/c 21 July 2008 Field Work Meetings - UK
3 Weeks
w/c 1 September 2008 Field Work Meetings - France
2 Weeks
Stage 3 – Population of Templates and Reporting
w/c 11 August 2008 Funding Model Analysis - UK
2 Weeks
w/c 15 September 2008 Funding Model Analysis - France
2 Weeks
w/c 29 September 2008 Submission of Draft Report
2 Weeks
w/c 6 October 2008 Submission of Final Report

Page 10 of 71
2.4 In relation to the ‘template’ referred to above, drawn up to analyse all the data collected and
ensure a true ‘like for like’ comparison between the two Member States - both ‘top down’ and
‘bottom up’ variations were developed. Figures run were for a full four year funding cycle over the
calendar years 2004-07. This duration was chosen in order to reflect an Olympiad in the case of
the so called ‘amateur’ sports, and a World/European Championships cycle in the case of many
of the ‘professional’ sports. All funding amounts were collated in European Euros (€), using the
current exchange rate of 0.792 GB Pounds: 1 Euro wherever applicable. It was agreed all text,
commentary and analysis be provided in the English language only at this stage.
2.5 Finally, the following definitions were used during the study in order to ensure as much
commonality as possible when comparing data across the two nations:
Graphic 3 - Study Definitions
Category Definition Principally Organised Via
‘Grassroots’ Formal, organised sport within
education (primary,
secondary, tertiary)
Formal, organised sport within
the local community
Formal, organised sport within
the voluntary club
State funded education
Local Government
Governing
Body/Federation
‘Performance’ Representative sport at county,
regional, national level
(junior and senior)
Sport in the professional club or
on the professional tour
Governing
Body/Federation
Professional
Leagues/Tour
‘People/Programmes’ Revenue funding in support of
the playing of formal,
organised sport
State Central and/or
/Local Government
‘Places/Facilities’ Capital funding in support of the
provision of facilities and
equipment where formal,
organised sport is played
Local Government
‘Events’ Spectator paying events Governing
Body/Federation
‘Professional’ Sport when athletes are paid to
play as employees of a
club/team or members of a
professional tour
Professional
Leagues/Tour
‘Amateur’ Sport when athletes are free to
compete (for money or not)
at any level desired
Governing
Body/Federation

Page 11 of 71
3. UK – SPORTS FUNDING MODEL
UK Structure – Overview
Note: All figures official UK Government statistics/Sportsbusiness (2008)
3.1 Sport in the UK represents 2% of the country’s GDP (twice that of agriculture) and attracts
significant commercial, exchequer, lottery and charitable funding. Yet while the funding model in
place is one of the most effective within the European Union (in terms of revenues generated), it
is also regarded as one of the most complex.
3.2 Support to both grassroots and performance sport is open, ‘entrepreneurial’, and benefiting from
investment via some 44 generic (yet all essentially different) funding bodies over and above the
national governing bodies for each sport. Because of this variety, it is not surprising that
commentators, analysts, and academics have all failed in recent years to agree upon a common
descriptor of the UK funding model; however for the purposes of this study, we have found the
simplest explanation to be to group investors into 10 main categories:
Graphic 4 - Main Funders of Sport in the UK
10. Households
Family Spending
9. NGBs (National Governing Bodies)
Self Generated/Membership Charitable/Other Grants
Commercial/Sponsorship Media/Broadcast Rights
Events World & European Bodies/Other
8. Commercial Professional Sports
Clubs/Teams Fitness Chains
Leisure Contractors Commercial Sponsors
7. Charitable National Sports Foundation Foundation for Sport and
Arts Youth Sports Trust Sports Coach UK
SportsAid Sports Relief
Spaces for Sport Programme
6. National Sports
Organisations BOA/BPA
Commonwealth Games Councils
CCPR Home Country
Sports Institutes LOCOG/ODA/LDA
5. NDPBs (Non Departmental Public
Bodies) UK Sport
Sport England sportscotland
Sports Council for Wales Sport NI
4. Education British University College Sport
Specialist Sports Colleges SSPs (School Sport Partnerships)
SkillsActive National Skills Academy
3. UK National Lottery
Lottery Sports Fund Big Lottery Fund
Awards for All Fund Active Communities Development Fund London 2012 Fund
2. Government – Local
Local Authorities CSPs (County Sports
Partnerships)
1. Government - Central
No 10/HM Treasury Department of Culture Media
and Sport Department of Children Schools and Families
Scottish Parliament/Welsh Assembly/NI Assembly
£ GBP
to grassroots and
performance sport in the UK

Page 12 of 71
3.3 Prior to further analysis under each category, it must be stressed that the model in the United
Kingdom has added complexity because it also covers 5 different administrations – the UK/GB
level itself, plus the four home countries of England, Scotland, Wales and Northern Ireland. This
has resulted in the evolution in some instances (particularly since the first Blair government of
1997) of 5 parallel bodies effectively performing the same funding role – the most notable
example being the 5 NDBPs of UK Sport, Sport England, sportscotland, Sports Council for Wales,
and Sport Northern Ireland.
Government - Central
3.4 At central Government level, the primary Department with jurisdiction for sport in England and the
UK is the Department for Culture, Media and Sport (DCMS). Within the three remaining home
countries, the same function is performed centrally by the Scottish Parliament, the National
Assembly for Wales, and the Northern Ireland Assembly, although the funding sums are much
smaller. The DCMS provides direct funding in accordance with appropriate Public Service
Agreements (PSAs) to two sports NDPBs - Sport England and UK Sport. Sport England is funded
“to promote and invest in grassroots and community sport”, whilst UK Sport is supported in
“helping the UK towards world class success”. Both Sport England and UK Sport distribute lottery
and exchequer funds to sport (€222.46m and €138.19m in 2006/07 respectively) – see more later.
3.5 In addition to funding routed through its sports NDPBs, No 10 provides indirect support via an
80% rate relief on all business rates charged to voluntary sports clubs by HM Treasury; and direct
support via its pump priming of the organisation of the forthcoming €11.8bn London 2012 Olympic
and Paralympic Games. The DCMS in turn runs three direct sports development programmes:
TASS (Talented Athlete Scholarship Scheme) for university based elite athletes at c€5.07m pa;
CCDF (Club Community Development Fund) for the capital funding of local sports club facilities at
c€12.05m pa; and Sportsmatch – the £ for £ programme that encourages the business sector to
invest in sport at the grass roots level – awarding c€45.67m to more than 3,800 projects in 78
different sports since 1995.
3.6 Finally, the DCSF (Department for Children Schools and Families) currently invests c€329.22m
pa into the PESSCL (Physical Education and School Sport Club Links) programme to encourage
school leavers to join sports clubs and prevent ‘drop off’ at aged 16-19.
Government - Local
3.7 By far the biggest investors in sport in the UK are its c640 Local Authorities (LAs). Indeed, sport
and leisure provision is regarded as one of only three services delivered by LAs that can make a
profit (the others being car parking and cemeteries). In 2007, the Local Government Association
estimated c€1.5bn revenue spending on sport by LAs, with a further €570.91m on capital
development and/or refurbishment of facilities.
3.8 The facilities stock represents a current funding dilemma however. In England, there are 1,642 LA
run or owned sport and leisure facilities. These break down into 679 wet leisure centres, 569 dry

Page 13 of 71
leisure centres/sports halls, and 394 stand-alone swimming pools. Yet the current stock is old: the
average age is around 25 years, compared to 11 years in the private sector, with only a third less
than 20 years old.
3.9 The public expectation leading up to London 2012 in particular, is for further investment still to
come, yet LAs are required to operate to a cost-driven culture – embedded through successive
waves of CCT (Compulsory Competitive Tendering), Best Value and CPA – and the reality is that
despite huge investment in recent years (including an additional c€2.3bn capital from the National
Lottery since 1994), there has been a steady re-direction of funds towards education and social
services, with sport being afforded a lower priority.
3.10 The above said, the introduction of 49 County Sports Partnerships in 2005 has bucked the trend
in revenue terms. Pump primed by LAs, these also benefit from €15.54m funding annually from
Sport England to link the vision and targets of NGBs to local infrastructure; to develop local sports
clubs; and to improve school-club links.
UK National Lottery
Graphic 5 - UK National Lottery Good Causes Distribution
Health, Education, Environment, Community & Charity, 50.0%
Sport, 16.7%
Arts, 16.7%
Heritage, 16.7%
Source: Camelot (2008)
3.11 The introduction of the UK National Lottery in 1994 was seen as one of the most significant
improvements to the UK sporting system, however in recent years the sums allocated to sport
have diminished in real terms. On its launch, sport - both grassroots and performance, via the
Lottery Sports Fund (LSF) - was allocated 20% of all proceeds alongside four other ‘good
causes’. By the turn of the Millennium, however, this percentage had shrunk to 16.7%, with the
introduction of a new Big Lottery Fund (BLF) responsible for distributing 50% of the overall
proceeds to education, health and environment initiatives across the UK. That said, sport does
continue to benefit (c€215m pa) from those BLF schemes where it can demonstrate a link to
those three policy areas.

Page 14 of 71
3.12 In addition to sums generated through the LSF and BLF, sport in the UK also benefits from the
Awards for All Fund (€90m) and the Active Communities Development Fund (€116m). The former
is a joint lottery programme supported by Heritage Lottery Fund, Arts Council of England, the
National Lottery Charities Board and Sport England. It gives applicants the opportunity to apply
for Lottery grants ranging from €650 to €12,750. These are designed to support short term
revenue schemes that develop opportunities for participation in sport, particularly by target
groups. Examples include coach training, competitions, leagues, participation programmes, and
associated non-personal items of equipment. The latter is designed to increase sports
participation among black and ethnic minority communities, people with disabilities, women and
girls, people on low incomes.
3.13 Specifically in relation to the Lottery Sports Fund (the principal funding source for spending on
sport in the UK) at €279m pa, investment is distributed via the 5 sports NDPBs – with UK Sport
running ‘World Class’ Pathway and Events programmes in support of performance sport at the
UK/GB level; and the home country Sports Councils distributing their share on a population
based, pro rata allocation (Sport England – 83%; sportscotland - 9%, Sports Council for Wales –
5%; Sport NI – 3%).
3.14 Finally, a new London 2012 ‘Going for Gold’ Fund was created in 2006 – with the aim of raising
an additional c€250m towards the overall budget of c€750m towards the cost of taking Team GB
to the Games. Currently, this is over-performing against expectations.
Education
3.15 Over and above the €329.22m funding allocated centrally to sport from the Department for
Children Schools and Families via the PESSCL programme, a raft of other education and training
based investment are in place. At the HE/FE level, British University College Sport (BUCS)
oversee the growing number of British universities (estimated at c35%) now opening up their
sports facility provision (and accompanying degree programmes where relevant) to the local
community. The most extreme example of this recently has been Leeds Carnegie Metropolitan
University which in 2007 ranked in the Top 10 biggest sponsors of sport in the UK, ploughing
some €35m into professional rugby union, rugby league and cricket.
3.16 At school level, 2005 also saw LAs pump priming (along with the Youth Sports Trust) the
introduction of 450 new Specialist Sports Colleges, and their accompanying SSPs (School Sport
Partnerships). In addition to this new delivery infrastructure, sport has been quick to capitalise on
the biggest ever capital spending programme ever embarked upon in British schools – the
Building Schools for the Future (BSF) programme – which has the aim of rebuilding or renewing
every secondary school in England – sports facilities included. The overall €2.8bn exchequer
funded programme is planned to span around 15 years, and will benefit over 3.3 million pupils in
3,500 schools. Sport’s share of this, however, while likely to be significant, is difficult to gauge at
this early stage in the programme’s roll out.

Page 15 of 71
3.17 Finally, the last five years has seen new investment into sport through the vocational skills
agenda, with the establishment of SkillsActive as the €5m sector skills council for sport in the UK,
and the planned introduction of a new €28m National Academy for Sport and Active Leisure this
autumn - in the form of a network of 9 regional training hubs and accompanying online portal. In
recognition of these new initiatives, additional money has now also flowed into sport via the
Learning and Skills Council, which now provides generic support for FE colleges seeking capital
new builds and redevelopments that help with the delivery of sport and recreation educational
programmes, and also to coaching and young elite athlete support in the form of €11.5k pa
bursaries and apprenticeships.
Non Departmental Public Bodies (NDPBs)
3.18 The majority of UK central government investment in sport has, since 1972, been routed via its
sport NDPBs. All receive annual exchequer funding and since 1994, have been Lottery
Distributing Bodies in their own right. Sport England (€44m pa Exchequer) and UK Sport (€19m
pa Exchequer) are both accountable to Government against their respective Public Service
Agreement (PSA) targets and so-called ‘Funding Agreements’. The same is true for
sportscotland, Sports Council for Wales and Sport NI directly via its respective administrations.
3.19 There is, currently, no line of accountability between the 5 NDPBs. Organisational and remit
changes of 2006, however, brought a greater, but not total, separation of responsibility between
UK Sport and Sport England for performance sport. In effect, part of Sport England’s brief now is
to grow the pool of talented performers that might move into the orbit of UK Sport funding and
support. This point was, perhaps, overlooked in 2005 with the launch of the former’s Whole Sport
Planning programme and its accompanying ‘Start, Stay and Succeed’ funding streams for English
NGBs, but has since become part of the focus of the current (2008) Sport England strategic
review.
3.20 Finally, the evolution of the NDPBs own lottery investment programmes is worthy of comment
here. Initially, all lottery monies were disbursed towards capital projects and in response to open
applications from eligible applicants – such as local authorities and sports clubs. By 1997,
however, revenue funding applications were admissible for the support and training of talented
young athletes leading up to the Sydney 2000 Olympic Games. The emergence of UK Sport in
1996 created an additional distributor and resources and funds were divided out across Sport
England and UK Sport in particular. Today, lottery funding represents nearly 82% of the 5 NDPBs
overall budget spend.
3.21 Thereafter, Sport England allocated approximately 75% to grassroots projects and 25% to
performance projects (such as the Wembley National Stadium, the Manchester 2002
Commonwealth Games, and the €150m English Institute of Sport); the capital/revenue distinction
becoming less clear. Moreover at this time, at the behest of government direction, the fund
became less available to open application, and an increasing number of initiatives or programmes
were funded through solicited applications. Today, however, investment is much clearer; it being
routed through two funding streams, roughly on a 40:60 split of the overall budget – nationally (on

Page 16 of 71
a sport by sport basis to some 46 sports), and regionally (to community projects and the 49
County Sports Partnerships).
National Sports Organisations (NSOs)
3.22 Peculiar to the UK funding model are the variety of other independent National Sports
Organisations (NSOs) that exist to support sport outside of the State. The main ones whose remit
is to support performance and grassroots sport in the UK generically are described below.
3.23 The BOA (British Olympic Association) and BPA (British Paralympic Association) are the UK’s
National Olympic and Paralympic Committees - overseeing the entering of Team GB into their
respective Games (funding the preparation for the Games is the remit of UK Sport). Both are self-
financed, raising significant revenue from commercial sponsors, and remain proudly independent
of any lottery or exchequer support.
3.24 At Commonwealth Games Level, a similar function is performed by the Commonwealth Games
Councils of England, Scotland, Wales and NI. They, on the contrary, are funded by the Home
Country Sports Councils, including any incidences of bidding to host the Games – such as for
Manchester 2002 in England, and for Glasgow 2014 in Scotland.
3.25 The CCPR (Central Council for Physical Recreation) exists as a federation of c270 national
governing bodies of sport, representing some 117 different sports/activities ranging from football
to rambling. A membership body, it raises funds from government and commercial sources to
provide advisory services to sport at the national and local club level, and ensure sport has a
single, independent voice as well as the skills and capacity to deliver.
3.26 Since the mid 1990s, each of the four home countries has also developed an Institute of Sport at the
elite level to provide a number of high performance training facilities and sports science/medicine
services to performance athletes. 17 training centres now exist, built at a cost of c€250m (9 in
England, 6 in Scotland and 1 each in Wales/NI). Each operates commercially although funding
support is routed to the Institutes’ main clients – the NGBs – via the 5 sport NDPBs.
3.27 Finally, the advent of the London 2012 Olympic and Paralympic Games is witnessing never before
seen investment from three new bodies in particular: LOCOG (London Organising Committee of the
Olympic Games) - responsible for staging the Games, and in particular its planned facilities and
sports development ‘legacy’ programme for each of the 26 sports thereafter - a key component to
London’s winning of the bid in 2005; the ODA (Olympic Delivery Authority) - responsible for building
the €11.8bn infrastructure to host the Games in London; and the LDA (London Development
Agency) - responsible for developing sporting opportunities in the capital city on the back of the
Olympiad.

Page 17 of 71
Charitable
3.28 Of equal importance in recent years has been the increased number of generic charitable trusts
and foundations that have been established to support British sport. The most significant of these
recently has been the National Sports Foundation established directly by Prime Minister Gordon
Brown when serving as the Chancellor of the Exchequer in 2006 “to facilitate and encourage
partnerships between private investors and community sports projects in England”. In essence,
new or additional private investment is matched pound for pound with Foundation funding. Some
€43m was announced in the 2006 budget speech, with €19m allocated across the so called ‘big
5’ sports of football, rugby league, rugby union, tennis and cricket.
3.29 A more established, but similar concern is the Foundation for Sport and the Arts. Established by
the football pools promoters, this body has approximately €76 million annually to donate to sports
and arts organisations. Grant aid is made for the support of 'athletic games', 'athletic sport', 'non-
athletic sport', or 'the Arts'.
3.30 In relation to school sport investment, a major landscape partner that has also emerged is the
Youth Sport Trust (YST). It is a national charity, established in 1994, to “build a brighter future for
young people in sport”. The Trust develops and implements, in close partnership with other
organisations, quality physical education and sport programmes for all young people in schools
and the community. The Trust’s educational sporting programmes delivered through schools are
supported by a range of corporate partners, trusts and foundations, and government departments.
The YST also supports the network of Specialist Sports Colleges which are designated sports-
focused schools. They are at the hub of the government’s strategy to enhance young people’s
opportunities to participate in a wide range of sport. The YST provides a framework of support
and resources to this aim including lobbying for PE to rise from the current statutory 2 hour per
week curriculum requirement in schools to 5 hours.
3.31 In coaching, the remit of Sports Coach UK (SCUK) extends across coach development and
education and is subsumed within the so called UK Coaching Framework and the developing
uniform qualification for sports governing bodies – the UK Coaching Certificate. This work is likely
to also see the roll out of 9 regional coaching centres from the autumn of 2008 onwards. €1.9m
funding for SCUK is primarily sourced from Sport England and UK Sport with the former more
interested in the development of coaches and opportunities for coaches, and the latter in high
performance sport. SCUK also provides a wide ranging programme of workshops available at
different levels - as well as books, videos, coaching aids and software through its trading arm -
Coachwise.
3.32 SportsAid and Sport Relief (a subsidiary charity of Comic Relief) both provide financial aid in the
form of grants to talented young people (SportsAid), and disadvantaged young people (Sport
Relief). Grants for the former are awarded to help offset the high costs of training and equipment
to enable young people to make the most of their sporting ability. Grants for the latter are
distributed through Sport Action Zones, which identify areas of highest deprivation.
Page 18 of 71
3.33 Finally, a major partnership of recent note has between the Barclays Spaces for Sport
programme – established between Barclays Bank, the Football Foundation (see below), and
Groundwork. Over 100 sustainable sports sites are to be created across the UK every year over
the three year €38m programme. The facilities provided are to be dependent on the needs of
each local community, but could in theory range from basketball courts to BMX tracks to football
pitches.
Commercial
3.34 Commercial sector investment in British sport is routed through four main sources – professional
sports clubs; fitness chains; private leisure contractors; and commercial sponsors.
3.35 It is fair to say it is not entirely clear how sponsorship (or for that matter, broadcast) monies in the
UK targeted at elite or professional sport are ‘recycled’ to supporting grassroots programmes -
and this remains a popular discussion area amongst the major professional sports clubs in
football, rugby union, cricket – many of whom have since established their own community
development schemes in support of local schools and clubs within their catchment (eg the recent
‘Playing for Success’ study support centres).
3.36 The Premiership football clubs themselves had an estimated combined turnover of €2.2bn in the
2006/07 season, and British professional football's total income is in the region of €2.9bn. Other
major sports, however, have a turnover in the low tens of millions. For example, cricket has a
turnover of only €77m and is highly dependent on its TV contract, which is currently worth €57m a
year for the 2006-09 seasons.
3.37 There are 1,757 private sector health and fitness clubs in England – providing a significant facility
stock for local community sport. Private sector leisure contractors, meanwhile, invest c€35m
annually, but claim it could be considerably more if a level playing field were on offer. Some
private sector operators have stated there is a lack of transparency in tendering for contracts
against LAs and their in house Leisure Trusts.
3.38 Commercial sponsorship in sport, however, still remains a major source of revenue and is valued
at around €570m pa (excluding commercial gambling operators contribution), although this figure
may be inflated. The majority of direct sponsorship funds accrue at the elite or professional end of
sport. Sponsorship at the grassroots level is estimated at no more than 10-20% of the total.
3.39 Traditionally, the top 5 biggest sectors sponsoring sport in the UK have been financial services;
sports goods; alcoholic drinks; automotive; and, more recently, media and telecommunications.
Commercial gambling companies and bookmakers have developed an increasing synergy with
sport over the last 3-4 years, initially entering the market in football – via the Premiership clubs
(32 Red, Bet24, 888, Mansion, Boylesports), but quickly expanding to a lower level - via the
Football Conference (Blue Square). More on this later (paragraphs 3.79-3.86)

Page 19 of 71
3.40 Finally, commentators in the UK are increasingly suggesting that three key external factors might
have a positive impact on grassroots sponsorship in sport in the future: first, an increase in
corporate social responsibility issues is leading companies to consider more community oriented
programmes; second, the public debate over obesity and inactivity presents a cause-related
marketing opportunity for corporates seeking to combat a significant social issue; and third, the
increasing likelihood of the commercial sector in the UK (despite the economic downturn) now
seeking to ‘jump on the London 2012 bandwagon’, particularly following the success of Team GB
at the recent Beijing 2008 Olympic Games, and confidence in the UK government’s underwriting
of the event.
National Governing Bodies of Sport (NGBs)
3.41 The bedrock of British sport is its federations or ‘National Governing Bodies’. Many of the NGBs are
funded by all 5 sports NDPBs. There are a number of pertinent issues to consider here. Funding
may be from exchequer, lottery, or both sources. Amounts vary according to the NGB plans and
their relative wealth, and according to purpose of spend - be it grassroots or performance. Some
sports are funded by all NDPBs, some by only one. Finally, not all NGBs are funded from the
public purse.
3.42 In addition, the structure and organisation of individual NGBs is complex and diverse, as well as
rooted, in many cases, in decades of tradition. However, with so many of these bodies being
dependent on government funding, many have developed structures and delivery systems that
mirror the prevailing NDPB structures of the time. With the advent of CSPs, the NGBs are
managing and deploying their resources to make a better fit with the new 49 county based generic
delivery system. There are only a few sports with the independent resources which allow them to
consider alternatives to the public sector funded sports system of the time. With the increased
functional separation of UK Sport and Sport England, some NGBs have also considered the spread
of devolved responsibilities, setting up English as well as British bodies or federations.
3.43 At the heart of the NGBs grassroots structure are their member clubs. The UK has a rich heritage
of sports club membership, largely based on small scale single sport clubs affiliated to their
respective NGBs for competition, coaching and other benefits.
3.44 In addition, many of the NGBs now have their own sports specific Charitable Foundations
attached to them – set up to boost investment in the grassroots of their sport. These range
dramatically in size, scope and scale of operation. The Cricket Foundation, for example, works
closely with the England and Wales Cricket Board (ECB) to deliver community and secondary
school cricketing opportunities. The Cricket Foundation is funded in part by the ECB and in part by
private donation (c€31m). It has also been a recipient of Sport England funding in recent years.
3.45 Perhaps the Foundation with the greatest ‘reach’ is the Football Foundation. It is the largest
sports charity in the UK spending c€545m across 117 different projects since 1997 – funded by
the Premier League, the Football Association (FA), Sport England and the Government. Its mission
is “to improve facilities, create opportunities and build communities throughout England”. It is the

Page 20 of 71
country’s largest funder of grassroots football, and its community scheme aims to use football and
other sports as a force for social change.
Households
3.46 Finally, by far the most indirect, but biggest funders of the UK sports industry are its 24.8m
households. Current estimates from Sport England suggest that 2.8% of all household spending is
allocated towards sports related goods and services. Latest figures from the Office of National
Statistics GHS (General Household Survey) show household spending totaled €737.67bn in 2005,
of which €20.65bn therefore, was on sport.
3.47 Interestingly however, this ‘contribution’ (unlike in France) is never considered central to the
funding of sport in official UK government statistics, nor used by the UK when describing the
overall amount of funding available to its sports overall.
Summary – UK Overall Spending Picture
3.48 Assimilating all the figures above allow us to project an estimated overall total spend on the UK
sporting system pa. It should be noted that while many of the latest published figures available
are (2008) current, for the purposes of the table below, spend has been assimilated using an
annual average over the study period (2004-07). The total provides an important, and detailed,
indicator of the overall spending picture currently within UK sport:

Page 21 of 71
Graphic 6 - Main Funders of Sport in the UK – Overall Spending Picture
Category Estimated Direct Spend on Sport
(€m, Annual Average 2004-07)
% of Total
1. Government - Central €367.95 1.43%
Department of Culture Media and Sport (DCMS) 20.63
Department of Children Schools and Families (DCSF) 329.22
Scottish Parliament/Welsh Assembly/NI Assembly 18.10
2. Government - Local €2,086.45 8.11%
Local Authorities 2,070.91
CSPs (County Sports Partnerships) 15.54
3. Lottery – UK National Lottery €700.0 2.72%
Lottery Sports Fund 279.00
Big Lottery Fund 215.00
Awards for All Fund 90.00
Active Communities Development Fund 116.00
London 2012 ‘Going for Gold’ Fund excluded
4. Education €36.0 0.14%
British University College Sport 3.00
Specialist Sports Colleges/ SSPs (School Sport Partnerships) within DCSF
SkillsActive/National Skills Academy 33.00
5. Non Departmental Public Bodies (NDPBs) exchequer only €94.0 0.37%
UK Sport 19.00
Sport England 44.00
sportscotland 15.00
Sports Council for Wales 11.00
Sport NI 5.00
6. National Sports Organisations €18.0 0.07%
BOA/BPA/Commonwealth Games Councils 9.00
CCPR 9.00
Home Country Sports Institutes within NDPBs
London 2012 - LOCOG/ODA/LDA excluded
7. Charitable €198.22 0.77%
National Sports Foundation 43.00
Foundation for Sport and Arts 76.00
Football Foundation 60.55
Youth Sports Trust 2.00
Sports Coach UK 3.00
SportsAid/Sports Relief 1.00
Spaces for Sport Programme 12.67
8. Commercial €646.0 2.51%
Professional Sports Clubs/Teams within NGBs
Fitness Chains/ Leisure Contractors 35.00
Commercial Sponsors (non-Gambling Industry) 570.00
Commercial Gambling Operators 41.00
9. National Governing Bodies (NGBs) excludes public financing €933.70 3.63%
Self Generated/Membership 179.36
Charitable/Other Grants 12.89
Commercial/Sponsorship 503.06
Media/Broadcast Rights 178.10
Events 41.54
World & European Bodies/Other 18.75
10. Households €20,654.69 80.26%
Family Spending 20,654.69
Total Estimated Annual Spend €25,735.01 100% Expressed as Spend per Capita (pop = 61.2m) €420.51
Note: The budget sum for staging „London 2012‟ (€11.8bn over 7 years) plus the „Going for Gold‟ lottery game (€250m over 5 years) have been excluded given no obvious comparative sums exist within France

Page 22 of 71
UK Financial Analysis
3.49 Our analysis of the contribution of the gambling industry to the funding of the UK’s sports system
is presented within the following headings:
National Lottery Funding Overview;
National Lottery Funding of 13 Leading Sports 2004-07 (‘Top Down’);
An Assessment of the Relative Importance of 13 Sports’ Funding by Source (‘Bottom Up’);
The Commercial Gambling Industry’s Contribution to Sport.
3.50 In both the French and the UK cases our analysis is focused on the years 2004 to 2007 inclusive.
This is the case as the funding of sports can vary within the cycles of major competitions such as
World/European Championships and the Olympic Games. Furthermore, we believe that it would
be dangerous to assess a single year given there can be variations from longer term patterns of
funding from time to time.
National Lottery Funding Overview
3.51 In the UK the National Lottery, which is operated under license by Camelot, generated total sales
of €24.599bn during the period 2004 to 2007, having fallen by 4% to €6.079bn during 2007. Of
these sales 50% is allocated to prizes with 28% going to the good causes.
3.52 Sport’s share of the good cause money equates to just under 4.7% of sales, however our analysis
has shown that €1.116bn, or 4.52%, has actually been allocated to sport via its ‘primary’ route –
the Lottery Sports Fund - during the period 2004 to 2007. (Note: as previously mentioned in
paragraphs 3.11-3.12, an indirect allocation to sport in the UK also exists via „secondary‟ routes -
namely the Big Lottery Fund, Awards for All Fund, Active Communities Development Fund).
3.53 Our analysis has determined that the five distribution bodies have allocated this money across a
total of 57 specific sports and four further categories: dance, movement and fitness; home
countries sports; Paralympics; and multi-sport.
3.54 Across all of the funding we have determined that individual sports were awarded a total of
€953.4m during 2004 to 2007, with the remaining €162.4m allocated to multi/disabled sports. In
total 75.7% or €844.5m of lottery funding was targeted at ‘grassroots’ sport, with the remaining
€271.3m focused on ‘performance’ sport.
3.55 During the period, sports governing bodies were allocated a total of €261.9m or 23.5% towards
performance, with the allocation for grassroots being €691.5m or 62%. The remainder was
allocated as €132.1m or 11.8% to multi-sports and €30.3m or 2.7% to disabled sport.
3.56 The changes in the percentage of overall funding allocated to sport since the introduction of the
National Lottery in 1994 is shown in the following four graphics:

Page 23 of 71
Graphic 7 - Where UK National Lottery Sales Revenue Goes
Prizes, 50.0%
Good Causes, 28.0%
Lottery Duty, 12.0%
Retailers, 5.0%
Costs, 4.5% Profit, 0.5%
Source: Camelot (2008)
Graphic 8 - Percentage of Lottery Good Cause Money Allocated to Sport by Distribution Body
Pre
13.10.97 to
14.02.99 to
16.05.99 to
20.08.01 to
31.03.06 to
31.03.07 From
01-04-07
UK Sport 1.5% 3.8% 5.14%
Sport England 16.66% 13.88% 4.17% 13.88% 12.60% 10.33% 8.83%
Sport Scotland 1.78% 1.48% 0.45% 1.48% 1.35% 1.35% 1.34%
Sports Council for Wales 1.00% 0.83% 0.25% 0.83% 0.75% 0.75% 0.77%
Sports Council for NI 0.56% 0.47% 0.14% 0.47% 0.43% 0.43% 0.58%
Total Sport Fund 20.00% 16.67% 5.00% 16.67% 16.67% 16.67% 16.67%
Source: Department of Culture, Media and Sport (2008)
Graphic 9 - Amount of Lottery Good Cause Money Allocated to Sport by Distribution Body
€m 2004 2005 2006 2007 2004-07
Total Average
UK Sport 2.6 32.5 23.2 89.3 147.7 36.9
Sport England 135.4 220.4 255.3 153.4 764.5 191.1
Sport Scotland 35.4 26.8 26.8 23.4 112.4 28.1
Sports Council for Wales 12.9 13.2 16.0 13.5 55.5 13.9
Sports Council for NI 8.4 8.9 8.4 10.1 35.7 8.9
Total Sport Fund 194.7 301.7 329.8 289.6 1,115.8 279.0
Source: Department of Culture, Media and Sport/Sports Councils (2008)

Page 24 of 71
Graphic 10 - The Contribution of the National Lottery to the Financing of Sport 2004 to 2007
(€m) 2004 2005 2006 2007 Total Annual
Average
Total Sport Fund 194.7 301.7 329.8 289.6 1,115.8 279.0
Camelot Sales 5,982.3 6,247.2 6,349.5 6,097.8 24,676.8 6,169.2
% Sales to Sport 3.3% 4.8% 5.2% 4.7% 4.5% 4.5%
Camelot Gross Win 2,991.2 3,123.6 3,174.7 3,048.9 12,338.4 3,084.6
% GW to Sport 6.5% 9.7% 10.4% 9.5% 9.0% 9.0%
Sources: Camelot/Sportsbusiness Analysis (2008)
3.57 In relation to the actual funding of sports, the main analysis tables below are relevant, before
examining particular trends/data further:
Graphic 11 -The Leading Sports in terms of All Lottery Funding in the UK 2004 to 2007 Inclusive
Rank Sport All Lottery Funding (€) Percentage of Sport
Awards
1 Swimming 156,906,000 16.5%
2 Football 144,452,000 15.2%
3 Athletics 69,694,000 7.3%
4 Badminton 61,282,000 6.4%
5 Hockey 51,887,000 5.4%
6 Tennis 39,859,000 4.2%
7 Cricket 37,875,000 4.0%
8 Rugby Union 36,190,000 3.8%
9 Rugby League 33,556,000 3.5%
10 Cycling 33,439,000 3.5%
11 Sailing & Yachting 31,737,000 3.3%
12 Rowing 31,195,000 3.3%
13 Netball 27,738,000 2.9%
14 Basketball 24,216,000 2.5%
15 Gymnastics 21,972,000 2.3%
16 Equestrian 15,312,000 1.6%
17 Judo 14,474,000 1.5%
18 Golf 12,171,000 1.3%
19 Canoeing 11,556,000 1.2%
20 Ice/Snow Sport 8,706,000 0.9%
Other Single Sports 89,159,000 9.4%
Single Sports Total 953,376,000 100.0%
Multi/Disability Sport Awards 162,436,000
Total Lottery Funding 1,115,812,000
Source: Lottery Distribution Agencies/Sportsbusiness Analysis (2008)

Page 25 of 71
Graphic 12 - The Leading Sports in terms of ‘Grassroots’ Lottery Funding in the UK 2004 to 2007 Inclusive
Rank Sport ‘Grassroots’ Lottery
Funding (€)
Percentage of Single Sport ‘Grassroots’
Awards
1 Swimming 129,552,000 18.7%
2 Football 128,246,000 18.5%
3 Badminton 51,916,000 7.5%
4 Hockey 44,616,000 6.5%
5 Athletics 37,127,000 5.4%
6 Tennis 34,880,000 5.0%
7 Cricket 31,168,000 4.5%
8 Rugby League 30,533,000 4.4%
9 Rugby Union 28,858,000 4.2%
10 Netball 23,820,000 3.4%
11 Basketball 20,004,000 2.9%
12 Sailing & Yachting 14,567,000 2.1%
13 Gymnastics 13,767,000 2.0%
14 Cycling 11,972,000 1.7%
15 Rowing 10,637,000 1.5%
16 Canoeing 8,722,000 1.3%
17 Golf 8,488,000 1.2%
18 Bowls 8,131,000 1.2%
19 Squash 6,146,000 0.9%
20 Judo 6,111,000 0.9%
Other Single Sports 42,201,000 6.1%
Single Sports Total 691,462,000 100.0%
Multi/Disability Sport Awards 153,021,000
Total Lottery Funding 844,483,000
Source: Lottery Distribution Agencies/Sportsbusiness Analysis (2008)

Page 26 of 71
Graphic 13 - The Leading Sports in terms of ‘Performance’ Lottery Funding in the UK 2004 to 2007 Inclusive
Rank Sport ‘Grassroots’ Lottery
Funding (€)
Percentage of Single Sport ‘Performance’
Awards
1 Athletics 32,566,000 12.4%
2 Swimming 27,354,000 10.4%
3 Cycling 21,467,000 8.2%
4 Rowing 20,558,000 7.8%
5 Sailing & Yachting 17,170,000 6.6%
6 Football 16,205,000 6.2%
7 Equestrian 10,110,000 3.9%
8 Badminton 9,365,000 3.6%
9 Judo 8,363,000 3.2%
10 Gymnastics 8,205,000 3.1%
11 Croquet 7,886,000 3.0%
12 Rugby Union 7,332,000 2.8%
13 Hockey 7,271,000 2.8%
14 Cricket 6,708,000 2.6%
15 Modern Pentathlon 5,380,000 2.1%
16 Tennis 4,979,000 1.9%
17 Basketball 4,212,000 1.6%
18 Triathlon 4,107,000 1.6%
19 Netball 3,917,000 1.5%
20 Ice/Snow Sport 3,825,000 1.5%
Other Single Sports 34,928,000 13.3%
Single Sports Total 261,908,000 100.0%
Multi/Disability Sport Awards 9,415,000
Total Lottery Funding 271,323,000
Source: Lottery Distribution Agencies/Sportsbusiness Analysis (2008)
3.58 If all 57 sports are assessed then 72.5% of funding or €691.5m was focused on ‘grassroots’,
whereas for the multi/disabled sports the level was 94.2% which equated to €153.0m.
3.59 It should be noted that toward the end of the period considered, a greater proportion of funding
was going to performance sport. A number of high spending community facility programmes were
still in full swing in 2004. However, a shift toward performance sport is a trend expected every
four years in the lead up to a summer Olympic Games and as part of a longer-term trend as the
UK gears up to host the games in 2012. Either way we believe that the four year period analysed
provides a fair reflection of the longer term balance in lottery funding between ‘grassroots’ and
performance sport in the UK.

Page 27 of 71
3.60 Swimming has been consistently the highest funded sport in the UK. During the four years
analysed the sport was in receipt of a total of €156.9m in lottery funding or 16.5% of the total
awarded. Not only is swimming a high profile sport in Olympic terms but it also is a strong
participation sport with high facility costs.
3.61 Swimming is followed closely by the UK’s national game, football, at €144.5m with all of the other
sports some way behind - led by athletics with €70.0m, then badminton at €61.2m and hockey at
€51.9m.
3.62 In total the 20 sports whose awards we have highlighted individually account for 90.7% of the
awards to individual sports during the period 2004 to 2007.
3.63 If just ‘grassroots’ funding is considered swimming and football once again came out highest at
€129.6m and €128.2m respectively. In this case, they are followed by badminton at €51.9m and
hockey at €44.6m - with athletics (the funding of which has been more focused on the
performance end of the sport) at €37.1m just ahead of tennis at €34.9m.
3.64 Here the 20 sports highlighted account for 93.9% of the total lottery funding awarded to the
‘grassroots’ level of individual sports between 2004 and 2007.
National Lottery Funding of 13 Leading Sports 2004 to 2007 (‘Top Down’)
3.65 We have conducted a ‘Top Down’ analysis of the lottery funding for thirteen of the leading sports
in the UK. The sports are:
Athletics
Badminton
Cricket
Cycling
Golf
Football
Hockey
Rowing
Rugby League
Ruby Union
Sailing
Swimming
Tennis
3.66 Our analysis concluded that these thirteen sports account for €740.2m or 77.6% of the €953.4m
total lottery funding allocated to individual sports during the period 2004 to 2007.
3.67 The proportion of all funding awarded to this group of sports to ‘grassroots’ was 73.3%. The vast
majority of funding was allocated to programmes or facilities. We have observed a trend of a shift
from the former to the latter during the period concerned. The former accounted for 54% of
funding with 57% or €228.6m of this going to ‘grassroots’ sport during 2004 to 2007.

Page 28 of 71
Graphic 14 - ‘Top Down’ Analysis of Lottery Funding 2004 to 2007 – All Thirteen Sports
Total Lottery Funding (€)
Average Annual Funding
(€)
Percentage of Category
Percentage of Total
People/Programmes Grassroots 228,569,000 57,142,250 57.0% 30.9%
Performance 172,188,000 43,047,000 43.0% 23.3%
Total 400,757,000 100,189,250 100.0% 54.1%
Places/Facilities Grassroots 314,216,000 78,554,000 94.1% 42.4%
Performance 19,776,000 4,944,000 5.9% 2.7%
Total 333,992,000 83,498,000 100.0% 45.1%
Events Grassroots 0 0 0.0% 0.0%
Performance 5,493,000 1,373,250 100.0% 0.7%
Total 5,493,000 1,373,250 100.0% 0.7%
All Grassroots 542,785,000 135,696,250 73.3% 73.3%
Performance 197,457,000 49,364,250 26.7% 26.7%
Total 740,242,000 185,060,500 100.0% 100.0%
Source: Lottery Distribution Agencies/Sportsbusiness Analysis (2008) Note: The above analysis includes the sports of athletics, badminton, cricket, cycling, football, golf, hockey, rowing,
rugby league, rugby union, sailing, swimming and tennis
Graphic 15 - ‘Top Down’ Analysis of Lottery Funding 2004 to 2007 – Nine Olympic Sports Only
Total Lottery Funding (€)
Average Annual Funding
(€)
Percentage of Category
Percentage of Total
People/Programmes
Grassroots 94,849,000 23,712,250 41.2% 19.9%
Performance 135,238,000 33,809,500 58.8% 28.4%
Total 230,087,000 57,521,750 100.0% 48.3%
Places/Facilities
Grassroots 240,418,000 60,104,500 100.0% 50.5%
Performance 0 0 0.0% 0.0%
Total 240,418,000 60,104,500 100.0% 50.5%
Events
Grassroots 0 0 0.0% 0.0%
Performance 5,493,000 1,373,250 100.0% 1.2%
Total 5,493,000 1,373,250 100.0% 1.2%
All
Grassroots 335,268,000 83,817,000 70.4% 70.4%
Performance 140,731,000 35,182,750 29.6% 29.6%
Total 475,998,000 118,999,500 100.0% 100.0%
Source: Lottery Distribution Agencies/Sportsbusiness Analysis (2008) Note: The above analysis includes the sports of athletics, badminton, cycling, football, hockey, rowing, sailing,
swimming and tennis.

Page 29 of 71
Graphic 16 - ‘Top Down’ Analysis of Lottery Funding 2004 to 2007 – Four Non-Olympic Sports Only
Total Lottery Funding (€)
Average Annual Funding
(€)
Percentage of Category
Percentage of Total
People/Programmes
Grassroots 133,720,000 33,430,000 78.4% 50.6%
Performance 36,950,000 9,237,500 21.6% 14.0%
Total 170,670,000 42,667,500 100.0% 64.6%
Places/Facilities
Grassroots 73,798,000 18,449,500 78.9% 27.9%
Performance 19,776,000 4,944,000 21.1% 7.5%
Total 93,574,000 23,393,500 100.0% 35.4%
Events
Grassroots 0 0 n/a 0.0%
Performance 0 0 n/a 0.0%
Total 0 0 n/a 0.0%
All
Grassroots 207,518,000 51,879,500 78.5% 78.5%
Performance 56,726,000 14,181,500 21.5% 21.5%
Total 264,244,000 66,061,000 100.0% 100.0%
Source: Lottery Distribution Agencies/Sportsbusiness Analysis (2008) Note: The above analysis includes the sports of cricket, golf, rugby league and rugby union
Graphic 17 - ‘Top Down’ Analysis of Lottery Funding 2004 to 2007 – Seven Professional Sports Only
Total Lottery Funding (€)
Average Annual Funding
(€)
Percentage of Category
Percentage of Total
People/Programmes
Grassroots 158,246,000 39,561,500 72.1% 46.9%
Performance 61,161,000 15,290,250 27.9% 18.1%
Total 219,407,000 54,851,750 100.0% 65.0%
Places/Facilities
Grassroots 96,123,000 24,030,750 82.9% 28.5%
Performance 19,776,000 4,944,000 17.1% 5.9%
Total 115,899,000 28,974,750 100.0% 34.3%
Events
Grassroots 0 0 0.0% 0.0%
Performance 2,236,000 559,000 100.0% 0.7%
Total 2,236,000 559,000 100.0% 0.7%
All
Grassroots 254,369,000 63,592,250 75.4% 75.4%
Performance 83,172,000 20,793,000 24.6% 24.6%
Total 337,542,000 84,385,500 100.0% 100.0%
Source: Lottery Distribution Agencies/Sportsbusiness Analysis (2008) Note: The above analysis includes the sports of cricket, cycling, football, golf, rugby league, rugby union and tennis

Page 30 of 71
Graphic 18 - ‘Top Down’ Analysis of Lottery Funding 2004 to 2007 – Six Amateur Sports Only
Total Lottery Funding (€)
Average Annual Funding
(€)
Percentage of Category
Percentage of Total
People/Programmes
Grassroots 70,323,000 17,580,750 38.8% 17.5%
Performance 111,027,000 27,756,750 61.2% 27.6%
Total 181,350,000 45,337,500 100.0% 45.0%
Places/Facilities
Grassroots 218,093,000 54,523,250 100.0% 54.2%
Performance 0 0 0.0% 0.0%
Total 218,093,000 54,523,250 100.0% 54.2%
Events
Grassroots 0 0 0.0% 0.0%
Performance 3,257,000 814,250 100.0% 0.8%
Total 3,257,000 814,250 100.0% 0.8%
All
Grassroots 288,416,000 72,104,000 71.6% 71.6%
Performance 114,284,000 28,571,000 28.4% 28.4%
Total 402,700,000 100,675,000 100.0% 100.0%
Source: Lottery Distribution Agencies/Sportsbusiness Analysis (2008) Note: The above analysis includes the sports of athletics, badminton, hockey, rowing, sailing and swimming
Graphic 19 - ‘Top Down’ Analysis of Lottery Funding 2004 to 2007 – All Sports Annual Average
Ath
letics
Bad
min
ton
Cricket
Cyclin
g
Fo
otb
all
Go
lf
Ho
ckey
Ro
win
g
Ru
gb
y Leag
ue
Ru
gb
y Un
ion
Sailin
g
Sw
imm
ing
Ten
nis
All
To
tal Fu
nd
ing
(€)
Grassroots 53.3
% 84.7
% 76.7
% 35.8
% 88.8
% 69.7
% 86.0
% 34.1
% 55.7
% 63.7
% 45.9
% 82.6
% 87.5
% 73.3
% 542.8
Performance 46.7
% 15.3
% 23.3
% 64.2
% 11.2
% 30.3
% 14.0
% 65.9
% 44.3
% 36.3
% 54.1
% 17.4
% 12.5
% 26.7
% 197.5
Total 100% 100% 100% 100% 100% 100% 100% 100% 100% 100% 100% 100% 100% 100% 740.2
Source: Lottery Distribution Agencies/Sportsbusiness Analysis (2008)
3.68 This group of thirteen sports was allocated a total of €334m toward facilities with 94% of this
going to ‘grassroots’. However, it is worth pointing out that this probably underestimates the
actual amount of benefit that performance sport gained from facilities funding during the period.
This is due to the fact that many facilities that are predominantly utilised for ‘grassroots’ activities
are also used by performance athletes at certain times.
3.69 Furthermore, the facility spending pattern probably does not fully reflect a longer term trend as the
development of the English and other Institutes of Sport during 1998 to 2002 meant that this
period saw a greater amount of facility spending geared toward performance sport.
3.70 If we remove the professional sports - football, cricket, golf, rugby league, rugby union and tennis
- from our analysis we see that there is a shift toward a greater proportion of funding being
allocated toward performance. The conclusion here is that where there is a professional system

Page 31 of 71
of leagues or a professional circuit that element of the sport is self funding and indeed is often
organised outside of the governing body.
3.71 Once again the majority of lottery funding in respect of the six amateur sports analysed was
allocated to either programmes or facilities. Of the €181m or 45.0% that was allocated to the
former just 38.8% was targeted at ‘grassroots’, whereas 100% of facilities funding was allocated
to ‘grass roots’ with the reverse being the case in terms of events.
3.72 Our analysis of each sport’s funding and the importance of the commercial betting industry/
National Lottery’s to them has been validated by the annual accounts of the National Governing
Bodies of Sport (NGBs), and followed up with a number of meetings.
An Assessment of the Relative Importance of 13 Sports’ Funding by Source (‘Bottom Up’)
Graphic 20 - ‘Bottom Up’ Analysis of NGB Income 2004 to 2007 – All Thirteen Sports
Income Type Total Income (€) Average Annual
Income (€) Percentage of Total
Lottery Funding 330,564,000 82,641,000 7.9%
Exchequer 99,375,000 24,843,750 2.4%
Self Generated 694,954,000 173,738,500 16.7%
Charitable 41,320,000 10,330,000 1.0%
Non Betting Industry Commercial
306,716,000 76,679,000 7.4%
Media/Broadcast Rights 712,384,000 178,096,000 17.1%
Other Grants 10,250,000 2,562,500 0.2%
Membership 22,478,000 5,619,500 0.5%
Sponsorship 1,705,520,000 426,380,000 41.0%
Events 166,167,000 41,541,750 4.0%
World and European Bodies
17,971,000 4,492,750 0.4%
Other 57,045,000 14,261,250 1.4%
Total 4,164,746,084 1,041,186,000 100.0%
Source: NGBs/Sportsbusiness Analysis (2008) Note: The above analysis includes the sports of athletics, badminton, cricket, cycling, football, golf, hockey, rowing,
rugby league, rugby union, sailing, swimming and tennis

Page 32 of 71
Graphic 21 - ‘Bottom Up’ Analysis of NGB Income 2004 to 2007 – Nine Olympic Sports Only
Income Type Total Income (€) Average Annual
Income (€) Percentage of Total
Lottery Funding 266,752,000 66,688,000 8.0%
Exchequer 80,361,000 20,090,250 2.4%
Self Generated 324,743,000 81,185,750 9.7%
Charitable 16,919,000 4,229,750 0.5%
Non Betting Industry Commercial
295,198,000 73,799,500 8.8%
Media/Broadcast Rights 585,492,000 146,373,000 17.5%
Other Grants 10,250,000 2,562,500 0.3%
Membership 22,478,000 5,619,500 0.7%
Sponsorship 1,621,655,000 405,413,750 48.4%
Events 87,127,000 21,781,750 2.6%
World and European Bodies
236,000 59,000 0.0%
Other 41,903,000 10,475,750 1.2%
Total 3,353,114,000 838,278,500 100.0%
Source: NGBs/Sportsbusiness Analysis (2008) Note: The above analysis includes the sports of athletics, badminton, cycling, football, hockey, rowing, sailing,
swimming and tennis
Graphic 22 - ‘Bottom Up’ Analysis of NGB Income 2004 to 2007 – Four Non-Olympic Sports Only
Income Type Total Income (€) Average Annual
Income (€) Percentage of Total
Lottery Funding 63,812,000 15,953,000 7.9%
Exchequer 19,014,000 4,753,500 2.3%
Self Generated 370,210,000 92,552,500 45.6%
Charitable 24,401,000 6,100,250 3.0%
Non Betting Industry Commercial
11,518,000 2,879,500 1.4%
Media/Broadcast Rights 126,892,000 31,723,000 15.6%
Other Grants 0 0 0.0%
Membership 0 0 0.0%
Sponsorship 83,865,000 20,966,250 10.3%
Events 79,040,000 19,760,000 9.7%
World and European Bodies
17,735,000 4,433,750 2.2%
Other 15,141,000 3,785,250 1.9%
Total 811,628,000 202,907,000 100.0%
Source: NGBs/Sportsbusiness Analysis (2008) Note: The above analysis includes the sports of cricket, golf, rugby league and rugby union
3.73 Our analysis focused on the thirteen sports outlined within the previous section. In total these
sports had a combined income across the UK of €4.2bn during the period 2004 to 2007, or an
average of €1.0bn per annum. The average income per sport per annum over the period was
€80m. It should be noted that income has been consistently on the increase during the period.

Page 33 of 71
3.74 We have determined that the majority of funding paid by the UK’s National Lottery has not been
allocated via the NGBs during the period concerned. However, it should be noted that this
position is gradually changing as programmes become more important that facilities.
Graphic 23 - ‘Bottom Up’ Analysis of NGB Income 2004 to 2007 – Seven Professional Sports Only
Income Type Total Income (€) Average Annual
Income (€) Percentage of Total
Lottery Funding 177,303,000 44,325,750 8.0%
Exchequer 44,330,000 11,082,500 2.0%
Self Generated 663,523,000 165,880,750 29.8%
Charitable 39,416,000 9,854,000 1.8%
Non Betting Industry Commercial
300,773,000 75,193,250 13.5%
Media/Broadcast Rights 692,765,000 173,191,250 31.1%
Other Grants 0 0 0.0%
Membership 3,701,000 925,250 0.2%
Sponsorship 84,541,000 21,135,250 3.8%
Events 151,046,000 37,761,500 6.8%
World and European Bodies
17,735,000 4,433,750 0.8%
Other 49,334,000 12,333,500 2.2%
Total 2,224,467,000 556,116,750 100.0%
Source: NGBs/Sportsbusiness Analysis (2008) Note: The above analysis includes the sports of cricket, cycling, football, golf, rugby league, rugby union and tennis
Graphic 24 - ‘Bottom Up’ Analysis of NGB Income 2004 to 2007 – Six Amateur Sports Only
Income Type Total Income (€) Average Annual
Income (€) Percentage of Total
Lottery Funding 153,262,000 38,315,500 7.9%
Exchequer 55,045,000 13,761,250 2.8%
Self Generated 31,431,000 7,857,750 1.6%
Charitable 1,904,000 476,000 0.1%
Non Betting Industry Commercial
5,944,000 1,486,000 0.3%
Media/Broadcast Rights 19,619,000 4,904,750 1.0%
Other Grants 10,250,000 2,562,500 0.5%
Membership 18,777,000 4,694,250 1.0%
Sponsorship 1,620,979,000 405,244,750 83.5%
Events 15,121,000 3,780,250 0.8%
World and European Bodies
236,000 59,000 0.0%
Other 7,710,000 1,927,500 0.4%
Total 1,940,278,000 485,069,500 100.0%
Source: NGBs/Sportsbusiness Analysis (2008) Note: The above analysis includes the sports of athletics, badminton, hockey, rowing, sailing and swimming
3.75 Across the nine Olympic sports we have identified that sponsorship, media/broadcast rights, self
generated funds and other commercial income are all far more important than the funding
received from the Lottery. During the period analysed sponsorship accounted for 48.4% of the

Page 34 of 71
NGBs’ income, with broadcast rights at 17.5%, self generated funds accounting for 9.7%,
commercial funding at 8.8%, and the National Lottery at 8.0%.
3.76 Given it was expected that all professional sports would be stronger in these areas than the
amateur sports we also present a separate analysis of the latter in Graphic 24 above. This
demonstrates that for the six amateur sports, sponsorship becomes even more significant -
accounting for 83.5% of income, followed by the Lottery at 7.9%, and Exchequer at 2.8%. Other
commercial income just accounted for just 0.3% of income.
3.77 Given that the sport of Athletics benefited from a sponsorship deal of just over €1.25bn during
2007 we believe that this significantly impacted our analysis. Consequently. We ran the analysis
excluding the sport - ie just including cycling, hockey, rowing, sailing and swimming.
3.78 In doing so the results highlight that lottery funding becomes far more important with 21.2% of
funding coming from that source. Sponsorship was still far more significant at 58.2%, followed by
Exchequer funding at 5.6%, self-generated funds at 5.4%, and membership at 3.2%.
Graphic 25 - Summary of the ‘Bottom Up’ Analysis of NGB Average Income 2004 to 2007 – All Thirteen Sports Average Annual Income
Ath
letic
s
Bad
min
ton
Cric
ke
t
Cyclin
g
Fo
otb
all
Go
lf
Ho
cke
y
Ro
win
g
Ru
gb
y
Le
ag
ue
Ru
gb
y U
nio
n
Sailin
g
Sw
imm
ing
Te
nn
is
All
To
tal
Fu
nd
ing
(€)
Lottery Funding 2% 54% 7% 50% 7% 21% 68% 54% 23% 4% 29% 76% 7% 8% 261.7
Exchequer 2% 15% 3% 37% 0% 15% 7% 23% 5% 0% 8% 0% 4% 2% 78.7
Self Generated 0% 8% 71% 1% 9% 53% 13% 6% 0% 33% 32% 0% 68% 17% 550.1
Charitable 0% 0% 7% 0% 0% 5% 0% 3% 0% 0% 0% 0% 5% 1% 32.7
Non Betting Industry
0% 0% 3% 1% 23% 3% 1% 10% 0% 0% 0% 0% 13% 7% 242.8
Media/Broadcast 1% 0% 5% 0% 52% 0% 0% 1% 26% 24% 0% 0% 0% 17% 563.9
Grants 0% 2% 0% 0% 0% 0% 0% 0% 0% 0% 0% 13% 0% 0% 8.1
Membership 0% 4% 0% 9% 0% 0% 0% 0% 0% 0% 23% 5% 0% 1% 17.8
Sponsorship 94% 0% 0% 2% 0% 0% 0% 0% 20% 18% 0% 3% 0% 41% 1,350.1
Events 0% 17% 0% 0% 7% 0% 0% 0% 21% 16% 8% 3% 0% 4% 131.5
World/Euro Bodies
0% 0% 0% 0% 0% 0% 0% 0% 0% 4% 0% 0% 0% 0% 14.2
Other 0% 0% 3% 1% 2% 4% 11% 3% 5% 0% 0% 1% 4% 1% 45.2
Total 100
% 100
% 100
% 100
% 100
% 100
% 100
% 100
% 100
% 99%
100%
100%
100%
100%
3,296.8
Source: NGBs/Sportsbusiness Analysis (2008)
The Commercial Gambling Industry’s Contribution to Sport
3.79 We have undertaken a significant amount of research in order to assess the additional
contribution that the UK licensed commercial gambling operators make to sport, something that
does not currently take place in France. Data was gathered from a variety of UK based current
sports marketing reference journals as well as utilising Deloitte’s „Review of Football Finance‟
(2008), and the Football Association’s „Community Report‟ (2008).

Page 35 of 71
3.80 In addition we have received information direct from six operators as to their spending on sport in
the UK. Five of these contributions were made under NDAs with H2 Gambling Capital; therefore,
we are limited here to report our aggregated assessment of the total value to UK sport from the
commercial betting industry during the period 2004 to 2007. In addition to commercial payments,
an account was taken of donations made to sport out of profits.
Graphic 26 - Sportsbetting and Pools Stakes 2004 to 2007
(€m) 2004 2005 2006 2007 Total Annual
Average
Sportsbetting 14,400.0 14,400.0 16,900.0 19,100.0 64,800.0 16,200.0
Football Pools 142.2 119.1 111.4 102.3 475.1 118.8
Total 14,542.2 14,519.1 17,011.4 19,202.3 65,275.1 16,318.8
Source: HM Revenues and Customs, Company Results, H2 Gambling Capital Analysis (2008)
Graphic 27 - Sportsbetting and Pools Gross Win 2004 to 2007
(€m) 2004 2005 2006 2007 Total Annual
Average
Sportsbetting 1,420.0 1,440.0 1,540.0 1,790.0 6,190.0 1,547.5
Football Pools 55.5 52.3 45.7 41.5 194.9 48.7
Total 1,475.5 1,492.3 1,585.7 1,831.5 6,384.9 1,596.2
Source: HM Revenues and Customs, Company Results, H2 Gambling Capital Analysis (2008)
Graphic 28 - Sportsbetting and Pools Gross Profits Tax Paid 2004 to 2007
(€m) 2004 2005 2006 2007 Total Annual
Average
Sportsbetting 213.0 216.0 231.0 268.5 928.5 232.1
Football Pools 1.5 1.4 1.2 1.2 5.3 1.3
Total 214.5 217.4 232.2 269.7 933.8 233.4
Source: HM Revenues and Customs, Company Results, H2 Gambling Capital Analysis (2008)
3.81 Following our assessment we concluded that the UK commercial bookmaking industry
contributed approximately €159m to sport (non-horseracing and dog racing) during the period
2004 to 2007. This is the equivalent of €40m per annum. However, the majority of this spending
was on football which was in receipt of an estimated €133m over the period, or €33m per annum.
3.82 The items that were included within our assessment of the industry contribution to football
included: betting partnerships, stadium betting deals, online streaming, shirt sponsorship,
advertising, league sponsorship, media streaming, etc. There was no way of assessing the
importance of the commercial betting industry to the organisation of the sport as the vast majority
of funding was targeted at professional teams.
3.83 There is generally no agreed allocation of the monies paid to football; therefore, it ends up in a
club, league or association’s general fund. It is therefore difficult to make an accurate

Page 36 of 71
assessment of the amount of money that reached the grassroots of the game based on the
proportion of spending clubs make on their academies and some of the targeting of the spend
that we were informed about.
3.84 Away from football we concluded that a total of €26m was invested into other UK sports by
commercial bookmakers. Once again the majority of this was targeted at performance and
particularly performance sport upon which UK customers favour to bet. However, it would appear
that a greater proportion of spend found its way to the grassroots as a result of a number of
specific initiatives.
3.85 In total our analysis has led us to conclude that a total of €164m - or an average of approximately
€41m per annum - of commercial bookmaker spend found its way into UK sport (non horseracing
and dog racing). In addition to football, other sports that were regularly mentioned included
boxing, cricket, golf, darts, rugby union, snooker and rugby league. In addition charities such as
SportAid and Cash for Clubs have benefited from bookmakers’ donations as have Team GB and
the British Olympic Appeal.
3.86 It is worth noting that we believe that the UK is a unique case in Europe as so much attention is
focused on a small group of sports, particularly football. Our experience is that interest, and the
resulting betting patterns, are spread across more sports in continental Europe. Therefore, we
would expect, although football would still be in the majority, what we found - that a much greater
proportion of spending would reach other sports.

Page 37 of 71
4. FRANCE – SPORTS FUNDING MODEL
France Structure – Overview
Note: All figures official French Government statistics/Sportsbusiness (2008)
4.1 France was one of the first countries in Europe to provide state funding for sport. Its beginnings
date to President de Gaulle’s Economic Plan of 1958, which made sport the rallying point for the
revival of national pride - introducing policies to increase mass participation as well as developing
excellence. To this day, the organisation and funding of sport in France is still mostly overseen by
the State.
4.2 Since 2004, sport has developed an increasing importance in French society, exemplified by the
introduction of a ‘Sport Code’ that defines public service objectives relating to the organisation
and promotion of physical and sporting activities across France. Although most activity is driven
through state funding, we have categorised 8 main types of stakeholder for the purposes of
clarifying this system below:
Graphic 29 - Main Funders of Sport in France
8. Ménages
Family Spending
7. French Sports Federations
Commercial/Sponsorship Membership/Other
Federations Other/Exceptional
6. Enterprises Professional Sports
Clubs/Teams Commercial Sponsors 5. National Sports
Organisations Commite National Olympique et
Sportif Francais (CNOSF) Institut National du Sport et de l’Education Physique (INSEP)
National Schools du Sport Centre Régional d’Éducation
Populaire et Sportive (CREPS)
4. Education Union Nationale du Sport
Scolaire (UNSS) Union Sportive de
l’Enseignement du Premier degree (USEP)
Union Francaise des Oeuvres Laiques d’Education Physique
(UFOLEP)
3. Lottery – La
Francaise des Jeux Centre National pour le Developement du Sport
(CNDS) MJSVA programmes
2. State – Collective
Territories Regions
Departments Communes
1. State - Ministry
Ministère de la Jeunesse, des Sports et de la Vie Associative (MJSVA)
Ministère de l’Education Nationale (MEN)
€ EUR
to grassroots and
performance sport in France

Page 38 of 71
State - Ministry
4.3 Le Ministère de la Jeunesse, des Sports et de la Vie Associative (MJSVA) is a major frontline
department of the French government, and its missions in the sports domain are centred around
four main Actions:
Action 1: Promotion du Sport pour le plus Grande Nombre („grassroots‟ sport)
Action 2: Développement du Sport de Haut Niveau („performance‟ sport)
Action 3: Prévention par le Sport et Protection des Sportifs (health promotion through sport)
Action 4: Promotion des Métiers du Sport (sports employment)
4.4 The MJSVA currently integrates 89 French Sports Federations with its public service objectives,
and exercises strong control over the way they work, most notably through important direct and
indirect financing. Experts call this “the French Model of Co-operative Management between
Sports and the State” and it promotes continuous dialogue between the Ministry and the French
National Olympic and Sports Committee (Comité National Olympique et Sportif Français) in
particular.
4.5 The State provides assistance to the sports movement principally by granting annual subventions
to the Federations, under the terms of agreements designed to launch or support the four policy
Actions above. By far the greatest priority is Action 2, which attracts some two thirds (66%) of total
funding. The subventions themselves are financed by Exchequer funding (currently €205m pa)
and - ever since the advent of La Francaise des Jeux - have been ‘topped up’ by a subsidy from
the lottery (currently €236m pa) through the separate ‘Centre National pour le Development du
Sport’ (CNDS) (see later). There has been a 23% increase in Ministry funding between 2002-07,
however the overall amount of funding to sport still only represents 0.22% of the French
government’s total budget.
4.6 Of particular note within the French system is the support provided by the MJSVA to human
resources, with the Ministry directly employing - then assigning - some 1,571 sports coaches to the
89 Federations. This personnel assistance has had the dual effect of strengthened the activities of
the Federations, as well as of the Ministry. Technical staff – although often pulled in two directions -
have emerged as vital agents for implementing Ministerial policy in such areas as training and
creation of sports-related jobs, the fight against doping, and encouraging mass participation. They
also play a valuable role in steering and assessing CNDS financial aid within the sports.
4.7 Le Ministère de l’Education Nationale (MEN) is mainly concerned with physical education and
sport at school, but is still an important partner to the MJSVA as a whole. Although it doesn’t fund
sports programmes directly, it does employ nearly 40,000 PE teachers. Physical and sporting
education at secondary school takes up between 2-4 hours every week. Every secondary or
university educational establishment is legally obliged to have a sports federation. This ensures
an appropriate number of Association Sportives (AS) to organise competitions.

Page 39 of 71
4.8 In 2002, the MEN presented a strategy containing the most current plans to ensure the
progression of sport and PE in French schools. The initiatives in this strategy are currently funded
in the order of €2.3bn pa and aim to:
Upgrade teacher training for sport and PE;
Create new impetus for school sport;
Implement a ‘Be Able to Swim’ initiative;
Increase student awareness of Olympic values;
Undertake a new curriculum review from the ages of 14 to 18;
Reform the examination of sport and PE in the Baccalaureate;
Introduce the compulsory study of PE for all teachers during training; and
Improve provision and quality of sports equipment across the nation.
State – Collective Territories
4.9 By far the most unique aspect of the French model is the role given to the local authorities
(€9.1bn spending in 2005 through 40,000 Communes; 100 Departments; and the 22 Regions) in
the development of physical and sporting activities. (Note: Figures for 2006 to be published
imminently).
4.10 Communes in particular have been involved in the explosion of mass sports right from the start
(1958) - notably as the owners of local facilities, running local sports grounds and stadium,
managing them, and partly financing them. The most notable fact here is in relation to French
professional club football, where most stadia remain in the ownership of the Commune in which
the local club plays its home games.
4.11 From starting with building gyms and providing equipment in the 1960s, the Communes have in
many cases evolved into sports facility management companies (the major part of the last
decade’s spending going on renovation, maintenance, and running costs). Communes (or
Mayorial councils) have sports councillors, and according to their population size, offer two main
structures:
The ‘sports service’ – which looks after all sporting resources, and applies sports policy.
(Since 1982, most Departments have also created sports services to manage sports policy
for equipment acquisition, reducing disparities in Commune facilities, or influencing the way
sport works – this has tended to be realised by contract-based assistance, dependant on
statements of objectives with clubs and athletes);
The ‘municipal sports office’ - a consultative and communications body designed to inform
municipalities and support their sports policies - for example, by intervening in the definition
of criteria for granting municipal subsidies.

Page 40 of 71
Lottery – La Francaise des Jeux
4.12 The French National Lottery, La Francaise des Jeux (FDJ), became the third largest in the world
during 2006 as it overtook the UK National Lottery and the Mizuho Bank in Japan. Just
Lottomatica’s Italian operation and Spain’s Loterias y Apuestas Estado achieved higher sales.
FDJ is 72% owned by the French state.
4.13 In addition to traditional lottery games (draw, instant, scratch cards, and numbers) FDJ also has a
monopoly on sportsbetting via the Cote, Match and Loto Foot 7&15 games. During 2006 the
sportsbetting games accounted for €387m of FDJ’s €9.47bn total sales. The same year FDJ’s
total sales via the internet reached €106m.
4.14 During June 2007, the EC issued a reasoned opinion against France in respect of the restriction
of supply of sportsbetting services. Of particular interest to the EC in the French case were the
criminal sanctions that have been threatened or imposed on the CEOs of sportsbetting
companies licensed in other Member States and the impact of legislation on sponsorship
agreements in football, as well as the ban on the Unibet sponsored cycling team participating in
races held on French soil.
4.15 Recently, France’s Finance Minister announced that the nation is likely to open out its betting
market within the next two to three years. Under a regulated market opening, the private
operators would be subject to the same conditions and tax regime as the current national
monopolies. President Sarkozy had referred to this as a possible policy during last year’s election
but at the time stressed a concern that there should be no impact on the level of government
funding generated by the industry.
4.16 The Durieux Report was published during early May which acknowledges that France’s
sportsbetting sector should be opened up but states that “for reasons of public order” only Pari
Mutuel betting on horseracing and sports should initially be allowed. Furthermore all operators
would be required to obtain a French licence regardless of whether they already have one
elsewhere in the EU.
4.17 In September 2008, the first signs of a market opening emerged with the announcement that the
French government was to consider privatising La Francaise des Jeux by selling its stake in the
company.
4.18 In the meantime, lottery funding of French sport is primarily routed via the Centre National pour le
Development du Sport (CNDS) – effectively a ‘stand alone’ funding pot available to Le Ministère
de la Jeunesse, des Sports et de la Vie Associative – which totalled €236m in 2007. Virtually
100% of this funding is allocated to the French Sports Federations, with two-thirds targeted at the
‘performance’ level.

Page 41 of 71
Education
4.19 In addition to the Ministère de l’Education Nationale, three agencies within France dedicate their
work to the development of youth sport and education through sport: Union National du Sport
Scolaire (UNSS); Union Sportive de l’Enseignement du Premier degree (USEP); and Union
Francaise des Oeuvres Laiques d’Education Physique (UFOLEP).
4.20 The UNSS is a government-controlled, centrally organised agency. Its major responsibilities are
to implement a Sport for All (‘Sport pour Tous’) policy, and broaden the participation base by
developing the interests of ‘non-sporting’ pupils. An equal priority is to promote competitive sport,
and specialist coaches operate to develop excellence. Regular Wednesday afternoon sports
fixtures take place and UNSS representation goes up to school international standard. The UNSS
uses community facilities and takes the responsibility for sports provision away from schools.
Time is not lost from study as French children attend school on Saturday mornings.
4.21 Each school has a sports club or ‘Association Sportive‟ (AS), which is affiliated to the UNSS. In
theory, the AS is managed by teachers and pupils, and administration and organisation skills are
learned. PE teachers tend to work alongside coaches. Sporting sections (formerly known as
sports study sections) have a mission to develop excellence. Sections operate within a
conventional school but select children with a high sporting potential. Although the development
of sports talent is a priority, academic progress cannot be compromised. Training schedules are
arranged around timetabled study and specialist coaches work with children. Sections are located
in all regions and, like the UNSS, receive government funding.
4.22 USEP (12,500 federations and 900,000 members) and UFOLEP (10,500 federations and 410,000
members) were established with the purpose of setting up popular and civic forms of practising
sport and physical activities. USEP is a sport federation working in and around primary schools.
UFOLEP is a multisport and sport for all federation. Together, they work to develop the concept of
a ‘human’ sport service. USEP promotes sport to primary school children, whereas UFOLEP
stages around 100 different sports for all activities and competitions per year - 35 of them at the
national level.
4.23 Via USEP, parents can elect to send their children to ‘primary sports schools’ (non-selective
institutions). Gymnastics is a primary focus but volleyball, basketball and handball are also given
priority, indicating a multi-sport approach. Indoor facilities are of a high standard (one school in
Chalon has gymnastic equipment to Olympic standard) and specialist coaches work alongside PE
teachers. Joint provision between schools and the community is a common policy where
equipment and facilities are of a high standard.
National Sports Organisations
4.24 The Comité National Olympique et Sportif Français (CNOSF) is a state-endorsed federation
made up of every sporting Federation, including Olympic and non-Olympic single sports
Federations, and multi-sport Federations. It represents the IOC (International Olympic

Page 42 of 71
Committee) in France, and must therefore respect the conditions of the Olympic Charter. The
CNOSF’s mission is to:
Ensure the rules governing Olympic sports are respected;
Participate in the selection of the French Olympic team and ensure their entry into the
Olympic Games;
Promote sportsmen and women in society;
Help affiliated federations.
4.25 It is responsible for arbitration in conflicts between athletes, clubs, and affiliated Federations, but
not in cases of illegal use of performance enhancing drugs. It brings together 92 Olympic and
non-Olympic Federations, about 175,000 clubs affiliated to these Federations, and 14 million
athletes (20 to 30% practice more than one sport). 1,250,000 are described as active elected
volunteers (Board members) of their clubs.
4.26 The CNOSF was traditionally heavily dependant on the State, particularly financially. In the last
10 years, however, it has greatly developed its range of projects, resources, and
professionalisation. Its c€12m budget today mostly comes from private sources (notably
sponsors) and it employs around 50 salaried staff.
4.27 More centrally, the sports Ministry has supervisory authority over the following institutions: the highly
renowned Institut National du Sport et de l’Éducation Physique (INSEP), located in the Bois de
Vincennes park on the eastern outskirts of Paris; the National Horseback Riding School (École
Nationale d’Équitation) in Saumur; the National Skiing and Mountain Climbing School (École
Nationale de Ski et d’Alpinisme) in Chamonix; and the National Sailing School (École Nationale de
Voile) in Saint-Pierre de Quiberon. Approximately 25% of the 3,000 elite French athletes can be
resident in these institutions at any one time. The remainder attend one of the 22 regional
sporting centres (CREPS).
4.28 Though INSEP operates under the guidance of the Ministry, some autonomy is granted. Its main
functions are:
A multi-sport centre of excellence catering for 25 different sports.
The major sports education centre in France;
Input into policy and funding decisions concerning funding allocations to the French Sports
Federations;
Selection of the sports and 3,000 athletes who qualify for elite status and attend for training;
Ultimately responsible for the performance of French elite sport.
4.29 In collaboration with laboratories across France, INSEP has developed a specialism in sports
science and is currently evolving high level research programmes in biomechanics and
physiology, movement action and performance, sports psychology, computer sciences, and
sociology.

Page 43 of 71
4.30 INSEP also delivers academic and professional training to prevent young athletes being
disadvantaged in the fields of education and employment. While engaged in high level sports
training, a residential athlete may study at a centre for education in Paris. Coaching and study
schedules are adapted and education is financed through public and Federation loans. In addition
to the above, INSEP has a central position in the development of international prestige. The
Institute is popular throughout the world, having a network exchange with 40 different countries,
and although now tired and under re-development, is still respected as an exemplary sporting
centre of excellence.
4.31 Beneath INSEP, the CREPS (Centres Régional d’Éducation Populaire et Sportive) offer training
for sports diplomas and usually cover the region in which they are located (as a rule, one CREPS
per region - total 22). In some cases, however, they may extend their activity to the inter-regional or
even national level.
Enterprises
4.32 The value of commercial sector interest in French sport is similar (in terms of overall spend) when
compared to other major European nations (ie the UK, Italy, Spain, Germany), but tends to
concentrate only on a handful of sports. Ministry estimates value the sponsorship market at
c€1.4bn pa, but that 90% of this sum is allocated to four main sports – football, rugby union,
cycling, and tennis. Many of the other sports suffer by comparison, including the Olympic sports
such as athletics which only achieved €3.8m commercial sponsorship in 2007, compared to its
UK counterpart who drew down big sponsorships from Norwich Union and McCain’s totalling
nearly c€20m in the same year. TV rights (routed through the French Sports Federations below)
are estimated at c€0.8bn pa.
4.33 Interestingly, many of the professional sports (rugby union and cycling excepted) find it difficult to
raise sponsorship to a level where the best French players can afford to stay in France (eg
football, basketball, golf, tennis) and hence the French league system has been labeled by many
commentators as relatively under-exploited.
French Sports Federations
4.34 In France, the organisation and growth of sport relies for the most part on membership
organisations, and chiefly on the French Sports Federations. Operating as non-profit
groups defined originally by the ‘1901 Act’, the Federations are placed under the
supervisory authority of the Sports Minister, except for school and university sports
federations and unions, which are supervised by the Education Minister.
4.35 The Sports Minister may issue a certificate of approval to those sports Federations that
have adopted a charter and disciplinary regulations compliant with model charters and
model regulations defined by a Council of State (Conseil d’État) decree. Federations follow
this procedure to participate in the implementation of a public service mission to promote
and democratise physical and sports activities.

Page 44 of 71
4.36 The Sports Minister delegates a single approved Federation in each sport to organise sports
competitions leading to the award of titles at the international, national, regional or
Département level. The delegated Federation promulgates the technical rules specific to its
discipline as well as the regulations governing the organisation of all events open to its
licensed members. It may set up a professional league to represent, manage, and co-
ordinate the professional sports activities of its affiliated organisations and the societies
they have formed.
4.37 There are 110 Federations in total - 87 single sport (of which 29 are Olympic) and 23 multi-sport
Federations. The approval for delegation in a public service partnership allows Federations to
obtain significant direct or indirect funding from the Ministry. Public funds mainly go to the 29
Olympic Federations, the 55 non-Olympic Federations, and to multi-sport Federations. Of this
number, currently:
10 sports get between €3-4m pa
3 sports get between €2-3m pa
16 sports get between €1-2m pa
The remainder get under €1m pa
4.38 Ministry funding to its 89 Federations is increasingly more important to them than ever, but with a
23% increase in Ministry funding between 2002-07, the French government is becoming ever
more concerned at the level of subvention provided which still varies enormously from sport to
sport - from a continuum that has at the one end football (2% of overall revenue), and at the other
modern pentathlon (98% of overall revenue).
Ménages
4.39 Finally, perhaps the most significant aspect of the French sports funding model that differentiates
it from others is the inclusion by the State of the contribution made by the ‘Ménages’ (or families)
across the country. This contribution – in official Ministry figures („Les Chiffres Cles du Sport‟) –
takes the form of a 1.59% allocation on all household spending on sports related clothing,
footwear, equipment, goods, and local club services. (The equivalent figure of 2.8% in the UK –
see paragraph 3.46 above – is not included in any parallel spending calculations of the UK
government). Out of a total spend in 2005 of €955bn, this is reported as an estimated contribution
to French ‘grassroots’ sport of €15.2bn.
Summary – France Overall Spending Picture
4.40 Assimilating all the figures above (under each of the 8 stakeholder categories) allow us to project
an estimated overall total spend on the French sporting system per year. As for the UK
(paragraph 3.47), spend has been assimilated using an annual average over the study period
(2004-07). Again, for the purposes of the study, the table below provides an important indicator of
the current estimated overall spending picture within French sport:

Page 45 of 71
Graphic 30 - Main Funders of Sport in France – Overall Spending Picture
Category Estimated Direct Spend on Sport (€m, Annual
Average 2004-07)
% of Total
1. State - Ministry €2,376.80 8.26%
Ministère de la Jeunesse, des Sports et de la Vie Associative (MJSVA)
86.80
Ministère de l’Education Nationale (MEN) 2,290.00
2. State – Collective Territories €9,090.00 31.60%
Regions/Departments/Communes 9,090.00
3. Lottery – La Francaise des Jeux €347.00 1.21%
Centre National pour le Development du Sport (CNDS) 213.50
MJSVA 133.50
4. Education €0 0%
Union Nationale du Sport Scolaire (UNSS) within MJSVA
Union Sportive de l’Enseignement du Premier degree (USEP) within MJSVA
Union Francaise des Oeuvres Laiques d’Education Physique (UFOLEP)
within MJSVA
5. National Sports Organisations €12.00 0.04%
Commite National Olympique et Sportif Francais (CNOSF) 12.0
Institut National du Sport et de l’Education Physique (INSEP) within MJSVA
National Schools du Sport within MJSVA
Centre Régional d’Éducation Populaire et Sportive (CREPS) within MJSVA
6. Enterprises €1,400.00 4.87%
Professional Sports Clubs/Teams within Federations
Commercial Sponsors 1,400.0
7. French Sports Federations excludes public financing €364.09 1.27%
Commercial/Sponsorship 281.20
Membership/Other Federations 66.64
Other/Exceptional 16.25
8. Ménages €15,180.00 52.76%
Family Spending 15,180.00
Total Estimated Annual Spend €28,769.89 100% Expressed as Spend per Capita (pop = 63.8m) €450.94
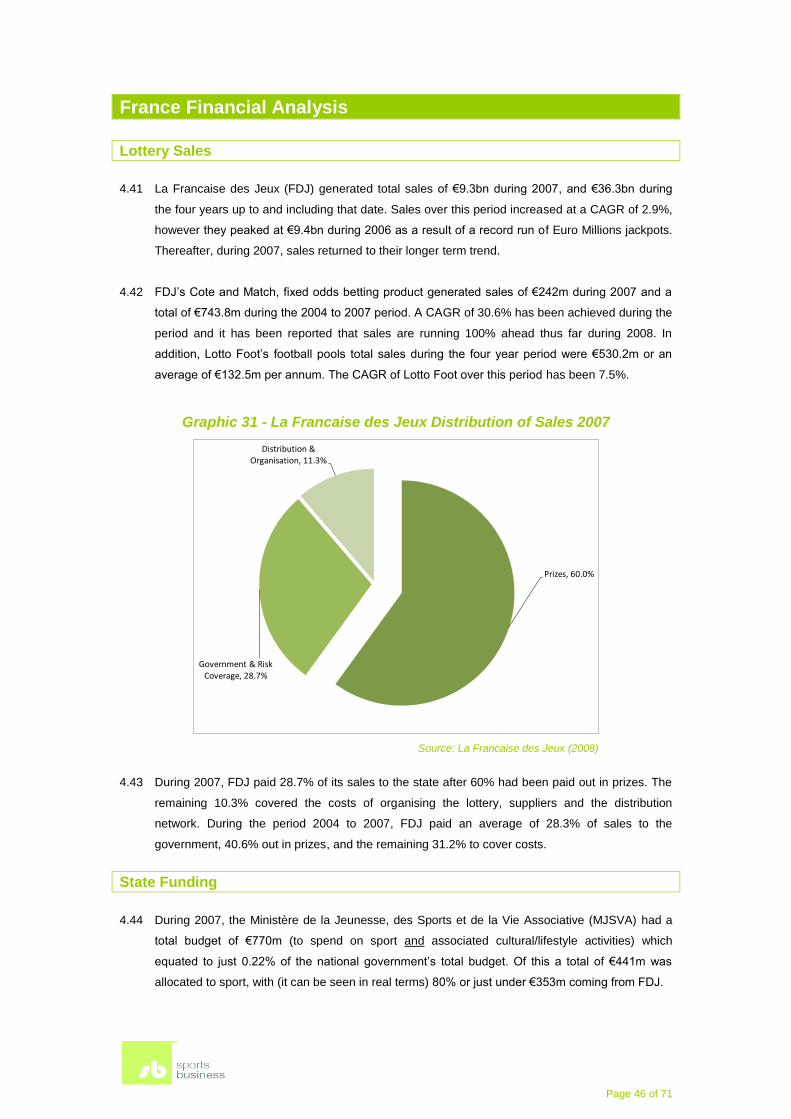
Page 46 of 71
France Financial Analysis
Lottery Sales
4.41 La Francaise des Jeux (FDJ) generated total sales of €9.3bn during 2007, and €36.3bn during
the four years up to and including that date. Sales over this period increased at a CAGR of 2.9%,
however they peaked at €9.4bn during 2006 as a result of a record run of Euro Millions jackpots.
Thereafter, during 2007, sales returned to their longer term trend.
4.42 FDJ’s Cote and Match, fixed odds betting product generated sales of €242m during 2007 and a
total of €743.8m during the 2004 to 2007 period. A CAGR of 30.6% has been achieved during the
period and it has been reported that sales are running 100% ahead thus far during 2008. In
addition, Lotto Foot’s football pools total sales during the four year period were €530.2m or an
average of €132.5m per annum. The CAGR of Lotto Foot over this period has been 7.5%.
Graphic 31 - La Francaise des Jeux Distribution of Sales 2007
Prizes, 60.0%
Government & Risk Coverage, 28.7%
Distribution & Organisation, 11.3%
Source: La Francaise des Jeux (2008)
4.43 During 2007, FDJ paid 28.7% of its sales to the state after 60% had been paid out in prizes. The
remaining 10.3% covered the costs of organising the lottery, suppliers and the distribution
network. During the period 2004 to 2007, FDJ paid an average of 28.3% of sales to the
government, 40.6% out in prizes, and the remaining 31.2% to cover costs.
State Funding
4.44 During 2007, the Ministère de la Jeunesse, des Sports et de la Vie Associative (MJSVA) had a
total budget of €770m (to spend on sport and associated cultural/lifestyle activities) which
equated to just 0.22% of the national government’s total budget. Of this a total of €441m was
allocated to sport, with (it can be seen in real terms) 80% or just under €353m coming from FDJ.

Page 47 of 71
4.45 The €441m was allocated to sport via two pots. The Ministry’s own programme for sport actually
had a budget of €205m and CNDS (the lottery ‘pot’) had one of €236m. However, despite the two
separate routes we have established that the Ministry controls all of the spending.
4.46 In total during the four year period, MJSVA figures show that the French national state has paid
€1.7bn to sport at an average of €433.8m per annum. Of this amount 44.3% has been directed
via CNDS with the remaining €967m being channelled via the Ministry’s programmes.
Graphic 32 - National State Financing of Sport 2004 to 2007
(€m) 2004 2005 2006 2007 Total Annual
Average
Programmes 175.7 187.4 200.0 205.0 768.1 192.0
CNDS 248.0 270.0 213.0 236.0 967.0 241.8
Total 423.7 457.4 413.0 441.0 1,735.1 433.8
Sources: MJSVA/ Sportsbusiness Analysis (2008)
4.47 FDJ’s actual contribution to sport over the period 2004 to 2007, however, has equated to 3.8% of
their sales or 9.4% of their gross win (sales less prizes paid). It appears as though sport’s relative
importance as a recipient of money in France has been declining. By 2007, 13.2% of the funds
transferred to the government were allocated to sport as opposed to 14.6% at the beginning of
the period and an average of 13.5% over the period as a whole.
Graphic 33 - The Contribution of La Francaise des Jeux to the Financing of Sport 2004 to 2007
(€m) 2004 2005 2006 2007 Total Annual
Average
Programmes 98.9 116.0 160.4 158.8 534.1 133.5
CNDS 240.0 250.0 170.0 194.0 854.0 213.5
Total 338.9 366.0 330.4 352.8 1,388.1 347.0
FDJ Sales 8,552.8 8,926.0 9,472.5 9,306.0 36,257.3 9,064.3
% Sales to Sport 4.0% 4.1% 3.5% 3.8% 3.8% 3.8%
FDJ Gross Win 3,426.4 3,619.4 3,863.6 3,799.1 14,708.6 3,677.1
% GW to Sport 9.9% 10.1% 8.6% 9.3% 9.4% 9.4%
Sources: Francaise des Jeux/Sportsbusiness Analysis (2008)
4.48 During 2007 the majority of the French national state funding was allocated to grassroots sport at
€230m or 52%. A further 40% was allocated to performance sport, with the balance going to
education and health. Over the four year period 2004 to 2007 the French national state budget for
grassroots sport was €909m or an average of €227m per annum. This represented an average of
just over 52% for grassroots sport with a further 7% or so being allocated via health and
education.
4.49 The largest allocation of state funding to an Olympic sport during 2007 was the €143.4m awarded
to football, with the best funded non-Olympic sport being rugby union at €82.3m. The sports that

Page 48 of 71
received the least were pentathlon at €849k in the Olympic category and javelot (note: not javelin)
at €58.5k amongst the non-Olympic sports.
4.50 There are a total of 89 federations of sport that are recognised by the State in France. During
2007 of the total national budget of €441m, €90.3m or 20.5% was allocated via the federations of
sport, with approximately two thirds of this amount having been spent on performance sport.
Amongst the 82 federations that were awarded some state funding during 2007, the average
award was €1.1m with the Federation Francaise de Football receiving by far the largest award at
€28.5m.
4.51 The French national system for the funding of sport is very much focused on the direct
employment of individuals. A total of 7,292 staff are directly employed via the national state
budget. Of these 1,571 coaches whose combined cost during 2007 was approximately €99.0m.
The remaining national state funding is distributed between leagues, clubs, staff, etc.
Graphic 34 - Allocation of National State Funding of Sport 2007
Associations21%
Coaches22%
Leagues6%
Communes/ Departments
7%
Clubs15%
Other29%
Source: Francaise des Jeux/MJSVA (2008)
Graphic 35 - National State Financing of Sport by Level 2004 to 2007
(€m) 2004 2005 2006 2007 Total Annual
Average
High Level 166 169 185 176 697 174.2
Development/Grassroots 227 257 195 230 909 227.3
Health 15 15 15 15 60 15.0
Education 15 16 18 20 69 17.3
Total 424 457 413 441 1,735 433.8
Sources: MJSVA/Sportsbusiness Analysis (2008)

Page 49 of 71
Graphic 36 - National State Funding of Federations 2004 to 2007
(€m) 2004 2005 2006 2007 Total Annual
Average
Olympic Sports 63.2 64.1 68.1 69.3 264.7 66.2
Non-Olympic Sports 18.2 19.0 20.2 21.0 78.4 19.6
Total 81.4 83.1 88.3 90.3 343.1 85.8
Allocated for Elite All Sports 56.0 57.0 59.9 60.9 233.8 58.5
% Federations for Elite 68.8% 68.6% 67.8% 67.4% 68.1% 68.1%
Allocated for Elite Olympic Sports 47.3 47.7 49.9 51.5 196.4 49.1
% Federations for Elite 74.8% 74.4% 73.3% 74.3% 74.2% 74.2%
Allocated for Elite Non-Olympic Sports
8.7 9.3 10 9.4 37.4 9.4
% Federations for Elite 47.8% 48.9% 49.5% 44.8% 47.7% 47.7%
Sources: MJSVA/Sportsbusiness Analysis (2008)
4.52 Of the €90.3m of state funding that was allocated via the federations of sport, €69.3m was
distributed amongst the Olympic sports with the remaining €21.0m via the remainder. During the
period 2004 to 2007 Olympic federations were awarded a total of €264.7m of state funding or an
average of €66.2m per annum. Non-Olympic sports received a total of €78.4m of funding, the
equivalent of an average of €19.6m per annum.
4.53 Olympic sports have had a significantly higher proportion of their funding allocated to
performance sport compared to their non-Olympic counterparts. During 2004 to 2007 the average
allocation of funding toward performance across all federations was 68.1%. However, the figure
for Olympic sports was 74.2% as opposed to 47.7% for the remainder.
4.54 Football leads the way by some considerable margin in terms of the public funding in France with
the Fédération Française de Football having received an average €26.7m per annum in funding
from the Ministry during the period 2004 to 2007. Tennis averaged €6.2m with athletics at €4.3m
and swimming at €3.5m.
French Government Funding by Type for 9 Leading Sports 2004 to 2007 (‘Top Down’)
4.55 We have conducted a ‘Top Down’ analysis of the lottery funding for nine of the leading sports in
France. Those included within our analysis were:
Athletics
Basketball
Cycling
Football
Rowing
Ruby Union
Swimming
Table Tennis
Tennis

Page 50 of 71
4.56 In addition to the above group we visited the Federation Francaise de Golf during one of our trips
to Paris. Following further email and telephone correspondence, however, the Federation has not
provided us with any follow up financial information for the study.
Graphic 37 - Olympic/Non Olympic Federation Funding 2004 to 2007
(€m) 2004 2005 2006 2007 Total Annual
Average
Olympic Sports 63.2 64.1 68.1 69.3 264.7 66.2
Non-Olympic Sports
18.2 19.0 20.2 21.0 78.4 19.6
Total 81.4 83.1 88.3 90.3 343.1 85.8
Sources: MJSVA/Francaise des Jeux/Federations of Sport/Sportsbusiness Analysis (2008)
Graphic 38 - A Selection of the Best Funded French Sports Federations 2004 to 2007
(€) Total Annual Average % of Total Federation
Funding
Athletics 17,112,000 4,278,000 5.0%
Basketball 10,646,000 2,661,500 3.1%
Cycling 13,926,000 3,481,500 4.1%
Football 106,800,000 26,700,000 31.1%
Rowing 11,385,000 2,846,250 3.3%
Rugby 8,847,000 2,211,750 2.6%
Swimming 14,181,000 3,545,250 4.1%
Table Tennis 6,269,000 1,567,250 1.8%
Tennis 24,852,000 6,213,000 7.2%
Total 214,018,000 53,504,500 62.4%
Sources: MJSVA/Francaise des Jeux/Federations of Sport/Sportsbusiness Analysis (2008)
4.57 Between 2004 and 2007 the nine sports for which financial data was analysed accounted for
€214.0m or 62.4% of the total amount of national state funding for sport allocated via the
federations of sport. Of the Olympic sports our group of eight accounted for 77.5% of the total
ministry financing in this area. The only non-Olympic sport considered within the study was rugby
union which accounted for 11.3% of the total ministry funding in this area between 2004 and
2007.
4.58 Of the total funding analysed exactly two thirds was allocated to performance. If just the eight
Olympic sports are considered 67.5% of the total of €205.2m funding was allocated to
performance. The difference between the proportion of funding that is allocated to performance
sport varies fairly insignificantly between amateur and professional sports. Of the former 68.3%
was allocated to performance as opposed to 66.2% in the case of the latter.

Page 51 of 71
Graphic 39 - ‘Top Down’ Analysis of Government Funding 2004 to 2007 – All Nine Sports
Ministry/CNDS
Funding (€)
Average Annual Ministry/CNDS
Funding (€) Percentage
Grassroots 71,374,000 17,843,500 33.3%
Performance 142,643,000 35,660,750 66.7%
Total 214,017,000 53,504,250 100.0%
Source: Federations of Sport/Sportsbusiness Analysis (2008) Note: The above analysis includes the sports of athletics, basketball, cycling, football, rowing, rugby union,
swimming, table tennis and tennis
Graphic 40 - ‘Top Down’ Analysis of Government Funding 2004 to 2007 – Eight Olympic Sports Only
Ministry/CNDS
Funding (€)
Average Annual Ministry/CNDS
Funding (€) Percentage
Grassroots 66,735,776 16,683,944 32.5%
Performance 138,435,068 34,608,767 67.5%
Total 205,170,844 51,292,711 100.0%
Source: Federations of Sport/Sportsbusiness Analysis (2008) Note: The above analysis includes the sports of athletics, basketball, cycling, football, rowing, swimming, table tennis
and tennis
Graphic 41 - ‘Top Down’ Analysis of Government Funding 2004 to 2007 – One Non-Olympic Sport Only
Ministry/CNDS
Funding (€)
Average Annual Ministry/CNDS
Funding (€) Percentage
Grassroots 4,638,224 1,159,556 52.4%
Performance 4,207,932 1,051,983 47.6%
Total 8,846,156 2,211,539 100.0%
Source: Federations of Sport/Sportsbusiness Analysis (2008) Note: The above analysis includes the sport of rugby union
Graphic 42 - ‘Top Down’ Analysis of Government Funding 2004 to 2007 – Five Professional Sports Only
Ministry/CNDS
Funding (€)
Average Annual Ministry/CNDS
Funding (€) Percentage
Grassroots 55,848,611 13,962,153 33.8%
Performance 109,221,642 27,305,410 66.2%
Total 165,070,253 41,267,563 100.0%
Source: Federations of Sport/Sportsbusiness Analysis (2008) Note: The above analysis includes the sports of basketball, cycling, football, rugby union and tennis

Page 52 of 71
Graphic 43 - ‘Top Down’ Analysis of Government Funding 2004 to 2007 – Four Amateur Sports Only
Ministry/CNDS
Funding (€)
Average Annual Ministry/CNDS
Funding (€) Percentage
Grassroots 15,525,389 3,881,347 31.7%
Performance 33,421,358 8,355,340 68.3%
Total 48,946,747 12,236,687 100.0%
Source: Federations of Sport/Sportsbusiness Analysis (2008) Note: The above analysis includes the sports of athletics, rowing, swimming and table tennis
French Federations Assessment of Income by Type for 9 Leading Sports 2004 to 2007 (‘Bottom Up’)
4.59 Across the nine sports analysed the total federations’ income generated during 2004 to 2007 was
€1.67bn or an average of €417.5m per annum. This equates to an average of €46m per
federation per annum but is obviously skewed to some extent by the amount of commercial
funding that sports likes of football and tennis generate. According to the ministry as much as
80% of the €188m in commercial funding generated by the Olympic sports during 2007. In the
same year the corresponding level of commercial funding generated by non-Olympic sports was
€52m.
4.60 Across the nine sports analysed 67.4% of income was sourced from commercial activities such
as TV rights, sponsorship, advertising etc. This equated to an annual average of €281m across
the group or €31.2m per sport. Membership/other federation activities was the second most
significant category at 16% or €7.4m per sport per annum across the period considered. Public
funding was less significant at 12.8% or an average of €5.9m per sport per annum. As FDJ
account for 80% of Ministry funding they provided an average of roughly €4.7m per annum of
funding across the nine sports analysed.
4.61 If just the eight Olympic sports are considered there was a total of €1.34bn over the four year
period which equates to an average of €41.9m per sport per annum. This compares to a
corresponding figure of €20.6m per annum for rugby union the only non-Olympic sport considered
in France.
4.62 Of the Olympic sports 61.2% of their funding or an average of €25.7m per annum was generated
via commercial sources, this was followed by membership/other federation activities at 18.9% or
an average of €15.8m per annum. Public funding was slightly more significant at 15.3% or an
average of €6.4m per annum.

Page 53 of 71
Graphic 44 - ‘Bottom Up’ Analysis of Federation Income 2004 to 2007 – All Nine Sports
Income Type Total Income
(€) Average Annual
Income (€) Percentage
Public Funding 213,415,085 53,353,771 12.8%
Commercial/Sponsorship 1,124,805,260 281,201,315 67.4%
Membership/Other Federation 266,594,016 66,648,504 16.0%
Other/Exceptional 65,005,251 16,251,313 3.9%
Total 1,669,819,612 417,454,903 100.0%
Source: Federations of Sport/Sportsbusiness Analysis (2008) Note: The above analysis includes the sports of athletics, basketball, cycling, football, rowing, rugby union,
swimming, table tennis and tennis.
Graphic 45 - ‘Bottom Up’ Analysis of Federation Income 2004 to 2007 – Eight Olympic Sports Only
Income Type Total Income
(€) Average Annual
Income (€) Percentage
Public Funding 204,568,511 51,142,128 15.3%
Commercial/Sponsorship 820,901,400 205,225,350 61.2%
Membership/Other Federation 253,023,920 63,255,980 18.9%
Other/Exceptional 61,920,023 15,480,006 4.6%
Total 1,340,413,854 335,103,464 100.0%
Source: Federations of Sport/Sportsbusiness Analysis (2008) Note: The above analysis includes the sports of athletics, basketball, cycling, football, rowing, swimming, table tennis
and tennis
Graphic 46 - ‘Bottom Up’ Analysis of Federation Income 2004 to 2007 – One Non-Olympic Sport Only
Income Type Total Income
(€) Average Annual
Income (€) Percentage
Public Funding 8,846,574 2,211,644 2.7%
Commercial/Sponsorship 303,903,860 75,975,965 92.3%
Membership/Other Federation 13,570,096 3,392,524 4.1%
Other/Exceptional 3,085,228 771,307 0.9%
Total 329,405,758 82,351,440 100.0%
Source: Federations of Sport/Sportsbusiness Analysis (2008) Note: The above analysis includes the sport rugby union
Graphic 47 - ‘Bottom Up’ Analysis of Federation Income 2004 to 2007 – Five Professional Sports Only
Income Type Total Income (€) Average Annual
Income (€) Percentage
Public Funding 165,084,068 41,271,017 10.8%
Commercial/Sponsorship 1,087,859,506 271,964,877 71.2%
Membership/Other Federation 212,894,713 53,223,678 13.9%
Other/Exceptional 61,410,125 15,352,531 4.0%
Total 1,527,248,412 381,812,103 100.0%
Source: Federations of Sport/Sportsbusiness Analysis (2008) Note: The above analysis includes the sports of basketball, cycling, football, rugby union and tennis
4.63 Moving on to professional sports the five federations their combined budget over the four years
analysed was €1.53bn which equates to an average of €76.4m per federation per annum. As
would be expected, commercial funding accounted for a much greater proportion of their income
at 71.2% or an average of €54.4m per sport per annum. Members/other federation income

Page 54 of 71
represented 13.9% or €3.1m per federation per annum with ministry funding coming in at 10.8%
or €8.3m per annum.
Graphic 48 - ‘Bottom Up’ Analysis of Federation Income 2004 to 2007 – Four Amateur Sports Only
Income Type Total Income (€)
Average Annual Income (€)
Percentage
Public Funding 48,331,017 12,082,754 33.9%
Commercial/Sponsorship 36,945,754 9,236,439 25.9%
Membership/Other Federation 53,699,303 13,424,826 37.7%
Other/Exceptional 3,595,126 898,782 2.5%
Total 142,571,200 35,642,800 100.0%
Source: Federations of Sport/Sportsbusiness Analysis (2008) Note: The above analysis includes the sports of athletics, rowing, swimming and table tennis
4.64 In the case of amateur sports the four federations considered generated total income of €142.6m
between them during the period 2004 to 2007. This represented an average of €8.9m per
federation per annum or the equivalent of just 11.6% of the corresponding figure for the
professional sports considered.
4.65 Across the amateur sports we analysed 37.7%, or an average of €3.4m per sport per annum, of
income was generated from commercial sources. In comparison ministry funding totalled
represented 33.9% or an average of €3.0m each per annum. Membership/other federation
funding totalled €36.9m during the period or an average of €2.3m per federation per annum.
Graphic 49 - ‘Bottom Up’ Analysis of Federation Income 2004 to 2007 – All Sports Annual Average
Ath
letic
s
Bask
etb
all
Cyclin
g
Fo
otb
all
Ro
win
g
Ru
gb
y U
nio
n
Sw
imm
ing
Ta
ble
Ten
nis
Te
nn
is
All
To
tal
Fu
nd
ing
(€)
Public Funding 28.1% 13.6% 23.8% 21.2% 47.4% 2.7% 38.5% 27.1% 4.5% 12.8% 213.4
Commercial/Sponsorship 31.2% 47.0% 24.7% 68.1% 20.4% 92.3% 12.0% 41.4% 70.0% 67.4% 1,124.8
Membership/Other Federation 39.9% 35.4% 51.6% 8.4% 22.3% 4.1% 47.7% 31.2% 17.8% 16.0% 266.6
Other/Exceptional 0.8% 4.0% 0.0% 2.3% 9.9% 0.9% 1.8% 0.3% 7.8% 3.9% 65.0
Total 100.0
% 100.0
% 100.0
% 100.0
% 100.0
% 100.0
% 100.0
% 100.0
% 100.0
% 100.0
% 1,669.8
Source: Federations of Sport/Sportsbusiness Analysis (2008)

Page 55 of 71
5. FRANCE AND UK – SPORTS FUNDING COMPARISON
5.1 Between 2004 and 2007 the average annual sales of FDJ were €9.06bn compared to the
€6.17bn of Camelot in the UK. However, once sportsbetting is stripped out from the French
number we are left with €8.75bn and if ‘Rapido’ - a number draw game mostly played in bars is
also excluded - the average was €6.30bn which is a much more comparable figure. There is no
similar high frequency game like ‘Rapido’ available in the UK. In fact given that there are no
gaming machines permitted outside of French casinos this product to some extent fills the void of
this market.
5.2 In France headline FDJ sales per head were an average of €144 per annum between 2004 and
2007, but once sportsbetting, pools and ‘Rapido’ are discounted the average for the typical draw
and scratch games available in France was €104. In the UK the average spend per head on the
National Lottery during the four year period concerned was just under €102.
Graphic 50 - Lottery Sales and Percentage to Sport 2004 to 2007
2004 2005 2006 2007 Total Average
Total Lottery Sales France (€m)
8,552.8 8,926.0 9,472.5 9,306.0 36,257.3 9,064.3
Less Sportsbetting/Pools (€m)
8,331.7 8,643.0 9,084.1 8,924.5 34,983.3 8,745.8
Less ‘Rapido’ (€m) 6,285.2 6,557.0 6,933.7 6,753.2 26,529.1 6,632.3
Total Lottery Sales UK (€m) 5,982.3 6,247.2 6,349.5 6,097.8 24,676.8 6,169.2
% Lottery Sales France 4.0% 4.1% 3.5% 3.8% 3.8% 3.8%
% Lottery Sales UK 3.3% 4.8% 5.2% 4.7% 4.5% 4.5%
Source: Francaise des Jeux/MJSVA/Camelot/Department of Culture Media and Sport/Sportsbusiness Analysis (2008)
5.3 If the total value of the sportsbetting, lottery and pools sectors are considered it is clear that at a
sales or stakes level the UK far outstrips France at an average of €22.49bn to €9.06bn. However,
given the much lower margins across the UK’s sportsbetting industry at the gross win level the
numbers are much closer at €4.68bn to €3.68bn. Once again this probably reduces the gap given
the existence of ‘Rapido‘ in France but is explained by the availability of a good value commercial
sportsbetting market in the UK.
Graphic 51 - Lottery Funding of Sport 2004 to 2007
2004 2005 2006 2007 Total Average
Total France (€m) 338.9 366.0 330.4 352.8 1,388.1 347.0
Total UK (€m) 194.7 301.7 329.8 289.6 1,115.8 279.0
Per Head France (€) 4.92 5.41 5.81 5.21 21.35 5.53
Per Head UK (€) 3.22 4.98 5.43 4.76 18.39 4.60
Source: Francaise des Jeux/MJSVA/Camelot/Department of Culture Media and Sport/Sportsbusiness Analysis (2008)

Page 56 of 71
Graphic 52 - Lottery Gross Win and Percentage to Sport 2004 to 2007
2004 2005 2006 2007 Total Average
Total Lottery Win France (€m)
3,426.4 3,619.4 3,863.6 3,799.1 14,708.6 3,677.1
Less Sportsbetting/Pools (€m)
3,352.8 3,534.5 3,747.1 3,676.2 14,310.6 3,577.6
Less ‘Rapido’ (€m) 2,697.8 2,836.1 3,027.2 2,958.7 11,519.9 2,880.0
Total Lottery Win UK (€m) 2,991.2 3,123.6 3,174.7 3,048.9 12,338.4 3,084.6
% Lottery Win France 9.9% 10.1% 8.6% 9.3% 9.4% 9.4%
% Lottery Win UK 6.5% 9.7% 10.4% 9.5% 9.0% 9.0%
Source: Francaise des Jeux/MJSVACamelot/Department of Culture Media and Sport/Sportsbusiness Analysis (2008)
Graphic 53 - Total Paid to the Government Sportsbetting, Lottery and Football Pools 2004 to 2007
2004 2005 2006 2007 Total Average
Sportsbetting 213.0 216.0 231.0 268.5 928.5 232.1
Football Pools 1.5 1.4 1.2 1.2 5.3 1.3
Lottery Games 2,392.9 2,498.9 2,539.8 2,439.1 9,870.7 2,467.7
Total UK 2,607.4 2,716.3 2,772.0 2,708.8 10,804.5 2,701.1
Sportsbetting 29.5 41.7 70.7 69.4 211.4 52.9
Football Pools 30.6 38.6 40.8 40.1 150.1 37.5
Lottery Games 2,266.2 2,454.6 2,607.1 2,561.3 9,889.3 2,472.3
Total France 2,326.4 2,535.0 2,718.6 2,670.8 10,250.8 2,562.7
Source: Francaise des Jeux/Camelot/HM Revenues and Customs/Company Reports/H2 Gambling Capital (2008)
5.4 In total the UK’s sportsbetting, lottery and pools sectors paid an average of €2.70bn per annum
as tax or good causes between 2004 and 2007 whereas in France the government received
€3.68bn.
5.5 Of total lottery sales, 3.8% was allocated to sport by the French government during the period
concerned whereas the corresponding figure in the UK was 4.5%. Both figures appear to have
been slightly volatile during the period though in the UK’s case, the 2007 figure is 36.4% higher
during the final year as the first in comparison to France where the final year’s share is 5% lower
than in 2004.
5.6 In France, FDJ contributed just under €353m to sport during 2007 as opposed to the €290m
contributed in the UK. Over the complete four year period the total for France was €1.39bn or an
annual average of €347m compared to corresponding figures of €1.12bn and €279.0m in the UK.
Overall this represented an average annual contribution per head in France of €5.53 as opposed
to €4.60 in the UK. It should be noted that if sportsbetting and the pools are excluded the French
figure becomes €5.15 and if the contribution made by ‘Rapido’ is also excluded it is €3.91 per
head.
5.7 In terms of gross win (stakes less prizes) at the headline level, FDJ has achieved an average of
€3.68bn during the period 2004 to 2007 as opposed to the National Lottery’s €3.08bn. However,

Page 57 of 71
the former drops to €3.58bn and €2.88bn when sportsbetting/pools and then ‘Rapido’ are
discounted. We consider the gross win metric which better reflects the lotteries’ ability to pay tax
etc. During the four year period concerned, FDJ paid an average of 9.4% of its gross win to sport
whereas in the UK the figure was slightly less at 9.0%.
5.8 In terms of our ‘top down’ approach we found that an average of €4.8m per annum in lottery
funding was received by each of the nine federations for which analysis was undertaken with
33.3% of this being allocated for grassroots sport. UK NGBs benefited by a higher amount at
€6.4m each with a higher proportion, 56.3%, being allocated to grassroots.
5.9 If just the Olympic sports are considered the average lottery funding was €5.1m per annum in
France as opposed to €7.4m in the UK. For non-Olympic sports the corresponding figures were
found to be €1.8m in France and €4.0m in the UK. In terms of the allocation to grassroots for
France we found the average to be 32.5% for Olympic and 52.4% for non-Olympic sports
compared to 52.9% and 70.6% respectively in the UK. It should be noted that in the case of
France that rugby union was the only non-Olympic sport considered which makes the analysis
unrepresentative of the sector as a whole.
5.10 Turning to professional sports in France the average level of annual lottery funding per federation
was €6.6m as opposed to €6.3m in the UK and the percentages of these allocated to grassroots
sport were 33.8% and 70% respectively. In the case of amateur sports the average annual
budgets per federation were €2.4m in France and €6.4m in the UK. Of these 31.7% was allocated
to grassroots in France as opposed to 40.4% in the UK.
Graphic 54 - ‘Top Down’ Analysis of Lottery Funding of Federation/NGB Income 2004 to 2007 – All Sports Annual Average per Sport
France UK
(€) % (€) %
Grassroots 1.6 33.3% 3.6 56.3%
Performance 3.2 66.7% 2.8 43.7%
Total 4.8 100.0% 6.4 100.0%
Source: French Federations of Sport/UK NGBs/Sportsbusiness Analysis (2008) Note: The above analysis includes the sports of athletics, basketball, cycling, football, rowing, rugby union, swimming,
table tennis and tennis in France and athletics, badminton, cricket, cycling, football, golf, hockey, rowing, rugby league, rugby union, sailing, swimming and tennis in the UK

Page 58 of 71
Graphic 55 - ‘Top Down’ Analysis of Lottery Funding of Federation/NGB Income 2004 to 2007 – Olympic Sports Annual Average per Sport
France UK
(€) % (€) %
Grassroots 1.7 32.5% 3.9 52.9%
Performance 3.5 67.5% 3.5 47.1%
Total 5.1 100.0% 7.4 100.0%
Source: French Federations of Sport/UK NGBs/Sportsbusiness Analysis (2008) Note: The above analysis includes the sports of athletics, basketball, cycling, football, rowing, swimming, table tennis and
tennis in France and athletics, badminton, cycling, football, hockey, rowing, sailing, swimming and tennis in the UK
Graphic 56 - ‘Top Down’ Analysis of the Profile of Federation/NGB Income 2004 to 2007 – Non-Olympic Sports Annual Average per Sport
France UK
(€) % (€) %
Grassroots 0.9 52.4% 2.8 70.6%
Performance 0.8 47.6% 1.2 29.4%
Total 1.8 100.0% 4.0 100.0%
Source: French Federations of Sport/UK NGBs/Sportsbusiness Analysis (2008) Note: The above analysis includes the sport of rugby union in France and cricket, golf, rugby league and rugby union in
the UK
Graphic 57 - ‘Top Down’ Analysis of Lottery Funding of Federation/NGB Income 2004 to 2007 – Professional Sports Annual Average per Sport
France UK
(€) % (€) %
Grassroots 2.2 33.8% 4.4 70.0%
Performance 4.4 66.2% 1.9 30.0%
Total 6.6 100.0% 6.3 100.0%
Source: French Federations of Sport/UK NGBs/Sportsbusiness Analysis (2008) Note: The above analysis includes the sports of basketball, cycling, football, rugby union and tennis in France and cricket,
cycling, football, golf, rugby league, rugby union and tennis in the UK
Graphic 58 - ‘Top Down’ Analysis of Lottery Funding of Federation/NGB Income 2004 to 2007 – Amateur Sports Annual Average per Sport
France UK
(€) % (€) %
Grassroots 0.8 31.7% 2.6 40.4%
Performance 1.7 68.3% 3.8 59.6%
Total 2.4 100.0% 6.4 100.0%
Source: French Federations of Sport/UK NGBs/Sportsbusiness Analysis (2008) Note: The above analysis includes the sports of athletics, rowing, swimming and table tennis and in France and
athletics, badminton, hockey, rowing, sailing and swimming in the UK

Page 59 of 71
5.11 From the point of view of our ‘bottom up’ analysis of Federations/NGBs’ income we established
that across all of the sports considered in the two countries that the average annual budget per
organisation was €46.4m in France in comparison to €80.1m in the UK. Commercial funding
represented 67.4% in France and 65.4% in the UK. Self generated income accounted for 16.0%
in France and 22.9% in the UK. Lottery funding accounted for 10.2% in France as opposed to
7.9% in the UK and other central government funding was fairly similar in importance at 2.6% in
France and 2.4% in the UK.
5.12 It would appear that the UK’s Olympic sports are much better off financially than their
counterparts in France. The average annual budget of a UK Olympic NGB was €93.1m as
opposed to just €41.9m in France. Commercial funding was more important in the UK at 74.6%
as opposed to 61.2% in France where self generated funding was more important in France but in
absolute terms far less. The average French Olympic sport gained 12.2% of its income from the
lottery and 3.1% from other state funding with the levels being just 7.9% and 2.3% in the UK.
5.13 In the case of professional sports the average annual federation budget was €69.3m in the UK as
opposed to €35.6m in France. Of these amounts just 7.9% of total income came from the lottery
in UK as opposed to 27.1% in France. Amongst amateur sports the average annual budget in the
UK was €79.4m during the period 2004 to 2007 compared to €76.4m in France. Both groups of
sports were fairly similar in terms of their reliance on public funding with the French at 10.8% and
the UK at 10.0%. In absolute terms the French federations averaged €8.3m per annum as
opposed to the UK NGB average of €7.9m.
5.14 It is worth pointing out that in the UK the scale of NGB funding means that amongst Olympic and
amateur sports and across the group as a whole although there is less reliance on state and
lottery funding the average absolute amounts are much higher. For instance in the UK Olympic
sports received an average of €9.6m per annum from these sources during the period concerned
as opposed to €6.4m in France. For amateur sports the corresponding numbers were €8.7m for
the UK and €3.0m for France.
Graphic 59 - ‘Bottom Up’ Analysis of Federation/NGB Income 2004 to 2007 – All Sports Annual Average per Sport
France UK
(€) % (€) %
Lottery 4.7 10.2% 6.4 7.9%
Exchequer 1.2 2.6% 1.9 2.4%
Commercial 31.2 67.4% 52.4 65.4%
Self Generated 7.4 16.0% 18.3 22.9%
Other 1.8 3.9% 1.1 1.4%
Total 46.4 100.0% 80.1 100.0%
Source: French Federations of Sport/UK NGBs/Sportsbusiness Analysis (2008) Note: The above analysis includes the sports of athletics, basketball, cycling, football, rowing, rugby union,
swimming, table tennis and tennis in France and athletics, badminton, cricket, cycling, football, golf, hockey, rowing, rugby league, rugby union, sailing, swimming and tennis in the UK

Page 60 of 71
Graphic 60 - ‘Bottom Up’ Analysis of Federation/NGB Income 2004 to 2007 – Olympic Sports Annual Average per Sport
France UK
(€) % (€) %
Lottery 5.1 12.2% 7.4 8.0%
Exchequer 1.3 3.1% 2.2 2.4%
Commercial 25.7 61.2% 69.5 74.6%
Self Generated 7.9 18.9% 12.8 13.8%
Other 1.9 4.6% 1.2 1.2%
Total 41.9 100.0% 93.1 100.0%
Source: French Federations of Sport/UK NGBs/Sportsbusiness Analysis (2008) Note: The above analysis includes the sports of athletics, basketball, cycling, football, rowing, swimming, table tennis
and tennis in France and athletics, badminton, cycling, football, hockey, rowing, sailing, swimming and tennis in the UK
Graphic 61 - ‘Bottom Up’ Analysis of Federation/NGB Income 2004 to 2007 – Non-Olympic Sports Annual Average per Sport
France UK
(€) % (€) %
Lottery 1.8 2.1% 4.0 7.9%
Exchequer 0.4 0.5% 1.2 2.3%
Commercial 76.0 92.3% 13.9 27.4%
Self Generated 3.4 4.1% 30.7 60.5%
Other 0.8 0.9% 0.9 1.9%
Total 82.4 100.0% 50.7 100.0%
Source: French Federations of Sport/UK NGBs/Sportsbusiness Analysis (2008) Note: The above analysis includes the sport of rugby union in France and cricket, golf, rugby league and rugby union
in the UK.
Graphic 62 - ‘Bottom Up’ Analysis of Federation/NGB Income 2004 to 2007 – Professional Sports Annual Average per Sport
France UK
(€) % (€) %
Lottery 6.6 8.6% 6.3 8.0%
Exchequer 1.7 2.2% 1.6 2.0%
Commercial 54.4 71.2% 38.5 48.5%
Self Generated 10.6 13.9% 31.3 39.4%
Other 3.1 4.0% 1.8 2.2%
Total 76.4 100.0% 79.4 100.0%
Source: French Federations of Sport/UK NGBs/Sportsbusiness Analysis (2008) The above analysis includes the sports of basketball, cycling, football, rugby union and in France and cricket, cycling,
football, golf, rugby league, rugby union and tennis in the UK
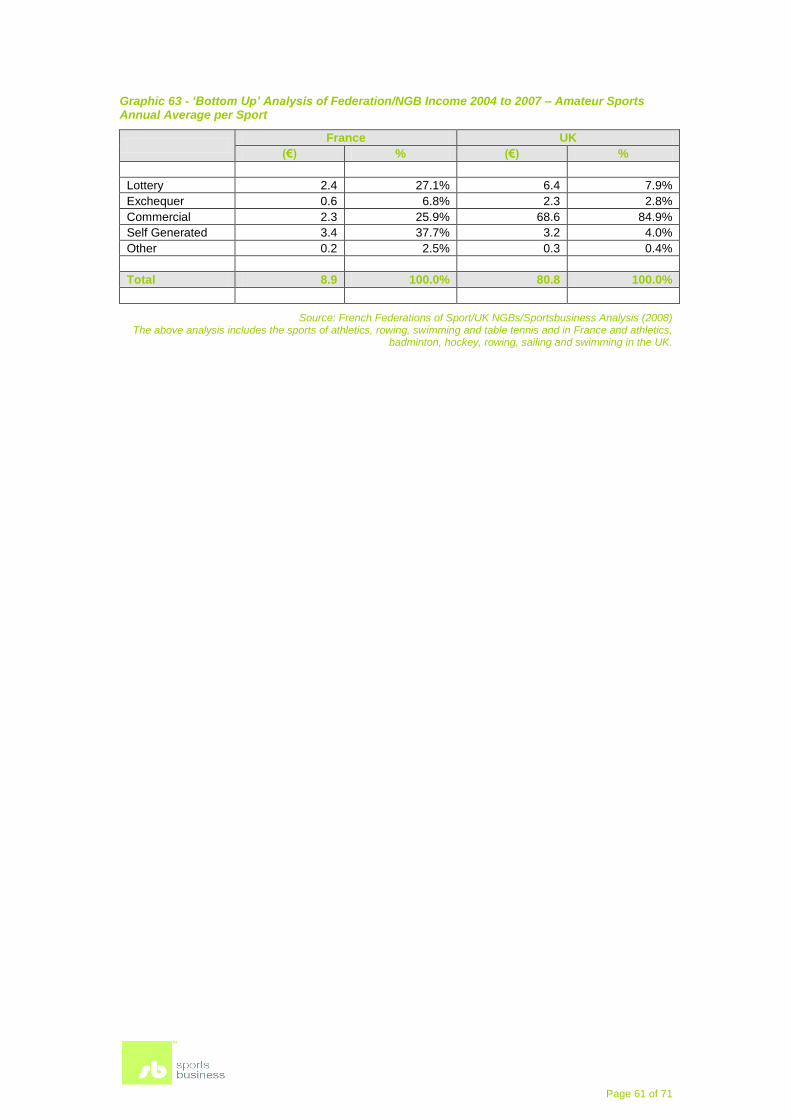
Page 61 of 71
Graphic 63 - ‘Bottom Up’ Analysis of Federation/NGB Income 2004 to 2007 – Amateur Sports Annual Average per Sport
France UK
(€) % (€) %
Lottery 2.4 27.1% 6.4 7.9%
Exchequer 0.6 6.8% 2.3 2.8%
Commercial 2.3 25.9% 68.6 84.9%
Self Generated 3.4 37.7% 3.2 4.0%
Other 0.2 2.5% 0.3 0.4%
Total 8.9 100.0% 80.8 100.0%
Source: French Federations of Sport/UK NGBs/Sportsbusiness Analysis (2008) The above analysis includes the sports of athletics, rowing, swimming and table tennis and in France and athletics,
badminton, hockey, rowing, sailing and swimming in the UK.

Page 62 of 71
6. LESSONS FROM OTHER MARKETS – RECENT EXAMPLES
6.1 Prior to drawing our conclusions on this study (and cognisant of the discussions underway in
relation to the likely market opening in France), we have also considered briefly the effect of the
two most recent examples of a major change in regulation in either sportsbetting or state lotteries
in EU Member States. The purpose is to test the thesis that the competitive, regulated market
opening of online sportsbetting in France might ‘cannibalise’ lottery sales.
6.2 In Italy, we consider the impact of the implementation of the so called Bersani Decree in late
2006 and resulting award of additional horse and sports betting concessions. In the UK, we
consider the introduction of the National Lottery in November 2004 alongside an already well
developed commercial betting industry.
6.3 It is also worth mentioning that Spain is also in the process of establishing a sportsbetting
market. The market is being developed from scratch in both a land based, and soon to be
regulated internet environment. The rollout is on an autonomous region by region basis but in
some ways this is the perfect scenario for any analysis as it provides both sportsbetting and non-
sporting areas to be compared.
Italy – The Extension of Sports Betting Concessions 2007
6.4 In Italy, there is evidence emerging that the rollout of sportsbetting does not necessarily
cannibalise lottery products. After the award of the additional concessions during the final days of
2006, operators were given until the middle of 2008 to open their new or enlarged estates. Most
operators achieved this with the majority of the opening coming during H2 2007.
6.5 It was a similar situation in respect to internet betting given the requirement that all
concessionaires connect their betting software to the licensee’s computer systems (AAMS). As a
result of this sequence of events we believe that the YoY performance of each lottery product
during H1 2008 provides a very good indicator of the impact that the increased supply of
sportsbetting is having on lottery sales.
6.6 In Italy there are three major categories of lottery products operated by two companies.
Lottomatica is listed on the MIB and organises the sale of both the nation’s lotto game and of
instant tickets. It should be noted that whilst the former has been in decline the latter has been
boosted significantly in recent years due to the introduction of higher denomination tickets
through a deal with Scientific Games.
6.7 The third category of lottery product, SuperEnalotto, is operated by private equity owned SISAL.
H2 Gambling Capital has requested SISAL for an indication of their current SuperEnalotto
trading in the light of the increased supply of sportsbetting across the nation.
6.8 It is worth noting that whilst H2 Gambling Capital was on a fact finding visit to Italy during late
2007 both Lottomatica and SISAL were confident that there would be little or no resulting

Page 63 of 71
cannibalisation due to the differences in customer bases and the relatively low price points of the
lottery products.
6.9 It appears that the trends in most products have been maintained if not bettered during the first
six months of 2008. Lotto sales were €3.0bn during the period against the €3.1bn reported for
the period 12 months earlier, a fall of 3.2%. This is well within the trend as lotto sales had fallen
6.2% during 2007 and an average 4.7% over the prior five years. Longer term trends should be
viewed with caution as single year sales, such as 2004, have spiked due to a large number of
‘late numbers’. As a result of the spike in sales in 2004 a third weekly lotto draw has since been
introduced which has had the impact of reducing the probability of late numbers and hence
sales.
6.10 Instant ticket sales grew €4.2bn to €4.9bn YoY during H1 2008, an increase of 16.7%. It could be
argued as multiple price point tickets up to a maximum of €10 were introduced at the beginning
of 2007 there is still a degree of novelty. Prior to this all tickets were priced at €1. The price point
growth has been supported by an increase in payout, from less than 50% to 70%. Furthermore,
Lottomatica only took over the management of instant tickets during late 2006. Before this,
instant tickets were managed directly by AAMS.
6.11 Still the H1 2008 performance was a like for like increase and has probably been assisted by
Lottomatica’s continued work in respect of branding, product innovation, retail network and
safety. Furthermore, the fact that many of the new sportsbetting kiosks are co-located with
existing lottery retailers. Hence after a sportsbetting win there is the ability to purchase instant
tickets with some winnings, etc.
6.12 It should be noted that the Italian case is different in that commercial sportsbetting shops existed
prior to 2007 under a limited number of concessions awarded to domestic companies such as
Snai, SISAL, Toto2000, etc. Under the Besani Decree additional sports and horse betting
licenses made available and companies such as Ladbrokes, Eurobet, Lottomatica and Intralot
entered the land based market. In addition these operators a number of others have launched
remote offerings. The existing market and the additional supply of land based betting do
differentiate Italy from the proposed French case where competition will only be permitted in
remote betting.
UK – The Introduction of the National Lottery 2004
6.13 It should be noted that in the UK the bookmakers argued that the introduction of the National
Lottery during November 2004 (the Lottery mainly generated its revenues from a draw at the
time of its launch) had a detrimental impact on their revenues. This was one of the arguments
that the sector used to gain additional products and a reduced tax.
6.14 The launch of the National Lottery was accompanied by a significant advertising campaign whilst
at the time UK bookmakers were not permitted to advertise. The UK betting industry’s turnover
was 2.5% ahead in 1994, but 2.5% down the following year before rising 2.9% during 1996 and

Page 64 of 71
then continued to rise at an average of 3.3% per annum for the following five years. The
National Lottery on the other hand after a strong increase in sales during 1997 saw sales fall by
an average of 1.6% over the following three years.
6.15 We believe that the UK case demonstrates that even where there is an initial cannibalisation of
one product’s sales by a new one; this is likely to be modest and much of it is due to novelty with
the majority of players returning to their longer term habits. We also believe that the UK case
was exaggerated by the fact that there was an unlevel advertising playing field which will
probably not be the case in France.
Europe – Overview of Sportsbetting in 16 Leading Nations
6.16 As a piece of added value, we have provided a desk based study of the sportsbetting activities
and the associated financial benefits to sport in 16 additional European nations. It was found that
across these nations a total of €98.5bn was staked on sportsbetting. The low margin high churn
model in the UK’s industry exaggerates the scale of the industry at this level. Excluding the UK,
the average sportsbetting sales per nation per annum across the remaining 15 nations was
€569m. Across the group, sportsbetting stakes accounted for 48.2% of lottery sales, yet in the
UK they were 263.4% and in France 2.1%.
Graphic 64 - An Overview of Sportsbetting Supply, Scale and Funding of Sport in Selected European Nations 2004 to 2007
Nation Principal Source of
Sportsbetting
Total Sports Bet Sales (€m)
Total Lottery
Sales (€m)
Total Sports Bet Sales as a
% of Lottery Sales
Total
Sports Bet Gross Win
(€m)
Total Sport
Funding (€m)
Total % Lottery Sales to
Sport
Austria Bookmakers 668.9 6,917.7 9.7% 80.8 202.0 2.9%
Belgium Bookmakers 1,008.5 4,593.4 22.0% 205.4
Czech Rep Lottery/Bookmakers 1,973.8 1,282.9 153.8% 238.7 142.8 11.1%
Denmark Lottery 1,233.4 3,552.7 34.7% 218 571.3 16.1%
Finland Lottery 1,003.4 3,899.9 25.7% 427.8 372.2 9.5%
France Lottery 744.0 34,983.0 2.1% 238.3 1,388.1 3.8%
Germany Lottery/4 Bookmakers 2,639.8 37,733.5 7.0% 90.7 214.2 0.6%
Greece Single Op Monopoly 7,480.2 10,425.6 71.7% 307.2 21.2 0.2%
Hungary Lottery 251.8 1,990.1 12.6% 106.3 67.7 3.4%
Ireland Bookmakers 4,880.0 2,644.0 184.6% 624.6
Italy Bookmakers 9,010.0 53,263.0 16.9% 2,983.0
Netherlands Lottery 74.3 5,432.1 1.4% 38.1 363.3 6.7%
Norway Lottery 270.8 4,521.7 5.9% 199.1 569.7 12.6%
Poland Lottery/Bookmakers 944.2 2,663.8 35.4% 235.0
Sweden Lottery 1,482.0 5,814.9 25.5% 516.1 375.4 6.5%
UK Bookmakers 64,800.0 24,599.0 263.4% 6,190.0 1,115.8 4.5%
Group Total 98,465.1 204,317.3 48.2% 12,699.1 5403.7 3.8%
Source: Sportsbusiness/H2 Gambling Capital Analysis (2008)

Page 65 of 71
6.17 At the gross win level the total across the sixteen nations was €15.0m for the four year period or
an average of €234m per nation per annum. Here the differential if the UK is excluded from the
analysis is not quite as substantial with the average for the other fifteen nations being €146m.
6.18 We are able to provide details of twelve nations’ allocation of lottery funds to sport during the
period 2004 to 2007. Between them a total of €5.5bn or an average of €115m per nation per
annum was allocated to sport. In terms of absolute spend the UK was second only to France but
in terms of percentage of sales was seventh one place ahead of France.
6.19 The proportion of French lottery sales allocated to sport at 3.9% was equal to that of the group
where as the UK was 15% higher. In absolute terms the average contribution per nation per
annum was €114m as opposed to €277m in the UK and €350m in France.
6.20 Of those Member States where information was available regarding the sports betting market,
there were four where it was unclear how much money is contributed to sport by the industry.
These were Belgium, Ireland, Italy and Poland - all of which have either an exclusive or
significant commercial bookmaking industry. As a result further more specific analysis would be
required in all of these nations.

Page 66 of 71
7. ANALYSIS AND CONCLUSIONS
7.1 We have collected an enormous amount of data, validated in person from official sources within
both Member States and also the EU (see list of consultees and references used in the
Appendices), and as a result can feel confident in our summary analysis and conclusions that
follow.
7.2 We should re-stress the objective of the study (shown on page 5) before concluding – which was
first, about presenting the facts as we found them in relation to the contribution made by the
gambling industry to the funding of sport in the UK and France; but second, to comment also on
the data collected from a qualitative perspective.
7.3 Of the 13 UK, and 9 French, sports that we have analysed in detail (from both ‘top down’ and
‘bottom up’ perspectives), these represent almost 80% of all lottery funding expended on sport at
in both Member States at the moment. We are therefore fairly reassured that the data presented
is strongly representative of the current picture as regards total spend.
‘7 Quantitative Findings’
7.4 Our 7 ‘headline’ quantitative findings are as follows:
1. Major Structural Differences Between the UK and France Sports Funding Models -
There are vast structural differences between the UK and France sports funding models.
The former is open, ‘entrepreneurial’, and benefiting from investment via some 44
different funding bodies; while the latter puts a strong emphasis on state run support,
and indeed the ‘official’ contribution made by the ménages at €15,180m per annum (or
1.59% of all household spending).
(Paragraph 4.39, p44)
2. Similar Overall Spending Pictures - Despite the structural differences, the overall
amount of funding on a true ‘like for like’ basis is roughly similar – at €25,735m per
annum in the UK and €28,770m in France. Household spending represents the biggest
contributor at 2.8% of average annual spend in the UK, and 1.59% in France. Support
when expressed by per head of population is €421 in the UK, and €451 in France.
(Graphic 6, p21 and Graphic 30, p45)
3. Similar Lottery Contributions to Sport - During the period 2004 to 2007, 4.5% of UK
National Lottery Sales were directly allocated to sport. La Francaise des Jeux’s (FDJ)
contribution to sport over the same time period was 3.8%.
(Graphic 50, p55)

Page 67 of 71
4. Different ‘Type’ of Lottery Contributions to Sport – While most lottery funding is routed
through structured programmes of support in both countries, the French model also
accommodates the direct employment by the State (on behalf of the Federations) of some
7,292 staff - including 1,571 coaches at a combined cost during 2007 of approximately
€99.0m.
(Paragraph 4.51, p47)
5. ‘Top Down’ Analysis Shows Marked Differences in Grassroots and Performance
Sport Lottery Contribution – From our ‘top down’ analysis, we found that an average of
€4.8m per annum in lottery funding was received by each of the French Federations
analysed, with 33.3% of this sum allocated for grassroots sport and 66.7% on
performance. In the UK, NGBs benefited by a higher amount at €6.4m each - with 56.3%
allocated to grassroots, and 43.7% on performance.
(Graphic 54 and Paragraph 5.8, p57)
6. ‘Bottom Up’ Analysis Shows UK Sports Are Much ‘Better Off’ – From our ‘bottom up’
analysis, we found that the average annual budget per UK NGB was €80.1m compared to
€46.4m in France. Of this, commercial funding represented the most important income
source at 67.4% of revenue in France, and 65.4% in the UK; with lottery funding
accounting for 10.2% of revenue in France, as opposed to 7.9% in the UK.
(Graphic 59, p59 and Paragraph 5.11, p58)
7. Additional Commercial Operators’ Contribution in the UK – Finally, the UK commercial
gambling industry contributed approximately €164m of additional funds to sport (or €41m
per annum) during the period 2004 to 2007. The majority of this spending was on football
which was in receipt of an estimated €133m over period, or €33m per annum.
(Paragraph 3.85, p36)
‘5 Qualitative Findings’
7.5 In addition to the above , we found during the desk review and from feedback at the field
meetings, a further 5 ‘headline’ qualitative findings as follows:
1. ‘Flexible’ Use of Lottery Funds in Support of French Sport - Although a separate
lottery ‘pot’ exists within France – the Centre National pour le Development du Sport
(CNDS) – its funds are effectively used by the Ministère de la Jeunesse, des Sports et de
la Vie Associative to ‘top up’ existing exchequer funding of sport, rather than as a source
for any ‘stand alone’ funding bid applications.
(Paragraph 4.18, p40 and Paragraph 4.45, p47)
2. Over Reliance on State Funding of Sport In France Set to Change - In relation to the
French sporting system, there is an increasing desire to develop more external revenue
for the leading French Sports Federations (particularly in the wake of Beijing 2008) –
called for by:

Page 68 of 71
La Ministère de la Jeunesse, des Sports et de la Vie Associative – because it believes its
subvention to the sports is increasing in real terms; while Federation membership is
decreasing (particularly as a result of more participants now taking part in sport informally,
haphazardly, and without recourse to their governing body);
The professional sports (particularly football and basketball) – because they require
greater funding support in order to retain the best players (and coaches) within the French
club system; and when they play for the French national team, to cover the players‟
insurance premiums in the event of serious injury;
INSEP (Institut National du Sport et de l‟Éducation Physique) – because although it is already
benefiting from new private sector backing in relation to the financing of its current facilities
refurbishment programme, it is concerned that greater revenues will be needed over and above
the current level of State funding in order to preserve its reputation as a beacon of excellence
and not fall behind world standards.
Olympic sports (particularly table tennis) – because they are seeking to develop their athletes
by establishing innovative talent development ‘twinning’ programmes with leading countries in
their field (eg China).
(Paragraph 4.38, p44 and Paragraph 4.33, p43)
3. Italy – ‘No Noticeable’ Change in the Context of the Regulated Opening of the Market
- Of relevance to the above, we established during our desk research that in Italy - since
its sportsbetting market was deregulated last year - there has been no, noticeable
cannibalisation of existing lottery products.
(Paragraphs 6.8-6.11, pp62-63)
4. UK – ‘Modest and Temporary’ Change in the Context of the Regulated Opening of
the Market – Similarly, we found that the introduction of the UK National Lottery in the mid
1990s demonstrated that even where there is an initial cannibalisation of a product’s sales
by a new one; it is likely to be modest and that much can be due to novelty, with the
majority of players returning to their longer term habits over time.
(Paragraphs 6.14-6.15, pp63-64)
5. UK Gives Higher Percentage of Lottery Sales to Sport than Both France and
Germany – In a three way comparison with Germany as the other major nation briefly
analysed as part of our summary overview of 16 European lottery playing nations, we
found that the UK model gives the highest percentage of lottery sales to sport at 4.5% (in
comparison to France on 3.8%; and Germany on 0.6%).
(Graphic 64, p64)

Page 69 of 71
Appendices
1. Desk Review - Key Sources
Assemblee Nationale – Mme Arletto Franco (2007)
„L‟Organisation et Le Financement du Sport en Europe‟
Carter Review (2005)
„Review of National Sport Effort and Resources‟
Central Council for Physical Recreation (2007)
„NGB Funding: An Analysis of the Funding Profiles of Sports Organisations‟
Commite National Olympique et Sportif Francais (2008)
„Ensemble Pour Un Sport Europeen‟
Courier des Statistiques (2008)
„Statistics at the French Sports Ministry‟
Deloitte (2008)
„Annual Review of Football Finance‟
European Commission (2007)
„White Paper on Sport‟
European Non-Governmental Sports Organisation (2007)
„Commission Conference on the White Paper on Sport‟ Brussels, 8-9 October
European Observatoire of Sport Employment (2007)
„The Sports Sector in France‟
European Observatoire of Sport Employment (2007)
„Vocasport – Improving Employment in the Field of Sport in Europe through Vocational Training‟
Gambling Commission (2007-08)
„Industry Statistics‟
HM Revenue and Customs (2008)
„Betting Bulletin 2004 to 2008‟
Ministrie de la Jeunesse, des Sports et de la Vie Associative (2003–07)
„STAT – Info‟ No 03-03, No 06-03, No 06-05, No 07-02,
Ministrie de la Jeunesse, des Sports et de la Vie Asso Ministère ciative (2006–07)
„Les Chiffres Cles du Sport‟ 2006, 2007
Ministrie de la Jeunesse, des Sports et de la Vie Associative (2007)
„Project de Loi de Reglement pour 2006‟
Ministrie de la Jeunesse, des Sports et de la Vie Associative (2008)
„Les Chiffres Cle du Project de Loi des Finances pour 2008‟
PFUE Sports (2008) „Study of Public and Private Financing of Sport in Europe – Summary of Conclusions and Proposals 20 September 2008‟
SPLISS (2008) „The Global Sporting Arms Race – France Policy questionnaire‟
Sport England (2000) „The Economics of Sport‟
Swiss Institute of Comparative Law (2008)
„Supply of Gambling across EC Member States‟
UK Office of National Statistics (2008) „General Household Survey - Family Spending: 2007 Edition‟

Page 70 of 71
2. Desk Review – Annual Reports
Review of the Annual Reports for 2004, 2005, 2006 and 2007 for the following organisations:
United Kingdom France
Government Bodies
Department of Culture, Media and Sport (DCMS) Department for Children, Schools and Families (DCSF) Local Government Association (LGA)
Ministère de la Jeunesse, des Sports et de la Vie Associative Ministère de l’Education Nationale
Sports Bodies UK Sport Home Country Sports Councils x 4 Central Council for Physical Recreation (CCPR) British Olympic Association (BOA) British Paralympic Federation (BPA) Commonwealth Games Councils x 4 Home Country Institutes of Sport x 4 Youth Sports Trust Sports Coach UK SkillsActive British University and College Sport (BUCS) County Sports Partnerships (CSPs)
Commite National Olympique et Sportif Francais (CNOSF) UNSS (National Federation for School Sport) Institut National du Sport et de l’Education Physique (INSEP) Centre Régional d’Éducation Populaire et Sportive (CREPS)
Federations/ Governing Bodies of Sport
Athletics - UK Athletics Badminton – Badminton England; Scottish Badminton Union; Welsh Badminton Union; Badminton Union of Ireland Cricket – England and Wales Cricket Board Cycling - British Cycling Golf - England Golf; Scottish Golf Union; Golf Development Wales; NI Golf Federation Football - Football Federation (FA);
Scottish FA; FA of Wales; Northern Irish (NI) FA Hockey – GB Hockey Board Rowing – GB Rowing Rugby League – Rugby Football League Rugby Union – Rugby Football Union Sailing – Royal Yachting Federation Swimming - British Swimming Tennis - Lawn Tennis Federation (LTA); Scottish LTA; Tennis Wales; NI LTA
Athletics – Federation Francaise d’Athletisme Basketball – Fédération Française de Basketball Cycling – Fédération Française de Cyclisme Football – Fédération Française de Football Golf – Fédération Française de Golf Rowing - Federation Francaise des Societes d’Aviron Rugby Union – Federation Francaise
de Rugby Swimming – Federation Francaise de Natation Table Tennis – Federation Francaise
de Tennis de Table Tennis – Federation Francaise de Tennis
Lottery/Gambling Bodies
Camelot National Lottery Commission Commercial Operators (undisclosed)
La Francaise des Jeux
Academic/Other Organisations
Sports Industry Research Centre University of Paris Sorbonne Centre de Droit et d’Econonmie de Sport European Observatoire of Sport Employment (EOSE) Acteurs du Sport

Page 71 of 71
3. Field Work – Meetings and Direct Consultation
United Kingdom France
Government Bodies
Department of Culture, Media and Sport (DCMS)
Ministère de la Jeunesse, des Sports et de la Vie Associative
Sports Bodies UK Sport Sport England sportscotland Central Council for Physical Recreation (CCPR) British Olympic Federation (BOA) Commonwealth Games Council for England English Institute of Sport Sports Coach UK SkillsActive
Institut National du Sport et de l’Education Physique (INSEP)
Federations/ Governing Bodies of Sport
Athletics - UK Athletics Cricket – England and Wales Cricket Board Cycling - British Cycling Golf - England Golf Football - Football Federation Hockey – GB Hockey Board Rugby League – Rugby Football League Rugby Union – Rugby Football Union Swimming - British Swimming Tennis - Lawn Tennis Federation
Athletics – Federation Francaise d’Athletisme Basketball – Fédération Française de
Basketball Cycling – Fédération Française de Cyclisme Golf – Fédération Française de Golf Swimming – Federation Francaise de Natation Table Tennis – Federation Francaise de Tennis de Table Tennis – Federation Francaise de Tennis
Lottery/Gambling Bodies
Camelot Commercial Operators (undisclosed)
La Francaise des Jeux
Academic/Other Organisations
Sports Industry Research Centre University of Paris Sorbonne European Observatoire of Sport Employment (EOSE)