study on performance enhancement of coconut fibres
TRANSCRIPT
HAL Id: tel-03240390https://tel.archives-ouvertes.fr/tel-03240390
Submitted on 28 May 2021
HAL is a multi-disciplinary open accessarchive for the deposit and dissemination of sci-entific research documents, whether they are pub-lished or not. The documents may come fromteaching and research institutions in France orabroad, or from public or private research centers.
L’archive ouverte pluridisciplinaire HAL, estdestinée au dépôt et à la diffusion de documentsscientifiques de niveau recherche, publiés ou non,émanant des établissements d’enseignement et derecherche français ou étrangers, des laboratoirespublics ou privés.
Study on performance enhancement of coconut fibresreinforced cementitious composites
Thi Thu Huyen Bui
To cite this version:Thi Thu Huyen Bui. Study on performance enhancement of coconut fibres reinforced cementitiouscomposites. Civil Engineering. Normandie Université, 2021. English. �NNT : 2021NORMC210�.�tel-03240390�
THÈSEPour obtenir le diplôme de doctorat
Spécialité GENIE CIVIL
Préparée au sein de l'Université de Caen Normandie
Study οn perfοrmance enhancement οf cοcοnut fibres reinfοrcedcementitiοus cοmpοsitesPrésentée et soutenue par
Thi Thu Huyen BUIThèse soutenue publiquement le 07/04/2021
devant le jury composé deM. FABRICE BERNARD Maître de conférences HDR, INSA de Rennes Rapporteur du jury
M. ZOUBEIR LAFHAJ Professeur des universités, École CentraleLille Rapporteur du jury
Mme ALEXANDRA BOURDOT Maître de conférences, École normalesupérieure Paris-Saclay Membre du jury
M. MOHAMED BOUTOUIL Directeur de recherche, Ecolesup.d'ingénieurs ESITC Caen Directeur de thèse
Mme HASNA GUALOUS Professeur des universités, Université CaenNormandie Co-directeur de thèse
M. DANIEL LEVACHER Professeur émérite, Université CaenNormandie Président du jury
Thèse dirigée par MOHAMED BOUTOUIL et HASNA GUALOUS, Laboratoireuniversitaire des sciences appliquées de cherbourg (Caen)
BUI Thi Thu Huyen P a g e | 2
ACKNOWLEDGEMENTS
First of all, I would like to express my deepest gratitude to my supervisors, Dr Mohamed BOUTOUIL for his comprehensive guidance, consistent supports, valuable advice, encouragements, and patience during this research work. His guidance helped me in all the time of the study and completing this thesis. I am also grateful to Dr Nassim SEBAIBI, Prof. Daniel LEVACHER, and Prof. Hasna LOUAHLIA as members of my doctoral advisory committee for their precise reviews, insightful comments, and constructive suggestions which contributed substantially to improving the quality of this dissertation. My sincere thanks also go to Prof. Anne PANTET and Dr. Malo LEGUERN as my CSI member, for their useful suggestions, fruitful discussion, and professional guidance during the first two years of my PhD study. Without their precious supports, it would not be possible to conduct this study. I would like to thank to David Lescarmontier, Tuan Anh Phung for their technical assistance in all my experimental works. Special thanks to my nice friends, Ali Hussan, Mazhar Hussain and Rexon Rodrigues for English proofreading of my writing. Moreover, I would like to extend my thanks to all my collegues in ESITC Lab for their helping me and sharing experiences in France. They all contributed to making me feel at home. Especially, I would like to express my gratitude to Dang Nguyen, Sahar
BUI Thi Thu Huyen P a g e | 3
Seifi, Synvain Louvel, Abdel Mohamed, Amel Bourguiba, Aurélie Fabien, Farjallah Alassadd, Fouzia, Karim, Marine … for the nice moments we shared together during my stay in Caen. They helped me in different ways for making my life and research much easier in France in the last three years. I greatly acknowledge the financial support granted by VIED scholarship from Vietnamese government under 911 program to succeed in my research at ESITC Caen. Finally, I would like to thank my family, particularly my parents to whom I am indebted for their encouragement, understanding and patience over many years. I am extremely grateful to my daughters and my hubby for their love and unconditional supports during the hard times. I also dedicate this dissertation to my daughters and hubby, who encouraged me to pursue and complete my PhD. December 2020 Caen, France BUI Thi Thu Huyen
Abstract
BUI Thi Thu Huyen P a g e | 4
ABSTRACT
Natural fibres have been used in daily human life since the dawn of history in a wide range of different applications such as ropes, textiles, mattresses, brushes, and so on. In recent decades, for minimizing impacts on the environment, natural fibres were applied in civil engineering as green alternatives for building construction to partially replace conventional materials and reduce the dependency on them. The usage of natural fibres is thus in perfect harmony with the concept of sustainability. Also, the sources of natural fibres are abundant in many regions over the world. Among the natural fibres, coconut fibre is considered as a good candidate for reinforcement in cement matrix due to its most ductile and energy absorbent properties compared to other plant fibres. Besides, it is necessary to use alternative binders in an attempt to improve the durability of these plant fibres into composites and reduce the negative impact on the environment. A new formulation of mortars is proposed, in which the Portland cement (PC) is totally replaced by calcium sulfoaluminate cement (CSA cement). This study aims to enhance the understanding of an innovative composite material by incorporating coconut fibres into cementitious matrix, which is prepared using two different types of cement, i.e., PC and CSA cement. This approach could, therefore, constitute an alternative solution to waste management and contribute to the development of reinforced mortars, improving comfort performance in buildings. After a review of characteristics of coconut fibres and mechanical performance as well as durability of fibre-reinforced composite, characterization of materials, experimental
Abstract
BUI Thi Thu Huyen P a g e | 5
programs and formulation methodology of mortars are first described in detail. The physical and mechanical properties of raw and treated coconut fibres for their recycling in construction materials are then determined in the next step. The influence of incorporating fibres on the rheological properties (consistency, workability, heat of hydration), physico-chemical properties (pH, ATG) and mechanical properties (compressive and flexural strengths, toughness) are analyzed. Also, the coconut fibres orientation and distribution within the hardened mortar matrix are obtained using microscope measurement. This constitutes an innovative part of the cracking behavior of coconut fibre-reinforced mortars. Finally, the relationship between durability and strength of mortar incorporating fibres is studied based on two different environments for curing: carbonation and wetting and drying conditions. These results clearly show that the presence of coconut fibres has significant effects on the properties of cementitious pastes due to the sensitivity of the fibres in the alkaline environment of the cementitious matrix and their highly hydrophilic nature. For instance, as fibre content increases, the flexural strength of mortars increased significantly, causing, by contrast, a decrease in compressive strength. The enhancement toughness and preventing the development of cracks inside reinforced mortars are the most important contributions of fibres. Although the mechanical properties improvement of fibre-reinforced mortars is not always obtained, these values meet the desired mechanical performance for rendering and plastering mortar in masonry in accordance with European standards. The study on the durability of fibre-reinforced mortars indicated that the losses in flexural strength are stronger than those in compressive strength due to the cumulated effect of fibres added under aggressive environments. Keywords: coconut fibre, mortar, treatment of fibre, mechanical properties, durability.
Content
BUI Thi Thu Huyen P a g e | 6
CONTENT
ACKNOWLEDGEMENTS .......................................................................................................................... 2 ABSTRACT .................................................................................................................................................... 4 CONTENT ...................................................................................................................................................... 6 LIST OF FIGURES ..................................................................................................................................... 10 LIST OF TABLES ...................................................................................................................................... 15 NOTATION LIST ....................................................................................................................................... 17 INTRODUCTION ...................................................................................................................................... 19 1. Motivation ........................................................................................................................................ 19 2. Objectives ......................................................................................................................................... 21 3. Structure of the thesis ................................................................................................................. 22 CHAPTER 1. LITERATURE REVIEW ................................................................................................ 24 1.1. Natural fibres ............................................................................................................................... 24 1.2. Coconut fibre ............................................................................................................................... 32 1.2.1. Properties of coconut fibre ............................................................................................ 34 1.2.2. Properties of coconut fibre-reinforced cementitious composites ................. 41 1.2.3. The effect of distribution and orientation of fibres in the composite materials .............................................................................................................................................................. 51
Content
BUI Thi Thu Huyen P a g e | 7
1.2.4. Cracking behavior of fibre reinforced composite materials ............................. 52 1.2.5. Durability of fibre reinforced composite materials ............................................. 53 1.3. Conclusions and recommendations .................................................................................... 63 CHAPTER 2. CHARACTERIZATION OF MATERIALS AND EXPERIMENTAL METHODS ........................................................................................................................................................................ 64 2.1. Introduction ................................................................................................................................. 64 2.2. Materials ........................................................................................................................................ 64 2.2.1. Water ...................................................................................................................................... 64 2.2.2. Cement ................................................................................................................................... 64 2.2.3. Sand ........................................................................................................................................ 65 2.2.4. Superplasticizer ................................................................................................................. 65 2.2.5. Raw fibre ............................................................................................................................... 67 2.3. Mixture proportions ................................................................................................................. 68 2.4. Experimental methods in fresh state of mortar ............................................................. 71 2.4.1. Slump flow test ................................................................................................................... 71 2.4.2. Determination of standard consistency ................................................................... 72 2.4.3. Setting time test ................................................................................................................. 73 2.4.4. Semi-adiabatic calorimeters of hydration test ....................................................... 73 2.5. The experiments in hardened state .................................................................................... 75 2.5.1. Water absorption capacity............................................................................................. 75 2.5.2. pH measurement ............................................................................................................... 75 2.5.3. Three-point flexural test ................................................................................................. 76 2.5.4. Compression test ............................................................................................................... 76 2.6. Conclusions .................................................................................................................................. 77 CHAPTER 3. DERTERMINATION OF PHYSICAL AND MECHANICAL PROPERTIES OF RAW AND TREATED COCONUT FIBRES FOR THEIR RECYCLING IN CONSTRUCTION MATERIALS ............................................................................................................................................... 79 3.1. Introduction ................................................................................................................................. 79 3.2. Preparation of fibres ................................................................................................................. 80 3.3. Testing methods for the determination of fibre properties ...................................... 80
Content
BUI Thi Thu Huyen P a g e | 8
3.3.1. Microscope image .............................................................................................................. 80 3.3.2. Absolute density ................................................................................................................ 81 3.3.3. The content of organic and mineral in fibre ........................................................... 81 3.3.4. The content of water in fibre ........................................................................................ 82 3.3.5. Water absorption .............................................................................................................. 83 3.3.6. Direct tensile test ............................................................................................................... 84 3.3.7. Single fibre pull-out test ................................................................................................. 86 3.3.8. Durability .............................................................................................................................. 87 3.4. Results and discussion ............................................................................................................. 89 3.4.1. Geometrical properties ................................................................................................... 89 3.4.2. Physical properties ........................................................................................................... 90 3.4.3. Mechanical properties ..................................................................................................... 93 3.4.4. Adhesion to matrix. Coconut fibre pull-out test .................................................... 94 3.4.5. Thermogravimetric analysis. ........................................................................................ 95 3.4.6. Chemical durability ........................................................................................................... 97 3.4.7. Conclusions for properties of coconut fibres ......................................................... 98 3.5. Conclusions .................................................................................................................................. 99 CHAPTER 4. BEHAVOIR OF FIBRES REINFORCED MORTAR: DISTRIBUTION, ORIENTATION OF FIBRES AND CRACKS FORMATION .........................................................101 4.1. Introduction ...............................................................................................................................101 4.2. Fresh mortars properties .....................................................................................................102 4.2.1. Slump flow .........................................................................................................................102 4.2.2. Standard consistency of cement ................................................................................102 4.2.3. Initial setting time ...........................................................................................................103 4.2.4. Heat of hydration .............................................................................................................104 4.3. Hardened mortar properties ...............................................................................................107 4.3.1. Water absorption capacity...........................................................................................107 4.3.2. Mechanical properties ...................................................................................................107 4.3.3. Orientation and distribution of fibres in mortar .................................................111

Content
BUI Thi Thu Huyen P a g e | 9
4.3.4. Cracking behavior of mortars using digital image correlation DIC .............122 4.4. Conclusions ................................................................................................................................134 CHAPTER 5. RELATIONSHIP BETWEEN DURABILITY AND STRENGH OF MORTAR INCOPORATING FIBRES .....................................................................................................................136 5.1. Introduction ...............................................................................................................................136 5.2. Influence of accelerated carbonation on the microstructure and mechanical properties of coconut fibre-reinforced cementitious matrix ..........................................137 5.2.1. Samples under accelerated carbonation ................................................................137 5.2.2. Experimental methods for carbonation depth measurement .......................137 5.2.3. Results and discussion ..................................................................................................139 5.2.4. Conclusions ........................................................................................................................146 5.3. Effects of wetting and drying cycles on the performance of coconut fibres reinforced mortar composite ......................................................................................................148 5.3.1. Sample under wetting and drying cycles ...............................................................148 5.3.2. Results and discussion ..................................................................................................148 5.3.3. Conclusions ........................................................................................................................153 5.4. Conclusions ................................................................................................................................154 CONCLUSIONS AND RECOMMENDATIONS ................................................................................156 REFERENCES ..........................................................................................................................................161 STANDARDS ............................................................................................................................................183 APPENDIX ................................................................................................................................................185 LIST OF PUBLICATIONS .....................................................................................................................190
List of figures
BUI Thi Thu Huyen P a g e | 10
LIST OF FIGURES
Fig. 1.1. Microstructure, schematic diagram and molecular structures of natural fibre [21]. .............................................................................................................................................................. 28 Fig. 1.2. Typical stress-strain relationship of single natural fibres [35]. ........................... 31 Fig. 1.3. Cross section of coconut fruit. ........................................................................................... 33 Fig. 1.4. Manufacturing process of coconut fibres. ..................................................................... 33 Fig. 1.5. Leading producers & global production of coir fibre annually. ........................... 34 Fig. 1.6. Images of the coconut fibre and SEM results [68]. .................................................... 39 Fig. 1.7. Variation of fibre diameter along the fibre length [44]. .......................................... 39 Fig. 1.8. Typical tensile stress-strain relationships of single coir fibres [43] .................. 39 Fig. 1.9. Flexural and compressive strengths and toughness of mortars, respectively [56]. .............................................................................................................................................................. 46 Fig. 1.10. Compressive and flexural strengths of fibre-reinforced cement mortars [6]. ........................................................................................................................................................................ 47 Fig. 2.1. Grain size distribution of cement and sand. ................................................................ 66 Fig. 2.2. The materials used. ................................................................................................................ 67 Fig. 2.3. The process of preparation of fibres. .............................................................................. 67
List of figures
BUI Thi Thu Huyen P a g e | 11
Fig. 2.4. Length distribution of coconut fibres. ............................................................................ 68 Fig. 2.5. Mortar mixer 20l. ................................................................................................................... 69 Fig. 2.6. Shock table. ............................................................................................................................... 69 Fig. 2.7. Mixing procedure of mortar containing fibres. .......................................................... 70 Fig. 2.8. Method of casting. .................................................................................................................. 71 Fig. 2.9. The procedure of casting and curing of samples. ...................................................... 71 Fig. 2.10. Flow table. .............................................................................................................................. 72 Fig. 2.11. The manual Vicat apparatus for determination of standard consistency. .... 73 Fig. 2.12. The automatic Vicat apparatus for determination of setting time. .................. 73 Fig. 2.13. The device for semi-adiabatic calorimeters of hydration test (EN 196-9). .. 75 Fig. 2.14. Water absorption test. ....................................................................................................... 75 Fig. 2.15. Stirring and filtering powder sample........................................................................... 76 Fig. 2.16. pH meter. ................................................................................................................................ 76 Fig. 2.17. Flexural three points test.................................................................................................. 77 Fig. 2.18. Compression test. ................................................................................................................ 77
Fig. 3.1. Process of fibre treatment applied. ................................................................................ 80 Fig. 3.2. Digital microscope. ................................................................................................................ 81 Fig. 3.3. The device for density test. ................................................................................................. 81 Fig. 3.4. Calcination oven with balance attachment. ................................................................. 82 Fig. 3.5. Ventilated oven for drying fibres. .................................................................................... 82 Fig. 3.6. Permeable bags to contain fibres. .................................................................................... 84 Fig. 3.7. The centrifuge machine installed for water absorption test. ................................ 84 Fig. 3.8. Bags containing fibres put in the centrifuge. ............................................................... 84 Fig. 3.9. Setup of the tensile test according to ASTM C1557. ................................................. 85 Fig. 3.10. Single fibre specimen before direct tensile test. ...................................................... 85 Fig. 3.11. Area calculation. ................................................................................................................... 86 Fig. 3.12. Casting specimen for pull-out test. ............................................................................... 87 Fig. 3.13. Specimen with seven fibres after demould ............................................................... 87 Fig. 3.14. Single fibre pull-out test set up ...................................................................................... 87
List of figures
BUI Thi Thu Huyen P a g e | 12
Fig. 3.15. Thermal analyzer device. .................................................................................................. 88 Fig. 3.16. The exposure procedure. .................................................................................................. 89 Fig. 3.17. Treated fibres. ....................................................................................................................... 89 Fig. 3.18. Microscope images of surface and cross-section of fibre. .................................... 90 Fig. 3.19. Diameter distribution of raw coconut fibres. ........................................................... 90 Fig 3.20. Water absorption of coconut fibres: (a) versus time; (b) logarithmic scale. . 92 Fig. 3.21. The image of fibre in mortar. .......................................................................................... 95 Fig. 3.22. The pull-out load–displacement curves. ..................................................................... 95 Fig. 3.23. TGA of fibres tested. ............................................................................................................ 96 Fig. 3.24. DTG of fibres tested. ........................................................................................................... 96 Fig. 3.25. Mass loss of fibres after exposure in sodium solution or calcium hydroxide solution. ...................................................................................................................................................... 98 Fig 3.26. Eco-friendly method of coconut fibres preparation................................................ 99 Fig. 4.1. Slump flow of mortars. .......................................................................................................102 Fig. 4.2. The evaluation of standard consistency of two types of cement paste in accordance with EN 196-3. ...............................................................................................................103 Fig. 4.3. Initial setting time. ...............................................................................................................103 Fig. 4.4. Rate of heat evolution of studied mortars. .................................................................105 Fig. 4.5. The semi-adiabatic curve of mortars. ...........................................................................106 Fig. 4.6. Water absorption capacity of mortars. ........................................................................107 Fig. 4.7. Compressive strength of mortars versus time. ........................................................109 Fig. 4.8. Flexural strength of mortars versus time. ..................................................................109 Fig. 4.9. Typical curves of behavior in bending 3 points of mortars after 28 of curing. ......................................................................................................................................................................110 Fig. 4.10. Principle of calculation of toughness index I5 in accordance with ASTM C1018. ......................................................................................................................................................................110 Fig. 4.11. Toughness index I5 at different ages of mortars. ...................................................111 Fig. 4.12. Definition of planes. ..........................................................................................................112 Fig. 4.13. Three different planes of mortar sample cut. .........................................................113
List of figures
BUI Thi Thu Huyen P a g e | 13
Fig. 4.14. Image of a typical grid in a cross-section divided into meshes of 1cm x 1cm. ......................................................................................................................................................................115 Fig. 4.15. Definition of two polar angles of each fibre ............................................................116 Fig. 4.16. The binary threshold image of cross sections. .......................................................117 Fig. 4.17. Notion of row of horizontal plane and layer of vertical planes. ......................120 Fig. 4.18. Different distribution of fibres in each mesh of three cross section planes of mortar sample incorporating 2% fibre in %. .............................................................................120 Fig. 4.19. Ratio of fibre area in each mesh of sample incorporating 2% fibre in %. ...120 Fig. 4.20. Ratio of fibres area in each part of mortar sample incorporating 2% fibre. ......................................................................................................................................................................121 Fig. 4.21. Load–displacement curves of mortar inclusion 2% fibre after 7 days. ........122 Fig. 4.22. Fibres bridging at the cracked surface of the specimen inclusion of 2% fibre loaded in opposite casting direction. ............................................................................................122 Fig. 4.23. Observation area on a mortar specimen obtained by spraying white and black paint. ..........................................................................................................................................................124 Fig. 4.24. Zone of interest. ..................................................................................................................124 Fig. 4.25. Flexural test set up equipped for DIC. .......................................................................125 Fig. 4.26. Force versus displacement for CSA2 sample at 7 days. ......................................126 Fig. 4.27. Image series of observed damage in ZOI for a CSA2 sample. ...........................128 Fig. 4.28. Displacement and strain development contour map inside ZOI of CSA2 at five load stages. ..............................................................................................................................................129 Fig. 4.29. Force versus displacement for a CSA control mortar at 7 days. ......................130 Fig. 4.30. Image series of observed damage in ZOI for a CSA control mortar. ..............130 Fig. 4.31. Displacement and strain development contour map inside ZOI of CSA at two load stages. ..............................................................................................................................................131 Fig. 4.32. Microscope images of two mixture designs. ...........................................................133 Fig. 4.33. Horizontal lines for analysis. .........................................................................................133 Fig. 4.34. Shear strains calculation at ultimate tests along horizontal lines of mortars by means of DIC. ..........................................................................................................................................133 Fig. 4.35. Value of crack width for samples measured at their corresponding ultimate loads based on DIC. ..............................................................................................................................134
List of figures
BUI Thi Thu Huyen P a g e | 14
Fig. 5.1. Carbonation chamber. ........................................................................................................137 Fig. 5.2. Images of CSA and CSA2 samples surfaces after carbonation test covered by phenolphthalein. ...................................................................................................................................140 Fig. 5.3. Images of PC and PC2 samples surfaces after carbonation test covered by phenolphthalein. ...................................................................................................................................140 Fig. 5.4. Effect of fibre content on pH values for PC and CSA cement-based mortars. ......................................................................................................................................................................141 Fig. 5.5. CH and CC concentrations distribution over the depth of PC2 and CSA2 samples. ....................................................................................................................................................142 Fig. 5.6. Comparison mechanical strength of mortar samples cured in two different conditions. ...............................................................................................................................................143 Fig. 5.7. TG and DTG graphs for different profiles of PC2 sample after accelerated carbonation. ............................................................................................................................................144 Fig. 5.8. Mass loss for different profiles of PC2 sample and transition temperature ranges. .......................................................................................................................................................146 Fig. 5.9. Values of moisture absorption for the mixes. ...........................................................149 Fig 5.10. Compressive strength of mortars after wetting and drying cycles. ................151 Fig 5.11. Flexural strength of mortars after wetting and drying cycles. .........................151 Fig. 5.12. Typical force – displacement relationship of sample incorporating fibres.152 Fig. 5.13. TG and DTG graphs for mortar incorporating fibres after 5 wetting and drying cycles..........................................................................................................................................................153 Fig. 5.14. Mass loss for samples incorporating fibres with and without wetting and drying cycles and transition temperature ranges. ...................................................................153
List of tables
BUI Thi Thu Huyen P a g e | 15
LIST OF TABLES
Table. 1.1. A list of fifteen natural fibres [16] .............................................................................. 25 Table. 1.2. Chemical compositions of some natural fibres [22]. ........................................... 27 Table. 1.3. Properties and performance of natural fibres reinforced cementitious composites. ................................................................................................................................................ 29 Table. 1.4. Physical and mechanical properties of coconut fibre reported in literature. ........................................................................................................................................................................ 36 Table. 1.5. Chemical composition of coconut fibre reported from different previous researches. ................................................................................................................................................. 40 Table. 1.6. Recommended fibre length and content in reinforced concrete. ................... 41 Table. 1.7. Mechanical properties compared between plain concrete and concrete with 5% fibre content [74] ............................................................................................................................ 44 Table. 1.8. Compressive and flexural properties of plain and fibre-reinforced concretes [49]. .............................................................................................................................................................. 45 Table. 1.9. Thermal conductivity of natural unconventional insulation materials. ...... 48 Table. 1.10. Thermal conductivity of some reinforced cementitious composites with coconut fibres. .......................................................................................................................................... 50
List of tables
BUI Thi Thu Huyen P a g e | 16
Table 1.11. A literature review concerning accelerated carbonation. ............................... 54 Table 1.12. A literature review concerning the effect of cyclic wetting and drying on the physical and mechanical properties of different composite materials. ............................. 60 Table. 2.1. Characteristics of two cement types. ........................................................................ 65 Table. 3.1. Organic content of fibres. ............................................................................................... 82 Table. 3.2. Water content of fibres. .................................................................................................. 83 Table. 3.3. Absolute density of fibre. ............................................................................................... 91 Table. 3.4. Data results from water absorption test in logarithmic law.. .......................... 92 Table. 3.5. Water absorption rate of some plant fibres from literature. ........................... 93 Table. 3.6. Tensile strengths and tensile strains of coconut fibres. ..................................... 94 Table. 3.7. Tensile properties of some plant fibres. ................................................................... 94 Table. 3.8. Thermal gravimetric data results of coconut fibres. ........................................... 97 Table. 4.1. Hydration characteristics of cementitious matrices. ........................................106 Table. 4.2. Orientation and distribution fibres parameters in each cross section observed for CSA cement-based mortars. ...................................................................................119

Notation list
BUI Thi Thu Huyen P a g e | 17
NOTATION LIST
A Fibre cross-section area Imax Maximum intensity of rate of heat evolution Abt Moisture absorption of mortar IRA Initial rate of absorption AD Air dry ITZ Interfacial transition zone ATF Alkali-treated fibre IWW Immersed in water for wetting BF Boiled fibre LCA Life cycle assessment C2S Calcium disilicate LCC Life cycle costs C3S Calcium trisilicate LVDT Linear variable differential transformer C4A3S ye’elimite MIP Mercury intrusion porosimetry CC Calcium carbonate NMR Nuclear magnetic resonance
Notation list
BUI Thi Thu Huyen P a g e | 18
CCD Charged-coupled device OD Oven dry CFRC Coconut fibres-reinforced concrete PC Portland cement CH Portlandite pH Potential of hydrogen CLSM Confocal laser scanning microscopy Qmax Maximal heat of hydration CSA Calcium sulfoaluminate Rc Compressive strength C-S-H Calcium-Silicate-Hydrate Rf Flexural strength CT Computed tomography RF Raw fibre DIC Digital image correlation RH Relative humidity DTG Difference Thermogravimetry SEM Scanning electron microscopy DX Horizontal displacement Sf Slump flow DY Vertical displacement TGA Thermogravimetric analysis EDS Energy dispersive X-ray spectroscopy tmax Time of maximum rate of heat evolution ɛxx Transverse strain W(t) Water absorption ɛxy Shear strain Wd Mass of mortar after drying ɛyy Vertical strain Ww Mass of mortar after wetting Fmax Maximum force at failure ZOI Zone of interest FTIR Fourier-transform infrared ηθ Orientation factor GWP Global warming potential λ Thermal conductivity HDR High dynamic range σ Ultimate tensile strength I5 Toughness index Tensile strain of fibre
Introduction
BUI Thi Thu Huyen P a g e | 19
INTRODUCTION
1. Motivation With the high speed of economic growth, nowadays, most countries have been investing a tremendous amount of budget into constructing infrastructures, which leads to the fact that the demand for construction materials such as concrete has been increasing significantly. Concrete is the primary construction material and plays a crucial role in the development of infrastructures such as highways, bridges, buildings, etc. It is estimated that the total annual consumption of concrete production over the world is more than 20 billion tons [1,2]. Besides, conventional aggregate for the concrete composite is decreasing sharply due to the overexploitation of human activities. The global aggregate production-consumption almost doubled from 21 billion tons in 2007 to 40 billion tons in 2014, up to 48.3 billion tons in 2015, and is expected to expand further to 66.3 billion tons by 2022 [3]. Therefore, the sustainability of the built environment will come through the increased use of alternative, recycled, natural, and unconventional construction materials and thermal insulation materials [4]. Green or alternative material is increasingly being investigated because of its advantages. Using natural fibres in the reinforced composite can reduce not only the dependency on conventional concrete-making materials but also environmental impact. Furthermore, the amount of natural fibres has been rising considerably in the past decades. Each year, farmers harvest million tons of natural fibres from a wide
Introduction
BUI Thi Thu Huyen P a g e | 20
range of plants, i.e., cotton bolls, abaca, sisal leaves coconut husks, the stalks of jute, hemp, flax and ramie plants and animals, i.e., sheep, rabbits, goats, camels and alpacas. At least five good reasons are presented for choosing natural fibres, including healthy, economy, responsibility, sustainable development and high-tech performance [5]. Firstly, natural fibres are a healthier choice for many industrial products. Some insulation batts in building construction made from wool or hemp draw moisture away from walls and timber, are reusable and can be installed without the need for protective clothing. Wool insulation is also naturally fire-resistant. Another reason is the responsible choice. Most of the natural fibres are produced and harvested in developing countries. This agriculture is vital to the economies of the livelihoods of millions of small-scale farmers and low-wage workers and then of the developing countries. Using natural fibres is an indirect and effective way to contribute to promoting the economies of those countries. Besides, using natural fibres is a sustainable choice. Natural fibres play a crucial role in green economies because of their renewable and reusable ability. The use of natural fibres is considered as a high-tech and fashionable choice thanks to eco-environmental and mechanical strength properties. Worldwide, the construction industry is moving to natural fibres for a range of products, including light structural walls, insulation materials, floor and wall coverings, and roofing. Many studies have shown the possible use of natural fibre in partial cement and aggregate replacement, as well as material reinforcement [6–11]. Additionally, using natural fibres reinforced composite material is both feasible and valuable to protect the environment, produce economic benefits, as well as preserving conventional aggregate sources. Using natural fibres for reinforcement in the composite can reduce fuel consumption for transport and construction cost, while other aggregates consume a huge energy at each step of processing. Many researchers suggested the potential application of natural fibres in composite materials in order to solve environmental issues and energy consumption [8,12–14]. Moreover, the use of natural fibres for the construction industry will reduce the amount of agriculture waste that usually ends up in landfills. The use of natural fibres for construction can decrease 65% of the greenhouse gas footprints and generate less carbon emission and require the lowest energy consumption in comparison with cement and lime [15,16]. The use of agriculture productions brings substantial gains related to reducing resource consumption and waste production. Although the research for the use of natural fibres as reinforcement in the composite material has been done for more than 50 years, there are not many structures using natural fibres. It is attributed to a lack of incentives, low landfill costs, a lack of up-to-date technical regulation as well as lack of government support, and
Introduction
BUI Thi Thu Huyen P a g e | 21
lower strength compared to traditional composite materials. The construction project stakeholders claim a lack of confidence in the technical feasibility of using natural fibres in the composite materials. As a result, numerous studies have focused on improving the quality of natural fibres to enhance properties and durability in order to meet the demand of construction industries. Generally, the obstacles to using natural fibres for realistic structures are lower mechanical and durability properties in comparison with those of conventional composite materials. Therefore, many methodologies have been developed to improve the properties of natural fibres reinforced composite. Further research is needed to overcome the existing technical and market barriers for broadening the application of natural fibres and increasing the proportion of natural fibres in the composite material. Among natural fibres, coconut fibre was known as one of the fifteen of the world's major plant and animal fibres [5]. This fibre has a high concentration of lignin among vegetable fibres (up to nearly 50 % [17]), which makes itself stronger. However, coconut fibre has been exploited in a limited way over the past few years. Properties of coconut fibre and its application ability in construction buildings are still poorly understood. According to the literature, it is clear that it is necessary and timely to develop research on the reinforcement based on natural fibres of mortars as a building material. Therefore, this Ph.D study focus on investigation of the properties of coconut fibres in the composite mortar as a reinforcement. The selection of coconut fibre is well justified in respect with the concept of sustainability and at the same time, the sources of natural fibres are abundant in many regions over the world. 2. Objectives The objective of this research is to determine the properties of coconut fibres reinforced mortars and then to develop methodologies for performance enhancement of coconut fibres in construction industries. These methodologies are also proposed to increase the number of fibres in mortars so as to dump less amount of fibre waste in landfills and to develop more sustainable alternative by substituting a part of traditional aggregate. Therefore, the study investigated the effects of the enhancement methodologies on mechanical properties and durability of natural fibres-reinforced mortars. This is gained by addressing the following objectives: - To determine the properties of coconut fibres namely geometrical, physical, and mechanical properties as well as the durability to enhance its use in construction materials. Additionally, in order to maximize the effectiveness and improve the microstructure and mechanical properties and the durability of coconut fibre, some pre-treating fibre methods are proposed. The data results of treated fibres are compared to the fibres without any treatment.
Introduction
BUI Thi Thu Huyen P a g e | 22
- To examine the optimum proportion of coconut fibres in the mortar and the suitable methods for incorporating coconut fibres in mortar. Therefore, the present study investigated the mechanical properties and durability of fibres-reinforced mortars at different incorporation rates with the usage of superplasticizer to mitigate the drawbacks of mortar incorporating fibres. The results of mortars containing fibres are compared to those of mortars without fibres, i.e., control mortars. Two types of cement are used to manufacture mortar mixtures, a CEM I 52.5 N type I Ordinary Portland Cement (OPC) and a Calcium Sulfoaluminate cement (CSA Cement). The properties of mortars with these two types of cement are also compared. - To investigate the effects of distribution and orientation of fibres in mortar on mechanical properties and crack formation inside mortars using microscope measurement. - To increase the role of fibres in mortar mixtures in controlling cracking behavior by means of a recent method digital image correlation DIC. This technique investigates displacement and strain fields based on comparison tracking of the same points between two digital images which characterize the original and deformed surface of a material under mechanical loading. - To investigate the effects of fibres on the properties of mortar in aggressive environments. An evaluation of the performance of fibres-reinforced mortar in carbonation resistance and wetting and drying cycles is carried out and demonstrates the role of fibres in retaining the strength of mortars. The findings of this research are expected to contribute to the sustainable development of the construction industries. 3. Structure of the thesis This thesis manuscript comprises five chapters. Each chapter investigates the properties of coconut fibres reinforced mortar to improve the properties of mortar taking into account increasing the number of fibres in mortar. The content of each chapter is summarized as follows:
Chapter 1: The first chapter gives a brief overview of natural fibres, especially coconut fibre characterization and recent methodologies for performance enhancement of natural fibres-reinforced composite. Chapter 2: The second chapter presents in detail properties of raw materials incorporated into mortar, including water, sand, cement and superplasticizer, and experimental methods in both fresh and hardened states of mortar used in this present study. Chapter 3: A wide range of experiments to determine the properties of coconut fibres as geometrical, physical, and mechanical properties, as well as the durability, to enhance its use in construction materials are reported in this chapter. Two fibres treating methods, i.e., physical, and chemical methods, have been used to improve the properties and durability of fibres in the alkaline environment of mortars.
Introduction
BUI Thi Thu Huyen P a g e | 23
Chapter 4: In the fourth chapter a case study is explored the mechanical properties of mortars with and without fibres in the fresh and hardened state. Additionally, cracking behavior of mortars is determined under mechanical loading and the role of fibre in controlling cracking of mortars is analyzed and discussed. This chapter also proposed a microscope-based measurement to investigate the distribution and orientation of fibres in mortar in order to understand their effect on the mechanical properties of mortars. Chapter 5: A discussion of relationship between strength and durability of mortars incorporating fibres falls outside the scope of the last chapter. A wide range of properties are investigated as wetting and drying, carbonation resistance, mechanical performance, and thermal analysis in order to follow the degradation of mortars under aggressive environments. Then concluding remarks for durability of coconut fibres-reinforced mortars are summarized in this last chapter. Conclusions and recommendations for further study are also given after the last chapter.
Chapter 1. Literature review
BUI Thi Thu Huyen P a g e | 24
CHAPTER 1. LITERATURE REVIEW
In this section, literature reviews related to the performance of natural fibres-reinforced composite materials and methodologies to improve the properties of the composite are described. This complete review first based on approximately 200 references reports the specificities of natural fibres in general, and then focuses mainly on comparing the properties of coconut fibres. Moreover, the coconut fibres characteristics as mechanical and thermal properties, as well as properties of composites incorporating fibres, are also analyzed in this section. The main scope of this review is to describe the possible usage of coconut fibres in a cementitious composite material to replace partly common materials and enhance awareness about using a new green material through value addition to enrich its use. 1.1. Natural fibres Natural fibres have been an essential material in daily human life since the dawn of civilization. They are greatly elongated substances produced by plants and animals that can be spun into filaments, threads, or ropes. Natural fibres may be classified according to their source as cellulosic (from plants), protein (from animals), and mineral. Plant fibres may be seed hairs, such as cotton; bast fibres such as linen; leaf fibres such as sisal; and husk fibres such as coir from the coconut. Animal fibres include wool, hair, fur, and secretions such as silk. The only important mineral fibre is asbestos; but due to its associated health problems, it is of little economic consequence nowadays [18]. So among them, plant fibres are
Chapter 1. Literature review
BUI Thi Thu Huyen P a g e | 25
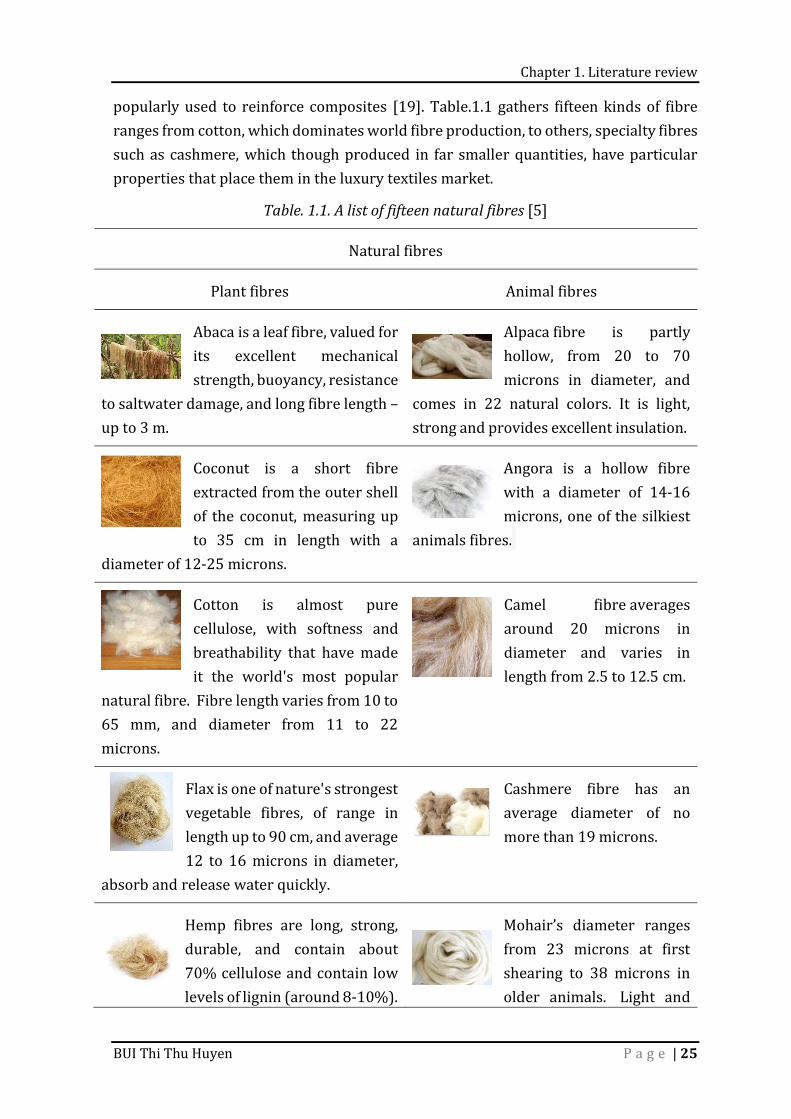
popularly used to reinforce composites [19]. Table.1.1 gathers fifteen kinds of fibre ranges from cotton, which dominates world fibre production, to others, specialty fibres such as cashmere, which though produced in far smaller quantities, have particular properties that place them in the luxury textiles market. Table. 1.1. A list of fifteen natural fibres [5] Natural fibres Plant fibres Animal fibres Abaca is a leaf fibre, valued for its excellent mechanical strength, buoyancy, resistance to saltwater damage, and long fibre length – up to 3 m.
Alpaca fibre is partly hollow, from 20 to 70 microns in diameter, and comes in 22 natural colors. It is light, strong and provides excellent insulation. Coconut is a short fibre extracted from the outer shell of the coconut, measuring up to 35 cm in length with a diameter of 12-25 microns. Angora is a hollow fibre with a diameter of 14-16 microns, one of the silkiest animals fibres.
Cotton is almost pure cellulose, with softness and breathability that have made it the world's most popular natural fibre. Fibre length varies from 10 to 65 mm, and diameter from 11 to 22 microns.
Camel fibre averages around 20 microns in diameter and varies in length from 2.5 to 12.5 cm.
Flax is one of nature's strongest vegetable fibres, of range in length up to 90 cm, and average 12 to 16 microns in diameter, absorb and release water quickly. Cashmere fibre has an average diameter of no more than 19 microns.
Hemp fibres are long, strong, durable, and contain about 70% cellulose and contain low levels of lignin (around 8-10%). Mohair’s diameter ranges from 23 microns at first shearing to 38 microns in older animals. Light and
Chapter 1. Literature review
BUI Thi Thu Huyen P a g e | 26
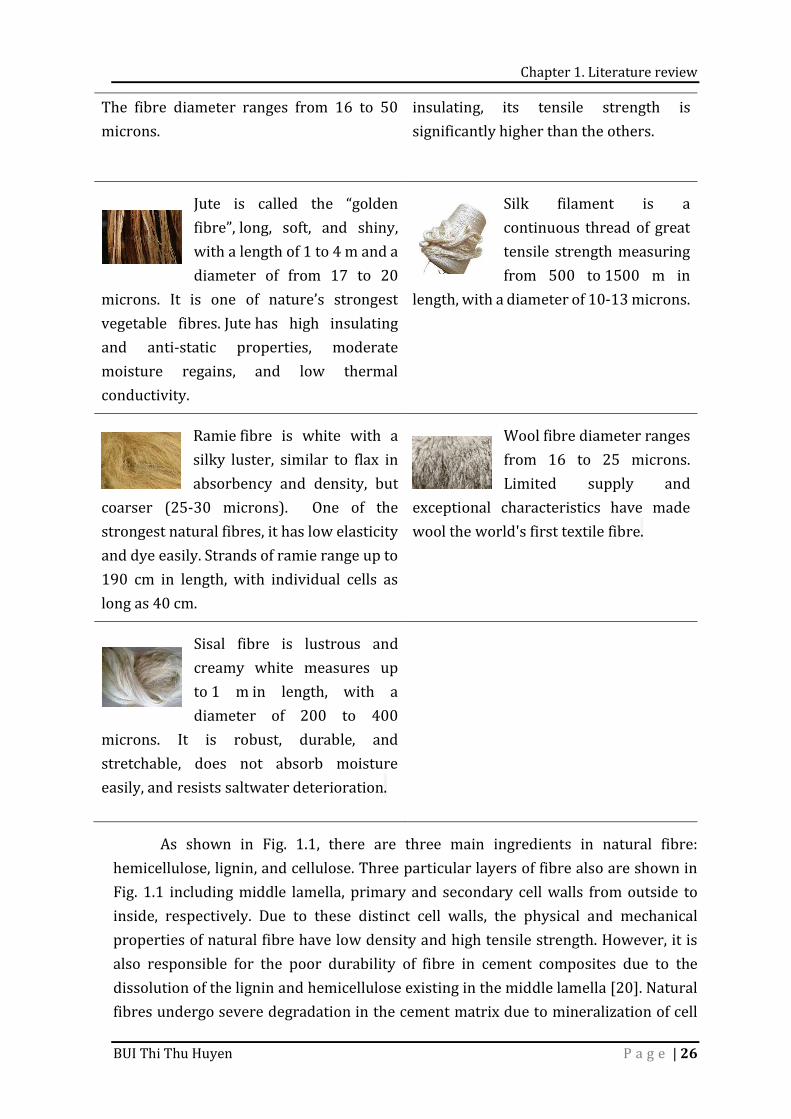
The fibre diameter ranges from 16 to 50 microns. insulating, its tensile strength is significantly higher than the others. Jute is called the “golden fibre”, long, soft, and shiny, with a length of 1 to 4 m and a diameter of from 17 to 20 microns. It is one of nature’s strongest vegetable fibres. Jute has high insulating and anti-static properties, moderate moisture regains, and low thermal conductivity.
Silk filament is a continuous thread of great tensile strength measuring from 500 to 1500 m in length, with a diameter of 10-13 microns.
Ramie fibre is white with a silky luster, similar to flax in absorbency and density, but coarser (25-30 microns). One of the strongest natural fibres, it has low elasticity and dye easily. Strands of ramie range up to 190 cm in length, with individual cells as long as 40 cm.
Wool fibre diameter ranges from 16 to 25 microns. Limited supply and exceptional characteristics have made wool the world's first textile fibre.
Sisal fibre is lustrous and creamy white measures up to 1 m in length, with a diameter of 200 to 400 microns. It is robust, durable, and stretchable, does not absorb moisture easily, and resists saltwater deterioration.
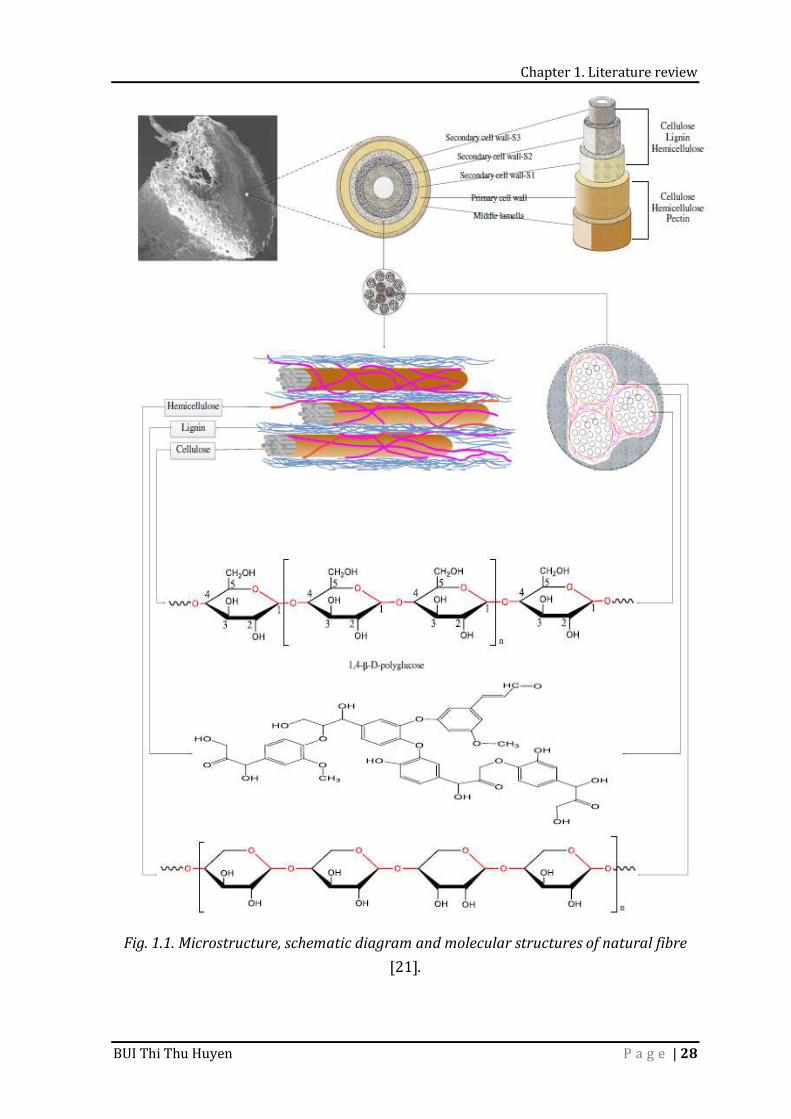
As shown in Fig. 1.1, there are three main ingredients in natural fibre: hemicellulose, lignin, and cellulose. Three particular layers of fibre also are shown in Fig. 1.1 including middle lamella, primary and secondary cell walls from outside to inside, respectively. Due to these distinct cell walls, the physical and mechanical properties of natural fibre have low density and high tensile strength. However, it is also responsible for the poor durability of fibre in cement composites due to the dissolution of the lignin and hemicellulose existing in the middle lamella [20]. Natural fibres undergo severe degradation in the cement matrix due to mineralization of cell
Chapter 1. Literature review
BUI Thi Thu Huyen P a g e | 27
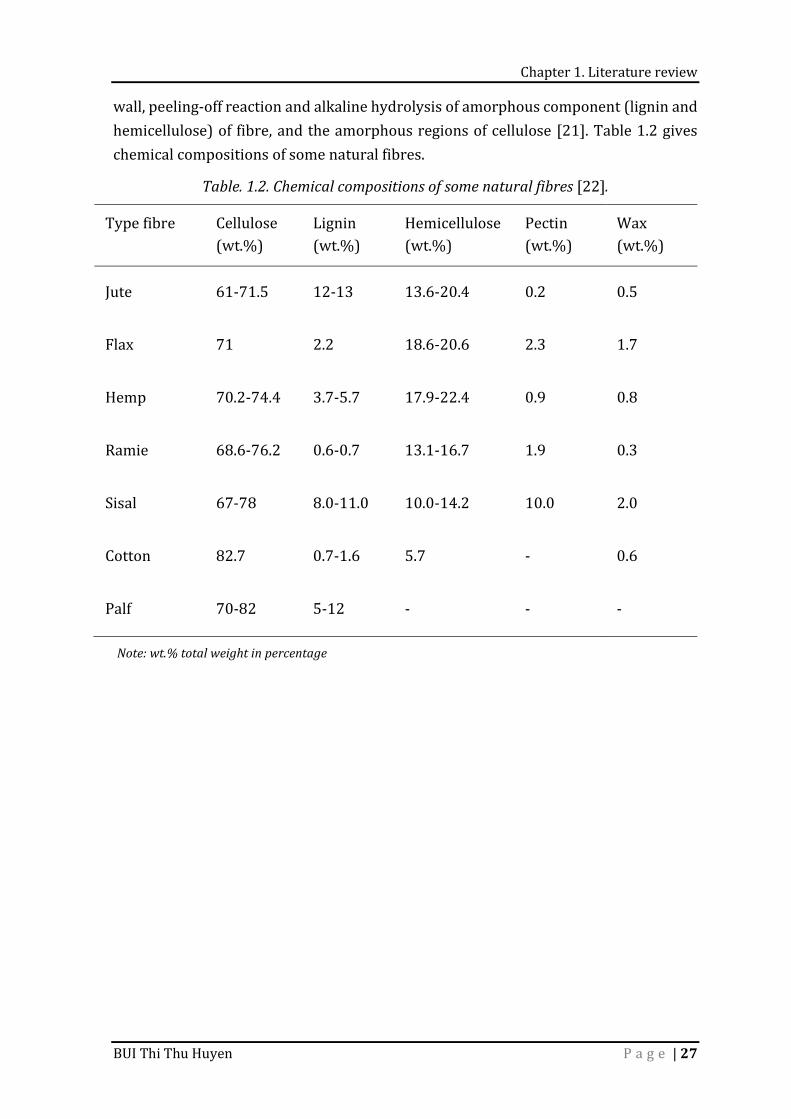
wall, peeling-off reaction and alkaline hydrolysis of amorphous component (lignin and hemicellulose) of fibre, and the amorphous regions of cellulose [21]. Table 1.2 gives chemical compositions of some natural fibres. Table. 1.2. Chemical compositions of some natural fibres [22]. Type fibre Cellulose (wt.%) Lignin (wt.%) Hemicellulose (wt.%) Pectin (wt.%) Wax (wt.%)
Jute 61-71.5 12-13 13.6-20.4 0.2 0.5 Flax 71 2.2 18.6-20.6 2.3 1.7 Hemp 70.2-74.4 3.7-5.7 17.9-22.4 0.9 0.8 Ramie 68.6-76.2 0.6-0.7 13.1-16.7 1.9 0.3 Sisal 67-78 8.0-11.0 10.0-14.2 10.0 2.0 Cotton 82.7 0.7-1.6 5.7 - 0.6 Palf 70-82 5-12 - - -
Note: wt.% total weight in percentage
Chapter 1. Literature review
BUI Thi Thu Huyen P a g e | 28
Fig. 1.1. Microstructure, schematic diagram and molecular structures of natural fibre [21].
Chapter 1. Literature review
BUI Thi Thu Huyen P a g e | 29
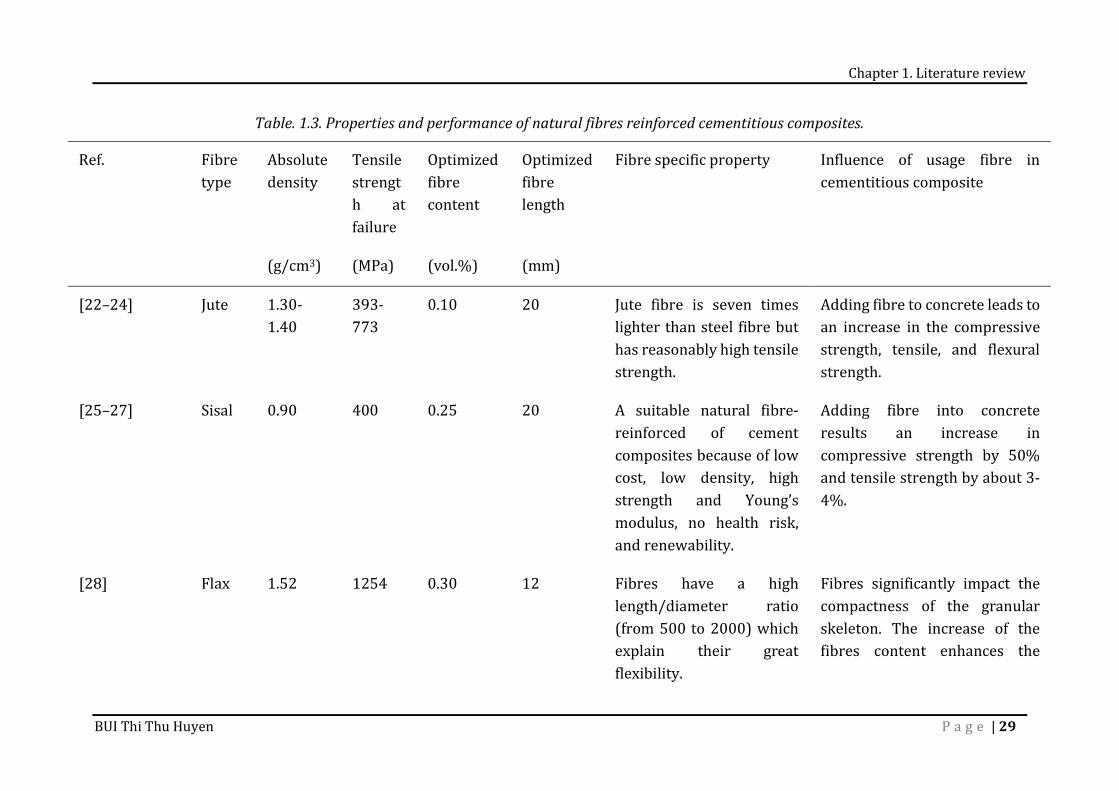
Table. 1.3. Properties and performance of natural fibres reinforced cementitious composites. Ref. Fibre type Absolute density Tensile strength at failure Optimized fibre content
Optimized fibre length Fibre specific property Influence of usage fibre in cementitious composite
(g/cm3) (MPa) (vol.%) (mm) [22–24] Jute 1.30-1.40 393-773 0.10 20 Jute fibre is seven times lighter than steel fibre but has reasonably high tensile strength. Adding fibre to concrete leads to an increase in the compressive strength, tensile, and flexural strength. [25–27] Sisal 0.90 400 0.25 20 A suitable natural fibre-reinforced of cement composites because of low cost, low density, high strength and Young’s modulus, no health risk, and renewability.
Adding fibre into concrete results an increase in compressive strength by 50% and tensile strength by about 3-4%. [28] Flax 1.52 1254 0.30 12 Fibres have a high length/diameter ratio (from 500 to 2000) which explain their great flexibility.
Fibres significantly impact the compactness of the granular skeleton. The increase of the fibres content enhances the
Chapter 1. Literature review
BUI Thi Thu Huyen P a g e | 30
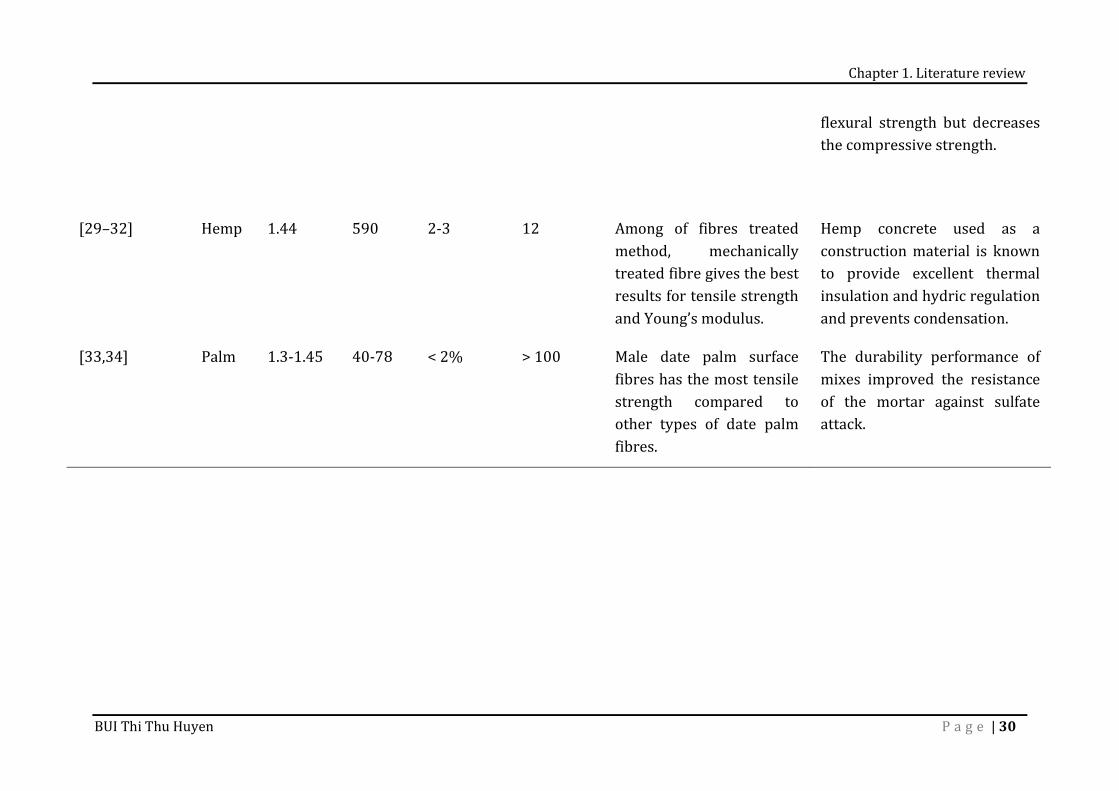
flexural strength but decreases the compressive strength. [29–32] Hemp 1.44 590 2-3 12 Among of fibres treated method, mechanically treated fibre gives the best results for tensile strength and Young’s modulus.
Hemp concrete used as a construction material is known to provide excellent thermal insulation and hydric regulation and prevents condensation. [33,34] Palm 1.3-1.45 40-78 < 2% > 100 Male date palm surface fibres has the most tensile strength compared to other types of date palm fibres. The durability performance of mixes improved the resistance of the mortar against sulfate attack.
Chapter 1. Literature review
BUI Thi Thu Huyen P a g e | 31
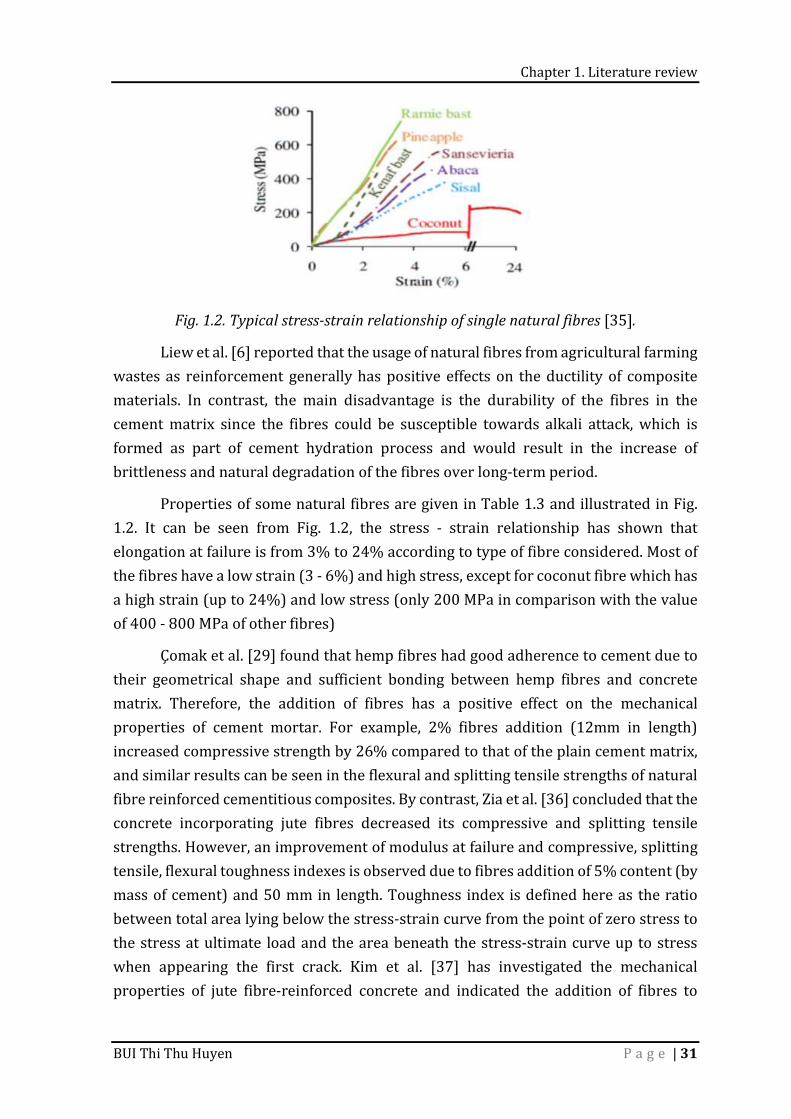
Fig. 1.2. Typical stress-strain relationship of single natural fibres [35]. Liew et al. [6] reported that the usage of natural fibres from agricultural farming wastes as reinforcement generally has positive effects on the ductility of composite materials. In contrast, the main disadvantage is the durability of the fibres in the cement matrix since the fibres could be susceptible towards alkali attack, which is formed as part of cement hydration process and would result in the increase of brittleness and natural degradation of the fibres over long-term period. Properties of some natural fibres are given in Table 1.3 and illustrated in Fig. 1.2. It can be seen from Fig. 1.2, the stress - strain relationship has shown that elongation at failure is from 3% to 24% according to type of fibre considered. Most of the fibres have a low strain (3 - 6%) and high stress, except for coconut fibre which has a high strain (up to 24%) and low stress (only 200 MPa in comparison with the value of 400 - 800 MPa of other fibres) Çomak et al. [29] found that hemp fibres had good adherence to cement due to their geometrical shape and sufficient bonding between hemp fibres and concrete matrix. Therefore, the addition of fibres has a positive effect on the mechanical properties of cement mortar. For example, 2% fibres addition (12mm in length) increased compressive strength by 26% compared to that of the plain cement matrix, and similar results can be seen in the flexural and splitting tensile strengths of natural fibre reinforced cementitious composites. By contrast, Zia et al. [36] concluded that the concrete incorporating jute fibres decreased its compressive and splitting tensile strengths. However, an improvement of modulus at failure and compressive, splitting tensile, flexural toughness indexes is observed due to fibres addition of 5% content (by mass of cement) and 50 mm in length. Toughness index is defined here as the ratio between total area lying below the stress-strain curve from the point of zero stress to the stress at ultimate load and the area beneath the stress-strain curve up to stress when appearing the first crack. Kim et al. [37] has investigated the mechanical properties of jute fibre-reinforced concrete and indicated the addition of fibres to
Chapter 1. Literature review
BUI Thi Thu Huyen P a g e | 32
concrete increase about 10% the compressive, flexural, and splitting tensile strengths of concrete compared to the one without fibres. Li et al. [25] used sisal fibre to reinforce cementitious materials and then evaluated the potential use of this composite. Their study concluded that although sisal fibres is an effective reinforcement of composites, the mechanical and physical properties of composites with fibres are very sensitive to processing methods, fibres length, fibres orientation, and fibres volume. Page et al. [28] incorporated 0.3% volume of flax fibres into concrete as reinforcement and indicated that the incorporation of short flax fibres reduced the workability of concrete. Even if the increase of the fibres content led to an increase of the flexural strength, a decrease of the compressive strength was still observed. In terms of thermal properties of natural fibres-reinforced composite, Binici et al. [12] revealed that the coefficients of thermal conductivity of natural fibres-reinforced composites are lower than the heat transfer coefficients of synthetic fibres one. They are more economical, do not harm the environment, and have better mechanical properties. Composite materials with natural fibres are thus an excellent candidate for building insulation materials thanks to their thermal insulation properties. The thermal conductivity of particleboards made from a mixture of coconut fibres and durian peels (ratio of 90:10 coconut fibres and durian peels by weight) is of 0.07W/m.K [38] and suitable to consider this material as a proper thermal insulator according to the review of Asdrubali et al. [39]. The thermal properties of material made with 40% of oil palm bunch fibres and phenol-formaldehyde showed a thermal conductivity of 0.293W/m.K and thermal diffusivity of 0.158 mm2/s, still remains high and not suitable for building insulation. This value was, however, obtained for a sample having only 40 % of natural fibres. The thermal conductivity of pure fibres is only 0.055W/m.K with the density of 100kg/m3 and can be considered as an insulation material. Sair et al. [40] suggested that the thermal conductivity properties of hemp fibres reinforced polyurethane composites is evidence of their application in the thermal insulation field. Polyurethane composites with fibres content from 5% to 30% reaches the maximum thermal conductivity of 0.048W/m.K. The study indicated that the introduction of hemp fibres into polyurethane matrix results in an increase in the thermal conductivity, it is also encouraged to use the hemp fibre for the sake of reducing the cost of polyurethane plates and ecological advantages. 1.2. Coconut fibre According to the report of Year of Natural Fibre (2009) [5], coconut fibre is one of the fifteen of the world's major plant and animal fibres. The application of coconut fibre has a long history. Coconut fibres-based products were introduced in late the 19th century, and now there is a wide range of products made from coconut fibres. More
Chapter 1. Literature review
BUI Thi Thu Huyen P a g e | 33
than 25 products could be made from coconut fibres like ropes, mattresses, brushes, geotextiles, and automobile seats and so on.
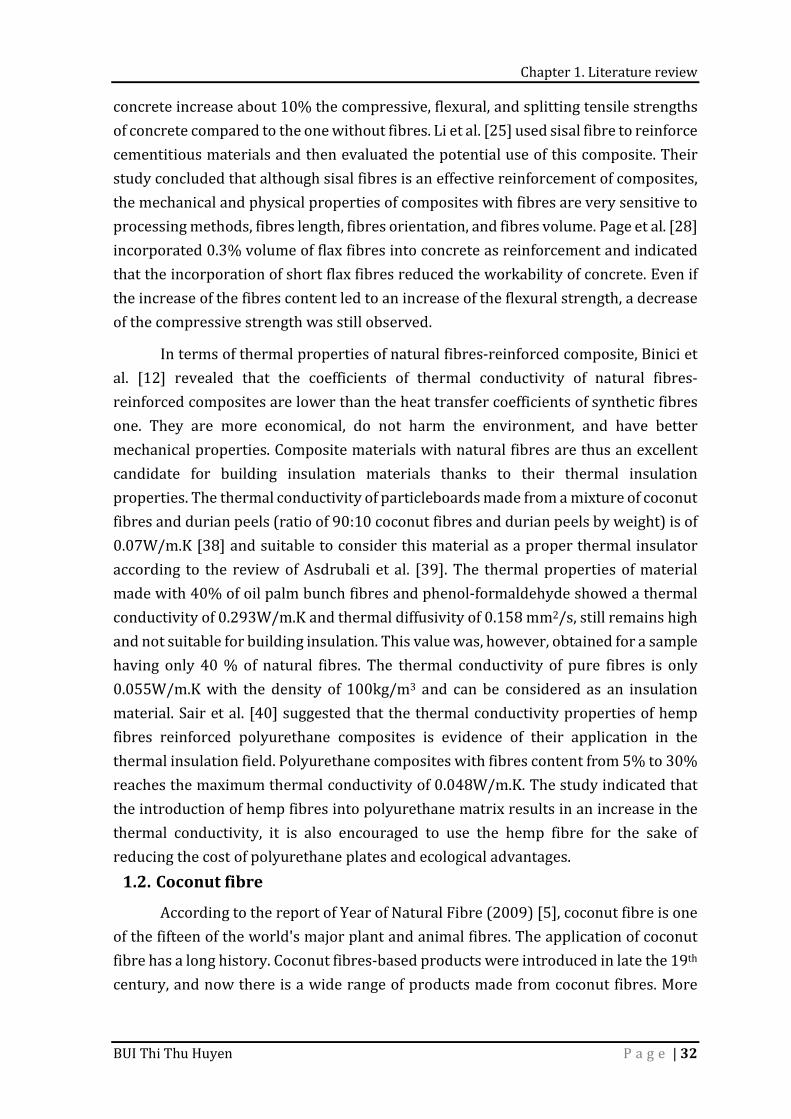
Fig. 1.3. Cross section of coconut fruit.
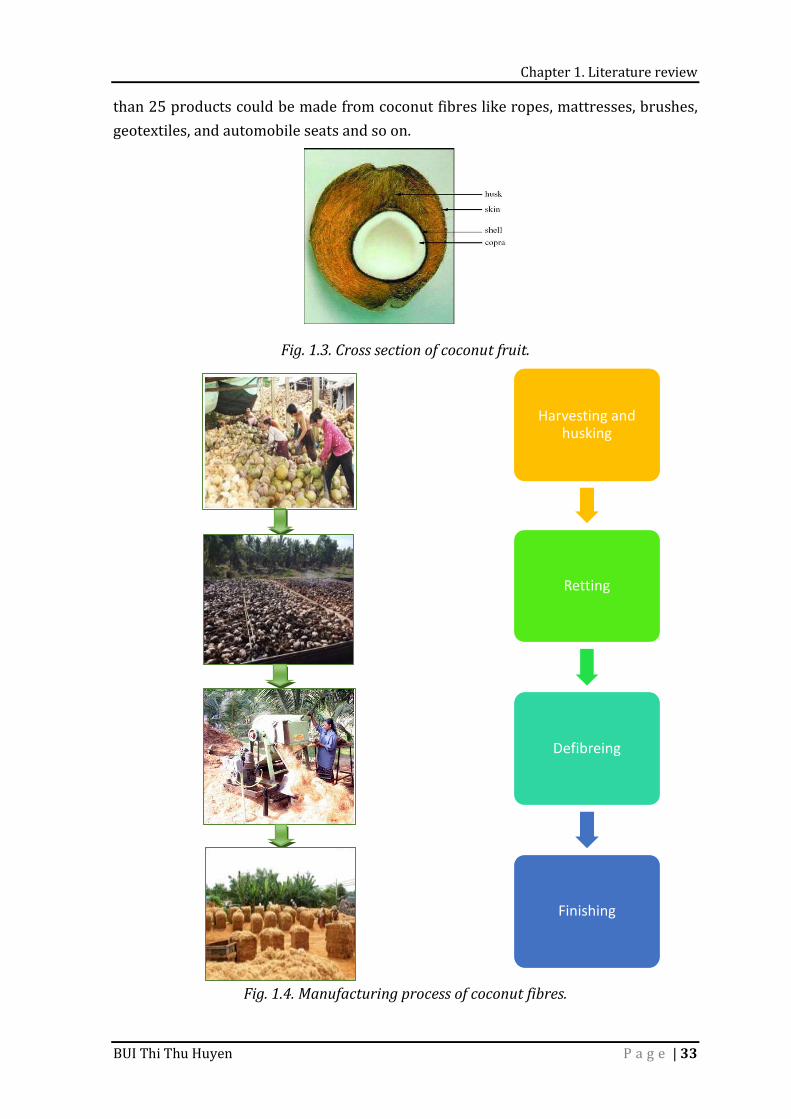
Fig. 1.4. Manufacturing process of coconut fibres.
Harvesting and husking
Retting
Defibreing
Finishing
Chapter 1. Literature review
BUI Thi Thu Huyen P a g e | 34
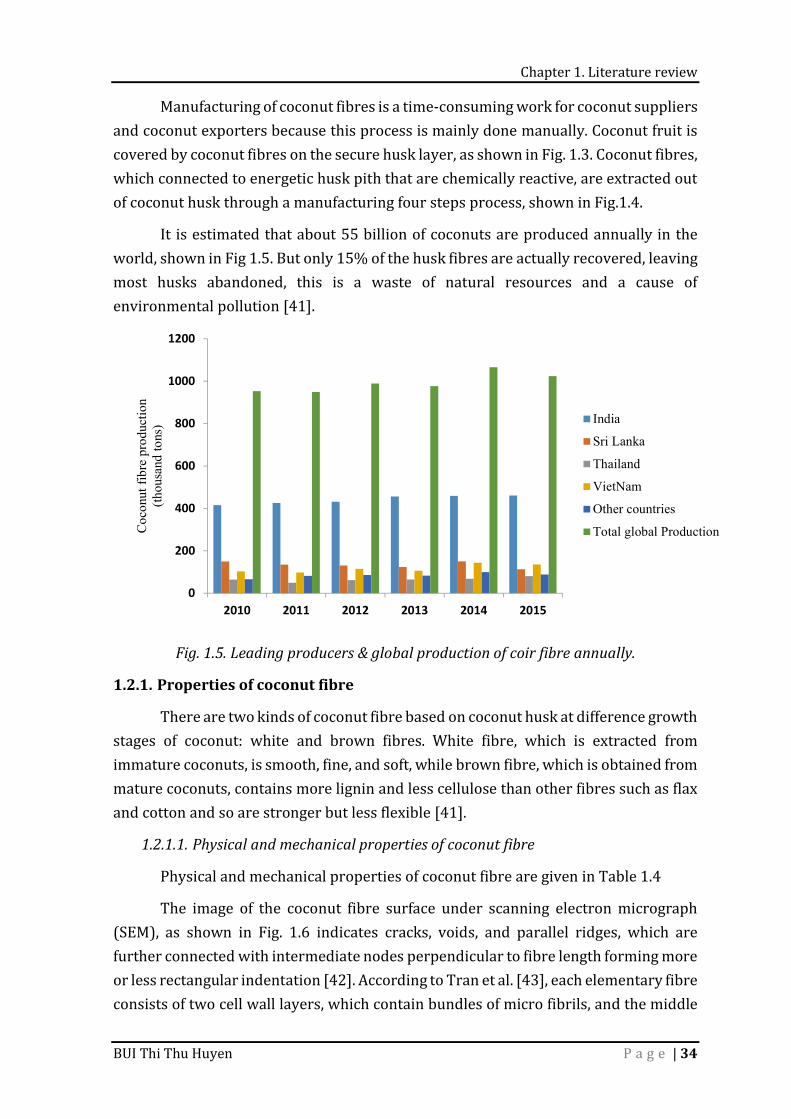
Manufacturing of coconut fibres is a time-consuming work for coconut suppliers and coconut exporters because this process is mainly done manually. Coconut fruit is covered by coconut fibres on the secure husk layer, as shown in Fig. 1.3. Coconut fibres, which connected to energetic husk pith that are chemically reactive, are extracted out of coconut husk through a manufacturing four steps process, shown in Fig.1.4. It is estimated that about 55 billion of coconuts are produced annually in the world, shown in Fig 1.5. But only 15% of the husk fibres are actually recovered, leaving most husks abandoned, this is a waste of natural resources and a cause of environmental pollution [41].
Fig. 1.5. Leading producers & global production of coir fibre annually.
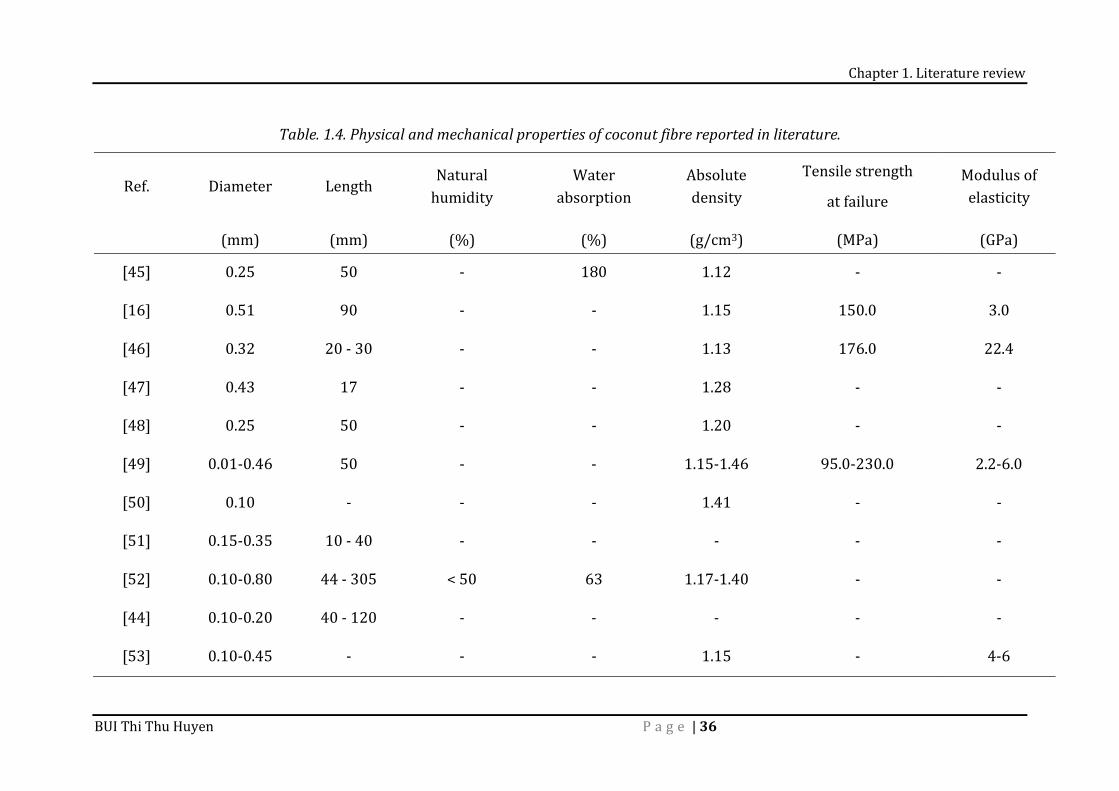
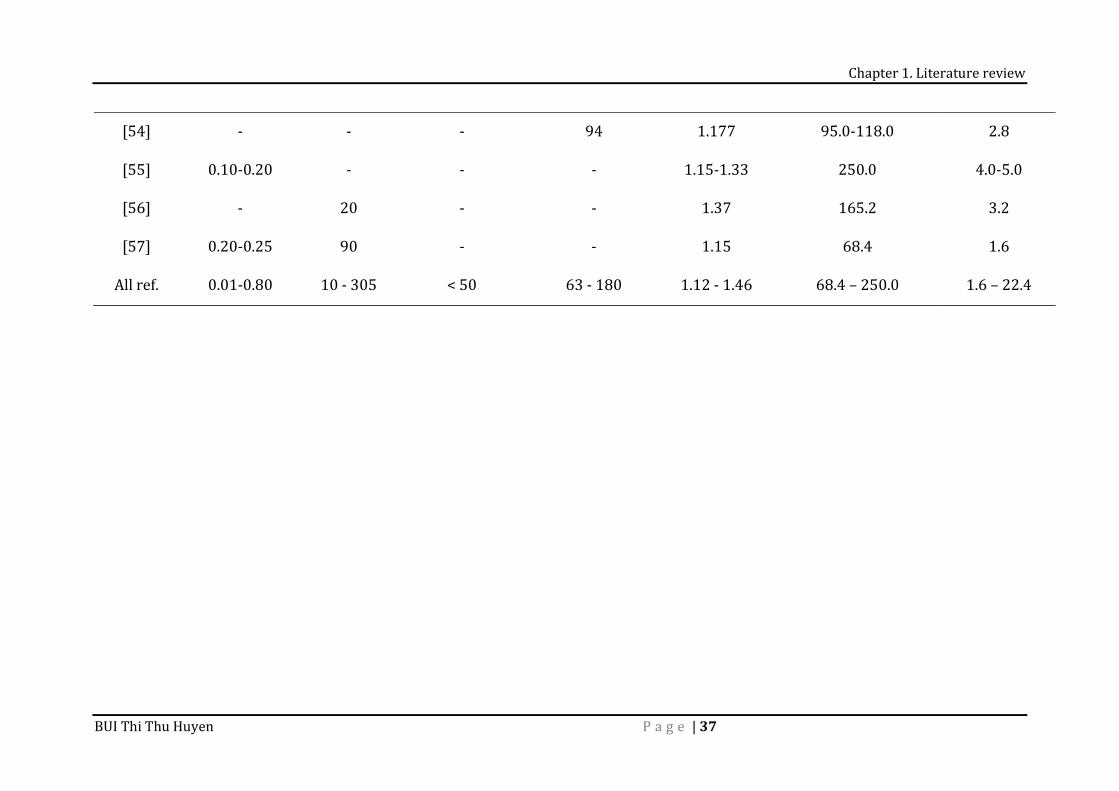
1.2.1. Properties of coconut fibre There are two kinds of coconut fibre based on coconut husk at difference growth stages of coconut: white and brown fibres. White fibre, which is extracted from immature coconuts, is smooth, fine, and soft, while brown fibre, which is obtained from mature coconuts, contains more lignin and less cellulose than other fibres such as flax and cotton and so are stronger but less flexible [41]. 1.2.1.1. Physical and mechanical properties of coconut fibre Physical and mechanical properties of coconut fibre are given in Table 1.4 The image of the coconut fibre surface under scanning electron micrograph (SEM), as shown in Fig. 1.6 indicates cracks, voids, and parallel ridges, which are further connected with intermediate nodes perpendicular to fibre length forming more or less rectangular indentation [42]. According to Tran et al. [43], each elementary fibre consists of two cell wall layers, which contain bundles of micro fibrils, and the middle
0
200
400
600
800
1000
1200
2010 2011 2012 2013 2014 2015
Coco
nut f
ibre
pro
duct
ion
(thou
sand
tons
) India
Sri Lanka
Thailand
VietNam
Other countries
Total global Production
Chapter 1. Literature review
BUI Thi Thu Huyen P a g e | 35
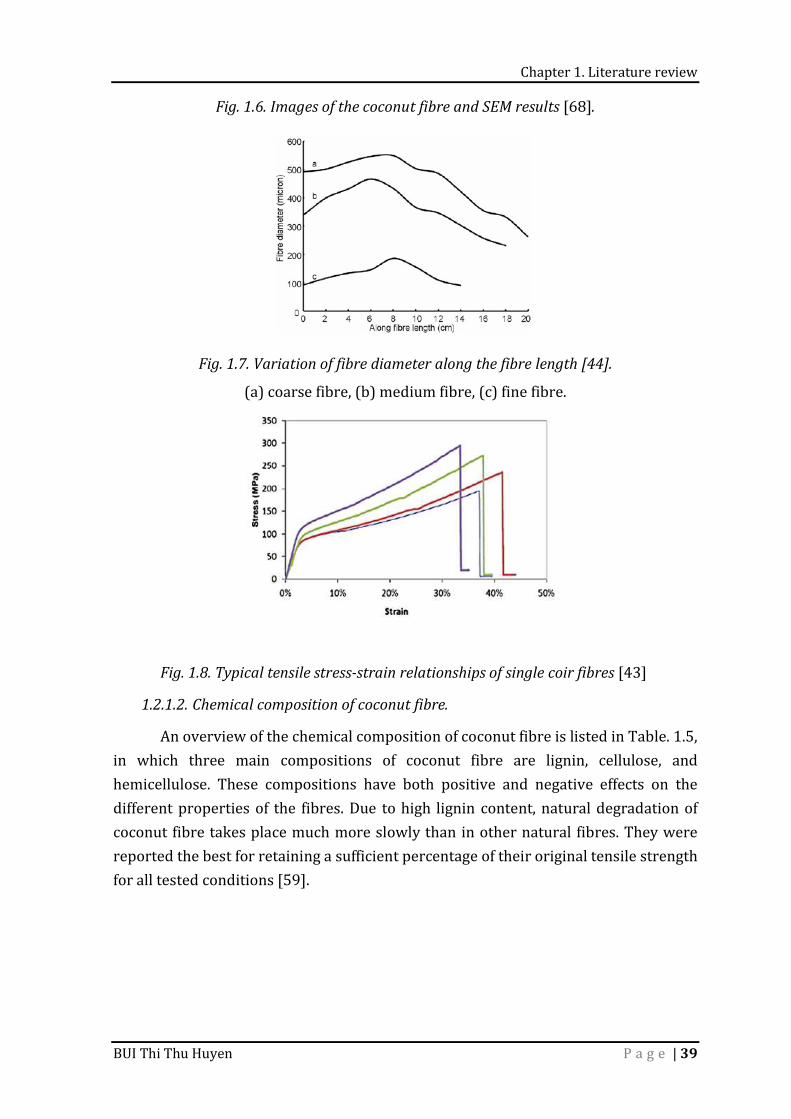
lamella glues elementary fibres together. Fig. 1.7 shows the variation of fibres diameter along the fibre length. The diameter of different fibres gradually increases from base to a mid-point and starts decreasing still the tip ends [44].
Chapter 1. Literature review
BUI Thi Thu Huyen P a g e | 36
Table. 1.4. Physical and mechanical properties of coconut fibre reported in literature.
Ref. Diameter Length Natural humidity Water absorption Absolute density Tensile strength at failure Modulus of elasticity (mm) (mm) (%) (%) (g/cm3) (MPa) (GPa) [45] 0.25 50 - 180 1.12 - - [16] 0.51 90 - - 1.15 150.0 3.0 [46] 0.32 20 - 30 - - 1.13 176.0 22.4 [47] 0.43 17 - - 1.28 - - [48] 0.25 50 - - 1.20 - - [49] 0.01-0.46 50 - - 1.15-1.46 95.0-230.0 2.2-6.0 [50] 0.10 - - - 1.41 - - [51] 0.15-0.35 10 - 40 - - - - - [52] 0.10-0.80 44 - 305 < 50 63 1.17-1.40 - - [44] 0.10-0.20 40 - 120 - - - - - [53] 0.10-0.45 - - - 1.15 - 4-6
Chapter 1. Literature review
BUI Thi Thu Huyen P a g e | 37
[54] - - - 94 1.177 95.0-118.0 2.8 [55] 0.10-0.20 - - - 1.15-1.33 250.0 4.0-5.0 [56] - 20 - - 1.37 165.2 3.2 [57] 0.20-0.25 90 - - 1.15 68.4 1.6 All ref. 0.01-0.80 10 - 305 < 50 63 - 180 1.12 - 1.46 68.4 – 250.0 1.6 – 22.4
Chapter 1. Literature review
BUI Thi Thu Huyen P a g e | 38
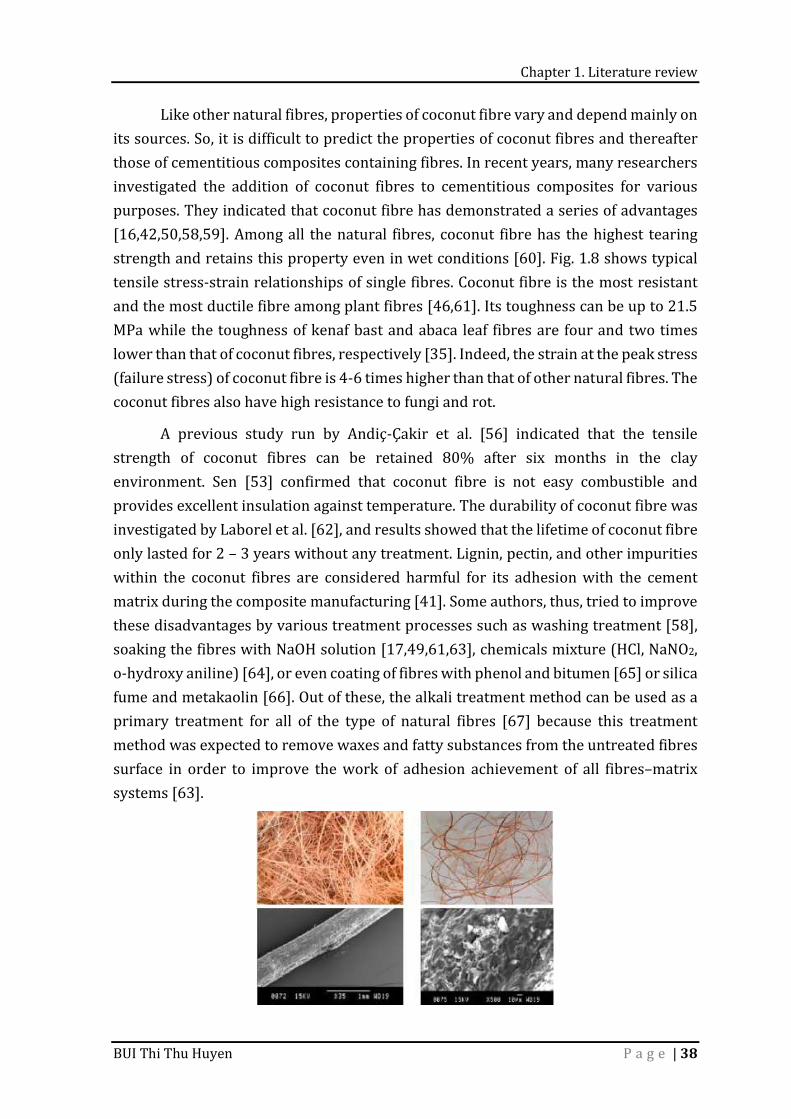
Like other natural fibres, properties of coconut fibre vary and depend mainly on its sources. So, it is difficult to predict the properties of coconut fibres and thereafter those of cementitious composites containing fibres. In recent years, many researchers investigated the addition of coconut fibres to cementitious composites for various purposes. They indicated that coconut fibre has demonstrated a series of advantages [16,42,50,58,59]. Among all the natural fibres, coconut fibre has the highest tearing strength and retains this property even in wet conditions [60]. Fig. 1.8 shows typical tensile stress-strain relationships of single fibres. Coconut fibre is the most resistant and the most ductile fibre among plant fibres [46,61]. Its toughness can be up to 21.5 MPa while the toughness of kenaf bast and abaca leaf fibres are four and two times lower than that of coconut fibres, respectively [35]. Indeed, the strain at the peak stress (failure stress) of coconut fibre is 4-6 times higher than that of other natural fibres. The coconut fibres also have high resistance to fungi and rot. A previous study run by Andiç-Çakir et al. [56] indicated that the tensile strength of coconut fibres can be retained 80% after six months in the clay environment. Sen [53] confirmed that coconut fibre is not easy combustible and provides excellent insulation against temperature. The durability of coconut fibre was investigated by Laborel et al. [62], and results showed that the lifetime of coconut fibre only lasted for 2 – 3 years without any treatment. Lignin, pectin, and other impurities within the coconut fibres are considered harmful for its adhesion with the cement matrix during the composite manufacturing [41]. Some authors, thus, tried to improve these disadvantages by various treatment processes such as washing treatment [58], soaking the fibres with NaOH solution [17,49,61,63], chemicals mixture (HCl, NaNO2, o-hydroxy aniline) [64], or even coating of fibres with phenol and bitumen [65] or silica fume and metakaolin [66]. Out of these, the alkali treatment method can be used as a primary treatment for all of the type of natural fibres [67] because this treatment method was expected to remove waxes and fatty substances from the untreated fibres surface in order to improve the work of adhesion achievement of all fibres–matrix systems [63].
Chapter 1. Literature review
BUI Thi Thu Huyen P a g e | 39
Fig. 1.6. Images of the coconut fibre and SEM results [68].
Fig. 1.7. Variation of fibre diameter along the fibre length [44]. (a) coarse fibre, (b) medium fibre, (c) fine fibre.
Fig. 1.8. Typical tensile stress-strain relationships of single coir fibres [43]
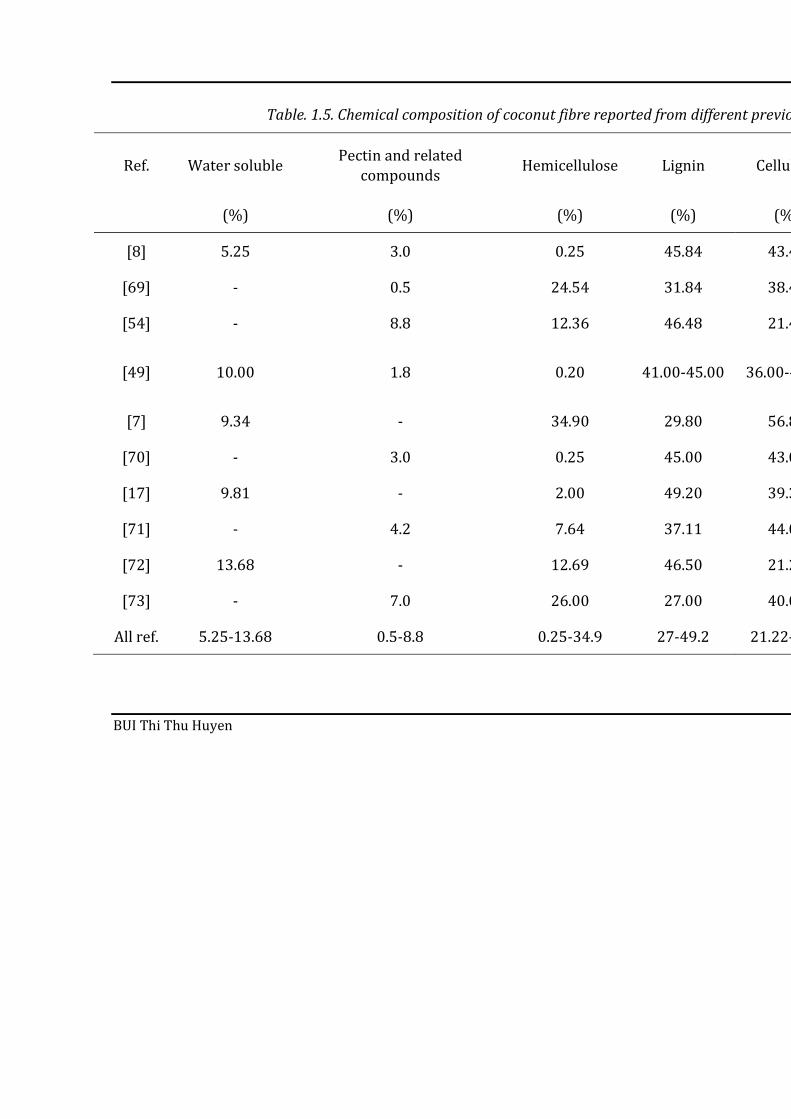
1.2.1.2. Chemical composition of coconut fibre. An overview of the chemical composition of coconut fibre is listed in Table. 1.5, in which three main compositions of coconut fibre are lignin, cellulose, and hemicellulose. These compositions have both positive and negative effects on the different properties of the fibres. Due to high lignin content, natural degradation of coconut fibre takes place much more slowly than in other natural fibres. They were reported the best for retaining a sufficient percentage of their original tensile strength for all tested conditions [59].
BUI Thi Thu Huyen
Table. 1.5. Chemical composition of coconut fibre reported from different previous
Ref. Water soluble Pectin and related compounds Hemicellulose Lignin Cellulose (%) (%) (%) (%) (%)[8] 5.25 3.0 0.25 45.84 43.44[69] - 0.5 24.54 31.84 38.4[54] - 8.8 12.36 46.48 21.46
[49] 10.00 1.8 0.20 41.00-45.00 36.00-43[7] 9.34 - 34.90 29.80 56.8[70] - 3.0 0.25 45.00 43.00[17] 9.81 - 2.00 49.20 39.3[71] - 4.2 7.64 37.11 44.06[72] 13.68 - 12.69 46.50 21.22[73] - 7.0 26.00 27.00 40.00All ref. 5.25-13.68 0.5-8.8 0.25-34.9 27-49.2 21.22-
Chapter 1. Literature review
BUI Thi Thu Huyen P a g e | 41
1.2.2. Properties of coconut fibre-reinforced cementitious composites
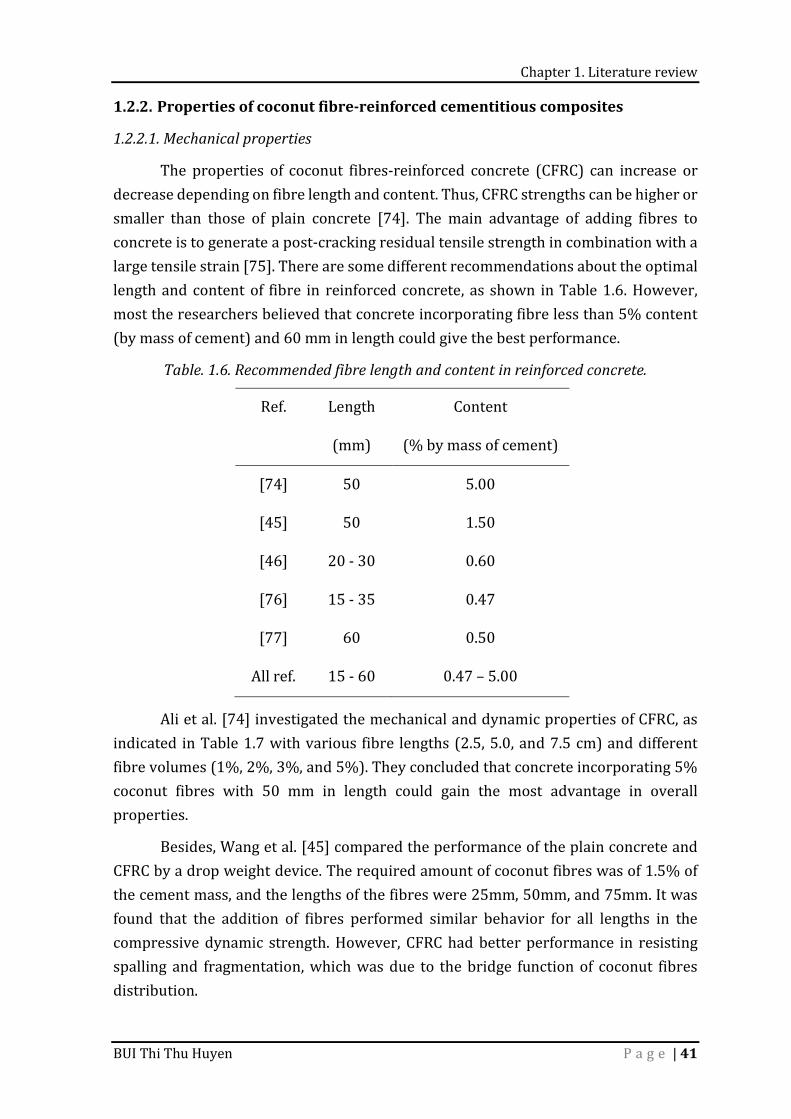
1.2.2.1. Mechanical properties The properties of coconut fibres-reinforced concrete (CFRC) can increase or decrease depending on fibre length and content. Thus, CFRC strengths can be higher or smaller than those of plain concrete [74]. The main advantage of adding fibres to concrete is to generate a post-cracking residual tensile strength in combination with a large tensile strain [75]. There are some different recommendations about the optimal length and content of fibre in reinforced concrete, as shown in Table 1.6. However, most the researchers believed that concrete incorporating fibre less than 5% content (by mass of cement) and 60 mm in length could give the best performance. Table. 1.6. Recommended fibre length and content in reinforced concrete. Ref. Length Content (mm) (% by mass of cement) [74] 50 5.00 [45] 50 1.50 [46] 20 - 30 0.60 [76] 15 - 35 0.47 [77] 60 0.50 All ref. 15 - 60 0.47 – 5.00 Ali et al. [74] investigated the mechanical and dynamic properties of CFRC, as indicated in Table 1.7 with various fibre lengths (2.5, 5.0, and 7.5 cm) and different fibre volumes (1%, 2%, 3%, and 5%). They concluded that concrete incorporating 5% coconut fibres with 50 mm in length could gain the most advantage in overall properties. Besides, Wang et al. [45] compared the performance of the plain concrete and CFRC by a drop weight device. The required amount of coconut fibres was of 1.5% of the cement mass, and the lengths of the fibres were 25mm, 50mm, and 75mm. It was found that the addition of fibres performed similar behavior for all lengths in the compressive dynamic strength. However, CFRC had better performance in resisting spalling and fragmentation, which was due to the bridge function of coconut fibres distribution.
Chapter 1. Literature review
BUI Thi Thu Huyen P a g e | 42
Ramli et al. [46] investigated the effects of aggressive environments on the strength and durability of CFRC. The experimental results proved that the fibres played a crucial role in restraining the development of cracks. The compressive and flexural strengths of the concrete containing fibres were improved by 13% and 9%, respectively, in comparison with unreinforced concrete. Generally, the negative effects caused by aggressive environments can be suppressed with fibres-reinforced concrete. This study recommended that the coconut fibres undergo treatment prior to its application in concrete protect it against natural degradation or it could be replaced with non-corrosive fibres. Sobuz et al. [76] investigated the physical and mechanical characteristics of concrete incorporating chopped coconut fibres with a different volume percentages of fibres 1.0, 3.0, 5.0, and 7.0. After 28 days of curing, the compressive strength of CFRC (at fibre level of 3%) is 18.85 MPa in comparison with 31.57 MPa that of plain concrete, and it satisfies the structural requirement of lightweight concrete. CFRC has shown a smaller number of crack developments and decreasing crack width. It has been concluded that coconut fibre has the potential to be used in the concrete to produce lightweight structural concrete. Ede et al. [77] studied the effect of coconut fibres on the compressive and flexural strength of concrete by destructive and non-destructive test methods with the fibres length of 60 mm and fibres diameter of 0.75mm. Result showed that the compressive strength of CFRC is increased with the increase of coconut fibres proportion up to 0.5% then gradually decreased from 0.75%. The percentage strength gained at 28 days for 0.25%, 0.5%, 0.75% and 1.0% fibres contents with respect to the control sample were 4.58%, 38.13%, 8.56% and -2.42%, respectively. The results for the flexural strength of concrete gained at 28 days for 0.25%, 0.5% and 1.0% of coconut fibres were 28.82%, 22.15%, and 0.42%, respectively. Yan et al. [49] studied the mechanical properties of fibre-reinforced cementitious composites. As shown in Table 1.8, compared with the plain concrete, coconut fibres (1% by mass of the cement) improved the compressive strength, modified stress-strain behavior, improved also flexural strength, deflection, fracture energy, i.e., energy at fracture from compressive test, which is the area under applied load to displacement curve, and flexural toughness, i.e., the energy equivalent to the area under load-deflection curve up to first-crack load of the concrete effectively. The increase in fracture energy and flexural toughness were 550% and 424%, respectively. The fibres treatment with 5 wt.% NaOH solution at 20°C during 30 min can further improve these properties of coconut fibres-reinforced cementitious composite.
Chapter 1. Literature review
BUI Thi Thu Huyen P a g e | 43
Hwang et al. [78] examined the effect of the addition of random short coconut fibres (an average 17 mm in length) for various cementitious composites on the mechanical properties, plastic cracking, and impact resistance of these composites. They noted that higher volume of coconut fibres in the mortar reduces the density of mortar. The addition of coconut fibres and higher water-to-binder ratio led to the lower compressive strength and higher absorption. The 28-day flexural strength of cementitious sheet and the modulus of failure increased from 5.2 to 7.4 MPa, and from 6.8 to 8.8 MPa with the coconut fibre-to-mortar ratios ranged from 0% to 4%, respectively.
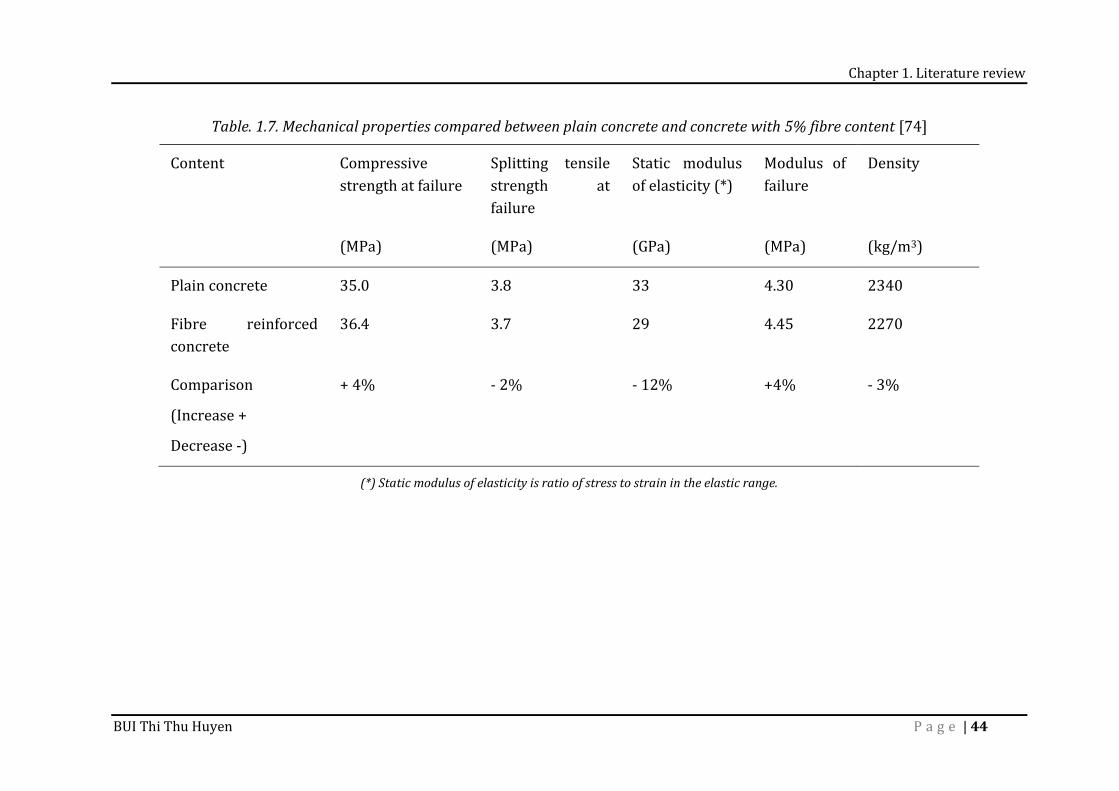
Chapter 1. Literature review
BUI Thi Thu Huyen P a g e | 44
Table. 1.7. Mechanical properties compared between plain concrete and concrete with 5% fibre content [74] Content Compressive strength at failure Splitting tensile strength at failure Static modulus of elasticity (*) Modulus of failure Density
(MPa) (MPa) (GPa) (MPa) (kg/m3) Plain concrete 35.0 3.8 33 4.30 2340 Fibre reinforced concrete 36.4 3.7 29 4.45 2270 Comparison (Increase + Decrease -)
+ 4% - 2% - 12% +4% - 3% (*) Static modulus of elasticity is ratio of stress to strain in the elastic range.

Chapter 1. Literature review
BUI Thi Thu Huyen P a g e | 45
Table. 1.8. Compressive and flexural properties of plain and fibre-reinforced concretes [49]. Type of concrete Compressive strength at failure Modulus of elasticity
Compressive strain at failure Energy absorption Flexural stress Fracture energy Flexural toughness (MPa) (GPa) (%) (N.m) (MPa) (N.m) Plain concrete 22.4 28.6 0.2 32.7 9.8 1.6 1.2 Coir fibre reinforced cementitious composite
23.8 (6.3%) 27.4 (-4.2%) 0.3 (45%) 54.5 (66.7%) 11.2 (14.2%) 10.4 (550%) 6.3 (424%) Treated coir fibre reinforced cementitious composite
24.0 (7.1%) 27.9 (-2.4%) 0.3 (70%) 58.4 (78.6%) 11.9 (21.4%) 11.3 (606%) 6.6 (449%) Note: in the brackets, the change due to coir fibres and treated coir fibres compared to the plain concrete specimen.
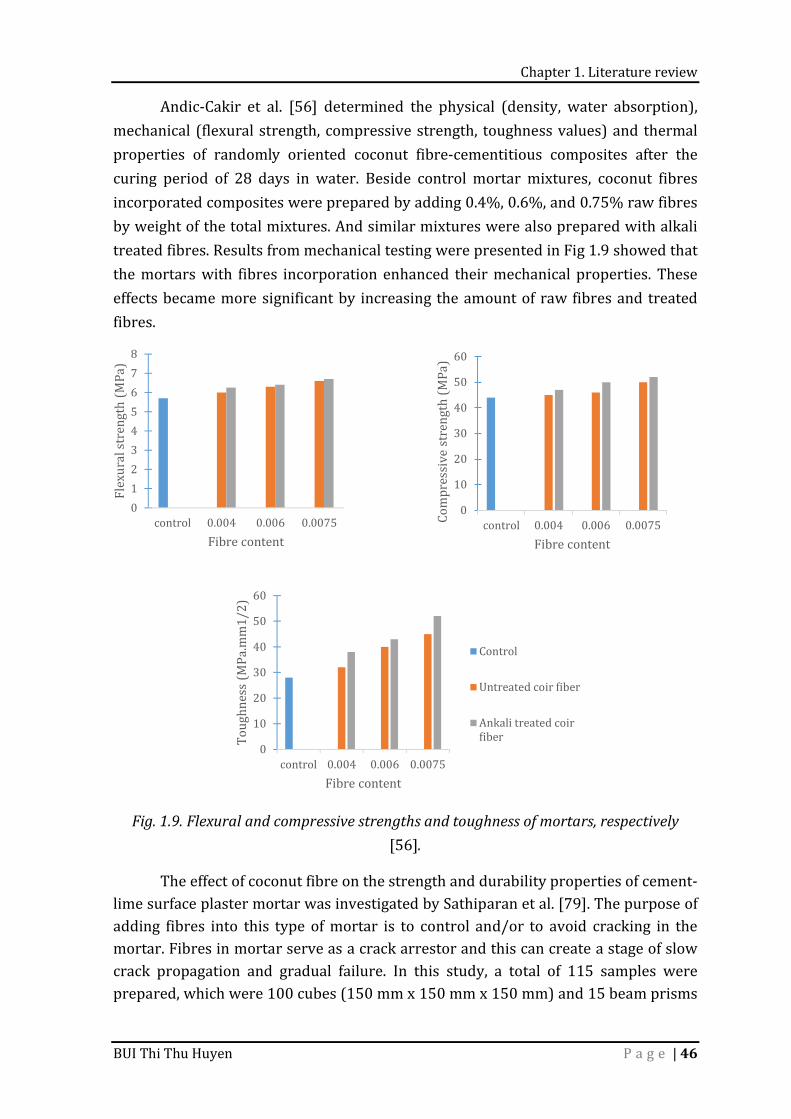
Chapter 1. Literature review
BUI Thi Thu Huyen P a g e | 46
Andic-Cakir et al. [56] determined the physical (density, water absorption), mechanical (flexural strength, compressive strength, toughness values) and thermal properties of randomly oriented coconut fibre-cementitious composites after the curing period of 28 days in water. Beside control mortar mixtures, coconut fibres incorporated composites were prepared by adding 0.4%, 0.6%, and 0.75% raw fibres by weight of the total mixtures. And similar mixtures were also prepared with alkali treated fibres. Results from mechanical testing were presented in Fig 1.9 showed that the mortars with fibres incorporation enhanced their mechanical properties. These effects became more significant by increasing the amount of raw fibres and treated fibres.
Fig. 1.9. Flexural and compressive strengths and toughness of mortars, respectively [56]. The effect of coconut fibre on the strength and durability properties of cement-lime surface plaster mortar was investigated by Sathiparan et al. [79]. The purpose of adding fibres into this type of mortar is to control and/or to avoid cracking in the mortar. Fibres in mortar serve as a crack arrestor and this can create a stage of slow crack propagation and gradual failure. In this study, a total of 115 samples were prepared, which were 100 cubes (150 mm x 150 mm x 150 mm) and 15 beam prisms
012345678
control 0.004 0.006 0.0075Flexural streng
th (MPa)
Fibre content 0102030405060
control 0.004 0.006 0.0075Compressive
strength (MPa
)
Fibre content
0102030405060
control 0.004 0.006 0.0075Toughness (M
Pa.mm1/2)
Fibre content
ControlUntreated coir fiberAnkali treated coirfiber
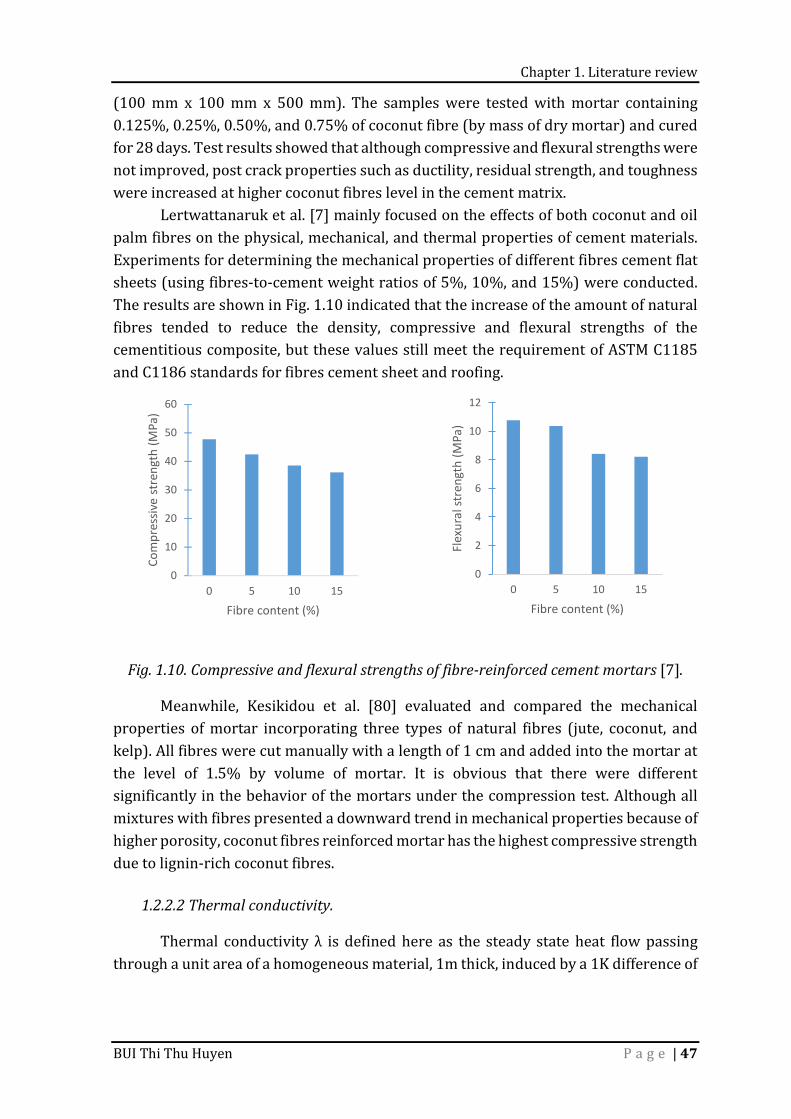
Chapter 1. Literature review
BUI Thi Thu Huyen P a g e | 47
(100 mm x 100 mm x 500 mm). The samples were tested with mortar containing 0.125%, 0.25%, 0.50%, and 0.75% of coconut fibre (by mass of dry mortar) and cured for 28 days. Test results showed that although compressive and flexural strengths were not improved, post crack properties such as ductility, residual strength, and toughness were increased at higher coconut fibres level in the cement matrix. Lertwattanaruk et al. [7] mainly focused on the effects of both coconut and oil palm fibres on the physical, mechanical, and thermal properties of cement materials. Experiments for determining the mechanical properties of different fibres cement flat sheets (using fibres-to-cement weight ratios of 5%, 10%, and 15%) were conducted. The results are shown in Fig. 1.10 indicated that the increase of the amount of natural fibres tended to reduce the density, compressive and flexural strengths of the cementitious composite, but these values still meet the requirement of ASTM C1185 and C1186 standards for fibres cement sheet and roofing.
Fig. 1.10. Compressive and flexural strengths of fibre-reinforced cement mortars [7]. Meanwhile, Kesikidou et al. [80] evaluated and compared the mechanical properties of mortar incorporating three types of natural fibres (jute, coconut, and kelp). All fibres were cut manually with a length of 1 cm and added into the mortar at the level of 1.5% by volume of mortar. It is obvious that there were different significantly in the behavior of the mortars under the compression test. Although all mixtures with fibres presented a downward trend in mechanical properties because of higher porosity, coconut fibres reinforced mortar has the highest compressive strength due to lignin-rich coconut fibres. 1.2.2.2 Thermal conductivity. Thermal conductivity λ is defined here as the steady state heat flow passing through a unit area of a homogeneous material, 1m thick, induced by a 1K difference of
0
10
20
30
40
50
60
0 5 10 15
Com
pres
sive
stre
ngth
(MPa
)
Fibre content (%)
0
2
4
6
8
10
12
0 5 10 15
Flex
ural
stre
ngth
(MPa
)
Fibre content (%)
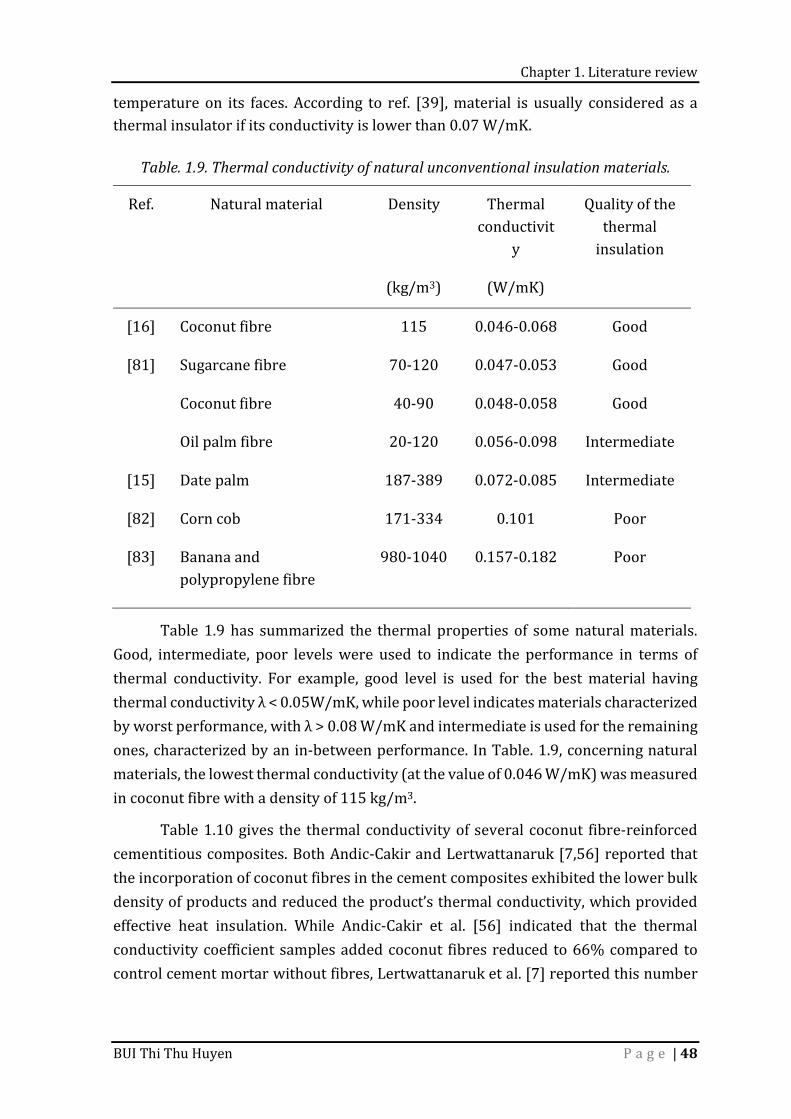
Chapter 1. Literature review
BUI Thi Thu Huyen P a g e | 48
temperature on its faces. According to ref. [39], material is usually considered as a thermal insulator if its conductivity is lower than 0.07 W/mK. Table. 1.9. Thermal conductivity of natural unconventional insulation materials. Ref. Natural material Density Thermal conductivity
Quality of the thermal insulation (kg/m3) (W/mK) [16] Coconut fibre 115 0.046-0.068 Good [81] Sugarcane fibre 70-120 0.047-0.053 Good Coconut fibre 40-90 0.048-0.058 Good Oil palm fibre 20-120 0.056-0.098 Intermediate [15] Date palm 187-389 0.072-0.085 Intermediate [82] Corn cob 171-334 0.101 Poor [83] Banana and polypropylene fibre 980-1040 0.157-0.182 Poor Table 1.9 has summarized the thermal properties of some natural materials. Good, intermediate, poor levels were used to indicate the performance in terms of thermal conductivity. For example, good level is used for the best material having thermal conductivity λ < 0.05W/mK, while poor level indicates materials characterized by worst performance, with λ > 0.08 W/mK and intermediate is used for the remaining ones, characterized by an in-between performance. In Table. 1.9, concerning natural materials, the lowest thermal conductivity (at the value of 0.046 W/mK) was measured in coconut fibre with a density of 115 kg/m3. Table 1.10 gives the thermal conductivity of several coconut fibre-reinforced cementitious composites. Both Andic-Cakir and Lertwattanaruk [7,56] reported that the incorporation of coconut fibres in the cement composites exhibited the lower bulk density of products and reduced the product’s thermal conductivity, which provided effective heat insulation. While Andic-Cakir et al. [56] indicated that the thermal conductivity coefficient samples added coconut fibres reduced to 66% compared to control cement mortar without fibres, Lertwattanaruk et al. [7] reported this number

Chapter 1. Literature review
BUI Thi Thu Huyen P a g e | 49
was only 7%. Besides, there is a difference between these two studies on the prediction tendency of the variation of thermal conductivity at the higher level of fibre. Andic-Cakir et al. [56] reported that the thermal conductivity values gradually increased with the increase of fibre content. By contrast, Lertwattanaruk et al. [7] concluded that the increase in fibre volume in the mix proportion led to higher porosity and lower bulk density of cement composites. A positive effect of decreasing bulk density is a lower thermal conductivity of fibre cement products leading to better thermal insulation. Similarly, it has frequently been shown [13,14,84,85] that the addition of fibres into the matrix resulted in a linear reduction in the density and a reduction in thermal conductivity and, therefore, a more insulating behavior of the material. This difference is explained by the sand content in these two studies. Ashour et al. [86] also proved that the thermal conductivity of all materials is decreased with the increase of fibre content or the addition of sand. The coconut fibres have more significant effect on the thermal conductivity than the sand content. The effect of coconut fibres length and pre-treatment on thermal conductivity of composites has been not reported in these studies.
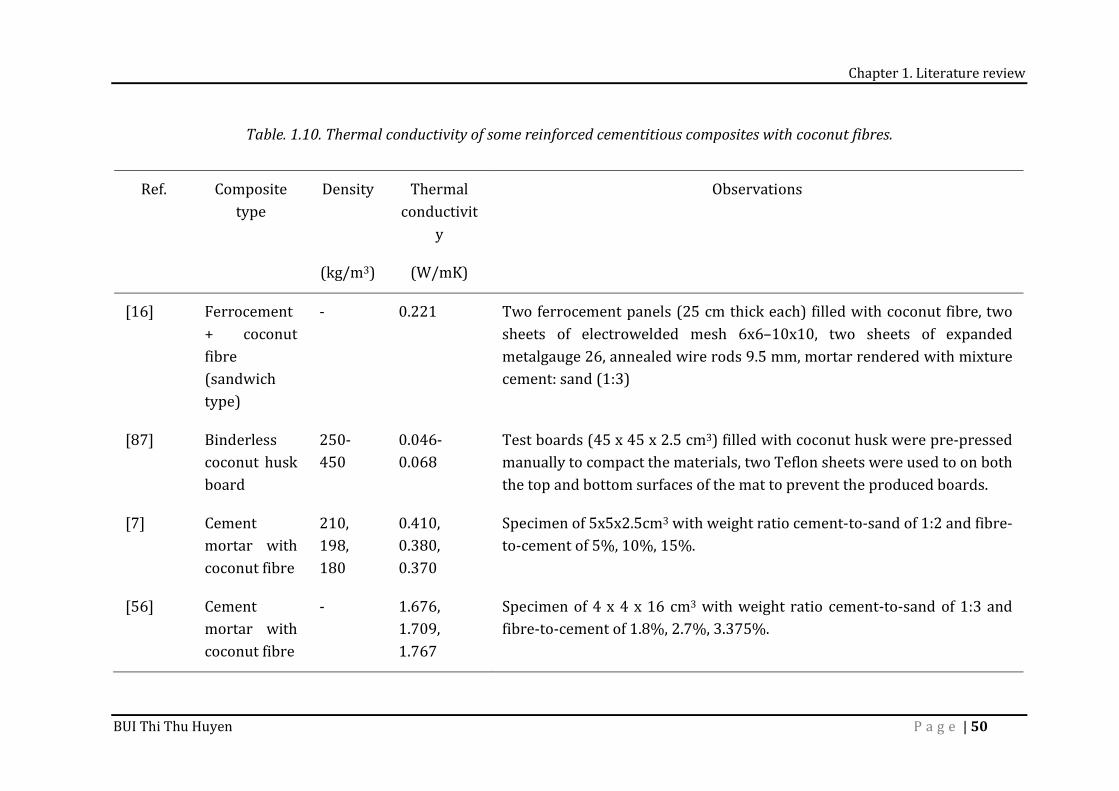
Chapter 1. Literature review
BUI Thi Thu Huyen P a g e | 50
Table. 1.10. Thermal conductivity of some reinforced cementitious composites with coconut fibres.
Ref. Composite type Density Thermal conductivity Observations
(kg/m3) (W/mK) [16] Ferrocement + coconut fibre (sandwich type) - 0.221 Two ferrocement panels (25 cm thick each) filled with coconut fibre, two sheets of electrowelded mesh 6x6–10x10, two sheets of expanded metalgauge 26, annealed wire rods 9.5 mm, mortar rendered with mixture cement: sand (1:3)
[87] Binderless coconut husk board 250-450 0.046-0.068 Test boards (45 x 45 x 2.5 cm3) filled with coconut husk were pre-pressed manually to compact the materials, two Teflon sheets were used to on both the top and bottom surfaces of the mat to prevent the produced boards. [7] Cement mortar with coconut fibre 210, 198, 180
0.410, 0.380, 0.370 Specimen of 5x5x2.5cm3 with weight ratio cement-to-sand of 1:2 and fibre-to-cement of 5%, 10%, 15%.
[56] Cement mortar with coconut fibre - 1.676, 1.709, 1.767
Specimen of 4 x 4 x 16 cm3 with weight ratio cement-to-sand of 1:3 and fibre-to-cement of 1.8%, 2.7%, 3.375%.
Chapter 1. Literature review
BUI Thi Thu Huyen P a g e | 51
The coconut fibres filled roofing can be used as an insulating material for house living with a lower thermal conductivity than conventional building materials [16] and a decrement factor of 43% (thermal damping) compared to ferrocement-only precast roofing channel [88]. Thus, fibres filled precast roofing can provide an ecological alternative for energy-saving and thermal comfort. 1.2.3. The effect of distribution and orientation of fibres in the composite materials To effectively control the cracking process, it is important to know how the location and orientation of fibres in matrix. Different approaches, from simple to cutting-edge technologies, including both destructive and non-destructive, have been conducted by many researchers to determine the orientation and distribution of fibres such as manual counting [89], numerical simulation [90], the usage of ERICKA software based on Mori and Tanaka model [91]. Moreover, image analysis technique [92], or some modelling methods coupled with radiography [93], confocal laser scanning microscopy CLSM [94,95], optical and tomographic applications [96] were also used. Recently, a new method using computed tomography CT, which was originally developed for medical application, has been applied as a useful tool for determining characteristics of composites in building construction [97–101]. This approach offers possibilities of microstructural analysis without any destruction for producing images. Dupont et al. [102] predicted the total number of fibre (both effective and non-effective) crosses a crack section by using the theoretical calculation of an orientation factor. The ratio between the fibres’ average projected length on the axis normal to a cross-section and the total length of fibre is considered as an orientation factor. For the sake of prediction, the fibre numbers in a cut cross-section, a comparison between calculation and experiment to acquire the number of fibres was made on 107 prismatic specimens with a coefficient of variation of 36%. The results showed that this model provided a sufficiently accurate prediction of the number of fibres in the cut surface. Gettu et al. [103] cut specimens according to main directions and counted fibres crossing in a cut surface. It has been statistically shown that the density of fibres in the plane, which is perpendicular to the filling direction, was 0.27 fibre/cm2. In the two other planes, which are parallel to the filling direction, this value was nearly double with 0.51 fibre/cm2 and 0.52 fibre/cm2, respectively. Based on the experimental results, they concluded that this method suits to appraise the distribution and orientation of fibres. Many attempts [104–110] have been made to investigate the influence of distribution and orientation of fibres on mechanical properties of composite. Among others, Laranjeira et al. [105] stated that composite inclusion of jute fibres in
Chapter 1. Literature review
BUI Thi Thu Huyen P a g e | 52
longitudinal direction seems to give significantly better results in tensile behavior than transverse fibres due to the extreme sensitivity of fibre-matrix adhesion. Nevertheless, randomly oriented fibre-reinforced composites provide intermediate results between those of longitudinal and transverse fibres. They also concluded that final composite properties mainly depended on both fibres orientation and fibres length and content. Yoo et al. [104] evaluated the influence of fibres orientation on flexural behavior of steel fibre-reinforced concrete by using image analysis during mechanical and impact tests. They indicated that placing fresh concrete at endpoint of the mould and granting it to flow freely could give better fibre orientation due to the higher density of fibres compared to pouring fresh concrete in all mould locations. A better fibre orientation can lead to higher flexural strengths, toughness, and energy absorption capacity, as shown by the drop-weight impact test. On the other hand, the fibre orientation has a negligible effect on the first-cracking properties under static loading. According to Sebaibi et al.[111], the rheology of material and the fibre content have significant effects on the behavior of uniaxial tensile strength due to the obstacles of fibres on the granular arrangement of reinforced concrete. 1.2.4. Cracking behavior of fibre reinforced composite materials Even if the improvement of compressive and flexural strengths of fibre-reinforced composites is not always observed, fibres would contribute as a crack-arrester that restricts the development of crack in composite as noticed in wide-ranging previous studies [11,27,79,112–114]. However, in order to control cracking behavior effectively, it is essential to know how displacement and strain fields in mortar specimens evolve during mechanical testing. In recent years, digital image correlation (DIC) method, offering a non-contact and high precise deformation determination solution for materials and product testing, is available and applied [115–117]. Notice that this method also offers measurement accuracy applied for different types of materials such as ceramics [117], soils [118], cementitious matrices [119,120], film [121], asphalt concrete [122], woods [123] or even sloshing liquids [124]. It seems to be the best option for conventional strain and deformation measurements because DIC method enables accuracy and precision even in the case of cementitious matrices that are considered as the various heterogeneous materials. Based on the DIC results of flexural behavior of lightweight ferrocement slab panels, several researchers [125,126] have confirmed the relevance of DIC approach for being applicable in deformation and strain fields determination. Concerning mechanical testing, the applicability of tensile and bending tests to fibres-reinforced composite materials with strain hardening and/or strain softening response has been observed on synthetic fibres-based composite. The three-point flexural test does not suit for
Chapter 1. Literature review
BUI Thi Thu Huyen P a g e | 53
fibre-reinforced composite when multiple cracks appeared around the part of the notch. However, the four-point flexural test can be used when specimen as a beam whose length is more than three times higher than its height to limit the effect of shear deformation on the bending test results [126]. 1.2.5. Durability of fibre reinforced composite materials
1.2.5.1. Carbonation resistance Significant reduction in the long-term mechanical performance has been observed and identified in natural fibre-reinforced composite in aging due to deterioration of the incorporated natural fibres under cementitious environment [21,46,127]. In recent years, carbonation is well indicated to achieve mitigation of degradation of natural fibres and improve the durability of fibre-based cement composite [20,128–131]. In nature, the reaction between carbon dioxide CO2 and cementitious composites based on cement occurs very slowly due to the CO2-poor environment, ranging from 0.03-0.04 % [132,133]. Therefore, it takes at least one year in accordance with XP P 18-458 French standard or even four years [134] to investigate the effect of carbonation on resistance of such composites. Experimentally, to enable the carbonation process, accelerated carbonation is highly recommended to significantly decrease time period of carbonation curing [135]. This method consists in creating an environment in which the concentration of CO2 is considerably higher than natural environment with selected experimental conditions, i.e., environmental conditions. As ambient environmental conditions, concentration of CO2, relative humidity RH, temperature, and duration of exposure as well play a crucial role in the carbonation process and have significant effects on the carbonation of cementitious composite samples. Parameters considered in previous studies on accelerated carbonation are listed in Table 1.11 with their experimental conditions and objectives.
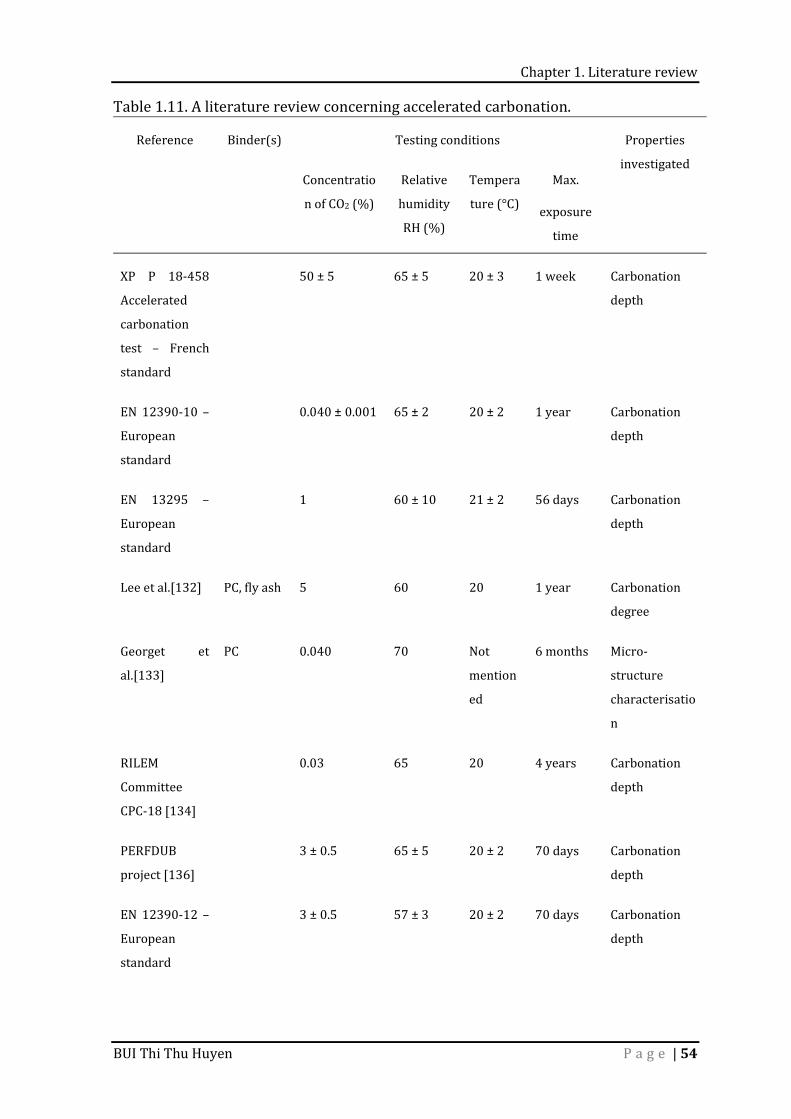
Chapter 1. Literature review
BUI Thi Thu Huyen P a g e | 54
Table 1.11. A literature review concerning accelerated carbonation. Reference Binder(s) Testing conditions Properties investigated Concentration of CO2 (%) Relative humidity RH (%) Temperature (°C) Max. exposure time
XP P 18-458 Accelerated carbonation test – French standard
50 ± 5 65 ± 5 20 ± 3 1 week Carbonation depth
EN 12390-10 – European standard 0.040 ± 0.001 65 ± 2 20 ± 2 1 year Carbonation depth
EN 13295 – European standard 1 60 ± 10 21 ± 2 56 days Carbonation depth
Lee et al.[132] PC, fly ash 5 60 20 1 year Carbonation degree Georget et al.[133] PC 0.040 70 Not mentioned
6 months Micro-structure characterisation RILEM Committee CPC-18 [134]
0.03 65 20 4 years Carbonation depth PERFDUB project [136] 3 ± 0.5 65 ± 5 20 ± 2 70 days Carbonation depth EN 12390-12 – European standard
3 ± 0.5 57 ± 3 20 ± 2 70 days Carbonation depth
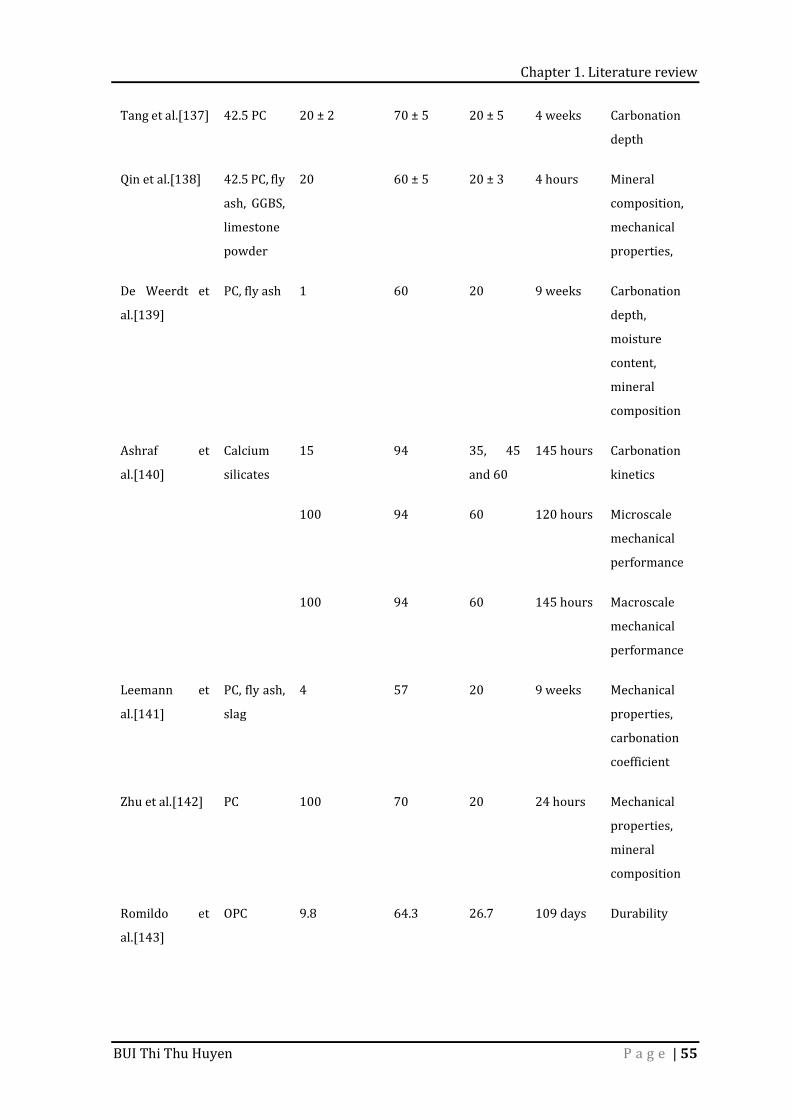
Chapter 1. Literature review
BUI Thi Thu Huyen P a g e | 55
Tang et al.[137] 42.5 PC 20 ± 2 70 ± 5 20 ± 5 4 weeks Carbonation depth Qin et al.[138] 42.5 PC, fly ash, GGBS, limestone powder
20 60 ± 5 20 ± 3 4 hours Mineral composition, mechanical properties, De Weerdt et al.[139] PC, fly ash 1 60 20 9 weeks Carbonation depth, moisture content, mineral composition Ashraf et al.[140] Calcium silicates 15 94 35, 45 and 60 145 hours Carbonation kinetics
100 94 60 120 hours Microscale mechanical performance 100 94 60 145 hours Macroscale mechanical performance
Leemann et al.[141] PC, fly ash, slag 4 57 20 9 weeks Mechanical properties, carbonation coefficient Zhu et al.[142] PC 100 70 20 24 hours Mechanical properties, mineral composition Romildo et al.[143] OPC 9.8 64.3 26.7 109 days Durability
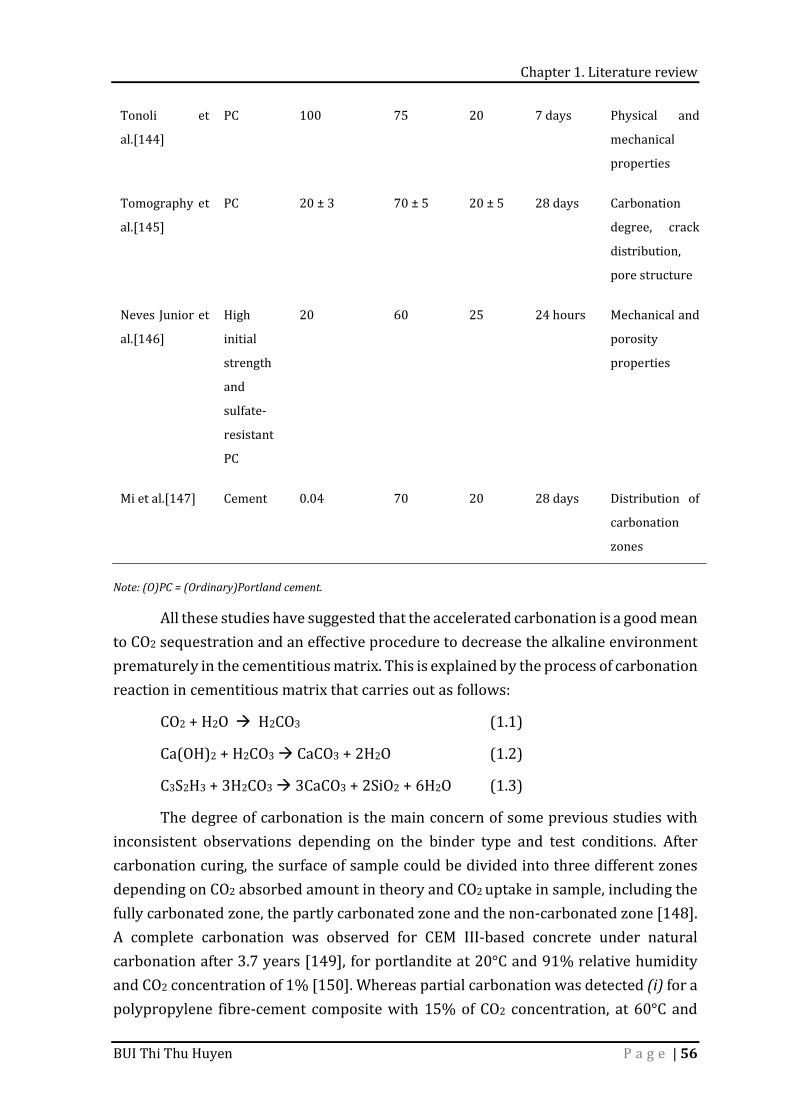
Chapter 1. Literature review
BUI Thi Thu Huyen P a g e | 56
Tonoli et al.[144] PC 100 75 20 7 days Physical and mechanical properties Tomography et al.[145] PC 20 ± 3 70 ± 5 20 ± 5 28 days Carbonation degree, crack distribution, pore structure Neves Junior et al.[146] High initial strength and sulfate-resistant PC
20 60 25 24 hours Mechanical and porosity properties
Mi et al.[147] Cement 0.04 70 20 28 days Distribution of carbonation zones Note: (O)PC = (Ordinary)Portland cement. All these studies have suggested that the accelerated carbonation is a good mean to CO2 sequestration and an effective procedure to decrease the alkaline environment prematurely in the cementitious matrix. This is explained by the process of carbonation reaction in cementitious matrix that carries out as follows: CO2 + H2O H2CO3 (1.1) Ca(OH)2 + H2CO3 CaCO3 + 2H2O (1.2) C3S2H3 + 3H2CO3 3CaCO3 + 2SiO2 + 6H2O (1.3) The degree of carbonation is the main concern of some previous studies with inconsistent observations depending on the binder type and test conditions. After carbonation curing, the surface of sample could be divided into three different zones depending on CO2 absorbed amount in theory and CO2 uptake in sample, including the fully carbonated zone, the partly carbonated zone and the non-carbonated zone [148]. A complete carbonation was observed for CEM III-based concrete under natural carbonation after 3.7 years [149], for portlandite at 20°C and 91% relative humidity and CO2 concentration of 1% [150]. Whereas partial carbonation was detected (i) for a polypropylene fibre-cement composite with 15% of CO2 concentration, at 60°C and
Chapter 1. Literature review
BUI Thi Thu Huyen P a g e | 57
with 90% relative humidity [151], (ii) for an autoclaved aerated concrete under conditions of 20°C, 90% relative humidity and 3% of CO2 after 20 days [152] or (iii) for OPC-based concrete with the conditions of 23°C, 70% relative humidity and 20% of CO2 within 16 weeks [146]. Several methods for the measurement of carbonation depth are applied, from simple to cutting-edge technology methods. However, the traditional and most popular parameter used to measure carbonation depth is the use of a suitable indicator [153]. Some reagent solutions were highly recommended like phenolphthalein [154,155] or thymolphthalein [132,156]. These indicators are sprayed on the tested surface of samples. The change of the pH value in samples leads to the change in colour of the indicator. But more recent conclusions [157,158] believed that even when the reduction of the pH value due to the carbonation process could be made visible clearly by the colour change of phenolphthalein pH reagent, that area can still be considered as only underwent partial carbonation. Therefore, in order to limit the drawbacks of the reagent solution, it is necessary to use simultaneously other methods for improving the accuracy of carbonation depth measurement. Some methods were suggested in previous studies such as thermogravimetric analysis [128,138,139,159], images analyses [145,160], X-ray diffraction [148,150], infrared spectroscopy [150] or using fibre optic chemical sensors [161]. Among them, digital image analysis was believed to be the most quickly and inexpensive technique for determining maximum carbonation depth [162]. Among accelerated carbonation testing conditions, the CO2 concentration is considered as the main factor for the laboratory carbonation test [153,163]. It should be noted that CO2 concentration is the largest difference between natural and accelerated carbonation conditions, inducing the laboratory process used to replace natural carbonation. With the CO2 concentration of under 5%, Neves et al. [164] have found that a linear relationship between carbonation depth and CO2 concentration was observed. Otherwise, when the CO2 concentration was beyond 5%, this relation differed significantly since the carbonation depth - CO2 concentration curve could be described by a square root function [165]. Moreover, Auroy et al. [166] reported that 3% CO2 concentration was the most suitable content for accelerated carbonation in the laboratory to investigate and compare the consequences of the natural environment and accelerated carbonation on the properties of cementitious matrix. Statistically, most of the research were done with relative humidity range of 50 - 75 %, for which it is believed to get a higher carbonation rate [150,167,168]. The only exception is reported by Ashraf et al. [140] that applied at relative humidity level of 94% due to the short exposure time, i.e. approximatively six days. Ceukelaire et al. [167]
Chapter 1. Literature review
BUI Thi Thu Huyen P a g e | 58
investigated the role of relative humidity condition in the carbonation process of concrete by using a wide range of different relative humidity levels from 40 to 90 % with increment of 10%. They indicated that the carbonation resistance increases with the increase of relative humidity levels. In detail, with relative humidity of 50%, a maximal rate of carbonation was obtained, expressed by maximal carbonation depth of 8.5 mm after 21 days exposure in 10 % CO2 while only 1.4 mm was recorded for the same time exposure in natural carbonation. Otherwise, these values with the relative humidity level of 90% dropped to only 4.9 mm and 0.5 mm for accelerated and natural carbonations, respectively. The presence and abundance of free water caused by high relative humidity could diminish the rate of CO2 diffusion and lead to the slow carbonation rate [169]. As well as, Elsalamawy et al. [168] reported that relative humidity and carbonation depth relationship corresponds to a polynomial function, showing a carbonation depth peak obtained with an approximately relative humidity of 65% for all four samples tested, regardless of the types of cement and water/cement ratio used. This seems to be corroborated by the result in ref.[170] which found that the highest carbonation rate reaches at the level of relative humidity of 65%, proving the ability of increase rate of carbonation process in moderately saturated moisture condition. Meanwhile in the study of Weerdt et al. [156], a higher carbonation rate was observed in mortar based on Portland-fly ash cement (30 wt.% fly ash) compared to Portland cement-based mortar at the same controlled conditions. The observed increase in carbonation rate could be interpreted as being a result of the fly ash reaction leading to the reduction of portlandite and formation of mono-carbonate which makes lower pH value in Portland-fly ash cement-based mortar [171,172]. The dependence of water/binder ratio on the carbonation degree was also investigated in literature [132,173]. The increase in water/binder ratio enhances carbonation depth for all the types of binder used. A higher ratio of water/binder provokes the formation of larger pores that contributes to carbon ion penetration deeply into sample. This is a convenient environment to promote the accelerated carbonation process. Concerning the relationship between the mechanical strength and accelerated carbonation of composites, the carbonation process could make the compressive strength of cementitious matrix higher in comparison with the samples cured under natural conditions whatever the types of added minerals, especially at the early age [174]. This is mainly owing to the formation of CaCO3 from the transformation of calcium hydroxide Ca(OH)2 that fills pores to mitigate the porosity in the cementitious matrix. These results provided additional support for previous findings in the literature [175–179]. In contrast, some other studies [146,158,168,170,173,180] believed that the compressive strength of the cementitious composite was decreased
Chapter 1. Literature review
BUI Thi Thu Huyen P a g e | 59
at the higher carbonation degree levels. They believed that the reduction of the pH value during CO2 curing process has negative effects on the reinforcement and leads to decrease in the mechanical performance of composite. The carbonation process causes a structural change in the CSH phase of cementitious composite, which could induce both the increase in strength and carbonation cracking. This complicated change leads to the prediction effects of carbonation on the mechanical performance of cementitious materials become very difficult [181]. Regarding thermogravimetric analysis, several studies [130,182] also confirmed that when samples are subjected to the carbonation process, the conversion of Ca(OH)2 into CaCO3 could result in mitigation of the pore size in the cementitious system. Therefore, at higher carbonation degree levels, samples show better resistance to high temperature due to the change in microstructure of the carbonated sample. For instance, the amount of Ca(OH)2 diminishes as the quantity of CaCO3 enlarges along the carbonation process and decreases the porosity of composite. Additionally, the disintegration of Ca(OH)2 occurs at the temperature range from 450°C to 550°C while the weight loss at the temperature above 550°C only concerns CaCO3. The reaction of Ca(OH)2 to acquire CaCO3 could lead to the reduction in alkalinity of the cementitious composite, creates a less aggressive environment to protect natural fibres in better condition [143]. Therefore, thermal and chemical stabilities are considered as two main advantages of carbonated products. 1.2.5.2. Wetting and drying cycle The weathering change is one of the most penalizing external actions for the long-term properties of reinforced-composite materials. Therefore, many attempts [127,183–186] have been made to investigate the weathering effects on the reinforced-composites for long-term structural applications because most of these materials are applied for outdoor construction activities. Several former studies showed that when natural fibres are incorporated, composites are sensitive to high humidity and temperature compared to man-made fibres because of their hydrophilic properties and thermal sensitivity [187–189]. Natural fibre-reinforced cementitious composites are mainly used in outdoor applications where the environment is considered as an aggressive factor. Therefore, these composite materials have to deal with damaged problems regarding the losses in strength and decrease in durability. It is necessary to evaluate the durability of wetting and drying exposure of cementitious composites in order to prevent and mitigate the composite degradation. Parameters considered in previous studies on effects of cyclic wetting and drying are listed in Table 1.12 with their experimental conditions and objectives.
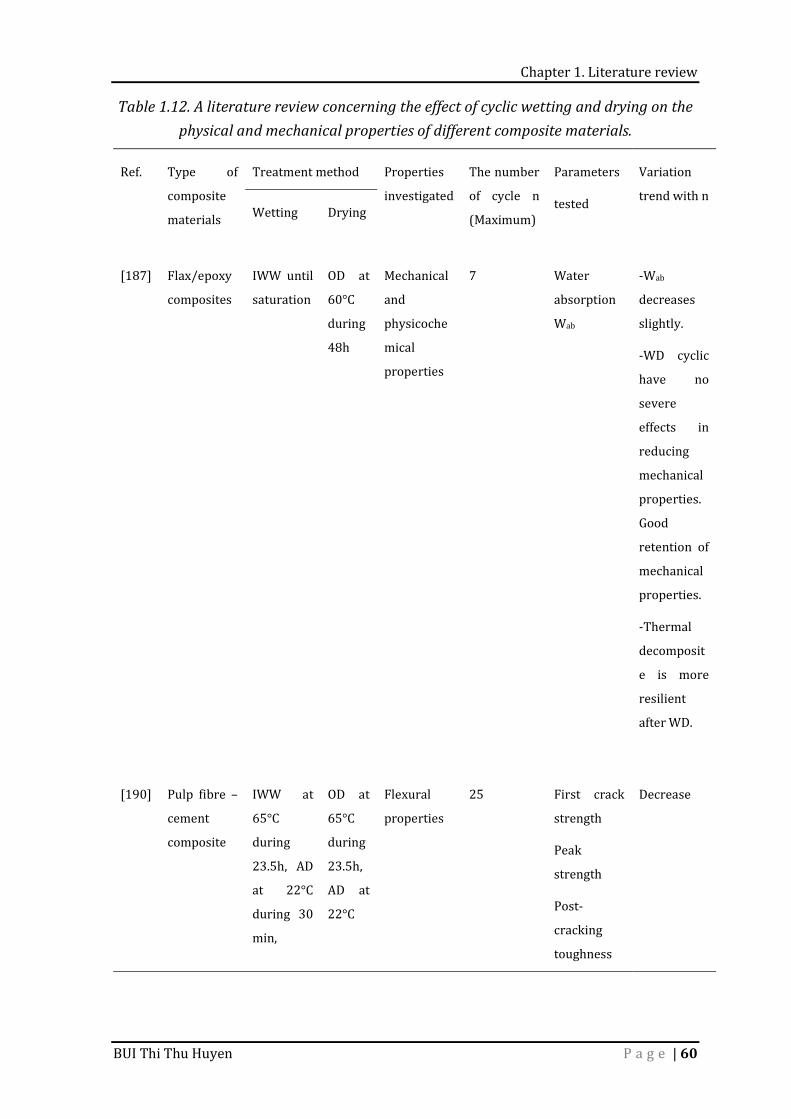
Chapter 1. Literature review
BUI Thi Thu Huyen P a g e | 60
Table 1.12. A literature review concerning the effect of cyclic wetting and drying on the physical and mechanical properties of different composite materials.
Ref. Type of composite materials Treatment method Properties investigated The number of cycle n (Maximum)
Parameters tested Variation trend with n Wetting Drying
[187] Flax/epoxy composites IWW until saturation OD at 60°C during 48h Mechanical and physicochemical properties
7 Water absorption Wab -Wab decreases slightly. -WD cyclic have no severe effects in reducing mechanical properties. Good retention of mechanical properties. -Thermal decomposite is more resilient after WD.
[190] Pulp fibre –cement composite IWW at 65°C during 23.5h, AD at 22°C during 30 min,
OD at 65°C during 23.5h, AD at 22°C
Flexural properties 25 First crack strength Peak strength Post-cracking toughness
Decrease
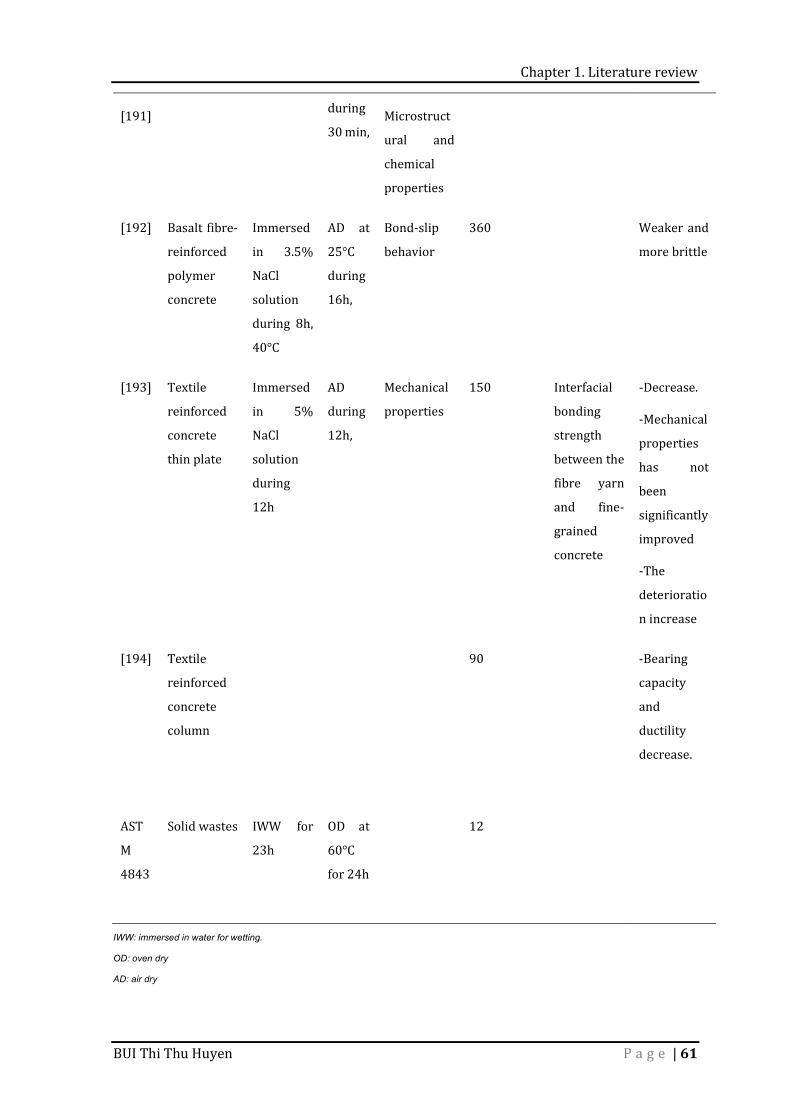
Chapter 1. Literature review
BUI Thi Thu Huyen P a g e | 61
[191] during 30 min, Microstructural and chemical properties
[192] Basalt fibre-reinforced polymer concrete Immersed in 3.5% NaCl solution during 8h, 40°C
AD at 25°C during 16h, Bond-slip behavior 360 Weaker and more brittle
[193] Textile reinforced concrete thin plate Immersed in 5% NaCl solution during 12h
AD during 12h, Mechanical properties 150 Interfacial bonding strength between the fibre yarn and fine-grained concrete
-Decrease. -Mechanical properties has not been significantly improved -The deterioration increase [194] Textile reinforced concrete column
90 -Bearing capacity and ductility decrease. ASTM 4843
Solid wastes IWW for 23h OD at 60°C for 24h 12
IWW: immersed in water for wetting.
OD: oven dry
AD: air dry
Chapter 1. Literature review
BUI Thi Thu Huyen P a g e | 62
Mechanical performance of composite materials needs be assured in wake of environmental vulnerability. The effects of wetting and drying cycle on the mechanical properties of natural fibres reinforced composite were investigated in several previous studies. Generally, exposure wetting and drying cycles have strong effects on mechanical properties of samples due to the repetition of negative environment for the bonding between fibres and matrix [192,194]. After sample is exposed to wetting and drying cycles, compressive strength is the most critical factor in assessing performance of composite materials [195]. For instance, the decrease in strength of kraft pulb fibres reinforced-cement paste was seen from the first two cycles in the study of Mohr et al [196]. After 25 cycles of freshwater exposure at ambient temperature, it would retain only 1 – 2% of post-cracking toughness. They also proposed three development steps of composite degradation under wetting and drying cycles. First, debonding between fibres and cementitious matrix occurs within the first two cycles because of drying shrinkage of fibres, followed by a remarkable loss in mechanical properties of composite and dimensional change of fibres due to the reappearance of hydration products inner the pore at the fibre-cement interface. This stage takes place prior to 10th cycle. Then fibres are mineralized after 10 cycles. In this last stage, although a negligible increase in strength is obtained, toughness is not regained. Similarly, compressive strength of alkali-activated composite materials showed a significant downward trend when these specimens were placed in wetting and drying repeating environment [197]. This strength reduction could be explained by several following reasons. Firstly, the shrinkage of specimen in drying stage induces the formation of cracks and subsequent decrease strength. Besides, the degradation of microstructure due to alkali attack also leads to affect harmful on mechanical performance. Sodium solution crystallizes in porosity space and creates inner pressure to contribute to strength decline. The last reason is due to alkali leaching that restrains alkali-activation, which probably diminishes strength. By contrast, the mechanical properties seem to be not affected significantly by several wetting and drying cycles, according to Sodoke et al.[187]. Observation on the relationship between stress and strain of cycle flax/epoxy composite indicated that an insignificant decrease in the initial slopes, i.e., deformation modulus, was obtained after a 104-day-period of exposure due to the crystallization effect of fibre treatment. Meanwhile, the deterioration process of mortar cement kept in the saltwater environment is diminished due to the delay of chloride diffusion in porosity of matrix [198]. Before decreasing slightly in the 120th cycle, the relative dynamic modulus of elasticity (which was considered as the conversion of acoustic time) of mortar has an upward trend during the first 90 cycles. Also, it was obvious that the mass of mortar increased to 2.74% after exposure time compared to control mortar (unaged cycling). Consumption
Chapter 1. Literature review
BUI Thi Thu Huyen P a g e | 63
water during the hydration process causes the formation of unsaturated pore space, and thus, mortar specimen continues to absorb water to increase its mass until reaches maximum water saturation [199,200]. 1.3. Conclusions and recommendations The collected data from literature presented in this chapter is intended to know the potential usage of coconut fibre and other natural fibres as reinforcement in the composite materials. The characteristics of fibres addition substantially influenced the mechanical and durability properties of the composite. To my best knowledge, only some researches [16,87,88] on the application of coconut fibre composite materials are done with precast filled coconut fibres. Ali [59] reviewed to put this composite materials into practice as house construction and slope stabilization. With regard to the durability of coconut fibres-reinforced composite, no study has been reported except for [46,48]. It is necessary to widen the application of coconut fibres-reinforced composite materials as parking lot pavement or noise barrier wall for highway noise insulation. Even it can also be used in road and bridge building. However, it needs to be carefully investigated before implementation. Although the usage of fibres could result in a reduction in some of the properties of composite such as modulus of elasticity and compressive strength, the addition of natural fibres to composite materials can reduce both the development of cracks and damage. Besides that, if the proper fibre content and selection of the material ratio are carried out, this material could be incorporated into the composite as a good thermal insulation solution. The dosage and length of fibres, therefore, could be studied further based on the summarized findings in this review to meet the standards for adequate composite performance. In order to compensate the negative effects of natural fibres, many new techniques and methods have been developed in the literature. Several datas, however, still exist limitation. Appropriate methods for fibres in the future in the construction industry should be thus considered to develop further applications of natural fibres. The usage of agricultural by-products in building construction is considered as a good solution for protecting the environment and reduce the burdens of waste management in many nations. The incorporation of natural fibres and/or agricultural by-products in construction attracted more attention from researchers and construction managers due to environmental and economic benefits.
Chapter 2. Characterization of materials and experimental methods
BUI Thi Thu Huyen P a g e | 64
CHAPTER 2. CHARACTERIZATION OF MATERIALS AND EXPERIMENTAL METHODS
2.1. Introduction The literature review presented in the previous chapter has highlighted the influence of constituents on the formulation and properties of concretes and mortars incorporating bio-based materials such as plant fibres. Also, in this work, it is essential to characterize the different constituents that will be used in the composition of materials (cement, aggregates, and fibres). This chapter details the campaign of tests conducted to characterize these materials through their morphological, physical, and mechanical properties. Besides, sample preparation and testing methods are also indicated in this second chapter. 2.2. Materials
2.2.1. Water The water used for manufacturing mortar is potable and obtained from local supplier. Its total chlorine content and pH is 0.07 mg/l and 7.4, respectively. The content of chlorine is, therefore, lower than the limit value given by standard NF EN 1008 (0.27 mg/l). 2.2.2. Cement Mortars are manufactured based on two types of cements, CEM I 52.5 N type I Portland Cement (PC) and Calcium Sulfoaluminate cement (CSA Cement), which are
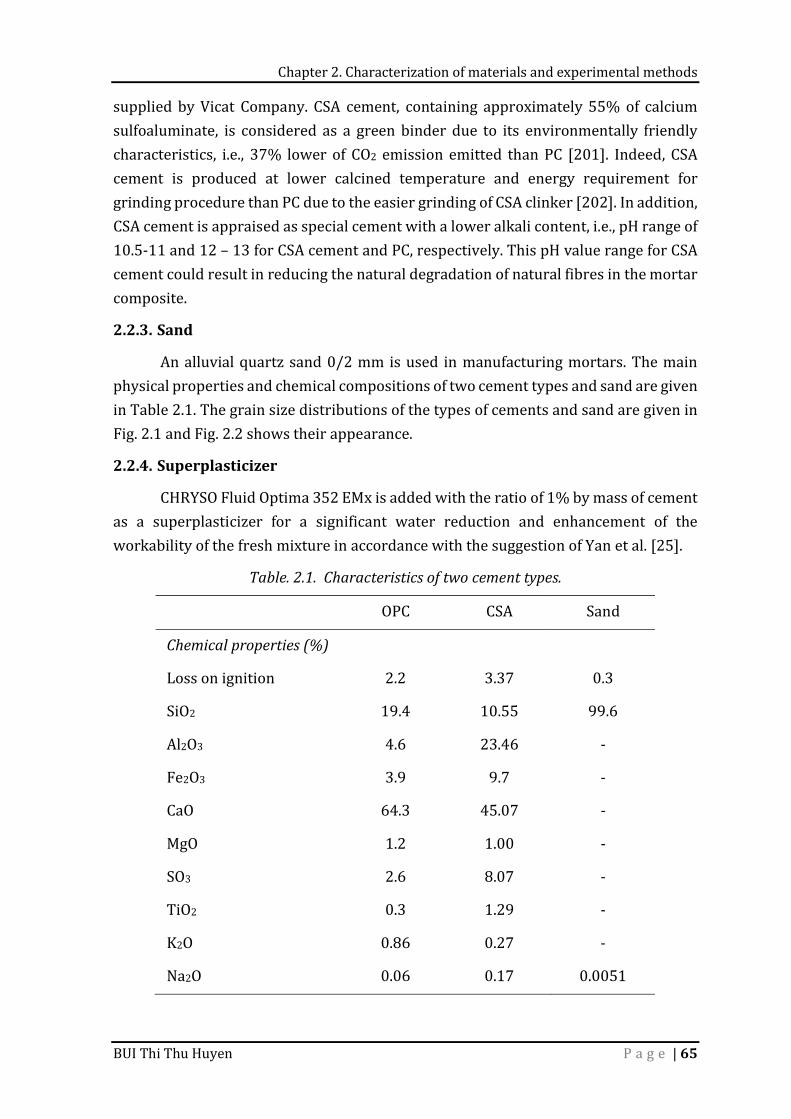
Chapter 2. Characterization of materials and experimental methods
BUI Thi Thu Huyen P a g e | 65
supplied by Vicat Company. CSA cement, containing approximately 55% of calcium sulfoaluminate, is considered as a green binder due to its environmentally friendly characteristics, i.e., 37% lower of CO2 emission emitted than PC [201]. Indeed, CSA cement is produced at lower calcined temperature and energy requirement for grinding procedure than PC due to the easier grinding of CSA clinker [202]. In addition, CSA cement is appraised as special cement with a lower alkali content, i.e., pH range of 10.5-11 and 12 – 13 for CSA cement and PC, respectively. This pH value range for CSA cement could result in reducing the natural degradation of natural fibres in the mortar composite. 2.2.3. Sand An alluvial quartz sand 0/2 mm is used in manufacturing mortars. The main physical properties and chemical compositions of two cement types and sand are given in Table 2.1. The grain size distributions of the types of cements and sand are given in Fig. 2.1 and Fig. 2.2 shows their appearance. 2.2.4. Superplasticizer CHRYSO Fluid Optima 352 EMx is added with the ratio of 1% by mass of cement as a superplasticizer for a significant water reduction and enhancement of the workability of the fresh mixture in accordance with the suggestion of Yan et al. [25].
Table. 2.1. Characteristics of two cement types.
OPC CSA Sand Chemical properties (%) Loss on ignition 2.2 3.37 0.3 SiO2 19.4 10.55 99.6 Al2O3 4.6 23.46 - Fe2O3 3.9 9.7 - CaO 64.3 45.07 - MgO 1.2 1.00 - SO3 2.6 8.07 - TiO2 0.3 1.29 - K2O 0.86 0.27 - Na2O 0.06 0.17 0.0051

Chapter 2. Characterization of materials and experimental methods
BUI Thi Thu Huyen P a g e | 66
P2O5 0.3 0.11 - S2- < 0.02 - Cl- < 0.007 0.01 < 0.001 Physical properties Blaine fineness (cm2/g) 4200 4650 - Density (g/cm3) 3.16 3.01 2.64 Average diameter (μm) 10.8 500 Mechanical properties Compressive strength (MPa) 8 hours 16 - 1 day 23 34 - 2 days 34 38 - 7 days 48 44 - 28 days 62 50 - Initial setting time (min) 150 30 -
Source: supplied by VICAT, France.
Fig. 2.1. Grain size distribution of cement and sand.
0
20
40
60
80
100
0,000001 0,00001 0,0001 0,001 0,01 0,1 1 10 100
Cum
ulat
ive
(%)
Particle diameter (mm)
Alluvial quartz sandPortland cement (PC)Sand EN 196-1CSA cement

Chapter 2. Characterization of materials and experimental methods
BUI Thi Thu Huyen P a g e | 67
CSA cement PC Sand 0/2
Fig. 2.2. The materials used.
2.2.5. Raw fibre Coconut fibres from Vietnam are used in present study as raw fibres. The specifications of fibres are presented in next chapter. Firstly, piths, coir dust, and undesirable materials are manually removed to select raw fibres.
Piths and dust of fibres
Raw fibres Cut fibres
Isolated fibres
Fig. 2.3. The process of preparation of fibres. These fibres are then cut into a range of 10 - 20 mm in length. Fig. 2.3 shows the appearance and the process of fibre hand-preparation, while the length distribution of
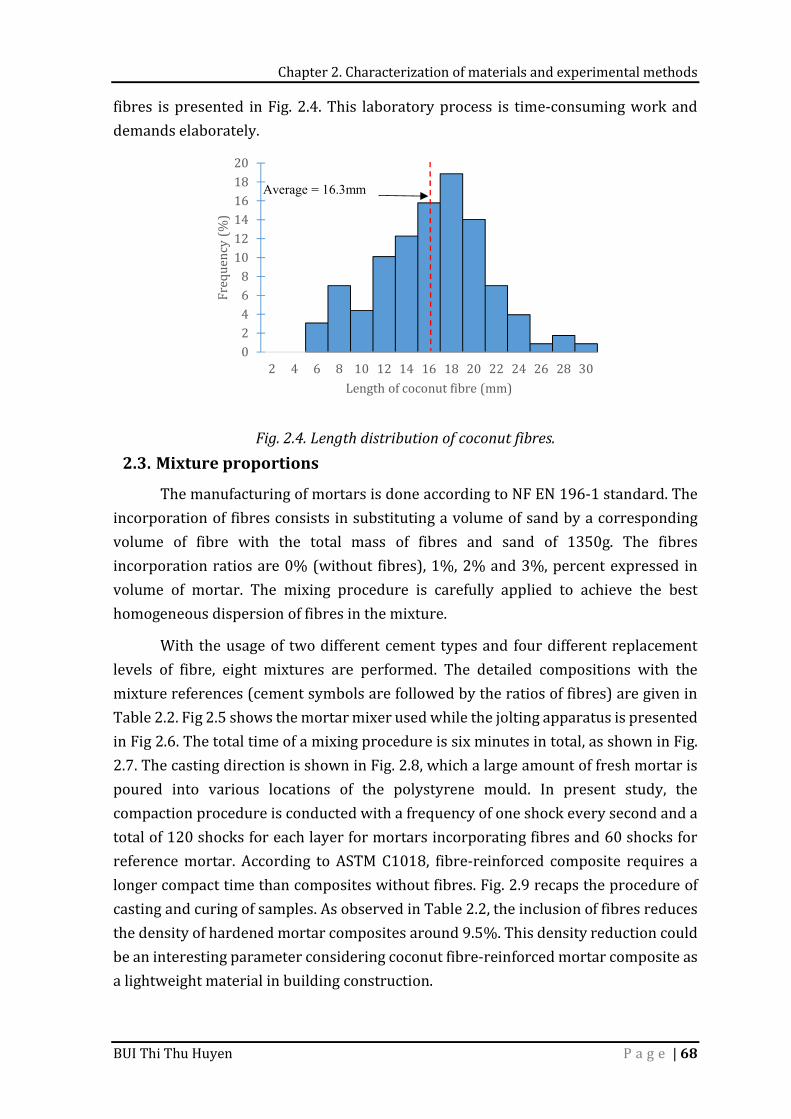
Chapter 2. Characterization of materials and experimental methods
BUI Thi Thu Huyen P a g e | 68
fibres is presented in Fig. 2.4. This laboratory process is time-consuming work and demands elaborately.
Fig. 2.4. Length distribution of coconut fibres.
2.3. Mixture proportions The manufacturing of mortars is done according to NF EN 196-1 standard. The incorporation of fibres consists in substituting a volume of sand by a corresponding volume of fibre with the total mass of fibres and sand of 1350g. The fibres incorporation ratios are 0% (without fibres), 1%, 2% and 3%, percent expressed in volume of mortar. The mixing procedure is carefully applied to achieve the best homogeneous dispersion of fibres in the mixture. With the usage of two different cement types and four different replacement levels of fibre, eight mixtures are performed. The detailed compositions with the mixture references (cement symbols are followed by the ratios of fibres) are given in Table 2.2. Fig 2.5 shows the mortar mixer used while the jolting apparatus is presented in Fig 2.6. The total time of a mixing procedure is six minutes in total, as shown in Fig. 2.7. The casting direction is shown in Fig. 2.8, which a large amount of fresh mortar is poured into various locations of the polystyrene mould. In present study, the compaction procedure is conducted with a frequency of one shock every second and a total of 120 shocks for each layer for mortars incorporating fibres and 60 shocks for reference mortar. According to ASTM C1018, fibre-reinforced composite requires a longer compact time than composites without fibres. Fig. 2.9 recaps the procedure of casting and curing of samples. As observed in Table 2.2, the inclusion of fibres reduces the density of hardened mortar composites around 9.5%. This density reduction could be an interesting parameter considering coconut fibre-reinforced mortar composite as a lightweight material in building construction.
02468101214161820
2 4 6 8 10 12 14 16 18 20 22 24 26 28 30
Frequency (%
)
Length of coconut fibre (mm)
Average = 16.3mm
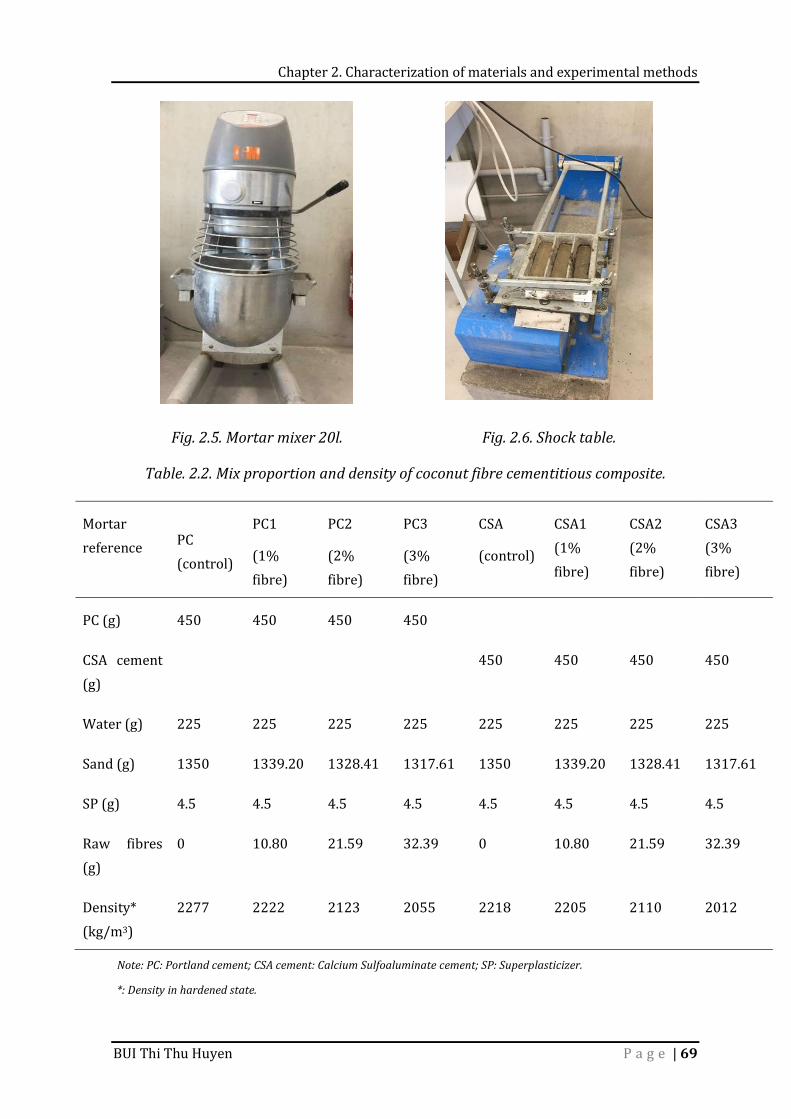
Chapter 2. Characterization of materials and experimental methods
BUI Thi Thu Huyen P a g e | 69
Fig. 2.5. Mortar mixer 20l. Fig. 2.6. Shock table.
Table. 2.2. Mix proportion and density of coconut fibre cementitious composite.
Mortar reference PC (control) PC1 (1% fibre) PC2 (2% fibre)
PC3 (3% fibre) CSA (control) CSA1 (1% fibre)
CSA2 (2% fibre) CSA3 (3% fibre)
PC (g) 450 450 450 450 CSA cement (g) 450 450 450 450 Water (g) 225 225 225 225 225 225 225 225 Sand (g) 1350 1339.20 1328.41 1317.61 1350 1339.20 1328.41 1317.61 SP (g) 4.5 4.5 4.5 4.5 4.5 4.5 4.5 4.5 Raw fibres (g) 0 10.80 21.59 32.39 0 10.80 21.59 32.39 Density* (kg/m3) 2277 2222 2123 2055 2218 2205 2110 2012
Note: PC: Portland cement; CSA cement: Calcium Sulfoaluminate cement; SP: Superplasticizer.
*: Density in hardened state.
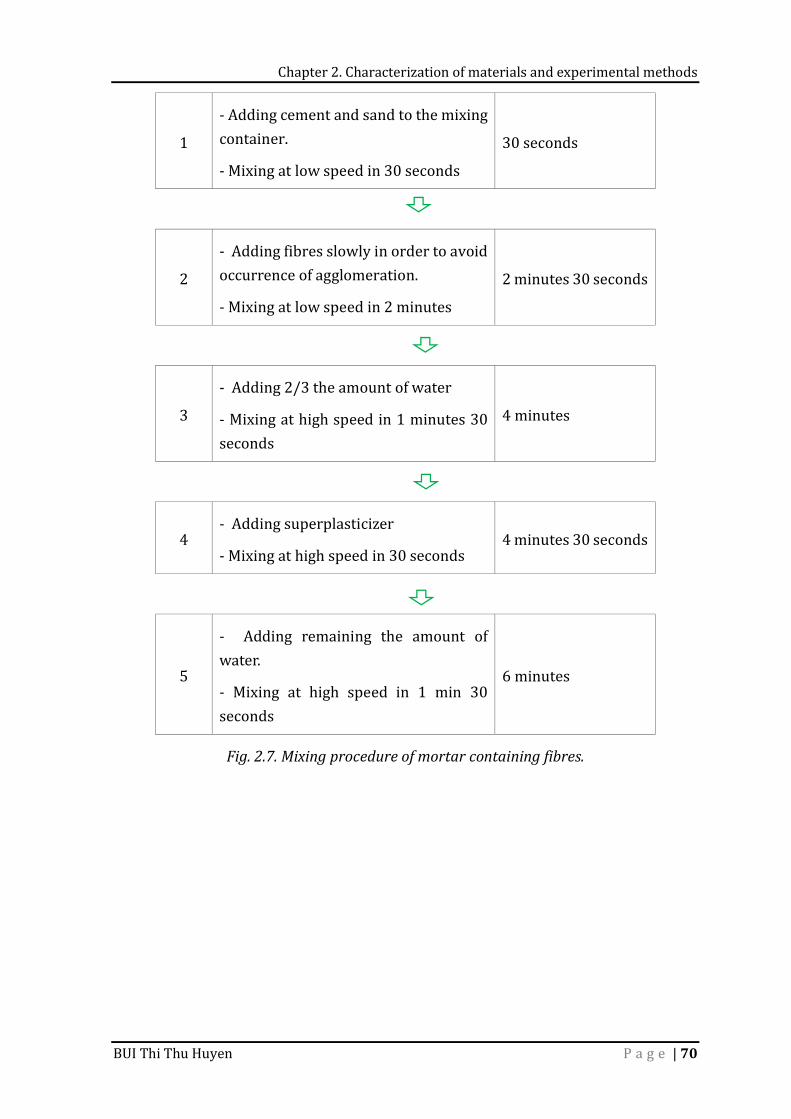
Chapter 2. Characterization of materials and experimental methods
BUI Thi Thu Huyen P a g e | 70
1 - Adding cement and sand to the mixing container. - Mixing at low speed in 30 seconds 30 seconds
2 - Adding fibres slowly in order to avoid occurrence of agglomeration. - Mixing at low speed in 2 minutes 2 minutes 30 seconds
3 - Adding 2/3 the amount of water - Mixing at high speed in 1 minutes 30 seconds 4 minutes
4 - Adding superplasticizer - Mixing at high speed in 30 seconds 4 minutes 30 seconds
5 - Adding remaining the amount of water. - Mixing at high speed in 1 min 30 seconds 6 minutes Fig. 2.7. Mixing procedure of mortar containing fibres.
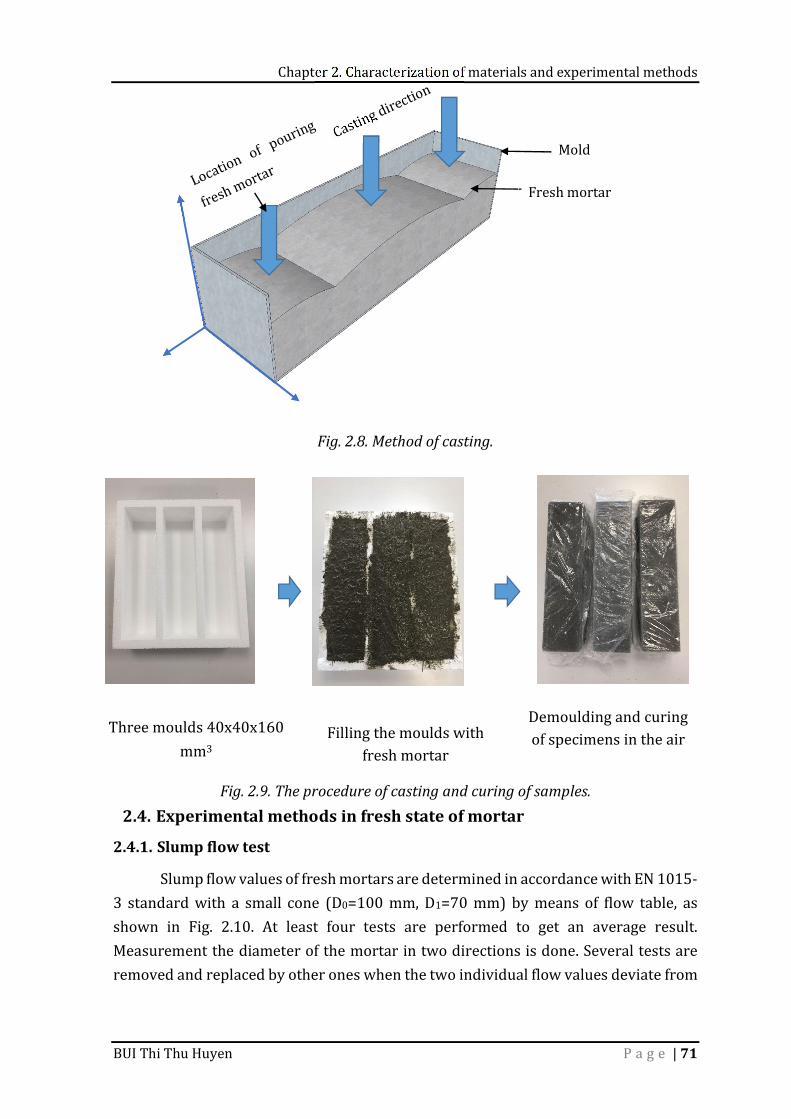
Chapter 2. Characterization of materials and experimental methods
BUI Thi Thu Huyen P a g e | 71
Fig. 2.8. Method of casting.
Three moulds 40x40x160 mm3 Filling the moulds with fresh mortar Demoulding and curing of specimens in the air
Fig. 2.9. The procedure of casting and curing of samples. 2.4. Experimental methods in fresh state of mortar
2.4.1. Slump flow test Slump flow values of fresh mortars are determined in accordance with EN 1015-3 standard with a small cone (D0=100 mm, D1=70 mm) by means of flow table, as shown in Fig. 2.10. At least four tests are performed to get an average result. Measurement the diameter of the mortar in two directions is done. Several tests are removed and replaced by other ones when the two individual flow values deviate from
Mold Fresh mortar
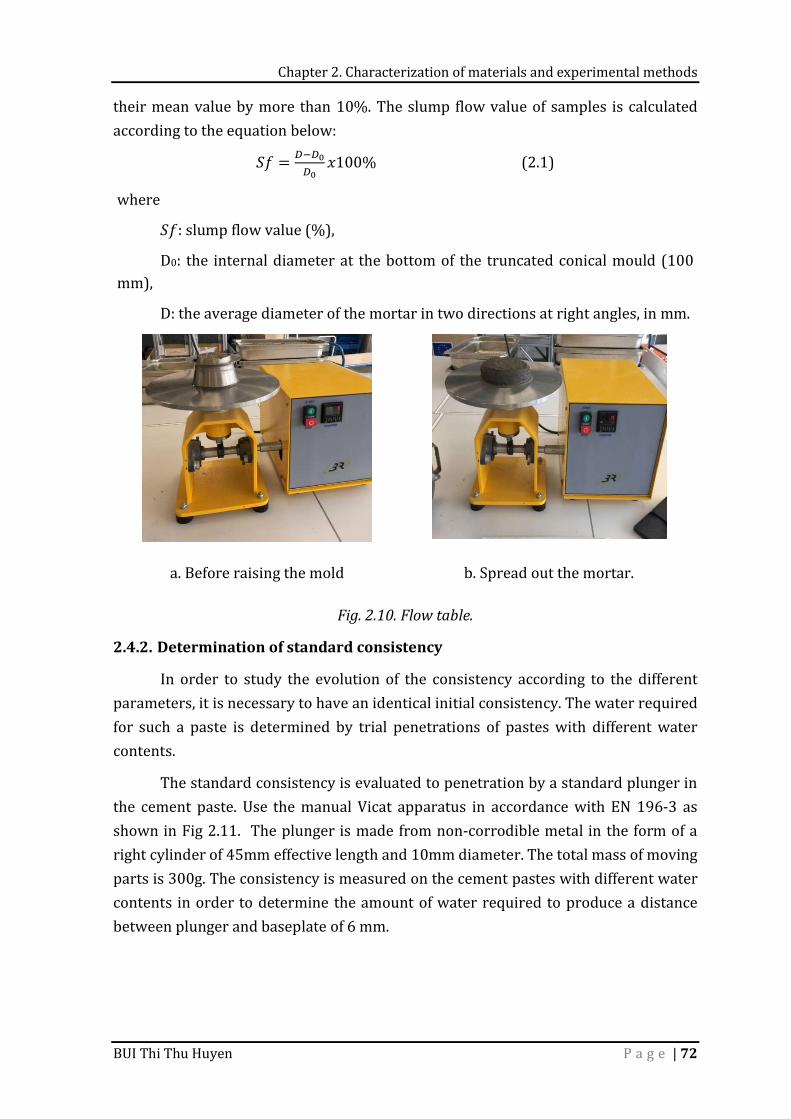
Chapter 2. Characterization of materials and experimental methods
BUI Thi Thu Huyen P a g e | 72
their mean value by more than 10%. The slump flow value of samples is calculated according to the equation below: 𝑆𝑓 = 𝑥100% (2.1) where 𝑆𝑓: slump flow value (%), D0: the internal diameter at the bottom of the truncated conical mould (100 mm), D: the average diameter of the mortar in two directions at right angles, in mm.
a. Before raising the mold b. Spread out the mortar. Fig. 2.10. Flow table.
2.4.2. Determination of standard consistency In order to study the evolution of the consistency according to the different parameters, it is necessary to have an identical initial consistency. The water required for such a paste is determined by trial penetrations of pastes with different water contents. The standard consistency is evaluated to penetration by a standard plunger in the cement paste. Use the manual Vicat apparatus in accordance with EN 196-3 as shown in Fig 2.11. The plunger is made from non-corrodible metal in the form of a right cylinder of 45mm effective length and 10mm diameter. The total mass of moving parts is 300g. The consistency is measured on the cement pastes with different water contents in order to determine the amount of water required to produce a distance between plunger and baseplate of 6 mm.

Chapter 2. Characterization of materials and experimental methods
BUI Thi Thu Huyen P a g e | 73
Fig. 2.11. The manual Vicat apparatus for determination of standard
consistency.
Fig. 2.12. The automatic Vicat apparatus for determination of setting time.
2.4.3. Setting time test The setting is an essential parameter for binding materials. Setting time value could provide suitable time for mixing and shaping operation [203]. The setting time is determined by observing the penetration of a needle into cement paste of standard consistency until it reaches a specified value. The automatic Vicat apparatus in accordance with EN 196-3 is shown in Fig 2.12. The test is performed at ambient temperature. For initial setting time, a needle which is made from steel and in the form of a right cylinder of the effective length of 45mm and diameter 1.13mm. The time elapsed between starting mixing stages and the time at which the distance between the needle and the baseplate is 6mm is the initial setting time of the cement paste. For final setting time, fit the needle with ring attachment of diameter approximately 5mm to facilitate accurate observation of small penetrations. The time in minutes, measured from starting mixing stages to that at which the needle first penetrates only 0,5mm into the specimen, as the final setting time of the cement. 2.4.4. Semi-adiabatic calorimeters of hydration test The quantity of heat of mortars during the first day is assessed in accordance with NF EN 196-9 standard, as shown in Fig. 2.13. The semi-adiabatic method consists
Chapter 2. Characterization of materials and experimental methods
BUI Thi Thu Huyen P a g e | 74
of importing fresh mortar samples into a calorimeter to calculate the amount of heat emitted according to the evolution of the temperature from the ambient temperature. The heat of hydration is given in joules per gram of cement (J/g). The temperature increase of mortar is compared with the temperature of an inert sample in a reference flask at 25°C. At a given time (t), the heat of hydration of cement 𝑄 is calculated as the sum of the heat accumulated 𝑄 in the flask and the heat dissipated outside 𝑄 in following equations: 𝑄 = 𝑄 + 𝑄 (2.2) The heat accumulated 𝑄 in the calorimeter and the heat dissipated outside 𝑄 are determined from the Eq. 2.3 and Eq. 2.4 below, respectively: 𝑄 = 𝑥 ∆𝑡 (2.3) where: 𝑐: is the total heat capacity of the calorimeter, in J/K. 𝑚 : is the mass of cement tested, in g. ∆𝑡: is the temperature difference between the test calorimeter and the reference calorimeter at given time t, in K. 𝑄 = ∫ 𝛼. ∆𝑡. 𝑑𝑡 (2.4) where: t: is the time since the hydration starts, in hour. 𝛼: is the coefficient of total heat loss of the calorimeter, in J/h.K.
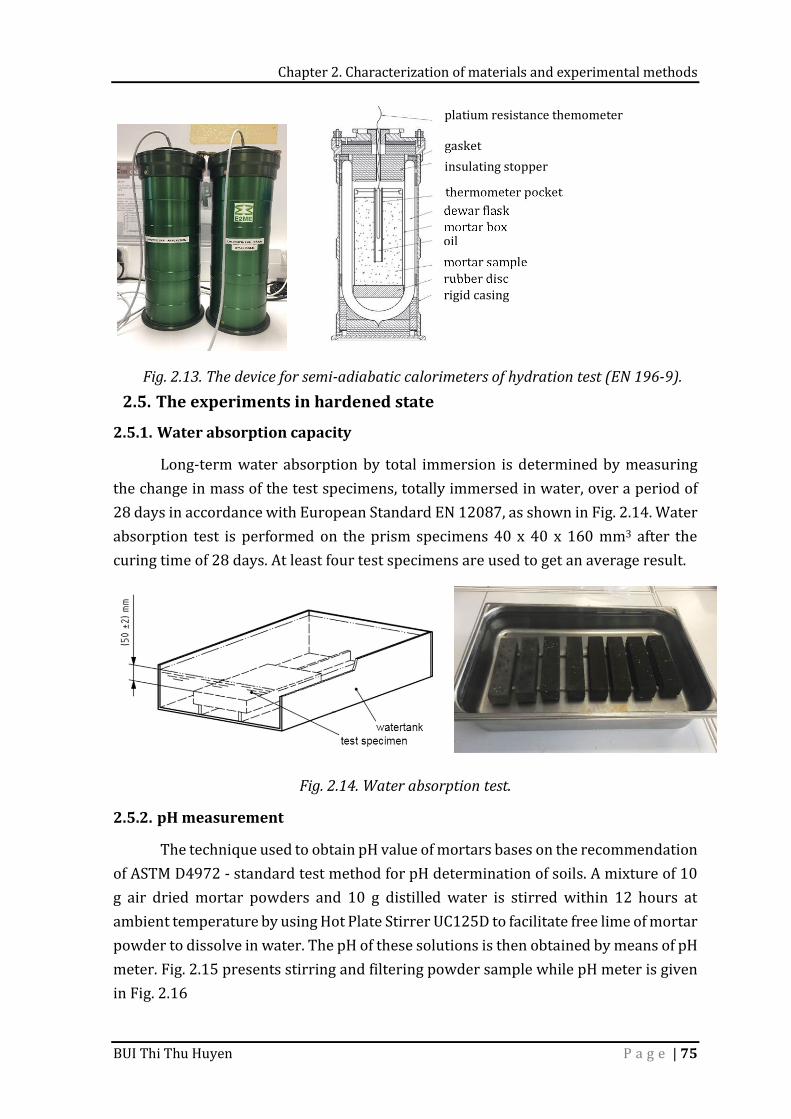
Chapter 2. Characterization of materials and experimental methods
BUI Thi Thu Huyen P a g e | 75
Fig. 2.13. The device for semi-adiabatic calorimeters of hydration test (EN 196-9).
2.5. The experiments in hardened state
2.5.1. Water absorption capacity Long-term water absorption by total immersion is determined by measuring the change in mass of the test specimens, totally immersed in water, over a period of 28 days in accordance with European Standard EN 12087, as shown in Fig. 2.14. Water absorption test is performed on the prism specimens 40 x 40 x 160 mm3 after the curing time of 28 days. At least four test specimens are used to get an average result.
Fig. 2.14. Water absorption test.
2.5.2. pH measurement The technique used to obtain pH value of mortars bases on the recommendation of ASTM D4972 - standard test method for pH determination of soils. A mixture of 10 g air dried mortar powders and 10 g distilled water is stirred within 12 hours at ambient temperature by using Hot Plate Stirrer UC125D to facilitate free lime of mortar powder to dissolve in water. The pH of these solutions is then obtained by means of pH meter. Fig. 2.15 presents stirring and filtering powder sample while pH meter is given in Fig. 2.16
platium resistance themometer gasket insulating stopper thermometer pocket dewar flask mortar box oil mortar sample rubber disc rigid casing
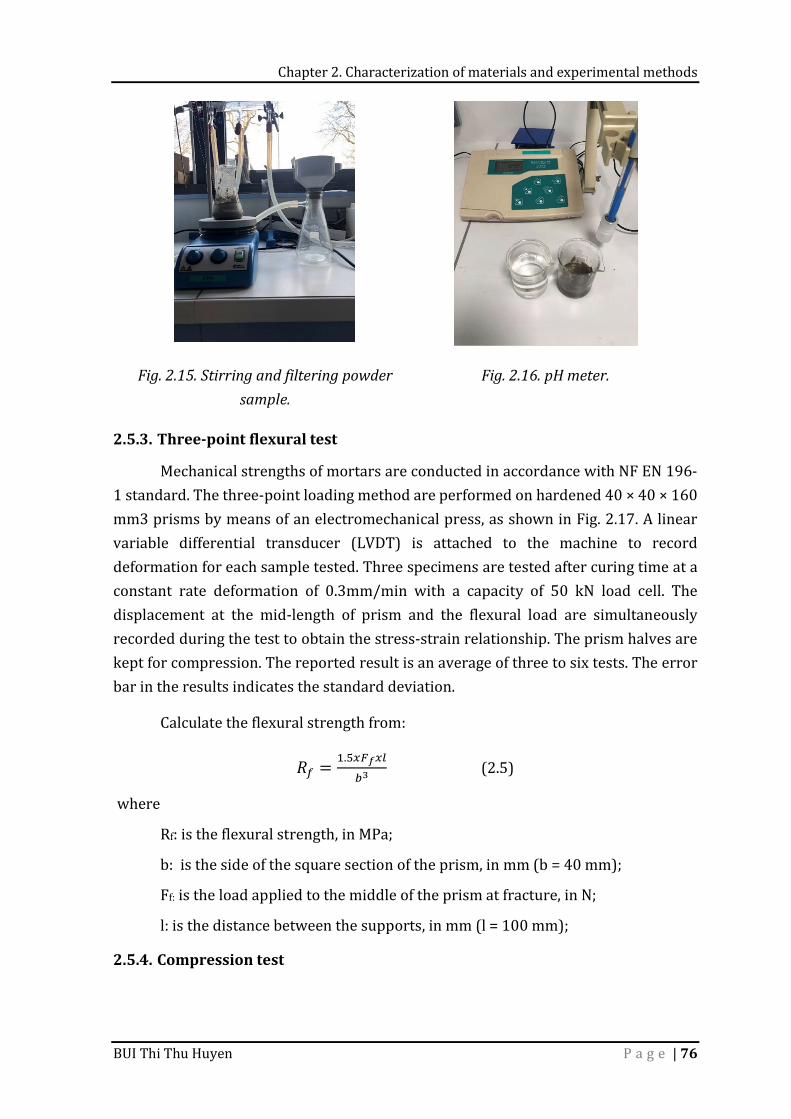
Chapter 2. Characterization of materials and experimental methods
BUI Thi Thu Huyen P a g e | 76
Fig. 2.15. Stirring and filtering powder
sample. Fig. 2.16. pH meter.
2.5.3. Three-point flexural test Mechanical strengths of mortars are conducted in accordance with NF EN 196-1 standard. The three-point loading method are performed on hardened 40 × 40 × 160 mm3 prisms by means of an electromechanical press, as shown in Fig. 2.17. A linear variable differential transducer (LVDT) is attached to the machine to record deformation for each sample tested. Three specimens are tested after curing time at a constant rate deformation of 0.3mm/min with a capacity of 50 kN load cell. The displacement at the mid-length of prism and the flexural load are simultaneously recorded during the test to obtain the stress-strain relationship. The prism halves are kept for compression. The reported result is an average of three to six tests. The error bar in the results indicates the standard deviation. Calculate the flexural strength from: 𝑅 = . (2.5) where Rf: is the flexural strength, in MPa; b: is the side of the square section of the prism, in mm (b = 40 mm); Ff: is the load applied to the middle of the prism at fracture, in N; l: is the distance between the supports, in mm (l = 100 mm); 2.5.4. Compression test
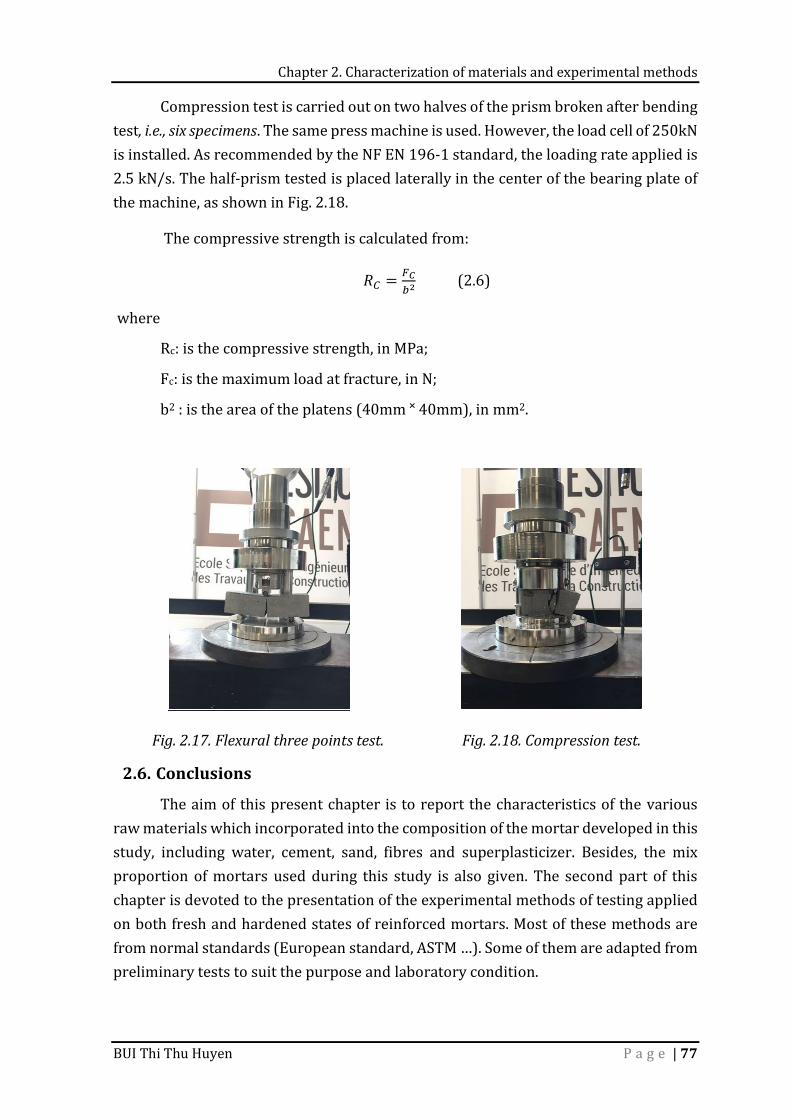
Chapter 2. Characterization of materials and experimental methods
BUI Thi Thu Huyen P a g e | 77
Compression test is carried out on two halves of the prism broken after bending test, i.e., six specimens. The same press machine is used. However, the load cell of 250kN is installed. As recommended by the NF EN 196-1 standard, the loading rate applied is 2.5 kN/s. The half-prism tested is placed laterally in the center of the bearing plate of the machine, as shown in Fig. 2.18. The compressive strength is calculated from: 𝑅 = (2.6) where Rc: is the compressive strength, in MPa; Fc: is the maximum load at fracture, in N; b2 : is the area of the platens (40mm ˟ 40mm), in mm2.
Fig. 2.17. Flexural three points test. Fig. 2.18. Compression test.
2.6. Conclusions The aim of this present chapter is to report the characteristics of the various raw materials which incorporated into the composition of the mortar developed in this study, including water, cement, sand, fibres and superplasticizer. Besides, the mix proportion of mortars used during this study is also given. The second part of this chapter is devoted to the presentation of the experimental methods of testing applied on both fresh and hardened states of reinforced mortars. Most of these methods are from normal standards (European standard, ASTM …). Some of them are adapted from preliminary tests to suit the purpose and laboratory condition.
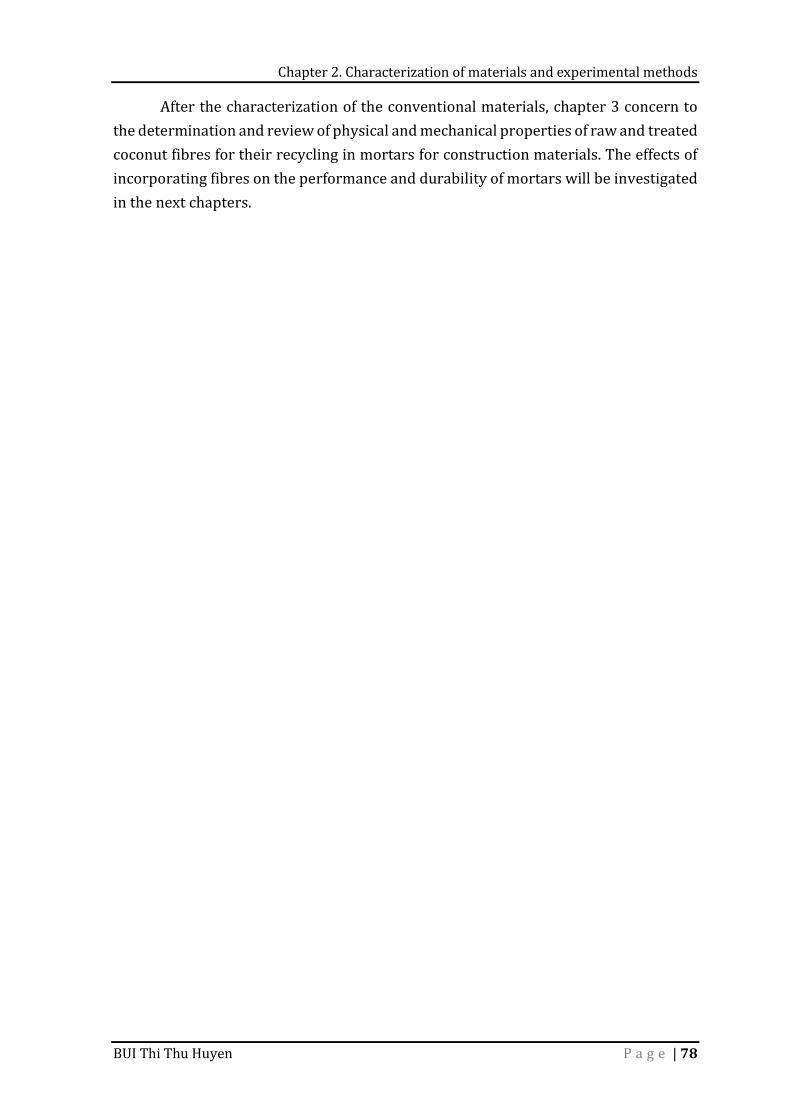
Chapter 2. Characterization of materials and experimental methods
BUI Thi Thu Huyen P a g e | 78
After the characterization of the conventional materials, chapter 3 concern to the determination and review of physical and mechanical properties of raw and treated coconut fibres for their recycling in mortars for construction materials. The effects of incorporating fibres on the performance and durability of mortars will be investigated in the next chapters.
Chapter 3. Determination of physical and mechanical properties of raw and treated coconut fibres for their recycling in construction materials
BUI Thi Thu Huyen P a g e | 79
CHAPTER 3. DERTERMINATION OF PHYSICAL AND MECHANICAL PROPERTIES OF RAW AND TREATED
COCONUT FIBRES FOR THEIR RECYCLING IN CONSTRUCTION MATERIALS
3.1. Introduction The coconut fibres could play an important role in reinforcing the building materials or improving/modifying their certain properties. Mechanical, thermal and acoustic properties are highly dependent on the characteristics of the fibre itself. As reported by various authors in the literature, the determination of the characteristics of coconut fibres poses several problems due to the great variability of these. This variability depends on several factors, such as the origin of the coconuts and the storage and processing methods used to obtain these fibres. Each study, like that of the incorporation of coconut fibres in mortars, requires an appropriate determination of the properties of the fibres used, i.e., the potential deposit of fibres at its disposal. The present chapter aims at providing further knowledge on the determination of coconut fibres properties in manufacturing reinforced mortars by incorporating different amounts of this type of fibres by means of the assessment of geometrical, physical and mechanical to thermal properties and durability properties of local coconut fibres (Vietnam). Once determined, these properties are compared with those observed in the literature. This comparative study makes it possible to situate the level of performance of these fibres with respect to other natural fibres, in particular coconut
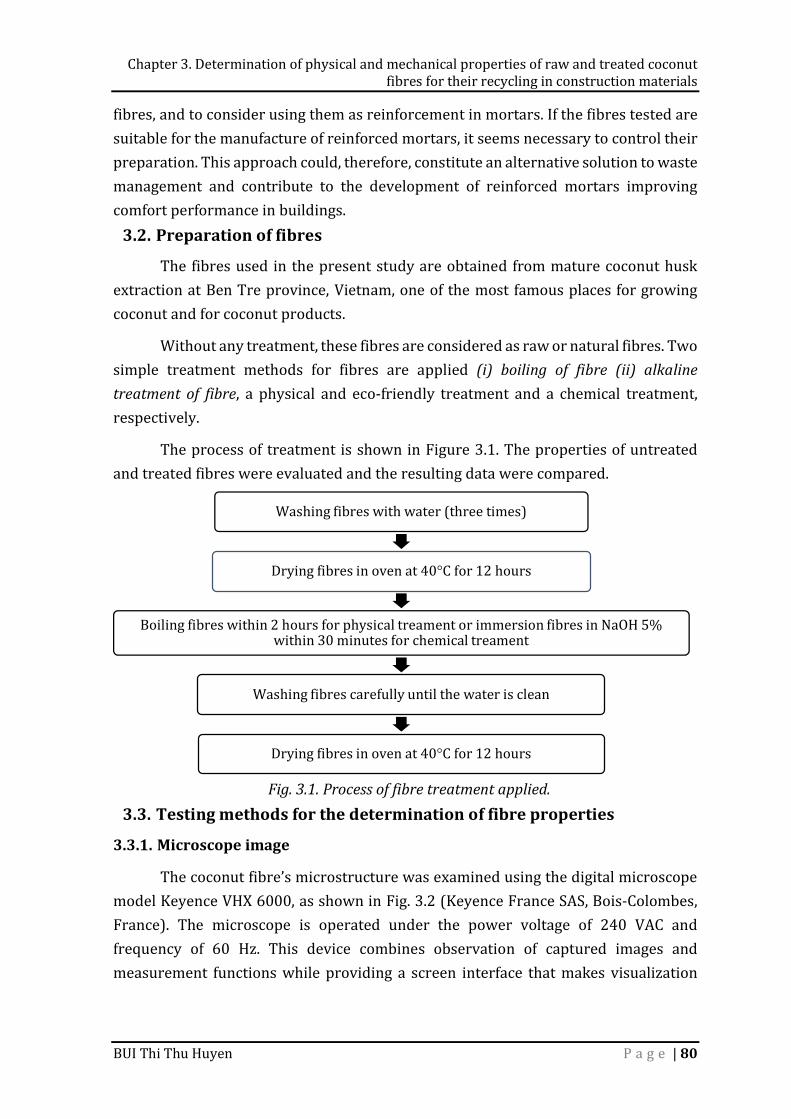
Chapter 3. Determination of physical and mechanical properties of raw and treated coconut fibres for their recycling in construction materials
BUI Thi Thu Huyen P a g e | 80
fibres, and to consider using them as reinforcement in mortars. If the fibres tested are suitable for the manufacture of reinforced mortars, it seems necessary to control their preparation. This approach could, therefore, constitute an alternative solution to waste management and contribute to the development of reinforced mortars improving comfort performance in buildings. 3.2. Preparation of fibres The fibres used in the present study are obtained from mature coconut husk extraction at Ben Tre province, Vietnam, one of the most famous places for growing coconut and for coconut products. Without any treatment, these fibres are considered as raw or natural fibres. Two simple treatment methods for fibres are applied (i) boiling of fibre (ii) alkaline
treatment of fibre, a physical and eco-friendly treatment and a chemical treatment, respectively. The process of treatment is shown in Figure 3.1. The properties of untreated and treated fibres were evaluated and the resulting data were compared.
Fig. 3.1. Process of fibre treatment applied. 3.3. Testing methods for the determination of fibre properties
3.3.1. Microscope image The coconut fibre’s microstructure was examined using the digital microscope model Keyence VHX 6000, as shown in Fig. 3.2 (Keyence France SAS, Bois-Colombes, France). The microscope is operated under the power voltage of 240 VAC and frequency of 60 Hz. This device combines observation of captured images and measurement functions while providing a screen interface that makes visualization
Washing fibres with water (three times)Drying fibres in oven at 40°C for 12 hours
Boiling fibres within 2 hours for physical treament or immersion fibres in NaOH 5% within 30 minutes for chemical treamentWashing fibres carefully until the water is clean
Drying fibres in oven at 40°C for 12 hours
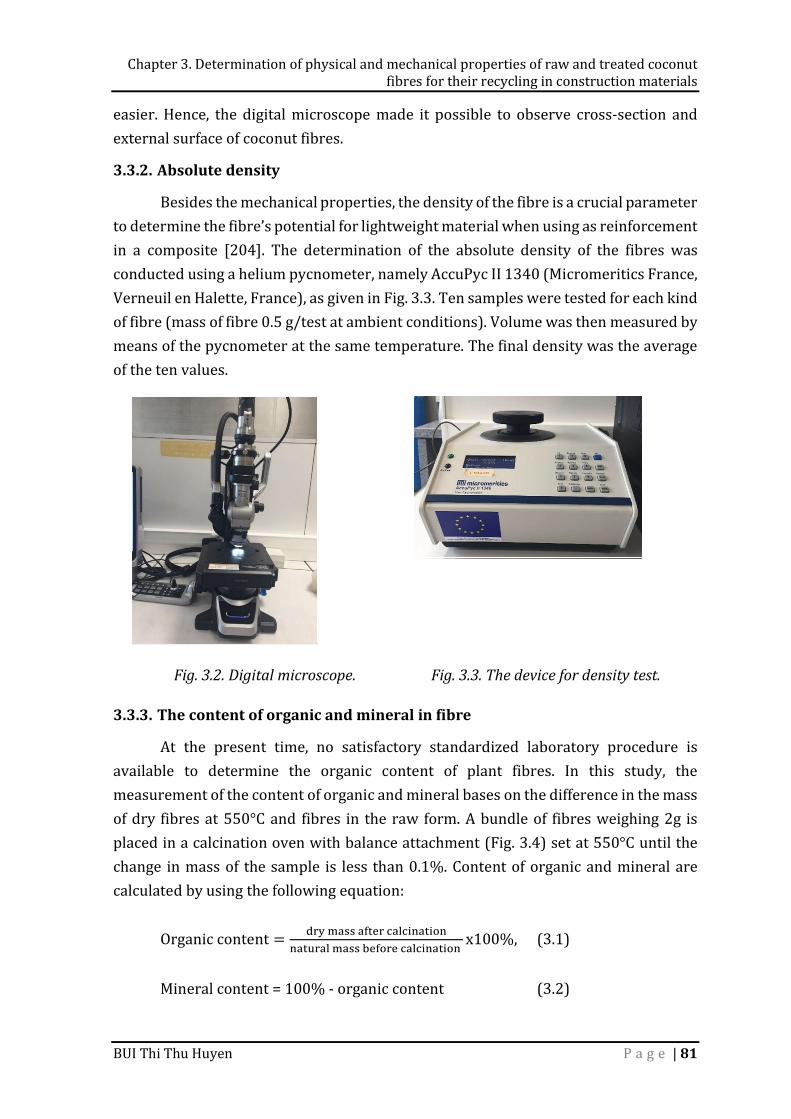
Chapter 3. Determination of physical and mechanical properties of raw and treated coconut fibres for their recycling in construction materials
BUI Thi Thu Huyen P a g e | 81
easier. Hence, the digital microscope made it possible to observe cross-section and external surface of coconut fibres. 3.3.2. Absolute density Besides the mechanical properties, the density of the fibre is a crucial parameter to determine the fibre’s potential for lightweight material when using as reinforcement in a composite [204]. The determination of the absolute density of the fibres was conducted using a helium pycnometer, namely AccuPyc II 1340 (Micromeritics France, Verneuil en Halette, France), as given in Fig. 3.3. Ten samples were tested for each kind of fibre (mass of fibre 0.5 g/test at ambient conditions). Volume was then measured by means of the pycnometer at the same temperature. The final density was the average of the ten values.
Fig. 3.2. Digital microscope. Fig. 3.3. The device for density test.
3.3.3. The content of organic and mineral in fibre At the present time, no satisfactory standardized laboratory procedure is available to determine the organic content of plant fibres. In this study, the measurement of the content of organic and mineral bases on the difference in the mass of dry fibres at 550°C and fibres in the raw form. A bundle of fibres weighing 2g is placed in a calcination oven with balance attachment (Fig. 3.4) set at 550°C until the change in mass of the sample is less than 0.1%. Content of organic and mineral are calculated by using the following equation: Organic content = x100%, (3.1) Mineral content = 100% - organic content (3.2)
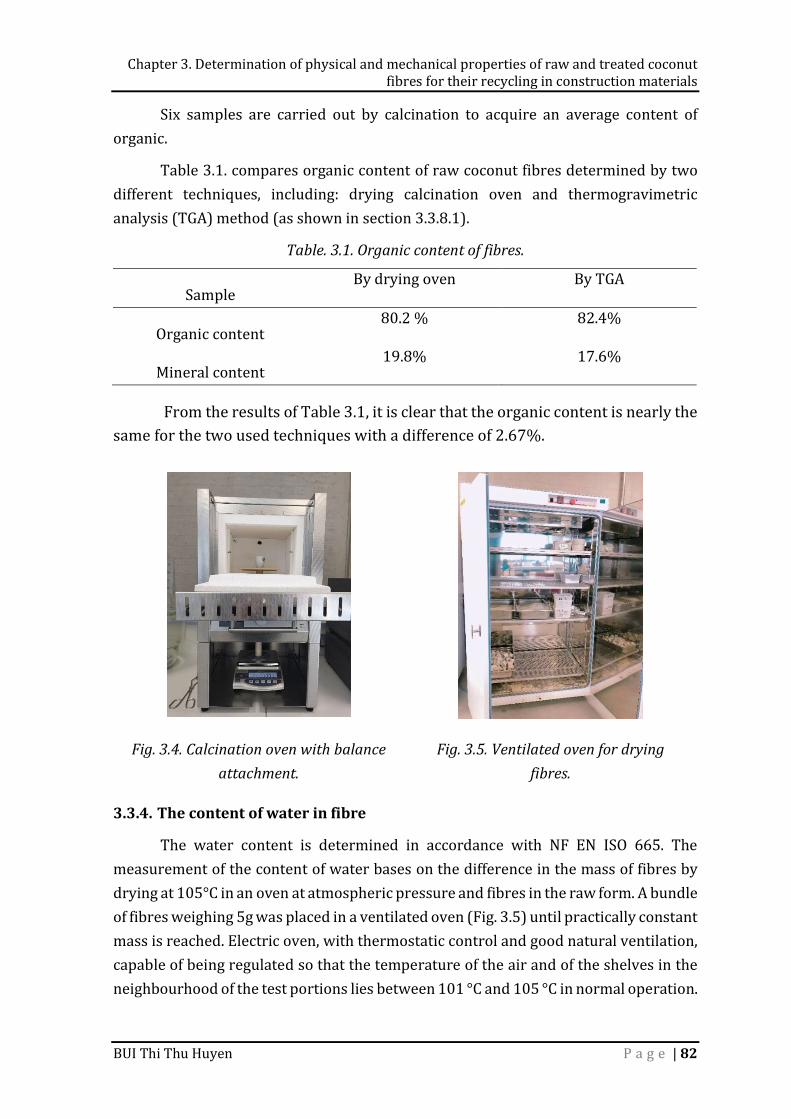
Chapter 3. Determination of physical and mechanical properties of raw and treated coconut fibres for their recycling in construction materials
BUI Thi Thu Huyen P a g e | 82
Six samples are carried out by calcination to acquire an average content of organic. Table 3.1. compares organic content of raw coconut fibres determined by two different techniques, including: drying calcination oven and thermogravimetric analysis (TGA) method (as shown in section 3.3.8.1). Table. 3.1. Organic content of fibres.
From the results of Table 3.1, it is clear that the organic content is nearly the same for the two used techniques with a difference of 2.67%.
Fig. 3.4. Calcination oven with balance
attachment. Fig. 3.5. Ventilated oven for drying
fibres.
3.3.4. The content of water in fibre The water content is determined in accordance with NF EN ISO 665. The measurement of the content of water bases on the difference in the mass of fibres by drying at 105°C in an oven at atmospheric pressure and fibres in the raw form. A bundle of fibres weighing 5g was placed in a ventilated oven (Fig. 3.5) until practically constant mass is reached. Electric oven, with thermostatic control and good natural ventilation, capable of being regulated so that the temperature of the air and of the shelves in the neighbourhood of the test portions lies between 101 °C and 105 °C in normal operation.
Sample By drying oven By TGA Organic content 80.2 % 82.4% Mineral content 19.8% 17.6%
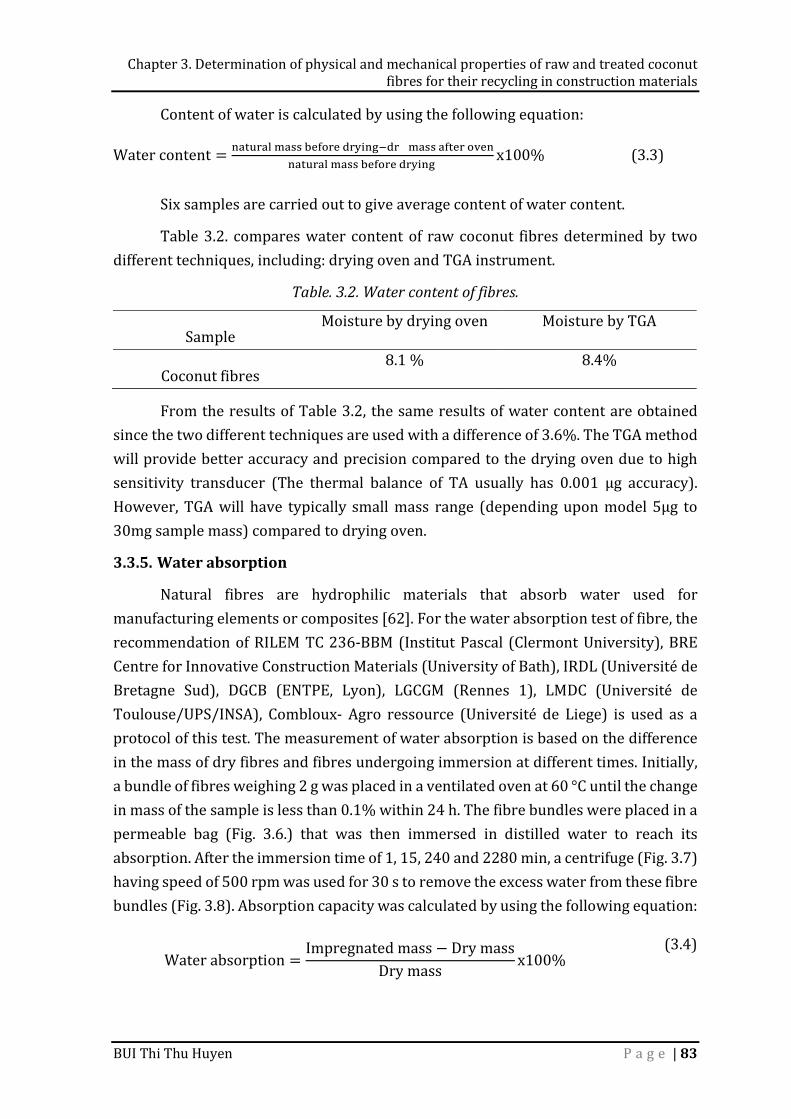
Chapter 3. Determination of physical and mechanical properties of raw and treated coconut fibres for their recycling in construction materials
BUI Thi Thu Huyen P a g e | 83
Content of water is calculated by using the following equation: Water content = x100% (3.3) Six samples are carried out to give average content of water content. Table 3.2. compares water content of raw coconut fibres determined by two different techniques, including: drying oven and TGA instrument.
Table. 3.2. Water content of fibres.
From the results of Table 3.2, the same results of water content are obtained since the two different techniques are used with a difference of 3.6%. The TGA method will provide better accuracy and precision compared to the drying oven due to high sensitivity transducer (The thermal balance of TA usually has 0.001 μg accuracy). However, TGA will have typically small mass range (depending upon model 5μg to 30mg sample mass) compared to drying oven. 3.3.5. Water absorption Natural fibres are hydrophilic materials that absorb water used for manufacturing elements or composites [62]. For the water absorption test of fibre, the recommendation of RILEM TC 236-BBM (Institut Pascal (Clermont University), BRE Centre for Innovative Construction Materials (University of Bath), IRDL (Université de Bretagne Sud), DGCB (ENTPE, Lyon), LGCGM (Rennes 1), LMDC (Université de Toulouse/UPS/INSA), Combloux- Agro ressource (Université de Liege) is used as a protocol of this test. The measurement of water absorption is based on the difference in the mass of dry fibres and fibres undergoing immersion at different times. Initially, a bundle of fibres weighing 2 g was placed in a ventilated oven at 60 °C until the change in mass of the sample is less than 0.1% within 24 h. The fibre bundles were placed in a permeable bag (Fig. 3.6.) that was then immersed in distilled water to reach its absorption. After the immersion time of 1, 15, 240 and 2280 min, a centrifuge (Fig. 3.7) having speed of 500 rpm was used for 30 s to remove the excess water from these fibre bundles (Fig. 3.8). Absorption capacity was calculated by using the following equation:
Water absorption = Impregnated mass − Dry massDry mass x100% (3.4)
Sample Moisture by drying oven Moisture by TGA Coconut fibres 8.1 % 8.4%
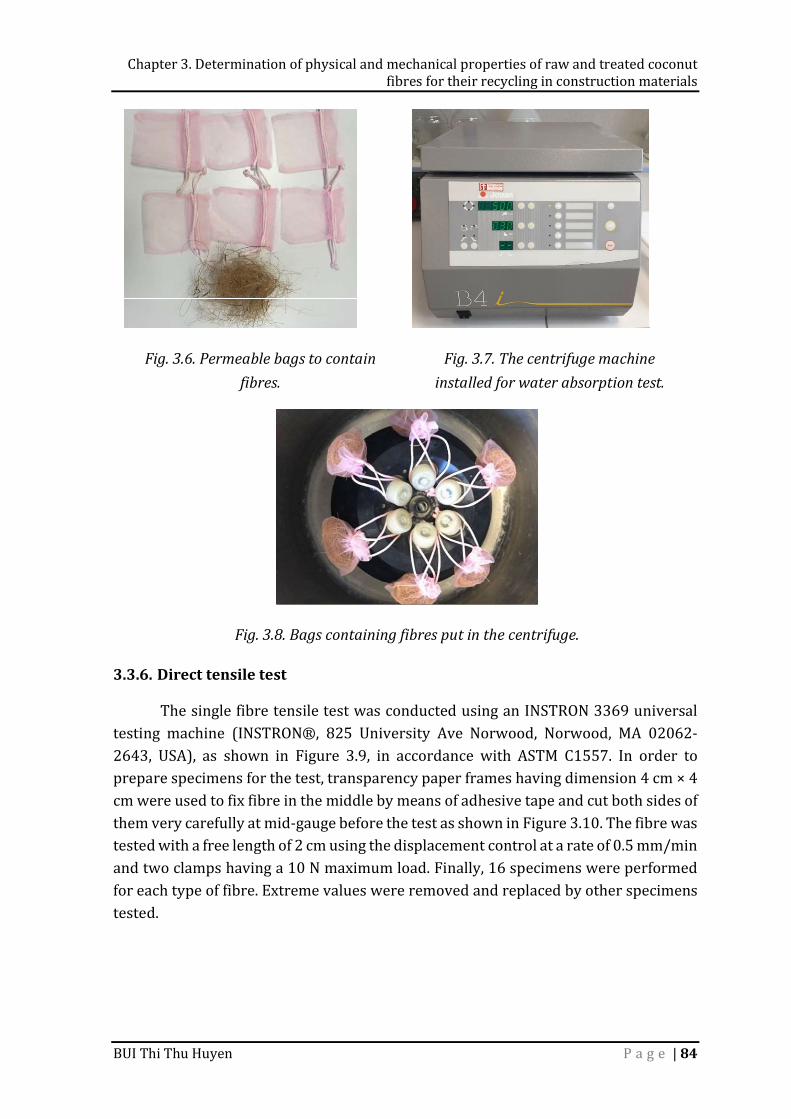
Chapter 3. Determination of physical and mechanical properties of raw and treated coconut fibres for their recycling in construction materials
BUI Thi Thu Huyen P a g e | 84
Fig. 3.6. Permeable bags to contain
fibres. Fig. 3.7. The centrifuge machine
installed for water absorption test.
Fig. 3.8. Bags containing fibres put in the centrifuge.
3.3.6. Direct tensile test The single fibre tensile test was conducted using an INSTRON 3369 universal testing machine (INSTRON®, 825 University Ave Norwood, Norwood, MA 02062-2643, USA), as shown in Figure 3.9, in accordance with ASTM C1557. In order to prepare specimens for the test, transparency paper frames having dimension 4 cm × 4 cm were used to fix fibre in the middle by means of adhesive tape and cut both sides of them very carefully at mid-gauge before the test as shown in Figure 3.10. The fibre was tested with a free length of 2 cm using the displacement control at a rate of 0.5 mm/min and two clamps having a 10 N maximum load. Finally, 16 specimens were performed for each type of fibre. Extreme values were removed and replaced by other specimens tested.

Chapter 3. Determination of physical and mechanical properties of raw and treated coconut fibres for their recycling in construction materials
BUI Thi Thu Huyen P a g e | 85
a. INSTRON 3369 universal testing machine b. Details of grips and specimen.
Fig. 3.9. Setup of the tensile test according to ASTM C1557.
a. Transparency paper frame for fixing fibre b. Cutting of the frame before
fibre testing.
Fig. 3.10. Single fibre specimen before direct tensile test.
The ultimate tensile strength of the fibre is calculated as follows: 𝜎 = 𝐹𝐴 (3.5)
where σ: is ultimate tensile strength, in MPa; Fmax: maximum force at failure, in N; A: is the fibre cross-section area at the fracture plane, in m2. In order to measure the
cross-section of each fibre after the tensile test, a borderline is drawn to define the cross-section area of the fibre, and then the surface area is determined as illustrated in Fig.3.11. The tensile strain of fibre is calculated as follows: ɛ = 𝑥100, (3.6)
Grip
Frame
Sample
Grip
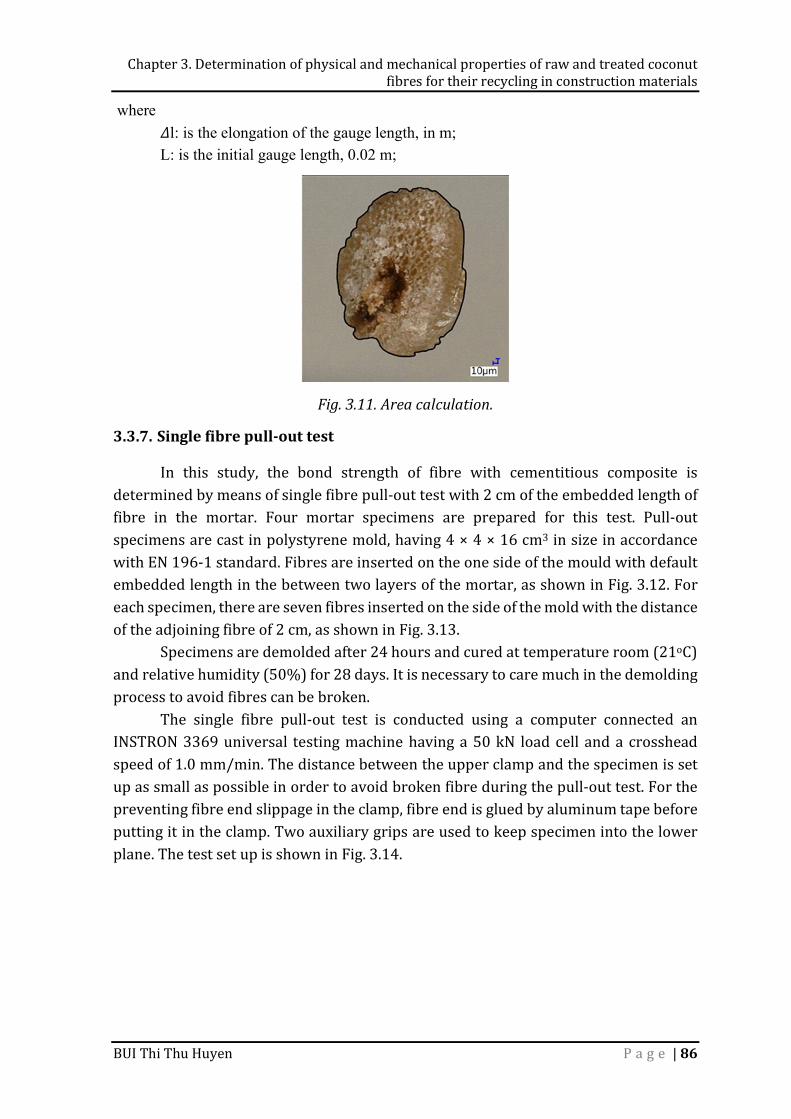
Chapter 3. Determination of physical and mechanical properties of raw and treated coconut fibres for their recycling in construction materials
BUI Thi Thu Huyen P a g e | 86
where 𝛥l: is the elongation of the gauge length, in m; L: is the initial gauge length, 0.02 m;
Fig. 3.11. Area calculation.
3.3.7. Single fibre pull-out test In this study, the bond strength of fibre with cementitious composite is determined by means of single fibre pull-out test with 2 cm of the embedded length of fibre in the mortar. Four mortar specimens are prepared for this test. Pull-out specimens are cast in polystyrene mold, having 4 × 4 × 16 cm3 in size in accordance with EN 196-1 standard. Fibres are inserted on the one side of the mould with default embedded length in the between two layers of the mortar, as shown in Fig. 3.12. For each specimen, there are seven fibres inserted on the side of the mold with the distance of the adjoining fibre of 2 cm, as shown in Fig. 3.13. Specimens are demolded after 24 hours and cured at temperature room (21oC) and relative humidity (50%) for 28 days. It is necessary to care much in the demolding process to avoid fibres can be broken. The single fibre pull-out test is conducted using a computer connected an INSTRON 3369 universal testing machine having a 50 kN load cell and a crosshead speed of 1.0 mm/min. The distance between the upper clamp and the specimen is set up as small as possible in order to avoid broken fibre during the pull-out test. For the preventing fibre end slippage in the clamp, fibre end is glued by aluminum tape before putting it in the clamp. Two auxiliary grips are used to keep specimen into the lower plane. The test set up is shown in Fig. 3.14.
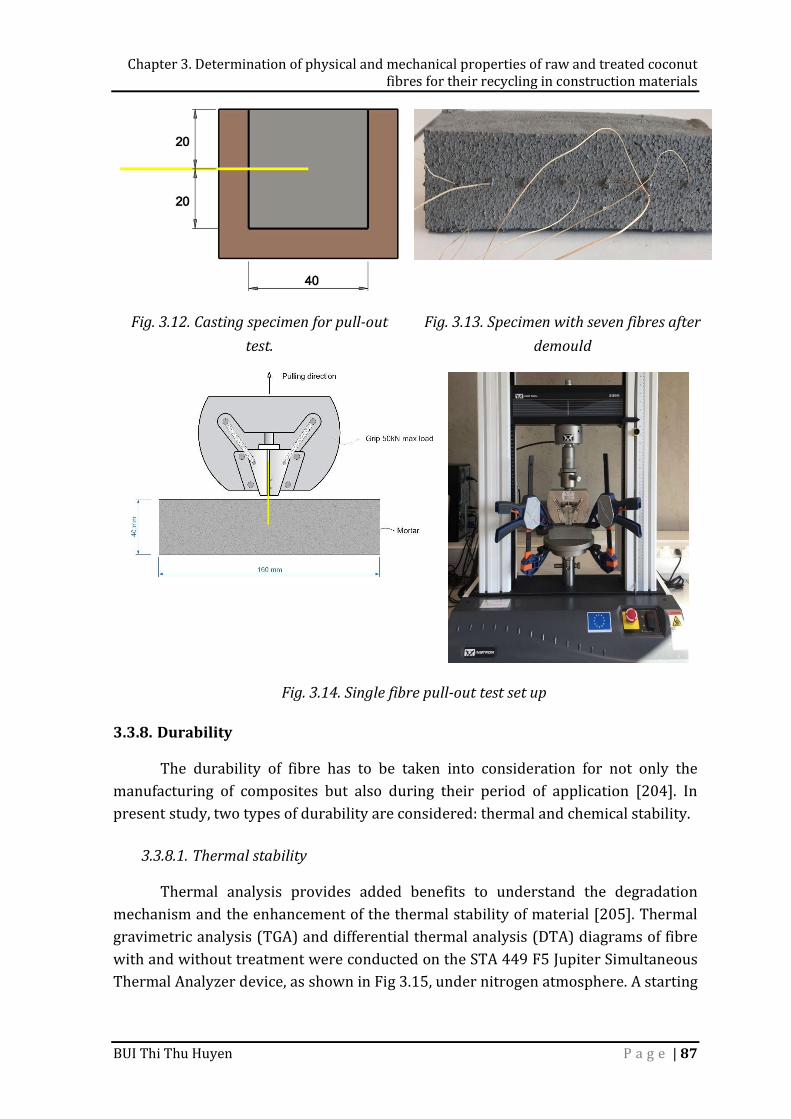
Chapter 3. Determination of physical and mechanical properties of raw and treated coconut fibres for their recycling in construction materials
BUI Thi Thu Huyen P a g e | 87
Fig. 3.12. Casting specimen for pull-out
test. Fig. 3.13. Specimen with seven fibres after
demould
Fig. 3.14. Single fibre pull-out test set up
3.3.8. Durability The durability of fibre has to be taken into consideration for not only the manufacturing of composites but also during their period of application [204]. In present study, two types of durability are considered: thermal and chemical stability. 3.3.8.1. Thermal stability Thermal analysis provides added benefits to understand the degradation mechanism and the enhancement of the thermal stability of material [205]. Thermal gravimetric analysis (TGA) and differential thermal analysis (DTA) diagrams of fibre with and without treatment were conducted on the STA 449 F5 Jupiter Simultaneous Thermal Analyzer device, as shown in Fig 3.15, under nitrogen atmosphere. A starting
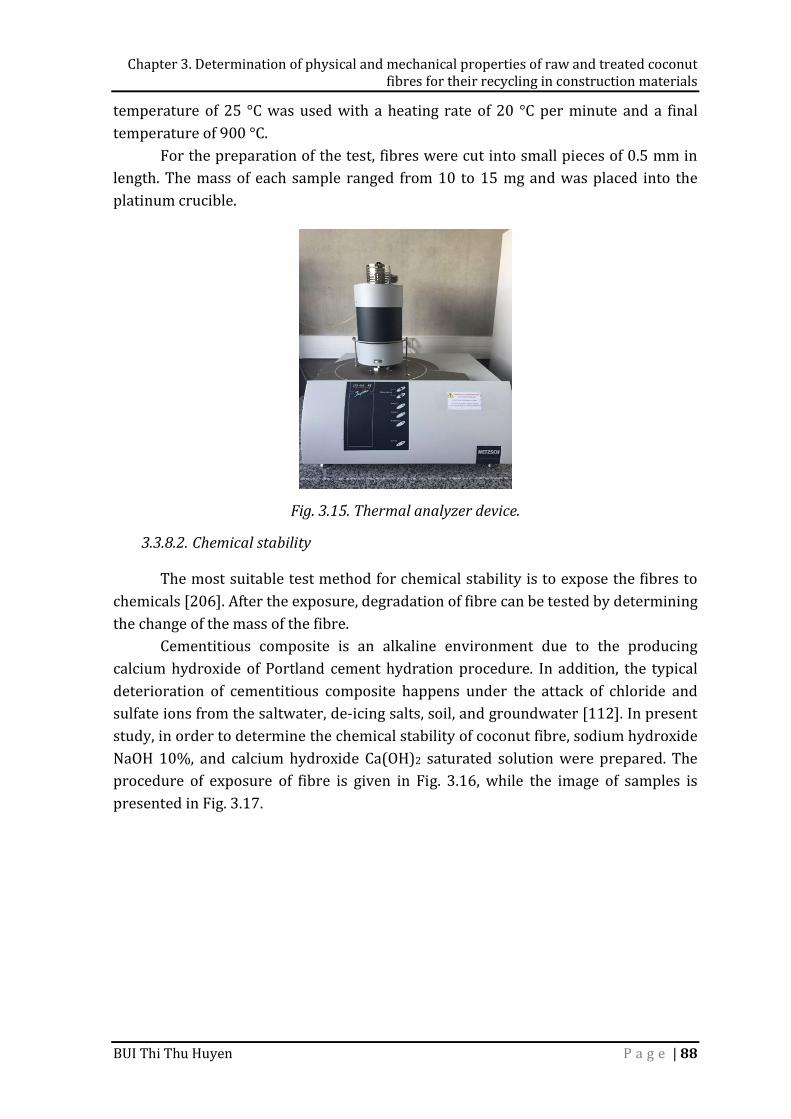
Chapter 3. Determination of physical and mechanical properties of raw and treated coconut fibres for their recycling in construction materials
BUI Thi Thu Huyen P a g e | 88
temperature of 25 °C was used with a heating rate of 20 °C per minute and a final temperature of 900 °C. For the preparation of the test, fibres were cut into small pieces of 0.5 mm in length. The mass of each sample ranged from 10 to 15 mg and was placed into the platinum crucible.
Fig. 3.15. Thermal analyzer device.
3.3.8.2. Chemical stability The most suitable test method for chemical stability is to expose the fibres to chemicals [206]. After the exposure, degradation of fibre can be tested by determining the change of the mass of the fibre. Cementitious composite is an alkaline environment due to the producing calcium hydroxide of Portland cement hydration procedure. In addition, the typical deterioration of cementitious composite happens under the attack of chloride and sulfate ions from the saltwater, de-icing salts, soil, and groundwater [112]. In present study, in order to determine the chemical stability of coconut fibre, sodium hydroxide NaOH 10%, and calcium hydroxide Ca(OH)2 saturated solution were prepared. The procedure of exposure of fibre is given in Fig. 3.16, while the image of samples is presented in Fig. 3.17.
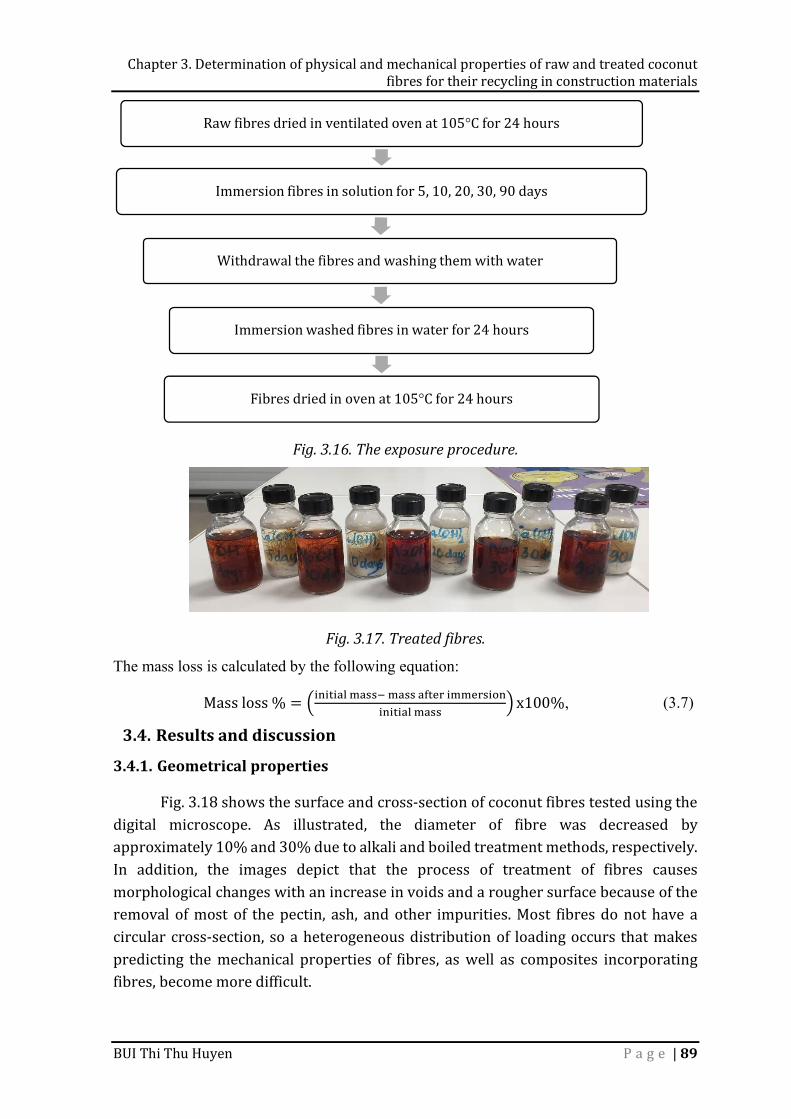
Chapter 3. Determination of physical and mechanical properties of raw and treated coconut fibres for their recycling in construction materials
BUI Thi Thu Huyen P a g e | 89
Fig. 3.16. The exposure procedure.
Fig. 3.17. Treated fibres.
The mass loss is calculated by the following equation: Mass loss % = x100%, (3.7)
3.4. Results and discussion
3.4.1. Geometrical properties Fig. 3.18 shows the surface and cross-section of coconut fibres tested using the digital microscope. As illustrated, the diameter of fibre was decreased by approximately 10% and 30% due to alkali and boiled treatment methods, respectively. In addition, the images depict that the process of treatment of fibres causes morphological changes with an increase in voids and a rougher surface because of the removal of most of the pectin, ash, and other impurities. Most fibres do not have a circular cross-section, so a heterogeneous distribution of loading occurs that makes predicting the mechanical properties of fibres, as well as composites incorporating fibres, become more difficult.
Raw fibres dried in ventilated oven at 105°C for 24 hoursImmersion fibres in solution for 5, 10, 20, 30, 90 daysWithdrawal the fibres and washing them with water
Immersion washed fibres in water for 24 hours Fibres dried in oven at 105°C for 24 hours
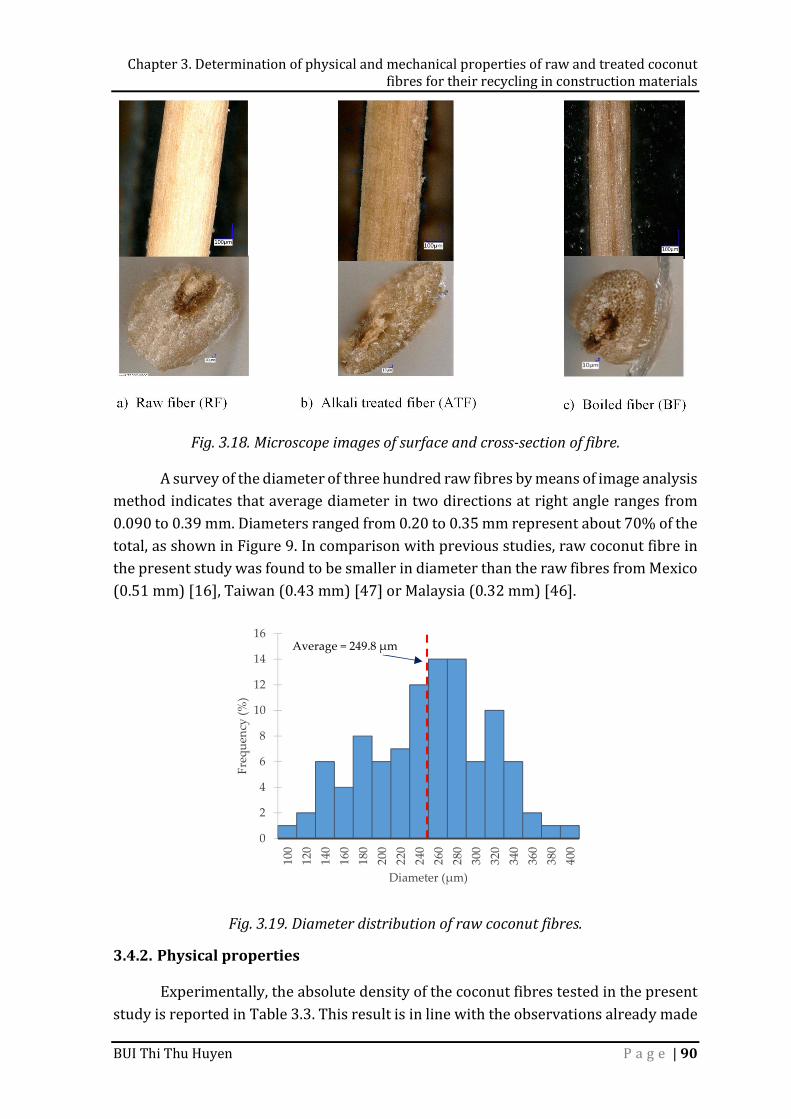
Chapter 3. Determination of physical and mechanical properties of raw and treated coconut fibres for their recycling in construction materials
BUI Thi Thu Huyen P a g e | 90
Fig. 3.18. Microscope images of surface and cross-section of fibre. A survey of the diameter of three hundred raw fibres by means of image analysis method indicates that average diameter in two directions at right angle ranges from 0.090 to 0.39 mm. Diameters ranged from 0.20 to 0.35 mm represent about 70% of the total, as shown in Figure 9. In comparison with previous studies, raw coconut fibre in the present study was found to be smaller in diameter than the raw fibres from Mexico (0.51 mm) [16], Taiwan (0.43 mm) [47] or Malaysia (0.32 mm) [46].
Fig. 3.19. Diameter distribution of raw coconut fibres.
3.4.2. Physical properties Experimentally, the absolute density of the coconut fibres tested in the present study is reported in Table 3.3. This result is in line with the observations already made
0
2
4
6
8
10
12
14
16
100
120
140
160
180
200
220
240
260
280
300
320
340
360
380
400
Freq
uenc
y (%
)
Diameter (μm)
Average = 249.8 μm
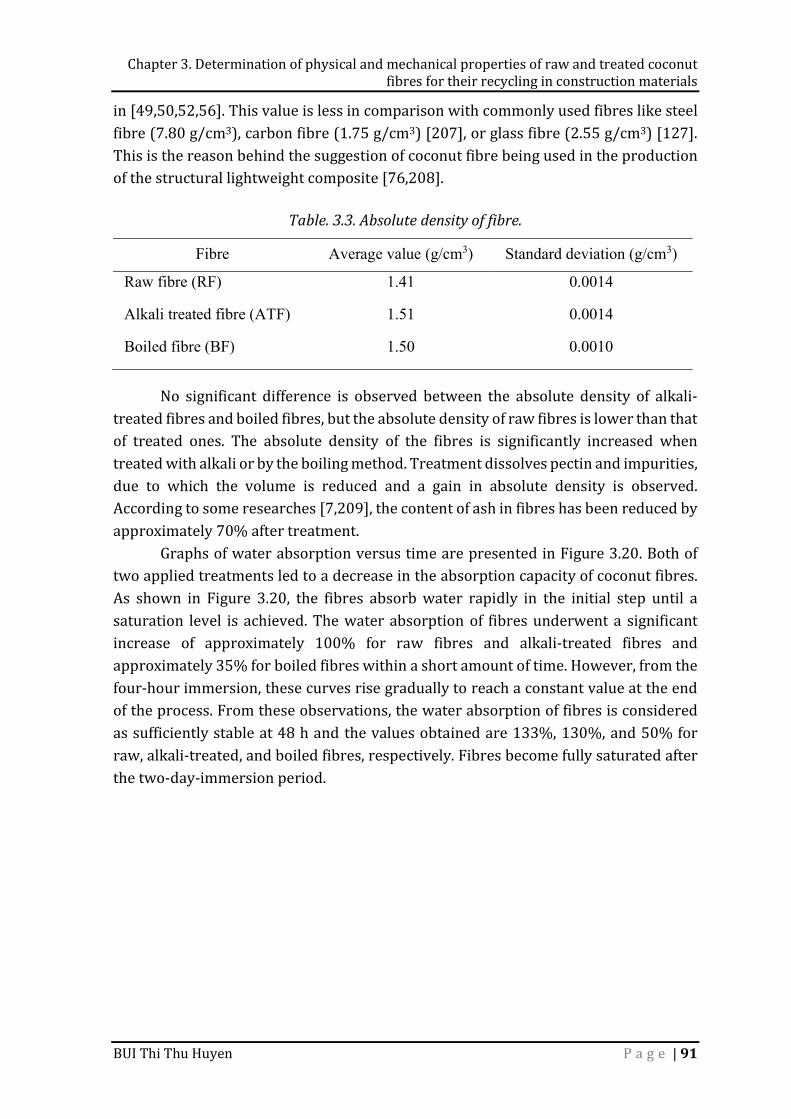
Chapter 3. Determination of physical and mechanical properties of raw and treated coconut fibres for their recycling in construction materials
BUI Thi Thu Huyen P a g e | 91
in [49,50,52,56]. This value is less in comparison with commonly used fibres like steel fibre (7.80 g/cm3), carbon fibre (1.75 g/cm3) [207], or glass fibre (2.55 g/cm3) [127]. This is the reason behind the suggestion of coconut fibre being used in the production of the structural lightweight composite [76,208]. Table. 3.3. Absolute density of fibre.
Fibre Average value (g/cm3) Standard deviation (g/cm3)
Raw fibre (RF) 1.41 0.0014
Alkali treated fibre (ATF) 1.51 0.0014
Boiled fibre (BF) 1.50 0.0010
No significant difference is observed between the absolute density of alkali-treated fibres and boiled fibres, but the absolute density of raw fibres is lower than that of treated ones. The absolute density of the fibres is significantly increased when treated with alkali or by the boiling method. Treatment dissolves pectin and impurities, due to which the volume is reduced and a gain in absolute density is observed. According to some researches [7,209], the content of ash in fibres has been reduced by approximately 70% after treatment. Graphs of water absorption versus time are presented in Figure 3.20. Both of two applied treatments led to a decrease in the absorption capacity of coconut fibres. As shown in Figure 3.20, the fibres absorb water rapidly in the initial step until a saturation level is achieved. The water absorption of fibres underwent a significant increase of approximately 100% for raw fibres and alkali-treated fibres and approximately 35% for boiled fibres within a short amount of time. However, from the four-hour immersion, these curves rise gradually to reach a constant value at the end of the process. From these observations, the water absorption of fibres is considered as sufficiently stable at 48 h and the values obtained are 133%, 130%, and 50% for raw, alkali-treated, and boiled fibres, respectively. Fibres become fully saturated after the two-day-immersion period.
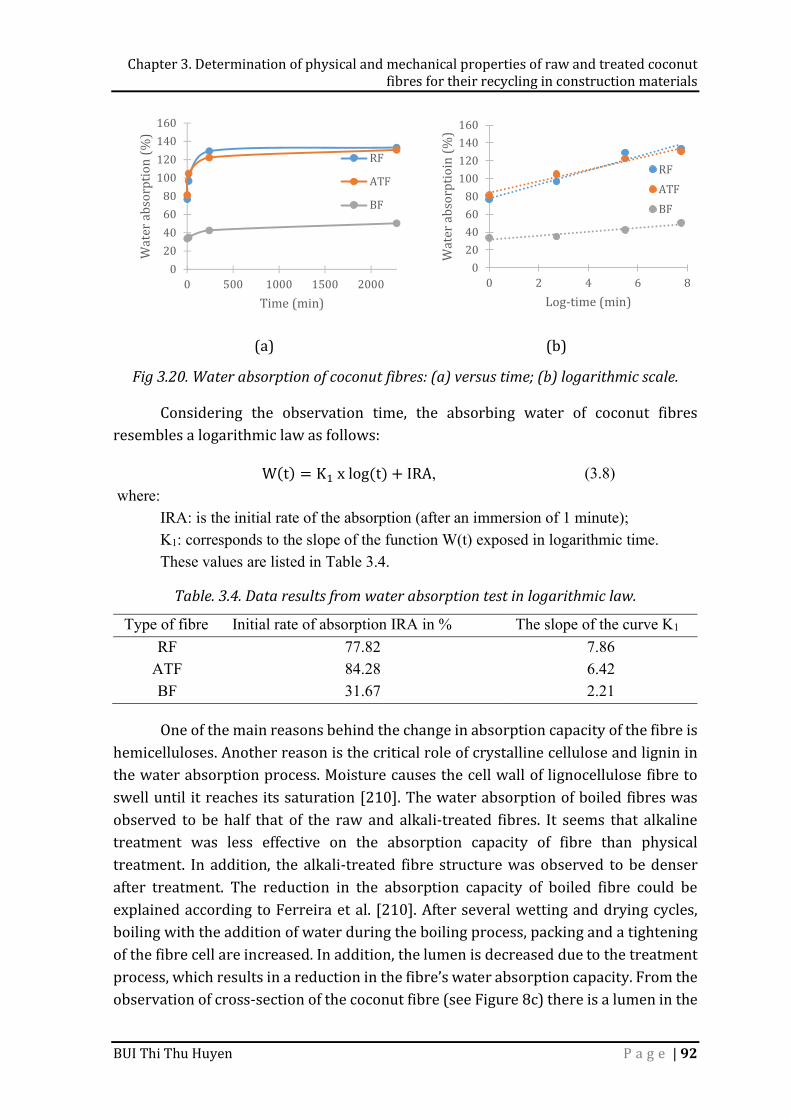
Chapter 3. Determination of physical and mechanical properties of raw and treated coconut fibres for their recycling in construction materials
BUI Thi Thu Huyen P a g e | 92
(a) (b) Fig 3.20. Water absorption of coconut fibres: (a) versus time; (b) logarithmic scale. Considering the observation time, the absorbing water of coconut fibres resembles a logarithmic law as follows: W(t) = K x log(t) + IRA, (3.8)
where: IRA: is the initial rate of the absorption (after an immersion of 1 minute); K1: corresponds to the slope of the function W(t) exposed in logarithmic time. These values are listed in Table 3.4.
Table. 3.4. Data results from water absorption test in logarithmic law.
Type of fibre Initial rate of absorption IRA in % The slope of the curve K1 RF 77.82 7.86
ATF 84.28 6.42 BF 31.67 2.21 One of the main reasons behind the change in absorption capacity of the fibre is hemicelluloses. Another reason is the critical role of crystalline cellulose and lignin in the water absorption process. Moisture causes the cell wall of lignocellulose fibre to swell until it reaches its saturation [210]. The water absorption of boiled fibres was observed to be half that of the raw and alkali-treated fibres. It seems that alkaline treatment was less effective on the absorption capacity of fibre than physical treatment. In addition, the alkali-treated fibre structure was observed to be denser after treatment. The reduction in the absorption capacity of boiled fibre could be explained according to Ferreira et al. [210]. After several wetting and drying cycles, boiling with the addition of water during the boiling process, packing and a tightening of the fibre cell are increased. In addition, the lumen is decreased due to the treatment process, which results in a reduction in the fibre’s water absorption capacity. From the observation of cross-section of the coconut fibre (see Figure 8c) there is a lumen in the
020406080100120140160
0 500 1000 1500 2000Water absorp
tion (%)
Time (min)
RFATFBF020406080100120140160
0 2 4 6 8Water absorp
tioin (%)
Log-time (min)
RFATFBF
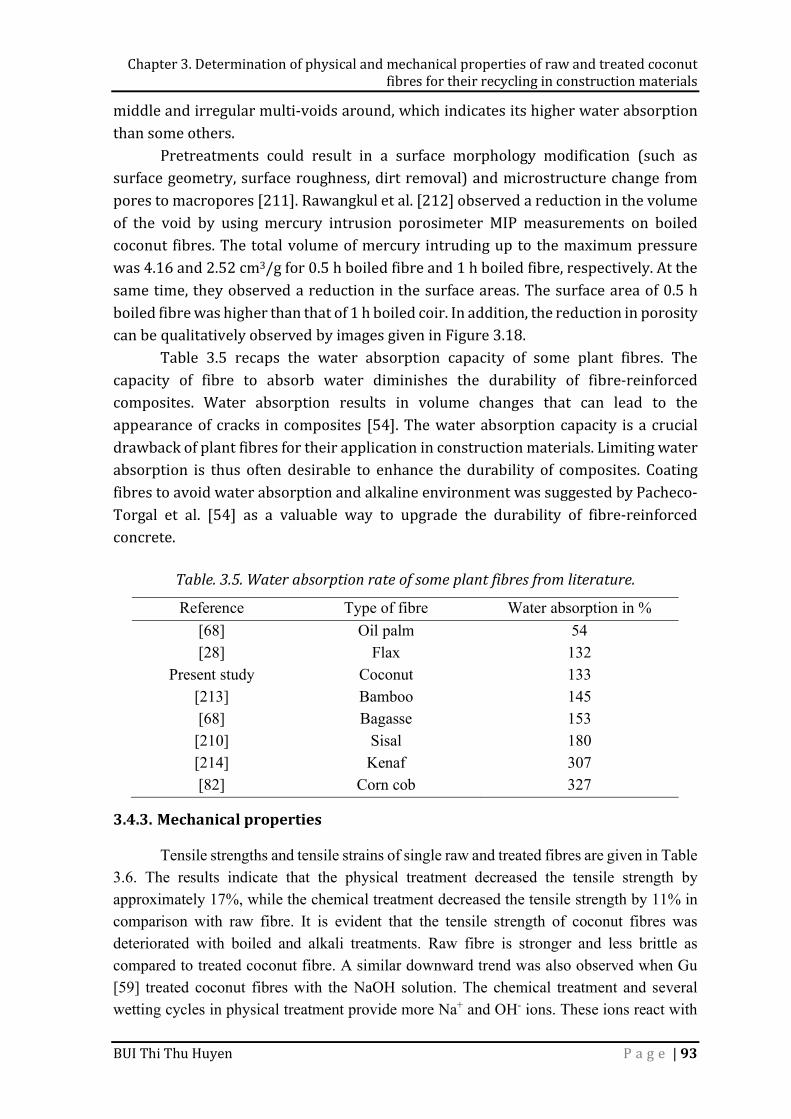
Chapter 3. Determination of physical and mechanical properties of raw and treated coconut fibres for their recycling in construction materials
BUI Thi Thu Huyen P a g e | 93
middle and irregular multi-voids around, which indicates its higher water absorption than some others. Pretreatments could result in a surface morphology modification (such as surface geometry, surface roughness, dirt removal) and microstructure change from pores to macropores [211]. Rawangkul et al. [212] observed a reduction in the volume of the void by using mercury intrusion porosimeter MIP measurements on boiled coconut fibres. The total volume of mercury intruding up to the maximum pressure was 4.16 and 2.52 cm3/g for 0.5 h boiled fibre and 1 h boiled fibre, respectively. At the same time, they observed a reduction in the surface areas. The surface area of 0.5 h boiled fibre was higher than that of 1 h boiled coir. In addition, the reduction in porosity can be qualitatively observed by images given in Figure 3.18. Table 3.5 recaps the water absorption capacity of some plant fibres. The capacity of fibre to absorb water diminishes the durability of fibre-reinforced composites. Water absorption results in volume changes that can lead to the appearance of cracks in composites [54]. The water absorption capacity is a crucial drawback of plant fibres for their application in construction materials. Limiting water absorption is thus often desirable to enhance the durability of composites. Coating fibres to avoid water absorption and alkaline environment was suggested by Pacheco-Torgal et al. [54] as a valuable way to upgrade the durability of fibre-reinforced concrete. Table. 3.5. Water absorption rate of some plant fibres from literature.
Reference Type of fibre Water absorption in % [68] Oil palm 54 [28] Flax 132
Present study Coconut 133 [213] Bamboo 145 [68] Bagasse 153 [210] Sisal 180 [214] Kenaf 307 [82] Corn cob 327
3.4.3. Mechanical properties
Tensile strengths and tensile strains of single raw and treated fibres are given in Table 3.6. The results indicate that the physical treatment decreased the tensile strength by approximately 17%, while the chemical treatment decreased the tensile strength by 11% in comparison with raw fibre. It is evident that the tensile strength of coconut fibres was deteriorated with boiled and alkali treatments. Raw fibre is stronger and less brittle as compared to treated coconut fibre. A similar downward trend was also observed when Gu [59] treated coconut fibres with the NaOH solution. The chemical treatment and several wetting cycles in physical treatment provide more Na+ and OH- ions. These ions react with
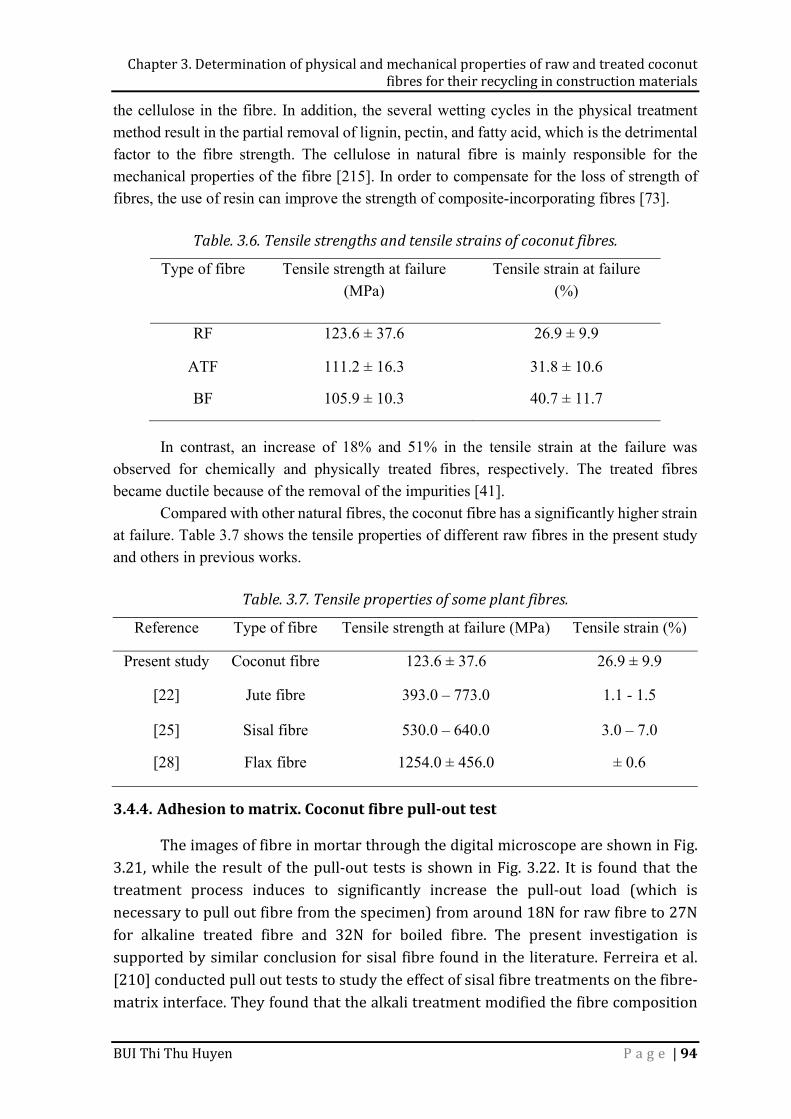
Chapter 3. Determination of physical and mechanical properties of raw and treated coconut fibres for their recycling in construction materials
BUI Thi Thu Huyen P a g e | 94
the cellulose in the fibre. In addition, the several wetting cycles in the physical treatment method result in the partial removal of lignin, pectin, and fatty acid, which is the detrimental factor to the fibre strength. The cellulose in natural fibre is mainly responsible for the mechanical properties of the fibre [215]. In order to compensate for the loss of strength of fibres, the use of resin can improve the strength of composite-incorporating fibres [73].
Table. 3.6. Tensile strengths and tensile strains of coconut fibres.
Type of fibre Tensile strength at failure (MPa)
Tensile strain at failure (%)
RF 123.6 ± 37.6 26.9 ± 9.9
ATF 111.2 ± 16.3 31.8 ± 10.6
BF 105.9 ± 10.3 40.7 ± 11.7
In contrast, an increase of 18% and 51% in the tensile strain at the failure was observed for chemically and physically treated fibres, respectively. The treated fibres became ductile because of the removal of the impurities [41].
Compared with other natural fibres, the coconut fibre has a significantly higher strain at failure. Table 3.7 shows the tensile properties of different raw fibres in the present study and others in previous works.
Table. 3.7. Tensile properties of some plant fibres.
Reference Type of fibre Tensile strength at failure (MPa) Tensile strain (%)
Present study Coconut fibre 123.6 ± 37.6 26.9 ± 9.9
[22] Jute fibre 393.0 – 773.0 1.1 - 1.5
[25] Sisal fibre 530.0 – 640.0 3.0 – 7.0
[28] Flax fibre 1254.0 ± 456.0 ± 0.6
3.4.4. Adhesion to matrix. Coconut fibre pull-out test The images of fibre in mortar through the digital microscope are shown in Fig. 3.21, while the result of the pull-out tests is shown in Fig. 3.22. It is found that the treatment process induces to significantly increase the pull-out load (which is necessary to pull out fibre from the specimen) from around 18N for raw fibre to 27N for alkaline treated fibre and 32N for boiled fibre. The present investigation is supported by similar conclusion for sisal fibre found in the literature. Ferreira et al. [210] conducted pull out tests to study the effect of sisal fibre treatments on the fibre-matrix interface. They found that the alkali treatment modified the fibre composition
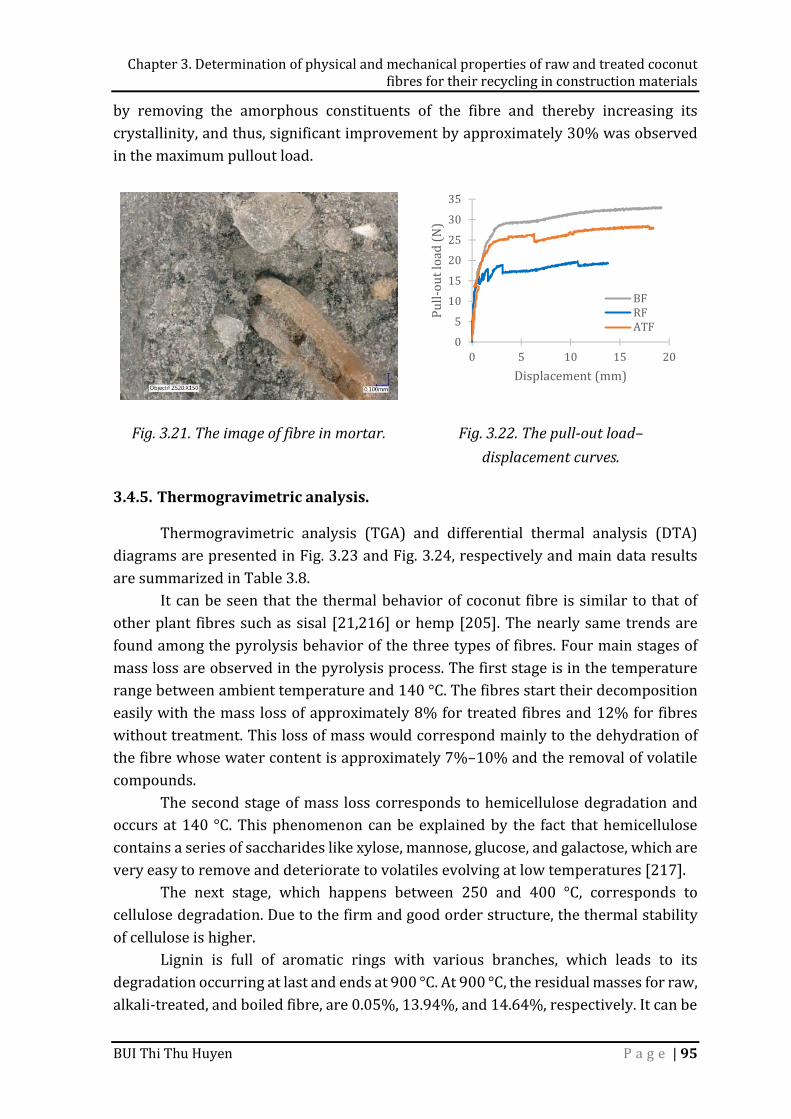
Chapter 3. Determination of physical and mechanical properties of raw and treated coconut fibres for their recycling in construction materials
BUI Thi Thu Huyen P a g e | 95
by removing the amorphous constituents of the fibre and thereby increasing its crystallinity, and thus, significant improvement by approximately 30% was observed in the maximum pullout load.
Fig. 3.21. The image of fibre in mortar. Fig. 3.22. The pull-out load–
displacement curves.
3.4.5. Thermogravimetric analysis. Thermogravimetric analysis (TGA) and differential thermal analysis (DTA) diagrams are presented in Fig. 3.23 and Fig. 3.24, respectively and main data results are summarized in Table 3.8. It can be seen that the thermal behavior of coconut fibre is similar to that of other plant fibres such as sisal [21,216] or hemp [205]. The nearly same trends are found among the pyrolysis behavior of the three types of fibres. Four main stages of mass loss are observed in the pyrolysis process. The first stage is in the temperature range between ambient temperature and 140 °C. The fibres start their decomposition easily with the mass loss of approximately 8% for treated fibres and 12% for fibres without treatment. This loss of mass would correspond mainly to the dehydration of the fibre whose water content is approximately 7%–10% and the removal of volatile compounds. The second stage of mass loss corresponds to hemicellulose degradation and occurs at 140 °C. This phenomenon can be explained by the fact that hemicellulose contains a series of saccharides like xylose, mannose, glucose, and galactose, which are very easy to remove and deteriorate to volatiles evolving at low temperatures [217]. The next stage, which happens between 250 and 400 °C, corresponds to cellulose degradation. Due to the firm and good order structure, the thermal stability of cellulose is higher. Lignin is full of aromatic rings with various branches, which leads to its degradation occurring at last and ends at 900 °C. At 900 °C, the residual masses for raw, alkali-treated, and boiled fibre, are 0.05%, 13.94%, and 14.64%, respectively. It can be
05101520253035
0 5 10 15 20Pull-ou
t load (N)
Displacement (mm)BFRFATF
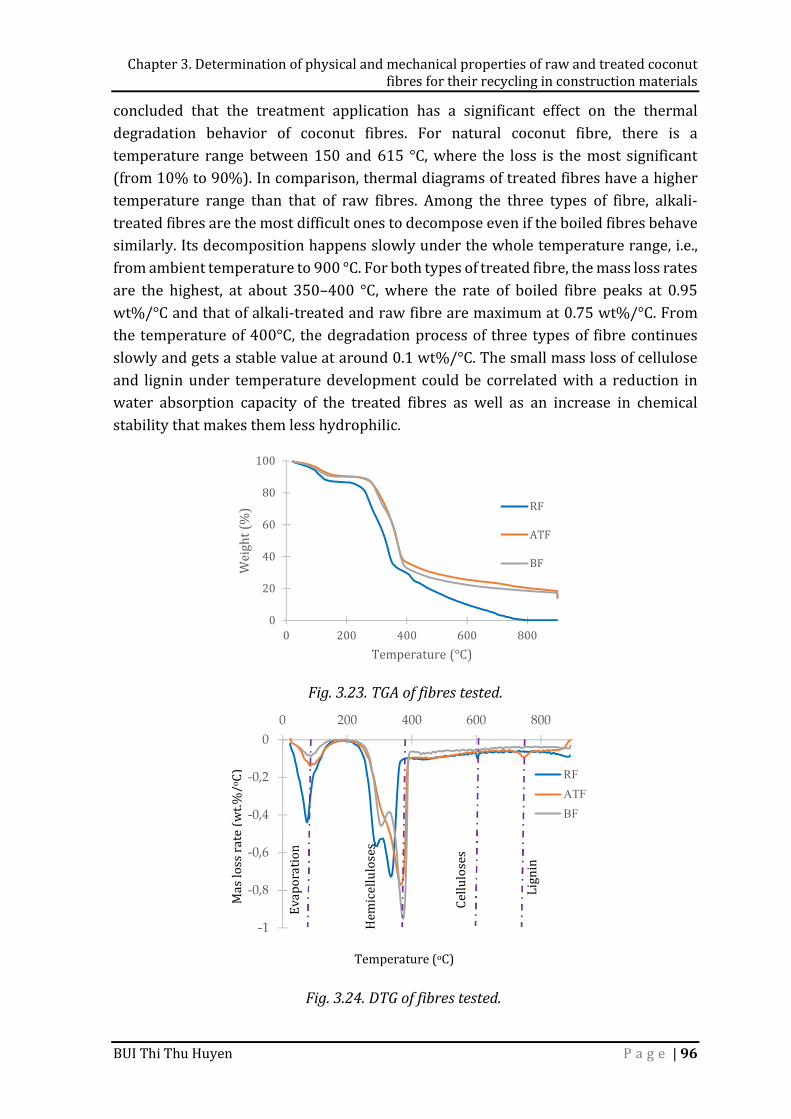
Chapter 3. Determination of physical and mechanical properties of raw and treated coconut fibres for their recycling in construction materials
BUI Thi Thu Huyen P a g e | 96
concluded that the treatment application has a significant effect on the thermal degradation behavior of coconut fibres. For natural coconut fibre, there is a temperature range between 150 and 615 °C, where the loss is the most significant (from 10% to 90%). In comparison, thermal diagrams of treated fibres have a higher temperature range than that of raw fibres. Among the three types of fibre, alkali-treated fibres are the most difficult ones to decompose even if the boiled fibres behave similarly. Its decomposition happens slowly under the whole temperature range, i.e., from ambient temperature to 900 °C. For both types of treated fibre, the mass loss rates are the highest, at about 350–400 °C, where the rate of boiled fibre peaks at 0.95 wt%/°C and that of alkali-treated and raw fibre are maximum at 0.75 wt%/°C. From the temperature of 400°C, the degradation process of three types of fibre continues slowly and gets a stable value at around 0.1 wt%/°C. The small mass loss of cellulose and lignin under temperature development could be correlated with a reduction in water absorption capacity of the treated fibres as well as an increase in chemical stability that makes them less hydrophilic.
Fig. 3.23. TGA of fibres tested.
Fig. 3.24. DTG of fibres tested.
020406080100
0 200 400 600 800
Weight (%)
Temperature (°C)
RFATFBF
Temperature (oC)
Mas loss rate (
wt.%/o C)
-1
-0,8
-0,6
-0,4
-0,2
00 200 400 600 800
RFATFBF
Evaporation
Hemicellulose
s Cellulo
ses Lignin
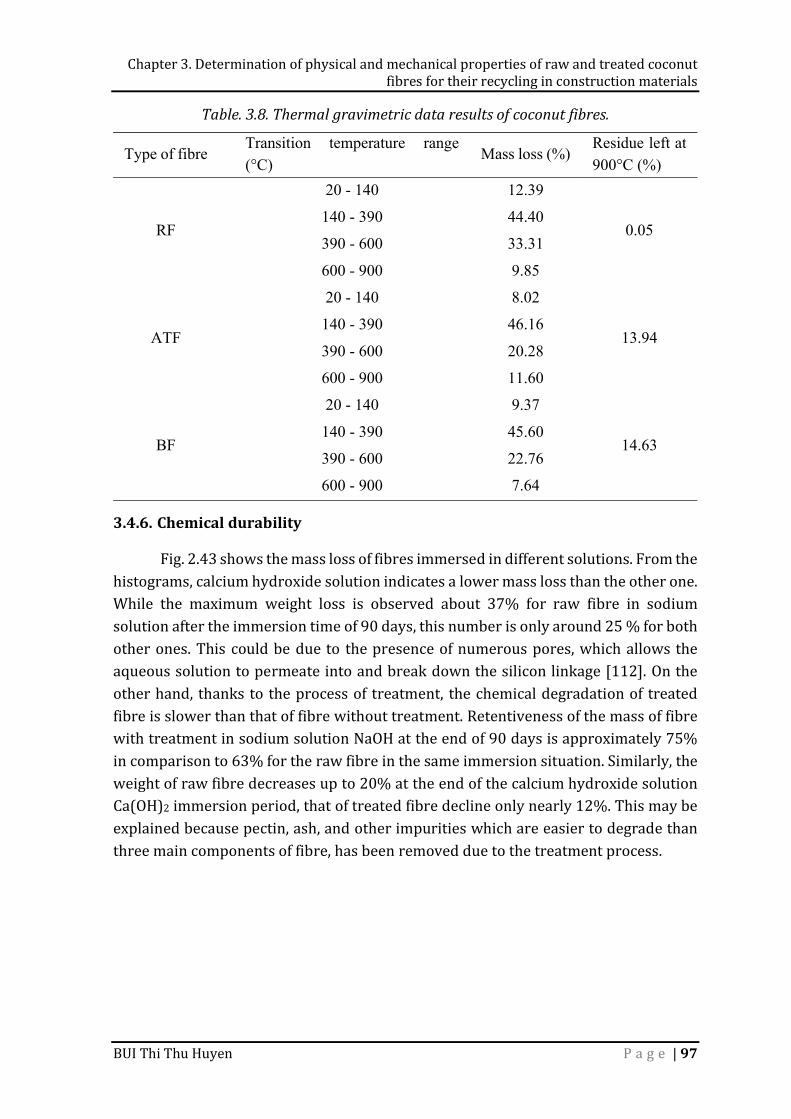
Chapter 3. Determination of physical and mechanical properties of raw and treated coconut fibres for their recycling in construction materials
BUI Thi Thu Huyen P a g e | 97
Table. 3.8. Thermal gravimetric data results of coconut fibres.
Type of fibre Transition temperature range
(°C) Mass loss (%)
Residue left at 900°C (%)
RF
20 - 140 12.39
0.05 140 - 390 44.40 390 - 600 33.31 600 - 900 9.85
ATF
20 - 140 8.02
13.94 140 - 390 46.16 390 - 600 20.28 600 - 900 11.60
BF
20 - 140 9.37
14.63 140 - 390 45.60 390 - 600 22.76 600 - 900 7.64
3.4.6. Chemical durability Fig. 2.43 shows the mass loss of fibres immersed in different solutions. From the histograms, calcium hydroxide solution indicates a lower mass loss than the other one. While the maximum weight loss is observed about 37% for raw fibre in sodium solution after the immersion time of 90 days, this number is only around 25 % for both other ones. This could be due to the presence of numerous pores, which allows the aqueous solution to permeate into and break down the silicon linkage [112]. On the other hand, thanks to the process of treatment, the chemical degradation of treated fibre is slower than that of fibre without treatment. Retentiveness of the mass of fibre with treatment in sodium solution NaOH at the end of 90 days is approximately 75% in comparison to 63% for the raw fibre in the same immersion situation. Similarly, the weight of raw fibre decreases up to 20% at the end of the calcium hydroxide solution Ca(OH)2 immersion period, that of treated fibre decline only nearly 12%. This may be explained because pectin, ash, and other impurities which are easier to degrade than three main components of fibre, has been removed due to the treatment process.
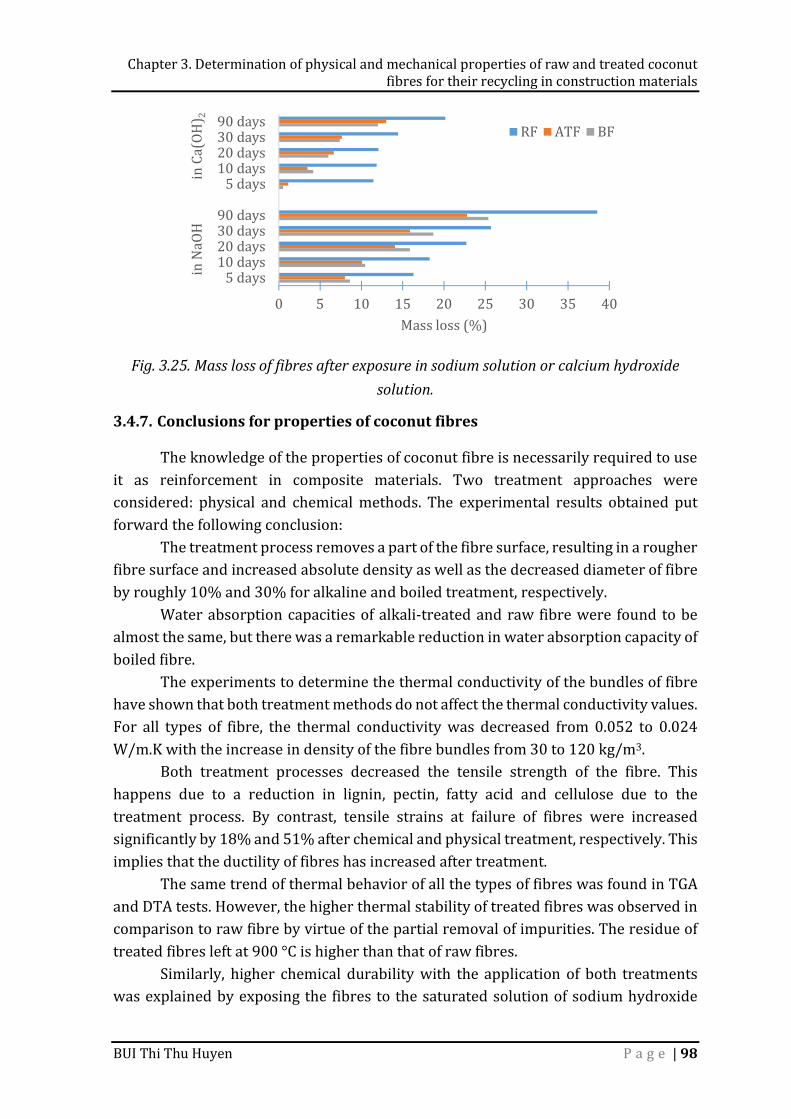
Chapter 3. Determination of physical and mechanical properties of raw and treated coconut fibres for their recycling in construction materials
BUI Thi Thu Huyen P a g e | 98
Fig. 3.25. Mass loss of fibres after exposure in sodium solution or calcium hydroxide solution.
3.4.7. Conclusions for properties of coconut fibres The knowledge of the properties of coconut fibre is necessarily required to use it as reinforcement in composite materials. Two treatment approaches were considered: physical and chemical methods. The experimental results obtained put forward the following conclusion: The treatment process removes a part of the fibre surface, resulting in a rougher fibre surface and increased absolute density as well as the decreased diameter of fibre by roughly 10% and 30% for alkaline and boiled treatment, respectively. Water absorption capacities of alkali-treated and raw fibre were found to be almost the same, but there was a remarkable reduction in water absorption capacity of boiled fibre. The experiments to determine the thermal conductivity of the bundles of fibre have shown that both treatment methods do not affect the thermal conductivity values. For all types of fibre, the thermal conductivity was decreased from 0.052 to 0.024 W/m.K with the increase in density of the fibre bundles from 30 to 120 kg/m3. Both treatment processes decreased the tensile strength of the fibre. This happens due to a reduction in lignin, pectin, fatty acid and cellulose due to the treatment process. By contrast, tensile strains at failure of fibres were increased significantly by 18% and 51% after chemical and physical treatment, respectively. This implies that the ductility of fibres has increased after treatment. The same trend of thermal behavior of all the types of fibres was found in TGA and DTA tests. However, the higher thermal stability of treated fibres was observed in comparison to raw fibre by virtue of the partial removal of impurities. The residue of treated fibres left at 900 °C is higher than that of raw fibres. Similarly, higher chemical durability with the application of both treatments was explained by exposing the fibres to the saturated solution of sodium hydroxide
0 5 10 15 20 25 30 35 405 days10 days20 days30 days90 days5 days10 days20 days30 days90 days
Mass loss (%)
in NaOH
in Ca(OH) 2 RF ATF BF
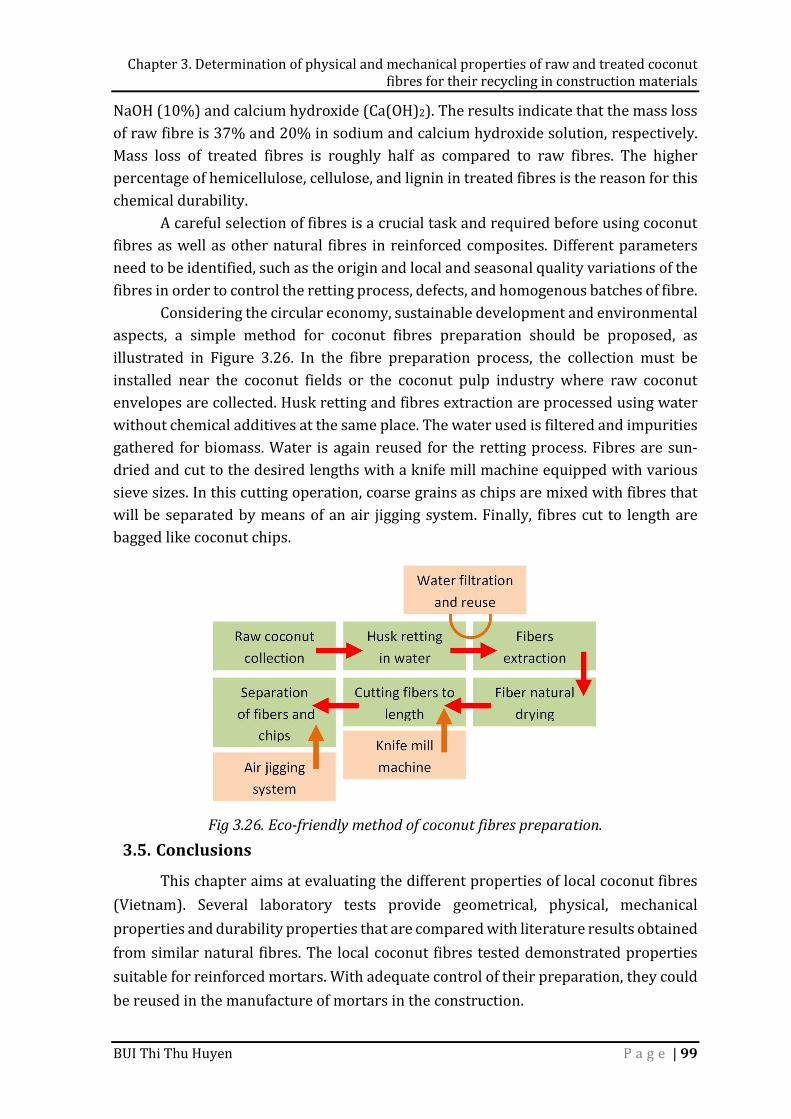
Chapter 3. Determination of physical and mechanical properties of raw and treated coconut fibres for their recycling in construction materials
BUI Thi Thu Huyen P a g e | 99
NaOH (10%) and calcium hydroxide (Ca(OH)2). The results indicate that the mass loss of raw fibre is 37% and 20% in sodium and calcium hydroxide solution, respectively. Mass loss of treated fibres is roughly half as compared to raw fibres. The higher percentage of hemicellulose, cellulose, and lignin in treated fibres is the reason for this chemical durability. A careful selection of fibres is a crucial task and required before using coconut fibres as well as other natural fibres in reinforced composites. Different parameters need to be identified, such as the origin and local and seasonal quality variations of the fibres in order to control the retting process, defects, and homogenous batches of fibre. Considering the circular economy, sustainable development and environmental aspects, a simple method for coconut fibres preparation should be proposed, as illustrated in Figure 3.26. In the fibre preparation process, the collection must be installed near the coconut fields or the coconut pulp industry where raw coconut envelopes are collected. Husk retting and fibres extraction are processed using water without chemical additives at the same place. The water used is filtered and impurities gathered for biomass. Water is again reused for the retting process. Fibres are sun-dried and cut to the desired lengths with a knife mill machine equipped with various sieve sizes. In this cutting operation, coarse grains as chips are mixed with fibres that will be separated by means of an air jigging system. Finally, fibres cut to length are bagged like coconut chips.
Fig 3.26. Eco-friendly method of coconut fibres preparation. 3.5. Conclusions This chapter aims at evaluating the different properties of local coconut fibres (Vietnam). Several laboratory tests provide geometrical, physical, mechanical properties and durability properties that are compared with literature results obtained from similar natural fibres. The local coconut fibres tested demonstrated properties suitable for reinforced mortars. With adequate control of their preparation, they could be reused in the manufacture of mortars in the construction.
Chapter 3. Determination of physical and mechanical properties of raw and treated coconut fibres for their recycling in construction materials
BUI Thi Thu Huyen P a g e | 100
After having better understanding properties of the raw materials used, the next chapter is an essential step of this study: Behavior of fibres reinforced mortar - Distribution, orientation of fibres and cracks formation.
Chapter 4. Behavior of fibres reinforced mortar: Distribution, orientation and cracks formation
BUI Thi Thu Huyen P a g e | 101
CHAPTER 4. BEHAVOIR OF FIBRES REINFORCED MORTAR: DISTRIBUTION, ORIENTATION OF FIBRES AND CRACKS
FORMATION
4.1. Introduction Based on the remarkable results of the addition of fibres in composite in previous studies, it is necessary to investigate comprehensively the effects of partial replacement of fine aggregate by natural fibres in mortar for enhancing the mechanical properties as well as durability of mortar incorporating fibres. In need, partial replacement of natural fibres will be clarified to determine the sufficient amount of fibres in mortar. The present chapter compared the mechanical properties of fibres reinforced mortar with different incorporation levels of fibres with the goals as follows: - To determine a suitable method for using coconut fibre in mortar for the sake of improving the mechanical properties of mortar. - From the experimental data, the optimum dosage of fibres for mortar can be detected. Cracking behavior and orientation distribution of fibres in mortar is also then determined to control mechanical cracks in the composite. In order to clarify the influence of coconut fibre volume fraction on the mechanical properties of mortars, compressive and flexural strengths are determined
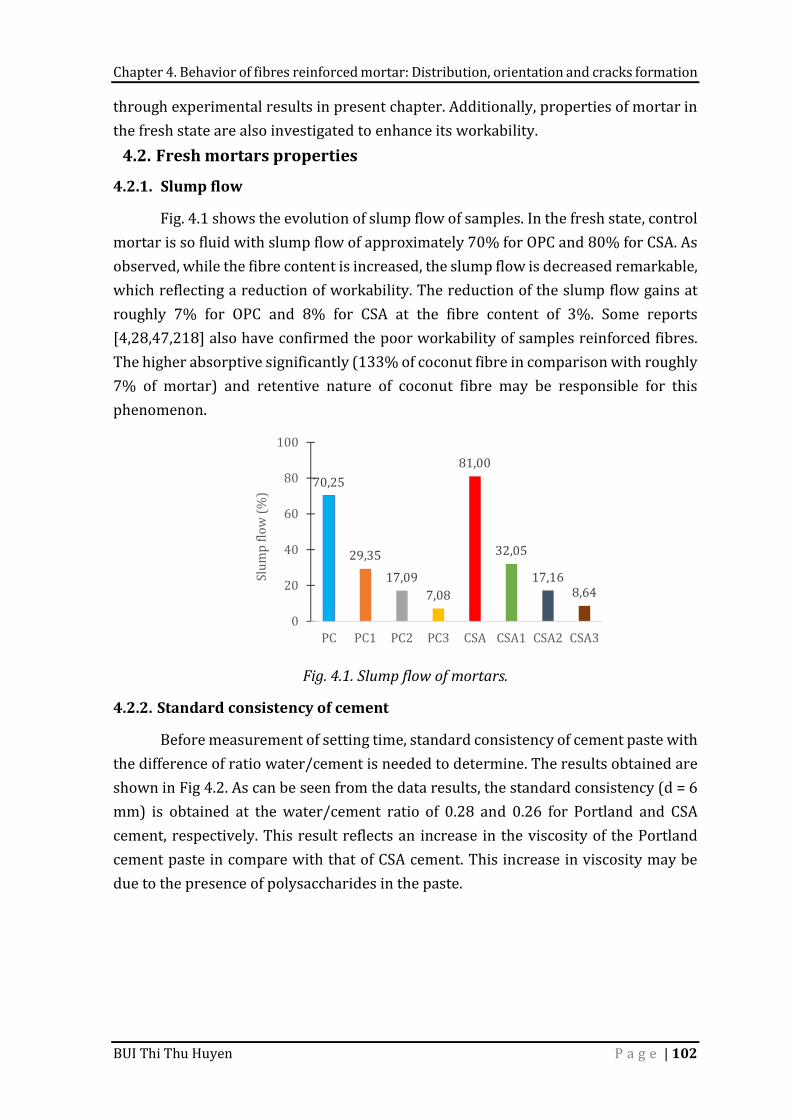
Chapter 4. Behavior of fibres reinforced mortar: Distribution, orientation and cracks formation
BUI Thi Thu Huyen P a g e | 102
through experimental results in present chapter. Additionally, properties of mortar in the fresh state are also investigated to enhance its workability. 4.2. Fresh mortars properties
4.2.1. Slump flow Fig. 4.1 shows the evolution of slump flow of samples. In the fresh state, control mortar is so fluid with slump flow of approximately 70% for OPC and 80% for CSA. As observed, while the fibre content is increased, the slump flow is decreased remarkable, which reflecting a reduction of workability. The reduction of the slump flow gains at roughly 7% for OPC and 8% for CSA at the fibre content of 3%. Some reports [4,28,47,218] also have confirmed the poor workability of samples reinforced fibres. The higher absorptive significantly (133% of coconut fibre in comparison with roughly 7% of mortar) and retentive nature of coconut fibre may be responsible for this phenomenon.
Fig. 4.1. Slump flow of mortars.
4.2.2. Standard consistency of cement Before measurement of setting time, standard consistency of cement paste with the difference of ratio water/cement is needed to determine. The results obtained are shown in Fig 4.2. As can be seen from the data results, the standard consistency (d = 6 mm) is obtained at the water/cement ratio of 0.28 and 0.26 for Portland and CSA cement, respectively. This result reflects an increase in the viscosity of the Portland cement paste in compare with that of CSA cement. This increase in viscosity may be due to the presence of polysaccharides in the paste.
70,2529,35 17,09 7,08
81,0032,05 17,16 8,64020406080100
PC PC1 PC2 PC3 CSA CSA1 CSA2 CSA3
Slump flow (%
)
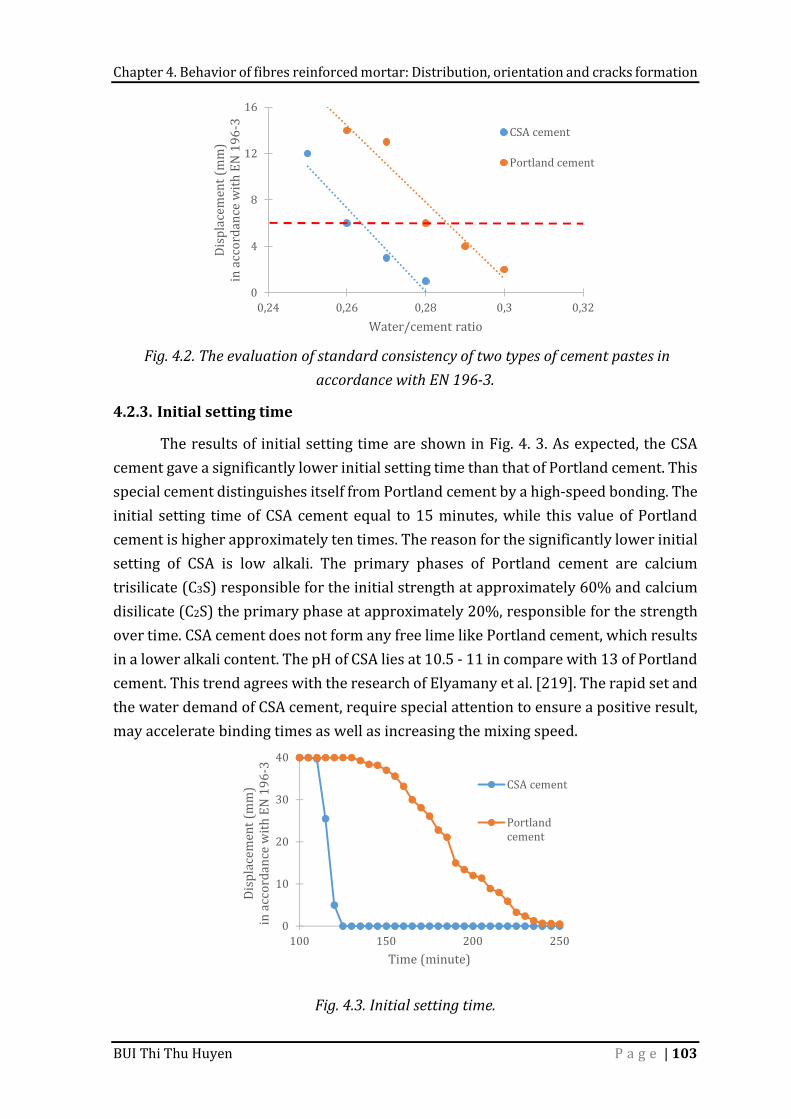
Chapter 4. Behavior of fibres reinforced mortar: Distribution, orientation and cracks formation
BUI Thi Thu Huyen P a g e | 103
Fig. 4.2. The evaluation of standard consistency of two types of cement pastes in accordance with EN 196-3.
4.2.3. Initial setting time The results of initial setting time are shown in Fig. 4. 3. As expected, the CSA cement gave a significantly lower initial setting time than that of Portland cement. This special cement distinguishes itself from Portland cement by a high-speed bonding. The initial setting time of CSA cement equal to 15 minutes, while this value of Portland cement is higher approximately ten times. The reason for the significantly lower initial setting of CSA is low alkali. The primary phases of Portland cement are calcium trisilicate (C3S) responsible for the initial strength at approximately 60% and calcium disilicate (C2S) the primary phase at approximately 20%, responsible for the strength over time. CSA cement does not form any free lime like Portland cement, which results in a lower alkali content. The pH of CSA lies at 10.5 - 11 in compare with 13 of Portland cement. This trend agrees with the research of Elyamany et al. [219]. The rapid set and the water demand of CSA cement, require special attention to ensure a positive result, may accelerate binding times as well as increasing the mixing speed.
Fig. 4.3. Initial setting time. 0
10203040
100 150 200 250
Displacement
(mm) in acco
rdance with E
N 196-3
Time (minute)
CSA cementPortlandcement
048
1216
0,24 0,26 0,28 0,3 0,32
Displacement
(mm) in acco
rdance with E
N 196-3
Water/cement ratio
CSA cementPortland cement
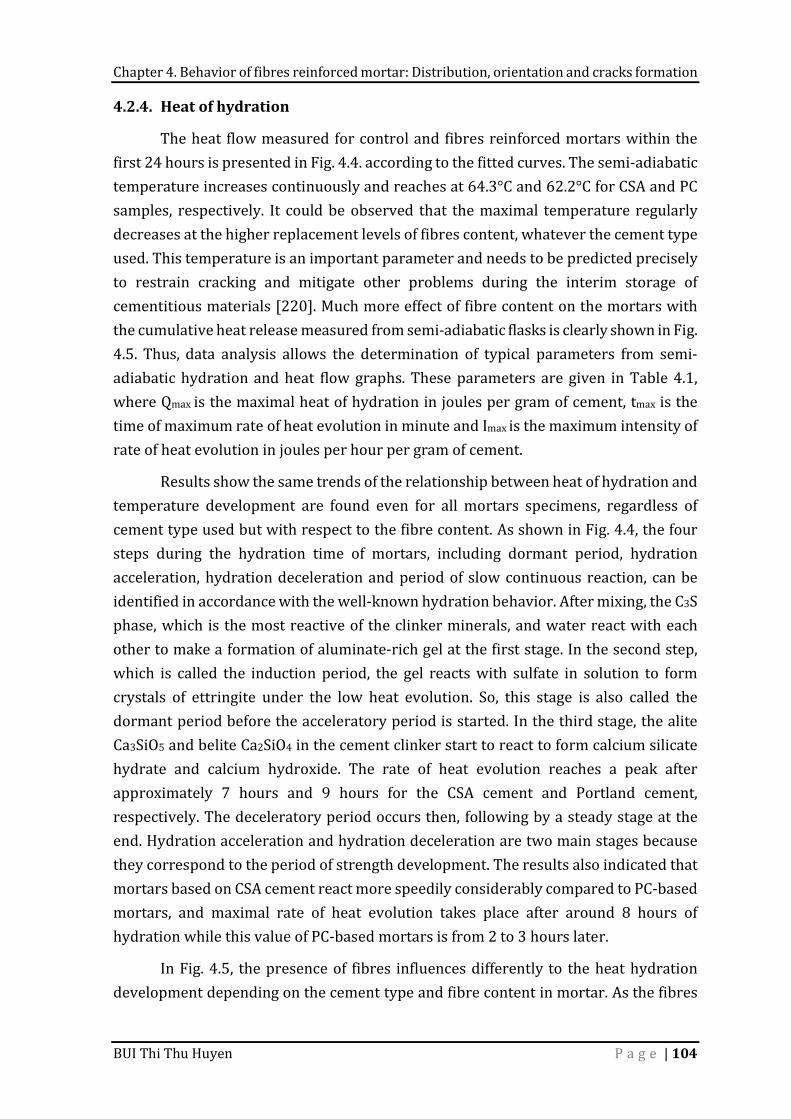
Chapter 4. Behavior of fibres reinforced mortar: Distribution, orientation and cracks formation
BUI Thi Thu Huyen P a g e | 104
4.2.4. Heat of hydration The heat flow measured for control and fibres reinforced mortars within the first 24 hours is presented in Fig. 4.4. according to the fitted curves. The semi-adiabatic temperature increases continuously and reaches at 64.3°C and 62.2°C for CSA and PC samples, respectively. It could be observed that the maximal temperature regularly decreases at the higher replacement levels of fibres content, whatever the cement type used. This temperature is an important parameter and needs to be predicted precisely to restrain cracking and mitigate other problems during the interim storage of cementitious materials [220]. Much more effect of fibre content on the mortars with the cumulative heat release measured from semi-adiabatic flasks is clearly shown in Fig. 4.5. Thus, data analysis allows the determination of typical parameters from semi-adiabatic hydration and heat flow graphs. These parameters are given in Table 4.1, where Qmax is the maximal heat of hydration in joules per gram of cement, tmax is the time of maximum rate of heat evolution in minute and Imax is the maximum intensity of rate of heat evolution in joules per hour per gram of cement. Results show the same trends of the relationship between heat of hydration and temperature development are found even for all mortars specimens, regardless of cement type used but with respect to the fibre content. As shown in Fig. 4.4, the four steps during the hydration time of mortars, including dormant period, hydration acceleration, hydration deceleration and period of slow continuous reaction, can be identified in accordance with the well-known hydration behavior. After mixing, the C3S phase, which is the most reactive of the clinker minerals, and water react with each other to make a formation of aluminate-rich gel at the first stage. In the second step, which is called the induction period, the gel reacts with sulfate in solution to form crystals of ettringite under the low heat evolution. So, this stage is also called the dormant period before the acceleratory period is started. In the third stage, the alite Ca3SiO5 and belite Ca2SiO4 in the cement clinker start to react to form calcium silicate hydrate and calcium hydroxide. The rate of heat evolution reaches a peak after approximately 7 hours and 9 hours for the CSA cement and Portland cement, respectively. The deceleratory period occurs then, following by a steady stage at the end. Hydration acceleration and hydration deceleration are two main stages because they correspond to the period of strength development. The results also indicated that mortars based on CSA cement react more speedily considerably compared to PC-based mortars, and maximal rate of heat evolution takes place after around 8 hours of hydration while this value of PC-based mortars is from 2 to 3 hours later. In Fig. 4.5, the presence of fibres influences differently to the heat hydration development depending on the cement type and fibre content in mortar. As the fibres
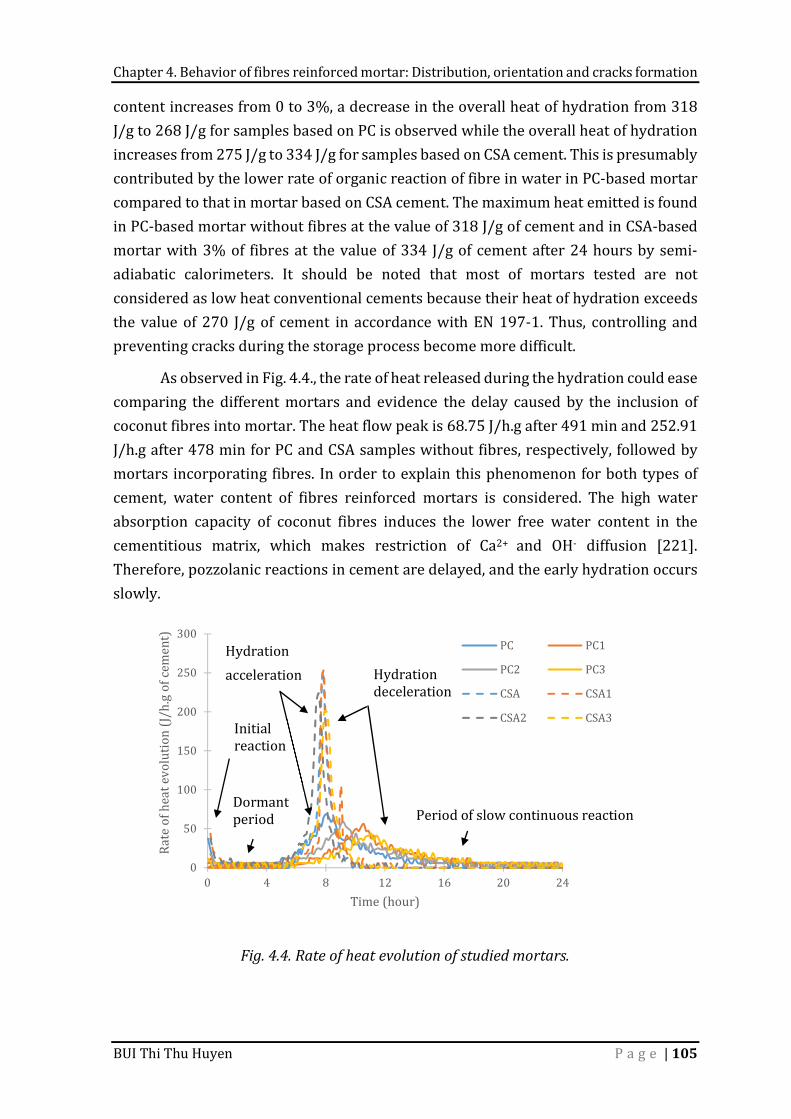
Chapter 4. Behavior of fibres reinforced mortar: Distribution, orientation and cracks formation
BUI Thi Thu Huyen P a g e | 105
content increases from 0 to 3%, a decrease in the overall heat of hydration from 318 J/g to 268 J/g for samples based on PC is observed while the overall heat of hydration increases from 275 J/g to 334 J/g for samples based on CSA cement. This is presumably contributed by the lower rate of organic reaction of fibre in water in PC-based mortar compared to that in mortar based on CSA cement. The maximum heat emitted is found in PC-based mortar without fibres at the value of 318 J/g of cement and in CSA-based mortar with 3% of fibres at the value of 334 J/g of cement after 24 hours by semi-adiabatic calorimeters. It should be noted that most of mortars tested are not considered as low heat conventional cements because their heat of hydration exceeds the value of 270 J/g of cement in accordance with EN 197-1. Thus, controlling and preventing cracks during the storage process become more difficult. As observed in Fig. 4.4., the rate of heat released during the hydration could ease comparing the different mortars and evidence the delay caused by the inclusion of coconut fibres into mortar. The heat flow peak is 68.75 J/h.g after 491 min and 252.91 J/h.g after 478 min for PC and CSA samples without fibres, respectively, followed by mortars incorporating fibres. In order to explain this phenomenon for both types of cement, water content of fibres reinforced mortars is considered. The high water absorption capacity of coconut fibres induces the lower free water content in the cementitious matrix, which makes restriction of Ca2+ and OH- diffusion [221]. Therefore, pozzolanic reactions in cement are delayed, and the early hydration occurs slowly.
Fig. 4.4. Rate of heat evolution of studied mortars.
050
100150200250300
0 4 8 12 16 20 24Rate of heat e
volution (J/h.g
of cement)
Time (hour)
PC PC1PC2 PC3CSA CSA1CSA2 CSA3Initial reaction Dormant period
Hydration acceleration Hydration deceleration
Period of slow continuous reaction
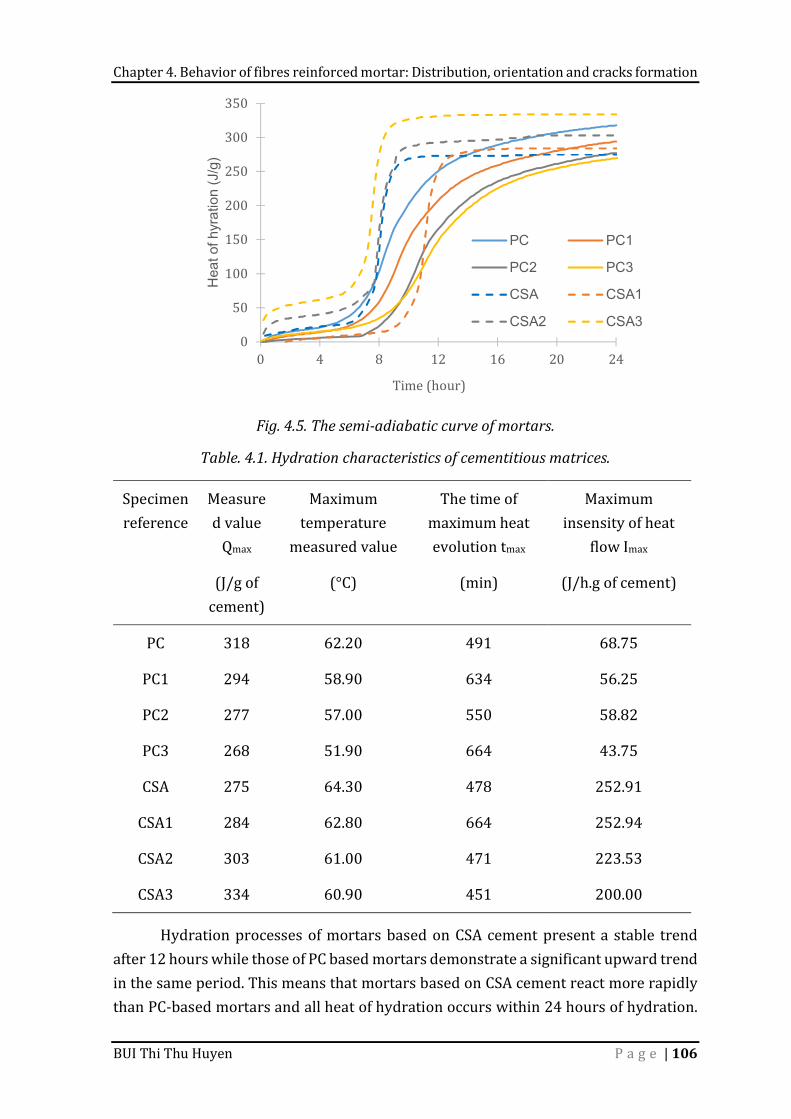
Chapter 4. Behavior of fibres reinforced mortar: Distribution, orientation and cracks formation
BUI Thi Thu Huyen P a g e | 106
Fig. 4.5. The semi-adiabatic curve of mortars.
Table. 4.1. Hydration characteristics of cementitious matrices.
Hydration processes of mortars based on CSA cement present a stable trend after 12 hours while those of PC based mortars demonstrate a significant upward trend in the same period. This means that mortars based on CSA cement react more rapidly than PC-based mortars and all heat of hydration occurs within 24 hours of hydration.
Specimen reference Measured value Qmax Maximum temperature measured value
The time of maximum heat evolution tmax Maximum insensity of heat flow Imax (J/g of cement) (°C) (min) (J/h.g of cement)
PC 318 62.20 491 68.75 PC1 294 58.90 634 56.25 PC2 277 57.00 550 58.82 PC3 268 51.90 664 43.75 CSA 275 64.30 478 252.91 CSA1 284 62.80 664 252.94 CSA2 303 61.00 471 223.53 CSA3 334 60.90 451 200.00
050100150200250300350
0 4 8 12 16 20 24
Hea
t of h
yrat
ion
(J/g
)
Time (hour)
PC PC1
PC2 PC3
CSA CSA1
CSA2 CSA3
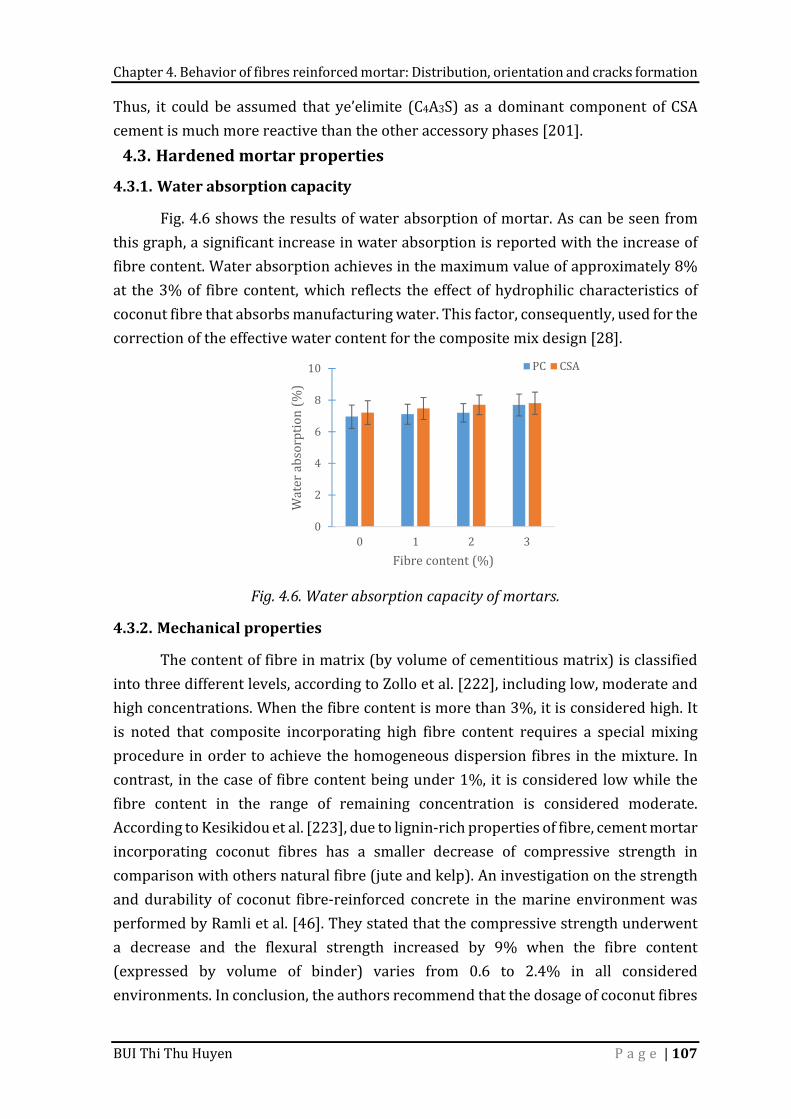
Chapter 4. Behavior of fibres reinforced mortar: Distribution, orientation and cracks formation
BUI Thi Thu Huyen P a g e | 107
Thus, it could be assumed that ye’elimite (C4A3S) as a dominant component of CSA cement is much more reactive than the other accessory phases [201]. 4.3. Hardened mortar properties
4.3.1. Water absorption capacity Fig. 4.6 shows the results of water absorption of mortar. As can be seen from this graph, a significant increase in water absorption is reported with the increase of fibre content. Water absorption achieves in the maximum value of approximately 8% at the 3% of fibre content, which reflects the effect of hydrophilic characteristics of coconut fibre that absorbs manufacturing water. This factor, consequently, used for the correction of the effective water content for the composite mix design [28].
Fig. 4.6. Water absorption capacity of mortars.
4.3.2. Mechanical properties The content of fibre in matrix (by volume of cementitious matrix) is classified into three different levels, according to Zollo et al. [222], including low, moderate and high concentrations. When the fibre content is more than 3%, it is considered high. It is noted that composite incorporating high fibre content requires a special mixing procedure in order to achieve the homogeneous dispersion fibres in the mixture. In contrast, in the case of fibre content being under 1%, it is considered low while the fibre content in the range of remaining concentration is considered moderate. According to Kesikidou et al. [223], due to lignin-rich properties of fibre, cement mortar incorporating coconut fibres has a smaller decrease of compressive strength in comparison with others natural fibre (jute and kelp). An investigation on the strength and durability of coconut fibre-reinforced concrete in the marine environment was performed by Ramli et al. [46]. They stated that the compressive strength underwent a decrease and the flexural strength increased by 9% when the fibre content (expressed by volume of binder) varies from 0.6 to 2.4% in all considered environments. In conclusion, the authors recommend that the dosage of coconut fibres
0246810
0 1 2 3
Water absorp
tion (%)
Fibre content (%)
PC CSA
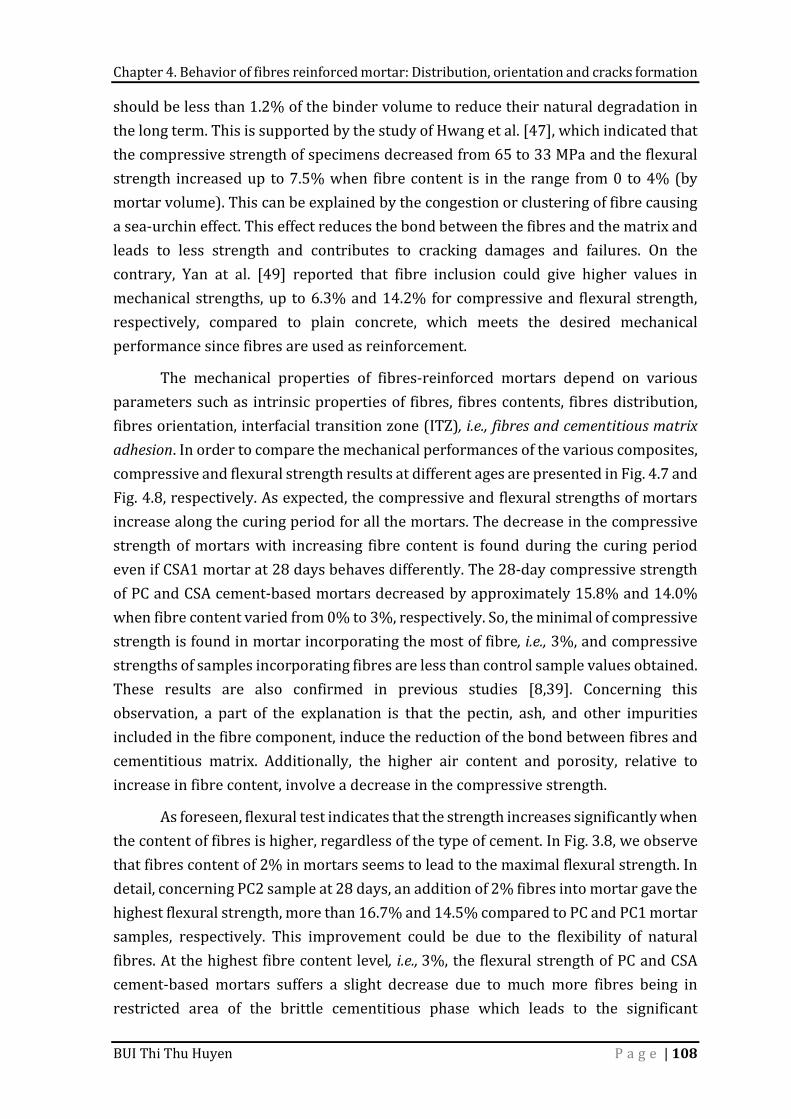
Chapter 4. Behavior of fibres reinforced mortar: Distribution, orientation and cracks formation
BUI Thi Thu Huyen P a g e | 108
should be less than 1.2% of the binder volume to reduce their natural degradation in the long term. This is supported by the study of Hwang et al. [47], which indicated that the compressive strength of specimens decreased from 65 to 33 MPa and the flexural strength increased up to 7.5% when fibre content is in the range from 0 to 4% (by mortar volume). This can be explained by the congestion or clustering of fibre causing a sea-urchin effect. This effect reduces the bond between the fibres and the matrix and leads to less strength and contributes to cracking damages and failures. On the contrary, Yan at al. [49] reported that fibre inclusion could give higher values in mechanical strengths, up to 6.3% and 14.2% for compressive and flexural strength, respectively, compared to plain concrete, which meets the desired mechanical performance since fibres are used as reinforcement. The mechanical properties of fibres-reinforced mortars depend on various parameters such as intrinsic properties of fibres, fibres contents, fibres distribution, fibres orientation, interfacial transition zone (ITZ), i.e., fibres and cementitious matrix adhesion. In order to compare the mechanical performances of the various composites, compressive and flexural strength results at different ages are presented in Fig. 4.7 and Fig. 4.8, respectively. As expected, the compressive and flexural strengths of mortars increase along the curing period for all the mortars. The decrease in the compressive strength of mortars with increasing fibre content is found during the curing period even if CSA1 mortar at 28 days behaves differently. The 28-day compressive strength of PC and CSA cement-based mortars decreased by approximately 15.8% and 14.0% when fibre content varied from 0% to 3%, respectively. So, the minimal of compressive strength is found in mortar incorporating the most of fibre, i.e., 3%, and compressive strengths of samples incorporating fibres are less than control sample values obtained. These results are also confirmed in previous studies [8,39]. Concerning this observation, a part of the explanation is that the pectin, ash, and other impurities included in the fibre component, induce the reduction of the bond between fibres and cementitious matrix. Additionally, the higher air content and porosity, relative to increase in fibre content, involve a decrease in the compressive strength. As foreseen, flexural test indicates that the strength increases significantly when the content of fibres is higher, regardless of the type of cement. In Fig. 3.8, we observe that fibres content of 2% in mortars seems to lead to the maximal flexural strength. In detail, concerning PC2 sample at 28 days, an addition of 2% fibres into mortar gave the highest flexural strength, more than 16.7% and 14.5% compared to PC and PC1 mortar samples, respectively. This improvement could be due to the flexibility of natural fibres. At the highest fibre content level, i.e., 3%, the flexural strength of PC and CSA cement-based mortars suffers a slight decrease due to much more fibres being in restricted area of the brittle cementitious phase which leads to the significant
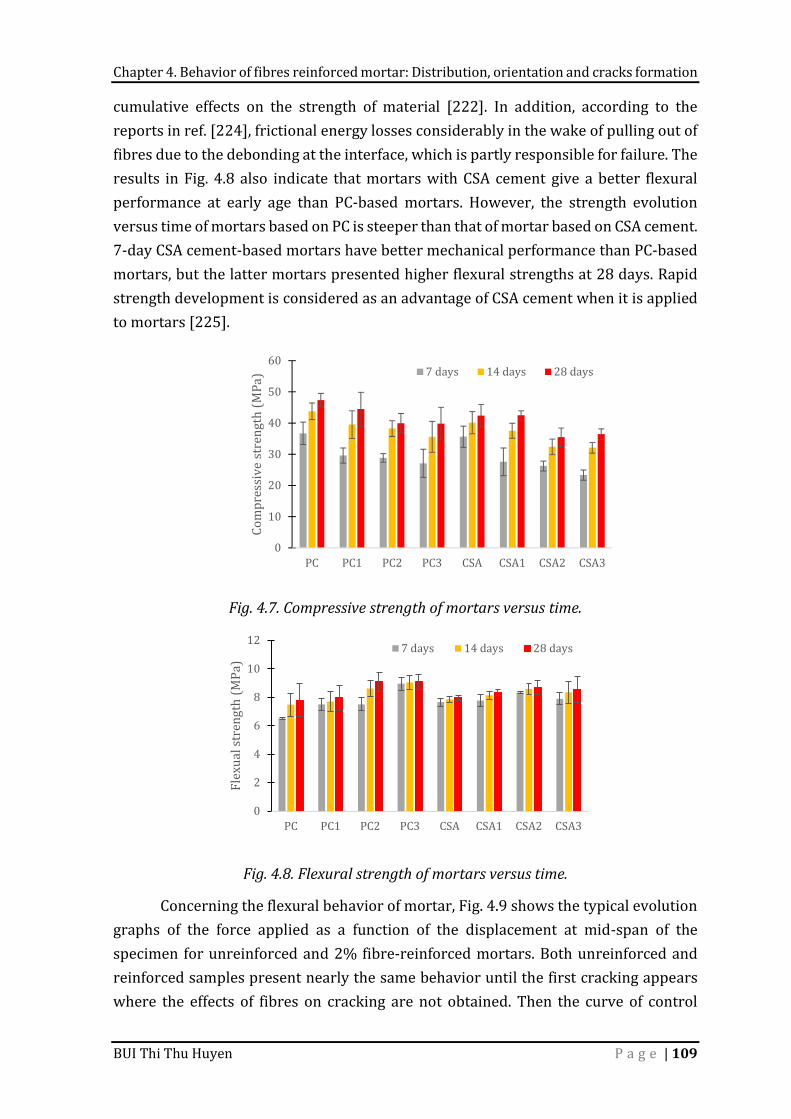
Chapter 4. Behavior of fibres reinforced mortar: Distribution, orientation and cracks formation
BUI Thi Thu Huyen P a g e | 109
cumulative effects on the strength of material [222]. In addition, according to the reports in ref. [224], frictional energy losses considerably in the wake of pulling out of fibres due to the debonding at the interface, which is partly responsible for failure. The results in Fig. 4.8 also indicate that mortars with CSA cement give a better flexural performance at early age than PC-based mortars. However, the strength evolution versus time of mortars based on PC is steeper than that of mortar based on CSA cement. 7-day CSA cement-based mortars have better mechanical performance than PC-based mortars, but the latter mortars presented higher flexural strengths at 28 days. Rapid strength development is considered as an advantage of CSA cement when it is applied to mortars [225].
Fig. 4.7. Compressive strength of mortars versus time.
Fig. 4.8. Flexural strength of mortars versus time. Concerning the flexural behavior of mortar, Fig. 4.9 shows the typical evolution graphs of the force applied as a function of the displacement at mid-span of the specimen for unreinforced and 2% fibre-reinforced mortars. Both unreinforced and reinforced samples present nearly the same behavior until the first cracking appears where the effects of fibres on cracking are not obtained. Then the curve of control
0102030405060
PC PC1 PC2 PC3 CSA CSA1 CSA2 CSA3Compressive
strength (MPa
) 7 days 14 days 28 days
024681012
PC PC1 PC2 PC3 CSA CSA1 CSA2 CSA3
Flexual streng
th (MPa) 7 days 14 days 28 days
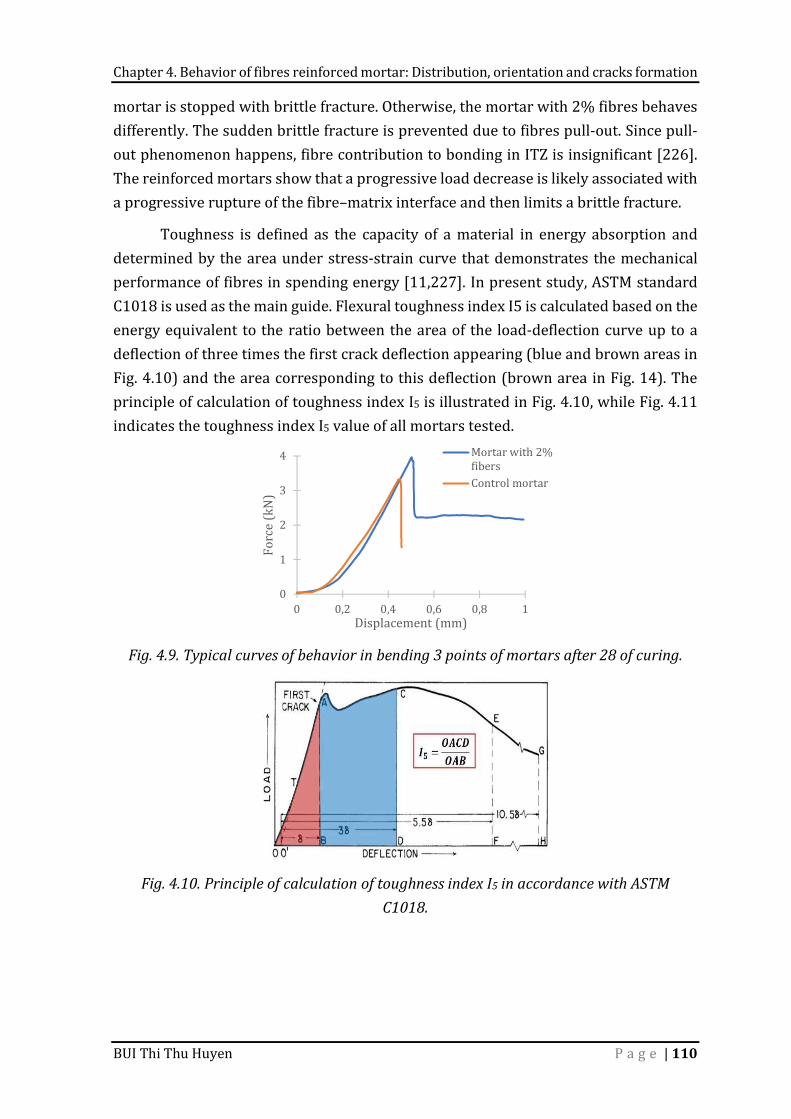
Chapter 4. Behavior of fibres reinforced mortar: Distribution, orientation and cracks formation
BUI Thi Thu Huyen P a g e | 110
mortar is stopped with brittle fracture. Otherwise, the mortar with 2% fibres behaves differently. The sudden brittle fracture is prevented due to fibres pull-out. Since pull-out phenomenon happens, fibre contribution to bonding in ITZ is insignificant [226]. The reinforced mortars show that a progressive load decrease is likely associated with a progressive rupture of the fibre–matrix interface and then limits a brittle fracture. Toughness is defined as the capacity of a material in energy absorption and determined by the area under stress-strain curve that demonstrates the mechanical performance of fibres in spending energy [11,227]. In present study, ASTM standard C1018 is used as the main guide. Flexural toughness index I5 is calculated based on the energy equivalent to the ratio between the area of the load-deflection curve up to a deflection of three times the first crack deflection appearing (blue and brown areas in Fig. 4.10) and the area corresponding to this deflection (brown area in Fig. 14). The principle of calculation of toughness index I5 is illustrated in Fig. 4.10, while Fig. 4.11 indicates the toughness index I5 value of all mortars tested.
Fig. 4.9. Typical curves of behavior in bending 3 points of mortars after 28 of curing.
Fig. 4.10. Principle of calculation of toughness index I5 in accordance with ASTM
C1018.
01234
0 0,2 0,4 0,6 0,8 1
Force (kN)
Displacement (mm)
Mortar with 2%fibersControl mortar
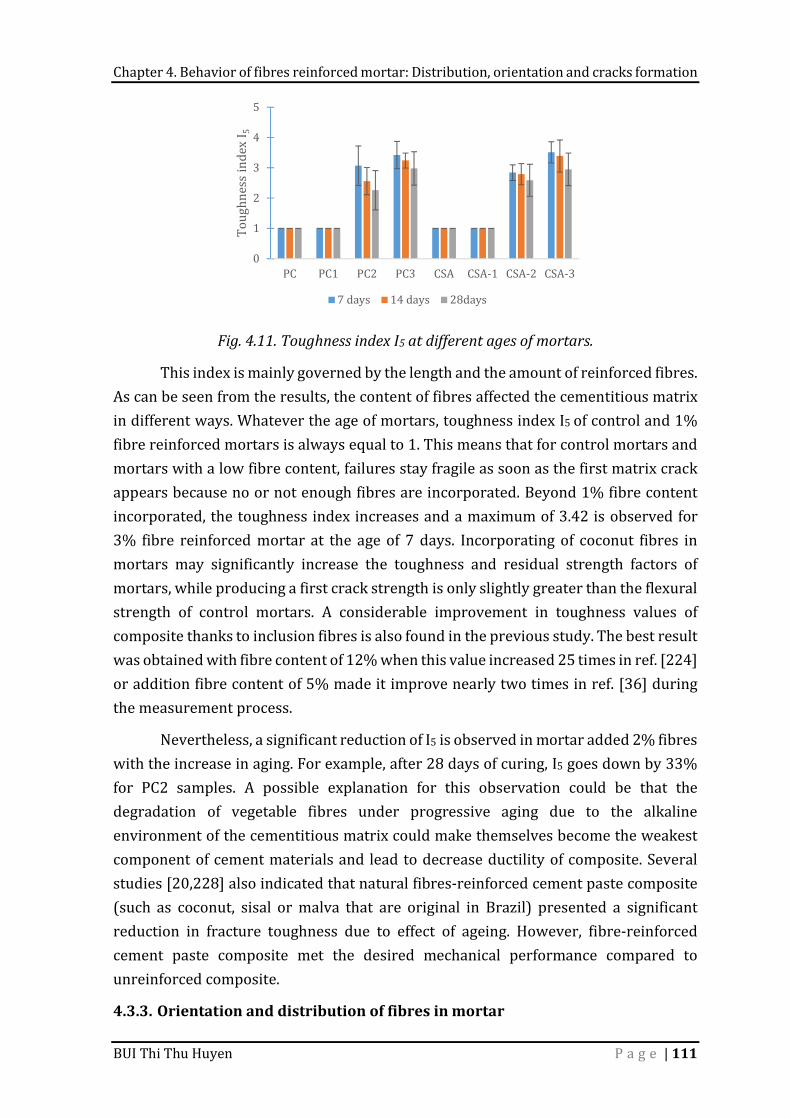
Chapter 4. Behavior of fibres reinforced mortar: Distribution, orientation and cracks formation
BUI Thi Thu Huyen P a g e | 111
Fig. 4.11. Toughness index I5 at different ages of mortars.This index is mainly governed by the length and the amount of reinforced fibres. As can be seen from the results, the content of fibres affected the cementitious matrix in different ways. Whatever the age of mortars, toughness index I5 of control and 1% fibre reinforced mortars is always equal to 1. This means that for control mortars and mortars with a low fibre content, failures stay fragile as soon as the first matrix crack appears because no or not enough fibres are incorporated. Beyond 1% fibre content incorporated, the toughness index increases and a maximum of 3.42 is observed for 3% fibre reinforced mortar at the age of 7 days. Incorporating of coconut fibres in mortars may significantly increase the toughness and residual strength factors of mortars, while producing a first crack strength is only slightly greater than the flexural strength of control mortars. A considerable improvement in toughness values of composite thanks to inclusion fibres is also found in the previous study. The best result was obtained with fibre content of 12% when this value increased 25 times in ref. [224] or addition fibre content of 5% made it improve nearly two times in ref. [36] during the measurement process. Nevertheless, a significant reduction of I5 is observed in mortar added 2% fibres with the increase in aging. For example, after 28 days of curing, I5 goes down by 33% for PC2 samples. A possible explanation for this observation could be that the degradation of vegetable fibres under progressive aging due to the alkaline environment of the cementitious matrix could make themselves become the weakest component of cement materials and lead to decrease ductility of composite. Several studies [20,228] also indicated that natural fibres-reinforced cement paste composite (such as coconut, sisal or malva that are original in Brazil) presented a significant reduction in fracture toughness due to effect of ageing. However, fibre-reinforced cement paste composite met the desired mechanical performance compared to unreinforced composite.
4.3.3. Orientation and distribution of fibres in mortar
012345
PC PC1 PC2 PC3 CSA CSA-1 CSA-2 CSA-3Toughn
ess index I 5
7 days 14 days 28days
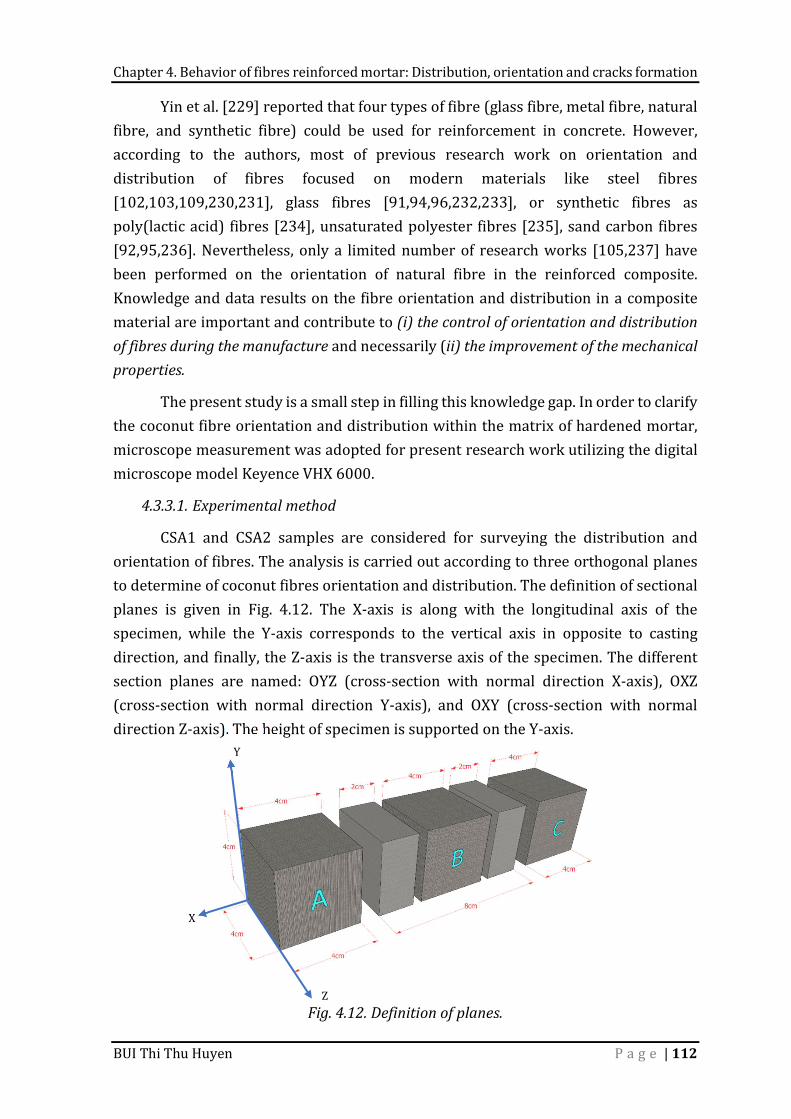
Chapter 4. Behavior of fibres reinforced mortar: Distribution, orientation and cracks formation
BUI Thi Thu Huyen P a g e | 112
Yin et al. [229] reported that four types of fibre (glass fibre, metal fibre, natural fibre, and synthetic fibre) could be used for reinforcement in concrete. However, according to the authors, most of previous research work on orientation and distribution of fibres focused on modern materials like steel fibres [102,103,109,230,231], glass fibres [91,94,96,232,233], or synthetic fibres as poly(lactic acid) fibres [234], unsaturated polyester fibres [235], sand carbon fibres [92,95,236]. Nevertheless, only a limited number of research works [105,237] have been performed on the orientation of natural fibre in the reinforced composite. Knowledge and data results on the fibre orientation and distribution in a composite material are important and contribute to (i) the control of orientation and distribution of fibres during the manufacture and necessarily (ii) the improvement of the mechanical properties. The present study is a small step in filling this knowledge gap. In order to clarify the coconut fibre orientation and distribution within the matrix of hardened mortar, microscope measurement was adopted for present research work utilizing the digital microscope model Keyence VHX 6000.
4.3.3.1. Experimental method CSA1 and CSA2 samples are considered for surveying the distribution and orientation of fibres. The analysis is carried out according to three orthogonal planes to determine of coconut fibres orientation and distribution. The definition of sectional planes is given in Fig. 4.12. The X-axis is along with the longitudinal axis of the specimen, while the Y-axis corresponds to the vertical axis in opposite to casting direction, and finally, the Z-axis is the transverse axis of the specimen. The different section planes are named: OYZ (cross-section with normal direction X-axis), OXZ (cross-section with normal direction Y-axis), and OXY (cross-section with normal direction Z-axis). The height of specimen is supported on the Y-axis.
Fig. 4.12. Definition of planes.
Y
Z X
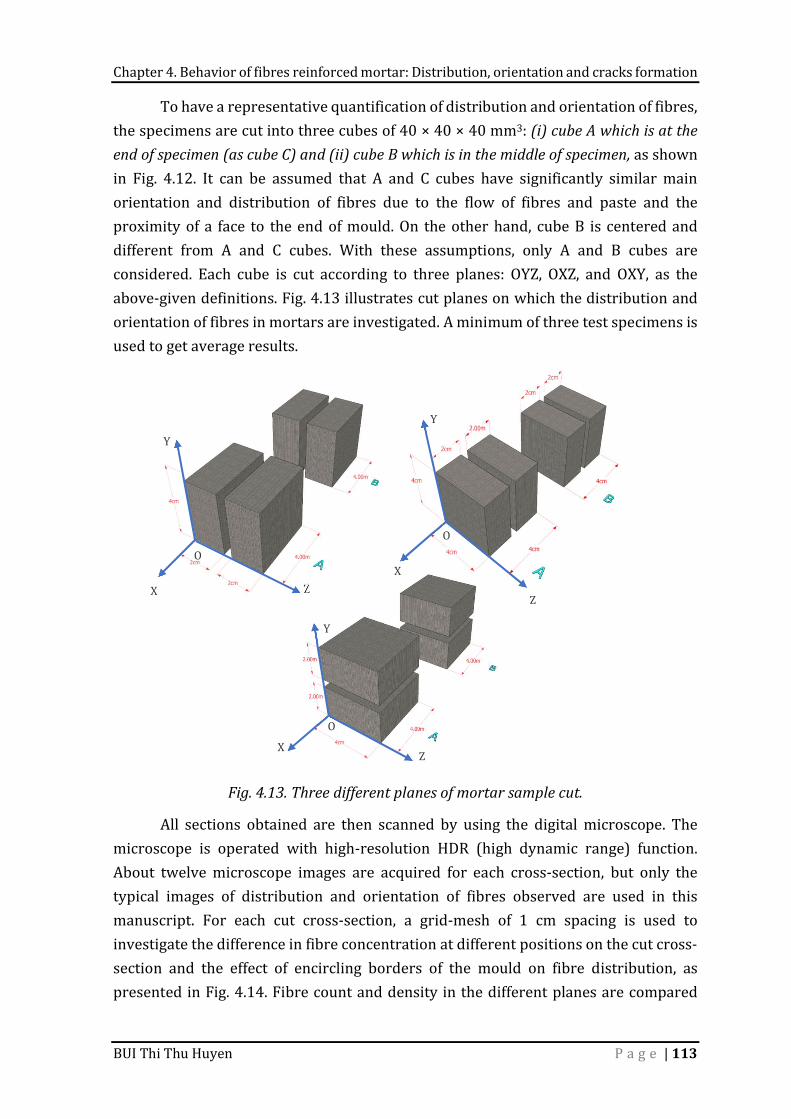
Chapter 4. Behavior of fibres reinforced mortar: Distribution, orientation and cracks formation
BUI Thi Thu Huyen P a g e | 113
To have a representative quantification of distribution and orientation of fibres, the specimens are cut into three cubes of 40 × 40 × 40 mm3: (i) cube A which is at the end of specimen (as cube C) and (ii) cube B which is in the middle of specimen, as shown in Fig. 4.12. It can be assumed that A and C cubes have significantly similar main orientation and distribution of fibres due to the flow of fibres and paste and the proximity of a face to the end of mould. On the other hand, cube B is centered and different from A and C cubes. With these assumptions, only A and B cubes are considered. Each cube is cut according to three planes: OYZ, OXZ, and OXY, as the above-given definitions. Fig. 4.13 illustrates cut planes on which the distribution and orientation of fibres in mortars are investigated. A minimum of three test specimens is used to get average results.
Fig. 4.13. Three different planes of mortar sample cut. All sections obtained are then scanned by using the digital microscope. The microscope is operated with high-resolution HDR (high dynamic range) function. About twelve microscope images are acquired for each cross-section, but only the typical images of distribution and orientation of fibres observed are used in this manuscript. For each cut cross-section, a grid-mesh of 1 cm spacing is used to investigate the difference in fibre concentration at different positions on the cut cross-section and the effect of encircling borders of the mould on fibre distribution, as presented in Fig. 4.14. Fibre count and density in the different planes are compared
Y
Z X Y
Z X
Y
Z X O O
O
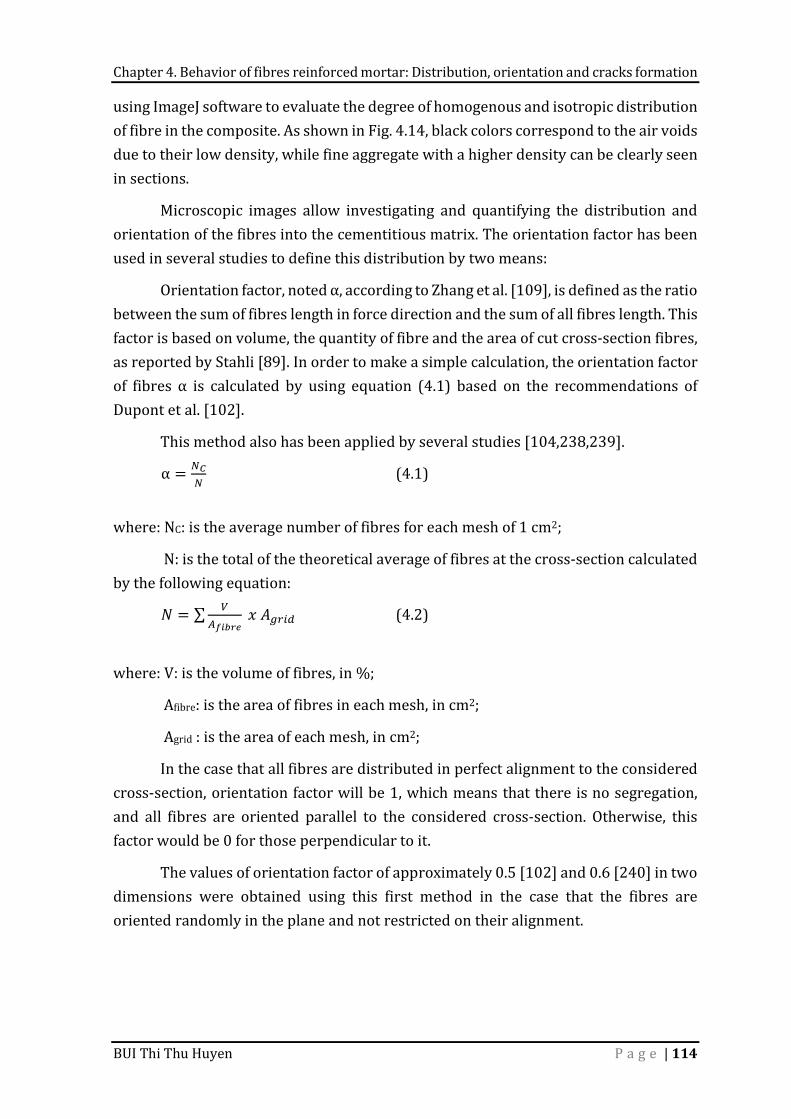
Chapter 4. Behavior of fibres reinforced mortar: Distribution, orientation and cracks formation
BUI Thi Thu Huyen P a g e | 114
using ImageJ software to evaluate the degree of homogenous and isotropic distribution of fibre in the composite. As shown in Fig. 4.14, black colors correspond to the air voids due to their low density, while fine aggregate with a higher density can be clearly seen in sections. Microscopic images allow investigating and quantifying the distribution and orientation of the fibres into the cementitious matrix. The orientation factor has been used in several studies to define this distribution by two means: Orientation factor, noted α, according to Zhang et al. [109], is defined as the ratio between the sum of fibres length in force direction and the sum of all fibres length. This factor is based on volume, the quantity of fibre and the area of cut cross-section fibres, as reported by Stahli [89]. In order to make a simple calculation, the orientation factor of fibres α is calculated by using equation (4.1) based on the recommendations of Dupont et al. [102]. This method also has been applied by several studies [104,238,239]. α = (4.1) where: NC: is the average number of fibres for each mesh of 1 cm2; N: is the total of the theoretical average of fibres at the cross-section calculated by the following equation: 𝑁 = ∑ 𝑥 𝐴 (4.2) where: V: is the volume of fibres, in %; Afibre: is the area of fibres in each mesh, in cm2; Agrid : is the area of each mesh, in cm2; In the case that all fibres are distributed in perfect alignment to the considered cross-section, orientation factor will be 1, which means that there is no segregation, and all fibres are oriented parallel to the considered cross-section. Otherwise, this factor would be 0 for those perpendicular to it. The values of orientation factor of approximately 0.5 [102] and 0.6 [240] in two dimensions were obtained using this first method in the case that the fibres are oriented randomly in the plane and not restricted on their alignment.
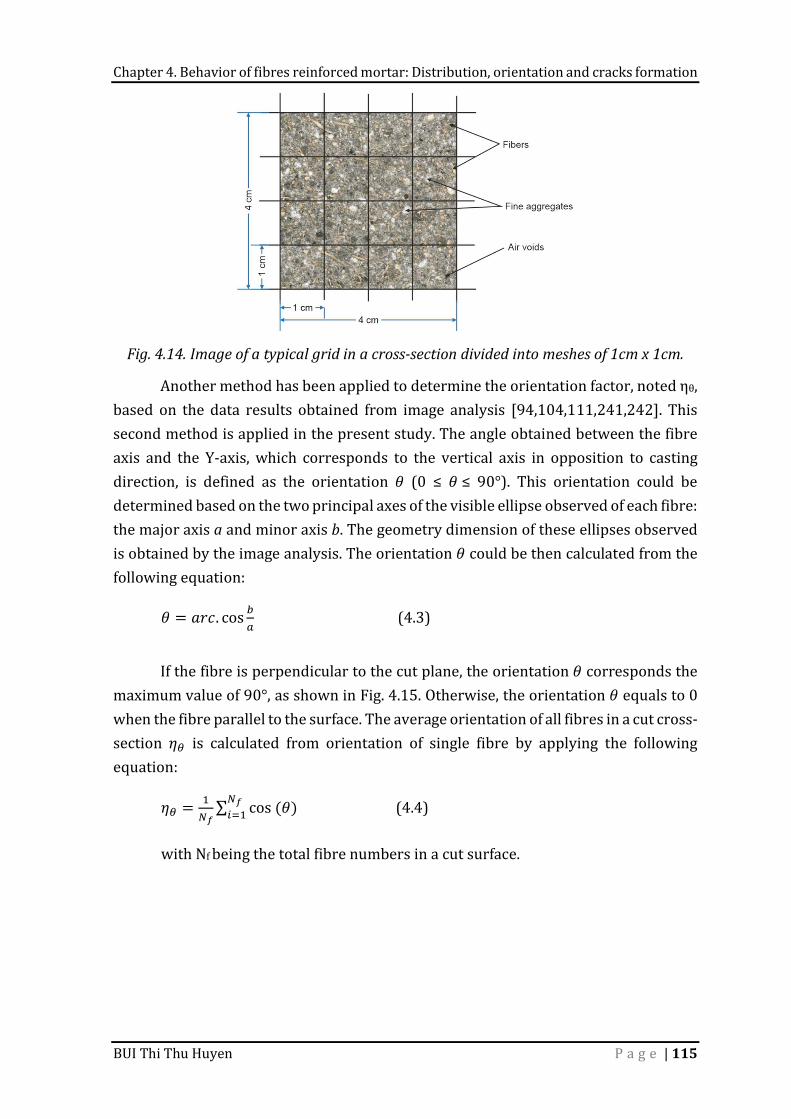
Chapter 4. Behavior of fibres reinforced mortar: Distribution, orientation and cracks formation
BUI Thi Thu Huyen P a g e | 115
Fig. 4.14. Image of a typical grid in a cross-section divided into meshes of 1cm x 1cm. Another method has been applied to determine the orientation factor, noted ηθ, based on the data results obtained from image analysis [94,104,111,241,242]. This second method is applied in the present study. The angle obtained between the fibre axis and the Y-axis, which corresponds to the vertical axis in opposition to casting direction, is defined as the orientation 𝜃 (0 ≤ 𝜃 ≤ 90°). This orientation could be determined based on the two principal axes of the visible ellipse observed of each fibre: the major axis a and minor axis b. The geometry dimension of these ellipses observed is obtained by the image analysis. The orientation 𝜃 could be then calculated from the following equation: 𝜃 = 𝑎𝑟𝑐. cos (4.3)
If the fibre is perpendicular to the cut plane, the orientation 𝜃 corresponds the maximum value of 90°, as shown in Fig. 4.15. Otherwise, the orientation 𝜃 equals to 0 when the fibre parallel to the surface. The average orientation of all fibres in a cut cross-section 𝜂 is calculated from orientation of single fibre by applying the following equation: 𝜂 = ∑ cos (𝜃) (4.4) with Nf being the total fibre numbers in a cut surface.
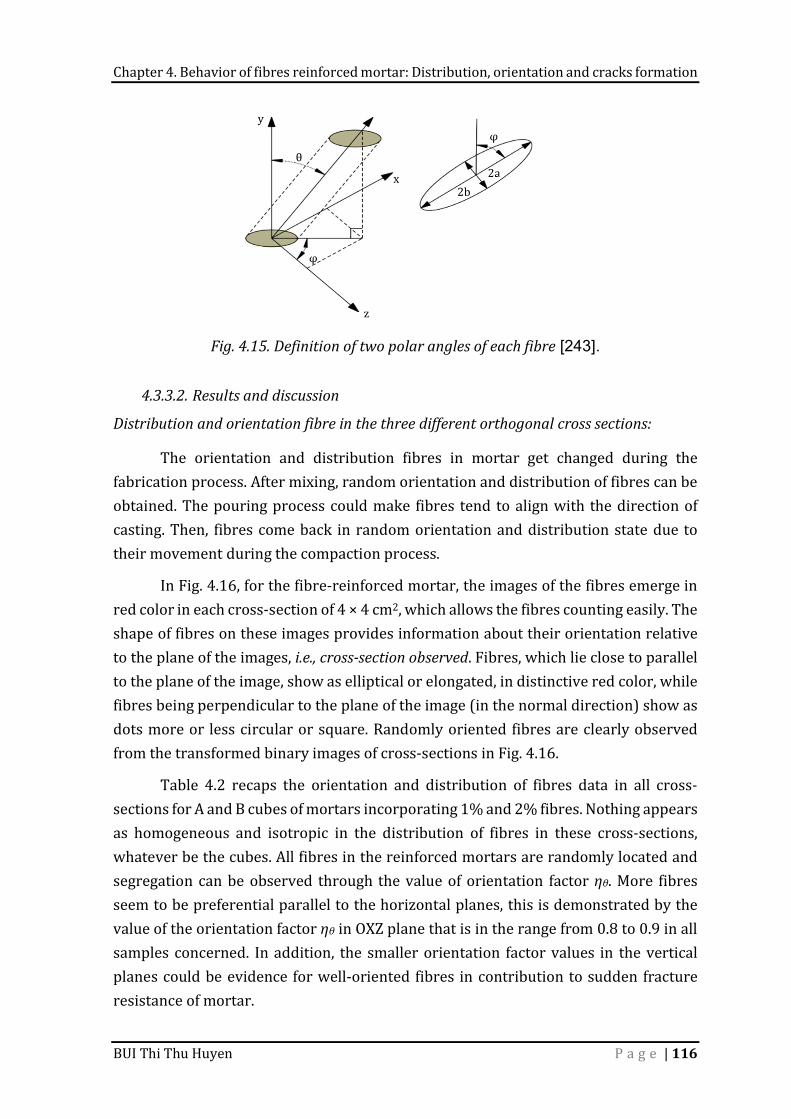
Chapter 4. Behavior of fibres reinforced mortar: Distribution, orientation and cracks formation
BUI Thi Thu Huyen P a g e | 116
Fig. 4.15. Definition of two polar angles of each fibre [243].
4.3.3.2. Results and discussion
Distribution and orientation fibre in the three different orthogonal cross sections: The orientation and distribution fibres in mortar get changed during the fabrication process. After mixing, random orientation and distribution of fibres can be obtained. The pouring process could make fibres tend to align with the direction of casting. Then, fibres come back in random orientation and distribution state due to their movement during the compaction process. In Fig. 4.16, for the fibre-reinforced mortar, the images of the fibres emerge in red color in each cross-section of 4 × 4 cm2, which allows the fibres counting easily. The shape of fibres on these images provides information about their orientation relative to the plane of the images, i.e., cross-section observed. Fibres, which lie close to parallel to the plane of the image, show as elliptical or elongated, in distinctive red color, while fibres being perpendicular to the plane of the image (in the normal direction) show as dots more or less circular or square. Randomly oriented fibres are clearly observed from the transformed binary images of cross-sections in Fig. 4.16. Table 4.2 recaps the orientation and distribution of fibres data in all cross-sections for A and B cubes of mortars incorporating 1% and 2% fibres. Nothing appears as homogeneous and isotropic in the distribution of fibres in these cross-sections, whatever be the cubes. All fibres in the reinforced mortars are randomly located and segregation can be observed through the value of orientation factor ηθ. More fibres seem to be preferential parallel to the horizontal planes, this is demonstrated by the value of the orientation factor ηθ in OXZ plane that is in the range from 0.8 to 0.9 in all samples concerned. In addition, the smaller orientation factor values in the vertical planes could be evidence for well-oriented fibres in contribution to sudden fracture resistance of mortar.
2a 2b θ x
y φ
φ z
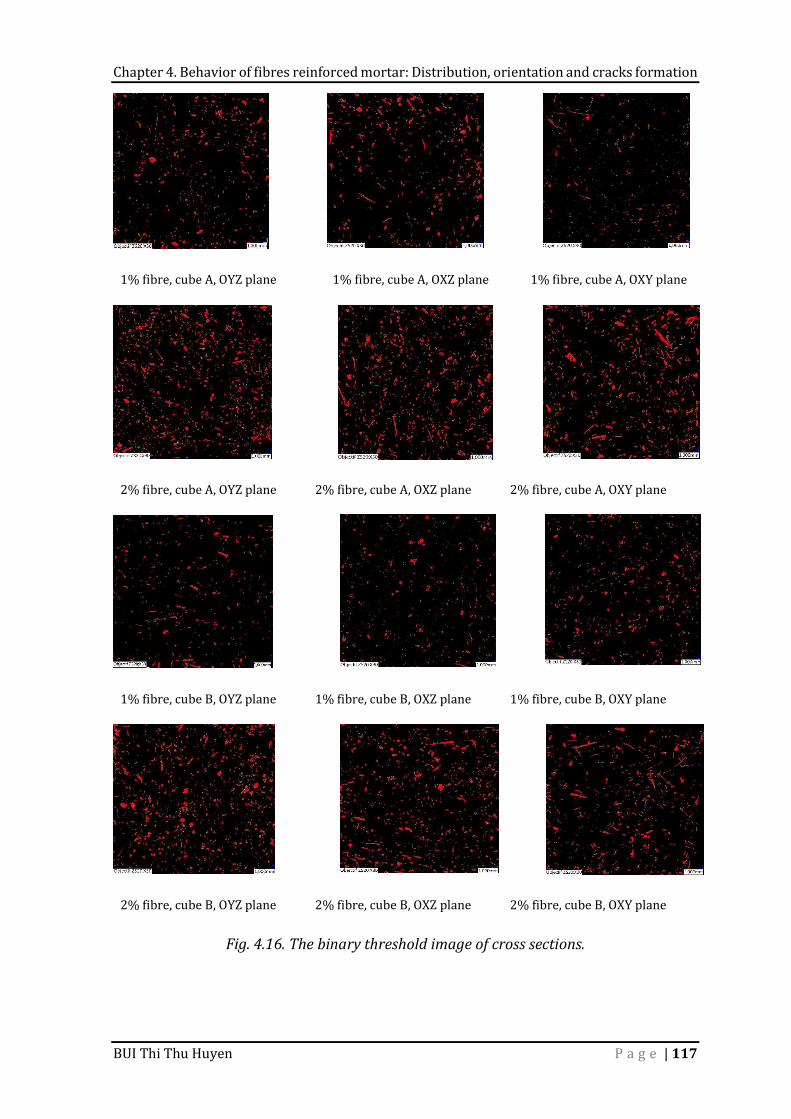
Chapter 4. Behavior of fibres reinforced mortar: Distribution, orientation and cracks formation
BUI Thi Thu Huyen P a g e | 117
1% fibre, cube A, OYZ plane 1% fibre, cube A, OXZ plane 1% fibre, cube A, OXY plane
2% fibre, cube A, OYZ plane 2% fibre, cube A, OXZ plane 2% fibre, cube A, OXY plane
1% fibre, cube B, OYZ plane 1% fibre, cube B, OXZ plane 1% fibre, cube B, OXY plane
2% fibre, cube B, OYZ plane 2% fibre, cube B, OXZ plane 2% fibre, cube B, OXY plane Fig. 4.16. The binary threshold image of cross sections.
Chapter 4. Behavior of fibres reinforced mortar: Distribution, orientation and cracks formation
BUI Thi Thu Huyen P a g e | 118
At both fibre contents tested, a clear difference in fibre orientation is not nearly observed as the value of orientation factor is almost similar. This means that fibre orientation is not governed by the number of fibres. The fibres area ratio and fibres density in vertical planes, i.e., OYZ and OXY planes, have considerably higher levels compared to the horizontal one, i.e., OXZ plane. The highest number of fibres per unit surface is obtained in the OYZ plane, followed by the numbers obtained in OXY and OXZ planes, respectively. Based on the statistical results, the vertical planes seem to gather more fibres than the horizontal plane. Different distribution fibres in different meshes – Effect of the sides and bottom of the mould Division surface sample into smaller parts is the easiest method for counting fibres and assessing the orientation factor [244]. Before analysing the distribution of fibres in each mesh, a notion of layer and row is indicated in Fig. 4.17. For detail, the fibre distribution results in each mesh of cube B of CSA2 sample are demonstrated in Fig. 4.18, while Fig. 4.19 indicates the ratio of fibre area in each mesh in all planes. Fig. 4.20 recaps the average ratio area of fibres in each part of cross-sections. By visualizing the position of fibres in each cross-section, it can be observed from Fig. 4.19 that fibres distribution in the cementitious matrix follows the same trend in both OXY and OYZ planes. The fibres tend to move to the upper layer during the compaction process. The fibres in the OXZ plane are fairly distributed in the middle row than at the top and bottom rows of the cross section. The increase in the percentage of fibres from bottom to the top layer in the opposite casting direction (for vertical planes) and from first and fourth rows to second and three rows (for the horizontal plane) is adequate evidence to explain movement trend of fibres. There could be a higher fibre number at the top layer of the specimen. A reasonable explanation for this phenomenon could be the different densities between fibres and other components of the cementitious matrix. The density of cement and sand are 3.16 g/cm3 and 2.69 g/cm3, respectively, while density of fibre is only 1.41 g/cm3. The lower weight of fibres makes them have a trend to move to the top of sample. It is essential to divide the cross-section into three different parts, as shown in Fig. 4.20 following the suggestion of Dupont et al. [102], to evaluate the effects of the sides and bottom of the mould on fibres orientation and distribution. It can be seen that fibres being in the white part are not influenced by any sides of the mold and, therefore, can move and rotate freely in all directions. Fibres being in the blue part are under only one side of the mold and fibres in the yellow part are under the influence of two boundaries of the mold. As can be observed from the data results in Fig. 4.20 that for all planes, the average ratio of fibre presence area in each mesh is the biggest in the
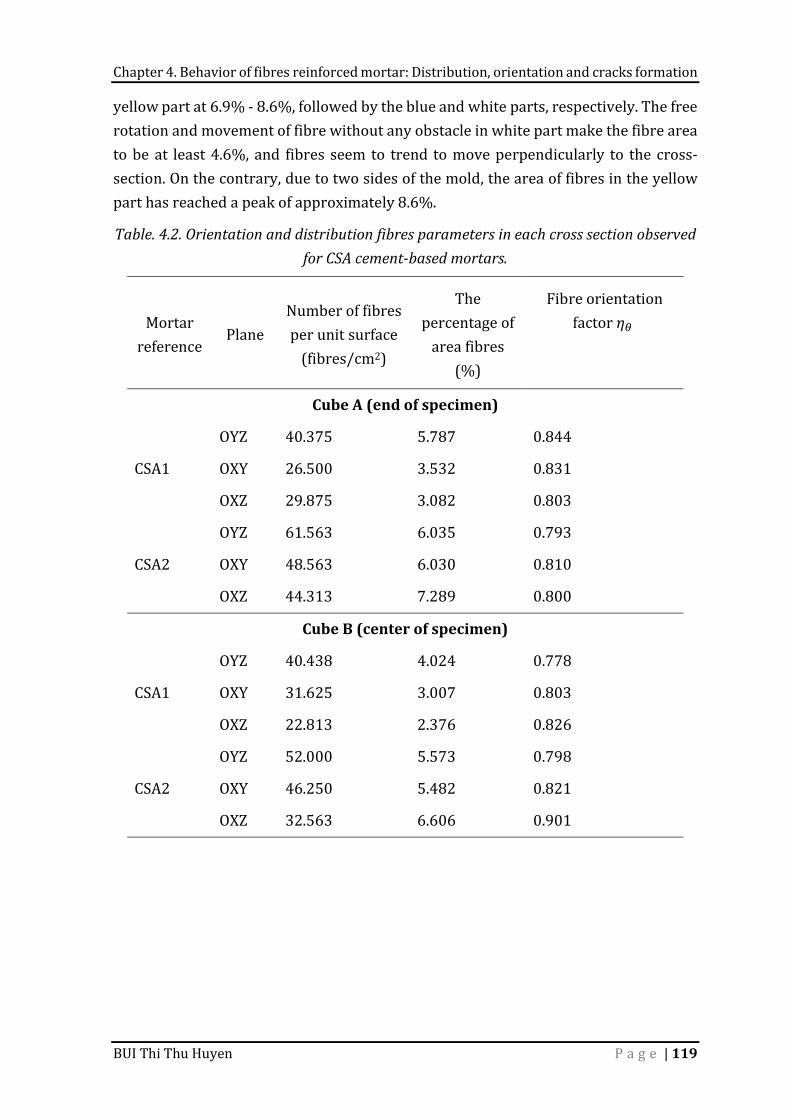
Chapter 4. Behavior of fibres reinforced mortar: Distribution, orientation and cracks formation
BUI Thi Thu Huyen P a g e | 119
yellow part at 6.9% - 8.6%, followed by the blue and white parts, respectively. The free rotation and movement of fibre without any obstacle in white part make the fibre area to be at least 4.6%, and fibres seem to trend to move perpendicularly to the cross-section. On the contrary, due to two sides of the mold, the area of fibres in the yellow part has reached a peak of approximately 8.6%. Table. 4.2. Orientation and distribution fibres parameters in each cross section observed
for CSA cement-based mortars.
Mortar reference Plane Number of fibres per unit surface (fibres/cm2) The percentage of area fibres (%)
Fibre orientation factor 𝜂
Cube A (end of specimen) CSA1 OYZ 40.375 5.787 0.844 OXY 26.500 3.532 0.831 OXZ 29.875 3.082 0.803 CSA2 OYZ 61.563 6.035 0.793 OXY 48.563 6.030 0.810 OXZ 44.313 7.289 0.800
Cube B (center of specimen) CSA1 OYZ 40.438 4.024 0.778 OXY 31.625 3.007 0.803 OXZ 22.813 2.376 0.826 CSA2 OYZ 52.000 5.573 0.798 OXY 46.250 5.482 0.821 OXZ 32.563 6.606 0.901
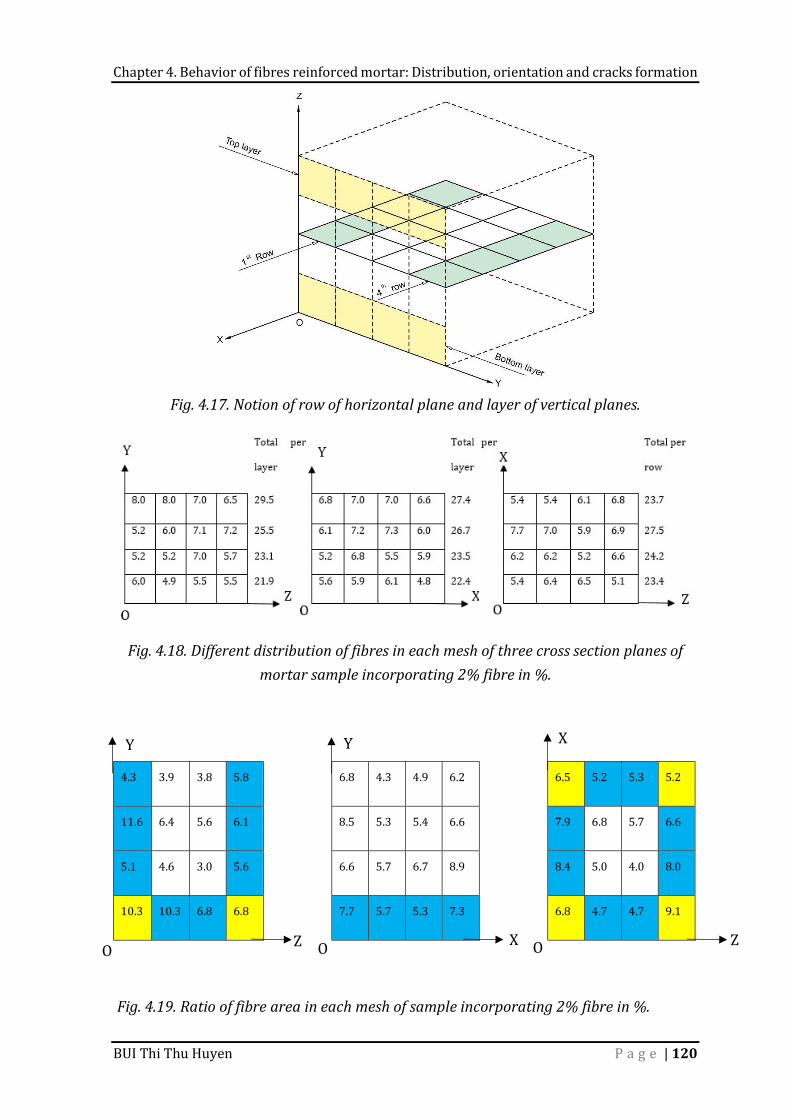
Chapter 4. Behavior of fibres reinforced mortar: Distribution, orientation and cracks formation
BUI Thi Thu Huyen P a g e | 120
Fig. 4.17. Notion of row of horizontal plane and layer of vertical planes.
Fig. 4.18. Different distribution of fibres in each mesh of three cross section planes of
mortar sample incorporating 2% fibre in %.
4.3 3.9 3.8 5.8 6.8 4.3 4.9 6.2 6.5 5.2 5.3 5.2 11.6 6.4 5.6 6.1 8.5 5.3 5.4 6.6 7.9 6.8 5.7 6.6 5.1 4.6 3.0 5.6 6.6 5.7 6.7 8.9 8.4 5.0 4.0 8.0 10.3 10.3 6.8 6.8 7.7 5.7 5.3 7.3 6.8 4.7 4.7 9.1
Fig. 4.19. Ratio of fibre area in each mesh of sample incorporating 2% fibre in %.
Y Y X
O Z O Z X O
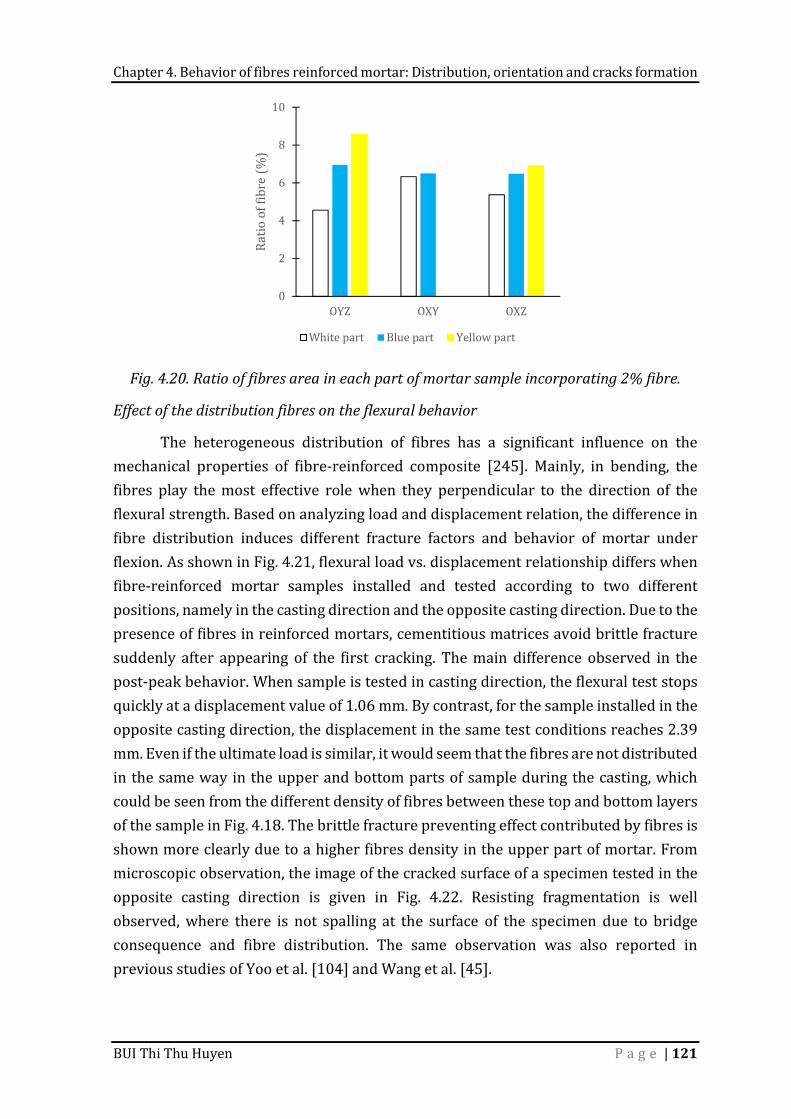
Chapter 4. Behavior of fibres reinforced mortar: Distribution, orientation and cracks formation
BUI Thi Thu Huyen P a g e | 121
Fig. 4.20. Ratio of fibres area in each part of mortar sample incorporating 2% fibre.
Effect of the distribution fibres on the flexural behavior The heterogeneous distribution of fibres has a significant influence on the mechanical properties of fibre-reinforced composite [245]. Mainly, in bending, the fibres play the most effective role when they perpendicular to the direction of the flexural strength. Based on analyzing load and displacement relation, the difference in fibre distribution induces different fracture factors and behavior of mortar under flexion. As shown in Fig. 4.21, flexural load vs. displacement relationship differs when fibre-reinforced mortar samples installed and tested according to two different positions, namely in the casting direction and the opposite casting direction. Due to the presence of fibres in reinforced mortars, cementitious matrices avoid brittle fracture suddenly after appearing of the first cracking. The main difference observed in the post-peak behavior. When sample is tested in casting direction, the flexural test stops quickly at a displacement value of 1.06 mm. By contrast, for the sample installed in the opposite casting direction, the displacement in the same test conditions reaches 2.39 mm. Even if the ultimate load is similar, it would seem that the fibres are not distributed in the same way in the upper and bottom parts of sample during the casting, which could be seen from the different density of fibres between these top and bottom layers of the sample in Fig. 4.18. The brittle fracture preventing effect contributed by fibres is shown more clearly due to a higher fibres density in the upper part of mortar. From microscopic observation, the image of the cracked surface of a specimen tested in the opposite casting direction is given in Fig. 4.22. Resisting fragmentation is well observed, where there is not spalling at the surface of the specimen due to bridge consequence and fibre distribution. The same observation was also reported in previous studies of Yoo et al. [104] and Wang et al. [45].
02468
10
OYZ OXY OXZRatio o
f fibre (%)
White part Blue part Yellow part
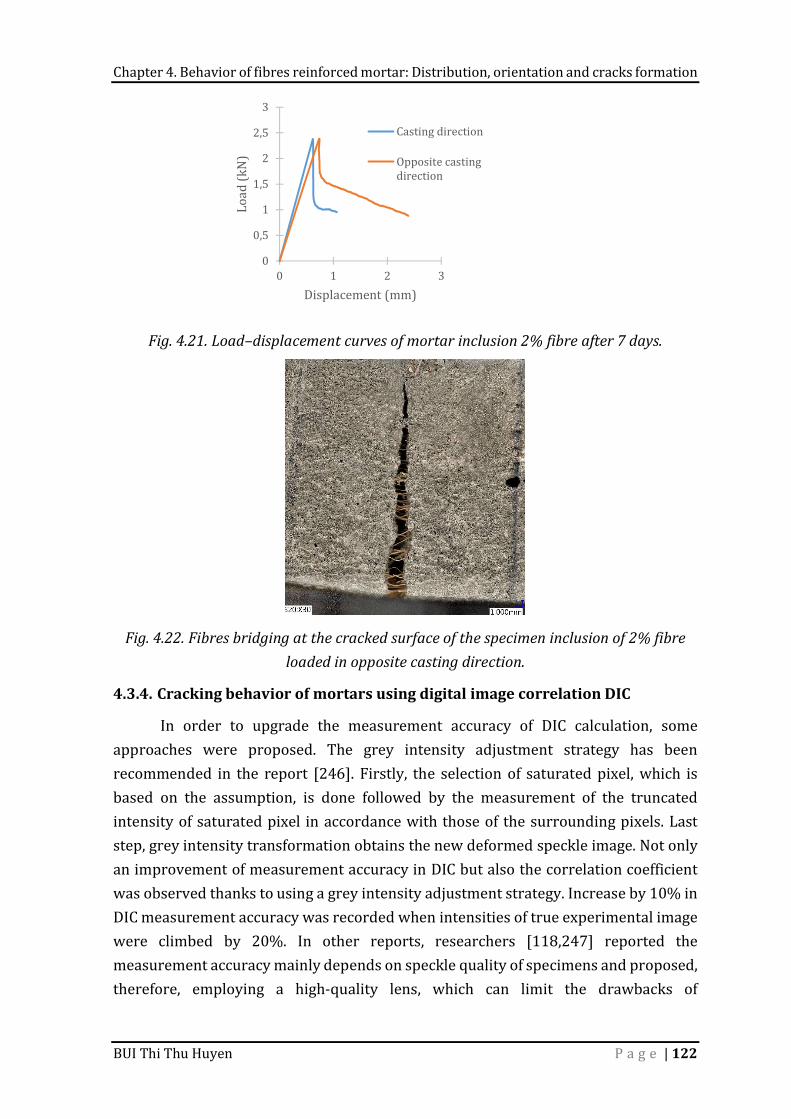
Chapter 4. Behavior of fibres reinforced mortar: Distribution, orientation and cracks formation
BUI Thi Thu Huyen P a g e | 122
Fig. 4.21. Load–displacement curves of mortar inclusion 2% fibre after 7 days.
Fig. 4.22. Fibres bridging at the cracked surface of the specimen inclusion of 2% fibre
loaded in opposite casting direction.
4.3.4. Cracking behavior of mortars using digital image correlation DIC In order to upgrade the measurement accuracy of DIC calculation, some approaches were proposed. The grey intensity adjustment strategy has been recommended in the report [246]. Firstly, the selection of saturated pixel, which is based on the assumption, is done followed by the measurement of the truncated intensity of saturated pixel in accordance with those of the surrounding pixels. Last step, grey intensity transformation obtains the new deformed speckle image. Not only an improvement of measurement accuracy in DIC but also the correlation coefficient was observed thanks to using a grey intensity adjustment strategy. Increase by 10% in DIC measurement accuracy was recorded when intensities of true experimental image were climbed by 20%. In other reports, researchers [118,247] reported the measurement accuracy mainly depends on speckle quality of specimens and proposed, therefore, employing a high-quality lens, which can limit the drawbacks of
00,511,522,53
0 1 2 3Load (k
N)Displacement (mm)
Casting directionOpposite castingdirection
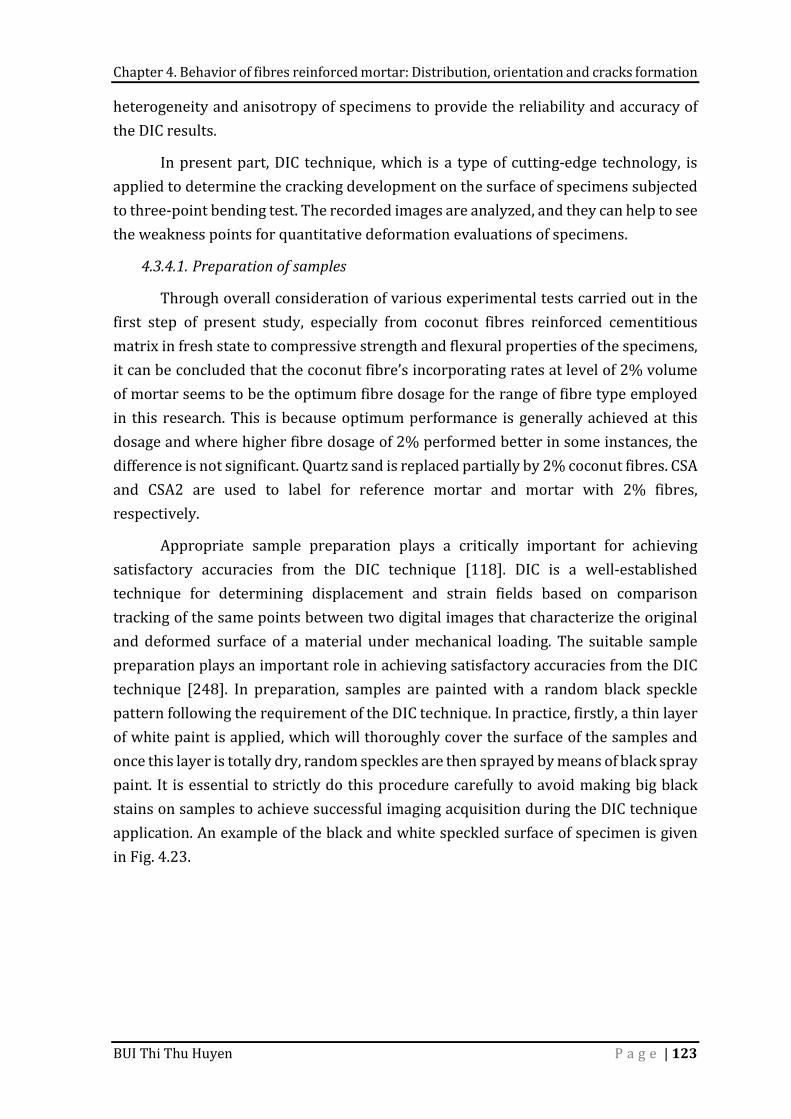
Chapter 4. Behavior of fibres reinforced mortar: Distribution, orientation and cracks formation
BUI Thi Thu Huyen P a g e | 123
heterogeneity and anisotropy of specimens to provide the reliability and accuracy of the DIC results. In present part, DIC technique, which is a type of cutting-edge technology, is applied to determine the cracking development on the surface of specimens subjected to three-point bending test. The recorded images are analyzed, and they can help to see the weakness points for quantitative deformation evaluations of specimens. 4.3.4.1. Preparation of samples Through overall consideration of various experimental tests carried out in the first step of present study, especially from coconut fibres reinforced cementitious matrix in fresh state to compressive strength and flexural properties of the specimens, it can be concluded that the coconut fibre’s incorporating rates at level of 2% volume of mortar seems to be the optimum fibre dosage for the range of fibre type employed in this research. This is because optimum performance is generally achieved at this dosage and where higher fibre dosage of 2% performed better in some instances, the difference is not significant. Quartz sand is replaced partially by 2% coconut fibres. CSA and CSA2 are used to label for reference mortar and mortar with 2% fibres, respectively. Appropriate sample preparation plays a critically important for achieving satisfactory accuracies from the DIC technique [118]. DIC is a well-established technique for determining displacement and strain fields based on comparison tracking of the same points between two digital images that characterize the original and deformed surface of a material under mechanical loading. The suitable sample preparation plays an important role in achieving satisfactory accuracies from the DIC technique [248]. In preparation, samples are painted with a random black speckle pattern following the requirement of the DIC technique. In practice, firstly, a thin layer of white paint is applied, which will thoroughly cover the surface of the samples and once this layer is totally dry, random speckles are then sprayed by means of black spray paint. It is essential to strictly do this procedure carefully to avoid making big black stains on samples to achieve successful imaging acquisition during the DIC technique application. An example of the black and white speckled surface of specimen is given in Fig. 4.23.
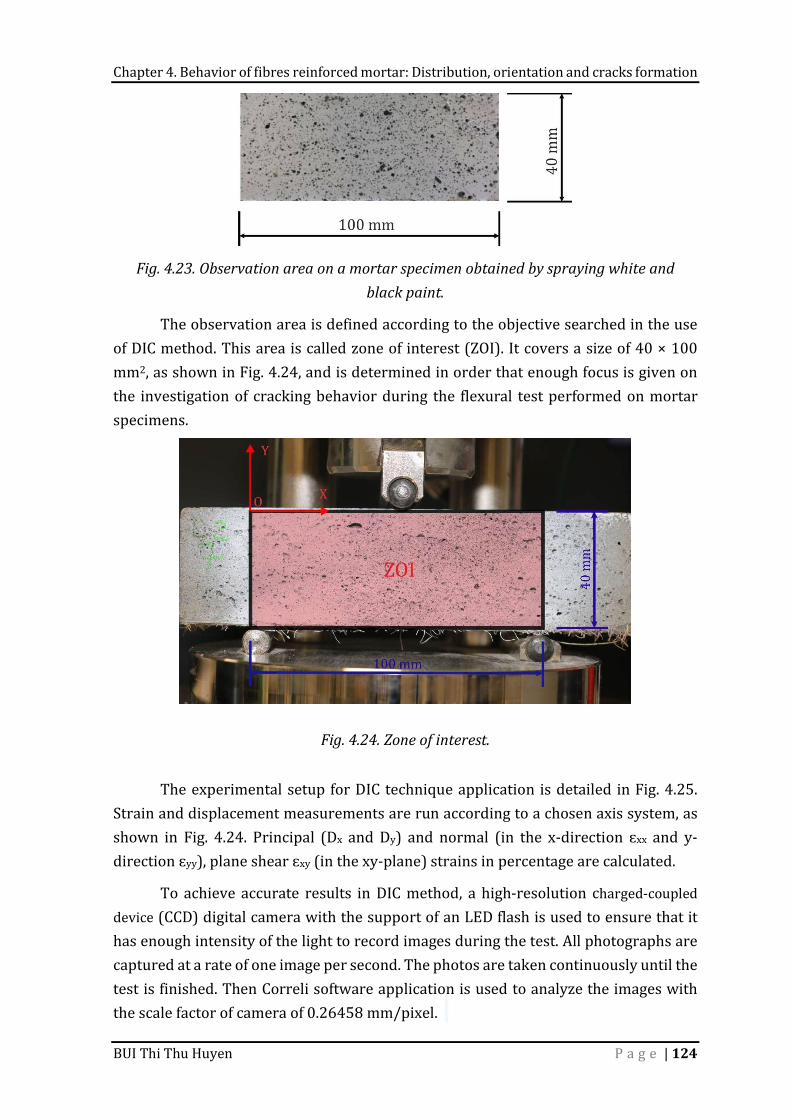
Chapter 4. Behavior of fibres reinforced mortar: Distribution, orientation and cracks formation
BUI Thi Thu Huyen P a g e | 124
Fig. 4.23. Observation area on a mortar specimen obtained by spraying white and
black paint. The observation area is defined according to the objective searched in the use of DIC method. This area is called zone of interest (ZOI). It covers a size of 40 × 100 mm2, as shown in Fig. 4.24, and is determined in order that enough focus is given on the investigation of cracking behavior during the flexural test performed on mortar specimens.
Fig. 4.24. Zone of interest.
The experimental setup for DIC technique application is detailed in Fig. 4.25. Strain and displacement measurements are run according to a chosen axis system, as shown in Fig. 4.24. Principal (Dx and Dy) and normal (in the x-direction ɛxx and y-direction ɛyy), plane shear ɛxy (in the xy-plane) strains in percentage are calculated. To achieve accurate results in DIC method, a high-resolution charged-coupled device (CCD) digital camera with the support of an LED flash is used to ensure that it has enough intensity of the light to record images during the test. All photographs are captured at a rate of one image per second. The photos are taken continuously until the test is finished. Then Correli software application is used to analyze the images with the scale factor of camera of 0.26458 mm/pixel.

Chapter 4. Behavior of fibres reinforced mortar: Distribution, orientation and cracks formation
BUI Thi Thu Huyen P a g e | 125
Fig. 4.25. Flexural test set up equipped for DIC.
4.3.4.2. Results and discussion
Strain development The relationship between force and displacement could describe flexural behavior until failure. A typical curve concerning CSA2 sample at 7 days of curing is plotted in Fig. 4.26. Simultaneously, during the flexural test, the images of observed damage inside ZOI are presented in Fig. 4.27. As expected, due to the presence of coconut fibres, specimen failure is not suddenly brittle. The DIC results concern the horizontal and vertical displacement (DX and DY) and the transverse strain (ɛxx), the vertical strain (ɛyy) and the shear strain (ɛxy), as shown in Fig. 4.28 for a CSA2 sample at 7 days of curing. These images illustrate the continuous strain development during the flexural test. The displacement and strain mappings obtained from DIC could better understand crack patterns and explain the failure mechanisms of samples in bending and shear. In addition, when analyzing DIC images, crack propagation of mortars during the tests is observed.
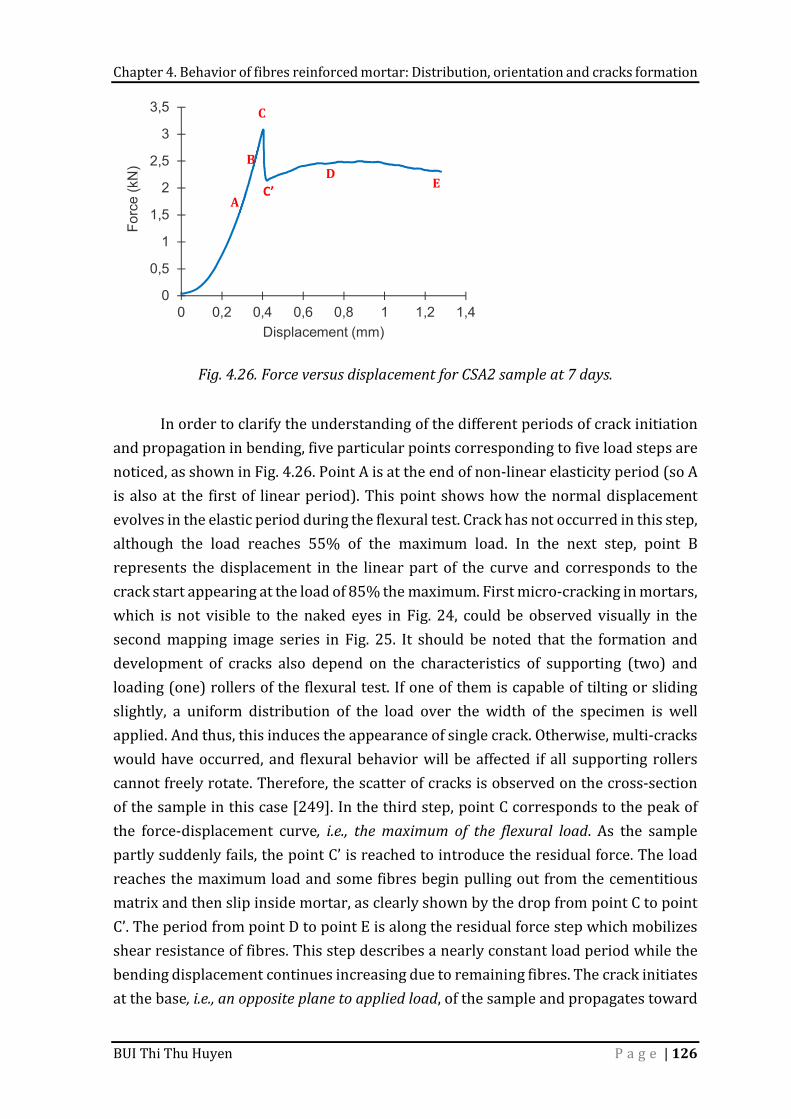
Chapter 4. Behavior of fibres reinforced mortar: Distribution, orientation and cracks formation
BUI Thi Thu Huyen P a g e | 126
Fig. 4.26. Force versus displacement for CSA2 sample at 7 days.
In order to clarify the understanding of the different periods of crack initiation and propagation in bending, five particular points corresponding to five load steps are noticed, as shown in Fig. 4.26. Point A is at the end of non-linear elasticity period (so A is also at the first of linear period). This point shows how the normal displacement evolves in the elastic period during the flexural test. Crack has not occurred in this step, although the load reaches 55% of the maximum load. In the next step, point B represents the displacement in the linear part of the curve and corresponds to the crack start appearing at the load of 85% the maximum. First micro-cracking in mortars, which is not visible to the naked eyes in Fig. 24, could be observed visually in the second mapping image series in Fig. 25. It should be noted that the formation and development of cracks also depend on the characteristics of supporting (two) and loading (one) rollers of the flexural test. If one of them is capable of tilting or sliding slightly, a uniform distribution of the load over the width of the specimen is well applied. And thus, this induces the appearance of single crack. Otherwise, multi-cracks would have occurred, and flexural behavior will be affected if all supporting rollers cannot freely rotate. Therefore, the scatter of cracks is observed on the cross-section of the sample in this case [249]. In the third step, point C corresponds to the peak of the force-displacement curve, i.e., the maximum of the flexural load. As the sample partly suddenly fails, the point C’ is reached to introduce the residual force. The load reaches the maximum load and some fibres begin pulling out from the cementitious matrix and then slip inside mortar, as clearly shown by the drop from point C to point C’. The period from point D to point E is along the residual force step which mobilizes shear resistance of fibres. This step describes a nearly constant load period while the bending displacement continues increasing due to remaining fibres. The crack initiates at the base, i.e., an opposite plane to applied load, of the sample and propagates toward
0
0,5
1
1,5
2
2,5
3
3,5
0 0,2 0,4 0,6 0,8 1 1,2 1,4
Forc
e (k
N)
Displacement (mm)
A B
C D
E C’
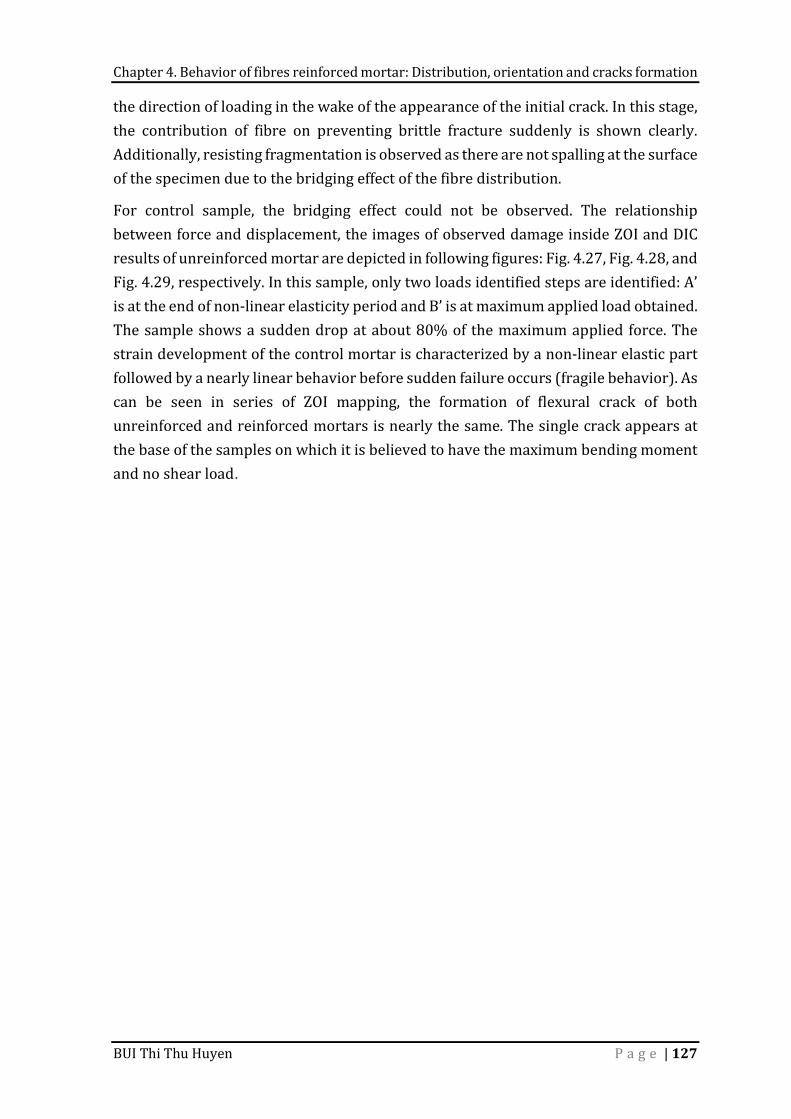
Chapter 4. Behavior of fibres reinforced mortar: Distribution, orientation and cracks formation
BUI Thi Thu Huyen P a g e | 127
the direction of loading in the wake of the appearance of the initial crack. In this stage, the contribution of fibre on preventing brittle fracture suddenly is shown clearly. Additionally, resisting fragmentation is observed as there are not spalling at the surface of the specimen due to the bridging effect of the fibre distribution. For control sample, the bridging effect could not be observed. The relationship between force and displacement, the images of observed damage inside ZOI and DIC results of unreinforced mortar are depicted in following figures: Fig. 4.27, Fig. 4.28, and Fig. 4.29, respectively. In this sample, only two loads identified steps are identified: A’ is at the end of non-linear elasticity period and B’ is at maximum applied load obtained. The sample shows a sudden drop at about 80% of the maximum applied force. The strain development of the control mortar is characterized by a non-linear elastic part followed by a nearly linear behavior before sudden failure occurs (fragile behavior). As can be seen in series of ZOI mapping, the formation of flexural crack of both unreinforced and reinforced mortars is nearly the same. The single crack appears at the base of the samples on which it is believed to have the maximum bending moment and no shear load.
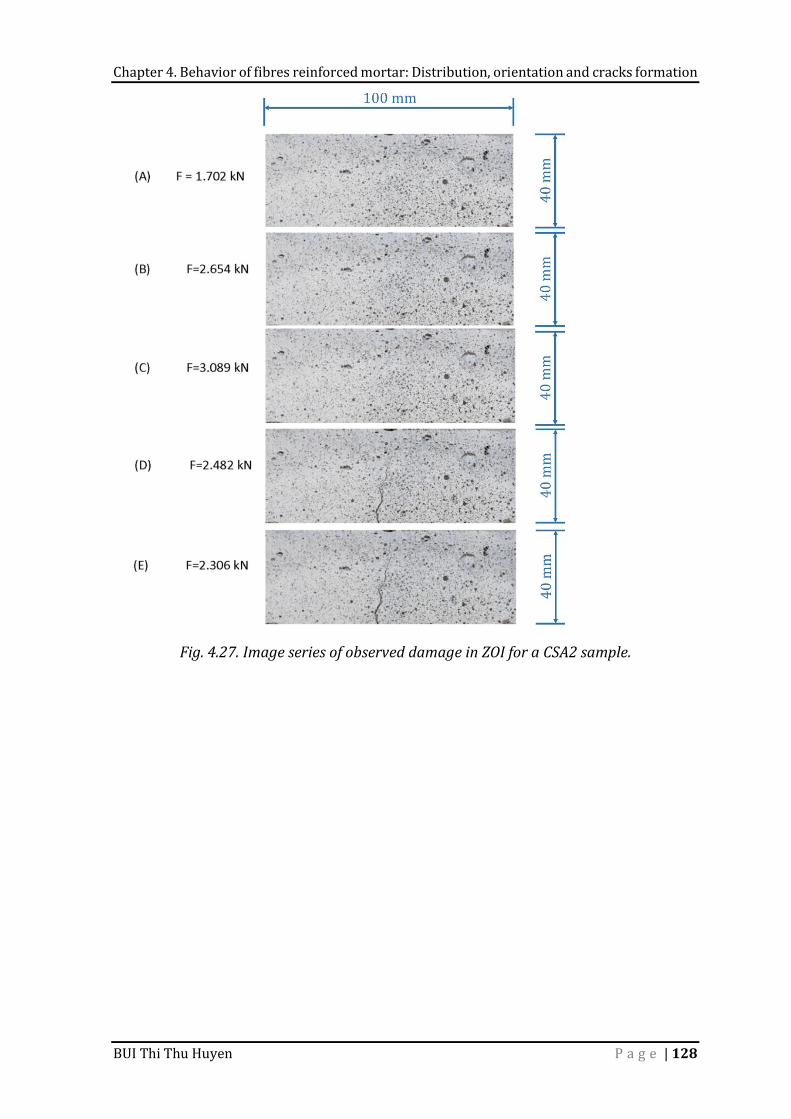
Chapter 4. Behavior of fibres reinforced mortar: Distribution, orientation and cracks formation
BUI Thi Thu Huyen P a g e | 128
Fig. 4.27. Image series of observed damage in ZOI for a CSA2 sample.
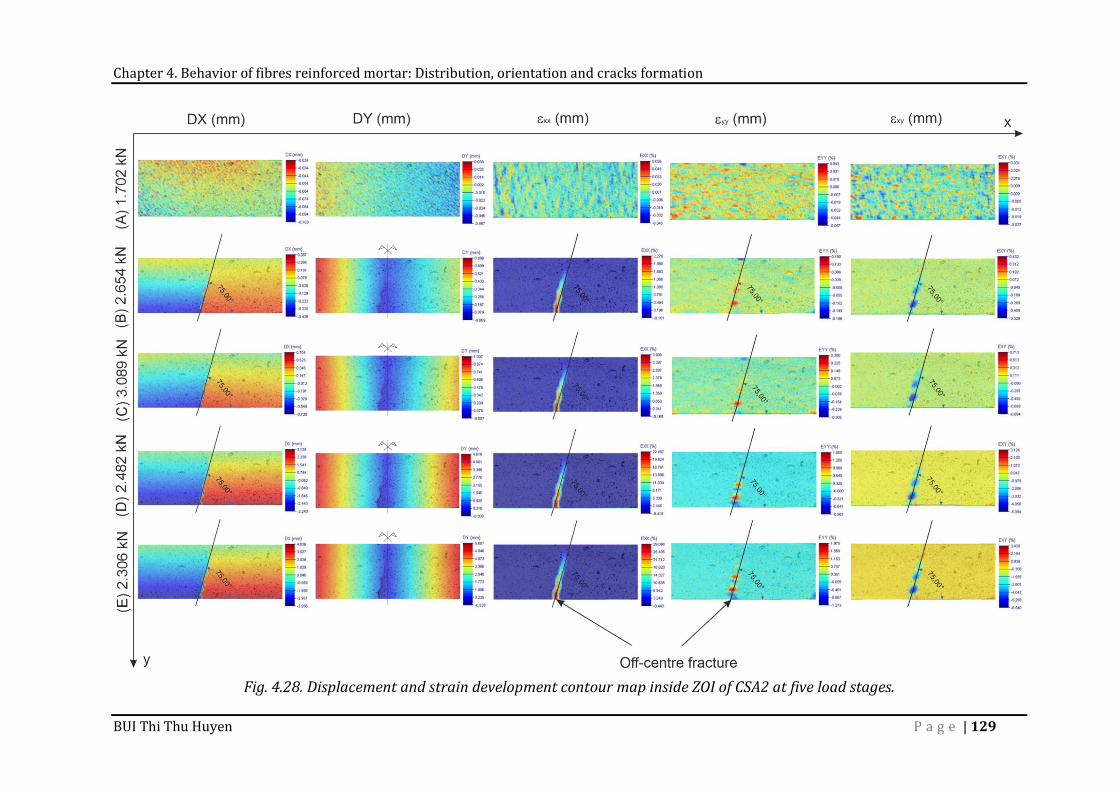
Chapter 4. Behavior of fibres reinforced mortar: Distribution, orientation and cracks formation
BUI Thi Thu Huyen P a g e | 129
Fig. 4.28. Displacement and strain development contour map inside ZOI of CSA2 at five load stages.
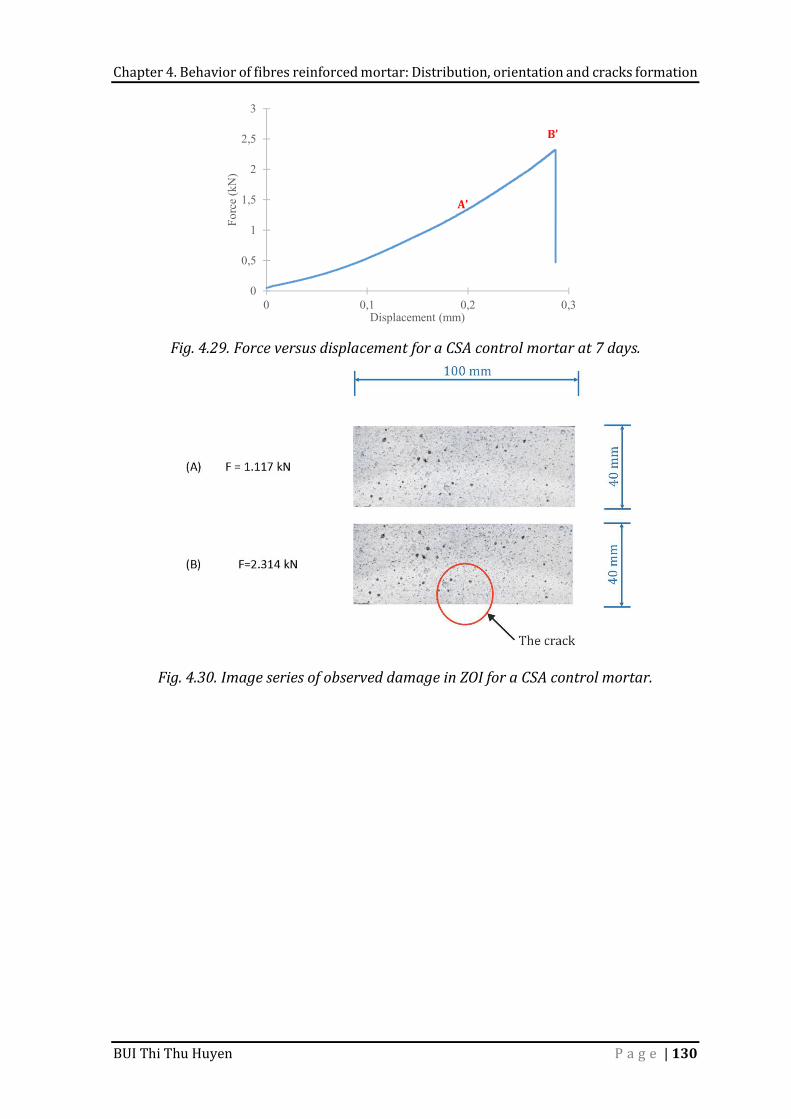
Chapter 4. Behavior of fibres reinforced mortar: Distribution, orientation and cracks formation
BUI Thi Thu Huyen P a g e | 130
Fig. 4.29. Force versus displacement for a CSA control mortar at 7 days.
Fig. 4.30. Image series of observed damage in ZOI for a CSA control mortar.
0
0,5
1
1,5
2
2,5
3
0 0,1 0,2 0,3
Forc
e (k
N)
Displacement (mm)
B’
A’
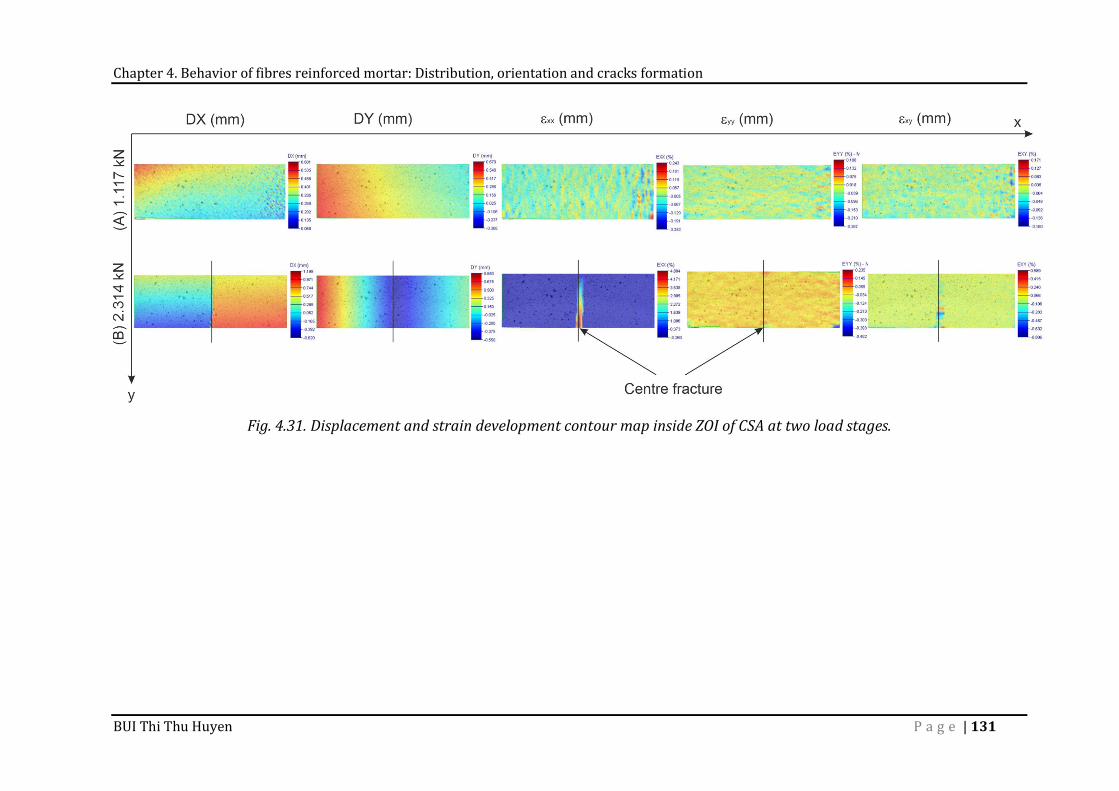
Chapter 4. Behavior of fibres reinforced mortar: Distribution, orientation and cracks formation
BUI Thi Thu Huyen P a g e | 131
Fig. 4.31. Displacement and strain development contour map inside ZOI of CSA at two load stages.
Chapter 4. Behavior of fibres reinforced mortar: Distribution, orientation and cracks formation
BUI Thi Thu Huyen P a g e | 132
Effect of fibre content The addition of 2% fibres increases the flexural strength of the reinforced mortar, as presented in section 4.3.2. In Fig. 4.28, the crack propagation is not exactly along the central axis and slightly off-centered for CSA2 sample, while the crack has occurred in the middle of the control sample, as shown in Fig. 4.31. Also, it can be seen in Fig. 4.28 and Fig. 4.31 the development of crack in fibre-reinforced mortar is found with an inclined angle of 75°, while staying along the vertical for unreinforced mortar. This could be the result of the inhomogeneous distribution of fibres in the mortar. Moreover, due to the presence of fibres, sample holds on to its shape in the wake of formation and development of fracture and crack. The results show that the addition of 2% fibres results in the smaller crack (both width and length) than that of mortar without fibre at the same level of loading, which is likely due to the relatively large pores in the mortar containing fibres. This can be confirmed by the microscope images of mortars at two mixture designs shown in Fig. 4.32. The inclusion of fibres has created a more porous structure in the mixture, which induces the mortar to be lower bulk density [36] that can provide convenience for transportation. In addition, the shear strains in horizontal planes are analyzed to achieve a clear understanding of the cracking behavior. In this way, two layers are chosen: (i) in the above part of sample, line A-A’ in the compressive part of sample which has small vertical displacement; (ii) in the below part of sample, line B-B’ in the tensile part of sample which has more significant vertical displacement. Fig. 4.33 indicates these chosen layers in the ZOI. The recorded results of the corresponding recorded shear strains can be seen in Fig. 4.34. The shear strain can be obtained from strain gauge. The results indicate that the shear strain shows an upward trend over the area of cracking. Outside of this area, the values of shear strain remain close to zero. This means that shear crack is mainly found around the crack tip and difficult to detect in other parts. Note that shear strains became significantly larger when the fibres are added in mortars. The distribution of cracks is governed by the distribution of shear strain. For both types of samples surveyed, the shear strains in the area closer to the loading point became remarkably smaller when compared to those in the layer closer to the maximum cracking of specimen. Fig. 4.35 gives the crack width of unreinforced mortar and fibre-reinforced mortars at their corresponding ultimate loads based on DIC analysis. It is clear that fibres play an important role in controlling the cracking behavior and increasing the crack width of fibre-reinforced mortar at the end of the test. As observed at the ultimate
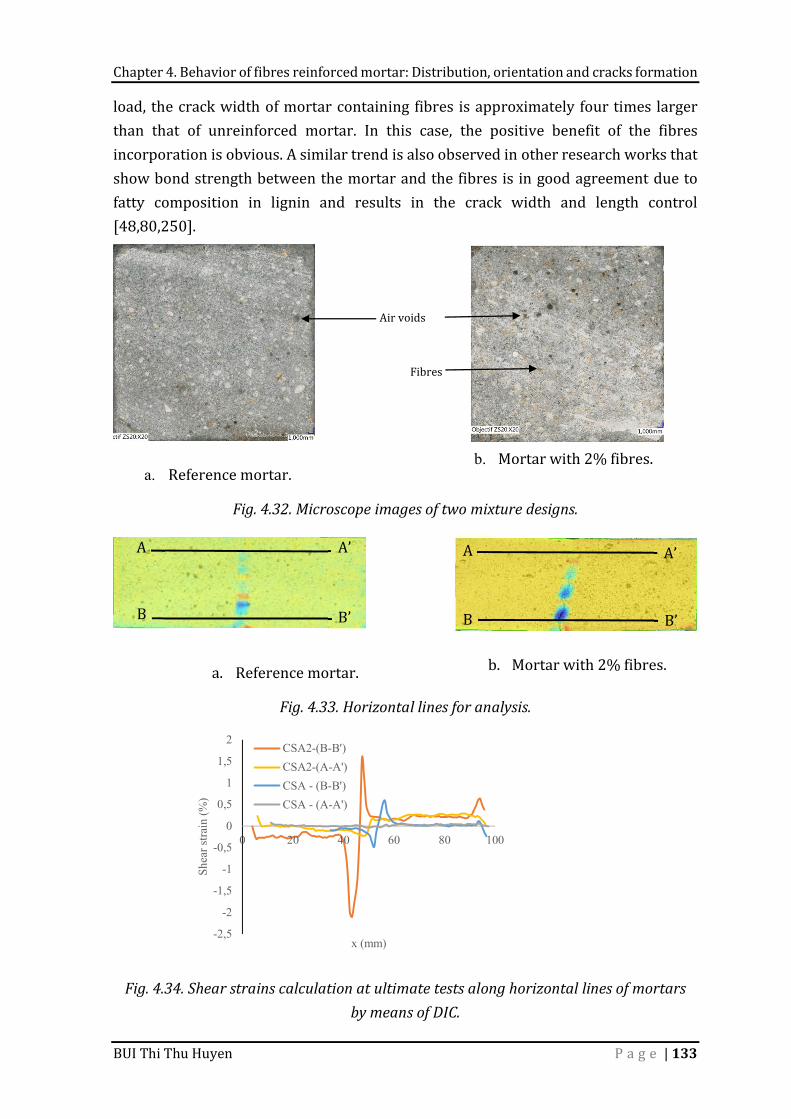
Chapter 4. Behavior of fibres reinforced mortar: Distribution, orientation and cracks formation
BUI Thi Thu Huyen P a g e | 133
load, the crack width of mortar containing fibres is approximately four times larger than that of unreinforced mortar. In this case, the positive benefit of the fibres incorporation is obvious. A similar trend is also observed in other research works that show bond strength between the mortar and the fibres is in good agreement due to fatty composition in lignin and results in the crack width and length control [48,80,250].
a. Reference mortar. b. Mortar with 2% fibres.
Fig. 4.32. Microscope images of two mixture designs. a. Reference mortar. b. Mortar with 2% fibres. Fig. 4.33. Horizontal lines for analysis.
Fig. 4.34. Shear strains calculation at ultimate tests along horizontal lines of mortars
by means of DIC.
-2,5
-2
-1,5
-1
-0,5
0
0,5
1
1,5
2
0 20 40 60 80 100
Shea
r stra
in (%
)
x (mm)
CSA2-(B-B')CSA2-(A-A')CSA - (B-B')CSA - (A-A')
A A’ B’ B
Air voids Fibres
A A’ B’ B
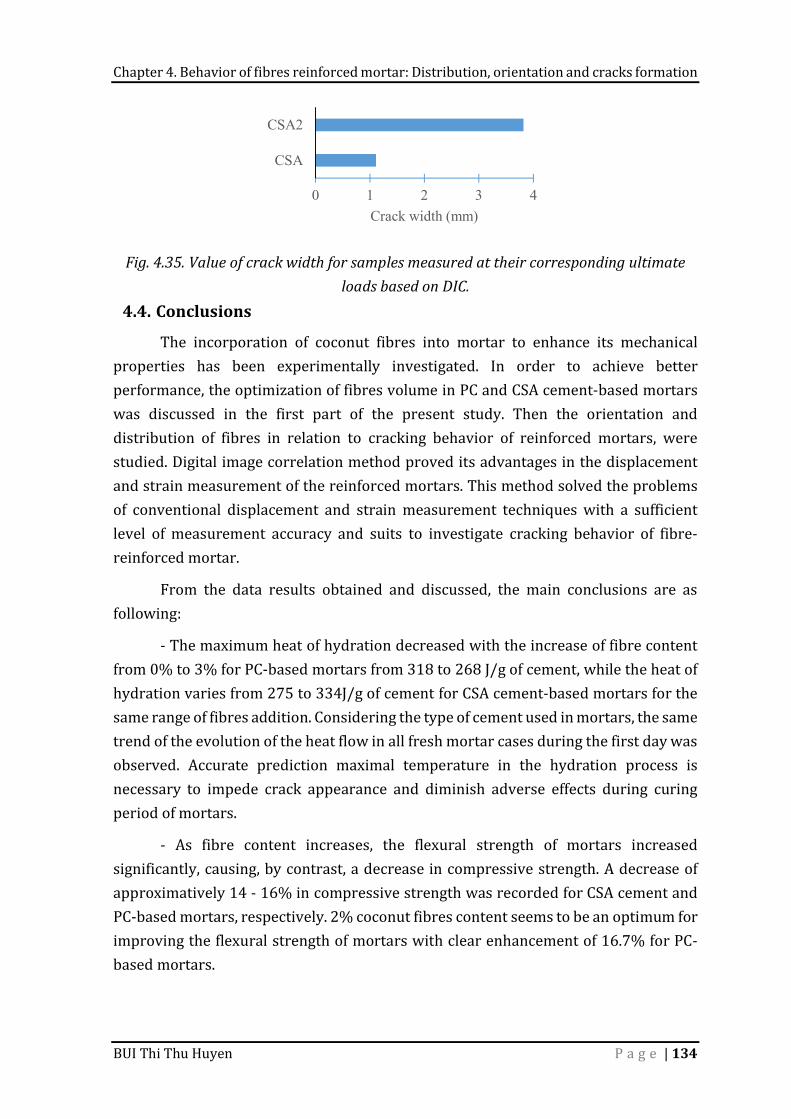
Chapter 4. Behavior of fibres reinforced mortar: Distribution, orientation and cracks formation
BUI Thi Thu Huyen P a g e | 134
Fig. 4.35. Value of crack width for samples measured at their corresponding ultimate
loads based on DIC. 4.4. Conclusions The incorporation of coconut fibres into mortar to enhance its mechanical properties has been experimentally investigated. In order to achieve better performance, the optimization of fibres volume in PC and CSA cement-based mortars was discussed in the first part of the present study. Then the orientation and distribution of fibres in relation to cracking behavior of reinforced mortars, were studied. Digital image correlation method proved its advantages in the displacement and strain measurement of the reinforced mortars. This method solved the problems of conventional displacement and strain measurement techniques with a sufficient level of measurement accuracy and suits to investigate cracking behavior of fibre-reinforced mortar. From the data results obtained and discussed, the main conclusions are as following: - The maximum heat of hydration decreased with the increase of fibre content from 0% to 3% for PC-based mortars from 318 to 268 J/g of cement, while the heat of hydration varies from 275 to 334J/g of cement for CSA cement-based mortars for the same range of fibres addition. Considering the type of cement used in mortars, the same trend of the evolution of the heat flow in all fresh mortar cases during the first day was observed. Accurate prediction maximal temperature in the hydration process is necessary to impede crack appearance and diminish adverse effects during curing period of mortars. - As fibre content increases, the flexural strength of mortars increased significantly, causing, by contrast, a decrease in compressive strength. A decrease of approximatively 14 - 16% in compressive strength was recorded for CSA cement and PC-based mortars, respectively. 2% coconut fibres content seems to be an optimum for improving the flexural strength of mortars with clear enhancement of 16.7% for PC-based mortars.
0 1 2 3 4
CSA
CSA2
Crack width (mm)

Chapter 4. Behavior of fibres reinforced mortar: Distribution, orientation and cracks formation
BUI Thi Thu Huyen P a g e | 135
- Cutting the specimens along the casting direction and counting fibres number on each surface seems to be a reasonable methodology for evaluating the distribution and orientation of fibres in the mortars. The fibres location is revealed through the microscope images, which helped to understand the arrangement of fibres within the hardened reinforced mortars and obtained the quantitative measurement of the distribution and orientation of fibres. It seems that the number of fibres do not have significant effects on fibre orientation. The higher density of fibres was found in vertical planes compared to horizontal planes. The distribution of fibres in hardened mortar was very different as fibres tend to move to the upper layer of mortar during the manufacturing process, creating a heterogeneous and anisotropic distribution of fibres in the matrix, which led to the difference in flexural behavior and fracture factor of mortar. Due to the border effect, the movement of fibres was limited and led to different area of fibres in different parts of sample. - Strain mapping of the mortar samples achieved by DIC method can be used in the study of understanding of crack mechanisms of fibres reinforced mortars when the strains are recorded from an ideal ZOI location on the sample surface. After the appearance of the initial crack at the load of 85% the maximum, crack initiates at the centre of sample and propagates toward the loading point. Due to the various distribution of fibres, crack formation and propagation is not developed exactly vertically in the centre of the sample. It is observed at an angle of 75°. By contrast, the development of crack goes vertically upwards at the centre of surface for the unreinforced mortar specimens. The enhancement toughness and preventing development of cracks inside reinforced mortars are the most important contributions of fibres.
Chapter 5. Relationship between durability and strength of mortar incorporating fibres
BUI Thi Thu Huyen P a g e | 136
CHAPTER 5. RELATIONSHIP BETWEEN DURABILITY AND STRENGH OF MORTAR INCOPORATING FIBRES
5.1. Introduction Although fibre-reinforced mortar shows a wide range of its advantage, it is not easy to recommend and employ such material for construction because of problems to solve as long-term properties and durability. Significant reduction in the long-term mechanical performance has been observed and identified in natural fibre-reinforced composite in aging due to deterioration of the incorporated natural fibres under cementitious environment [21,46,127]. The study of the durability and long-term behavior of mortar incorporating coconut fibres is one of the main objectives of this research program. Unlike work on fibre formulation and treatments, the data results on the durability of these materials are still limited. The results of the two previous chapters have highlighted obstacles in terms of the durability of these fibre cementitious composites. Natural fibres reinforced composites are mainly used in outdoor applications where environment is considered as an aggressive factor. These composite materials have to deal with damaged problems regarding the losses in strength and decrease in durability. In order to improve long-term behavior of these composite materials, several programs to investigate relationship between durability and strength are proposed in this chapter, including exposure of these materials to extreme conditions, such as carbonation or wetting and drying cycles. Improving the
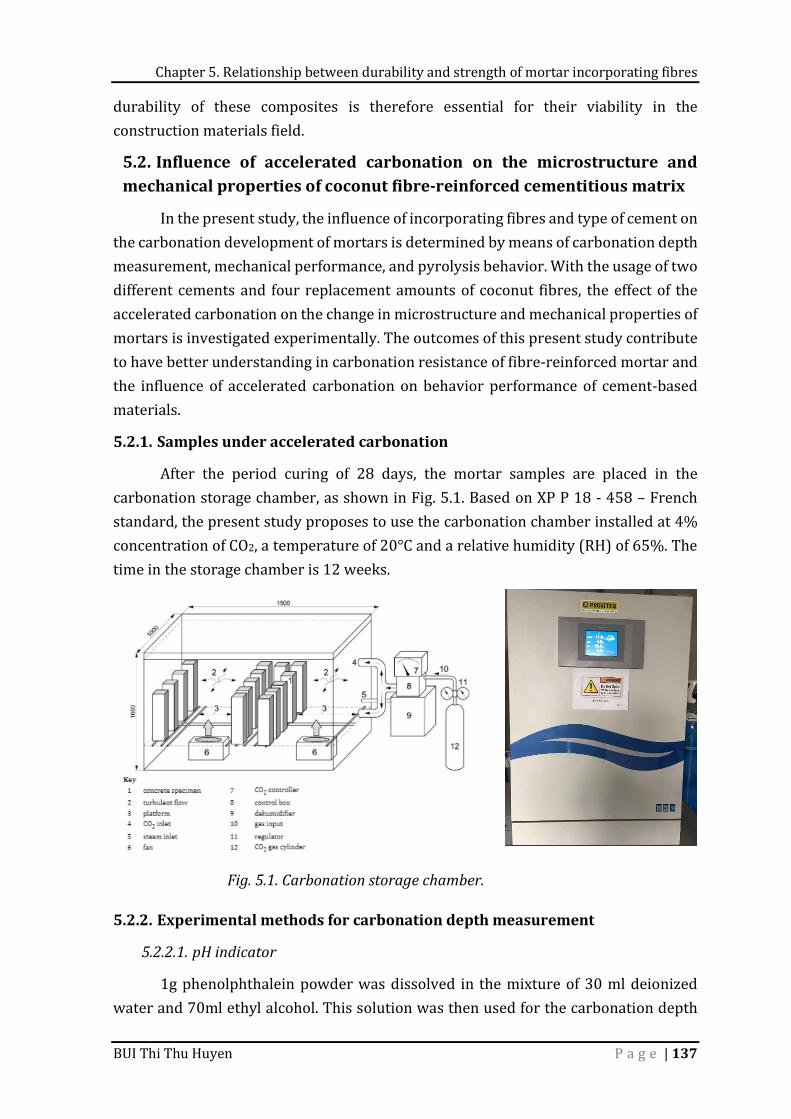
Chapter 5. Relationship between durability and strength of mortar incorporating fibres
BUI Thi Thu Huyen P a g e | 137
durability of these composites is therefore essential for their viability in the construction materials field. 5.2. Influence of accelerated carbonation on the microstructure and mechanical properties of coconut fibre-reinforced cementitious matrix In the present study, the influence of incorporating fibres and type of cement on the carbonation development of mortars is determined by means of carbonation depth measurement, mechanical performance, and pyrolysis behavior. With the usage of two different cements and four replacement amounts of coconut fibres, the effect of the accelerated carbonation on the change in microstructure and mechanical properties of mortars is investigated experimentally. The outcomes of this present study contribute to have better understanding in carbonation resistance of fibre-reinforced mortar and the influence of accelerated carbonation on behavior performance of cement-based materials.
5.2.1. Samples under accelerated carbonation After the period curing of 28 days, the mortar samples are placed in the carbonation storage chamber, as shown in Fig. 5.1. Based on XP P 18 - 458 – French standard, the present study proposes to use the carbonation chamber installed at 4% concentration of CO2, a temperature of 20°C and a relative humidity (RH) of 65%. The time in the storage chamber is 12 weeks.
Fig. 5.1. Carbonation storage chamber. 5.2.2. Experimental methods for carbonation depth measurement
5.2.2.1. pH indicator 1g phenolphthalein powder was dissolved in the mixture of 30 ml deionized water and 70ml ethyl alcohol. This solution was then used for the carbonation depth
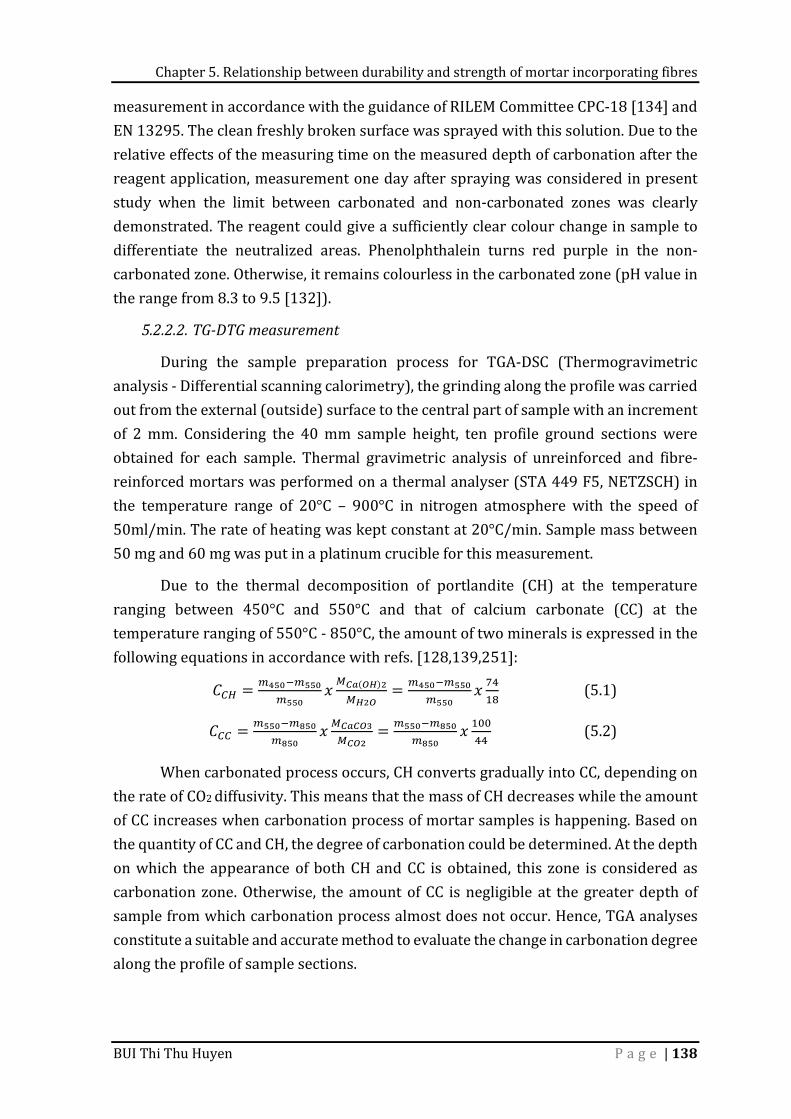
Chapter 5. Relationship between durability and strength of mortar incorporating fibres
BUI Thi Thu Huyen P a g e | 138
measurement in accordance with the guidance of RILEM Committee CPC-18 [134] and EN 13295. The clean freshly broken surface was sprayed with this solution. Due to the relative effects of the measuring time on the measured depth of carbonation after the reagent application, measurement one day after spraying was considered in present study when the limit between carbonated and non-carbonated zones was clearly demonstrated. The reagent could give a sufficiently clear colour change in sample to differentiate the neutralized areas. Phenolphthalein turns red purple in the non-carbonated zone. Otherwise, it remains colourless in the carbonated zone (pH value in the range from 8.3 to 9.5 [132]). 5.2.2.2. TG-DTG measurement During the sample preparation process for TGA-DSC (Thermogravimetric analysis - Differential scanning calorimetry), the grinding along the profile was carried out from the external (outside) surface to the central part of sample with an increment of 2 mm. Considering the 40 mm sample height, ten profile ground sections were obtained for each sample. Thermal gravimetric analysis of unreinforced and fibre-reinforced mortars was performed on a thermal analyser (STA 449 F5, NETZSCH) in the temperature range of 20°C – 900°C in nitrogen atmosphere with the speed of 50ml/min. The rate of heating was kept constant at 20°C/min. Sample mass between 50 mg and 60 mg was put in a platinum crucible for this measurement. Due to the thermal decomposition of portlandite (CH) at the temperature ranging between 450°C and 550°C and that of calcium carbonate (CC) at the temperature ranging of 550°C - 850°C, the amount of two minerals is expressed in the following equations in accordance with refs. [128,139,251]: 𝐶 = 𝑥 ( ) = 𝑥 (5.1) 𝐶 = 𝑥 = 𝑥 (5.2) When carbonated process occurs, CH converts gradually into CC, depending on the rate of CO2 diffusivity. This means that the mass of CH decreases while the amount of CC increases when carbonation process of mortar samples is happening. Based on the quantity of CC and CH, the degree of carbonation could be determined. At the depth on which the appearance of both CH and CC is obtained, this zone is considered as carbonation zone. Otherwise, the amount of CC is negligible at the greater depth of sample from which carbonation process almost does not occur. Hence, TGA analyses constitute a suitable and accurate method to evaluate the change in carbonation degree along the profile of sample sections.
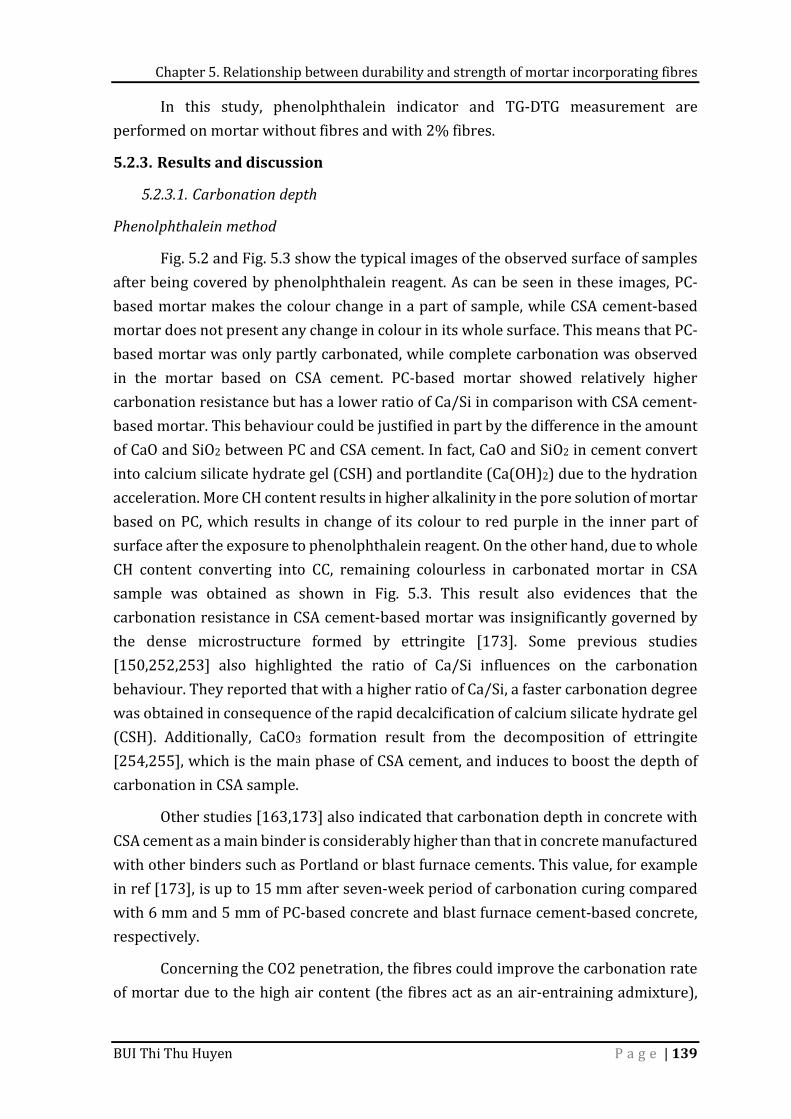
Chapter 5. Relationship between durability and strength of mortar incorporating fibres
BUI Thi Thu Huyen P a g e | 139
In this study, phenolphthalein indicator and TG-DTG measurement are performed on mortar without fibres and with 2% fibres. 5.2.3. Results and discussion
5.2.3.1. Carbonation depth
Phenolphthalein method Fig. 5.2 and Fig. 5.3 show the typical images of the observed surface of samples after being covered by phenolphthalein reagent. As can be seen in these images, PC-based mortar makes the colour change in a part of sample, while CSA cement-based mortar does not present any change in colour in its whole surface. This means that PC-based mortar was only partly carbonated, while complete carbonation was observed in the mortar based on CSA cement. PC-based mortar showed relatively higher carbonation resistance but has a lower ratio of Ca/Si in comparison with CSA cement-based mortar. This behaviour could be justified in part by the difference in the amount of CaO and SiO2 between PC and CSA cement. In fact, CaO and SiO2 in cement convert into calcium silicate hydrate gel (CSH) and portlandite (Ca(OH)2) due to the hydration acceleration. More CH content results in higher alkalinity in the pore solution of mortar based on PC, which results in change of its colour to red purple in the inner part of surface after the exposure to phenolphthalein reagent. On the other hand, due to whole CH content converting into CC, remaining colourless in carbonated mortar in CSA sample was obtained as shown in Fig. 5.3. This result also evidences that the carbonation resistance in CSA cement-based mortar was insignificantly governed by the dense microstructure formed by ettringite [173]. Some previous studies [150,252,253] also highlighted the ratio of Ca/Si influences on the carbonation behaviour. They reported that with a higher ratio of Ca/Si, a faster carbonation degree was obtained in consequence of the rapid decalcification of calcium silicate hydrate gel (CSH). Additionally, CaCO3 formation result from the decomposition of ettringite [254,255], which is the main phase of CSA cement, and induces to boost the depth of carbonation in CSA sample. Other studies [163,173] also indicated that carbonation depth in concrete with CSA cement as a main binder is considerably higher than that in concrete manufactured with other binders such as Portland or blast furnace cements. This value, for example in ref [173], is up to 15 mm after seven-week period of carbonation curing compared with 6 mm and 5 mm of PC-based concrete and blast furnace cement-based concrete, respectively. Concerning the CO2 penetration, the fibres could improve the carbonation rate of mortar due to the high air content (the fibres act as an air-entraining admixture),
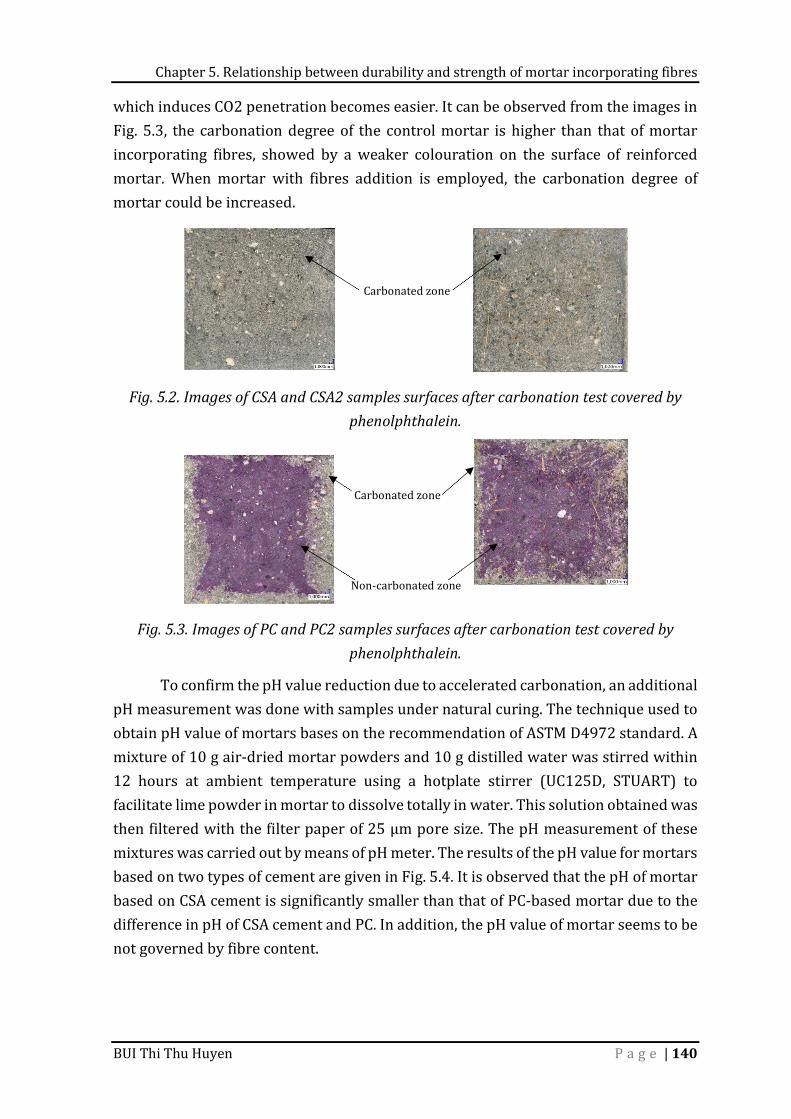
Chapter 5. Relationship between durability and strength of mortar incorporating fibres
BUI Thi Thu Huyen P a g e | 140
which induces CO2 penetration becomes easier. It can be observed from the images in Fig. 5.3, the carbonation degree of the control mortar is higher than that of mortar incorporating fibres, showed by a weaker colouration on the surface of reinforced mortar. When mortar with fibres addition is employed, the carbonation degree of mortar could be increased.
Fig. 5.2. Images of CSA and CSA2 samples surfaces after carbonation test covered by
phenolphthalein.
Fig. 5.3. Images of PC and PC2 samples surfaces after carbonation test covered by
phenolphthalein. To confirm the pH value reduction due to accelerated carbonation, an additional pH measurement was done with samples under natural curing. The technique used to obtain pH value of mortars bases on the recommendation of ASTM D4972 standard. A mixture of 10 g air-dried mortar powders and 10 g distilled water was stirred within 12 hours at ambient temperature using a hotplate stirrer (UC125D, STUART) to facilitate lime powder in mortar to dissolve totally in water. This solution obtained was then filtered with the filter paper of 25 μm pore size. The pH measurement of these mixtures was carried out by means of pH meter. The results of the pH value for mortars based on two types of cement are given in Fig. 5.4. It is observed that the pH of mortar based on CSA cement is significantly smaller than that of PC-based mortar due to the difference in pH of CSA cement and PC. In addition, the pH value of mortar seems to be not governed by fibre content.
Carbonated zone
Non-carbonated zone
Carbonated zone
Chapter 5. Relationship between durability and strength of mortar incorporating fibres
BUI Thi Thu Huyen P a g e | 141
Fig. 5.4. Effect of fibre content on pH values for PC and CSA cement-based mortars.
TGA measurement Fig. 5.5 illustrates the measured CC and CH content using TGA measurement, as a function of depth of mortar. For the PC2 sample, where a part of area is exposed by carbonation, a clear decrease in CC content is detected while the amount of CH measured is increased gradually. This means that exposure to carbonation has significant effects on the degree of clinker reaction. This induces the observed two opposite trends in CC and CH contents from the outer surface to the middle part of carbonated samples observed. More deeply, the CO2 penetration is more complicated and almost restricted in the outer sections due to the dense microstructure impeding. On the contrary, the concentration distribution of CH and CC in CSA2 sample, which is carbonated completely, is almost constant over the sample entire depth. In addition, the amount of CC in the carbonated area of PC2 sample is higher than that of CSA2 sample but is lower in the non-carbonated area. A stronger carbonation degree for PC2 sample compared to CSA2 sample in outer sections is obtained. This observation could be explained by CaO content in the two types of binder. The higher content of CaO in PC could induce the higher content of CC in carbonation area. Also, due to the low pH value and low porosity of CSA cement [201], the CO2 diffusivity becomes more difficult even in the outer sections. Nevertheless, the difference happened upon non-carbonated area and the lower content of CC in PC2 sample is observed. The cause of this phenomenon is that clinker reaction under carbonation curing for 12 weeks increases the amount of CC created, which makes the higher content of CC in CSA2 sample than in PC2 sample within non-carbonation sections. Otherwise, due to low CH content [256], the consumption of CH in CSA samples were almost completed after 12 weeks of the accelerated carbonation. As can be seen from Fig. 5.5, the different carbonation depth according to two methods, i.e., one using phenolphthalein indicator on the freshly broken surface of samples and the other, the thermogravimetric analysis for sample powder profiles, is
12,53 12,5410,97 10,96
10111213
0 2pH
Fibre content (%)PC binderCSA binder
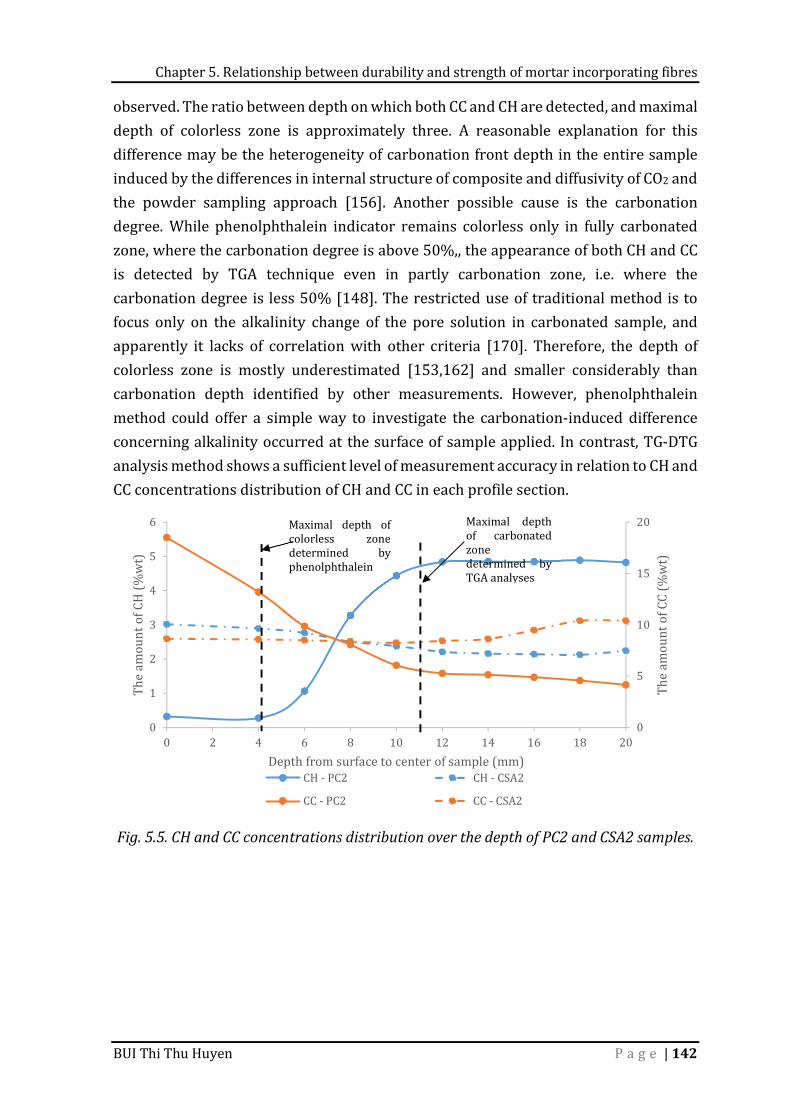
Chapter 5. Relationship between durability and strength of mortar incorporating fibres
BUI Thi Thu Huyen P a g e | 142
observed. The ratio between depth on which both CC and CH are detected, and maximal depth of colorless zone is approximately three. A reasonable explanation for this difference may be the heterogeneity of carbonation front depth in the entire sample induced by the differences in internal structure of composite and diffusivity of CO2 and the powder sampling approach [156]. Another possible cause is the carbonation degree. While phenolphthalein indicator remains colorless only in fully carbonated zone, where the carbonation degree is above 50%,, the appearance of both CH and CC is detected by TGA technique even in partly carbonation zone, i.e. where the carbonation degree is less 50% [148]. The restricted use of traditional method is to focus only on the alkalinity change of the pore solution in carbonated sample, and apparently it lacks of correlation with other criteria [170]. Therefore, the depth of colorless zone is mostly underestimated [153,162] and smaller considerably than carbonation depth identified by other measurements. However, phenolphthalein method could offer a simple way to investigate the carbonation-induced difference concerning alkalinity occurred at the surface of sample applied. In contrast, TG-DTG analysis method shows a sufficient level of measurement accuracy in relation to CH and CC concentrations distribution of CH and CC in each profile section.
Fig. 5.5. CH and CC concentrations distribution over the depth of PC2 and CSA2 samples.
05101520
0123456
0 2 4 6 8 10 12 14 16 18 20The am
ount of CC (%
wt)
The amount of
CH (%wt)
Depth from surface to center of sample (mm)CH - PC2 CH - CSA2CC - PC2 CC - CSA2
Maximal depth of colorless zone determined by phenolphthalein Maximal depth of carbonated zone determined by TGA analyses
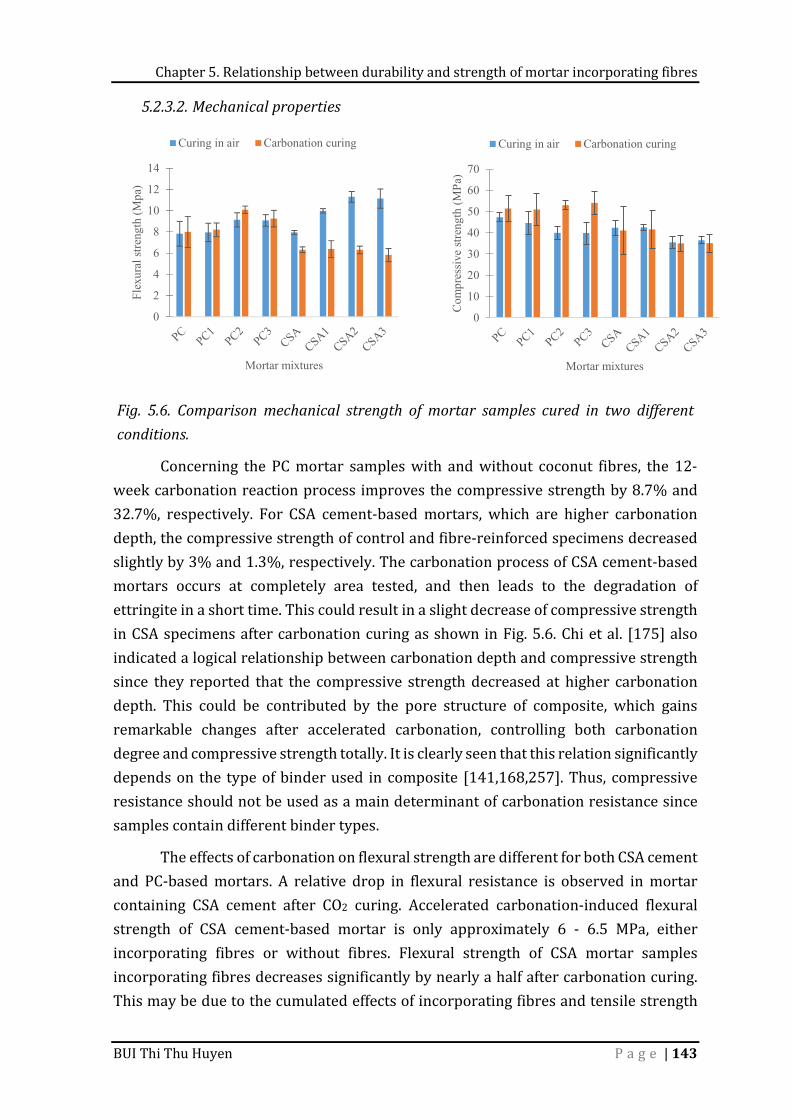
Chapter 5. Relationship between durability and strength of mortar incorporating fibres
BUI Thi Thu Huyen P a g e | 143
5.2.3.2. Mechanical properties
Fig. 5.6. Comparison mechanical strength of mortar samples cured in two different conditions. Concerning the PC mortar samples with and without coconut fibres, the 12-week carbonation reaction process improves the compressive strength by 8.7% and 32.7%, respectively. For CSA cement-based mortars, which are higher carbonation depth, the compressive strength of control and fibre-reinforced specimens decreased slightly by 3% and 1.3%, respectively. The carbonation process of CSA cement-based mortars occurs at completely area tested, and then leads to the degradation of ettringite in a short time. This could result in a slight decrease of compressive strength in CSA specimens after carbonation curing as shown in Fig. 5.6. Chi et al. [175] also indicated a logical relationship between carbonation depth and compressive strength since they reported that the compressive strength decreased at higher carbonation depth. This could be contributed by the pore structure of composite, which gains remarkable changes after accelerated carbonation, controlling both carbonation degree and compressive strength totally. It is clearly seen that this relation significantly depends on the type of binder used in composite [141,168,257]. Thus, compressive resistance should not be used as a main determinant of carbonation resistance since samples contain different binder types. The effects of carbonation on flexural strength are different for both CSA cement and PC-based mortars. A relative drop in flexural resistance is observed in mortar containing CSA cement after CO2 curing. Accelerated carbonation-induced flexural strength of CSA cement-based mortar is only approximately 6 - 6.5 MPa, either incorporating fibres or without fibres. Flexural strength of CSA mortar samples incorporating fibres decreases significantly by nearly a half after carbonation curing. This may be due to the cumulated effects of incorporating fibres and tensile strength
0
2
4
6
8
10
12
14
Flex
ural
stre
ngth
(Mpa
)
Mortar mixtures
Curing in air Carbonation curing
0
10
20
30
40
50
60
70
Com
pres
sive
stren
gth
(MPa
)
Mortar mixtures
Curing in air Carbonation curing
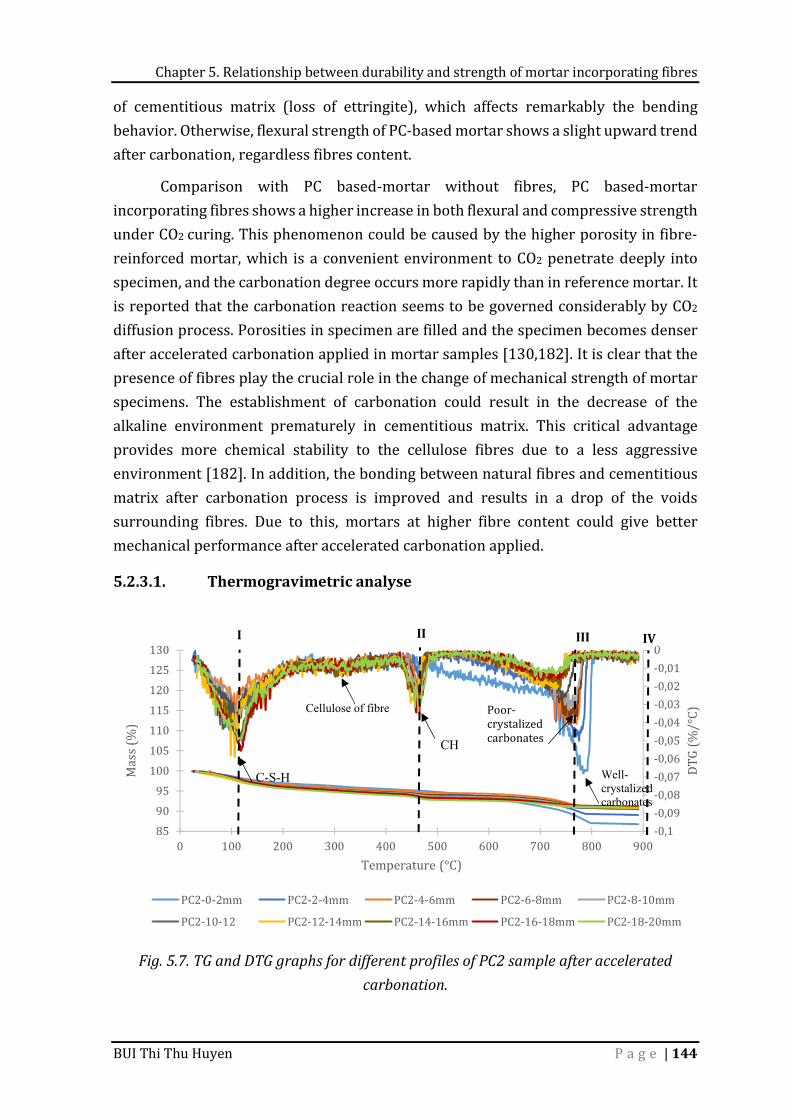
Chapter 5. Relationship between durability and strength of mortar incorporating fibres
BUI Thi Thu Huyen P a g e | 144
of cementitious matrix (loss of ettringite), which affects remarkably the bending behavior. Otherwise, flexural strength of PC-based mortar shows a slight upward trend after carbonation, regardless fibres content. Comparison with PC based-mortar without fibres, PC based-mortar incorporating fibres shows a higher increase in both flexural and compressive strength under CO2 curing. This phenomenon could be caused by the higher porosity in fibre-reinforced mortar, which is a convenient environment to CO2 penetrate deeply into specimen, and the carbonation degree occurs more rapidly than in reference mortar. It is reported that the carbonation reaction seems to be governed considerably by CO2 diffusion process. Porosities in specimen are filled and the specimen becomes denser after accelerated carbonation applied in mortar samples [130,182]. It is clear that the presence of fibres play the crucial role in the change of mechanical strength of mortar specimens. The establishment of carbonation could result in the decrease of the alkaline environment prematurely in cementitious matrix. This critical advantage provides more chemical stability to the cellulose fibres due to a less aggressive environment [182]. In addition, the bonding between natural fibres and cementitious matrix after carbonation process is improved and results in a drop of the voids surrounding fibres. Due to this, mortars at higher fibre content could give better mechanical performance after accelerated carbonation applied. 5.2.3.1. Thermogravimetric analyse
Fig. 5.7. TG and DTG graphs for different profiles of PC2 sample after accelerated
carbonation.
-0,1-0,09-0,08-0,07-0,06-0,05-0,04-0,03-0,02-0,010
859095100105110115120125130
0 100 200 300 400 500 600 700 800 900
DTG (%/°C)
Mass (%)
Temperature (°C)PC2-0-2mm PC2-2-4mm PC2-4-6mm PC2-6-8mm PC2-8-10mmPC2-10-12 PC2-12-14mm PC2-14-16mm PC2-16-18mm PC2-18-20mm
C-S-H
CH
Well-crystalized carbonates
Cellulose of fibre
I II III IV
Poor-crystalized carbonates
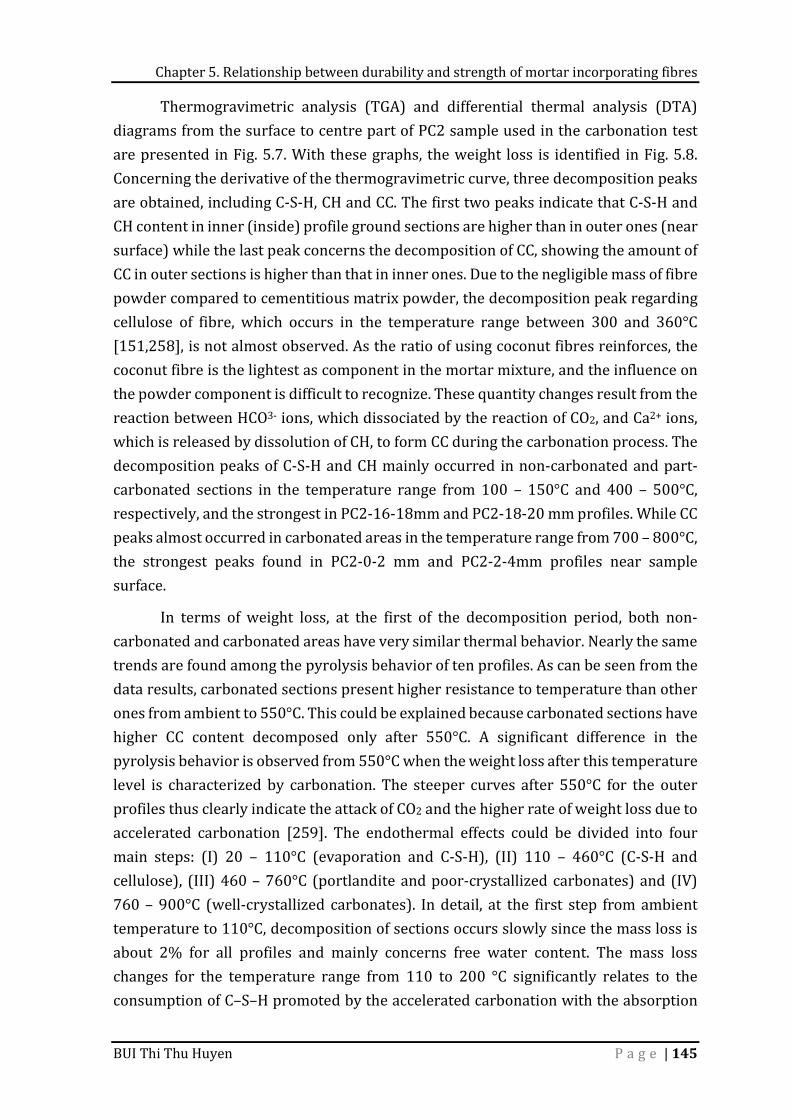
Chapter 5. Relationship between durability and strength of mortar incorporating fibres
BUI Thi Thu Huyen P a g e | 145
Thermogravimetric analysis (TGA) and differential thermal analysis (DTA) diagrams from the surface to centre part of PC2 sample used in the carbonation test are presented in Fig. 5.7. With these graphs, the weight loss is identified in Fig. 5.8. Concerning the derivative of the thermogravimetric curve, three decomposition peaks are obtained, including C-S-H, CH and CC. The first two peaks indicate that C-S-H and CH content in inner (inside) profile ground sections are higher than in outer ones (near surface) while the last peak concerns the decomposition of CC, showing the amount of CC in outer sections is higher than that in inner ones. Due to the negligible mass of fibre powder compared to cementitious matrix powder, the decomposition peak regarding cellulose of fibre, which occurs in the temperature range between 300 and 360°C [151,258], is not almost observed. As the ratio of using coconut fibres reinforces, the coconut fibre is the lightest as component in the mortar mixture, and the influence on the powder component is difficult to recognize. These quantity changes result from the reaction between HCO3- ions, which dissociated by the reaction of CO2, and Ca2+ ions, which is released by dissolution of CH, to form CC during the carbonation process. The decomposition peaks of C-S-H and CH mainly occurred in non-carbonated and part-carbonated sections in the temperature range from 100 – 150°C and 400 – 500°C, respectively, and the strongest in PC2-16-18mm and PC2-18-20 mm profiles. While CC peaks almost occurred in carbonated areas in the temperature range from 700 – 800°C, the strongest peaks found in PC2-0-2 mm and PC2-2-4mm profiles near sample surface. In terms of weight loss, at the first of the decomposition period, both non-carbonated and carbonated areas have very similar thermal behavior. Nearly the same trends are found among the pyrolysis behavior of ten profiles. As can be seen from the data results, carbonated sections present higher resistance to temperature than other ones from ambient to 550°C. This could be explained because carbonated sections have higher CC content decomposed only after 550°C. A significant difference in the pyrolysis behavior is observed from 550°C when the weight loss after this temperature level is characterized by carbonation. The steeper curves after 550°C for the outer profiles thus clearly indicate the attack of CO2 and the higher rate of weight loss due to accelerated carbonation [259]. The endothermal effects could be divided into four main steps: (I) 20 – 110°C (evaporation and C-S-H), (II) 110 – 460°C (C-S-H and cellulose), (III) 460 – 760°C (portlandite and poor-crystallized carbonates) and (IV) 760 – 900°C (well-crystallized carbonates). In detail, at the first step from ambient temperature to 110°C, decomposition of sections occurs slowly since the mass loss is about 2% for all profiles and mainly concerns free water content. The mass loss changes for the temperature range from 110 to 200 °C significantly relates to the consumption of C–S–H promoted by the accelerated carbonation with the absorption
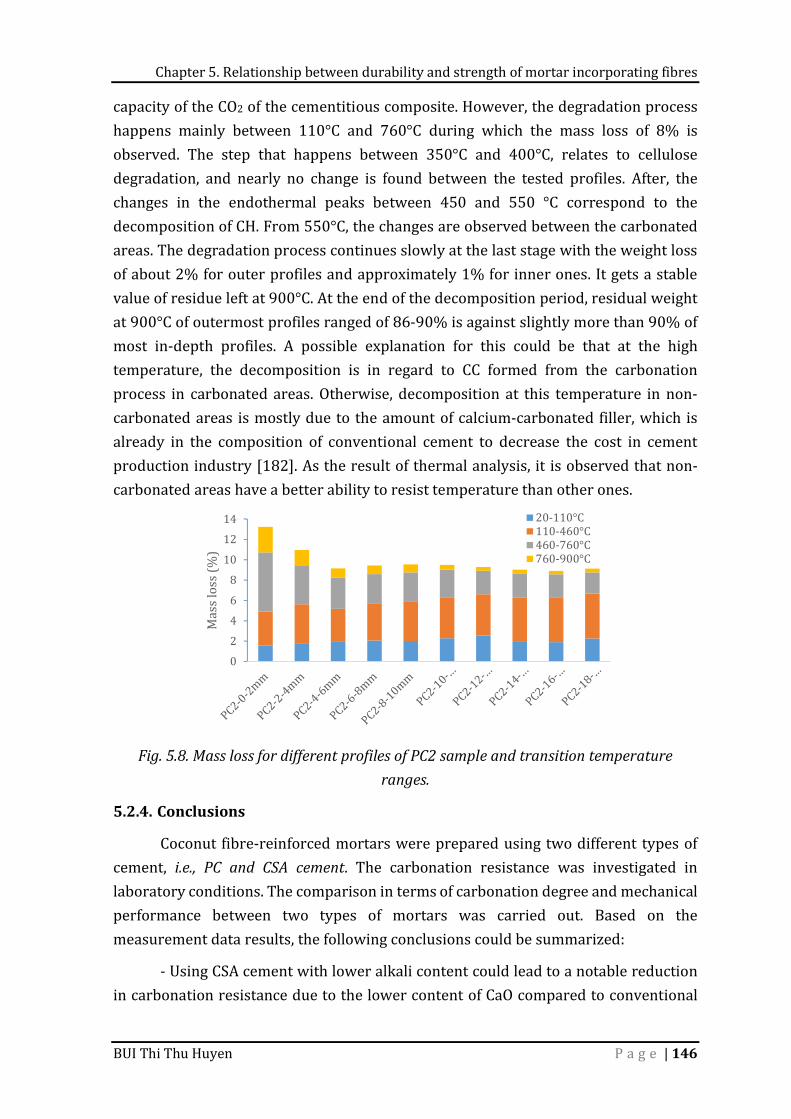
Chapter 5. Relationship between durability and strength of mortar incorporating fibres
BUI Thi Thu Huyen P a g e | 146
capacity of the CO2 of the cementitious composite. However, the degradation process happens mainly between 110°C and 760°C during which the mass loss of 8% is observed. The step that happens between 350°C and 400°C, relates to cellulose degradation, and nearly no change is found between the tested profiles. After, the changes in the endothermal peaks between 450 and 550 °C correspond to the decomposition of CH. From 550°C, the changes are observed between the carbonated areas. The degradation process continues slowly at the last stage with the weight loss of about 2% for outer profiles and approximately 1% for inner ones. It gets a stable value of residue left at 900°C. At the end of the decomposition period, residual weight at 900°C of outermost profiles ranged of 86-90% is against slightly more than 90% of most in-depth profiles. A possible explanation for this could be that at the high temperature, the decomposition is in regard to CC formed from the carbonation process in carbonated areas. Otherwise, decomposition at this temperature in non-carbonated areas is mostly due to the amount of calcium-carbonated filler, which is already in the composition of conventional cement to decrease the cost in cement production industry [182]. As the result of thermal analysis, it is observed that non-carbonated areas have a better ability to resist temperature than other ones.
Fig. 5.8. Mass loss for different profiles of PC2 sample and transition temperature
ranges.
5.2.4. Conclusions Coconut fibre-reinforced mortars were prepared using two different types of cement, i.e., PC and CSA cement. The carbonation resistance was investigated in laboratory conditions. The comparison in terms of carbonation degree and mechanical performance between two types of mortars was carried out. Based on the measurement data results, the following conclusions could be summarized: - Using CSA cement with lower alkali content could lead to a notable reduction in carbonation resistance due to the lower content of CaO compared to conventional
02468101214
Mass loss (%)
20-110°C110-460°C460-760°C760-900°C
Chapter 5. Relationship between durability and strength of mortar incorporating fibres
BUI Thi Thu Huyen P a g e | 147
cement. While the large inner surface area of PC-based mortar presents in red purple, all broken surface of CSA cement-based mortar shows in colourless when they are sprayed by phenolphthalein reagent after the carbonation exposure period of 12 weeks. - Incorporating natural fibres into mortar could lead to an increase in the carbonation degree due to the additional presence of air entrainment that strongly supports CO2 penetration into fibre-reinforced mortar. - A difference in carbonation degree was obtained between two measurement methods used: phenolphthalein reagent and TGA measurement. The depth of colourless zone determined by phenolphthalein is nearly three times smaller than the carbonation depth obtained by TGA technique. Several drawbacks of the conventional method by the reagent were reported, but this simple method still suits to evaluate the change in alkalinity of pore solution in samples after the carbonation exposure. Meanwhile, TGA technique could give accurate results even if in the case powdered samples are representative only of different small areas, not of the entire sample. - The carbonation has different effects on the mechanical performance of mortar. While carbonation-induced compressive strength of PC-based mortar increased to 32.7%, that of all mortars based on CSA cement decreased insignificantly. However, in bending, the flexural strength ratio of CSA cement-based mortar before and after carbonation storage is nearly two due to the cumulated effect of fibres added and loss of ettringite of CSA cement-base samples during the carbonation process. It should be noted that for composites containing different binders, mechanical behaviour could be not a key factor in evaluating carbonation resistance. - Three decomposition peaks were clearly observed corresponding three decompositions, namely of CSH, CH and CC in the PC2 sample, respectively. Meanwhile, inner profile (centre part of sample), are concerned by the two first decomposition peaks and outer (near surface) ones are responsible for the last decomposition peak of CC. This means that from the external surface to centre part of PC2 sample, the increase in CSH and CH contents and decrease CC content were obtained. - The thermal stability of the non-carbonated area is slightly higher than that of the carbonated area. For instance, at 900°C, the mass loss of the carbonated area is approximately 10 – 14%, while this value of the non-carbonated area is less than 10%. This could be due to the formation of CC, which is decomposed at the higher temperature during the carbonation process in the carbonated area. Other, the decomposition at this temperature mainly depends on the calcium-carbonated filler content in the production of conventional cement.

Chapter 5. Relationship between durability and strength of mortar incorporating fibres
BUI Thi Thu Huyen P a g e | 148
5.3. Effects of wetting and drying cycles on the performance of coconut fibres reinforced mortar composite Many investigations on the effects of weathering on the long-term performance of composite materials have been performed by previous studies as durability [190], degradation mechanisms [195,198,260], microstructure and composition change [200,261], mechanical performance [193,262–265]. However, most of them work on conventional concrete while knowledge and data results about those of natural fibred-reinforced composite are still limited. So that understanding on the effects of wetting and drying exposure on mechanical performance and microstructure change of natural fibres reinforced mortars are essential and contribute to (i) the control of the change in
microstructure and necessarily (ii) the improvement of the mechanical properties of mortar composite.
5.3.1. Sample under wetting and drying cycles A wetting and drying cycle is defined here as 24 hours for drying in a ventilated oven at 55 °C, 24 hours for immersion in water at ambient condition. Before each exposure (immersion or dry), sample is stored in the air within at least 1 hour to dry or cool down at original temperature to avoid undesirable micro-crack due to thermal shock. Simultaneously, the mass of sample is measured to control its change (loss/gain) during wetting and drying repeating. It is ensured stability, which means that the change in mass of the sample is less than 1% within 2 hours before doing the next steps. Samples are exposed to 1 and 5 cycles before testing to investigate the effects of different wetting and drying cycles on mechanical performance and composition of fibres reinforced mortar. The properties of exposed and unexposed samples are evaluated, and the resulting data are compared. After different cycles of wetting and drying, the water absorption properties of mortars are evaluated by the relative uptake of weight defined by Abt according to the following equation: 𝐴𝑏 = 𝑥 100% (5.3) Where Abt: Moisture absorption of mortar after exposure t cycles, %. Ww: Mass of mortar after wetting, g. Wd: Mass of mortar after drying, g. The value of moisture absorption is calculated based on an average of at least three specimens. 5.3.2. Results and discussion
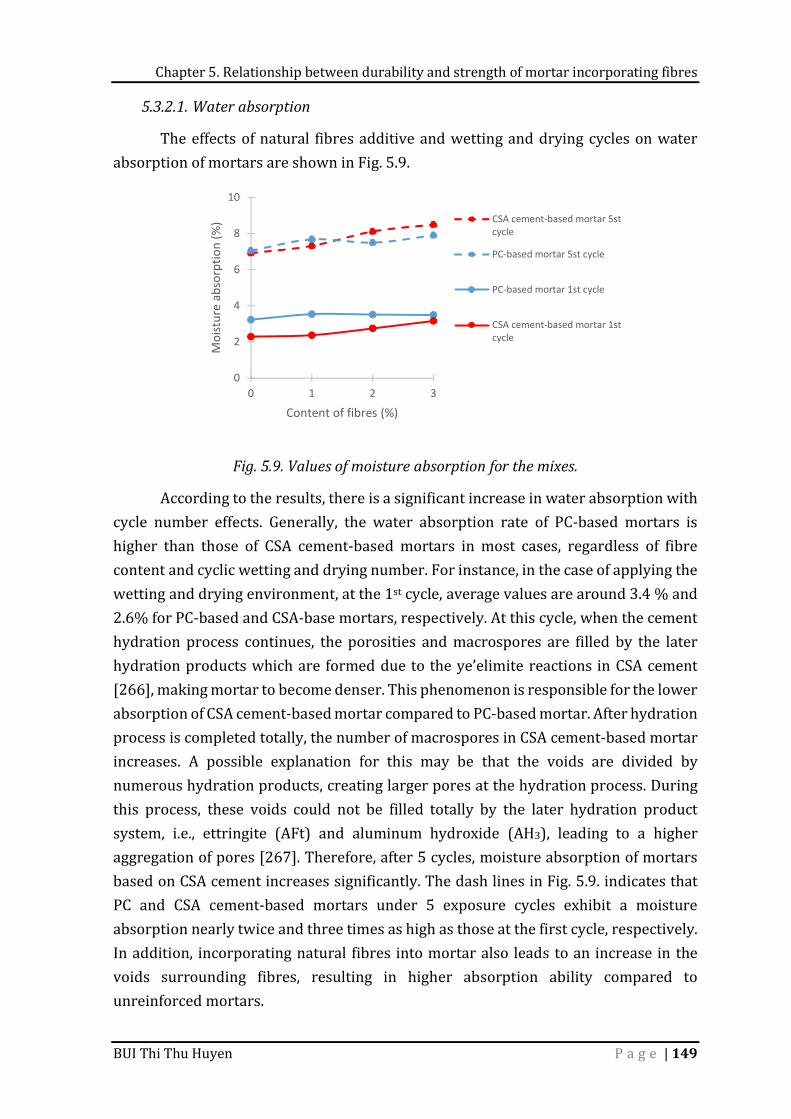
Chapter 5. Relationship between durability and strength of mortar incorporating fibres
BUI Thi Thu Huyen P a g e | 149
5.3.2.1. Water absorption The effects of natural fibres additive and wetting and drying cycles on water absorption of mortars are shown in Fig. 5.9.
Fig. 5.9. Values of moisture absorption for the mixes. According to the results, there is a significant increase in water absorption with cycle number effects. Generally, the water absorption rate of PC-based mortars is higher than those of CSA cement-based mortars in most cases, regardless of fibre content and cyclic wetting and drying number. For instance, in the case of applying the wetting and drying environment, at the 1st cycle, average values are around 3.4 % and 2.6% for PC-based and CSA-base mortars, respectively. At this cycle, when the cement hydration process continues, the porosities and macrospores are filled by the later hydration products which are formed due to the ye’elimite reactions in CSA cement [266], making mortar to become denser. This phenomenon is responsible for the lower absorption of CSA cement-based mortar compared to PC-based mortar. After hydration process is completed totally, the number of macrospores in CSA cement-based mortar increases. A possible explanation for this may be that the voids are divided by numerous hydration products, creating larger pores at the hydration process. During this process, these voids could not be filled totally by the later hydration product system, i.e., ettringite (AFt) and aluminum hydroxide (AH3), leading to a higher aggregation of pores [267]. Therefore, after 5 cycles, moisture absorption of mortars based on CSA cement increases significantly. The dash lines in Fig. 5.9. indicates that PC and CSA cement-based mortars under 5 exposure cycles exhibit a moisture absorption nearly twice and three times as high as those at the first cycle, respectively. In addition, incorporating natural fibres into mortar also leads to an increase in the voids surrounding fibres, resulting in higher absorption ability compared to unreinforced mortars.
0
2
4
6
8
10
0 1 2 3
Moi
stur
e ab
sorp
tion
(%)
Content of fibres (%)
CSA cement-based mortar 5stcycle
PC-based mortar 5st cycle
PC-based mortar 1st cycle
CSA cement-based mortar 1stcycle
Chapter 5. Relationship between durability and strength of mortar incorporating fibres
BUI Thi Thu Huyen P a g e | 150
5.3.2.2. Mechanical properties Samples without fibres, i.e., PC and CSA, and with 2% fibres, i.e., PC2 and CSA2, are chosen for mechanical investigation. This is because PC2 and CSA2 samples contain optimal fibres content, according to previous study [268]. For the sake of comparison, PC and CSA are also considered. In order to observe the damage progression and explain the influence of wetting-drying action, the mechanical tests are performed after 0, 1 and 5 cycles. Control samples, which are not exposed, are considered as reference samples. Data results of compressive and flexural strengths after cyclic wetting and drying are presented in Fig. 5.10 and Fig. 5.11, respectively. The wetting and drying repeating has adverse effects on the mechanical performance of mortar, regardless of fibres content, presented by reducing both strengths. In general, losses in mechanical properties progress more highly in CSA-based mortar than that in PC-based mortars. However, the measurement results pinpoint that the maximum compressive strength is observed after one cycle since complete hydration of cement is reached due to the supplement of water during wetting process. In the next cycles, because of the formation crystallised hydrate products [269], more micro-cracks are appeared gradually inside mortar structure and induces a decrease in compressive strength. Both strength and deformation of mortar samples decrease according to the increase of porosity and the number of cycles. The great loss of strength is observed when fibres are incorporated into mortar. More pore in fine aggregate mortar could be appeared due to adding coconut fibres, causing to the convenient environment for the penetration of ambient air and water deeply. The change in mechanical value with predicted tendency is governed by the porosity, the number of cycles and fibre content as well, i.e., the higher fibre content, the higher porosity, the higher number of repeating, the lower mechanical strength. The difference observed in bending, the strength of mortars decreases continuously even after the 1st cycle. In comparison with the compressive strength reduction, the decrease of flexural strength occurs more quickly with a dangerously high loss rate, shown by the steeper slope of strength reduction. Tang et al. [270] also confirmed that the flexural strength loss is more severe than that of compressive strength under wetting and drying exposure conditions. The main reason is that the natural degradation of fibres after wetting and drying exposure causes the break of the bonding between fibres and matrix, contributing mainly to the reduction the flexural strength of fibre reinforced-cementitious materials. Consequently, the bonding properties are deteriorated, which leads to the rapid decrease in the flexural performance of specimens. When the fibres are added, the effects of fibres degradation on mortar damage are stronger than that of bridging effect of the fibres distribution.
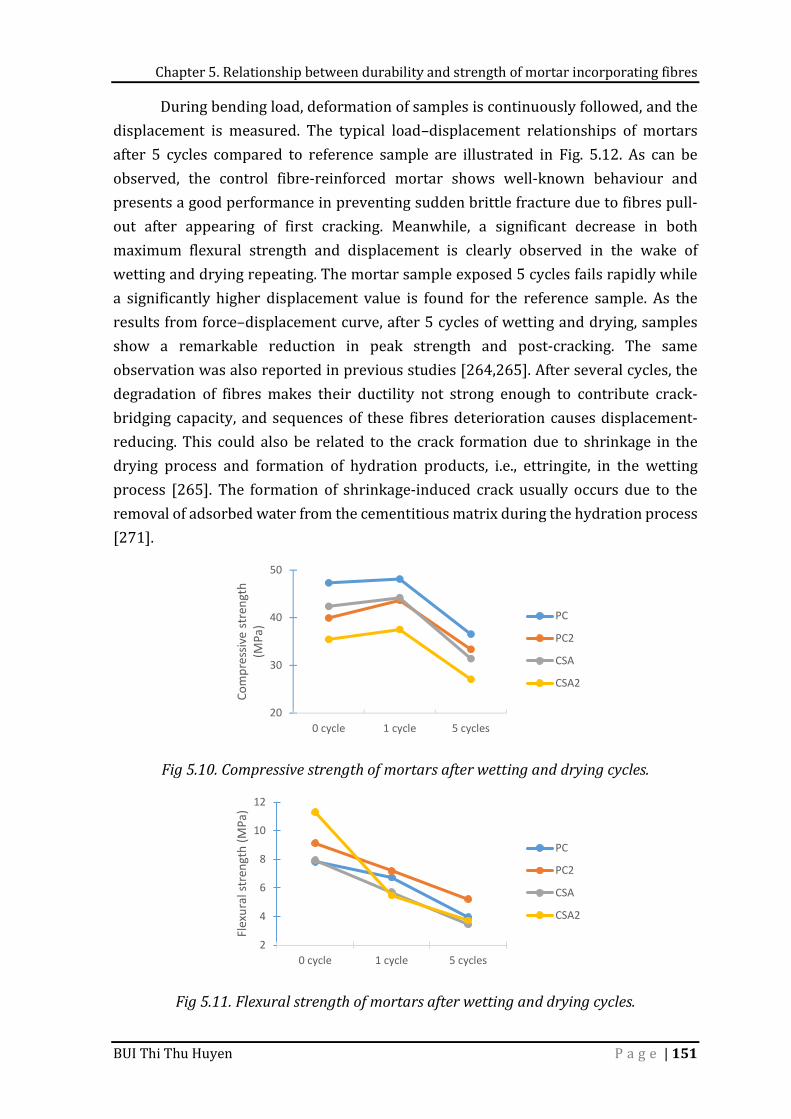
Chapter 5. Relationship between durability and strength of mortar incorporating fibres
BUI Thi Thu Huyen P a g e | 151
During bending load, deformation of samples is continuously followed, and the displacement is measured. The typical load–displacement relationships of mortars after 5 cycles compared to reference sample are illustrated in Fig. 5.12. As can be observed, the control fibre-reinforced mortar shows well-known behaviour and presents a good performance in preventing sudden brittle fracture due to fibres pull-out after appearing of first cracking. Meanwhile, a significant decrease in both maximum flexural strength and displacement is clearly observed in the wake of wetting and drying repeating. The mortar sample exposed 5 cycles fails rapidly while a significantly higher displacement value is found for the reference sample. As the results from force–displacement curve, after 5 cycles of wetting and drying, samples show a remarkable reduction in peak strength and post-cracking. The same observation was also reported in previous studies [264,265]. After several cycles, the degradation of fibres makes their ductility not strong enough to contribute crack-bridging capacity, and sequences of these fibres deterioration causes displacement-reducing. This could also be related to the crack formation due to shrinkage in the drying process and formation of hydration products, i.e., ettringite, in the wetting process [265]. The formation of shrinkage-induced crack usually occurs due to the removal of adsorbed water from the cementitious matrix during the hydration process [271].
Fig 5.10. Compressive strength of mortars after wetting and drying cycles.
Fig 5.11. Flexural strength of mortars after wetting and drying cycles.
20
30
40
50
0 cycle 1 cycle 5 cycles
Com
pres
sive
stre
ngth
(M
Pa)
PC
PC2
CSA
CSA2
2
4
6
8
10
12
0 cycle 1 cycle 5 cycles
Flex
ural
stre
ngth
(MPa
)
PC
PC2
CSA
CSA2
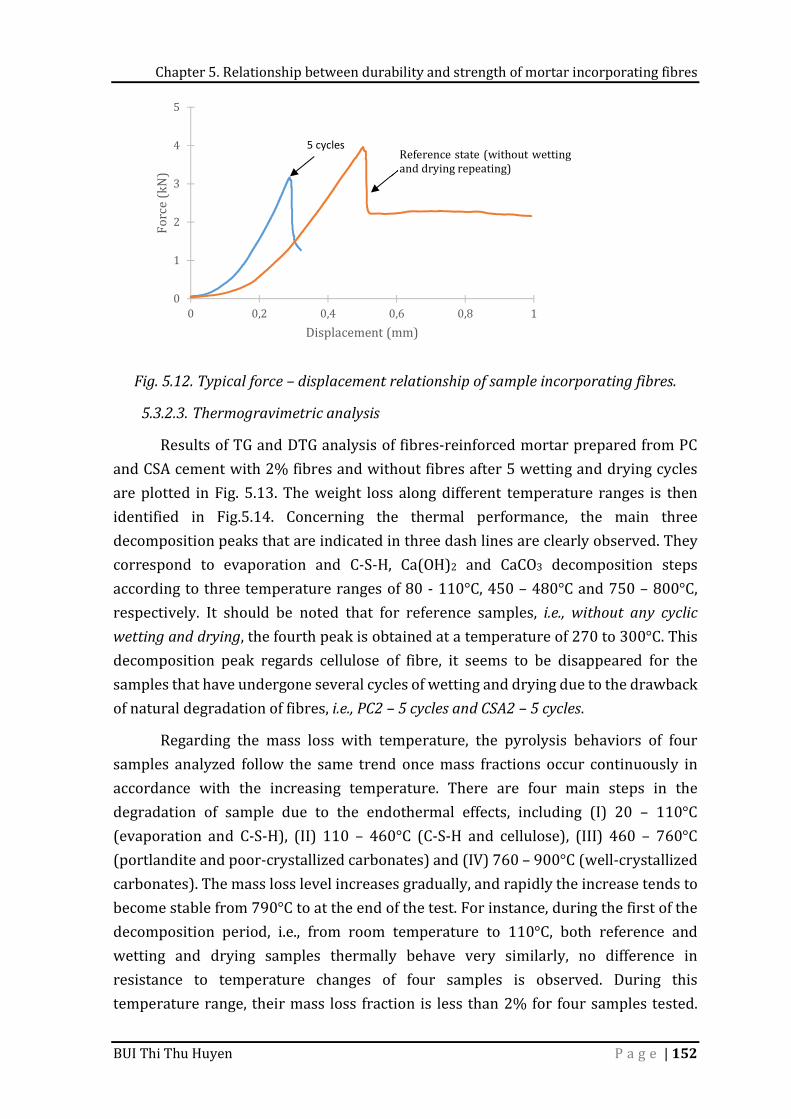
Chapter 5. Relationship between durability and strength of mortar incorporating fibres
BUI Thi Thu Huyen P a g e | 152
Fig. 5.12. Typical force – displacement relationship of sample incorporating fibres.
5.3.2.3. Thermogravimetric analysis Results of TG and DTG analysis of fibres-reinforced mortar prepared from PC and CSA cement with 2% fibres and without fibres after 5 wetting and drying cycles are plotted in Fig. 5.13. The weight loss along different temperature ranges is then identified in Fig.5.14. Concerning the thermal performance, the main three decomposition peaks that are indicated in three dash lines are clearly observed. They correspond to evaporation and C-S-H, Ca(OH)2 and CaCO3 decomposition steps according to three temperature ranges of 80 - 110°C, 450 – 480°C and 750 – 800°C, respectively. It should be noted that for reference samples, i.e., without any cyclic wetting and drying, the fourth peak is obtained at a temperature of 270 to 300°C. This decomposition peak regards cellulose of fibre, it seems to be disappeared for the samples that have undergone several cycles of wetting and drying due to the drawback of natural degradation of fibres, i.e., PC2 – 5 cycles and CSA2 – 5 cycles. Regarding the mass loss with temperature, the pyrolysis behaviors of four samples analyzed follow the same trend once mass fractions occur continuously in accordance with the increasing temperature. There are four main steps in the degradation of sample due to the endothermal effects, including (I) 20 – 110°C (evaporation and C-S-H), (II) 110 – 460°C (C-S-H and cellulose), (III) 460 – 760°C (portlandite and poor-crystallized carbonates) and (IV) 760 – 900°C (well-crystallized carbonates). The mass loss level increases gradually, and rapidly the increase tends to become stable from 790°C to at the end of the test. For instance, during the first of the decomposition period, i.e., from room temperature to 110°C, both reference and wetting and drying samples thermally behave very similarly, no difference in resistance to temperature changes of four samples is observed. During this temperature range, their mass loss fraction is less than 2% for four samples tested.
012345
0 0,2 0,4 0,6 0,8 1
Force (kN)
Displacement (mm)
5 cycles Reference state (without wetting and drying repeating)
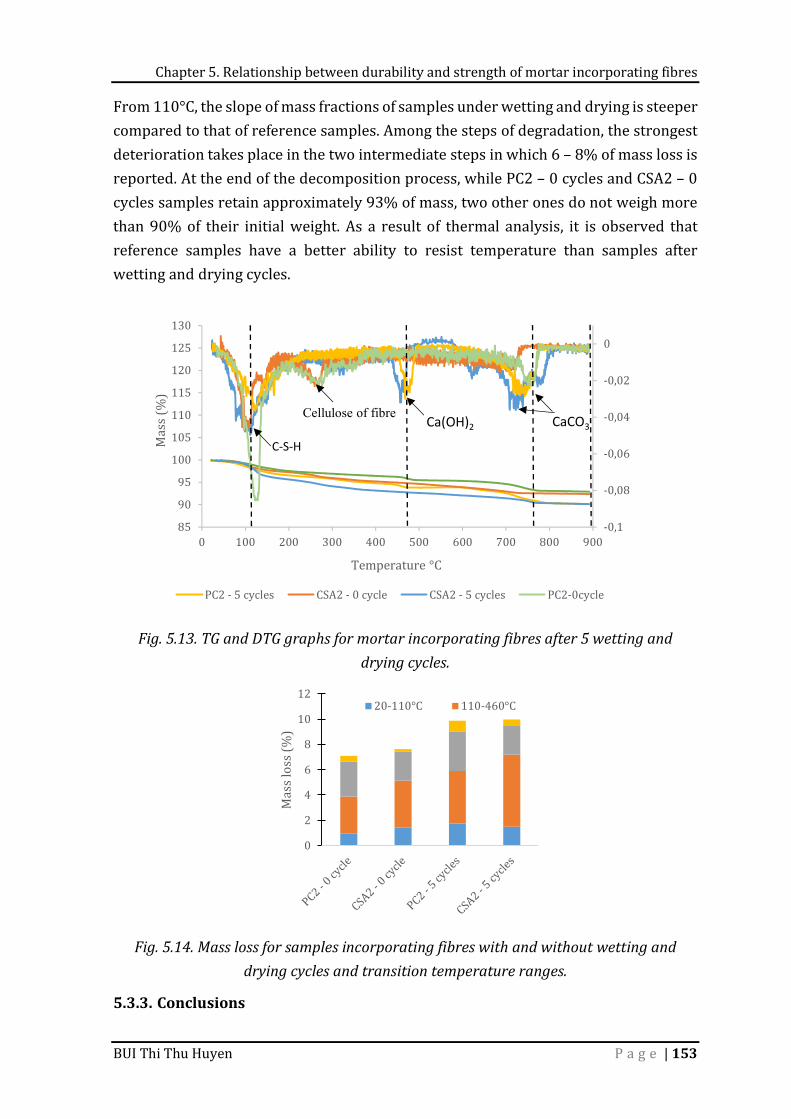
Chapter 5. Relationship between durability and strength of mortar incorporating fibres
BUI Thi Thu Huyen P a g e | 153
From 110°C, the slope of mass fractions of samples under wetting and drying is steeper compared to that of reference samples. Among the steps of degradation, the strongest deterioration takes place in the two intermediate steps in which 6 – 8% of mass loss is reported. At the end of the decomposition process, while PC2 – 0 cycles and CSA2 – 0 cycles samples retain approximately 93% of mass, two other ones do not weigh more than 90% of their initial weight. As a result of thermal analysis, it is observed that reference samples have a better ability to resist temperature than samples after wetting and drying cycles.
Fig. 5.13. TG and DTG graphs for mortar incorporating fibres after 5 wetting and drying cycles.
Fig. 5.14. Mass loss for samples incorporating fibres with and without wetting and drying cycles and transition temperature ranges.
5.3.3. Conclusions
-0,1-0,08-0,06-0,04-0,020
859095100105110115120125130
0 100 200 300 400 500 600 700 800 900
Mass (%)
Temperature °CPC2 - 5 cycles CSA2 - 0 cycle CSA2 - 5 cycles PC2-0cycle
C-S-H
Cellulose of fibre Ca(OH)2 CaCO3
024681012
Mass loss (%)
20-110°C 110-460°C
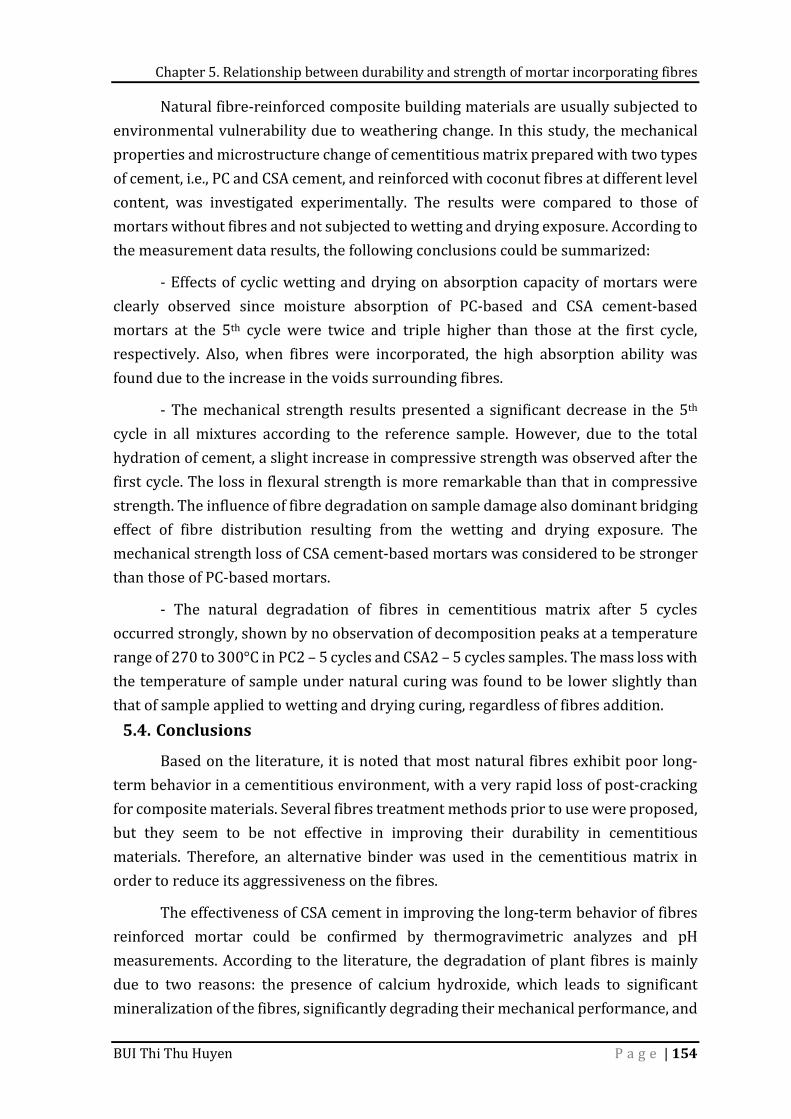
Chapter 5. Relationship between durability and strength of mortar incorporating fibres
BUI Thi Thu Huyen P a g e | 154
Natural fibre-reinforced composite building materials are usually subjected to environmental vulnerability due to weathering change. In this study, the mechanical properties and microstructure change of cementitious matrix prepared with two types of cement, i.e., PC and CSA cement, and reinforced with coconut fibres at different level content, was investigated experimentally. The results were compared to those of mortars without fibres and not subjected to wetting and drying exposure. According to the measurement data results, the following conclusions could be summarized: - Effects of cyclic wetting and drying on absorption capacity of mortars were clearly observed since moisture absorption of PC-based and CSA cement-based mortars at the 5th cycle were twice and triple higher than those at the first cycle, respectively. Also, when fibres were incorporated, the high absorption ability was found due to the increase in the voids surrounding fibres. - The mechanical strength results presented a significant decrease in the 5th cycle in all mixtures according to the reference sample. However, due to the total hydration of cement, a slight increase in compressive strength was observed after the first cycle. The loss in flexural strength is more remarkable than that in compressive strength. The influence of fibre degradation on sample damage also dominant bridging effect of fibre distribution resulting from the wetting and drying exposure. The mechanical strength loss of CSA cement-based mortars was considered to be stronger than those of PC-based mortars. - The natural degradation of fibres in cementitious matrix after 5 cycles occurred strongly, shown by no observation of decomposition peaks at a temperature range of 270 to 300°C in PC2 – 5 cycles and CSA2 – 5 cycles samples. The mass loss with the temperature of sample under natural curing was found to be lower slightly than that of sample applied to wetting and drying curing, regardless of fibres addition. 5.4. Conclusions Based on the literature, it is noted that most natural fibres exhibit poor long-term behavior in a cementitious environment, with a very rapid loss of post-cracking for composite materials. Several fibres treatment methods prior to use were proposed, but they seem to be not effective in improving their durability in cementitious materials. Therefore, an alternative binder was used in the cementitious matrix in order to reduce its aggressiveness on the fibres. The effectiveness of CSA cement in improving the long-term behavior of fibres reinforced mortar could be confirmed by thermogravimetric analyzes and pH measurements. According to the literature, the degradation of plant fibres is mainly due to two reasons: the presence of calcium hydroxide, which leads to significant mineralization of the fibres, significantly degrading their mechanical performance, and
Chapter 5. Relationship between durability and strength of mortar incorporating fibres
BUI Thi Thu Huyen P a g e | 155
alkaline environment cementitious matrix, which causes alkaline hydrolysis of plant fibre constituents. CSA cement makes a remarkable reduction in pH value of the mortars. In addition, hydration of this cement does not result in the formation of calcium hydroxide. CSA cement seems, therefore, to be a suitable cement for natural fibres reinforced composite. In this chapter, the durability of coconut fibres reinforced mortar was investigated in laboratory conditions. Two aggressive environments were used to determine the relationships between strength and durability of mortar with and without fibres, i.e., carbonation curing and wetting and drying repeating. This approach could constitute an alternative solution to waste management and contribute to the development of reinforced mortars improving comfort performance in buildings. Regarding carbonation curing condition, two methods are used to measure carbonation depth of coconut fibre-reinforced mortars, including traditional phenolphthalein reagent and thermogravimetric analysis (TGA). Accelerated carbonation is conducted at 4% concentration of CO2, temperature of 20°C and relative humidity of 65% within 12 weeks. A complete carbonation is detected in the CSA cement-based mortar while PC-based mortar is partially carbonated according to both methods used. The difference in carbonation depth, however, is observed as soon as the reagent and TGA measurement are applied. The significant effects of carbonation process on the microstructure and mechanical properties of cementitious matrix are highlighted by analyzing the change in the amount of calcium carbonate (CC) and portlandite on the different mortar profiles and comparison with natural cured samples. Carbonation resistance capacity will decrease with the addition of 2% coconut fibres. In terms of wetting and drying curing, water absorption of mortars is mainly affected by number of cycles while the effect of natural fibres incorporating is not clear. Compressive strength of mortar increases after the first cycle because the supplement of water in wetting process leads to complete hydration. However, the decrease in both compressive and flexural strengths and post cracking are observed after 5th cycle. The results of TGA measurement also indicated that weight loss due to the high temperature of samples under conventional curing lower than that of sample cured in wetting and drying repeating, regardless of incorporating fibres.
Conclusions and recommendation
BUI Thi Thu Huyen P a g e | 156
CONCLUSIONS AND RECOMMENDATIONS
In order to reduce the dependency on conventional materials and negative environmental impacts, one of the main responsibilities of the construction field is to find new eco-friendly resources to replace the traditional materials partially. The usage of green materials in construction activities has become very interesting in recent years due to its advantages in different sectors. Natural fibres were known as potential candidates for reinforcing structures in civil engineering by virtue of their advantages. Many studies have shown the possible usage of natural fibre, such as the partial replacement of cement and aggregate, as well as fibre reinforcement. Significant environmental benefits can be gained through the usage of recycled plant fibres for reinforcement in composite materials. Coconut fibre was known as one of the main fifteen plant and animal fibres in the world. It is extracted from the tissues surrounding the coconut palm envelope, which is grown on 10 million ha of land throughout the tropics. Although natural fibres could play an important role in reinforcing the building materials or improving/modifying their certain properties, the investigations on their performance and durability are still limited. Therefore, this study aims at evaluating the different properties of local coconut fibres (Vietnam) and composite materials incorporating fibres. Many laboratory tests investigate geometrical, physical, mechanical properties and durability of fibres reinforced mortar compared to the literature results obtained from similar composite. With adequate control of their preparation, they could be reused in the manufacture of mortars in the construction.
Conclusions and recommendation
BUI Thi Thu Huyen P a g e | 157
The findings of this study demonstrated that the usage of coconut fibres in composite materials could significantly contribute to the sustainable development of the construction industry. Taking into consideration the structure application of composite materials containing fibres, the study recommended the composite outdoor structure for employing these materials. In order to supplement knowledge concerning agricultural by-products incorporated into composite materials, several experimental works have been carried out as part of this thesis: - Investigations on physical and mechanical properties of raw and treated coconut fibres for their recycling in construction materials. - Study on the orientation distribution of fibres in mortar and the cracking behavior of mortar incorporating fibres. - Determination relationship between durability and strength of fibres reinforced mortar. Coconut fibres are extracted from coconut husk through a multi-step manufacturing process. Coconut fibres from Vietnam are used in present study as raw fibres. The specifications of fibre were identified as following main characteristics: - A big mean diameter (249.8 ± 30.95 µm) and variable morphology along with the fibre. - An absolute density is 1.41 g/cm3, and is much smaller than the man-made fibres. - Coconut fibre is hydrophilic material, likes other natural fibres, with high water absorption. This value reaches 133% after 48 hours of immersion. - Compared to other plant fibres, coconut fibre has lower stress (only 123.6 MPa), but higher tensile strain at the failure (approximately 27%). This research examined the properties of coconut fibres reinforced mortar, its performance in an alternative cement, and the following important conclusions can be drawn from this research: - The combination method of coconut fibres and CSA cement in mortar significantly increased the flexural strength of mortar, up to approximately 17%. - The addition fibres into mortar has remarkable effects on the cracking behavior of mortar. Fibres act as a crack-arrester since the presence of fibres could contribute to preventing brittle fracture suddenly after the first crack appears. Also, bridging effect of the fibre distribution induces a decrease in the crack width and length compared to the control sample at the same level of loading.
Conclusions and recommendation
BUI Thi Thu Huyen P a g e | 158
- Post cracking (toughness) is mainly governed by the length and the number of reinforced fibres since the toughness index reaches a maximum value at fibre content of 3%. - The enhancement of toughness and preventing the development of cracks inside reinforced mortars are the most important contributions of fibres. - The heterogeneous and anisotropic distribution of fibres in the matrix were observed as fibres have the tendency to move the upper layer of mortar. The distribution and orientation of fibres were very various that have the different effects on the flexural behavior and fracture patterns of mortar. The limited movement of fibres due to the effect of the sides and bottom of the mould was observed, which induced the different fibre areas in different parts of cut cross-section of sample. - The addition of fibres could improve the carbonation resistance of mortar while the usage of CSA cement with lower alkali content could lead to a significant decrease in carbonation resistance due to the lower content of CaO compared to conventional cement. - The different effects of carbonation on the performances of mortar were obtained. Carbonation-induced strengths of mortar are various due to the cumulated effect of fibres added. Therefore, mechanical behavior could be not a key factor in evaluating carbonation resistance of composite materials containing different binders. Carbonation curing also makes a slight reduction in the thermal stability of mortar. - A significant decrease in mechanical strength was observed after 5 cycles of wetting and drying due to the degradation of fibres. The losses in flexural strength are stronger than those in compressive strength because the fibres degradation influence on sample damage is also dominant compared to the bridging effect of fibres distribution through the wetting and drying curing. In summary, this research has developed methodologies of producing mortar with the improvement of mechanical properties and durability in the case of addition fibres. The great potential of using these methodologies in various composite materials applications have been shown as further studies. This will not only help to reduce consumption of conventional aggregate sources, but also provide an attractive avenue for recycling various types of waste in agricultural by-products. The findings contributed toward the sustainable development of the construction industry and environment. Based on the findings of this study, the following recommendations for further research can be made:
Conclusions and recommendation
BUI Thi Thu Huyen P a g e | 159
- The usage of natural fibre types in composite materials and a simple technique to select coconut fibres from coconut fruit should be considered. A careful selection of fibres is a crucial task and required before using them in reinforced composites. Different parameters need to be identified, such as the origin and local and seasonal quality variations of the fibres in order to control the retting process, defects, and homogenous batches of fibre. - A factor affecting the mechanical performance of the composite is the microstructure of the interfacial transition zone (ITZ), which mainly decides the contribution of fibres in behavior improvement. The quantitative evaluation of the microstructure of ITZ should be conducted based on analysis of the results of SEM-EDS (scanning electron microscope - energy dispersive X-ray spectroscopy). The results obtained from SEM-EDS elemental analysis will allow the analysis microstructure of the ITZ between cement paste and fibres. The analyses of elemental compositions of major cement hydrated products (C-S-H (Calcium silicate hydrate), CH (Portlandite), AFm (monosulfate), AFt (ettringite) phases) will be used to determine the properties of ITZ of mortar. The fibres treatment method can lead to reducing porosity, CH content in the interfacial transition zone (ITZ). When fibres are treated with the treatment solutions, sodium silicate and silica fume reacted with CH to form C-S-H in composite. So, it is important to know how much reaction there is between treatment solution and CH to make C-S-H in the new concrete product, and how much CH consumed should be quantitatively determined by Fourier Transform Infrared Spectroscopy (FTIR analysis) or nuclear magnetic resonance (NMR) spectroscopy. - The long-term performance of composite materials containing agricultural by-products should be considered for future studies to assess the potential application for structures. - Minimizing the environmental impact of construction materials is increasingly the goal of a series of studies. The environmental impacts of typical composite in the construction industry are assessed based on the life cycle assessment (LCA) methodology according to ISO 14040 - Environmental management - Life cycle assessment - Principles and framework. Therefore, this section of the research proposal will focus on using an LCA method to evaluate the environmental impacts of natural fibres reinforced composites in terms of their global warming potential (GWP) for construction. Furthermore, this research will employ agricultural by-products for increasing the mechanical and durability performance of natural fibres reinforced composites. The LCA process requires maximizing composite durability, use agricultural by-products and supplementary cementing materials that replace a part or total of conventional cement. It is necessary to investigate the GWP, and
Conclusions and recommendation
BUI Thi Thu Huyen P a g e | 160
environmental impact of natural fibres reinforced composites while considering the fibres treatment method to improve mechanical and durability characteristics. Moreover, life cycle costs (LCC) analysis of the use of composite materials containing agricultural by-products should be observed in future studies. - In order to natural fibres reinforced composite to become widely used construction materials, consistent and predictable results need to be obtained. To achieve these outcomes, further studies are required on these composite performances by testing and modeling. Further studies on this topic are necessary to contribute to the application of this material for the building materials widely. Further research outcomes might contribute to environmental benefits and sustainable development of the construction industries in the future.
References
BUI Thi Thu Huyen P a g e | 161
REFERENCES
[1] C. Meyer, The greening of the concrete industry, Cem. Concr. Compos. 31 (2009) 601–605. https://doi.org/10.1016/j.cemconcomp.2008.12.010. [2] S.B. Huda, M.S. Alam, Mechanical behavior of three generations of 100 % repeated recycled coarse aggregate concrete, Constr. Build. Mater. 65 (2014) 574–582. https://doi.org/10.1016/j.conbuildmat.2014.05.010. [3] V.W.Y. Tam, M. Soomro, A. Catarina, J. Evangelista, A review of recycled aggregate in concrete applications ( 2000 – 2017 ), Constr. Build. Mater. 172 (2018) 272–292. https://doi.org/10.1016/j.conbuildmat.2018.03.240. [4] A. Kylili, P.A. Fokaides, Policy trends for the sustainability assessment of construction materials: A review, Sustain. Cities Soc. 35 (2017) 280–288. https://doi.org/10.1016/j.scs.2017.08.013. [5] http://www.naturalfibres2009.org/, (n.d.). [6] K.M. Liew, A.O. Sojobi, L.W. Zhang, Green concrete: Prospects and challenges, Constr. Build. Mater. (2017). https://doi.org/10.1016/j.conbuildmat.2017.09.008. [7] P. Lertwattanaruk, A. Suntijitto, Properties of natural fiber cement materials containing coconut coir and oil palm fibers for residential building applications, Constr. Build. Mater. 94 (2015) 664–669. https://doi.org/10.1016/j.conbuildmat.2015.07.154. [8] D. Verma, P.C. Gope, A. Shandilya, A. Gupta, M.K. Maheshwari, Coir fibre reinforcement and application in polymer composites: A review, J. Mater. Environ. Sci. 4 (2013) 263–276. [9] A. Abdullah, S.B. Jamaludin, M.I. Anwar, M.M. Noor, K. Hussin, Assessment of
References
BUI Thi Thu Huyen P a g e | 162
physical and mechanical properties of cement panel influenced by treated and untreated coconut fiber addition, in: Phys. Procedia, 2011. https://doi.org/10.1016/j.phpro.2011.11.042. [10] R.C. Kanning, K.F. Portella, M.O.G.P. Bragança, M.M. Bonato, J.C.M. Dos Santos, Banana leaves ashes as pozzolan for concrete and mortar of Portland cement, Constr. Build. Mater. 54 (2014) 460–465. https://doi.org/10.1016/j.conbuildmat.2013.12.030. [11] N.K. Bui, T. Satomi, H. Takahashi, Recycling woven plastic sack waste and PET bottle waste as fiber in recycled aggregate concrete: An experimental study, Waste Manag. 78 (2018) 79–93. https://doi.org/10.1016/j.wasman.2018.05.035. [12] H. Binici, M. Eken, M. Kara, M. Dolaz, An environment-friendly thermal insulation material from sunflower stalk, textile waste and stubble fibers, Proc. 2013 Int. Conf. Renew. Energy Res. Appl. ICRERA 2013. 51 (2013) 833–846. https://doi.org/10.1109/ICRERA.2013.6749868. [13] S. Liuzzi, C. Rubino, P. Stefanizzi, A. Petrella, A. Boghetich, C. Casavola, G. Pappalettera, Hygrothermal properties of clayey plasters with olive fibers, Constr. Build. Mater. 158 (2018) 24–32. https://doi.org/10.1016/j.conbuildmat.2017.10.013. [14] A. Simons, A. Laborel-Préneron, A. Bertron, J.E. Aubert, C. Magniont, C. Roux, C. Roques, Development of bio-based earth products for healthy and sustainable buildings: characterization of microbiological, mechanical and hygrothermal properties, Matériaux Tech. 103 (2015) 206. https://doi.org/10.1051/mattech/2015011. [15] M. Chikhi, B. Agoudjil, A. Boudenne, A. Gherabli, Experimental investigation of new biocomposite with low cost for thermal insulation, Energy Build. 66 (2013) 267–273. https://doi.org/10.1016/j.enbuild.2013.07.019. [16] R. Alavez-Ramirez, F. Chiñas-Castillo, V.J. Morales-Dominguez, M. Ortiz-Guzman, Thermal conductivity of coconut fibre filled ferrocement sandwich panels, Constr. Build. Mater. 37 (2012) 425–431. https://doi.org/10.1016/j.conbuildmat.2012.07.053. [17] E. Abraham, B. Deepa, L.A. Pothen, J. Cintil, S. Thomas, M.J. John, R. Anandjiwala, S.S. Narine, Environmental friendly method for the extraction of coir fibre and isolation of nanofibre, Carbohydr. Polym. 92 (2013) 1477–1483. https://doi.org/10.1016/j.carbpol.2012.10.056. [18] K.S. Nw, 2009 International Year of Natural Fibers 1, (2009) 1–9. [19] H.M. Akil, M.F. Omar, A.A.M. Mazuki, S. Safiee, Z.A.M. Ishak, A.A. Bakar, Kenaf fiber reinforced composites : A review, Mater. Des. 32 (2011) 4107–4121. https://doi.org/10.1016/j.matdes.2011.04.008. [20] R.D. Tolêdo Filho, K. Scrivener, G.L. England, K. Ghavami, Durability of alkali-sensitive sisal and coconut fibres in cement mortar composites, Cem. Concr. Compos. 22 (2000) 127–143. https://doi.org/10.1016/S0958-9465(99)00039-6. [21] J. Wei, C. Meyer, Degradation mechanisms of natural fiber in the matrix of cement
References
BUI Thi Thu Huyen P a g e | 163
composites, Cem. Concr. Res. 73 (2015) 1–16. https://doi.org/10.1016/j.cemconres.2015.02.019. [22] M.M. Kabir, H. Wang, K.T. Lau, F. Cardona, Chemical treatments on plant-based natural fibre reinforced polymer composites: An overview, Compos. Part B Eng. 43 (2012) 2883–2892. https://doi.org/10.1016/j.compositesb.2012.04.053. [23] S.P. Kundu, S. Chakraborty, A. Roy, B. Adhikari, S.B. Majumder, Chemically modified jute fibre reinforced non-pressure (NP) concrete pipes with improved mechanical properties, Constr. Build. Mater. 37 (2012) 841–850. https://doi.org/10.1016/j.conbuildmat.2012.07.082. [24] A. Razmi, M.M. Mirsayar, On the mixed mode I/II fracture properties of jute fiber-reinforced concrete, Constr. Build. Mater. 148 (2017) 512–520. https://doi.org/10.1016/j.conbuildmat.2017.05.034. [25] Y. Li, Y.W. Mai, L. Ye, Sisal fibre and its composites: a review of recent developments, Compos. Sci. Technol. 60 (2000) 2037–2055. https://doi.org/10.1016/S0266-3538(00)00101-9. [26] A. Rahuman, S. Yeshika, Study on Properties of Sisal Fiber Reinforced Concrete With Different Mix Proportions and Different Percentage of Fiber Addition, Int. J. Res. Eng. Technol. (2015) 2319–2322. [27] F. de A. Silva, B. Mobasher, R.D.T. Filho, Cracking mechanisms in durable sisal fiber reinforced cement composites, Cem. Concr. Compos. 31 (2009) 721–730. https://doi.org/10.1016/j.cemconcomp.2009.07.004. [28] J. Page, F. Khadraoui, M. Boutouil, M. Gomina, Multi-physical properties of a structural concrete incorporating short flax fibers, Constr. Build. Mater. 140 (2017) 344–353. https://doi.org/10.1016/j.conbuildmat.2017.02.124. [29] B. Çomak, A. Bideci, Ö. Salli Bideci, Effects of hemp fibers on characteristics of cement based mortar, Constr. Build. Mater. 169 (2018) 794–799. https://doi.org/10.1016/j.conbuildmat.2018.03.029. [30] M. Fourmentin, P. Faure, P. Pelupessy, V. Sarou-Kanian, U. Peter, D. Lesueur, S. Rodts, D. Daviller, P. Coussot, NMR and MRI observation of water absorption/uptake in hemp shives used for hemp concrete, Constr. Build. Mater. 124 (2016) 405–413. https://doi.org/10.1016/j.conbuildmat.2016.07.100. [31] C. Niyigena, S. Amziane, A. Chateauneuf, L. Arnaud, L. Bessette, F. Collet, C. Lanos, G. Escadeillas, M. Lawrence, C. Magniont, S. Marceau, S. Pavia, U. Peter, V. Picandet, M. Sonebi, P. Walker, Variability of the mechanical properties of hemp concrete, Mater. Today Commun. 7 (2016) 122–133. https://doi.org/10.1016/j.mtcomm.2016.03.003. [32] T. Väisänen, P. Batello, R. Lappalainen, L. Tomppo, Modification of hemp fibers (Cannabis Sativa L.) for composite applications, Ind. Crops Prod. 111 (2018) 422–429. https://doi.org/10.1016/j.indcrop.2017.10.049. [33] T. Tioua, A. Kriker, G. Barluenga, I. Palomar, Influence of date palm fiber and shrinkage reducing admixture on self-compacting concrete performance at early age in hot-dry environment, Constr. Build. Mater. 154 (2017) 721–733. https://doi.org/10.1016/j.conbuildmat.2017.07.229. [34] N.G. Ozerkan, B. Ahsan, S. Mansour, S.R. Iyengar, Mechanical performance and
References
BUI Thi Thu Huyen P a g e | 164
durability of treated palm fiber reinforced mortars, Int. J. Sustain. Built Environ. 2 (2013) 131–142. https://doi.org/10.1016/j.ijsbe.2014.04.002. [35] S.S. Munawar, K. Umemura, S. Kawai, Characterization of the morphological, physical, and mechanical properties of seven nonwood plant fiber bundles, J. Wood Sci. 53 (2007) 108–113. https://doi.org/10.1007/s10086-006-0836-x. [36] A. Zia, M. Ali, Behavior of fiber reinforced concrete for controlling the rate of cracking in canal-lining, Constr. Build. Mater. 155 (2017) 726–739. https://doi.org/10.1016/j.conbuildmat.2017.08.078. [37] G.So. J.Kim, C.Pack, Y. Choi, H. Lee, An investigation of mechanical properties of jute fiber reinforced concrete, High Perform. Fiber Reinf. Cem. Compos. 6. (2016) 75–82. https://doi.org/https://doi.org/10.1007/978-94-007-2436-5_10. [38] J. Khedari, S. Charoenvai, J. Hirunlabh, New insulating particleboards from durian peel and coconut coir, 38 (2003) 435–441. [39] F. Asdrubali, F. D’Alessandro, S. Schiavoni, A review of unconventional sustainable building insulation materials, Sustain. Mater. Technol. 4 (2015) 1–17. https://doi.org/10.1016/j.susmat.2015.05.002. [40] S. Sair, A. Oushabi, A. Kammouni, O. Tanane, Y. Abboud, A. El Bouari, Mechanical and thermal conductivity properties of hemp fiber reinforced polyurethane composites, Case Stud. Constr. Mater. 8 (2018) 203–212. https://doi.org/10.1016/j.cscm.2018.02.001. [41] H. Gu, Tensile behaviours of the coir fibre and related composites after NaOH treatment, Mater. Des. 30 (2009) 3931–3934. https://doi.org/10.1016/j.matdes.2009.01.035. [42] S. Sengupta, G. Basu, Properties of Coconut Fiber, Ref. Modul. Mater. Sci. Mater. Eng. (2016). https://doi.org/https://doi.org/10.1016/B978-0-12-803581-8.04122-9. [43] L.Q.N. Tran, T.N. Minh, C.A. Fuentes, T.T. Chi, A.W. Van Vuure, I. Verpoest, Investigation of microstructure and tensile properties of porous natural coir fibre for use in composite materials, Ind. Crops Prod. 65 (2015) 437–445. https://doi.org/10.1016/j.indcrop.2014.10.064. [44] S. Sengupta, G. Basu, R. Chakraborty, C.J. Thampi, Stochastic analysis of major physical properties of coconut fibre, Indian J. Fibre Text. Res. (2014). [45] W. Wang, N. Chouw, The behaviour of coconut fibre reinforced concrete (CFRC) under impact loading, Constr. Build. Mater. (2017). https://doi.org/10.1016/j.conbuildmat.2016.12.092. [46] M. Ramli, W.H. Kwan, N.F. Abas, Strength and durability of coconut-fiber-reinforced concrete in aggressive environments, Constr. Build. Mater. 38 (2013) 554–566. https://doi.org/10.1016/j.conbuildmat.2012.09.002. [47] C.L. Hwang, V.A. Tran, J.W. Hong, Y.C. Hsieh, Effects of short coconut fiber on the mechanical properties, plastic cracking behavior, and impact resistance of cementitious composites, Constr. Build. Mater. (2016). https://doi.org/10.1016/j.conbuildmat.2016.09.118. [48] L. Yan, S. Su, N. Chouw, Microstructure, flexural properties and durability of coir
References
BUI Thi Thu Huyen P a g e | 165
fibre reinforced concrete beams externally strengthened with flax FRP composites, Compos. Part B Eng. 80 (2015) 343–354. https://doi.org/10.1016/j.compositesb.2015.06.011. [49] L. Yan, N. Chouw, L. Huang, B. Kasal, Effect of alkali treatment on microstructure and mechanical properties of coir fibres, coir fibre reinforced-polymer composites and reinforced-cementitious composites, Constr. Build. Mater. (2016). https://doi.org/10.1016/j.conbuildmat.2016.02.182. [50] X.T. Nguyen, S. Hou, T. Liu, X. Han, A potential natural energy absorption material – Coconut mesocarp: Part A: Experimental investigations on mechanical properties, Int. J. Mech. Sci. (2016). https://doi.org/10.1016/j.ijmecsci.2016.07.017. [51] M. Ali, N. Chouw, Experimental investigations on coconut-fibre rope tensile strength and pullout from coconut fibre reinforced concrete, Constr. Build. Mater. (2013). https://doi.org/10.1016/j.conbuildmat.2012.12.052. [52] S. Sengupta, G. Basu, Chapter 04122 - Properties of Coconut Fiber, Ref. Modul. Mater. Sci. Mater. Eng. (2017) 1–20. https://doi.org/10.1016/B978-0-12-803581-8.04122-9. [53] M. Sen, Finite Element Simulation of Retrofitting of RCC Beam Using Coir Fibre Composite (Natural Fibre), Int. J. Innov. Manag. Technol. 2 (2011) 175–179. http://www.ijimt.org/papers/127-M529.pdf. [54] F. Pacheco-Torgal, S. Jalali, Cementitious building materials reinforced with vegetable fibres: A review, Constr. Build. Mater. 25 (2011) 575–581. https://doi.org/10.1016/j.conbuildmat.2010.07.024. [55] S.M. Hejazi, M. Sheikhzadeh, S.M. Abtahi, A. Zadhoush, A simple review of soil reinforcement by using natural and synthetic fibers, Constr. Build. Mater. 30 (2012) 100–116. https://doi.org/10.1016/j.conbuildmat.2011.11.045. [56] Ö. Andiç-Çakir, M. Sarikanat, H.B. Tüfekçi, C. Demirci, Ü.H. Erdoǧan, Physical and mechanical properties of randomly oriented coir fiber-cementitious composites, Compos. Part B Eng. 61 (2014) 49–54. https://doi.org/10.1016/j.compositesb.2014.01.029. [57] N. Ezekiel, B. Ndazi, C. Nyahumwa, S. Karlsson, Effect of temperature and durations of heating on coir fibers, Ind. Crops Prod. 33 (2011) 638–643. https://doi.org/10.1016/j.indcrop.2010.12.030. [58] A. Abdullah, S.B. Jamaludin, M.I. Anwar, M.M. Noor, K. Hussin, Assessment of physical and mechanical properties of cement panel influenced by treated and untreated coconut fiber addition, Phys. Procedia. 22 (2011) 263–269. https://doi.org/10.1016/j.phpro.2011.11.042. [59] M. Ali, Coconut fibre: A versatile material and its applications in engineering, Second Int. Conf. Sustain. Constr. Mater. Technol. (2010) 189–197. https://doi.org/10.1.1.823.5053. [60] G.L. Sivakumar Babu, A.K. Vasudevan, Strength and Stiffness Response of Coir Fiber-Reinforced Tropical Soil, J. Mater. Civ. Eng. 20 (2008) 571–577. https://doi.org/10.1061/(ASCE)0899-1561(2008)20:9(571). [61] P.C.G. D. Verma, Biofi ber Reinforcement in Composite Materials Related titles :,
References
BUI Thi Thu Huyen P a g e | 166
2015. [62] A. Laborel-Préneron, J.E. Aubert, C. Magniont, C. Tribout, A. Bertron, Plant aggregates and fibers in earth construction materials: A review, Constr. Build. Mater. 111 (2016) 719–734. https://doi.org/10.1016/j.conbuildmat.2016.02.119. [63] L.Q.N. Tran, C.A. Fuentes, C. Dupont-Gillain, A.W. Van Vuure, I. Verpoest, Understanding the interfacial compatibility and adhesion of natural coir fibre thermoplastic composites, Compos. Sci. Technol. 80 (2013) 23–30. https://doi.org/10.1016/j.compscitech.2013.03.004. [64] M.N. Islam, M.R. Rahman, M.M. Haque, M.M. Huque, Physico-mechanical properties of chemically treated coir reinforced polypropylene composites, Compos. Part A Appl. Sci. Manuf. (2010). https://doi.org/10.1016/j.compositesa.2009.10.006. [65] H.. SIngh, Effects of Coir Fiber on CBR Value of Itnagar Soil, Intern. J. Curr. Eng. Technol. 3 (2013) 2011–2013. [66] E.J. da Silva, M.L. Marques, F.G. Velasco, C. Fornari Junior, F.M. Luzardo, M.M. Tashima, A new treatment for coconut fibers to improve the properties of cement-based composites – Combined effect of natural latex/pozzolanic materials, Sustain. Mater. Technol. (2017). https://doi.org/10.1016/j.susmat.2017.04.003. [67] M. Sood, G. Dwivedi, Effect of fiber treatment on flexural properties of natural fiber reinforced composites: A review, Egypt. J. Pet. (2017). https://doi.org/10.1016/j.ejpe.2017.11.005. [68] H. Danso, ScienceDirect ScienceDirect Properties of Coconut , Oil Palm and Bagasse Fibres : As Potential Building Materials, Procedia Eng. 200 (2017) 1–9. https://doi.org/10.1016/j.proeng.2017.07.002. [69] G. Basu, L. Mishra, S. Jose, A.K. Samanta, Accelerated retting cum softening of coconut fibre, Ind. Crops Prod. 77 (2015) 66–73. https://doi.org/10.1016/j.indcrop.2015.08.012. [70] M.M. Haque, M. Hasan, M.S. Islam, M.E. Ali, Physico-mechanical properties of chemically treated palm and coir fiber reinforced polypropylene composites, Bioresour. Technol. (2009). https://doi.org/10.1016/j.biortech.2009.04.072. [71] G.M. Arifuzzaman Khan, M.S. Alam, M. Terano, Thermal characterization of chemically treated coconut husk fibre, Indian J. Fibre Text. Res. 37 (2012) 20–26. [72] K. Bilba, M.A. Arsene, A. Ouensanga, Study of banana and coconut fibers. Botanical composition, thermal degradation and textural observations, Bioresour. Technol. 98 (2007) 58–68. https://doi.org/10.1016/j.biortech.2005.11.030. [73] S.M. Suresh Kumar, D. Duraibabu, K. Subramanian, Studies on mechanical, thermal and dynamic mechanical properties of untreated (raw) and treated coconut sheath fiber reinforced epoxy composites, Mater. Des. 59 (2014) 63–69. https://doi.org/10.1016/j.matdes.2014.02.013. [74] M. Ali, A. Liu, H. Sou, N. Chouw, Mechanical and dynamic properties of coconut
References
BUI Thi Thu Huyen P a g e | 167
fibre reinforced concrete, Constr. Build. Mater. 30 (2012) 814–825. https://doi.org/10.1016/j.conbuildmat.2011.12.068. [75] F. Bencardino, Mechanical parameters and post-cracking behaviour of hpfrc according to three-point and four-point bending test, Adv. Civ. Eng. 2013 (2013). https://doi.org/10.1155/2013/179712. [76] Habibur Rahman Sobuz, The use of coconut fiber in the production of structural lightweight concrete, Appl. Sci. (2012) 831–839. [77] A. Nkem Ede, J. Olaoluwa Agbede, Use of Coconut Husk Fiber for Improved Compressive and Flexural Strength of Con- crete, Int. J. Sci. Eng. Res. 6 (2015). http://www.ijser.org. [78] C.L. Hwang, V.A. Tran, J.W. Hong, Y.C. Hsieh, Effects of short coconut fiber on the mechanical properties, plastic cracking behavior, and impact resistance of cementitious composites, Constr. Build. Mater. 127 (2016) 984–992. https://doi.org/10.1016/j.conbuildmat.2016.09.118. [79] N. Sathiparan, M.N. Rupasinghe, B. H.M. Pavithra, Performance of coconut coir reinforced hydraulic cement mortar for surface plastering application, Constr. Build. Mater. 142 (2017) 23–30. https://doi.org/10.1016/j.conbuildmat.2017.03.058. [80] F. Kesikidou, M. Stefanidou, Natural fi ber-reinforced mortars, J. Build. Eng. 25 (2019) 100786. https://doi.org/10.1016/j.jobe.2019.100786. [81] K. Manohar, Experimental Investigation of Building Thermal Insulation from Agricultural By-products, Br. J. Appl. Sci. Technol. 2 (2012) 227–239. https://doi.org/10.9734/BJAST/2012/1528. [82] J. Pinto, D. Cruz, A. Paiva, S. Pereira, P. Tavares, L. Fernandes, H. Varum, Characterization of corn cob as a possible raw building material, Constr. Build. Mater. 34 (2012) 28–33. https://doi.org/10.1016/j.conbuildmat.2012.02.014. [83] S. Annie Paul, A. Boudenne, L. Ibos, Y. Candau, K. Joseph, S. Thomas, Effect of fiber loading and chemical treatments on thermophysical properties of banana fiber/polypropylene commingled composite materials, Compos. Part A Appl. Sci. Manuf. 39 (2008) 1582–1588. https://doi.org/10.1016/j.compositesa.2008.06.004. [84] Y. Millogo, J.C. Morel, J.E. Aubert, K. Ghavami, Experimental analysis of Pressed Adobe Blocks reinforced with Hibiscus cannabinus fibers, Constr. Build. Mater. 52 (2014) 71–78. https://doi.org/10.1016/j.conbuildmat.2013.10.094. [85] D. Taoukil, A. El Bouardi, F. Sick, A. Mimet, H. Ezbakhe, T. Ajzoul, Moisture content influence on the thermal conductivity and diffusivity of wood-concrete composite, Constr. Build. Mater. 48 (2013) 104–115. https://doi.org/10.1016/j.conbuildmat.2013.06.067. [86] T. Ashour, H. Wieland, H. Georg, F.J. Bockisch, W. Wu, The influence of natural reinforcement fibres on insulation values of earth plaster for straw bale buildings, Mater. Des. 31 (2010) 4676–4685. https://doi.org/10.1016/j.matdes.2010.05.026. [87] S. Panyakaew, S. Fotios, New thermal insulation boards made from coconut husk and bagasse, Energy Build. 43 (2011) 1732–1739.
References
BUI Thi Thu Huyen P a g e | 168
https://doi.org/10.1016/j.enbuild.2011.03.015. [88] R. Alavez-Ramirez, F. Chiñas-Castillo, V. Morales-Dominguez, M. Ortiz-Guzman, J. Lara-Romero, Thermal lag and decrement factor of a coconut-ferrocement roofing system, Constr. Build. Mater. (2014). https://doi.org/10.1016/j.conbuildmat.2014.01.048. [89] P. Stähli, Ultra-Fluid , Oriented Hybrid-Fibre-Concrete, 2008. [90] S. Fu, B. Lauke, Effects of Fiber length and fiber orientation distributions on the tensile strength of short-fibe.pdf, 56 (1996) 1179–1190. [91] E. Jao Jules, T. Tsujikami, S. V. Lomov, I. Verpoest, Effect of fibres length and fibres orientation on the predicted elastic properties of long fibre composites, Macromol. Symp. 17 (2004). [92] R. Blanc, C. Germain, J.P. Da Costa, P. Baylou, M. Cataldi, Fiber orientation measurements in composite materials, Compos. Part A Appl. Sci. Manuf. 37 (2006) 197–206. https://doi.org/10.1016/j.compositesa.2005.04.021. [93] E.G. Kim, J.K. Park, S.H. Jo, A study on fiber orientation during the injection molding of fiber-reinforced polymeric composites: (Comparison between image processing results and numerical simulation), J. Mater. Process. Technol. 111 (2001) 225–232. https://doi.org/10.1016/S0924-0136(01)00521-0. [94] C. Eberhardt, A. Clarke, Fibre-orientation measurements in short-glass-fibre composites. Part I: Automated, high-angular-resolution measurement by confocal microscopy, Compos. Sci. Technol. 61 (2001) 1389–1400. https://doi.org/10.1016/S0266-3538(01)00038-0. [95] K.S. Lee, S.W. Lee, J.R. Youn, T.J. Kang, K. Chung, Confocal microscopy measurement of the fiber orientation in short fiber reinforced plastics, Fibers Polym. 2 (2001) 41–50. https://doi.org/10.1007/BF02875227. [96] A. Bernasconi, F. Cosmi, P.J. Hine, Analysis of fibre orientation distribution in short fibre reinforced polymers: A comparison between optical and tomographic methods, Compos. Sci. Technol. 72 (2012) 2002–2008. https://doi.org/10.1016/j.compscitech.2012.08.018. [97] O.A. Ige, Key Factors Affecting Distribution and Orientation of Fibres in Steel Fibre Reinforced Concrete and Subsequent Effects on Mechanical Properties, 2016. [98] B.R. Denos, D.E. Sommer, A.J. Favaloro, R.B. Pipes, W.B. Avery, Fiber orientation measurement from mesoscale CT scans of prepreg platelet molded composites, Compos. Part A Appl. Sci. Manuf. 114 (2018) 241–249. https://doi.org/10.1016/j.compositesa.2018.08.024. [99] T. Sabiston, P. Pinter, J. Lévesque, K.A. Weidenmann, K. Inal, Evaluating the number of fibre orientations required in homogenization schemes to predict the elastic response of long fibre sheet moulding compound composites from X-ray computed tomography measured fibre orientation distributions, Compos. Part A Appl. Sci. Manuf. 114 (2018) 278–294. https://doi.org/10.1016/j.compositesa.2018.08.032. [100] D.C. González, J. Mínguez, M.A. Vicente, F. Cambronero, G. Aragón, Study of the effect of the fibers’ orientation on the post-cracking behavior of steel fiber
References
BUI Thi Thu Huyen P a g e | 169
reinforced concrete from wedge-splitting tests and computed tomography scanning, Constr. Build. Mater. 192 (2018) 110–122. https://doi.org/10.1016/j.conbuildmat.2018.10.104. [101] H. Zhao, L. Zhang, B. Chen, J. Zhang, The effect of fiber orientation on failure behavior of 3DN C/SiC torque tube, Ceram. Int. 44 (2018) 4190–4197. https://doi.org/10.1016/j.ceramint.2017.11.222. [102] D. Dupont, L. Vandewalle, Distribution of steel fibres in rectangular sections, Cem. Concr. Compos. 27 (2005) 391–398. https://doi.org/10.1016/j.cemconcomp.2004.03.005. [103] R. Gettu, D.R. Gardner, H. Saldívar, B.E. Barragán, Study of the distribution and orientation of fibers in SFRC specimens, Mater. Struct. Constr. 38 (2005) 31–37. https://doi.org/10.1617/14021. [104] D.Y. Yoo, N. Banthia, S.T. Kang, Y.S. Yoon, Effect of fiber orientation on the rate-dependent flexural behavior of ultra-high-performance fiber-reinforced concrete, Compos. Struct. 157 (2016) 62–70. https://doi.org/10.1016/j.compstruct.2016.08.023. [105] J.R.M.D. E. Laranjeira, L.H. De Carvalho, S.M.D.L. Silva, Influence of fiber orientation on the mechanical properties of polyester/jute composites, J. Reinf. Plast. Compos. 25 (2006) 1269–1278. [106] H. Li, R. Mu, L. Qing, H. Chen, Y. Ma, The influence of fiber orientation on bleeding of steel fiber reinforced cementitious composites, Cem. Concr. Compos. 92 (2018) 125–134. https://doi.org/10.1016/j.cemconcomp.2018.05.018. [107] N. Sebaibi, M. Benzerzour, N.E. Abriak, C. Binetruy, Mechanical and physical properties of a cement matrix through the recycling of thermoset composites, Constr. Build. Mater. 34 (2012) 226–235. https://doi.org/10.1016/j.conbuildmat.2012.02.048. [108] Q. Song, R. Yu, Z. Shui, X. Wang, S. Rao, Z. Lin, Optimization of fibre orientation and distribution for a sustainable Ultra-High Performance Fibre Reinforced Concrete ( UHPFRC ): Experiments and mechanism analysis, Constr. Build. Mater. 169 (2018) 8–19. https://doi.org/10.1016/j.conbuildmat.2018.02.130. [109] S. Zhang, L. Liao, S. Song, C. Zhang, Experimental and analytical study of the fibre distribution in SFRC: A comparison between image processing and the inductive test, Compos. Struct. 188 (2018) 78–88. https://doi.org/10.1016/j.compstruct.2018.01.006. [110] B. Zhou, Y. Uchida, Relationship between fiber orientation/distribution and post-cracking behaviour in ultra-high-performance fiber-reinforced concrete (UHPFRC), Cem. Concr. Compos. 83 (2017) 66–75. https://doi.org/10.1016/j.cemconcomp.2017.07.007. [111] N. Sebaibi, M. Benzerzour, N. Edine, Influence of the distribution and orientation of fibres in a reinforced concrete with waste fibres and powders, Constr. Build. Mater. 65 (2014) 254–263. https://doi.org/10.1016/j.conbuildmat.2014.04.134. [112] M. Afroz, I. Patnaikuni, S. Venkatesan, Chemical durability and performance of modified basalt fiber in concrete medium, Constr. Build. Mater. 154 (2017) 191–
References
BUI Thi Thu Huyen P a g e | 170
203. https://doi.org/10.1016/j.conbuildmat.2017.07.153. [113] S. Yin, R. Tuladhar, F. Shi, M. Combe, T. Collister, N. Sivakugan, Use of macro plastic fibres in concrete: A review, Constr. Build. Mater. 93 (2015) 180–188. https://doi.org/10.1016/j.conbuildmat.2015.05.105. [114] M.A. Aziz, P. Paramasivam, S.L. Lee, Prospects for natural fibre reinforced concretes in construction, Int. J. Cem. Compos. Light. Concr. 3 (1981) 123–132. https://doi.org/10.1016/0262-5075(81)90006-3. [115] W.G. Buttlar, B.C. Hill, Y.R. Kim, M.E. Kutay, A. Millien, A. Montepara, G.H. Paulino, C. Petit, Digital image correlation techniques to investigate strain fields and cracking phenomena in asphalt materials, (2014) 1373–1390. https://doi.org/10.1617/s11527-014-0362-z. [116] O. Orell, J. Vuorinen, J. Jokinen, H. Kettunen, P. Hytönen, J. Turunen, Characterization of elastic constants of anisotropic composites in compression using digital image correlation, Compos. Struct. 185 (2018) 176–185. https://doi.org/10.1016/j.compstruct.2017.11.008. [117] Y. Belrhiti, A. Gallet-Doncieux, A. Germaneau, P. Doumalin, J.C. Dupre, A. Alzina, P. Michaud, I.O. Pop, M. Huger, T. Chotard, Application of optical methods to investigate the non-linear asymmetric behavior of ceramics exhibiting large strain to rupture by four-points bending test, J. Eur. Ceram. Soc. 32 (2012) 4073–4081. https://doi.org/10.1016/j.jeurceramsoc.2012.06.016. [118] H. Khatami, A. Deng, M. Jaksa, Computers and Geotechnics An experimental study of the active arching effect in soil using the digital image correlation technique, Comput. Geotech. 108 (2019) 183–196. https://doi.org/10.1016/j.compgeo.2018.12.023. [119] F. Nath, R.J. Kimanzi, M. Mokhtari, S. Salehi, SC, J. Pet. Sci. Eng. (2018). https://doi.org/10.1016/j.petrol.2018.03.068. [120] E. Dildar, E. Tsangouri, K. Spiessens, G. De Schutter, D.G. Aggelis, Digital image correlation ( DIC ) on fresh cement mortar to quantify settlement and shrinkage, Arch. Civ. Mech. Eng. 19 (2019) 205–214. https://doi.org/10.1016/j.acme.2018.10.003. [121] T.Y. Chen, T. Chen, F. Cheng, A. Tsai, M. Lin, Microelectronic Engineering Digital image correlation of SEM images for surface deformation of CMOS IC, Microelectron. Eng. 201 (2018) 16–21. https://doi.org/10.1016/j.mee.2018.09.007. [122] C.M. Stewart, E. Garcia, Fatigue crack growth of a hot mix asphalt using digital image correlation, Int. J. Fatigue. 120 (2019) 254–266. https://doi.org/10.1016/j.ijfatigue.2018.11.024. [123] X. Zhao, Y. Wen, J. Zhao, D. Zhao, Optik Study of the quality of wood texture patterns in digital image correlation, Opt. - Int. J. Light Electron Opt. 171 (2018) 370–376. https://doi.org/10.1016/j.ijleo.2018.06.017. [124] C. Chien, T. Su, C. Huang, Y. Chao, W. Yeh, Application of digital image correlation ( DIC ) to sloshing liquids, Opt. Lasers Eng. 115 (2019) 42–52. https://doi.org/10.1016/j.optlaseng.2018.11.016. [125] A. Madadi, H. Eskandari-naddaf, R. Shadnia, L. Zhang, Digital image correlation
References
BUI Thi Thu Huyen P a g e | 171
to characterize the flexural behavior of lightweight ferrocement slab panels, Constr. Build. Mater. 189 (2018) 967–977. https://doi.org/10.1016/j.conbuildmat.2018.09.079. [126] I. Paegle, G. Fischer, Evaluation of test methods used to characterize fiber reinforced cementitious composites, in: Proceedings of the International Conference „Innovative Materials, Structures and Technologies, 2014. https://doi.org/10.7250/iscconstrs.2014.20. [127] K. Sindhu, K. Joseph, J.M. Joseph, T. V. Mathew, Degradation studies of coir fiber/polyester and glass fiber/polyester composites under different conditions, J. Reinf. Plast. Compos. 26 (2007) 1571–1585. https://doi.org/10.1177/0731684407079665. [128] J. Wei, S. Ma, D.S.G. Thomas, Correlation between hydration of cement and durability of natural fiber-reinforced cement composites, Eval. Program Plann. 106 (2016) 1–15. https://doi.org/10.1016/j.corsci.2016.01.020. [129] S.F. Santos, R. Schmidt, A.E.F.S. Almeida, G.H.D. Tonoli, H. Savastano, Cement & Concrete Composites Supercritical carbonation treatment on extruded fibre – cement reinforced with vegetable fibres, 56 (2015) 84–94. https://doi.org/10.1016/j.cemconcomp.2014.11.007. [130] V.D. Pizzol, L.M. Mendes, H.S. Jr, M. Frías, F.J. Davila, M.A. Cincotto, V.M. John, G.H.D. Tonoli, Mineralogical and microstructural changes promoted by accelerated carbonation and ageing cycles of hybrid fiber – cement composites, Constr. Build. Mater. 68 (2014) 750–756. https://doi.org/10.1016/j.conbuildmat.2014.06.055. [131] T. Chen, X. Gao, L. Qin, Mathematical modeling of accelerated carbonation curing of Portland cement paste at early age, Cem. Concr. Res. 120 (2019) 187–197. https://doi.org/10.1016/j.cemconres.2019.03.025. [132] H.J. Lee, D.G. Kim, J.H. Lee, M.S. Cho, A Study for Carbonation Degree on Concrete using a Phenolphthalein Indicator and Fourier-Transform Infrared Spectroscopy, 6 (2012) 95–101. [133] F. Georget, W. Soja, K.L. Scrivener, Characteristic lengths of the carbonation front in naturally carbonated cement pastes: Implications for reactive transport models, Cem. Concr. Res. 134 (2020) 106080. https://doi.org/10.1016/j.cemconres.2020.106080. [134] RILEM Committee CPC-18, Measurement of hardened concrete carbonation depth, Mater. Struct. 18 (1988) 453–455. [135] M. Lim, G.C. Han, J.W. Ahn, K.S. You, Environmental remediation and conversion of carbon dioxide (CO2) into useful green products by accelerated carbonation technology, Int. J. Environ. Res. Public Health. 7 (2010) 203–228. https://doi.org/10.3390/ijerph7010203. [136] The French National Research Project PERFDUB (Approche Performantielle de la Durabilité des Ouvrages en Béton), https://www.perfdub.fr/en/, (2015). [137] J. Tang, J. Wu, Z. Zou, A. Yue, A. Mueller, Influence of axial loading and carbonation age on the carbonation resistance of recycled aggregate concrete, Constr. Build. Mater. 173 (2018) 707–717.
References
BUI Thi Thu Huyen P a g e | 172
https://doi.org/10.1016/j.conbuildmat.2018.03.269. [138] L. Qin, X. Gao, T. Chen, Influence of mineral admixtures on carbonation curing of cement paste, Constr. Build. Mater. 212 (2019) 653–662. https://doi.org/10.1016/j.conbuildmat.2019.04.033. [139] K. De Weerdt, G. Plusquellec, A.B. Revert, M.R. Geiker, B. Lothenbach, Effect of carbonation on the pore solution of mortar, Cem. Concr. Res. 118 (2019) 38–56. https://doi.org/10.1016/j.cemconres.2019.02.004. [140] W. Ashraf, J. Olek, Carbonation activated binders from pure calcium silicates: Reaction kinetics and performance controlling factors, Cem. Concr. Compos. 93 (2018) 85–98. https://doi.org/10.1016/j.cemconcomp.2018.07.004. [141] A. Leemann, R. Loser, Carbonation resistance of recycled aggregate concrete, Constr. Build. Mater. 204 (2019) 335–341. https://doi.org/10.1016/j.conbuildmat.2019.01.162. [142] C. Zhu, Y. Fang, H. Wei, Carbonation-cementation of recycled hardened cement paste powder, Constr. Build. Mater. 192 (2018) 224–232. https://doi.org/10.1016/j.conbuildmat.2018.10.113. [143] K.S. Romildo D. Tol^eedo Filho, Khosrow Ghavami, George L. England, Development of vegetable fibre–mortar composites of improved durability, Cem. Concr. Compos. 25 (2003) 186–196. https://doi.org/10.1590/1678-457x.00717. [144] G.H.D. Tonoli, S.F. Santos, A.P. Joaquim, H. Savastano, Effect of accelerated carbonation on cementitious roofing tiles reinforced with lignocellulosic fibre, Constr. Build. Mater. 24 (2010) 193–201. https://doi.org/10.1016/j.conbuildmat.2007.11.018. [145] X.C. Tomography, J. Han, D. Ph, W. Sun, G. Pan, W. Caihui, D. Ph, Monitoring the Evolution of Accelerated Carbonation of Hardened Cement Pastes by X-Ray Computed Tomography, (2013). https://doi.org/10.1061/(ASCE)MT. [146] A. Neves Junior, R.D. Toledo Filho, E. De Moraes Rego Fairbairn, J. Dweck, The effects of the early carbonation curing on the mechanical and porosity properties of high initial strength Portland cement pastes, Constr. Build. Mater. 77 (2015) 448–454. https://doi.org/10.1016/j.conbuildmat.2014.12.072. [147] R. Mi, G. Pan, K.M. Liew, Predicting carbonation service life of reinforced concrete beams reflecting distribution of carbonation zones, Constr. Build. Mater. 255 (2020) 119367. https://doi.org/10.1016/j.conbuildmat.2020.119367. [148] C.F. Chang, J.W. Chen, The experimental investigation of concrete carbonation depth, Cem. Concr. Res. 36 (2006) 1760–1767. https://doi.org/10.1016/j.cemconres.2004.07.025. [149] C. Andrade, Evaluation of the degree of carbonation of concretes in three environments, Constr. Build. Mater. 230 (2020) 116804. https://doi.org/10.1016/j.conbuildmat.2019.116804. [150] F. Winnefeld, S. S, B. Lothenbach, B. A, P. T, Effect of relative humidity on the carbonation rate of portlandite , calcium silicate hydrates and ettringite, Int. Conf. Build. Mater. 135 (2018) 106116. https://doi.org/10.1016/j.cemconres.2020.106116.
References
BUI Thi Thu Huyen P a g e | 173
[151] G. Henrique, D. Tonoli, G. Fernando, C. Alexandre, H. Savastano, Influence of the initial moisture content on the carbonation degree and performance of fiber-cement composites, Constr. Build. Mater. 215 (2019) 22–29. https://doi.org/10.1016/j.conbuildmat.2019.04.159. [152] F. Matsushita, Y. Aono, S. Shibata, Carbonation degree of autoclaved aerated concrete, 30 (2000) 1741–1745. [153] Q. Qiu, A state-of-the-art review on the carbonation process in cementitious materials: Fundamentals and characterization techniques, Constr. Build. Mater. 247 (2020) 118503. https://doi.org/10.1016/j.conbuildmat.2020.118503. [154] N.V.R. and T. Meena, A review on carbonation study in concrete, (2017). https://doi.org/10.1088/1757-899X/263/3/032011. [155] J. Tang, J. Wu, Z. Zou, A. Yue, A. Mueller, Influence of axial loading and carbonation age on the carbonation resistance of recycled aggregate concrete, Constr. Build. Mater. 173 (2018) 707–717. https://doi.org/10.1016/j.conbuildmat.2018.03.269. [156] K. De Weerdt, G. Plusquellec, A. Belda Revert, M.R. Geiker, B. Lothenbach, Effect of carbonation on the pore solution of mortar, Cem. Concr. Res. 118 (2019) 38–56. https://doi.org/10.1016/j.cemconres.2019.02.004. [157] W. Ashraf, Carbonation of cement-based materials : Challenges and opportunities, Constr. Build. Mater. 120 (2016) 558–570. https://doi.org/10.1016/j.conbuildmat.2016.05.080. [158] B. Johannesson, P. Utgenannt, Microstructural changes caused by carbonation of cement mortar, Cem. Concr. Res. 31 (2001) 925–931. https://doi.org/10.1016/S0008-8846(01)00498-7. [159] V.D. Pizzol, L.M. Mendes, L. Frezzatti, H.S. Jr, G.H.D. Tonoli, Effect of accelerated carbonation on the microstructure and physical properties of hybrid fiber-cement composites, Miner. Eng. 59 (2014) 101–106. https://doi.org/10.1016/j.mineng.2013.11.007. [160] Mohamed Maslehuddin, C. L. Page, Rasheeduzzafar, Effect of temperature and salt contamination on carbonation of cements, J. Mater. Civ. Eng. (1996). https://doi.org/10.1061/(ASCE)0899-1561(1996)8:2(63). [161] W.X. D.O. McPolin, P.A.M. Basheer, K.T.V. Grattan, A.E. Long, T. Sun, Preliminary development and evaluation of fibre optic chemical sensor, J. Mater. Civ. Eng. 23 (2011) 1200–1210. [162] and L.J.J.C. Ricardo Herrera, Stephen D. Kinrade, A comparison of methods for determining carbonation depth in fly ash-blended cement mortars, ACI Mater. J. (2015). https://doi.org/10.14359/51687452. [163] W. Ashraf, Carbonation of cement-based materials: Challenges and opportunities, Constr. Build. Mater. 120 (2016) 558–570. https://doi.org/10.1016/j.conbuildmat.2016.05.080. [164] R. Neves, F. Branco, J. De Brito, Field assessment of the relationship between natural and accelerated concrete carbonation resistance, Cem. Concr. Compos. 41 (2013) 9–15. https://doi.org/10.1016/j.cemconcomp.2013.04.006.
References
BUI Thi Thu Huyen P a g e | 174
[165] N. Hyvert, A. Sellier, F. Duprat, P. Rougeau, P. Francisco, Dependency of C-S-H carbonation rate on CO2 pressure to explain transition from accelerated tests to natural carbonation, Cem. Concr. Res. 40 (2010) 1582–1589. https://doi.org/10.1016/j.cemconres.2010.06.010. [166] M. Auroy, S. Poyet, P. Le Bescop, J.M. Torrenti, T. Charpentier, M. Moskura, X. Bourbon, Comparison between natural and accelerated carbonation (3% CO2): Impact on mineralogy, microstructure, water retention and cracking, Cem. Concr. Res. 109 (2018) 64–80. https://doi.org/10.1016/j.cemconres.2018.04.012. [167] L. De Ceukelaire, D. Van Nieuwenburg, Accelerated carbonation of a blast-furnace cement concrete, Cem. Concr. Res. 23 (1993) 442–452. https://doi.org/10.1016/0008-8846(93)90109-M. [168] M. Elsalamawy, A.R. Mohamed, E.M. Kamal, The role of relative humidity and cement type on carbonation resistance of concrete, Alexandria Eng. J. 58 (2019) 1257–1264. https://doi.org/10.1016/j.aej.2019.10.008. [169] X. Zeng, Progress in the research of carbonation resistance of RAC, Constr. Build. Mater. 230 (2020) 116976. https://doi.org/10.1016/j.conbuildmat.2019.116976. [170] S.A. Bernal, J.L. Provis, R. Mejía de Gutiérrez, J.S.J. van Deventer, Accelerated carbonation testing of alkali-activated slag/metakaolin blended concretes: effect of exposure conditions, Mater. Struct. Constr. 48 (2014) 653–669. https://doi.org/10.1617/s11527-014-0289-4. [171] K. De Weerdt, M. Ben Haha, G. Le Saout, K.O. Kjellsen, H. Justnes, B. Lothenbach, Hydration mechanisms of ternary Portland cements containing limestone powder and fly ash, Cem. Concr. Res. 41 (2011) 279–291. https://doi.org/10.1016/j.cemconres.2010.11.014. [172] G. Plusquellec, M.R. Geiker, J. Lindgård, J. Duchesne, B. Fournier, K. De Weerdt, Determination of the pH and the free alkali metal content in the pore solution of concrete: Review and experimental comparison, Cem. Concr. Res. 96 (2017) 13–26. https://doi.org/10.1016/j.cemconres.2017.03.002. [173] S. Ioannou, K. Paine, L. Reig, K. Quillin, Performance characteristics of concrete based on a ternary calcium sulfoaluminate – anhydrite – fly ash cement, Cem. Concr. Res. 55 (2015) 196–204. https://doi.org/10.1016/j.cemconcomp.2014.08.009. [174] L. Qin, X. Gao, T. Chen, Influence of mineral admixtures on carbonation curing of cement paste, Constr. Build. Mater. 212 (2019) 653–662. https://doi.org/10.1016/j.conbuildmat.2019.04.033. [175] J.M. Chi, R. Huang, C.C. Yang, Effects of carbonation on mechanical properties and durability of concrete using accelerated testing method, J. Mar. Sci. Technol. 10 (2002) 14–20. [176] M. Chabannes, E. Garcia-Diaz, L. Clerc, J.C. Bénézet, Studying the hardening and mechanical performances of rice husk and hemp-based building materials cured under natural and accelerated carbonation, Constr. Build. Mater. 94 (2015) 105–115. https://doi.org/10.1016/j.conbuildmat.2015.06.032.
References
BUI Thi Thu Huyen P a g e | 175
[177] C. Zhu, Y. Fang, H. Wei, Carbonation-cementation of recycled hardened cement paste powder, Constr. Build. Mater. 192 (2018) 224–232. https://doi.org/10.1016/j.conbuildmat.2018.10.113. [178] V. Rostami, Y. Shao, A.J. Boyd, Carbonation curing versus steam curing for precast concrete production, J. Mater. Civ. Eng. 24 (2012) 1221–1229. https://doi.org/10.1061/(ASCE)MT.1943-5533.0000462. [179] J. Wang, H. Xu, D. Xu, P. Du, Z. Zhou, L. Yuan, X. Cheng, Accelerated carbonation of hardened cement pastes: Influence of porosity, Constr. Build. Mater. 225 (2019) 159–169. https://doi.org/10.1016/j.conbuildmat.2019.07.088. [180] K. De Weerdt, G. Plusquellec, A.B. Revert, M.R. Geiker, B. Lothenbach, Cement and Concrete Research Effect of carbonation on the pore solution of mortar, Cem. Concr. Res. 118 (2019) 38–56. https://doi.org/10.1016/j.cemconres.2019.02.004. [181] M. Lukovic, Carbonation of cement paste : Understanding , challenges , and opportunities, 117 (2016) 285–301. https://doi.org/10.1016/j.conbuildmat.2016.04.138. [182] V.D. Pizzol, L.M. Mendes, L. Frezzatti, H. Savastano, G.H.D. Tonoli, Effect of accelerated carbonation on the microstructure and physical properties of hybrid fiber-cement composites, Miner. Eng. 59 (2014) 101–106. https://doi.org/10.1016/j.mineng.2013.11.007. [183] J. Wei, S. Ma, D.G. Thomas, Correlation between hydration of cement and durability of natural fiber-reinforced cement composites, Corros. Sci. 106 (2016) 1–15. https://doi.org/10.1016/j.corsci.2016.01.020. [184] M. Khan, M. Ali, Use of glass and nylon fibers in concrete for controlling early age micro cracking in bridge decks, Constr. Build. Mater. 125 (2016) 800–808. https://doi.org/10.1016/j.conbuildmat.2016.08.111. [185] M. Vafaei, A. Allahverdi, High strength geopolymer binder based on waste-glass powder, Adv. Powder Technol. 28 (2017) 215–222. https://doi.org/10.1016/j.apt.2016.09.034. [186] S.R. Ferreira, F. de A. Silva, P.R.L. Lima, R.D. Toledo Filho, Effect of hornification on the structure, tensile behavior and fiber matrix bond of sisal, jute and curauá fiber cement based composite systems, Constr. Build. Mater. 139 (2017). https://doi.org/10.1016/j.conbuildmat.2016.10.004. [187] F.K. Sodoke, Wetting / drying cyclic effects on mechanical and physicochemical properties of quasi-isotopic fl ax / epoxy composites re b, 161 (2019) 121–130. https://doi.org/10.1016/j.polymdegradstab.2019.01.014. [188] M. Assarar, D. Scida, A. El Mahi, C. Poilâne, R. Ayad, Influence of water ageing on mechanical properties and damage events of two reinforced composite materials: Flax-fibres and glass-fibres, Mater. Des. 32 (2011) 788–795. https://doi.org/10.1016/j.matdes.2010.07.024. [189] J.R. Araújo, W.R. Waldman, M.A. De Paoli, Thermal properties of high density polyethylene composites with natural fibres: Coupling agent effect, Polym. Degrad. Stab. 93 (2008) 1770–1775. https://doi.org/10.1016/j.polymdegradstab.2008.07.021.
References
BUI Thi Thu Huyen P a g e | 176
[190] B.J. Mohr, H. Nanko, K.E. Kurtis, Durability of thermomechanical pulp fiber-cement composites to wet / dry cycling, 35 (2005) 1646–1649. https://doi.org/10.1016/j.cemconres.2005.04.005. [191] B.J. Mohr, J.J. Biernacki, K.E. Kurtis, Microstructural and chemical effects of wet / dry cycling on pulp fiber – cement composites, 36 (2006) 1240–1251. https://doi.org/10.1016/j.cemconres.2006.03.020. [192] M. Wei, J. Xie, H. Zhang, J. Li, Bond-slip behaviors of BFRP-to-concrete interfaces exposed to wet / dry cycles in chloride environment, Compos. Struct. 219 (2019) 185–193. https://doi.org/10.1016/j.compstruct.2019.03.049. [193] S. Yin, L. Jing, M. Yin, B. Wang, Mechanical properties of textile reinforced concrete under chloride wet-dry and freeze-thaw cycle environments, Cem. Concr. Compos. 96 (2019) 118–127. https://doi.org/10.1016/j.cemconcomp.2018.11.020. [194] S. Yin, C. Peng, Z. Jin, Research on Mechanical Properties of Axial-Compressive Concrete Columns Strengthened with TRC under a Conventional and Chloride Wet-Dry Cycle Environment, (2014) 1–11. https://doi.org/10.1061/(ASCE)CC.1943-5614.0000725. [195] M.Z. Yeon Ting, K.S. Wong, M.E. Rahman, S.J. Meheron, Deterioration of marine concrete exposed to wetting-drying action, J. Clean. Prod. 278 (2020) 123383. https://doi.org/10.1016/j.jclepro.2020.123383. [196] B.J. Mohr, H. Nanko, K.E. Kurtis, Durability of kraft pulp fiber – cement composites to wet / dry cycling, 27 (2005) 435–448. https://doi.org/10.1016/j.cemconcomp.2004.07.006. [197] Z. Li, S. Li, Effects of wetting and drying on alkalinity and strength of fly ash/slag-activated materials, Constr. Build. Mater. 254 (2020) 119069. https://doi.org/10.1016/j.conbuildmat.2020.119069. [198] S. Cheng, Z. Shui, X. Gao, R. Yu, T. Sun, C. Guo, Y. Huang, Degradation mechanisms of Portland cement mortar under seawater attack and drying-wetting cycles, Constr. Build. Mater. 230 (2020) 116934. https://doi.org/10.1016/j.conbuildmat.2019.116934. [199] K. Wang, D.E. Nelsen, W.A. Nixon, Damaging effects of deicing chemicals on concrete materials, Cem. Concr. Compos. 28 (2006) 173–188. https://doi.org/10.1016/j.cemconcomp.2005.07.006. [200] M. Jerman, L. Scheinherrová, I. Medveď, J. Krejsová, M. Doleželová, P. Bezdička, R. Černý, Effect of cyclic wetting and drying on microstructure, composition and length changes of lime-based plasters, Cem. Concr. Compos. 104 (2019). https://doi.org/10.1016/j.cemconcomp.2019.103411. [201] M.C.G. Juenger, F. Winnefeld, J.L. Provis, J.H. Ideker, Advances in alternative cementitious binders, Cem. Concr. Res. 41 (2011) 1232–1243. https://doi.org/10.1016/j.cemconres.2010.11.012. [202] F.P. Glasser, L. Zhang, High-performance cement matrices based on calcium sulfoaluminate-belite compositions, Cem. Concr. Res. 31 (2001) 1881–1886. https://doi.org/10.1016/S0008-8846(01)00649-4. [203] P.N. Lemougna, A. Nzeukou, B. Aziwo, A.B. Tchamba, K. Wang, U.C. Melo, X. Cui,
References
BUI Thi Thu Huyen P a g e | 177
Effect of slag on the improvement of setting time and compressive strength of low reactive volcanic ash geopolymers synthetized at room temperature, Mater. Chem. Phys. 239 (2020) 122077. https://doi.org/10.1016/j.matchemphys.2019.122077. [204] W. Steinmann, A. Saelhoff, Fibrous and Textile Materials for Composite Applications, 2016. https://doi.org/10.1007/978-981-10-0234-2. [205] N. Stevulova, A. Estokova, J. Cigasova, I. Schwarzova, F. Kacik, A. Geffert, Thermal degradation of natural and treated hemp hurds under air and nitrogen atmosphere, J. Therm. Anal. Calorim. 128 (2017) 1649–1660. https://doi.org/10.1007/s10973-016-6044-z. [206] S. Rana, Fibrous and Textile Materials for Composite Applications, 2016. https://doi.org/10.1007/978-981-10-0234-2. [207] K. Liu, L. Lu, F. Wang, W. Liang, Theoretical and experimental study on multi-phase model of thermal conductivity for fiber reinforced concrete, Constr. Build. Mater. (2017). https://doi.org/10.1016/j.conbuildmat.2017.05.043. [208] C. Asasutjarit, J. Hirunlabh, J. Khedari, S. Charoenvai, Development of coconut coir-based lightweight cement board, 21 (2007) 277–288. https://doi.org/10.1016/j.conbuildmat.2005.08.028. [209] C. Asasutjarit, S. Charoenvai, J. Hirunlabh, J. Khedari, Composites : Part B Materials and mechanical properties of pretreated coir-based green composites, Compos. Part B. 40 (2009) 633–637. https://doi.org/10.1016/j.compositesb.2009.04.009. [210] S.R. Ferreira, F.D.A. Silva, P.R.L. Lima, R.D. Toledo Filho, Effect of fiber treatments on the sisal fiber properties and fiber-matrix bond in cement based systems, Constr. Build. Mater. 101 (2015) 730–740. https://doi.org/10.1016/j.conbuildmat.2015.10.120. [211] M. Arsyad, I.N.G. Wardana, Pratikto, Y.S. Irawan, The morphology of coconut fiber surface under chemical treatment, Rev. Mater. 20 (2015) 169–177. https://doi.org/10.1590/S1517-707620150001.0017. [212] R. Rawangkul, J. Khedari, J. Hirunlabh, B. Zeghmati, Characteristics and performance analysis of a natural desiccant prepared from coconut coir, ScienceAsia. 36 (2010) 216–222. https://doi.org/10.2306/scienceasia1513-1874.2010.36.216. [213] T. Sen, H.N.J. Reddy, Application of Sisal , Bamboo , Coir and Jute Natural Composites in Structural Upgradation, Int. J. Innov. Maagement Technol. 2 (2011) 186–191. https://doi.org/10.7763/IJIMT.2011.V2.129. [214] Y. Millogo, J.E. Aubert, E. Hamard, J.C. Morel, How properties of kenaf fibers from Burkina Faso contribute to the reinforcement of earth blocks, Materials (Basel). 8 (2015) 2332–2345. https://doi.org/10.3390/ma8052332. [215] C. Baley, Analysis of the flax fibres tensile behaviour and analysis of the tensile stiffness increase, Compos. - Part A Appl. Sci. Manuf. 33 (2002) 939–948. https://doi.org/10.1016/S1359-835X(02)00040-4. [216] J. Wei, C. Meyer, Improving degradation resistance of sisal fiber in concrete through fiber surface treatment, Appl. Surf. Sci. 289 (2014) 511–523.
References
BUI Thi Thu Huyen P a g e | 178
https://doi.org/10.1016/j.apsusc.2013.11.024. [217] H. Yang, R. Yan, H. Chen, D.H. Lee, C. Zheng, Characteristics of hemicellulose, cellulose and lignin pyrolysis, Fuel. 86 (2007) 1781–1788. https://doi.org/10.1016/j.fuel.2006.12.013. [218] K.H. Mo, U.J. Alengaram, M.Z. Jumaat, S.P. Yap, S.C. Lee, Green concrete partially comprised of farming waste residues: A review, J. Clean. Prod. (2016). https://doi.org/10.1016/j.jclepro.2016.01.022. [219] H.E. Elyamany, A. Elmoaty, M.A. Elmoaty, A.M. Elshaboury, Setting time and 7-day strength of geopolymer mortar with various binders, Constr. Build. Mater. 187 (2018) 974–983. https://doi.org/10.1016/j.conbuildmat.2018.08.025. [220] R.A. Sanderson, G.M. Cann, J.L. Provis, Comparison of calorimetric methods for the assessment of slag cement hydration, Adv. Appl. Ceram. 116 (2017) 186–192. https://doi.org/10.1080/17436753.2017.1288371. [221] O.M. Abdulkareem, A. Ben Fraj, M. Bouasker, A. Khelidj, Mixture design and early age investigations of more sustainable UHPC, Constr. Build. Mater. 163 (2018) 235–246. https://doi.org/10.1016/j.conbuildmat.2017.12.107. [222] R.F. Zollo, Fiber-reinforced concrete: An overview after 30 years of development, Cem. Concr. Compos. 19 (1997) 107–122. https://doi.org/10.1016/s0958-9465(96)00046-7. [223] F. Kesikidou, M. Stefanidou, Natural fi ber-reinforced mortars, J. Build. Eng. 25 (2019) 100786. https://doi.org/10.1016/j.jobe.2019.100786. [224] H. Savastano, P.G. Warden, R.S.P. Coutts, Brazilian waste fibres as reinforcement for cement-based composites, Cem. Concr. Compos. 22 (2000) 379–384. https://doi.org/10.1016/S0958-9465(00)00034-2. [225] F.K. Winnefeld, Concrete produced with calcium sulfoaluminate cement – a potential system for energy and heat storage, First Middle East Conf. Smart Monit. (2011) 1–9. [226] G. Tiberti, F. Minelli, G. Plizzari, Cracking behavior in reinforced concrete members with steel fibers: A comprehensive experimental study, Cem. Concr. Res. 68 (2015) 24–34. https://doi.org/10.1016/j.cemconres.2014.10.011. [227] L. Li, C.S. Poon, J. Xiao, D. Xuan, Effect of carbonated recycled coarse aggregate on the dynamic compressive behavior of recycled aggregate concrete, Constr. Build. Mater. 151 (2017) 52–62. https://doi.org/10.1016/j.conbuildmat.2017.06.043. [228] H. Savastano, V. Agopyan, Transition zone studies of vegetable fibre-cement paste composites, Cem. Concr. Compos. 21 (1999) 49–57. https://doi.org/10.1016/S0958-9465(98)00038-9. [229] S. Yin, R. Tuladhar, F. Shi, M. Combe, T. Collister, N. Sivakugan, Use of macro plastic fibres in concrete: A review, Constr. Build. Mater. 93 (2015) 180–188. https://doi.org/10.1016/j.conbuildmat.2015.05.105. [230] H. Huang, X. Gao, L. Li, H. Wang, Improvement effect of steel fiber orientation control on mechanical performance of UHPC, Constr. Build. Mater. 188 (2018) 709–721. https://doi.org/10.1016/j.conbuildmat.2018.08.146. [231] Q. Song, R. Yu, Z. Shui, X. Wang, S. Rao, Z. Lin, Optimization of fibre orientation
References
BUI Thi Thu Huyen P a g e | 179
and distribution for a sustainable Ultra-High Performance Fibre Reinforced Concrete (UHPFRC): Experiments and mechanism analysis, Constr. Build. Mater. 169 (2018) 8–19. https://doi.org/10.1016/j.conbuildmat.2018.02.130. [232] S. Zhang, C. Caprani, A. Heidarpour, Influence of fibre orientation on pultruded GFRP material properties, Compos. Struct. 204 (2018) 368–377. https://doi.org/10.1016/j.compstruct.2018.07.104. [233] A. V. Borgaonkar, M.B. Mandale, S.B. Potdar, Effect of Changes in Fiber Orientations on Modal Density of Fiberglass Composite Plates, Mater. Today Proc. 5 (2018) 5783–5791. https://doi.org/10.1016/j.matpr.2017.12.175. [234] N. Kumar, D. Das, B. Neckář, Effect of fiber orientation on tensile behavior of biocomposites prepared from nettle and poly(lactic acid) fibers: Modeling & experiment, Compos. Part B Eng. 138 (2018) 113–121. https://doi.org/10.1016/j.compositesb.2017.11.019. [235] N. Sebaibi, M. Benzerzour, N.E. Abriak, C. Binetruy, Mechanical properties of concrete-reinforced fibres and powders with crushed thermoset composites: The influence of fibre/matrix interaction, Constr. Build. Mater. 29 (2012) 332–338. https://doi.org/10.1016/j.conbuildmat.2011.10.026. [236] H.C. Tseng, R.Y. Chang, C.H. Hsu, Numerical prediction of fiber orientation and mechanical performance for short/long glass and carbon fiber-reinforced composites, Compos. Sci. Technol. 144 (2017) 51–56. https://doi.org/10.1016/j.compscitech.2017.02.020. [237] F. Chegdani, B. Takabi, M. El Mansori, B.L. Tai, S.T.S. Bukkapatnam, Effect of flax fiber orientation on machining behavior and surface finish of natural fiber reinforced polymer composites, J. Manuf. Process. 54 (2020) 337–346. https://doi.org/10.1016/j.jmapro.2020.03.025. [238] B. Zhou, Y. Uchida, Relationship between fiber orientation/distribution and post-cracking behaviour in ultra-high-performance fiber-reinforced concrete (UHPFRC), Cem. Concr. Compos. 83 (2017) 66–75. https://doi.org/10.1016/j.cemconcomp.2017.07.007. [239] B. Boulekbache, M. Hamrat, M. Chemrouk, S. Amziane, Flowability of fibre-reinforced concrete and its effect on the mechanical properties of the material, Constr. Build. Mater. 24 (2010) 1664–1671. https://doi.org/10.1016/j.conbuildmat.2010.02.025. [240] Kamesware, Effectiveness of random fibers in composite, Cem. Concr. Res. 9 (1979) 685–693. [241] S.W. Jung, S.Y. Kim, H.W. Nam, K.S. Han, Measurements of fiber orientation and elastic-modulus analysis in short-fiber-reinforced composites, Compos. Sci. Technol. 61 (2001) 107–116. https://doi.org/10.1016/S0266-3538(00)00200-1. [242] A. Mudadu, G. Tiberti, F. Germano, G.A. Plizzari, A. Morbi, The effect of fiber orientation on the post-cracking behavior of steel fiber reinforced concrete under bending and uniaxial tensile tests, Cem. Concr. Compos. 93 (2018) 274–288. https://doi.org/10.1016/j.cemconcomp.2018.07.012. [243] C. Eberhardt, A. Clarke, M. Vincent, T. Giroud, S. Flouret, Fibre-orientation
References
BUI Thi Thu Huyen P a g e | 180
measurements in short-glass-fibre composites — II : a quantitative error estimate of the 2D image analysis technique, 61 (2001) 1961–1974. [244] M.G. Alberti, A. Enfedaque, J.C. Gálvez, On the prediction of the orientation factor and fibre distribution of steel and macro-synthetic fibres for fibre-reinforced concrete, Cem. Concr. Compos. 77 (2017) 29–48. https://doi.org/10.1016/j.cemconcomp.2016.11.008. [245] B. Boulekbache, M. Hamrat, M. Chemrouk, S. Amziane, Flowability of fibre-reinforced concrete and its effect on the mechanical properties of the material, Constr. Build. Mater. 24 (2010) 1664–1671. https://doi.org/10.1016/j.conbuildmat.2010.02.025. [246] B. Li, Q. Wang, D. Duan, J. Chen, Using grey intensity adjustment strategy to enhance the measurement accuracy of digital image correlation considering the effect of intensity saturation, Opt. Lasers Eng. 104 (2018) 173–180. https://doi.org/10.1016/j.optlaseng.2017.08.006. [247] T. Hua, H. Xie, S. Wang, Z. Hu, P. Chen, Q. Zhang, Optics & Laser Technology Evaluation of the quality of a speckle pattern in the digital image correlation method by mean subset fluctuation, Opt. Laser Technol. 43 (2011) 9–13. https://doi.org/10.1016/j.optlastec.2010.04.010. [248] H. Khatami, A. Deng, M. Jaksa, Computers and Geotechnics An experimental study of the active arching effect in soil using the digital image correlation technique, Comput. Geotech. 108 (2019) 183–196. https://doi.org/10.1016/j.compgeo.2018.12.023. [249] I. Paegle, G. Fischer, Evaluation of test methods used to characterize fiber reinforced cementitious composites, (n.d.). [250] M. Ali, X. Li, N. Chouw, Experimental investigations on bond strength between coconut fibre and concrete, Mater. Des. (2013). https://doi.org/10.1016/j.matdes.2012.08.038. [251] F. Deschner, F. Winnefeld, B. Lothenbach, S. Seufert, P. Schwesig, S. Dittrich, F. Goetz-neunhoeffer, J. Neubauer, Cement and Concrete Research Hydration of Portland cement with high replacement by siliceous fl y ash, Cem. Concr. Res. 42 (2012) 1389–1400. https://doi.org/10.1016/j.cemconres.2012.06.009. [252] L. Black, K. Garbev, I. Gee, Surface carbonation of synthetic C-S-H samples : A comparison between fresh and aged C-S-H using X-ray photoelectron spectroscopy, Cem. Concr. Res. 38 (2008) 745–750. https://doi.org/10.1016/j.cemconres.2008.02.003. [253] J. Li, Q. Yu, H. Huang, S. Yin, Effects of Ca/Si ratio, aluminum and magnesium on the carbonation behavior of calcium silicate hydrate, Materials (Basel). 12 (2019). https://doi.org/10.3390/ma12081268. [254] L. Fernández-Carrasco, D. Torréns-Martín, S. Martínez-Ramírez, Carbonation of ternary building cementing materials, Cem. Concr. Compos. 34 (2012) 1180–1186. https://doi.org/10.1016/j.cemconcomp.2012.06.016. [255] D. Zhang, D. Xu, X. Cheng, W. Chen, Carbonation resistance of sulphoaluminate cement-based high performance concrete, J. Wuhan Univ. Technol. Mater. Sci. Ed. 24 (2009) 663–666. https://doi.org/10.1007/s11595-009-4663-y.
References
BUI Thi Thu Huyen P a g e | 181
[256] J. Kleib, G. Aouad, G. Louis, M. Zakhour, M. Boulos, A. Rousselet, D. Bulteel, The use of calcium sulfoaluminate cement to mitigate the alkali silica reaction in mortars, Constr. Build. Mater. 184 (2018) 295–303. https://doi.org/10.1016/j.conbuildmat.2018.06.215. [257] N.I. Fattuhi, Carbonation of concrete as affected by mix constituents and initial water curing period, Mater. Struct. 19 (1986) 131–136. https://doi.org/10.1007/BF02481757. [258] H. Bui, N. Sebaibi, M. Boutouil, D. Levacher, Determination and Review of Physical and Mechanical Properties of Raw and Treated Coconut Fibers for Their Recycling in Construction Materials, Fibers. 8 (2020) 37–55. https://doi.org/10.3390/fib8060037. [259] V. Rostami, Y. Shao, A.J. Boyd, Z. He, Microstructure of cement paste subject to early carbonation curing, Cem. Concr. Res. 42 (2012) 186–193. https://doi.org/10.1016/j.cemconres.2011.09.010. [260] M. Stefanoni, U. Angst, B. Elsener, The mechanism controlling corrosion of steel in carbonated cementitious materials in wetting and drying exposure, Cem. Concr. Compos. 113 (2020) 103717. https://doi.org/10.1016/j.cemconcomp.2020.103717. [261] A.A. Arslan, M. Uysal, A. Yılmaz, M.M. Al-mashhadani, O. Canpolat, F. Şahin, Y. Aygörmez, Influence of wetting-drying curing system on the performance of fiber reinforced metakaolin-based geopolymer composites, Constr. Build. Mater. 225 (2019) 909–926. https://doi.org/10.1016/j.conbuildmat.2019.07.235. [262] Z. Zhou, X. Cai, D. Ma, L. Chen, S. Wang, L. Tan, Dynamic tensile properties of sandstone subjected to wetting and drying cycles, Constr. Build. Mater. 182 (2018) 215–232. https://doi.org/10.1016/j.conbuildmat.2018.06.056. [263] J. Li, F. Xie, G. Zhao, L. Li, Experimental and numerical investigation of cast-in-situ concrete under external sulfate attack and drying-wetting cycles, Constr. Build. Mater. 249 (2020) 118789. https://doi.org/10.1016/j.conbuildmat.2020.118789. [264] W. Tang, S. Li, Y. Lu, Z. Li, Combined effects of wetting–drying cycles and sustained load on the behaviour of FRP-strengthened RC beams, Eng. Struct. 213 (2020) 110570. https://doi.org/10.1016/j.engstruct.2020.110570. [265] A. Dehestani, M. Hosseini, A.T. Beydokhti, Effect of wetting–drying cycles on mode I and mode II fracture toughness of sandstone in natural (pH = 7) and acidic (pH = 3) environments, Theor. Appl. Fract. Mech. 107 (2020) 102512. https://doi.org/10.1016/j.tafmec.2020.102512. [266] Y. Zhang, J. Chang, J. Ji, AH3 phase in the hydration product system of AFt-AFm-AH3 in calcium sulfoaluminate cements: A microstructural study, Constr. Build. Mater. 167 (2018) 587–596. https://doi.org/10.1016/j.conbuildmat.2018.02.052. [267] P. Li, X. Gao, K. Wang, V.W.Y. Tam, W. Li, Hydration mechanism and early frost resistance of calcium sulfoaluminate cement concrete, Constr. Build. Mater. 239 (2020) 117862. https://doi.org/10.1016/j.conbuildmat.2019.117862. [268] H. Bui, M. Boutouil, N. Sebaibi, D. Levacher, Effect of coconut fibers on the
References
BUI Thi Thu Huyen P a g e | 182
mechanical properties of mortars, in: 3rd Int. Conf. Bio-Based Build. Mater., 2019: pp. 300–307. [269] M. García-Maté, A.G. De La Torre, L. León-Reina, M.A.G. Aranda, I. Santacruz, Hydration studies of calcium sulfoaluminate cements blended with fly ash, Cem. Concr. Res. 54 (2013) 12–20. https://doi.org/10.1016/j.cemconres.2013.07.010. [270] J. Tang, H. Cheng, Q. Zhang, W. Chen, Q. Li, Development of properties and microstructure of concrete with coral reef sand under sulphate attack and drying-wetting cycles, Constr. Build. Mater. 165 (2018) 647–654. https://doi.org/10.1016/j.conbuildmat.2018.01.085. [271] M. Mehta, Concrete microstructure, properties and materials, n.d.
Standards
BUI Thi Thu Huyen P a g e | 183
STANDARDS
ASTM C1018 (2006): Standard test method for flexural toughness and first-crack strength of fibre-reinforced concrete (using beam with third-point loading). ASTM C1557 (1997): Standard test method for tensile strength and Young's modulus of fibres. ASTM C1185 (2003): Standard test methods for sampling and testing non-asbestos fibre-cement flat sheet, roofing and siding shingles, and slap boards. ASTM C1186 (2016): Standard specification for flat fibre-cement sheets. ASTM D4843 (2016): Standard test method for wetting and drying test of solid wastes. ASTM C109/C109M (2016): Standard test method for compressive strength of hydraulic cement mortars (Using 2-in. or [50-mm] cube specimens). ASTM D4972 (2003): Standard test method for pH of soils. NF EN 196-1 (2006): Methods of testing cement - Determination of strength. NF EN 196-3 (2009): Methods of testing cement - Determination of setting times and soundness. NF EN 196-6 (2012): Methods of testing cement - Determination of fineness. NF EN 196-7 (2012): Methods of testing cement - Methods of taking and preparing samples of cement.
Standards
BUI Thi Thu Huyen P a g e | 184
NF EN 196-9 (2010): Methods of testing cement - Heat of hydration - Semi-adiabatic method. NF EN 1015-3 (1999): Methods of test for mortar for masonry – Determination of consistency of fresh mortar (by flow table). NF EN ISO 665 (2020): Oilseeds - Determination of moisture and volatile matter content. NF EN 12390-10 (2018): Testing hardened concrete - Determination of the carbonation resistance of concrete at atmospheric levels of carbon dioxide. NF EN 12390-12 (2020): Testing hardened concrete - Determination of the carbonation resistance of concrete - Accelerated carbonation method. NF EN 13295 (2004): Products and systems for the protection and repair of concrete structures - Determination of resistance to carbonation. NF EN 12087 (2013): Thermal insulating products for building applications - Determination of long-term water absorption by immersion. XP P 18-458 (2008): Accelerated carbonation test - Measurement of the thickness of carbonated concrete.
Appendix
BUI Thi Thu Huyen P a g e | 185
APPENDIX
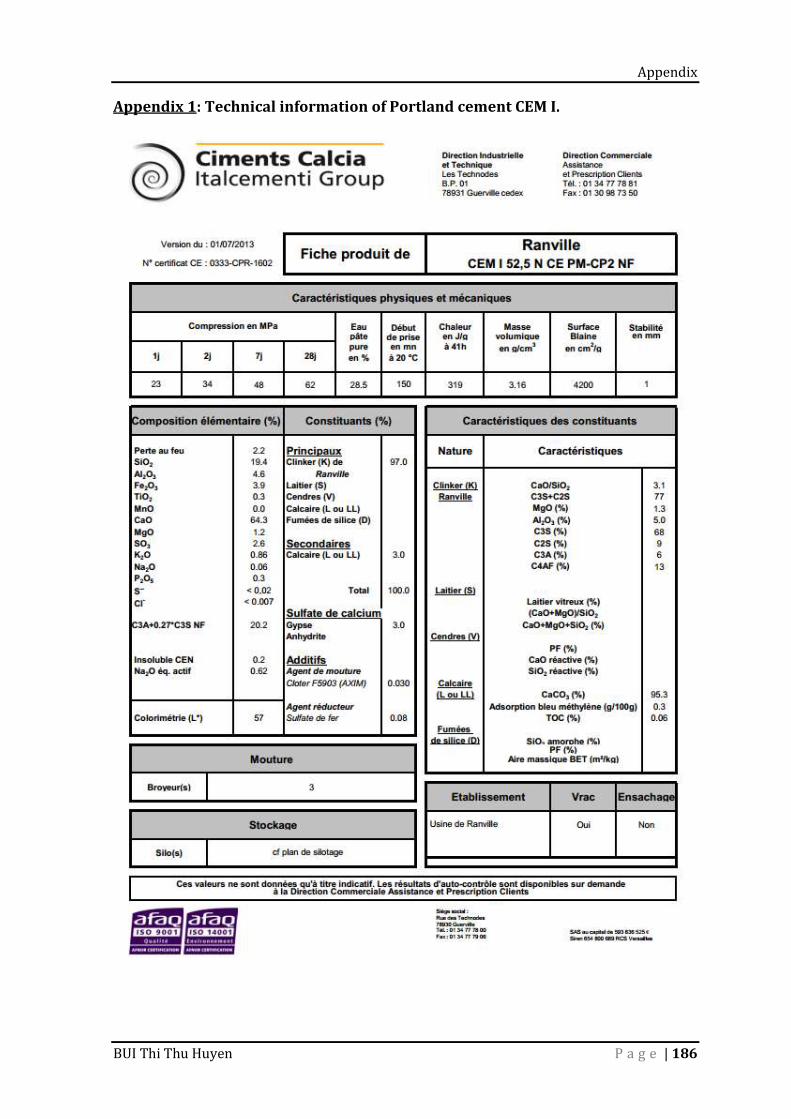
Appendix
BUI Thi Thu Huyen P a g e | 186
Appendix 1: Technical information of Portland cement CEM I.
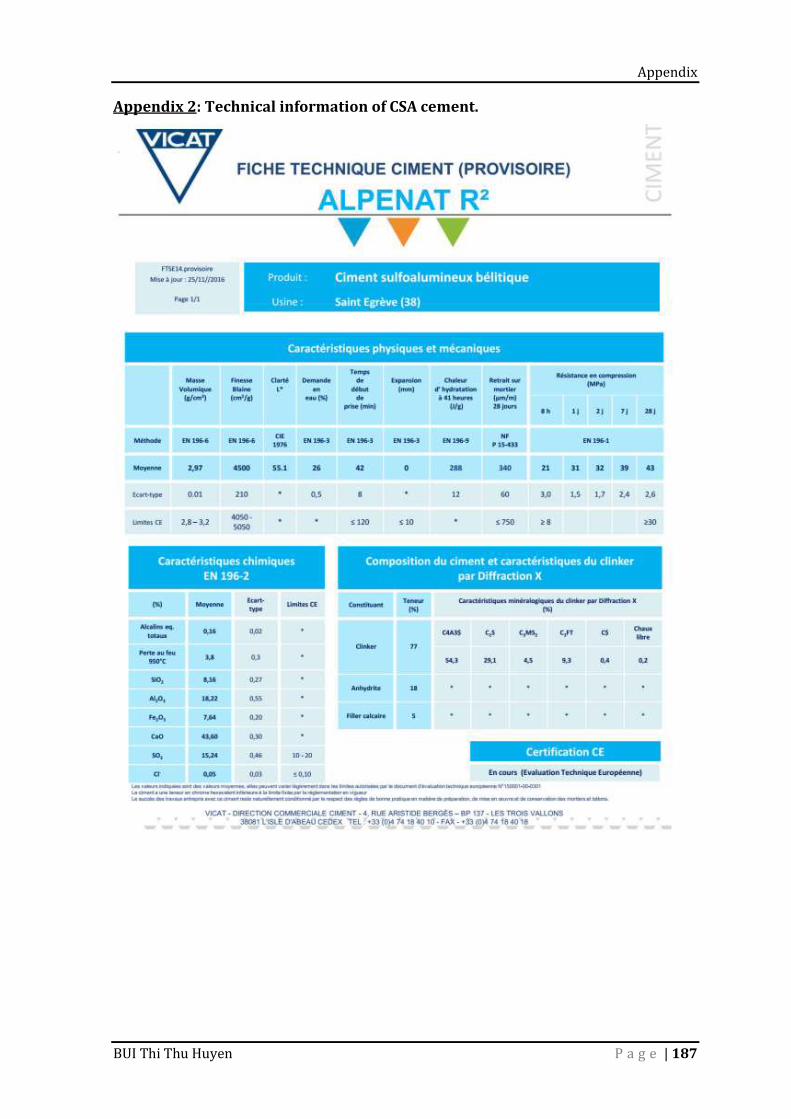
Appendix
BUI Thi Thu Huyen P a g e | 187
Appendix 2: Technical information of CSA cement.
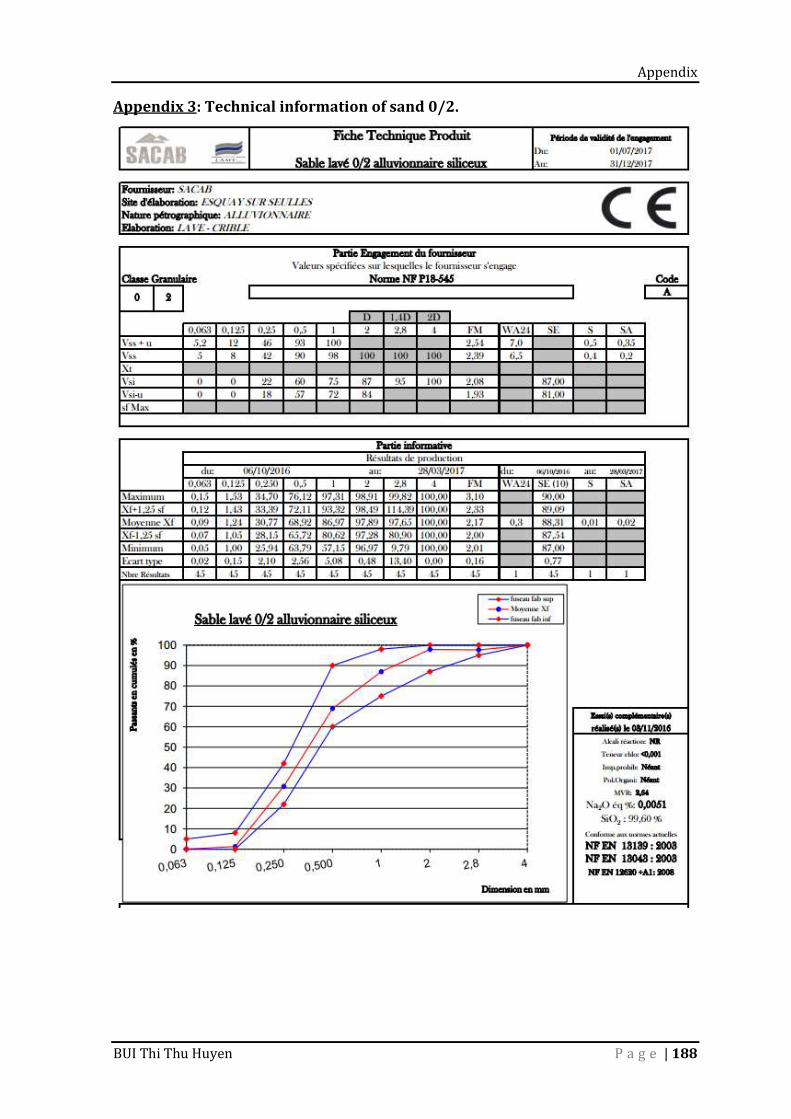
Appendix
BUI Thi Thu Huyen P a g e | 188
Appendix 3: Technical information of sand 0/2.
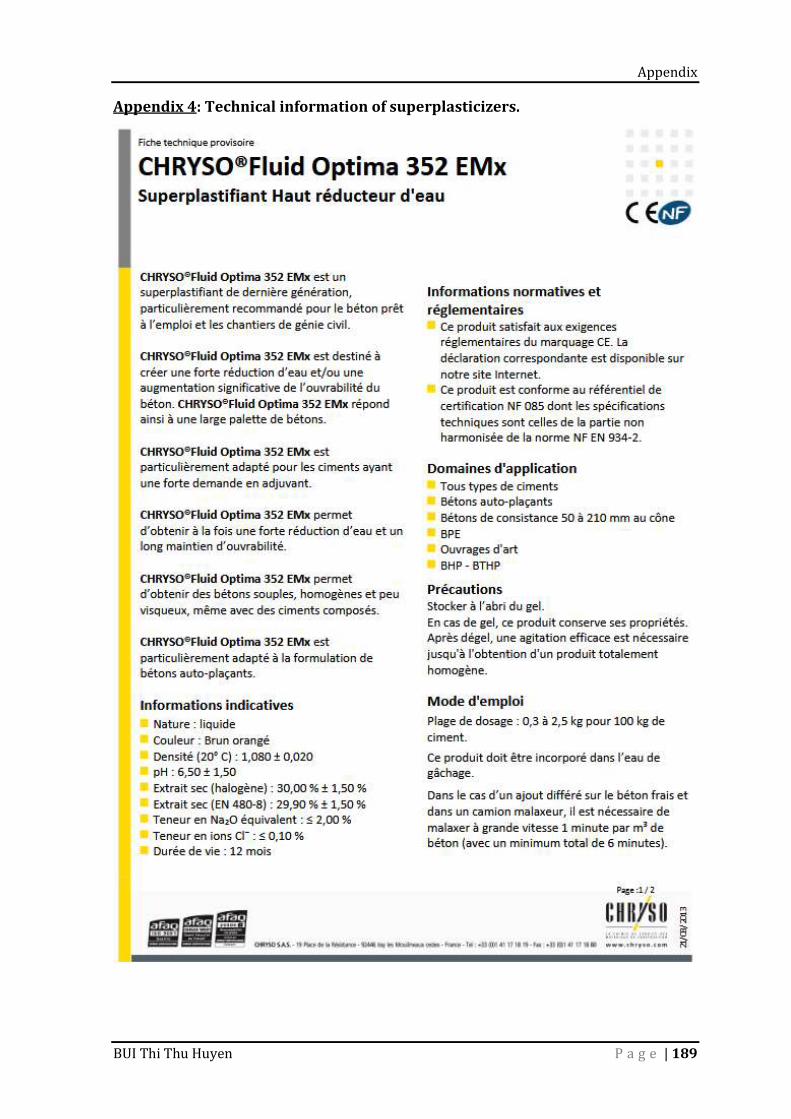
Appendix
BUI Thi Thu Huyen P a g e | 189
Appendix 4: Technical information of superplasticizers.
List of publication
BUI Thi Thu Huyen P a g e | 190
LIST OF PUBLICATIONS
Chapter 1: - Huyen Bui, Mohamed BOUTOUIL, Dang Hanh NGUYEN, Nassim SEBAIBI,
A simple review of using coconut fibre as reinforcement in composite, in Proceedings of the 8th International Conference of Asian Concrete Federation (ACF 2018), Sustainability and Innovation in Concrete Material and Structures, Fuzhou, China, November 2018. - Léo Saouti, Daniel Levacher, Nathalie Leblanc, Hafida Zmamou, Huyen
Bui, Irini Djeran-Maigre, Andry Razakamanantsoa, Mazhar Hussain, Mechanical tensile behavior of tropical waste fibres, in Proceedings of the 3rd Euromaghreb Conference, Sustainability and Bio based Materials on the Road of Bioeconomy, Rouen, France, October 2020.
Chapter 3:
- Huyen Bui, Nassim Sebaibi, Mohamed Boutouil, Daniel Levacher, Determination, and review of physical and mechanical properties of raw and treated coconut fibres for their recycling in construction materials, Fibres, Volume 8, Issue 6, 2020, DOI: 10.3390/fib8060037
List of publication
BUI Thi Thu Huyen P a g e | 191
Chapter 4:
- Huyen BUI, Mohamed BOUTOUIL, Nassim SEBAIBI, Daniel LEVACHER, Effect of coconut fibres on the mechanical properties of mortars, in Proceedings of 3rd International Conference on Bio-Based Building Materials, Belfast, UK, June 2019.
- Huyen BUI, Mohamed BOUTOUIL, Nassim SEBAIBI, Daniel LEVACHER, Behavior of fibres reinforced mortar: Cracks formation, distribution, and orientation of fibres (under review in Engineering Structures Journal).
Chapter 5:
- Huyen BUI, Mohamed BOUTOUIL, Daniel LEVACHER, Nassim SEBAIBI, Evaluation of the influence of accelerated carbonation on the microstructure and mechanical characteristics of coconut fibre-reinforced cementitious matrix, Journal of Building Engineering, Volume 39, February 2021, DOI: 10.1016/j.jobe.2021.102269.
- Huyen BUI, Mohamed BOUTOUIL, Nassim SEBAIBI, Daniel LEVACHER, Effects of wetting and drying cycles on microstructure and mechanical properties of coconut fibres-reinforced mortar composite. (under review in Magazine of Concrete Research).