study on growth, flowering and carotenoids …singh netam, my elder sister-sister in law,madhunetam...
TRANSCRIPT

STUDY ON GROWTH, FLOWERING AND
CAROTENOIDS CONTENT OF AFRICAN MARIGOLD
(Tageteserecta) UNDER CHHATTISGARH PLAINS AGRO-
CLIMATIC CONDITION
M.Sc. (Hort.)Thesis
By
MANISHA NETAM
DEPARTMENT OF FLORICULTURE AND LANDSCAPE
ARCHITECTURE
COLLEGE OF AGRICULTURE
INDIRA GANDHI KRISHI VISHWAVIDYALAYA
RAIPUR (Chhattisgarh)
2017

STUDY ON GROWTH, FLOWERING AND
CAROTENOIDS CONTENT OF AFRICAN MARIGOLD
(Tageteserecta) UNDER CHHATTISGARH PLAINS AGRO-
CLIMATIC CONDITION
M.Sc. (Hort.)Thesis
Submitted to the
Indira Gandhi KrishiVishwavidyalaya, Raipur
by
ManishaNetam
IN PARTIAL FULFILMENT OF THE REQUIREMENTS
FOR THE DEGREE OF
Master of Science
in
(Horticulture)
College ID -120115187U.E. ID -20151622601
JULY, 2017


iii
ACKNOWLEDGMENTS
I feel great pride in expressing about my academic journey with deepest sense of
gratitude and sincere thanks to those people who gave their contribution. It was their
blessings showered on me that I travelled the academic path with ease and reached to this
end
Words fail to express my humble gratitude, appreciation, reverence and sense of
indebtedness to my major advisor Dr. Gaurav Sharma, Assistant Professor, Department
of Floriculture and Landscape Architecture, College of Agriculture, Raipur whose
unimpeachable and incessant guidance, creative thoughts and plentiful encouragement in
spite of all his multifarious responsibilities, helped me to accomplish the research
successfully.
My co-advisor, Dr. NeerajShukla, Professor and Head, Department of Floriculture and
Landscape Architecture, College of Agriculture, IGKV, Raipur, (C.G.), has been always
there to listen and give advice. I am deeply grateful to him for the long discussions that
helped me sort out the technical details of my work. Dr. S.K. Nair, Assistant Professor,
Department of Genetics and plant Breeding and Dr. D. Khokhar, Assistant Professor,
Department of Plant Physiology, insightful comments and constructive criticisms at
different stages of my research were thought-provoking and they helped me focus my
ideas. I am grateful to him for holding me to a high research standard and enforcing
strict validations for each research result, and thus teaching me how to do research.
I wish to express my cordial thanks to Dr. Ravi R. Saxena Professor, Department of
Agricultural Statistics and Social Science (Language), who is one of the best teachers that
I have had in my life. He sets high standards for his students and he encourages and
guides them to meet those standards. He introduced me to Statistical Logic and his
teachings inspired me to work on this dissertation. I am indebted to him for his
continuous encouragement and guidance.
Particularly, I would like to acknowledge Dr. L.S. Verma and Dr. T. Tirkey, Assistant
Professor, Department of Floriculture and Landscape Architecture.
I pay my sincere thanks to Harsh bhaiya, Radhebhaiya, Karanbhaiya, Shekharbhaiya,
Manojbhaiya, Gautambhaiyaand all other non-teaching staff of Department of
Floriculture and Landscape Architecture for timely cooperation and help during the
entire research work.
I would like to express my sincere gratitude to Dr. MadhavPandey (Librarian, Nehru
Library, Raipur) for giving me there kind help during my present study.
I wish to record my grateful thanks to Dr. S.K. Patil, Hon’ble Vice Chancellor, Dr. O.P.
Kashyap Dean, College of Agriculture, Dr. S.S. Rao, Director Research Services, Dr.
M.P. Thakur,DirectorServices,Dr.S.S. Sa, Director of Instructions and Dr. G.K.

iv
Shrivastava, Dean Student Welfare IGKV, Raipur for providing necessary facilities
technical and administrative supports for conductance of this research work.
No words can felicity unveils the feeling of recourse, foster and supportive received from
family and friends. I would like to grateful to my friends and family who has supported me
either directly or indirectly are praiseworthy. From the depth of my heart, I owe
everything to my beloved family my mother – father, Mrs. TriveniNetam and Mr.Chetan
Singh Netam, my elder sister-sister in law,MadhuNetam and Kundan Singh Dhruw, my
loving brothers Rupendra and Deependra who have been the imperative cause of
incentive and having faith that aid me becoming better and all are rooting for me
throughout my work. This thesis would not have been accomplish in a approving way
without the kith and kin fondness, strong willed, forego, coddle backing, scrupulous
thanksgiving and blessings of the biggest asset of my life.
I am pleased to thank to my workmate/compatriot for their succor, backing and stand
shoulder to shoulder with me AbhilashShuklawho have done me a great service. I would
like to thanks my seniors VikasRamteke Sir,SushilKashyap Sir, JitendraSahu Sir.I cannot
forget friends who went through hard times together, cheered me on, and celebrated each
accomplishment: PriyankaKujur,SushmaNetam,RuchiOtti,TanuSahu& Harsh Turkar. I
will miss you all.
In the last but not least I am thankful to the almighty God. Thank you God… please
continue to light my path and let me be a light for anothers.
DATED:
ManishaNetam
Department of Floriculture and Landscape Architecture College of Agriculture, I.G.K.V. Raipur (C.G.)

v
LIST OF CONTENTS
Chapter No. Title Page (s)
No.
CERTIFICATE – I I
CERTIFICATE – II II
ACKNOWLEDMENT III
TABLE OF CONTENTS IV
LIST OF TABLES V
LIST OF FIGURES VI
LIST OF PLATES VII
LIST OF ABBREVIATIONS VIII
ABSTRACT IX
I INTRODUCTION 1
II REVIEW OF LITERATURE 3
2.1 Growth and flowering attributes 3
2.2 Xanthophyll yieid and its attributes 7
III MATERIALS AND METHODS 13
3.1 Geographical Situation 13
3.2 Experimental Site and Season 13
3.3 Weather condition 14
3.4 Soil characteristics of the experimental field 14
3.5 Design and layout of experiment 16
3.6 Cultural operations 21
3.6.1 Raising of seedlings 21
3.6.2 Field preparation 21
3.6.3 Irrigation 21
3.6.4 Manures and fertilizers 21
3.6.5 Pinching 22
3.6.6 Weeding 22
3.6.7 Plant protection 22
3.7 Observations recorded 22
3.7.1 Observations of vegetative phase 22
3.7.1.1Plant height (cm) 22
3.7.1.2Plant spread (cm) 22
3.7.1.3 Number of primary branches plant-1 22
3.7.1.4 Number of secondary branches plant-1
23
3.7.1.5 Number of leaves plant-1
23
3.7.2 Observations of flowering attributes 23

vi
3.7.2.1 Days to first bud appearance 23
3.7.2.2 Days to 50% flowering 23
3.7.2.3 Flower diameter (cm) 23
3.7.2.4 Number of flowers plant-1
23
3.7.2.5 Flower weight plant-1
(g) 23
3.7.2.6 Flower yield (t ha-1
) 23
3.7.2.7 Duration of flowering (days) 24
3.8 Observation on xanthophyll and its
attributes
24
3.8.1 Xanthophyll content kg-1
of petal meal (g) 24
3.8.2 Xanthophyll estimation 24
3.8.3 Apparatus and reagents 24
3.8.4Procedure 24
3.8.4.1 Preparation of solutions 24
3.8.4.2 Hot saponification 25
3.8.4.3 Calculation 25
3.9 Statistical Analysis 27
IV RESULTS AND DISCUSSION 29
4.1 Vegetative growth parameters 29
4.1.1 Plant height (cm) 29
4.1.2 Plant spread (cm) 34
4.1.3 Number of primary branches plant-1
37
4.1.4 Number of secondary branches plant-1
40
4.1.5 Number of leaves plant-1 43
4.2 Flowering attributes, yield and
xanthophylls content
46
4.2.1 Days to first bud appearance 46
4.2.2 Days to 50 per cent flowering 49
4.2.3 Flower diameter (cm) 52
4.2.4 Number of flowers plant-1
55
4.2.5 Flower weight plant-1
(g) 60
4.2.6 Flower yield (t ha) 63
4.2.7 Duration of flowering (days) 66
4.2.8 Xanthophyll content (g kg-1
of petal meal) 69

vii
V SUMMARY AND CONCLUSIONS 72
VI REFERENCES 76
VII APPENDIX 83
V VITA 84

viii
LIST OF TABLES
Table Title
Page
1 Physcio – chemical composition of soil at experimental site 15
2 Treatment details 17
3 Performance of marigold genotypes for plant height (cm) 31
4 Performance of marigold genotypes for plant spread (cm) 35
5 Performance of marigold genotypes for number of primary
branches
38
6 Performance of marigold genotypes for number of seconary
branches plant-1
41
7 Performance of marigold genotypes for number Number of
leaves plant-1
44
8 Performance of marigold genotypes for days to first bud
appearance
47
9 Performance of marigold genotypes for days to 50 %
flowering
50
10 Performance of marigold genotypes for flower diameter (cm) 53
11 Performance of marigold genotypes for number of flowers
plant-1
57
12 Performance of marigold genotypes for flower weight per
plant (g)
61
13 Performance of marigold genotypes for flower yield (t ha-1
) 64
14 Performance of marigold genotypes for duration of flowering
(days) 67
15 Performance of marigold genotypes for xanthophyll content
(g kg-1
of petal meal)
70

ix
LIST OF FIGURES
Figure Title
Page
1 Meteorological details about the weather condition prevailing
during the course of experiment
19
2 Layout of Experimental Field 20
3 Performance of marigold genotypes for plant height (cm) 32
4 Performance of marigold genotypes for plant spread (cm) 36
5 Performance of marigold genotypes for number of primary
branches
39
6 Performance of marigold genotypes for number of seconary
branches plant-1
42
7 Performance of marigold genotypes for numberNumber of
leaves plant-1
45
8 Performance of marigold genotypes for days to first bud
appearance
48
9 Performance of marigold genotypes for days to 50 % flowering 51
10 Performance of marigold genotypes for flower diameter (cm) 54
11 Performance of marigold genotypes for number of flowers
plant-1
58
12 1Performance of marigold genotypes for flower weight per
plant (g)
62
13 Performance of marigold genotypes for flower yield (t ha-1
) 65
14 Performance of marigold genotypes for duration of flowering
(days)
68
15 Performance of marigold genotypes for xanthophyll content (g
kg-1
of petal meal)
71

x
LIST OF PLATES
Plate Title Page
Plate I A view of experimental site 18
Plate II Preparation of solutions and hot saponification 26
Plate III Variation in plant height of different genotypes at 30 DAT 33
Plate IV Variation in plant height of different genotypes at 60 DAT 33
Plate V Diameter of flower in genotype CGSG-2 55
Plate VI Diameter of flower in genotype PBG (check variety) 55
Plate VII Number of flowers plant-1
in CGMS-1 59
Plate VIII Number of flowers plant-1
in PBG (check variety) 59

xi
LIST OF ABBREVIATIONS
% - Per cent
/ - Per
@ - At the rate
MT - Million tones
at par - At equality
C.D. - Critical difference
cm - Centimeter
CV - Coefficient of variation
DAT - Days after transplanting
et al. - Co workers
etc. Excetera
Fig. - Figure
i.e. - That is
g - Gram
Kg Kilogram
NS - Non significant
Var. - Variety
via. - Through
viz. - Namely
SEm±
Anova
-
-
Standard error of mean
Analysis of variance


x
recorded in variety PNG at 60 and 90 DAT. Maximum number of leaves plant-1
was
recorded in genotype CGJS-3 at 30, 60 and 90 DAT.
The earlieast days to first bud appearance was recorded in variety PNG
whereas, the earliest days to fifty % flowering was recorded in check variety PBG.
The genotype CGR-2 recorded maximum flower diameter while maximum flower
weight plant-1
was recorded in CGRJ-1. The variety PA recorded longest duration of
flowering. The maximum number of flowers plant-1
was recorded in the CGMS-1 .
Maximum flower yield was obtained in the genotype CGRJ-1 whereas, the maximum
xanthophyll content was recorded in CGJS-3.


o`f)] iq"iu] mit ,oa tSUFkksfQy dh ekiksa gsrq T;knkrj thu Á:iksa us egRoiw.kZ
fofHkUurk,a n”kkZ;hA ikS/kjksi.k ds 30 fnuksa ckn vf/kdre ikS/k ÅapkbZ thu Á:i lhth,lth-
2 esa ,oa 60 fnuks ckn lhthvkj-2] tcfd ikS/kjksi.k dh 90 fnuksa ckn vf/kdre ikS/ks ÅapkbZ
lhthts,l-4 esa ntZ dh xbZA ikS/kjksi.k ds 60 fnuksa ckn vf/kdre ikS/k QSyko lhthvkj-2
esasa ,oa 90 fnuksa ckn lhthvkjts-1 esasa ntZ dh xbZA ikS/ksjksi.k dh 30 fnuksa ds ckn ÁkFkfed
'kk[kkvksa dh vf/kdre la[;k lhth,lth-2 esa tcfd lhthvkj-3 esa 60 ,oa 90 fnuksa ckn
ik;h xbZ A ikS/kkjksi.k dh 60] 90 fnuksa ds ckn f}rh;d 'kk[kkvksa dh vf/kdre la[;k fdLe
ih,uth esa ik;h xbZA jksi.k ds 30] 60 ,oa 90 fnuksa ckn ifRr;ksa dh vf/kdre la[;k
lhthts,l-3 esa ik;h xbZA
ÁFke iq"Ik dfydk dh lcls de fnukss esa mifLFkfr fdLe ih,uth }kjk de ls de
fnukss esa ntZ dh xbZA iq"iu dh 50 voLFkk lcls igys ihchth ¼ekud Átkfr½ esa ntZ dh
xbZA vf/kdre iq"Ik O;kl thu Á:i lhthvkj-2 esa Ikk;h xbZA vf/kdre iq"i Hkkj
lhthvkjts-1 esa ntZ dh xbZA fdLe iwlk vfiZrk esa iq"iu dh lcls yEch voLFkk ntZ dh
xbZA vf/kdre iq"i la[;k lhths,e,l-1 esa ntZ dh xbZA vf/kdre iq"i mit lhthvkjts-1
esa ik;h xbZ tcfd tSUFkksfQy dh vf/kder ek=k lhthts,l-3 esa ntZ dh xbZA

1
CHAPTER-I
INTRODUCTION
Flowers are associated with mankind from the dawn of civilization. They are
symbol of affection, beauty, friendship and love. They are also used for decoration and
aesthetic purpose and they have tremendous economic value as cut flower, loose
flower, for perfumes and other products. Today floriculture is recognized as a
lucrative business, because of its higher potential per unit area than most of the other
field crops.
Marigold (Tagetes erecta L.) is an immensely popular annual flower
crop widely grown throughout the world. Marigold belongs to the family Compositae
and genus Tagetes. The genus Tagetes comprises about 33 species of which Tagetes
erecta (African marigold) and Tagetes patula (French marigold) are under commercial
cultivation in India. Marigold is native of Central and South America, especially
Mexico. The chromosome number is x = 12 and 2n = 24. The other species introduced
in India are Tagetes signata Linn. Tagetes minuta Linn, Tagetes lucida and Tagetes
tenuifolia. Marigold with its bright colours ranging from yellow to orange is the best
for combination in any colour scheme. In India, marigold ranks first among the loose
flowers followed by chrysanthemum, jasmine, tuberose, and crossandra. The estimated
area under marigold cultivation in India is about 64 thousand ha with a production of
608.97 thousand MT (Anon, 2017). In Chhattisgarh, marigold is cultivated in an area
of 4129 ha with a production of 29 thousand MT (Anon, 2016). It is one of the
dominating flowers which fetches high price in the local market. Marigold has a great
demand as loose flowers, and is widely used for making garlands and for decorative
purposes. It is grown in flower beds, borders and also even as potted plants. It has
gained popularity on account of its easy cultivation, wide adaptability and production
throughout the year. Apart from this, it is widely used as colorant in the food and
animal feed industry.

2
Marigold flower is one of the richest sources of natural carotenoids. It has
gained popularity on account of carotenoids production. Carotenoids are organic
pigments which are naturally occurring in the chloroplast and chromoplats of plants
and some photosynthetic organism like algae. Carotenoids are responsible for the
yellow, orange and red pigment in a large variety of plants.
Orange colour marigold has emerged as rich source of carotenoids pigments
namely xanthophyll, which is widely used as dietary supplement in poultry industry to
enhance the broiler skin colour and egg yolk pigmentation (Naik et al., 2004).
Industrial use of carotenoids extracted from flowers is being used commercially in
pharmaceuticals, food supplements, animal feed additive and as food colorants.
Marigold plants are commercially grown for pigment production in Mexico, Peru and
India (Bose et al, 2002) and in India mostly southern part of the country.
Though potential as well demand of marigold in Chhattisgarh is high, yet low
productivity due to poor yielding ability of genetic populations is one of the major
constraints in its commercial cultivation. The commercial cultivation of marigold with
higher flower yield and carotenoids in general and xanthophylls in particular is the
requirement of the state. Therefore, there is a need to identify varieties/genotypes best
suited for commercial cultivation in the state.
Moreover, in Chhattisgarh state, which is having rich biodiversity, there is a
greater chance to find out marigold genotypes with variations of economic value for
flowering and xanthophylls content.
Keeping these points in view, the present investigation “Study on growth,
flowering and carotenoids content of African marigold (Tagetes erecta L.) under
Chhattisgarh plains agro-climatic condition” was undertaken with the following
objectives:-
1. To study the morphological characters of marigold genotypes
2. To study the performance of different marigold genotypes for growth and
flowering parameters
3. To determine the major carotenoids content in marigold petal extracts

3
CHAPTER - II
REVIEW OF LITERATURE
A brief review of research work done on the growth, flowering, yield and
carotenoids contents in marigold is being discussed in this chapter. It includes brief
results of the research work done in India and elsewhere which is similar to or closely
related with the present investigation. The works on the evaluation of marigold
genotypes for growth, flowering and carotenoids content of African marigold have
been summarized under following heads:
2.1 Growth and flowering attributes
2.2 Xanthophyll yield and its attributes
2.1 Growth and flowering attributes
Howe and Waters (1982) evaluated twenty-two marigold cultivars (Tagetes
spp.) as bedding plants. Information was acquired on the dates when the first floral
bud began to open and was fully open, the heights at different stages of plant
development, flower diameter, disease and insect resistance, growth habit, and
consumer preference.
Kelly and Harbaugh (2002) evaluated eighty four cultivars of African
marigold (Tagetes erecta) and french marigold (T. patula). Cultivars viz., `Inca Gold'
and `Royal Gold' (African marigold), `Disco Granada' (French marigold) and Golden
Boy' and `Hero Gold' (French dwarf-double gold class) were observed to perform well
with similar heat and cold hardiness zones.
Verma et al. (2004) collected twelve genotyopes of T. patula and twenty
genotypes of T. erecta from Uttaranchal, India and evaluated for 9 character traits viz.,
plant height, number of leaves plant-1
, leaf length, leaf width, peduncle length, number
of branches plant-1
, stem diameter, plant canopy and flower diameter. The tallest
plants (208.01 cm) were observed in the genotype NIC-14859, while the shortest plant
was observed in NIC-14839. The highest number of branches plant-1
(25.80) was

4
obtained from NIC-14841. The highest stem diameter was obtained from NIC-14847
(1.81 cm). The plant canopy spread was highest (6855.11 cm) in NIC-14848, while the
lowest was in NIC-14834. The flower diameter (7.67 cm) was maximum in NIC-
14865.
Rao et al. (2005) reported the maximum plant height (84 cm), leaf area (3762
cm2), total dry matter per plant (42.96 g) in ‘Orange Double’ and maximum plant
spread (46.0 cm) and number of branches per plant(20.00) in ‘Hyderabad Local
Selection 1’.
Rao et al. (2005) screened different cultivars of African marigold for yield and
pigments. Better plant growth was found in Orange Double cultivar with the highest
plant height. The cultivar Orange Double gave the highest fresh flower yield with a
total carotenoids yield of 51.07 kg ha-1
. Early flowering was observed in Orange
Double cultivar followed by Pusa Narangi Gainda. Duration of flowering was also
observed to be higher in Orange Double cultivar followed by Pusa Basanti Gainda.
Naik et al. (2005) identified a suitable and stable genotype for higher flower
production of marigold (Targets erecta L.) across the environments. The results of the
stability analysis over three environments (Viz, Kharif 2001-02, Rabi 2001-02 and
Kharif 2002-03 revealed that the genotype, African Marigold Orange (AMO) recorded
significantly higher flower yield (16.47 t/ha) per hectare with a B: C ratio of 3.28 as
compared to the local check (Orange Double).
Singh and Singh (2006) evaluated performance of twenty nine genotypes of
African marigold (Tagetes erecta Unn.) and reported significant variation in
germplasm for all the growth and flowering parameters. The germplasm TEG16
exhibited best performance on number of primary branches plant-1
, number of flowers
plant-1
and dry weight of leaf. However, germplasm TEG17 resulted in maximum
flower longevity and dry weight of flower, whereas maximum duration of flowering
was recorded with TEG13. Germplasm TEG23 exerted poorest performance on
various growth and flowering attributes.
Verma and Beniwal (2006) evaluated thirty two marigold genotypes for their
resistance to the root knot nematode. No susceptible or highly susceptible reaction was

5
observed in any of the genotypes, including the local control (Pusa Narangi). Eight
genotypes (MGH-126, MGH-127, MGH-131, MGH-138, MGH-141, MGH-154,
MGH-159 and MGH-160) exhibited moderate resistance. Only one genotype, i.e.
MGH-136, was highly resistant to the root knot nematode.
Singh and Mishra (2008) conducted an experiment to assess the diversity of
forty five genotypes of marigold (Tagetes spp.). Marigold germplasm exhibited
significant variation for various growth parameters. Cross 'Sutton Orange' x
'Crackerjack Mix' recorded maximum plant height (127.80 cm), whereas parent
'French Dwarf' attained maximum plant spread and maximum secondary branches
plant-1
(76.61 cm and 107.40). 'Pusa Narangi Gainda' x 'Late Summer' attained the
maximum flower diameter (13.00), flower yield ha-1
(182.13 ha-1
). Cross 'Seraceul' x
'Late Summer' exhibited the maximum duration for flowering (134.00 days) in the first
year and cross 'Pusa Narangi Gainda' x 'French Dwarf' attained the longest flowering
duration (132.33 days) in the second year.
Narsude et al. (2010) reported significant variations for different growth and
yield attributes. The genotype Pakharsangavi Local had significantly maximum plant
height (114.64 cm) and stem girth (5.37 cm). Maximum spread of plant (64.48 cm)
was observed in genotype Tuljapur Local-2, number of flowers per plant, yield plant-1
and yield hectare-1
. The genotype Tuljapur Local –1 showed significantly superior
performance. The genotype Marigold Orange Bunch required maximum days (109.67)
to last picking and duration of flowering was also longer (56.33 days) in this genotype.
Raghuvanshi and Sharma (2011) evaluated french marigold cultivars and
recorded highly significant variation among cultivars for all the traits studied. Cultivar
Safari Queen recorded maximum plant height (35.80 cm), flower yield/sq2 meter (8.27
kg), seed yield per plant (0.54g), and seed yield/sq2 meter (9.06g). Plant spread (30.37
cm) was recorded maximum in ‘Harmony Boy’. The ‘Bonanza Bolero’ recorded
maximum values for three traits viz. leaf area (34.58 cm2).flower diameter (5.26 cm)
and 1000-seed weight (2.60g). Maximum carotene content of 3747.50 μg/g was
obtained in cv. ‘Honey Comb’ which was at par with cv. ‘Hero Harmony’
(3745.83μg/g).

6
Anuja and Jahnavi (2012) studied genetic variability and heritability involving
thirty genotypes of French marigold and indicated that there were highly significant
differences between the genotypes for flower yield and other growth and flower
attributes.
Krol (2012) evaluated five genotypes of pot marigold which differed in colour
and in size of inflorescences viz., ‘Orange King’, ‘Persimmom Beauty’ ‘Promyk’,
‘Radio’ and ‘Santana’. For, morphological features ‘Orange King’ performed best. It
produced the most numerous and shapeliest inflorescences, with the biggest number of
ligulate flowers. Raw material yield of compared cultivars oscillated from 849 to 1661
kg ha-1
of flower heads, and the ligulate flowers themselves from 449 to 1141 kg ha-1
.
In both cases the highest yield was obtained by ‘Orange King’, and the lowest by
‘Promyk’.
Munikrishnappa et al. (2013) conducted an investigation to evaluate suitable
varieties for growth and flower yield of China aster. The maximum flower yield
(37.91 t ha-1
) was recorded in ‘Phule Ganesh White’and it was lowest variety Local
(9.97 ton). Number of cut flower production was maximum (55.43) in ‘Phule Ganesh
Violet’ and the lowest number of cut flower plant-1
was produced in Shashank (40.92).
The maximum number of cut flowers (40.76 lakh ha-1
) was recorded in ‘Phule Ganesh
Violet’ and minimum number of cut flower (31.64 lakh ha-1
) was recorded in
‘Kamini’.
Bharathi and Jawaharlal (2014) evaluated twenty eight genotypes of African
marigold (Tagetes erecta L.) for growth and flowering traits. The marigold germplasm
exhibited significant variation for various growth and flowering traits. The earliest day
taken for flower bud appearance was found in ‘Bangalore Local Tall’ (29.47 days) and
earliest flower bud opening was observed in Double Orange (46.00 days). The highest
plant height was recorded in Dharmapuri local (113.27 cm) and the highest number of
primary and secondary branches plant-1
was observed in ‘Bidhan-1’ (22.40 and 41.47
respectively). The highest flower yield per plant was recorded in ‘Coimbatore Local
Orange’ (1.48kg) followed by ‘Coimbatore local orange’ (1.12 kg).

7
Choudhary et al. (2014) evaluated thirty genotypes of marigold. All the
genotypes showed significant variations for growth, flowering and yield parameters.
The genotype ‘Hisar Jaffri-2’ exhibited best performance in terms plant spread (77.72
cm), numbers of secondary branches plant-1
(150.97), number of buds plant-1
(217.10),
duration of flowering (76.53 days) and flower yield plot-1
(20.99 kg). The genotype
MGH-148-3-3 recorded maximum stem diameter (2.14 cm) and dry weight of plant
(130.72 g), whereas it was minimum (0.61 cm and 9.91 g, respectively) in ‘Hisar
Beauty’. Maximum diameter of flower (8.21cm) was recorded in ‘MGH-09-276’,
while it was minimum (4.01 cm) in ‘Hisar Jaffri-2’. The maximum dry weight of
flower (2.04 g) was recorded in ‘MGH-09-271’.
Sahu (2016) evaluated seventeen genotypes of African marigold (Tagetes
erecta L.) for Variability, heritability and genetic advance and reported significant
vatiation in germplasm for all the growth and flowering parameters.
Manik and Sharma (2016) evaluated fifteen genotypes of African marigold
(Tagetes erecta L.) for yield attributes and xanthophyll content. All the genotypes
showed variations for growth and yield parameters. Maximum plant height was
recorded in the genotype CGSG-1 at 30 and 60 DAT whereas in genotype CGJS-1 at
90 DAT. Maximum plant spread and primary branches plant-1
was recorded in the
genotype CGSG-1. Whereas, maximum number of secondary branches plant-1
at 60
and 90 DAT was recorded in CGRJ-1. Maximum number of flowers plant-1
, flower
yield plot-1
and flower yield ha-1
was observed in genotype CGSG-1.
2.2 Xanthophyll yield and its attributes
Gregory et al. (1986) used high performance liquid chromatography to analyze
the lutein esters in Marigold flowers (Tagetes erecta). Result showed that the lutein
ester concentrations in fresh Marigold flowers varied from 4 pg g-1
in greenish yellow
flowers to 800 pg g-1 in orange brown flowers.
El-saeid et al. (1996) recorded the maximum carotenoid content, volatile oil
and biomass yield with the application of 238 kg N ha-1
in Tagetes patula.

8
Vargas and Lopez (1997) conducted an experiment to study the identity of
lutein isomers of marigold (Tagetes erecta) samples treated with enzymes. Enzymatic
treatment on 5% solids slurry produced the marigold meal with the highest all trans-
lutein content (25.1 g kg-1
) dry weight. The solids content was the principal factor that
affected the carotenoid profiles. An analysis of the distribution showed that 15% solids
gave the highest all-trans-lutein percentage in treated meals. Interestingly, with 20%
solids both the degradation of lutein and the percentage of all-trans-zeaxanthin were
the highest.
Vargas and Lopez (1997) reported that the highest carotenoid yields were
obtained using the enzyme ECONASE-CEP. This enzyme at 0.1% w/w increased
extraction from 1.7 to 7.4 g kg-1
of marigold flower in dry weight and that such
treatment may enhance carotenoid extraction at the industrial level as well.
Naik (2003) reported that, petal meal yield ha-1
and xanthophyll content per
kilogram of petal meal was increased with increase in the level of N and P which was
maximum (22.36gm and 19.90g ka-1
petal meal) at a treatment combination of ‘N’ 250
kg and ‘P’ at 120 kg ha-1
in marigold.
Bolanos et al. (2004) studied the effect of a noncommercial enzyme
preparation on xanthophyll extraction from marigold flower (Tagetes erecta). The
results show that the extraction yield depends directly on the extent of the enzymatic
hydrolysis of cell walls in the flower petals and that it is possible to reach yields in
excess of those previously reported for treatments with commercially available
enzymes (29.3 g kg-1
of dry weight).
Cantrill et al. (2004) reported that lutein, prepared by saponification and
crystallization, contains more than 80% total carotenoids of which lutein is present at
70 – 78 %, zeaxanthin 2 – 9% and other carotenoids are also present. Waxes (14%)
and fatty acids (1%), present in the unprocessed oleoresin, make up the balance of the
material.
Rao et al. (2005) reported that the cultivar ‘Orange Double’ gave the highest
fresh flower yield with a total carotenoids yield of 51.07 kg ha-1
and the cultivar ‘Pusa

9
Narangi Gainda’ produced the highest total carotenoids g-1 of fresh weight of flower
petals followed by ‘Orange Double’.
Kaul and Bedi (2006) conducted a study with eight genotypes of African
marigold for xanthophyll as natural source. The result showed the ranges of
xanthophylls content varaied from 0.76 to 1.42%. Among all the genotypes the highest
xanthophyll (5 kg ha-1
) was found in orange colour genotypes suggesting them use for
commercial production.
Shubha (2006) reported that in marigold, yield components like petal meal
yield, xanthophyll yield ha-1
with maximum net returns were maximum in the
treatment combination of vermicompost (12.5 % N) + poultry manure (12.5 % N) +
Azo along with 75% RDN ha-1
.
Deineka et al. (2007) studied the accumulation of xanthophylls in five cultivars
representing three marigold species including T. erecta (Rhodes and Orange Snow
cultivars), T. patula (Bolero and Harmony) and T. tenuifolia (Red Gem) of marigold
(Tagetes) species and observed that more than 90% of xanthophylls in flowers are
retained upon drying and the content of lutein diesters in the dry material can exceed
15 mg g-1
.
Li et al. (2007) analyzed eleven Chinese cultivars of marigold to determine
their major phytochemical contents and antioxidant activities. The different cultivars
of marigold showed considerable variations in their lutein ester contents, ranging from
161.0 to 611.0 mg per 100 g of flower (dry basis). The different cultivars of marigold
also showed marked variations in total phenols and flavonoids.
Singh et al. (2008) estimated carotenoids and its fractions in six promising
genotypes of African marigold (Tagetes erecta) followed by effect of grading of
flowers and harvesting stage on recovery of total carotenoids and its fractions, i.e.
carotene, mono-hydroxy pigment (MHP) and di-hydroxy pigment (DHP) including
dry matter and moisture content. The flowers from each genotype were harvested at
two different stages, i.e. half-bloom and full-bloom. Half-bloom flowers contain more
amount of pigment than full-bloom in all the genotypes. However, ‘Pusa Narangi
Gainda’ showed maximum recovery of total carotenoids and di-hydroxy pigment,

10
while Selection-19 and Selection-22 had the maximum carotene and mono-hydroxy
pigment respectively at half bloom stage. Large flower gave maximum recovery of
pigments than small flowers in all the genotypes. Maximum recovery of total
carotenoids and DHP was found in ‘Pusa Narangi Gainda’.
Ma et al. (2008) extracted lutein esters from marigold (Tagetes erecta L.). The
results showed that the maximum yield of lutein esters was 1263.62 mg 100 g-1
marigold.
Pratheesh et al. (2009) studied the raw sample of marigold flower with two set
(A1 & A2) - one stored without preservation and the other with proper preservation
technique. For processing, the full-blown marigold flowers having minimum calyx
portion are taken and then laden in a room. Chromatographical separation of
saponified and unsaponified oleoresin were performed and Trans-Lutin identified as
the major constituent. Well-preserved flowers emphasizing the significance of flower
preservation in the extraction of xanthophylls. The stability and amount of
xanthophylls also increased from 105.19 g kg-1
to 226.88 g kg-1
on saponification and
subsequent purification with Ethylene Dichloride.
Bhattacharyya et al. (2010) analyzed three different cultivars of marigold
flowers (Tagetes patula L.) (Marigold orange, Marigold yellow, and Marigold red) for
the lutein ester contents, and the in vitro antioxidative activities of the flower extracts
were compared. Result showed that the marigold orange (MGO) variety contains the
maximum amount of lutein.
Ahmad et al. (2011) studied the effects of various NPK levels on growth,
flowering and xanthophyll contents of African marigold (Tagetes erecta, ‘Double
Eagle’) and French marigold (Tagetes patula, ‘Yellow’). Result showed the
xanthophyll contents were higher in plants fertilized with 15:20:10 g m-2 NPK
application.
Sujith et al. (2012) conducted supercritical fluid extraction of lutein esters
from marigold flowers and found the saponification of lutein esters after
preconcentration gives a much higher yield of lutein compared to the lipase catalyzed
hydrolysis. The modified saponification method of the pre-concentrated lutein esters

11
serves to be an efficient and economical process for the production of lutein. The
lutein thus produced is a potent nutraceutical and a natural colourant that can be
incorporated into different foods after proper encapsulation to improve its stability in
foods.
Sarkar et al. (2012) found that saponification of carotenoid esters leads to
decomposition at high temperature and high concentration of alkali. Lutein ester is
collected from marigold flower. Findings showed efficient saponification in 0.5 M
KOH at 500ºC for 30 minute.
Shivakumar et al. (2014) cunducted a field investigation on fifteen diverse
genotype of African marigold for correlation analysis to understand the association
between component characters and their relative contribution to xanthophyll content to
bring about a rational improvement in the desirable direction. The 19 characters
related to growth, flowering, and xanthophyll content revealed that, the genotypic and
phenotypic correlation of xanthophyll content was found to be positively highly
significant with petal meal yield ha-1
, flower yield plant-1
, number of petals flower-1,
flower weight, flower diameter, number of flower plant-1
, flowering duration, day to
50 % flowering, secondary branches, primary branches, plant height.
Tiwary et al. (2014) conducted an experiment with the main objective to
optimize petal yield from important marigold genotypes viz., ‘African marigold-
Double’ (AFM-D), ‘African marigold-Single’ (AFM-S), ‘African marigold-
orange’(AFM-O), ‘French marigold-Orange’ (FRM-O), ‘French marigold-Double’
(FRMD), and LC (Local type). Among them ‘FRM-O’ produced highest petal meal 82
g kg-1 of fresh flower and the genotype ‘FRM-D’ produced lowest petal meal yield 69
g kg-1
of fresh flower.
Kaimainen et al. (2015) analyzed oil extraction of lutein esters from marigold
flowers was successful, with a lutein yield (present as lutein esters but calculated as
free lutein) of 1.1 mg/g of marigold flowers (fresh weight). The lutein contents of oil
extracts were 0.50 mg/ml for the first extract, 0.23 mg/ml for the second extract, and
0.36 mg/ml for the combined extract.

12
Sahu (2016) reported that the xanthophyll content varied significantly amongst
of different genotypes. Significantly maximum xanthophyll content (20.20 g) was
recorded in the genotype T9 followed by T17 (20.09 g) and T6 (19.79 g).
Manik and Sharma (2016) reported that the highest petal meal yield kg-1
of
flower was found in Pusa Narangi Gainda whereas, the petal meal yield ha-1
was found
maximum in genotype CGRJ-2. The genotype CGSG-1 recorded maximum
xanthophylls content kg-1
of petal meal and xanthophyll yield ha-1
.

13
CHAPTER-III
MATERIALS AND METHODS
The present chapter deals with information regarding the materials used and
techniques employed during the course of investigation entitled “Study on growth,
flowering and carotenoids content of African marigold (Tagetes erecta L.) under
Chhattisgarh plains agro-climatic condition”.
The present investigation was conducted at the Horticultural Research cum
Instruction Farm of the Department of Floriculture and Landscape Architecture,
College of Agriculture, Indira Gandhi Krishi Vishwavidyalaya, Raipur, Chhattisgarh
under Chhattisgarh Council of Science and Technology (CCOST) sponsored adhoc
project on Marigold.
3.1 Geographical Situation
Raipur, the capital of Chhattisgarh state of India is situated in the central part
of Chhattisgarh and lies between 21014’06.8” N latitude and 81042’41” E longitude at
an altitude of 289.56 m above mean sea level. The climate of Raipur is characterized
as dry sub- humid with normal rainfall of 1200 mm per annum, mostly concentrated
during the monsoon months i.e. June to September. The pattern of rainfall, particularly
during August to November months has great variation from year to year. The
maximum temperature goes as high as 46ºC during summer and minimum as below as
6ºC during winter months. The relative humidity varies from seventy to ninty percent
from middle of June to end of March.
3.2 Experimental Site and Season
The experimental site was located at the Horticultural Research cum
Instruction Farm of the Department of Floriculture and Landscape Architecture,
College of Agriculture, Indira Gandhi Krishi Vishwavidyalaya, Raipur,
Chhattisgarh.The experiment was conducted during the kharif season of year 2016-

14
2017. Adequate facilities for conduction of experiment existed at the experimental
site.
3.3 Weather condition
The meteorological observations recorded during the investigation have been
presented in Figure 3.1 and Appendix I. Weekly meteorological observations from
June 2016 to November 2016 were recorded. During the crop period the maximum
temperature varied between 28.75ºC to 40.84ºC, whereas, minimum temperature
ranged between 11.35ºC to 26.34ºC. The maximum and minimum relative humidity
ranged between 33 to 94 percent whereas, the bright sunshine varied from 1.2 to 10.0
hours day-1
and evaporation rate recorded varied from 2.5 to 4.7 mm.
3.4 Soil characteristics of the experimental field
The soil of the experimental field was silt-loam. The soil samples (upto a depth
of 20 cm) were collected randomly from five different places of the experimental site
before layout of experiment. The samples were mixed thoroughly and a uniform
sample was analyzed for assessing the physico-chemical properties of the soil. The
physico-chemical composition of soil sample is presented in the Table 1.

15
Table 1: Physcio-chemical composition of soil at experimental site
S.No. Particulars Value Group/
Class
Method followed
A. Physical analysis
Sand (%) 33.01 - International pipette
method (Black, 1965)
Silt (%) 38.32 - -
Clay (%) 28.63 - -
Class Sandy
loam
-
B. Chemical analysis
1. Organic carbon
(%)
0.31 Low Walkey and Black’s rapid
titration method
(Jackson 1967)
2. Available N
(kg/ha)
185.2 Low Alkaline permagnet method
(Subbiah and Asija, 1967)
3. Available P2O5
(Kg/ha)
11.25 Low Olsen’s method
(Olsen, 1954)
4. Exchange K2O
(kg/ha)
325.00 Medium Flame photometer method
(Jackson, 1967)
5. pH 6.88 Neutral Glass electrode pH meter
(Piper, 1967)
6. Electrical
Conductivity at
25oC
0.21 Normal Solubridge method
(Black, 1965)

16
3.5 Design and layout of experiment
The experimental field was laid out in Randomized Block Design with three
replications. The treatment consisted of eighteen genotypes including named varieties
of African marigold .The layout of the experimental field is given in Fig. 2 and its
general view in Plate 1.
Experimental details:
Crop : African Marigold (Tagetes erecta L.)
Design of experiment : Randomized Block Design (RBD)
Number of treatment : 18
Number of replication : 3
Gross plot size : 2.0 × 2.0 m
Net plot size : 1.6 × 1.6 m
Number of plots : 54
Number of plants/plot : 20
Spacing : 40 × 40 cm (R-R × P-P)
Planting date : 23/07/2016

17
Table 2 : Treatment details
Sr no. Treatment
Notation
Genotype/varieties Location/Source
1. T1 CGRG-1 Raigarh
2. T2 CGRG-2 Raigarh
3. T3 CGJS-1 Jashpur
4. T4 CGJS-2 Jashpur
5. T5 CGRJ-1 Rajnandgaon
6. T6 CGRJ-2 Rajnandgaon
7. T7 CGJS-3 Jashpur
8. T8 CGJS-4 Jashpur
9. T9 CGMS-1 Mahasamund
10 T10 CGMS-2 Mahasamund
11 T11 CGR-2 Raipur
12 T12 CGR-3 Raipur
13 T13 CGDU-1 Durg
14 T14 CGSG-2 Sarguja
15 T15 CGKS-1 Keshkal
16 T16 Pusa Basanti Gainda (Check) IARI,New Delhi
17 T17 Pusa Narangi Gainda IARI,New Delhi
18 T18 Pusa Arpita Gainda IARI,New Delhi

18
Plate I: A view of experimental site

19
0
20
40
60
80
100
120
23 24 25 26 27 28 29 30 31 32 33 34 35 36 37 38 39 40 41 42 43 44 45 46 47 48
MaxT(°C) MinT(°C) RF (mm) RH I (%) RH II (%) WS(kmph) SS (hr)
Standard meteorological weeks
Fig. 1 Meteorological details about the weather condition prevailing during the course of experiment

20
R3
0.5 m 2 m
Fig. 2 Layout of Experimental Field
2 m
0.50 m
S N
T9
T8
T16
T11
T14
T13
T12
T7
T10
T2
T17
T5
T18
T4
7 m
47 m
R2 R1
T15
T6
T3
T13
T17
T15
T7
T9
T14
T11
T2
T3
T18
T4
T16
T6
T1
T5
T8
T10
T12
T1
T13
T18
T17
T8
T10
T5
T12
T6
T14
T16
T15
T3
T9
T14
T11
T2
T7
T1

21
3.6 Cultural operations
3.6.1 Raising of seedlings
Marigold seeds were sown on raised beds, measuring 120 x 60 x 15 cm.
The soil of bed was prepared to fine tilth with incorporation of well rotten FYM
(15 kg) and 250 g DAP/ bed. The line sowing of seeds was done at 4-5 cm spacing.
The seed beds were covered with a mixture of garden soil and coarse sand. The
nursery beds were covered by the paddy straw after sowing. Initially, watering was
done with watering can at alternate days. The sowing was done on 23rd
June. The
seeds germinated within 4-5 days of sowing and thereafter mulch cover was
removed. The seedlings were hardened by withdrawing the watering in forenoon 2-
3 days before lifting the seedlings. The transplanting was done after 27 days.
3.6.2 Field preparation
Field preparation was done by ploughing the field with mould board plough
once, followed by leveling and weeding manually. Harrowing was done to break
the clods followed by criss-cross ploughing by cultivator and then the field was
pulverized by rotavator. During harrowing, well rotten FYM @10 kg/m2
was
incorporated in the soil. The experiment was laid out with the help of measuring
tape, rope and bamboo pegs. The small-sized beds were then prepared.
3.6.3 Irrigation
The first irrigation was given just after transplanting with the help of hazara
(rose can) and subsequent irrigation were given by plot to plot system and the
interval between two irrigation was adjusted according to the requirement of the
crop.
3.6.4 Manures and fertilizers
Well decomposed FYM @ 20 tonnes ha-1
was applied at the time of land
preparation. The fertilizer dose of 90:90:75 kg ha-1
NPK was applied in two splits
i.e. half the dose of ‘ N’ and full dose of ‘P’ and ‘K’ at the time of transplanting
and remaining 50 % ‘N’ was applied at the time of pinching in the form of urea.

22
3.6.5 Pinching
The African marigold seedlings were pinched one month after transplanting
in order to break their apical dominance so as to increase their lateral spread.
3.6.6 Weeding
For better growth and development of marigold plants, the experimental
field was kept weed-free by hand weeding and hoeing at regular intervals.
3.6.7 Plant protection
The prophylactic measures were adopted timely and uniformly as and when
required to protect the crop against insect-pests and diseases.
3.7 Observations recorded
Five plants were selected randomly in each treatment plot and tagged for
the purpose of recording data on various parameters.
3.7.1 Observations of vegetative phase
3.7.1.1 Plant height (cm)
The plant height of five randomly selected plants from each plot was
measured from the ground level to the tip of the plant with the help of meter scale.
The average height was then worked out by dividing the summation with five.
3.7.1.2 Plant spread (cm)
The plant spread was measured in the five randomly selected plants with
the help of meter scale in the North- South and East-West direction. The average
value was then worked out.
3.7.1.3 Number of primary branches plant-1
All the branches which came out from the main stem were counted and
recorded at 30, 60 and 90 DAT. This was done on all the five tagged plants in each
treatment and then average worked out.

23
3.7.1.4 Number of secondary branches plant-1
Number of secondary branches per plant of the five randomly selected plants from
each plot was counted at 60 and 90 DAT the average was then calculated by
dividing the summation with five.
3.7.1.5 Number of leaves plant-1
The number of leaves plant-1
of the five randomly selected plants plot-1
was
recorded at 30, 60 and 90 DAT. The average was then worked out by dividing the
summation with five.
3.7.2 Observations of flowering attributes
3.7.2.1 Days to first bud appearance
The number of days taken from transplanting to the appearance of first bud
in each tagged plants was counted.
3.7.2.2 Days to 50% flowering
When 50 per cent of the plants came into flowering, this observation was
taken with reference to the date of planting.
3.7.2.3 Number of flowers plant-1
The total number of flowers plant-1
was counted per plant from each plot at
the flowering stage and then averaged to get the value.
3.7.2.4 Flower diameter (cm)
The diameter of flowers at fully open stage from five randomly selected
plants was recorded and then averaged for arriving at the flower size. The size of
flower was measured with the help of verneir callipers .
3.7.2.5 Flower weight plant-1
(g)
For flower weight plant-1
weight of fresh flowers from the five randomly
selected plants was recorded with the help of pan balance and average value was
calculated.
3.7.2.6 Duration of flowering (days)
It was recorded by counting the days of first flowering to fading of the last
flower.
24
3.7.2.7 Flower yield (t ha-1
)
It was worked out by multiplying total number of plants and flower yield
plant-1
for each plot and then worked out per unit area (t ha-1
).
3.8 Observation on carotenoids and its attributes
The observations on major carotenoids content i,e xanthophyll and the
procedure involved in its estimation is as below:
3.8.1 Xanthophyll content kg-1
of petal meal (g)
Xanthophyll content kg-1
of petal meal was calculated based on chemical
analysis.
3.8.2 Xanthophyll estimation
Xanthophyll was estimated by AOAC method (Lawrence, 1990). The
procedure followed is as follows:
3.8.3 Reagents and Apparatus
1) Extractant: 10 parts of hexane + 7 parts of acetone + 6 parts of absolute alcohol
+ 7 parts toluene.
2) Sodium sulphate – 10% in distilled water.
3) Methanolic potassium hydroxide – 40 per cent (Dissolve 40 g KOH in 100 ml
methanol).
Spectrophotometer was used for to estimate the total carotenoids
concentration in mixture or extract of carotenoids in a marigold petal meal sample.
3.8.4 Procedure
3.8.4.1 Preparation of solutions
The dried petals were grinded into fine powder and were homogenized
well. Then 0.05 g of petal meal was weighed accurately and put into 100 ml
volumetric flask, after which 30 ml extractant was pipetted and shaked well for 10-
15 minutes.

25
3.8.4.2 Hot saponification
Two ml of 40 per cent methanolic KOH was pipetted into flask and shaked
for one minute. The flask was refluxed in a water bath at 56°C. Air condenser was
attached to prevent loss of solvent. The sample was then cooled. It was then kept in
dark for one hour after which pipette 30 ml hexane was pipette into flask. It was
shaked for one minute. The volume was made up with 10 per cent sodium sulphate
solution and shaked vigorously for one minute. This was kept in dark for one hour.
Then upper phase was collected in a 50 ml volumetric flask. Three ml of upper
phase was pipette into 100 ml volumetric flask and the volume made up with
hexane was mixed well and absorbance at 474 nm was measured.
3.8.4.3 Calculation
The total xanthophyll content in the sample was calculated by using the formula:
Where,
A474 = Absorbance at 474nm
W = Weight of the sample (petal meal) in g
236 = Translation specific absorbitivity for 1 gm -1

26
Plate II: Preparation of solutions hot saponification

27
3.9 Statistical Analysis
The data collected from various observations recorded in the field as well
as laboratory were subjected to statistical analysis by standard analysis of variance
technique (Gomez and Gomez, 1984). The skeleton of ANOVA for Randomized
Block Design is as follows:
ANOVA TABLE
Source of
variation
Degree
of
freedom
Sum of
squares
Mean
sum of
squares
F value
calculated
F value
tabulated
Replication (r-1) RSS MSR MSR /
MSE
Treatment (t-1) TrSS MST MST /
MSE
Error (r-1)(t-1) ESS MSE
Total (rt-1)
Where,
r = Replication
t = Treatment
SSR = Sum of square for replication
SST = Sum of square for treatment
SSE = Sum of square for Error
MSR = Mean sum of square for replication
MST = Mean sum of square for treatment
MSE = Mean sum of square for error
Fc = F value calculated
Ft = F value from table
In order to compare the mean value of treatment, standard error and critical values
were calculated as follows.

28
a. Standard Error of mean
S Em ± = √
Where,
S Em = Standard error of mean
EMS = Error Mean of square
r = Number of replications
b. Critical Difference
CD = SEd x t Value at 5% at error degree of freedom
S Ed = √
Where,
S Ed = Standard error of difference between two treatment means
EMS = Error Mean of square
r = Number of replications

29
CHAPTER – IV
RESULTS AND DISCUSSION
The results of the experiment entitled “Study on growth, flowering and
carotenoids content of African marigold (Tagetes erecta L.) under
Chhattisgarh plains agro-climatic condition” have been presented in this
chapter. The data recorded on various morphological, growth, flowering and yield
parameters of marigold genotypes and the results of present investigation obtained
have been interpreted under the following heads:
4.1 Vegetative growth parameters
4.2 Flowering attributes, yield and xanthophylls content
4.1 Vegetative growth parameters
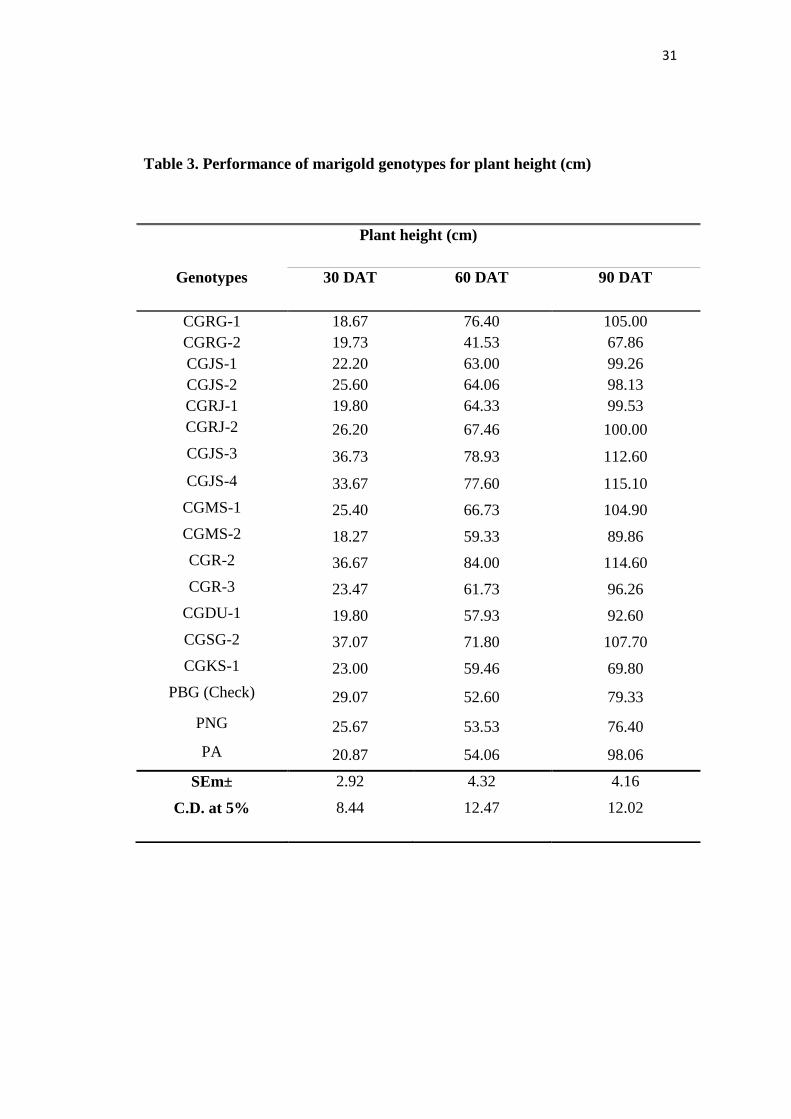
4.1.1 Plant height (cm)
The periodical observation with respect to height of plants were recorded
and are presented in Table 3 and depicted in Fig. 3.
The data indicates that there were significant differences observed among
the treatments with respect to plant height at 30, 60 and 90 DAT.
At 30 DAT, maximum plant height (37.07 cm) was recorded in the
genotype CGSG-2 which however was found to be at par with the genotypes
CGJS-3 (36.73 cm), CGR-2 (36.67 cm), CGJS-4 (33.67cm) and check variety
(PBG). The minimum plant height was recorded in the genotype CGMS-2 (18.27
cm).
At 60 DAT, the maximum plant height was recorded in CGR-2 (84 cm)
which however, was at par with genotypes CGJS-3 (78.93 cm), CGJS-4 (77.60
cm), CGRG-1 (76.40 cm), and CGSG-2 (71.80 cm) but significantly higher than
PBG (Check). Whereas, the minimum plant height was recorded in genotype
CGRG-2 (41.53 cm).
At 90 DAT, maximum plant height was recorded in CGJS-4 (115.10 cm)
which, was at par with genotypes CGR-2 (114.60 cm), CGJS-3 (112.60 cm),

30
CGSG-2 (107.73 cm), CGRG-1 (105 cm) and CGMS-1 (104.86 cm).Whereas, the
minimum was recorded in genotype CGRG-2 (67.86 cm).
Plant height is attributed to be an important varietal character that depends
upon the genetic constitution. The variation in plant height among the various
genotypes might be due to genotypic differences in phenotypic expression of plant
height and variations in different genotype-environmental interaction effects on
plant height (Bharathi and Jawaharlal, 2014).Similar variation in plant height due
to genotypes was also reported by Rao et al. (2005), Singh and Singh (2006) and
Khanvilkar et al. (2003) in marigold.
31
Table 3. Performance of marigold genotypes for plant height (cm)
Plant height (cm)
Genotypes
30 DAT
60 DAT
90 DAT
CGRG-1 18.67 76.40 105.00
CGRG-2 19.73 41.53 67.86
CGJS-1 22.20 63.00 99.26
CGJS-2 25.60 64.06 98.13
CGRJ-1 19.80 64.33 99.53
CGRJ-2 26.20 67.46 100.00
CGJS-3 36.73 78.93 112.60
CGJS-4 33.67 77.60 115.10
CGMS-1 25.40 66.73 104.90
CGMS-2 18.27 59.33 89.86
CGR-2 36.67 84.00 114.60
CGR-3 23.47 61.73 96.26
CGDU-1 19.80 57.93 92.60
CGSG-2 37.07 71.80 107.70
CGKS-1 23.00 59.46 69.80
PBG (Check) 29.07 52.60 79.33
PNG 25.67 53.53 76.40
PA 20.87 54.06 98.06
SEm± 2.92 4.32 4.16
C.D. at 5% 8.44 12.47 12.02

32
Fig. 3 Performance of marigold genotypes for plant height (cm)
0
20
40
60
80
100
120
140
T1 T2 T3 T4 T5 T6 T7 T8 T9 T10 T11 T12 T13 T14 T15 T16 T17 T18
Pla
nt
hei
gh
t (c
m)
Treatments
30DAT
60DAT
90DAT
33
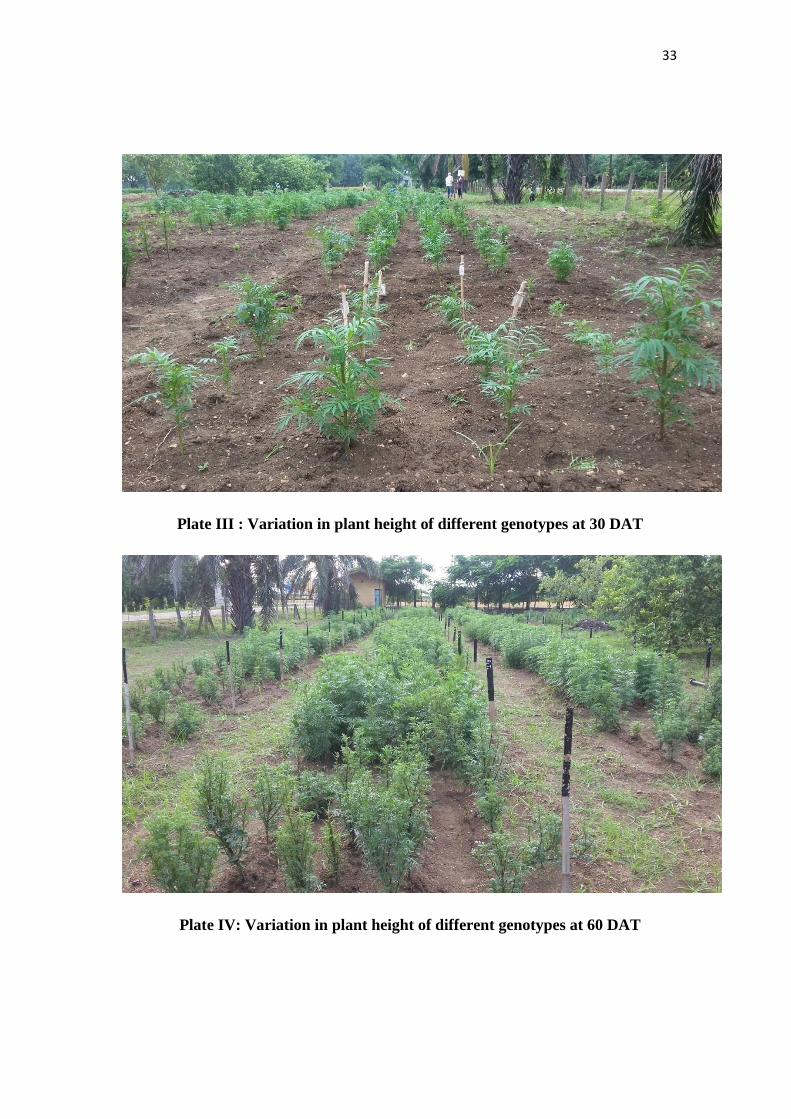
Plate III : Variation in plant height of different genotypes at 30 DAT
Plate IV: Variation in plant height of different genotypes at 60 DAT

34
4.1.2 Plant spread (cm)
The perusal of data presented in Table 4 indicates that there were
significant differences observed among the treatments with respect to plant spread
at 60 and 90 DAT (Fig. 4)
At 60 DAT, significantly maximum plant spread was recorded in CGR-2
(48.56 cm) which was found to be at par with majority of the genotypes CGJS-4
(47.53 cm), CGSG-2 (47.16 cm), CGR-3 (46.07 cm), PA (45.33 cm), CGJS-3 (45.1
cm), CGMS-2 (44.33 cm), CGMS-1 (43.80 cm), CGRG-1 (43.06 cm), CGRG-2 (42
cm), CGJS-2 (40.63 cm) and CGRJ-2 (40.50) whereas, the minimum plant spread
was noticed in check variety PBG (29.43 cm).
Whereas at 90 DAT, maximum plant spread was recorded in CGRJ-1
(53.20 cm) which however was at par with all the marigold genotypes except
CGDU-1 (40.43 cm) and PBG (36.86 cm) which recorded the minimum plant
spread.
The observations are in line with the finding of Singh et al. (2003), Poonam
and Kumar (2007), Narsude et al. (2010), Raghuvanshi and Sharma (2011) and
Choudhary et al. (2014) in marigold, who also observed variation in plant spread in
different genotypes of marigold due to the inherent character of marigold
genotypes.

35
Table 4. Performance of marigold genotypes for plant spread (cm)
Plant spread (cm)
Genotypes
60 DAT
90 DAT
CGRG-1 43.06 48.00
CGRG-2 42.00 49.60
CGJS-1 39.36 46.30
CGJS-2 40.63 47.56
CGRJ-1 36.76 53.20
CGRJ-2 40.50 51.27
CGJS-3 45.10 52.30
CGJS-4 47.53 52.70
CGMS-1 43.80 51.56
CGMS-2 44.33 46.86
CGR-2 48.56 49.60
CGR-3 46.07 47.10
CGDU-1 32.33 40.43
CGSG-2 47.16 48.13
CGKS-1 39.70 45.35
PBG(Check) 29.43 36.86
PNG 32.47 40.17
PA 45.33 49.07
SEm± 2.85 2.73
C.D. at 5% 8.235 7.88

36
Fig. 4 Performance of marigold genotypes for plant spread (cm)
0
10
20
30
40
50
60
T1 T2 T3 T4 T5 T6 T7 T8 T9 T10 T11 T12 T13 T14 T15 T16 T17 T18
Pla
nt
spre
ad
(cm
)
60DAT
90DAT
Treatments Treatments

37
4.1.3 Number of primary branches plant-1
The data on number of primary branches plant-1
are presented in Table 5
and illustrated in Fig. 5.
At 30 DAT, the maximum number of primary branches plant-1
were noticed
in genotype CGSG-2 (11.53) which however, was at par with variety PA (9.40) but
significantly superior over rest of the genotypes. The minimum number of primary
branches was recorded in CGKS-1 (5.53).
At 60 DAT, the maximum number of primary branches plant-1
were
recorded in CGR-3 (18.53) which, was at par with genotypes CGSG-2 (17.40),
CGMS-2 (16.60), CGRJ-1 (15.73), CGRG-1 (15.40), CGJS-4 (15.80), PA (15.80),
CGJS-3 (15.06) and CGRJ-2 (14.66) and PNG (14.33) but significantly superior
over check variety PBG. The minimum number of primary branches was recorded
in genotype CGMS-1 (9.26).
However at 90 DAT, number of primary branches plant-1
was found to be
non significant.
The variation in number of primary branches plant-1
might be due to the
difference in their genetic composition and varied growth rate among the
genotypes of marigold (Narsude et al., 2010). Further, the individual genetic
makeup of the genotypes may also have been influenced by the environmental
conditions. Similar variations for number of branches were also observed by
Ravikumar (2002), Rao et al. (2005), Singh and Singh (2010), Narsude et al.
(2010a) in marigold and Munikrishnappa et al. (2013) in China aster.

38
Table 5. Performance of marigold genotypes for number of primary branches
Number of primary branches plant-1
Genotypes
30 DAT
60 DAT
90 DAT
CGRG-1 7.93 15.40 17.35
CGRG-2 6.07 11.33 14.73
CGJS-1 6.67 13.40 19.78
CGJS-2 6.00 13.07 15.53
CGRJ-1 6.53 15.73 18.00
CGRJ-2 7.87 14.67 17.40
CGJS-3 6.40 15.07 17.47
CGJS-4 8.47 15.80 19.73
CGMS-1 6.80 9.27 15.27
CGMS-2 7.07 16.60 20.27
CGR-2 9.00 11.73 16.20
CGR-3 8.53 18.53 20.53
CGDU-1 6.07 12.80 15.13
CGSG-2 11.53 17.40 20.13
CGKS-1 5.53 7.13 15.67
PBG (Check) 6.60 13.67 17.27
PNG 6.63 14.33 17.40
PA 9.40 15.80 18.27
SEm± 0.82
1.57 1.64
C.D. at 5% 2.37
4.54
NS

39
Fig. 5 Performance of marigold genotypes for number of primary branches plant-1
0
5
10
15
20
25
T1 T2 T3 T4 T5 T6 T7 T8 T9 T10 T11 T12 T13 T14 T15 T16 T17 T18
Nu
mb
er o
f p
rim
ary
bra
nch
es
Treatments
30DAT
60DAT
90DAT

40
4.1.4 Number of secondary branches plant-1
The number of secondary branches plant-1
were recorded at 60 and 90 DAT
and are presented in Table 6 and depicted in Fig.6.
At 60 DAT, the maximum number of secondary branches plant-1
were
observed in variety PNG (51.93) which, was at par with check variety PBG (49.40)
and genotypes CGJS-4 (41) and CGR-3 (40.93). The minimum number of
secondary branches was recorded in CGDU-1 (24.93).
A similar trend for number of secondary branches plant-1
was observed 90
DAT, the maximum number of secondary branches plant-1
were noticed in variety
PNG (55.40) which, was at par with variety PBG (54.24) but superior over other
genotypes. The minimum number of secondary branches was recorded in genotype
CGDU-1 (29.86).
The numbers of secondary branches plant-1
may have increased due to
pinching of plant which might have forced the auxiliary buds to thrive well (Kelly
and Harbaugh, 2002). Similar results have also been reported by Khanvilkar et al.
(2003) in marigold and Munikrishnappa et al. (2013) in China aster.

41
Table 6. Performance of marigold genotypes for number of secondary branches
plant-1
Number of secondary branches plant-1
Genotypes
60 DAT
90 DAT
CGRG-1 37.60 39.06
CGRG-2 31.80 39.53
CGJS-1 30.73 40.46
CGJS-2 32.13 40.93
CGRJ-1 30.93 34.60
CGRJ-2 35.87 42.08
CGJS-3 34.67 40.60
CGJS-4 41.00 46.20
CGMS-1 33.47 41.20
CGMS-2 35.67 37.80
CGR-2 38.13 43.31
CGR-3 40.93 45.08
CGDU-1 24.93 29.86
CGSG-2 35.20 41.80
CGKS-1 32.73 45.13
PBG (Check) 49.40 54.24
PNG 51.93 55.40
PA 35.60 40.20
SEm± 4.03 2.58
C.D. at 5% 11.64 7.44

42
Fig. 6 Performance of marigold genotypes for number of secondary branches plant-1
0
10
20
30
40
50
60
T1 T2 T3 T4 T5 T6 T7 T8 T9 T10 T11 T12 T13 T14 T15 T16 T17 T18
Nu
mb
er o
f se
con
dary
bra
nch
es
Treatments
60DAT
90DAT

43
4.1.5 Number of leaves plant-1
The number of leaves plant-1
were recorded periodically at 30, 60 and 90
DAT are presented in Table 7 and depicted in Fig. 7.
At 30 DAT, number of leaves plant-1
was found to be non significant.
At 60 DAT, the maximum number of leaves plant-1
were recorded in
genotype CGJS-3 (27.80 cm) which however, was at par with genotypes CGSG-2
(26.46), PBG (26.40), CGRG-1 (25.86), CGRJ-1 (25.33), CGR-2 (24.93), CGJS-1
(24.66), CGJS-4 (24.33), CGR-3 (24.33) and CGDU-1 (24.26). The minimum
number of leaves was recorded in genotype CGKS-1 (14.40).
At 90 DAT, the maximum number of leaves plant-1
were noticed in
genotype CGJS-3 (43.86 cm) which, however was at par with all the other
genotypes except CGRG-2 (37.46) whereas, minimum number of leaves plant-1
was recorded in genotype CGKS-1 (26.13).
The production of more number of leaves may be attributed to the
production of more number of branches per plant (Verma et al., 2004). Similar
variation in number of leaves plant-1
among the genotypes was also observed
previously in marigold by Singh and Misra (2008) and Zosiamlianana et al. (2012)
in china aster.

44
Table 7. Performance of marigold genotypes for number of leaves plant-1
Number of leaves plant-1
Genotypes
30 DAT
60 DAT
90 DAT
CGRG-1 14.07 25.86 41.60
CGRG-2 14.13 22.73 37.46
CGJS-1 12.33 24.66 38.86
CGJS-2 13.97 23.00 40.13
CGRJ-1 13.60 25.33 40.20
CGRJ-2 12.93 21.00 34.86
CGJS-3 17.61 27.80 43.86
CGJS-4 17.07 24.33 38.46
CGMS-1 13.20 21.73 38.73
CGMS-2 13.33 24.00 41.80
CGR-2 17.33 24.93 42.26
CGR-3 16.13 24.33 42.00
CGDU-1 12.27 24.26 40.00
CGSG-2 17.13 26.46 43.33
CGKS-1 14.27 14.40 26.13
PBG (Check) 15.33 26.40 40.13
PNG 14.40 22.80 39.00
PA 11.47 18.26 40.00
SEm± 1.39 1.67 2.13
C.D. at 5% NS 4.83 6.15

45
Fig. 7 Performance of marigold genotypes for number of leaves plant-1
0
5
10
15
20
25
30
35
40
45
50
T1 T2 T3 T4 T5 T6 T7 T8 T9 T10 T11 T12 T13 T14 T15 T16 T17 T18
Nu
mb
er o
f le
aves
Treatments
30DAT
60DAT
90DAT

46
Flowering attributes, yield and xanthophyll content
4.2.1 Days to first bud appearance
Days to first bud appearance was significantly influenced by the different
genotypes. The data pertaining to number of days to first bud appearance is
presented in Table 8 and Fig 8.
Significantly earliest days for first bud appearance was recorded in variety
PNG (48 days) which was at par with check variety PBG (48.33 days) and
genotype CGJS-3 (50.33 days) but significantly superior to rest of the treatments.
The observations are in line with the findings of Mohanty et al. (2002) in
marigold and Bhaskarar et al. (2016) in gaillardia. The different period required for
first flower bud appearance in marigold genotypes might be due to varied growth
rate and the genetic makeup of the genotypes (Nayak et al., 2005).

47
Table 8. Performance of marigold genotypes for days to first bud appearance
Genotypes
Days to first bud appearance
CGRG-1 68.00
CGRG-2 65.33
CGJS-1 65.33
CGJS-2 69.00
CGRJ-1 69.00
CGRJ-2 68.67
CGJS-3 50.33
CGJS-4 67.00
CGMS-1 69.67
CGMS-2 71.33
CGR-2 67.67
CGR-3 71.00
CGDU-1 72.67
CGSG-2 65.67
CGKS-1 59.00
PBG (Check) 48.33
PNG 48.00
PA 105.00
SEm±
2.09
C.D. at 5% 6.04

48
Fig. 8 Performance of marigold genotypes for days to first bud appearance
0
20
40
60
80
100
120
T1 T2 T3 T4 T5 T6 T7 T8 T9 T10 T11 T12 T13 T14 T15 T16 T17 T18
Days
to f
irst
bu
d a
pp
eara
nce
Treatments

49
4.2.2 Days to 50 % flowering
The data pertaining to the number of days required for 50 percent flowering
are presented in the Table 9 and graphically illustrated in Fig. 9 Significant
differences has observed for number of days taken to 50% flowering.
The data on days required for 50 percent flowering revealed that variety
PBG (Check) recorded the earliest days to 50% flowering (65.67 days) which was
at par with variety PNG (66.67 days) and genotype CGKS-1 (66.67 days).
However, these three treatments were found to be superior to rest of the genotypes.
The differences in flowering might be due to the different time period taken
by the different genotypes based on their genetic makeup (Singh and Singh, 2006).
The findings also corroborates with the findings of Nair and Shiva (2003) in
gerbera, Singh and Mishra (2008) in marigold, Palai et al. (2008) in
chrysanthemum.

50
Table 9. Performance of marigold genotypes for days to 50 % flowering
Genotypes
Days to 50 % flowering
CGRG-1 75.33
CGRG-2 76.33
CGJS-1 81.33
CGJS-2 79.00
CGRJ-1 81.33
CGRJ-2 79.33
CGJS-3 85.67
CGJS-4 80.67
CGMS-1 85.00
CGMS-2 86.67
CGR-2 76.33
CGR-3 89.67
CGDU-1 96.67
CGSG-2 85.00
CGKS-1 66.67
PBG (Check) 65.67
PNG 66.67
PA 128.67
SEm± 2.54
C.D. at 5% 7.33

51
Fig. 9 Performance of marigold genotypes for days to 50 % flowering
0
20
40
60
80
100
120
140
T1 T2 T3 T4 T5 T6 T7 T8 T9 T10 T11 T12 T13 T14 T15 T16 T17 T18
Days
to 5
0 %
flo
wer
ing
Treatments

52
4.2.3 Flower diameter (cm)
Data pertaining to flower diameter are presented in Table 10 and Fig. 10.
The genotype CGR-2 recorded maximum flower diameter (6.61 cm) which,
however, was found to be at par with genotype CGSG-2 (6.01 cm) but superior
over rest of the genotypes including check variety PBG. However, the minimum
flower diameter (2.96 cm) was recorded in genotype CGJS-2.
The variation in flower diameter might be due to genetic makeup of
genotypes and more number of leaves which may have lead to more dry matter
accumulation, resulting in the accumulation of maximum photosynthates that may
have contributed to the production of bigger size flower (Verma and Beniwal,
2006). Similar results have been reported by Narsude et al. (2010) and Panwar et
al. (2013) in African marigold.

53
Table 10. Mean performance of marigold genotypes for flower diameter (cm)
Genotypes
Flower Diameter (cm)
CGRG-1 4.96
CGRG-2 3.75
CGJS-1 4.28
CGJS-2 2.96
CGRJ-1 5.32
CGRJ-2 4.02
CGJS-3 4.35
CGJS-4 5.28
CGMS-1 4.92
CGMS-2 3.68
CGR-2 6.61
CGR-3 4.82
CGDU-1 5.25
CGSG-2 6.01
CGKS-1 5.28
PBG (Check) 5.41
PNG 5.36
PA 4.59
SEm±
0.22
C.D. at 5% 0.63

54
Fig. 10 Performance of marigold genotypes for flower diameter (cm)
0
1
2
3
4
5
6
7
T1 T2 T3 T4 T5 T6 T7 T8 T9 T10 T11 T12 T13 T14 T15 T16 T17 T18
Flo
wer
d
iam
eter
(cm
)
Treatments

55
Plate V: Diameter of flower in genotype CGSG-2
Plate VI : Diameter of flower in PBG (check variety)
CGSG-2
PBG

56
4.2.3 Number of flowers plant-1
Various genotypes showed a significant difference for the number of
flowers plant-1
(Table 11 and Fig.11).
The maximum number of flowers plant-1
(50.73) was recorded in the
genotype CGMS-1, which however was at par with genotypes CGRG-1 (50.13),
PNG (48.60), CGRJ-1 (47.73), CGJS-4 (47.20), check variety PBG (46.60), CGJS-
2 (45.80), CGJS-1 (45.73) and CGMS-2 (43.53). The minimum number of flowers
plant-1
was recorded in genotype CGKS-1 (35.13).
The variation in number of flower plant-1
might be due to hereditary traits
of the genotypes. Number of flowers plant-1
may have increased with the increase
in number of branches plant-1
(Laishram et al., 2013). Moreover, different
photosynthesis efficacy of genotypes may have enhanced food accumulation
resulting in better plant growth and subsequently higher number of flowers per
plant (Sunitha et al., 2007). These results are in accordance with the findings
obtained by Singh and Sangama (2000) in China aster. Similar results were
reported by Narsude et al. (2010), Beniwal and Dahiya (2012), Singh et al. (2004)
and Singh and Misra (2009) in marigold.

57
Table 11. Performance of marigold genotypes for number of flowers plant-1
Genotypes
Number of flowers plant-1
CGRG-1 50.13
CGRG-2 36.00
CGJS-1 45.73
CGJS-2 45.80
CGRJ-1 47.73
CGRJ-2 41.87
CGJS-3 42.73
CGJS-4 47.20
CGMS-1 50.73
CGMS-2 43.53
CGR-2 39.80
CGR-3 42.33
CGDU-1 40.07
CGSG-2 45.00
CGKS-1 35.13
PBG(Check) 46.60
PNG 48.60
PA 41.47
SEm±
2.65
C.D. at 5% 7.65

58
Fig. 11 Performance of marigold genotypes for number of flowers plant-1
0
10
20
30
40
50
60
T1 T2 T3 T4 T5 T6 T7 T8 T9 T10 T11 T12 T13 T14 T15 T16 T17 T18
Nu
mb
er o
f fl
ow
ers
Treatments

59
Plate VII: Number of flowers plant-1
in genotype CGMS-1
Plate VIII : Number of flowers plant-1
in PBG (check variety)

60
4.2.4 Flower weight plant-1
(g)
Flower weight plant-1
differed significantly with different treatments as is
evident from the data in Table 12 and Fig. 12.
Significantly maximum flower weight plant-1
(228.34 g) was recorded in
CGRJ-1 which, was found to be at par with genotypes CGMS-1 (212.90 g) and
CGSG-2 (200.81 g) but significantly superior over rest of the genotypes including
check variety PBG.
The flower weight plant-1
may have been dependant on the individual
flower weight as well as number of flowers plant-1
resulting in the variation in
fresh weight of flowers among the genotypes (Shivakumar et al. 2014).
The results are in accordance with the finding of Singh and Misra (2009),
Rao et al. (2005), Narsude et al. (2010) and Beniwal and Dahiya (2012) and Manik
et al. (2016) in marigold.

61
Table 12. Performance of marigold genotypes for flower weight plant-1
(g)
Genotypes
Flower weight plant-1
(g)
CGRG-1 135.57
CGRG-2 88.83
CGJS-1 121.05
CGJS-2 162.03
CGRJ-1 228.34
CGRJ-2 82.27
CGJS-3 148.04
CGJS-4 184.36
CGMS-1 212.90
CGMS-2 126.21
CGR-2 185.42
CGR-3 177.46
CGDU-1 164.30
CGSG-2 200.81
CGKS-1 57.83
PBG (Check) 166.01
PNG 192.61
PA 78.45
SEm±
11.27
C.D. at 5% 32.54

62
Fig. 12 Performance of marigold genotypes for flower weight plant-1
(g)
0
50
100
150
200
250
T1 T2 T3 T4 T5 T6 T7 T8 T9 T10 T11 T12 T13 T14 T15 T16 T17 T18
Flo
wer
w
eigh
t (g
m p
lan
t-1)
Treatments

63
4.2.6 Flower yield (t ha-1
)
Data pertaining to flower yield (t ha-1
) of marigold are presented in Table
13 and Fig. 13. The maximum flower yield (11.26 t ha-1
) was recorded in genotype
CGRJ-1 which was found to be at par with genotypes CGMS-1 (10.52 t ha-1
) and
CGSG-2 (10.34 t ha-1
) and PNG (9.72 t ha-1
) but significantly superior over rest of
the genotypes including check variety PBG (8.48 t ha-1
). However, minimum
flower yield was obtained in the genotype CGRG-2 (3.86 t ha-1
).
The variation in yield of flowers plant-1
might be attributed to the more
number of leaves as well as plant spread which might have resulted in production
and accumulation of maximum photosynthesis resulting the production of more
yield. The difference in flower yield per hectare may have varied due to positive
correlation with number of flowers per plant, flower diameter and weight of flower
plant-1
. Similar results have also been reported by Rao et al. (2005), Singh and
Singh (2006), Narsude et al. (2010) and Beniwal and Dahiya (2012) in marigold.

64
Table 13. Performance of marigold genotypes for flower yield (t ha-1
)
Genotypes
Flower yield t ha-1
CGRG-1 6.59
CGRG-2 3.98
CGJS-1 5.97
CGJS-2 9.08
CGRJ-1 11.19
CGRJ-2 4.24
CGJS-3 7.75
CGJS-4 10.00
CGMS-1 10.52
CGMS-2 6.67
CGR-2 9.25
CGR-3 8.63
CGDU-1 8.09
CGSG-2 10.34
CGKS-1 3.32
PBG (Check) 8.48
PNG 9.72
PA 8.91
SEm± 0.40
C.D. at 5% 1.15

65
Fig. 13 Performance of marigold genotypes for flower yield (t ha-1
)
0
2
4
6
8
10
12
T1 T2 T3 T4 T5 T6 T7 T8 T9 T10 T11 T12 T13 T14 T15 T16 T17 T18
Flo
wer
Y
ield
(t
ha
-1)
Treatments
66
4.2.7 Duration of flowering (days)
The perusal of data presented in Table 14 and Fig. 14 on Duration of
flowering. The variety PA recorded longest duration of flowering (77 days) which,
was at par with CGJS-3 (75 days), PBG (73 days) and PNG (70.67 days). The
minimum duration of flowering was observed in genotype CGRG-2 (48 days).
The genetic control of the characters and modification in their expression
due to environmental conditions might be the possible cause observed for variation
in duration of flowering (Choudhary et al., 2014). Panwar et al. (2013) reported in
general a high range for duration of flowering in African marigold. Similar
findings have been also reported by Rao et al. (2005) and Raghuvanshi and
Sharma (2011) in African marigold.

67
Table 14. Performance of marigold genotypes for duration of flowering (days)
Genotypes
Duration of flowering (days)
CGRG-1 56.00
CGRG-2 48.00
CGJS-1 54.33
CGJS-2 54.67
CGRJ-1 56.00
CGRJ-2 55.00
CGJS-3 75.00
CGJS-4 55.67
CGMS-1 55.67
CGMS-2 51.00
CGR-2 55.33
CGR-3 52.00
CGDU-1 49.67
CGSG-2 56.67
CGKS-1 64.33
PBG(Check) 73.00
PNG 70.67
PA 77.00
SEm±
3.15
C.D. at 5% 9.10

68
Fig. 14 Performance of marigold genotypes for duration of flowering (days)
0
10
20
30
40
50
60
70
80
90
T1 T2 T3 T4 T5 T6 T7 T8 T9 T10 T11 T12 T13 T14 T15 T16 T17 T18
Du
rati
on
of
flow
erin
g (
days)
Treatments

69
4.2.8 Xanthophyll content (g kg-1
of petal meal)
The perusal of data presented in Table 15 and Fig. 15 on xanthophyll
content g kg-1
of petal meal reveals that significantly maximum xanthophyll
content (27.87 g) was recorded in the genotype CGJS-3 which was significantly
superior to all other genotypes including check variety PBG (9.58 g). However, the
minimum xanthophyll content was recorded in genotype CGMS-1 (5.82 g).
The xanthophyll content variation may be due to colour of flower and also
due to different genetic makeup of genotypes (Naik, 2003). Higher xanthophyll
content might be due to increase in vegetative parameters which might have
contributed in production of more photosynthates resulting in greater accumulation
of dry matter which in turn leads to production of more dark colour flower with
higher xanthophyll ( Krol, 2012). The findings are in conformity with the research
finding of Rao et al. (2005), Iftikhar et al. (2011) and Manik et al. (2016) in
African marigold.

70
Table 15. Performance of marigold genotypes for xanthophyll content (g kg-1
)
Genotypes
Xanthophyll content (g kg-1
of petal meal)
CGRG-1 14.89
CGRG-2 21.74
CGJS-1 14.79
CGJS-2 12.77
CGRJ-1 24.49
CGRJ-2 14.53
CGJS-3 27.87
CGJS-4 26.66
CGMS-1 5.82
CGMS-2 15.25
CGR-2 13.49
CGR-3 27.78
CGDU-1 15.41
CGSG-2 19.57
CGKS-1 19.34
PBG(Check) 9.58
PNG 19.55
PA 11.89
SEm± 0.14
C.D. at 5% 0.41

71
Fig. 15 Performance of marigold genotypes for xanthophyll content (g/kg)
0
5
10
15
20
25
30
T1 T2 T3 T4 T5 T6 T7 T8 T9 T10 T11 T12 T13 T14 T15 T16 T17 T18
Xan
thop
hyll
con
ten
t (g
kg
-1)
Treatments

72
CHAPTER-V
SUMMARY AND CONCLUSIONS
The present investigation “Study on growth, flowering and carotenoids
content of African marigold (Tagetes erecta L.) under Chhattisgarh plains
agro-climatic condition” was carried out in the Department of Floriculture &
Landscape Architecture, College of Agriculture, Indira Gandhi Krishi
Vishwavidyalaya, Raipur (C.G.) during the year 2016-17. The investigation was
undertaken to evaluate some indigenously available marigold genotypes for
growth, flowering and yield under Chhattisgarh plains condition.
The experimental material consisted of eighteen genotypes of marigold
i.e., CGRG-1, CGRG-2, CGJS-1, CGJS-2, CGRJ-1, CGRJ-2, CGJS-3, CGJS-4,
CGMS-1, CGMS-2, CGR-2, CGR-3, CGDU-1, CGSG-2, CGKS-1 including
named varieties viz., Pusa Basanti Gainda (check variety ), Pusa Narangi Gainda
and Pusa Arpita. Observations on thirteen important characters viz., plant height,
plant spread, number of primary branches plant-1
, number of secondary branches
plant-1
, number of leaves plant-1
, days to first bud appearance, days to 50%
flowering, duration of flowering, flower diameter, flower weight plant-1
, number
of flowers plant-1
, flower yield (t ha-1
) and xanthophyll content were recorded on
five competitive randomly selected plants from each replication. These were
evaluated in the field in a randomized block design with three replications. The
observations were recorded for growth, flowering and yield characters. The results
of the investigation presented in chapter four are summarized here as under:
The maximum plant height (37.07 cm) at 30 DAT was recorded in the
genotype CGSG-2 which however, was found to be at par with the genotypes
CGJS-3 (36.73 cm), CGR-2 (36.67 cm) and CGJS-4 (33.67cm) but significantly
superior over standard check variety (PBG). At 60 DAT, the maximum plant
height was recorded in CGR-2 (84 cm) which however, was at par with CGJS-3
(78.93 cm), CGJS-4 (77.6 cm) and CGRG-1 (76.40 cm), but significantly higher
than Pusa Basanti Gainda (standard check). At 90 DAT, maximum plant height
was recorded in genotype CGJS-4 (115.06 cm) which however, was at par with

73
genotypes CGR-2 (114.6 cm), CGJS-3 (112.6 cm), CGSG-2 (107.73 cm), CGRG-1
(105.00 cm) and CGMS-1 (104.86 cm).
At 60 DAT,maximum plant spread was recorded in genotype CGR-2 (48.56
cm) and was found to be at par with the genotypes CGJS-4 (47.53 cm), CGSG-2
(47.16 cm), CGR-3 (46.07 cm), PA (45.33 cm), CGJS-3 (45.1 cm), CGMS-2 (44.33
cm), CGMS-1 (43.8 cm), CGRG-1 (43.06 cm), CGRG-2 (42 cm), CGJS-2 (40.63
cm). At 90 DAT,maximum plant spread was recorded in genotypeCGRJ-1 (53.20
cm) which was found to be at par with majority of the genotypes.
In case of number of primary branches plant-1
at 30 DAT, the maximum
number were noticed in genotype CGSG-2 (11.53 cm) which, was at par with
variety PA (9.40 cm) but significantly superior over standard check variety (PBG).
At 60 DAT, the maximum number of primary branches plant-1
were noticed in
genotype CGR-3 (18.53 cm) which however, was at par with genotypes CGSG-2
(17.4 cm) , CGMS-2 (16.6 cm) , CGRJ-1 (15.73 cm) , CGSG-1 (15.40 cm) ,
CGJS-4 (15.8 cm) , PA (15.8 cm) , CGJS-3 (15.06 cm) and CGRJ-2 (14.66 cm)
but significantly superior over check variety (PBG). At 90 DAT, number of
primary branches plant-1
was found non significant. The maximum number of
primary branches plant-1
were noticed in genotype CGR-3 (20.53 cm).
At 60 DAT, the maximum number of secondary branches plant-1
were
noticed in variety PNG (51.93 cm) which, was at par with PBG (49.40) , CGJS-4
(41.00) and CGR-3 (40.93 cm). At 90 DAT, the maximum number of secondary
branches plant-1
were noticed in PNG (55.40 cm) however, was at par with PBG
standard check variety (54.24 cm).
At 30 DAT, number of leaves plant-1
was found to be non significance. The
maximum number of leaves plant-1
were noticed in genotypes CGJS-3 (17.61 cm)
.At 60 DAT, the maximum number of leaves plant-1
were noticed in genotype
CGJS-3 (27.80 cm) which, was at par with genotypes CGSG-2 (26.46), PBG
(26.40), CGRG-1 (25.86), CGRJ-1 (25.33), CGR-2 (24.93), CGJS-1 (24.66),
CGJS-4 (24.33), CGR-3 (24.33) and CGDU-1 (24.26 cm). At 90 DAT, the
maximum number of leaves plant-1
were noticed in genotype CGJS-3 (43.86 cm)
however, was at par with genotypes CGSG-2 (43.33 cm) , CGR-2 (42.26 cm) ,
CGR-3 (42 cm), CGRG-1 (41.60 cm) , CGMS-2 (41.8 cm) , CGRJ-1 (40.20 cm) ,
74
CGJS-2 (40.13 cm) , PBG (40.13 cm), CGDU-1 (40 cm), PA (40 cm), PNG (39
cm), CGJS-1 (38.86 cm), CGMS-1 (38.73 cm) and CGJS-4 (38.46 cm).
The significantly earliest of days for first bud appearance were recorded in
variety PNG (48 days) which was at par with check variety PBG (48.33 days) but
significantly superior to rest of the genotypes.
For fifty percent flowering revealed that variety PBG (Check) recorded the
earliest days to 50% flowering (65.67 days) which was at par with variety PNG
(66.67 days) and genotype CGKS-1 (66.67 days). However, there treatments were
found to be superior to rest of genotypes.
The genotype CGR-2 (6.61 cm) recorded maximum flower diameter which,
however, was found to be at par with genotype CGSG-2 (6.01 cm) but superior
over rest of genotypes including check (PBG).
The maximum number of flowers plant-1
(50.73) was recorded in the
genotype CGMS-1 which, was found to be at par with genotypes CGRG-1
(50.13), PNG (48.60), CGRJ-1 (47.73), CGJS-4 (47.20), check variety PBG
(46.60), CGJS-2 (45.80), CGJS-1 (45.73) and CGMS-2 (43.53).
Significantly maximum flower weight plant-1
(228.34 g) was recorded in
genotype CGRJ-1 which, was found to be at par with genotypes CGMS-1 (212.90
g) and CGSG-2 (200.81 g) but superior over rest of the genotypes including check
(PBG).
The variety PA recorded longest duration of flowering (77 days) which,
however, was found to be at par with CGJS-3 (75), PBG (73) and PNG (70.67).
The maximum flower yield (11.26 t ha-1
) was recorded in genotype CGRJ-
1 which was found to be at par with genotypes CGMS-1 (10.52), and CGSG-2
(10.34) and PNG (9.72) but significantly superior over rest of the genotypes
including check variety PBG.
The maximum xanthophyll content (27.87 g) was recorded in the genotype
CGJS-3 which was significantly superior to all other treatments including check
variety PBG (9.58 g).

75
CONCLUSIONS
At 30 DAT, the maximum plant height was recorded in genotype CGSG-2
whereas, at 60 and 90 DAT, the genotype CGJS-4 recorded maximum
plant height.
At 30 DAT the maximum number of primary branches was recorded in
genotype CGSG-2 and at 60,90 DAT was recorded in genotype CGR-3 .
Secondary branches plant-1
were found to be maximum in treatment PNG.
Maximum number of flowers plant-1
was recorded the genotype CGMS-1
which however,was at par with genotypes CGRG-1, PNG, CGRJ-1,
CGJS-4, check variety PBG, CGJS-2, CGJS-1 and CGMS-2.
Genotype CGR-2 had the maximum flower diameter which however, was
at par with genotype CGSG-2.
Earliest days to 50 per cent flowering was noticed in genotype CGRG-2
.Whereas, the variety PA recorded longest duration of flowering and it can
be grown for taking number of picking.
Maximum Flower yield t ha-1
was recorded in genotype CGRJ-1 which
however, was at par with genotypes CGMS-1 and CGSG-2.
Genotype CGJS-3 recorded heighest xanthophyll content gram kg-1
.

76
REFERENCES
Ahmad, I., Asif, M., Amjad, A. and Ahmad, S. 2011. Fertilization enhances
growth, yield, and xanthophyll contents of marigold. Turk Journal of
Agriculture, 35 (3): 641-648.
Anonymous. 2016. Chhattisgarh Database, Directorate of Horticulture. Government of
Chhattisgarh, Raipur.
Anonymous. 2017. Horticulture crop estimate, Department of Agriculture &
Farmers Welfare (DAC&FW), Government of India,New Delhi,India.
Anuja, S. and Jahnavi, K. 2012. Variability, heritability and genetic advance
studies in French marigold (Tagetes patula L.). The Asian Journal of
Horticulture, 7(2): 362-364.
Aradhana Singh (2006). Study of performance of marigold hybrids under Pune
con-dition. M.Sc. thesis submitted to Mahatma Phule Krushi
Vidyapeeth, Rahuri.
Beniwal, B.S. and Dahiya, S.S., 2012. Variability studies in marigold (Tagetes
spp.). In: Abstracts of National Seminar on Sustainable Agriculture
and Food Security: Challenges in Changing Climate, held at CCS
Haryana Agricultural University, Hisar, Haryana, March 27-28, p. 298.
Bhaskarwar, A.C., Jadhav, G.N., Ghube, N.N., Tayade, M.M. and Patekar, T.R.
2016. Performance of different gaillardia genotypes in respect of growth,
flowering, quality and yield parameters. IJRBAT,4(2):512-517.
Bharathi, T. and Jawaharlal, M. 2014. Evaluation of African marigold (Tagetes
erecta. L). genotypes for growth and flower yield under Coimbatore
conditions. Trends in Biosciences, 7(16): 2197-2201.
Bhattacharyya, S., Datta. S., Mallick. B., Dhar, P. and Ghosh, S. 2010. Lutein
content and in vitro antioxidant activity of different cultivars of Indian

77
marigold flower (Tagetes patula L.) extracts. Journal of Agricultural
and Food Chemistry, 58(14): 8259-8264.
Black, C.A. 1965. Method of soil analysis, Amer. Argon. Due. Madison,
Wisconsin, USA, pp. 131-137.
Bolanos, N.J.L., Islas, J.H., Alvarez, B.E., Martinez, R. R. and Lopez, P. O. 2004.
Improving xanthophyll extraction from marigold flower using
cellulolytic enzymes. Journal of Agricultural and Food Chemistry,
52(11): 3394-8.
Boonnoun, P., Opaskonkun, T., Prasitchoke, P., Goto, M., Shotipruk, A. 2012.
Purification of free lutein from marigold flowers by liquid
chromatography. Engineering Journal, 16: 145-155.
Bose, T.K and Yadav, L.P. (1989). Commercial flowers. Kalyani Public. pp: 713-
729.
Cantrill, R. 2004. Lutein from Tagetes erecta. Chemical and Technical Assessment
(CTA), FAO. 63rd JECFA, 1(5): 5.
Choudhary, M., Beniwal, B. S. and Kumari, A. 2014. Evaluation of marigold
genotypes under semi-arid conditions of Haryana. Annals of
Horticulture, 7(1): 30-35.
Deineka, V. I., Sorokopudov, V. N., Deineka, L.A. and Tretyakov, M. U. 2007.
Flowers of marigold (Tagetes species) as a source of xanthophyll.
Pharmaceutical Chemical Journal, 41(10): 540-542.
El-Saeid, H. M., Hussen, M. S., Sterbeny, S. E., and Omer, E. A. (1996). Effect of
nitrogen on yield and active constituents of Tagetes Patula. Egyptian
Journal of Horticulture, 23 (1): 101-112.
Gomez, K.A. and Gomez, A.A. 1984. Statistical procedure for Agricultural
research. Second Edition, Wiley publication.

78
Gregory, G.K., Chen, T. and Philip, T. 1986. Quantitative analysis of lutein esters
in marigold flowers by high performance liquid chromatography.
Journal of Food Science, 51(4): 1093–1094.
Howe, T.K. and Waters, W.E. 1982. Evaluation of flowering annuals: Marigold
and zinnia. Florida State Horticulture Society, 95: 282-285.
Iftikhar, A. Muhammad, A., Atyab, A. and Ahmad, S. 2011. Fertilization enhances
growth, yield, and xanthophyll contents of marigold. Turk Journal of
Agriculture, 35: 641-648.
Jackson, M.L., 1967. Soil Chemical Analysis. Prentice Hall of India Private
Limited, New Delhi, India,p. 498.
Jitendra Sahu (2016). Variability, Heritability and Genetic Advance Studies in
African Marigold (Tagetes erecta L.) Genotypes. M.Sc. thesis submitted
to Indira Gandhi Krishi Vishwavidyalaya, Raipur (C.G.)
Kaul, K. and Bedi, Y.S. 2006. Natural source of luetien: Marigold (Tagetes erecta
L.), Introduction, cultivation, selection and quality improvement under
mid hill condition of Himachal Pradesh.
Kelly, R.O. and Harbaugh, B.K. (2002). Evaluation of marigold cultivars as
bedding plants in Central Florida. Horticulture Technology. 12(3):477-
484.
Khanvilkar, M.H.(2003).Performance of African Marigold(Tagetes erecta) in north
Konkan coastal zone of Maharashtra. Journal of Maharashtra
Agriculture University, 28(3):333-334.
Krol, B. 2012. Yield and chemical composition of flower heads of selected
cultivars of pot marigold (Calendula officinalis L.). Acta Horticulture,
11(1): 215-225.
Laishram, N., Dhiman, S.R., Gupta, Y.C., Bhardwaj, S.K. and Singh, A. 2013.
Microbial dynamics and physico-chemical properties of soil in the
rhizosphere of chrysanthemum (Dendranthema grandiflora) as

79
influenced by integrated nutrient management. Indian Journal of
Agricultural Science, 83(4): 447-455.
Lawrence, J.F. 1990. Determination of total xanthophyll and marigold oleoresin.
Journal of Association of Official Analytical Chemists, 2: 970-975.
Li, W., Gao, Y., Zhao, J. and Wang, Q. 2007. Phenolic, flavonoid, and lutein ester
content and antioxidant activity of 11 cultivars of chinese marigold.
Journal of Agricultural Food and Chemistry, 55(21): 8478-8484.
Ma, Q., Xu, X., Gao, Y., Wang, Q. and Zhao, J. 2008. Optimisation of supercritical
carbon dioxide extraction of lutein esters from marigold (Tagetes erecta
L.) with soybean oil as a co-solvent. International Journal of Food
Science Technology, 43: 1763–1769.
Manik.H. and Sharma.G. 2016. Promising marigold genotypes for flower and
xanthophylls yield under Chhattisgarh plains condition. Advances in
Life Science 5 (7):2659-2662.
Munikrishnappa, P.M., Patil, A.A., Patil, V.S., Patil, B.N., Channappagoudar, B.
B. and Alloli, T. 2013. Studies on the growth and yield parameters of
different genotypes of China aster (Callistephus chinensis Nees.).
Karnataka Journal of Agricultural Science, 26(1): 107-110.
Naik, B. 2003. Stability analysis and standardization of production technology for
flower and xanthophyll yield in marigold (Tagetes spp.). Ph.D. Thesis,
University of Agricultural Sciences, Dharwad.
Naik, B.H., Patil, A.A. and Basavaraj, N. 2005. Stability analysis in African
marigold (Tagetes erecta L.) genotypes for growth and flower yield.
Karnataka Journal of Agricultural Science., 18(3): 758-763.
Nair, A.S. and Shiva, K. N. 2003. Genetic variability, correlation and path
coefficient analysis in gerbera journal of Ornamental Horticulture. 6 (3):
180-187.

80
Nair, A.S. and Medhi, R.P. 2002. Performance of gerbera cultivars in the Bay
Islands. Indian journal of Horticulture. 59 (3): 322-225.
Narsude, P.B., Kadam, A.S. and Patil, V. K. 2010 a. Studies on the growth and
yield attributes of different African marigold (Tagetes erecta L.)
genotypes under Marathwada conditions. Asian Journal of Horticulture,
5(2): 284-286.
Narsude, P.B., Kadam, A.S. and Patil, V.K. 2010 b. Studies on the growth and
quality attributes of different African marigold (Tagetes erecta L.)
genotypes under Marathwada condition. The Asian Journal of
Horticulture, 5 (2): 407-410.
Olsen, S.R., Cole, C.V., Watanabe, F.S. and Dean, L. S. 1954. Estimation of
available P in soil by extraction with sodium bicarbonate. Circular
United State Department of Agriculture, p. 939.
Palai, L., Pratap, M. and Amrender, S. 2008. Evaluation of yellow coloured
chrysanthemum for growth, flowering and yield. The Orissa Journal of
Horticulture, 36(11): 116- 119.
Panwar, S., Singh, K.P., Janakiram, T. and Namita 2013. Genetic variability,
heritability and genetic advance in African marigold (Tagetes erecta L.)
genotypes. Progressive Horticulture, 45(1): 135-140.
Piper, C. S. 1967. In Soil and plant analysis. Hans publication, Bombay, p.368.
Poonam and Kumar, A. 2007. Garden beauty – A, promising chrysanthemum
cultivars of garden decoration. Jornal of Ornamental Horticulture, 10(3):
165-168.
Pratheesh, V.B., Benny, N. and Sujatha, C.H. 2009. Isolation, stabilization and
characterization of xanthophyll from marigold flower, Tagetes erecta L.
Modern Applied Science, 3(2): 19-28.

81
Raghuvanshi, A. and Sharma, B.P. 2011. Varietal evaluation of French marigold
(Tagetes patula Ninn.) under mid-hill zone of Himachal Pradesh.
Progressive Agriculture, 11(1): 123126.
Rao, C.C., Goud, P.V., Reddy, K. M. and Padmaja, G. 2005. Screening of African
marigold (Tagetes erecta L.) cultivars for flower yield and carotenoid
pigments. Indian Journal of Horticulture, 62(3): 276-279.
Ravikumar. 2002. Evaluation of China aster (Callistephus chinesis (L.) Nees)
genotypes under transitional zone of north Karnataka. M.Sc. (Agri.)
Thesis, University Agricultural Science, Dharwad (India).
Sarkar, C.R., Bhagawati, B., Das, L. and Goswami, B.C. 2012. An efficient
condition of saponification of lutein ester from marigold flower. Annals
of Biological Research, 3(3):1461-1466.
Shivakumar, Srinivasa, V., Sudeep, H.P., Shivayya, K.M. and Ketana, G.B. 2014.
Correlation studies in African marigold (Tagetes erecta L.) genotypes.
International Journal on Biological Science, 5 (2): 83-87.
Singh, D. and Singh, A.K. 2006. Characterization of African marigold (Tagetes
erecta Linn.). Journal of Ornamental Horticulture, 9(1): 40-42.
Singh, D., Sen, N.L. and Sindhu, S.S. (2003). Evaluation of marigold germplasm
under semi- arid conditions of Rajstan . Harayana Journal of Horticulture
Science, 32 (394):206-209.
Singh, D. and Misra, K.K. 2008. Genetic variability in quantitative characters of
marigold. Indian Journal Horticulture, 65(2): 187-192.
Singh, D. and Misra, K.K., 2009. Assessment of genetic traits of marigold (Tagetes
spp.) germplasm in Uttarakhand. Journal of Hill Research, 22(2): 86-94.
Singh, K.P. and Sangama. 2000. Effect of graded level of N and P on China aster
(Callistephus chinensis) cv. 'Kamini'. Indian Journal of Horticulture,
57(1): 87-89.

82
Subbiah, B.V. and Asija, G.L. (1956). A rapid procedure for the determination of
available nitrogen in soil. Current Sci., 25: 259-260.
Subha, B.M. (2006). Integrated nutrient management for growth, flowering and
xanthophylls yield of marigold (Tagetes erecta L.). M. Sc. (Ag.) Thesis,
Dharwad University of Agricultural Sciences, Dharwad.
Sujith, A., Hymavathi, T.V. and Devi, P.Y. 2012. Supercritical fluid extraction of
lutein esters from marigold. In. Journal of Biological and Life Sciences,
6(2):67-75.
Sunitha, H.M., Ravi, Hunje, Vyakaranahal, B.S. and Bablad, H.B. (2007). Effect of
pinching and growth regulators on plant growth, flowering and seed
yield in African marigold (Tagetes erecta Linn.). Journal of
Ornamental Horticulture, 10(2): 91-95.
Tiwary, B.K., Kumar, A., Nanda, A.K. and Chakraborty, R. 2014. A study on
optimization of marigold petal yield, pure lutein, and formulation of
free-flowing lutein esters. Journal of Crop Science Biotechnology.,
17(3): 175-181.
Vargas, F.D. and Lopez, O.P. 1997. Effects of Enzymatic Treatments of Marigold
Flowers on Lutein Isomeric Profiles. Journal of Agricultural and Food
Chemistry, 45(4): 1097–1102.
Verma, K.K. and Beniwal, B.S. 2006. Evaluation of marigold (Tagetes erecta L.)
genotypes for resistance against root-knot nematode, Meloidogyne
javanica. National Journal of Plant Improvement, 8(2): 184-185.
Verma, S. K., Singh, R. K., and Arya, R. R. (2004). Evaluation of Tagetes
germplasm. Scientific Horticulture, 9:219-224.
Zosiamliana, J. H., Reddy, G. S. N. And Rymbai, H., 2012, Growth, flowering and
yield characters of some cultivars of China aster (Callistephus chinensis
L. Ness). J. Natural Production Plant Resource. 2(2): 302-305.

83
Appendix-I: Meteorological details about the weather conditions prevailing during the course of experiment
Wk No. Date Max.Temp.
(°C)
Min.
Temp. (°C)
Rain-fall
(mm)
Relative
Humidity (%)
Vapour
Pressure (mm
of Hg)
Wind
speed
(kmph)
Evapo-ration
(mm)
Sun
shine
(hours)
I II I II
23 6June-12June 40.8 25.0 00 57.2 32.5 19.2 17.6 9.1 11.2 8.3
24 13-19 38.9 26.3 9.6 72.0 40.0 20.7 18.1 6.7 8.4 5.3
25 20-26 35.3 26.3 3.0 84.4 53.5 23.2 22.6 5.5 6.2 6.2
26 27-3 34.5 26.2 10.6 89.4 64.1 23.7 23.6 6.6 6.2 6.7
27 4July-10July 28.6 24.6 10.7 95.4 85.4 22.9 23.9 10.7 2.6 0.4
28 11-17 30.2 24.6 17.6 92.1 79.4 22.7 22.9 7.7 3.1 1.8
29 18-24 30.9 24.8 24.5 92.5 77.0 23.1 24.1 5.0 3.8 2.2
30 25-31 32.0 25.3 3.6 92.0 69.2 23.4 23.3 4.4 4.7 6.2
31 1Aug.-7Aug. 28.7 25.1 16.5 91.7 84.7 22.6 23.5 8.2 2.5 0.7
32 8.-14 30.0 22.3 2.7 89.1 73.1 22.2 22.3 8.8 3.3 2.3
33 15-21 28.9 11.3 1.6 88.4 72.2 21.3 20.8 8.7 2.9 3.1
34 22-28 31.6 25.8 3.7 91.4 73.2 23.9 23.2 4.0 3.6 3.8
35 29-4 32.4 25.7 7.8 91.2 68.8 24.2 23.5 4.6 3.6 3.9
36 5Sep.-11Sep. 30.6 25.0 09 86.7 67.5 21.8 22.1 4.5 3.3 1.2
37 12-18 31.2 24.7 16.1 94.5 78.8 23.8 24.2 2.5 3.9 4.6
38 19-25 31.9 24.8 9.2 93.7 73.4 23.6 23.3 3.4 4.6 6.2
39 26-2 29.4 24.4 20.6 97.2 85.8 23.4 23.7 2.5 3.2 3.0
40 3Oct.-9Oct. 30.7 24.6 5.5 96.2 70.4 23.7 22.9 1.7 2.9 3.4
41 10-16 32.1 21.4 00 91.1 37.4 18.9 13.5 1.3 3.8 7.9
42 17-23 31.2 18.5 00 91.5 35.8 16.2 12.1 1.2 3.8 10.0
43 24-30 31.3 18.9 00 85.1 41.1 14.8 13.5 1.7 3.7 8.8
44 31-6 30.4 19.9 00 83.8 47.1 15.4 14.8 2.3 3.4 8.0
45 7Nov.-13Nov. 29.7 13.6 00 91.7 28.2 11.5 8.4 1.4 3.4 8.6
46 14-20 29.2 13.5 00 87.5 31.0 11.3 9.5 1.5 3.0 8.0
47 21-27 30.4 11.9 00 88.1 24.2 9.9 7.6 1.8 3.0 8.6
48 28Nov.-4Dec. 30.1 13.8 00 88.2 33.7 11.3 10.1 1.4 3.2 8.2

7/6/2017 Gmail - TRENDS IN BIOSCIENCES JOURNAL NAAS SCORE 3.94 from 2017 (ISSN – PRINT -0974-8431 & ONLINE - 0976-2485)
https://mail.google.com/mail/u/0/?ui=2&ik=331a7eef61&jsver=lEZPUTRTfxI.en.&view=pt&search=inbox&th=15d071a5bcab44d9&siml=15d07199c… 1/7
MANISHA NETAM <[email protected]>
TRENDS IN BIOSCIENCES JOURNAL NAAS SCORE 3.94 from 2017 (ISSN – PRINT-0974-8431 & ONLINE - 0976-2485) 5 messages
TRENDS IN BIOSCIENCES JOURNAL <[email protected]> Mon, Jul 3, 2017 at 11:48 AMTo: MANISHA NETAM <[email protected]>
TRENDS IN BIOSCIENCES JOURNAL
NAAS SCORE 3.94 from 2017(ISSN – PRINT -0974-8431 & ONLINE - 0976-2485)
Dear Sir/Madam,
Accepted for Trends In Biosciences Journal – JULY, 2017 ISSUE
We accept your manuscript for publication in TRENDS IN BIOSCIENCESJOURNAL FREQUENCY - 48 ISSUES PER YEAR
MANUSCRIPTNO(MSSNO)-8394
TITLE-Evaluation of Marigold Genotypes under ChhattisgarhPlains Agro-Climatic Condition
Manisha Netam1*, Gaurav Sharma2
PUBLICATION FEE + PRINT COPY FEE – RS 2000 + 200 = RS 2200
LAST DATE FOR FEE SUBMISSION – 09-JULY-2017
ADDITIONAL PRINT COPY FEE (OPTIONAL) - RS 400 PER COPY
KINDLY FILL ONLINE AUTHOR DETAIL FORM
(copy and paste link on browser)