study of weld imperfections on thin aluminum tubes ...s report rabel... · study of weld...
TRANSCRIPT

Study of Weld Imperfections on Thin Aluminum Tubes
According To ISO 10042
Summer Student internship – 30/06/2014 till 22/08/2014
Presented by:
Rabel Rizkallah
NOTRE DAME UNIVESITY-LOUAIZE, LEBANON
Faculty of Engineering
ME Department
EN/MME/FW
&
EN/MME/MM
Supervisors:
Said Atieh
&
Jean-Michel Dalin

1
Table of Contents
Acknowledgements: ............................................................................................................... 2
Abstract .................................................................................................................................. 3
Introduction ............................................................................................................................ 4
Part I
Aluminum’s Importance ................................................................................................ 5
Used Material ................................................................................................................. 8
The GTAW Process or TIG Welding Process ............................................................... 9
Aluminum Welding: The Difficulties and Precautions ................................................ 11
The Objective and Actual Work .................................................................................. 14
Radiographic and Visual Testing ................................................................................. 16
Metallographic Testing ................................................................................................ 19
Sectioning: .................................................................................................... 19
Mounting: ...................................................................................................... 21
Polishing: ...................................................................................................... 22
Etching: ......................................................................................................... 23
Macroscopic Images and Results ................................................................................. 25
Preparation of the Catalogue’s Forms .......................................................................... 28
Form One ...................................................................................................... 31
Form Two ...................................................................................................... 32
Form Three .................................................................................................... 33
Form Four ..................................................................................................... 34
Finishing of the Catalogue ........................................................................................... 35
Part II .................................................................................................................................... 36
Leak of the VJ Vacuum Chamber of ATLAS .............................................................. 36
Micro-Tomographic Testing ........................................................................................ 37
Advantages and Perspective ......................................................................................... 40
Conclusion ............................................................................................................................ 42

2
Acknowledgements:
I would like to thank both of my supervisors, Said Atieh and Jean-Michel Dalin, for
their constant support and encouragements, and for their availability and help during my
work.
I also wish to thank Aline Piguiet and Alexandre Porret, my office colleagues, who
always found time to help and support me even with their many obligations.
Many thanks also to Frederic Excoffier and Pascal Mesenge who provided me the
samples used for the project and found time to do so even though they had a lot of more
urgent jobs to attend to.
My thanks also go to Alexandre Gerardin for his help and advices regarding the
metallographic testing notably with the polishing and etching processes as well as the use of
the Leica microscope for the macroscopic views.
I also wish to thank the entire MM section with the likes of Stefano Sgobba, leader of
the MM section, as well as Gonzalo Arnau Izquierdo, Ana Teresa Perez Fontenla, Ignacio
Aviles Santillana, Stefanie Langeslag, Barbora Bartova and Floriane Léaux.

3
Abstract
The following report presents the work done as part of my summer student internship
at CERN in the EN/MME group, and is divided into two parts. Part I of the report is a
continuation of the work started previously by the student Quentin Drouhet, which aims at
studying and classifying welding imperfections on various materials of small thicknesses.
Drouhet worked on the welding imperfections found on thin Stainless Steel plates of
thicknesses of 2 and 6 millimeters, welded using the GTAW (or TIG welding) process. My
job was to conduct a similar study on thin Aluminum tubes welded using this same process.
The samples used for the study were made of EN AW 5083 and came with two different
thicknesses of the tubes, of 1.5 and 2.2 millimeters. Studying the welding imperfections was
based on visual testing, radiographic testing and metallographic testing. The classification of
these imperfections in a reference catalogue is important as it helps engineers and technicians
recognize and identify the various imperfections that could be encountered during welding
and compare them to the norm (the ISO 10042 was used) regulating the quality levels. This is
even more important for people working in welding or with the welds, and not familiar with
the norms and standards. Part II of the report will introduce a new method for defect analysis
that is still not available at CERN: the micro-tomographic testing. This method, which
analyses the cross section of a weld for every 15 microns increment in a direction
perpendicular to it, will be tested on a defect found on one of the VJ vacuum chambers of the
ATLAS experiment that was spotted during a leak test. The micro-tomographic testing was
chosen because it allows spotting very small defects that the conventional methods used in
Part I cannot spot. Both Part I and Part II of the report were successful in the sense that the
imperfections and defects were clearly observed and identified. Seven imperfections on four
macroscopic views were obtained in Part I of my work, which went beyond expectations
taking into consideration the lack of available time to work on the project. However, it didn’t
allow the completion of the reference catalogue as more imperfections need to be obtained.
The completion of the catalogue will be done during a future student internship. As for the
micro-tomographic testing, the method allowed us to identify a second leak that wasn’t
spotted at CERN, and presented us with excellent quality radiographic images of the weld
which were used to create a simulation of the defect as one moves through the cross-section,
along the weld. The operation of both leaks was clearly understood, and the method also gave
us the benefit of an important time saving as compared to what would be required if
conventional methods were adopted instead.
4
Introduction
Welding is a very common and important process that enters in virtually any
engineering design at CERN. Also, Aluminum, which is one of the most used materials at
CERN, happens to be one of the most difficult metals to weld because of some of its
properties and characteristics that affect the welding process. Moreover, most of the
Aluminum that is welded at CERN comes in the form of tubes, which is more critical than
plate welding, as imperfections are more susceptible to appear on tube welding. This is the
motivation behind the study of welding imperfections on Aluminum tubes and their
classification in a reference catalogue. The samples used for creating the imperfections to be
studied were thin Aluminum tubes made of EN AW 5083 alloy, and came with two
thicknesses of 1.5 millimeters and 2.2 millimeters. The long term objective of the project
would be to recreate as many imperfections as possible and classify them in a reference
catalogue, which would help engineers and technicians identifying weld imperfections and
compare them to the quality requirements as regulated by the ISO 10042 norm. The work
done in order to realize this reference catalogue will be the subject of Part I of the report.
The procedure used in Part I of the report to study the welding imperfections is based
on visual testing (VT), radiographic testing (RT) and metallographic testing. However, these
methods take time, and don’t allow the observation of very small defects. In the latter case, a
different approach has to be applied in order to be able to see some defects that even if small
can prove critical and lead to important problems. This is addressed in Part II of the report
where a small leak was identified during a leak test on an Aluminum weld in one of the VJ
vacuum chambers of the ATLAS experiment. The conventional methods of Part I proved
insufficient to analyze the defect responsible of the leak, and micro-tomographic testing was
used instead. Details on the obtained results and the advantages this new method provides
will be discussed later on in Part II.

5
Part I
Aluminum’s Importance
Aluminum is replacing Stainless Steel as a material in the newest vacuum chambers
as can be seen in the ATLAS vacuum chambers and studies are ongoing to even replace
Beryllium with some new transparent Aluminum alloys. The reason why we are interested in
Aluminum as a material is because of its excellent mechanical and physical properties. While
Aluminum based alloys and Stainless Steels both present excellent cryogenic properties,
Aluminum has some important advantages over Stainless Steels in the applications related to
vacuum and ultra-high.
Figure 1: Aluminum is the Future
One of the biggest advantages of Aluminum over Stainless Steels lies in its high
strength to weight ratio. Typical density of an Aluminum alloy is of around ,
which is roughly three times less than the density of a typical Stainless Steel material that is
around . On the other hand, Aluminum alloys are typically only two times less
hard than steels, with some alloys even matching steels’ hardness. The combination of this
very low density and quite high strength makes Aluminum an excellent material for
engineering applications, as we still get the required strength, with much less weight. And
less weight means less energy and less money spent. Aluminum is also very ductile and easy
to machine; much easier than steel for instance.
Aluminum vacuum chambers have excellent vacuum and ultra-high vacuum
properties. Aluminum is for instance ten millions of times less permeable to Hydrogen than
Stainless Steel is. Aluminum alloys have also less carbon in their composition than Stainless

6
Steels (all steels have carbon in their composition). This means that Aluminum vacuum
chambers have much less H2, H2O, hydrocarbon vapor and carbon based gas contamination at
ultra-high vacuum level. Aluminum also presents a thin oxide layer that protects the material
from oxidation since this oxide layer is saturated and cannot withstand further oxygen atoms.
Moreover, this saturated oxide layer serves as a barrier that prevents diffusion and desorption
of Hydrogen, Oxygen and Carbon and therefore protects from contamination at vacuum and
ultra-high vacuum levels.
Outgassing rates on Aluminum vacuum chambers have also reached excellent levels
with rates of less than now possible. Aluminum also presents very high
thermal conductivity, in the range of , while all steels have a thermal
conductivity falling between and . This means that baking and then
cooling an Aluminum vacuum chamber will be done much faster than a similar chamber
made of Stainless Steel. Also, because of the high thermal conductivity of Aluminum, a
complete bake out is possible with no risk of condensation of gases on local cool spots as the
entire system will have a uniform temperature change.
Figure 2: Aluminum Tube Chamber
Aluminum is also an amagnetic material which is an advantage when working on
beams made of charged particles, as the Aluminum won’t affect nor the trajectory of the
beam neither the magnetic field of the concerned control magnets. Stainless Steels on the
other hand do exhibit some residual magnetism, as it is an Iron alloy. Moreover, Aluminum
has a much faster induced radioactivity decay compared to Stainless Steels. If bombarded
with the same flux, residual radioactivity one can find in the Aluminum material will be
typically between one and two orders of magnitude lower than what will be found on a
Stainless Steel material.
Finally, let’s point out that ongoing studies are even trying to replace the Beryllium of
the vacuum chambers with some new Aluminum alloys. The reason for this is that Beryllium

7
is toxic, very expensive and difficult to obtain. The main advantage of Beryllium is that it is
extremely transparent, which is a very important property as the detectors are placed outside
the vacuum chamber. New Aluminum alloys do exhibit similar characteristics and research is
ongoing to improve their weldability and mechanical properties.
8
Used Material
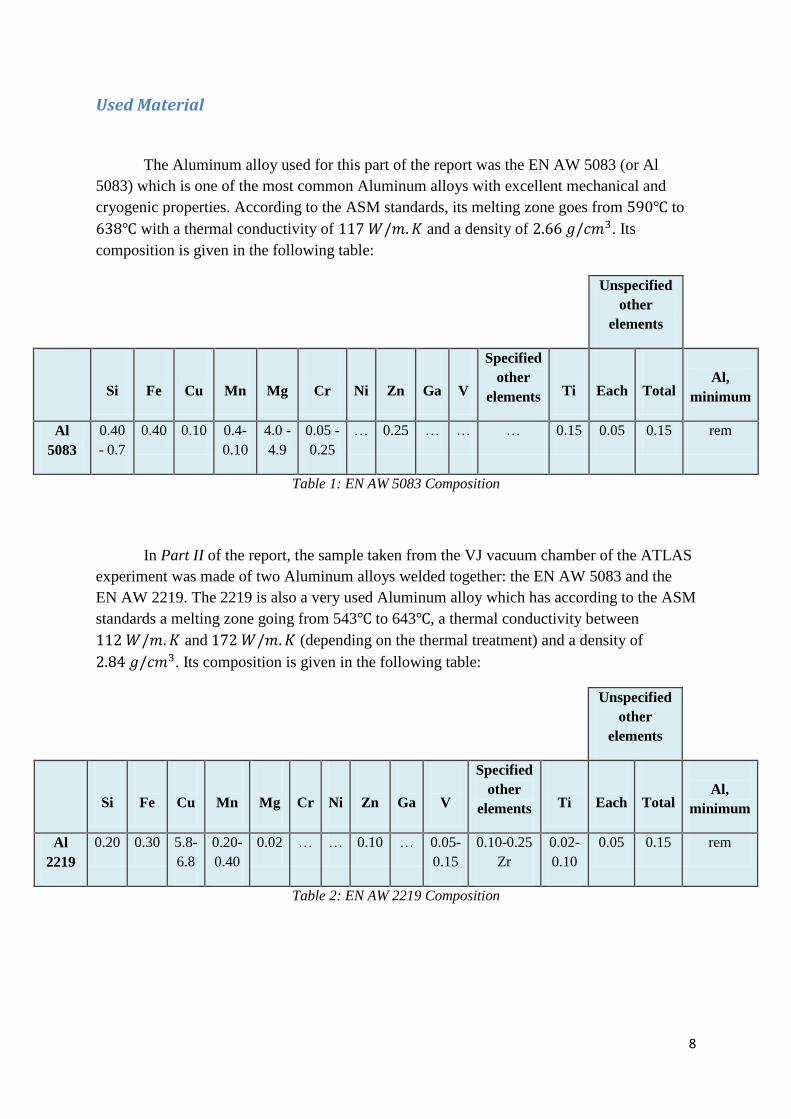
The Aluminum alloy used for this part of the report was the EN AW 5083 (or Al
5083) which is one of the most common Aluminum alloys with excellent mechanical and
cryogenic properties. According to the ASM standards, its melting zone goes from to
with a thermal conductivity of and a density of . Its
composition is given in the following table:
Unspecified
other
elements
Si
Fe
Cu
Mn
Mg
Cr
Ni
Zn
Ga
V
Specified
other
elements
Ti
Each
Total
Al,
minimum
Al
5083
0.40
- 0.7
0.40 0.10 0.4-
0.10
4.0 -
4.9
0.05 -
0.25
… 0.25 … … … 0.15 0.05 0.15 rem
Table 1: EN AW 5083 Composition
In Part II of the report, the sample taken from the VJ vacuum chamber of the ATLAS
experiment was made of two Aluminum alloys welded together: the EN AW 5083 and the
EN AW 2219. The 2219 is also a very used Aluminum alloy which has according to the ASM
standards a melting zone going from 543 to 643 , a thermal conductivity between
and (depending on the thermal treatment) and a density of
. Its composition is given in the following table:
Unspecified
other
elements
Si
Fe
Cu
Mn
Mg
Cr
Ni
Zn
Ga
V
Specified
other
elements
Ti
Each
Total
Al,
minimum
Al
2219
0.20 0.30 5.8-
6.8
0.20-
0.40
0.02 … … 0.10 … 0.05-
0.15
0.10-0.25
Zr
0.02-
0.10
0.05 0.15 rem
Table 2: EN AW 2219 Composition
9
The GTAW Process or TIG Welding Process
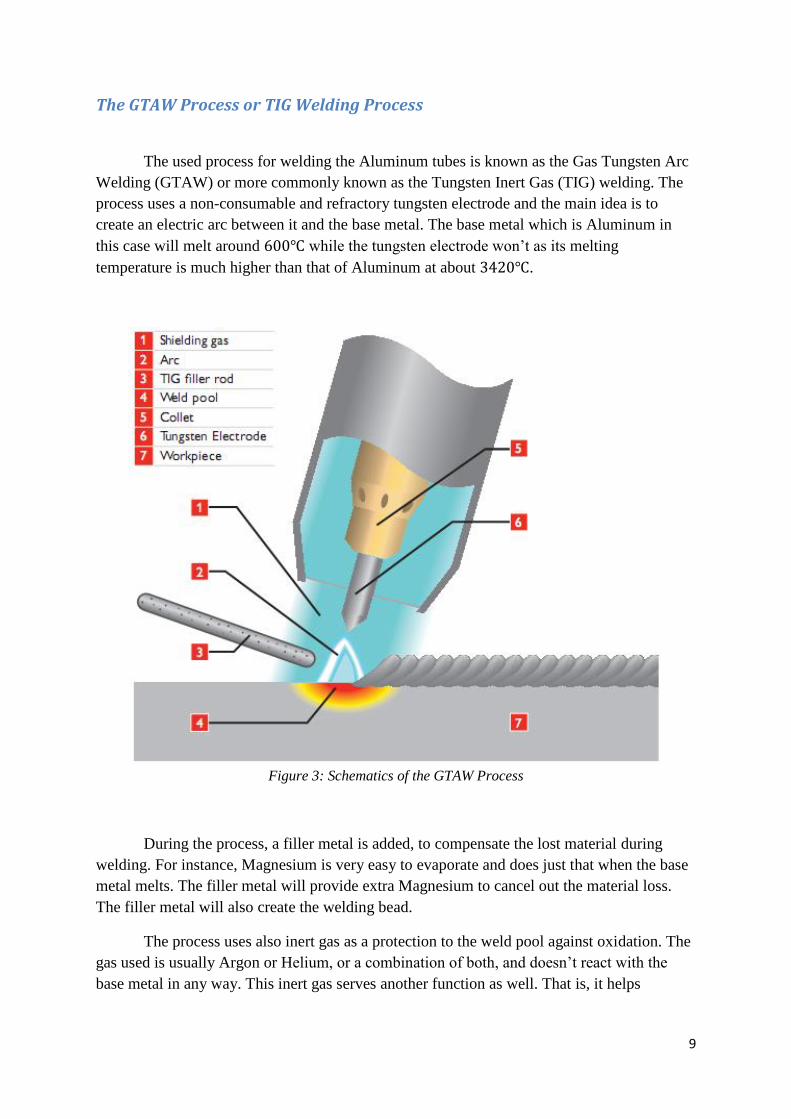
The used process for welding the Aluminum tubes is known as the Gas Tungsten Arc
Welding (GTAW) or more commonly known as the Tungsten Inert Gas (TIG) welding. The
process uses a non-consumable and refractory tungsten electrode and the main idea is to
create an electric arc between it and the base metal. The base metal which is Aluminum in
this case will melt around while the tungsten electrode won’t as its melting
temperature is much higher than that of Aluminum at about .
Figure 3: Schematics of the GTAW Process
During the process, a filler metal is added, to compensate the lost material during
welding. For instance, Magnesium is very easy to evaporate and does just that when the base
metal melts. The filler metal will provide extra Magnesium to cancel out the material loss.
The filler metal will also create the welding bead.
The process uses also inert gas as a protection to the weld pool against oxidation. The
gas used is usually Argon or Helium, or a combination of both, and doesn’t react with the
base metal in any way. This inert gas serves another function as well. That is, it helps
10
maintain a stable arc between the tungsten electrode and the base metal, as it ionizes during
welding.
The GTAW process is used on Aluminum quite extensively as it allows welding of a
large interval of thicknesses going from 0.25 millimeters to 150 millimeters, and it is
relatively slow with a slow solidification in comparison with electron beam welding for
instance. This facilitates the welding of tubes and pipes, and allow for higher degassing and
limits risks of lack of fusion.
The welding quality obtained is affected by many parameters. One of these
parameters is the current intensity or input energy. As a rule of thumb, the current must
satisfy the expression where is the current intensity and the thickness of the
base metal. This will give us a compromise between intensity and penetration depth. Another
important parameter is the choice of the filler metal. The filler metal has to be as close as
possible to the base metal in terms of mechanical properties and composition, in order to
obtain a certain mechanical and structural homogeneity in the weld. Also, the flux of inert gas
has to be proportional to the diameter of the collet with per millimeter of the collet
diameter. The position of the torch is also important, as well as the advance speed and the
type of alimentation, i.e., AC or DC current, and direct or reversed polarity.
11
Aluminum Welding: The Difficulties and Precautions
There are many types of weld imperfections or defects that can occur during welding.
Even though many of these imperfections are common to all welding processes for all
different materials, they are affected by the material that is being welded and by the welding
technique. For instance, tungsten inclusion won’t be found on samples welded with electron
beam welding, and root porosity which can occur on Stainless Steel welding is almost never
found on Aluminum welding.
Aluminum welding presents more difficulties as compared to other materials like
Stainless Steel because of some of its characteristics.
The first difficulty we face when welding Aluminum is the formation of a layer of
Aluminum Oxide at the contact between the Aluminum metal and the atmosphere. This
Aluminum Oxide comes in two layers. There’s the first layer, or inner layer, of Al2O3 very
strongly bounded to the metal, which plays the role of barrier, is saturated and prevent further
oxidation. The second layer, or outer layer, of Al(OH)3 and Al2O3.H2O, respectively bayerite
and bohemite, much thicker than the first layer. Removing the oxide layer before proceeding
to welding is a necessity because its melting temperature of is much higher than the
melting temperature zone of the Aluminum base metal which is around the mark as
was already seen. If the oxide layer isn’t removed, what can happen is that the base metal will
melt without the oxide layer which will lead to a lack of fusion. Moreover, oxide inclusions
can occur. Also, since this oxide double layer formation is extremely fast, it needs to be
removed just before welding. This can be done by mechanical or chemical means. However
removing the oxide layer mechanically is the most adopted solution, and is safer than the
chemical approach as there’s no risks whatsoever of letting the Aluminum base metal
reacting with the etching solutions. During welding, it is also strongly recommended to weld
using alternating current (AC current) to allow for cathodic bombardment. That is, during the
positive half-cycle, the base metal will be bombarded by ions instead of electrons, which will
break and disperse the forming oxide. This doesn’t mean that using DC current isn’t possible
of course, and DC current is indeed used to weld Aluminum with Helium as the inert gas
because it is much hotter than argon.
Another difficulty of Aluminum welding is the big Heat Affected Zone, or HAZ as
compared to other metals like Stainless Steel. This is due to many properties of Aluminum
including the big thermal expansion and the spread of the melting zone, as well as the
welding technique, as the TIG welding leads to a higher HAZ than electron beam welding for
example. Because of this, and because Aluminum doesn’t show any color change before
melting, special attention needs to be given to the input energy and the advance speed. If the
energy is too high, or the advance speed to low, the HAZ will be bigger, allowing segregation
to happen, which will weaken the base metal, and may lead to cracks. Preheating can improve
the penetration depth and the advance speed, which will facilitate welding.

12
Finally, the biggest source of imperfections in Aluminum welding is the huge
solubility of Hydrogen in melted Aluminum. When Aluminum is in its solid state, Hydrogen
solubility is negligible and almost inexistent. But as soon as Aluminum melts, this solubility
increases drastically. The following plot shows the solubility jump of Hydrogen in pure
Aluminum which melts at .
Figure 4: Hydrogen Solubility in Aluminum
Hydrogen solubility in Aluminum alloys follows the same logic. And because of the
big thermal conductivity of Aluminum, the Hydrogen has little time to escape, and gets
trapped inside the Aluminum as it solidifies. This is the main source of porosities and is often
seen in Aluminum welding. This is a much more critical issue with electron beam welding
because as was mentioned already, TIG welding is slower with relatively slow solidification
as compared to electron beam welding which has a very fast solidification rate. This is why
one usually goes to TIG welding to avoid trapping Hydrogen in Aluminum. But porosities
due to trapped Hydrogen in the base metal are observed in TIG welding nevertheless, and
special attention should be taken in order to avoid it. Humidity, oils, paints… are all sources
of Hydrogen and must be removed before proceeding to welding. Preheating the base metal is
also recommended as it helps remove humidity from it.
Of course, as for all other metals, Aluminum welding is affected by the welding
parameters used. The energy input, the advance speed, the inert gas protection and choice of
the gas, the choice of filler metal, the position of the torch, etc. … are all parameters that
13
affect the welding process. If these parameters aren’t well chosen, welding imperfections and
defects can occur in the weld.
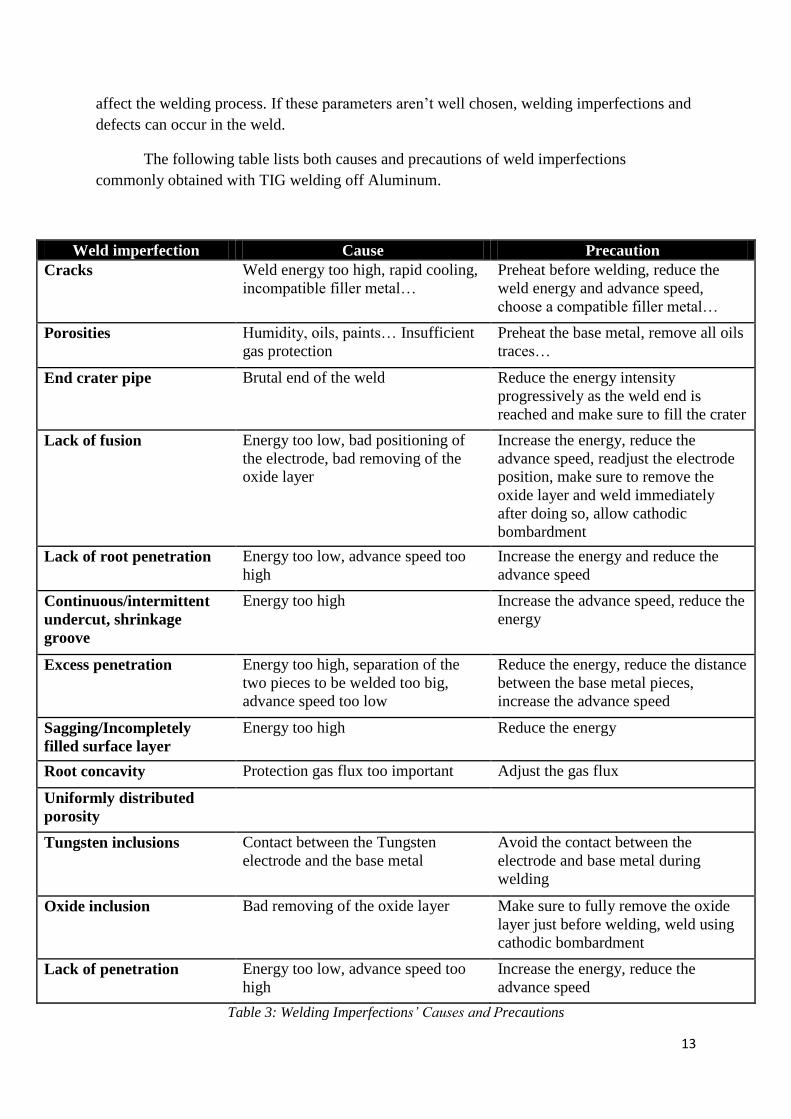
The following table lists both causes and precautions of weld imperfections
commonly obtained with TIG welding off Aluminum.
Weld imperfection Cause Precaution
Cracks Weld energy too high, rapid cooling,
incompatible filler metal…
Preheat before welding, reduce the
weld energy and advance speed,
choose a compatible filler metal…
Porosities Humidity, oils, paints… Insufficient
gas protection
Preheat the base metal, remove all oils
traces…
End crater pipe Brutal end of the weld Reduce the energy intensity
progressively as the weld end is
reached and make sure to fill the crater
Lack of fusion Energy too low, bad positioning of
the electrode, bad removing of the
oxide layer
Increase the energy, reduce the
advance speed, readjust the electrode
position, make sure to remove the
oxide layer and weld immediately
after doing so, allow cathodic
bombardment
Lack of root penetration Energy too low, advance speed too
high
Increase the energy and reduce the
advance speed
Continuous/intermittent
undercut, shrinkage
groove
Energy too high Increase the advance speed, reduce the
energy
Excess penetration Energy too high, separation of the
two pieces to be welded too big,
advance speed too low
Reduce the energy, reduce the distance
between the base metal pieces,
increase the advance speed
Sagging/Incompletely
filled surface layer
Energy too high Reduce the energy
Root concavity Protection gas flux too important Adjust the gas flux
Uniformly distributed
porosity
Tungsten inclusions Contact between the Tungsten
electrode and the base metal
Avoid the contact between the
electrode and base metal during
welding
Oxide inclusion Bad removing of the oxide layer Make sure to fully remove the oxide
layer just before welding, weld using
cathodic bombardment
Lack of penetration Energy too low, advance speed too
high
Increase the energy, reduce the
advance speed
Table 3: Welding Imperfections’ Causes and Precautions

14
The Objective and Actual Work
The objective of Part I is to recreate as many defects as possible on welded
Aluminum tubes, welded using the GTAW process. For this, two EN AW 5083 alloy tubes
were used. One tube with a 1.5 mm thickness and an 83 mm diameter, and a second tube with
a 2.2 mm thickness and a 124.6 mm diameter. Each tube came with three sample welds on
them: on the 1.5 mm thickness tube, the three welds were named respectively A, S1 and S2,
and on the 2.2 mm thickness tube, the three welds were named A2, S3 and S4.
Figure 5: View of Weld A Figure 6: View of Weld A2
Figure 7: View of Weld S1 Figure 8: View of Weld S2
Figure 9: View of Weld S3 Figure 10: View of Weld S4

15
The procedure to analyze these welds consisted in running both visual and
radiographic testing on the welds, to identify the imperfections and choose the typical ones to
be used in the reference catalogue we’re aiming at. Once the imperfections are chosen, the
welds will be sectioned to isolate the imperfections on small samples that will be prepared for
the metallographic testing that comes before the macroscopic observation. Each imperfection
will be listed in a form of the reference catalogue, along with its corresponding radiographic
and macroscopic views, as well as an actual picture of the weld as it looks from the outside
and inside of the tube at the position of the imperfection, and a comparison to the ISO 10042
to assess its quality level.
The following sections will detail these procedures.
16
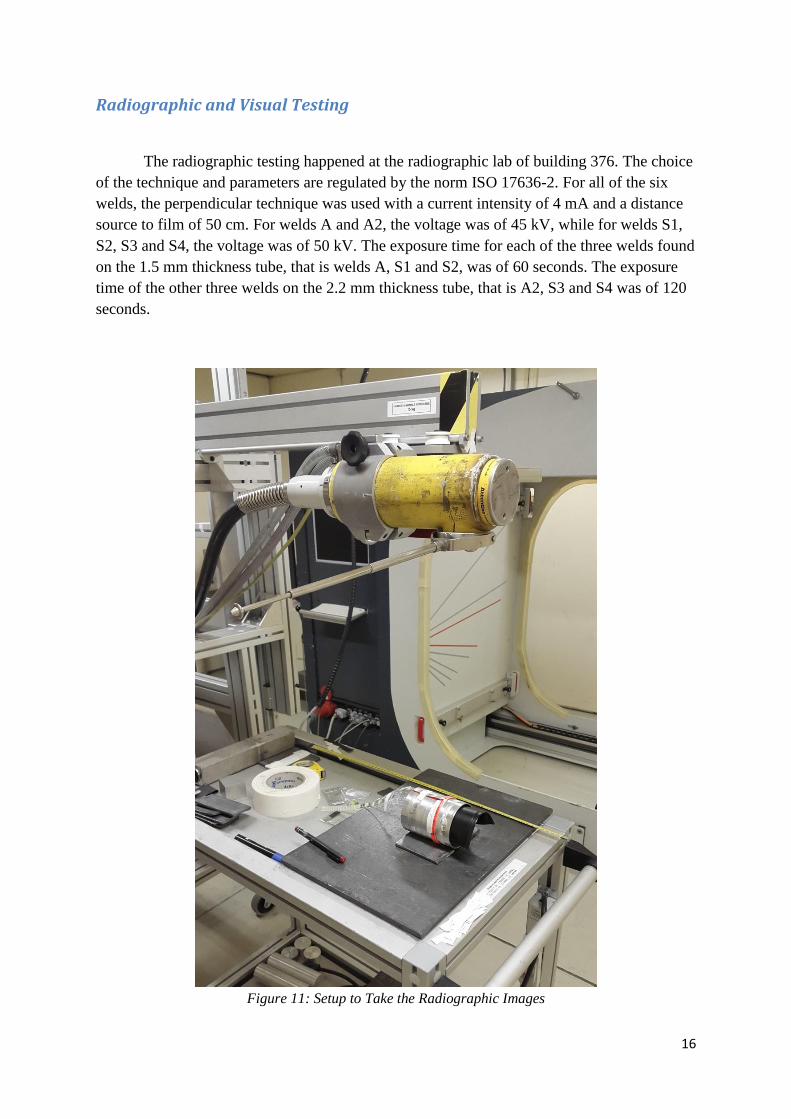
Radiographic and Visual Testing
The radiographic testing happened at the radiographic lab of building 376. The choice
of the technique and parameters are regulated by the norm ISO 17636-2. For all of the six
welds, the perpendicular technique was used with a current intensity of 4 mA and a distance
source to film of 50 cm. For welds A and A2, the voltage was of 45 kV, while for welds S1,
S2, S3 and S4, the voltage was of 50 kV. The exposure time for each of the three welds found
on the 1.5 mm thickness tube, that is welds A, S1 and S2, was of 60 seconds. The exposure
time of the other three welds on the 2.2 mm thickness tube, that is A2, S3 and S4 was of 120
seconds.
Figure 11: Setup to Take the Radiographic Images

17
Also, in accordance to the ISO 17636-2, an image quality index (IQI) was used to
assess the quality of the radiographs and determine whether or not interpretation of the
radiographs is possible. The IQI used was the Al 13.
This way, 33 digital radiographs were obtained as follows:
7 radiographs for weld A
6 radiographs for weld A2
7 radiographs for weld S1
5 radiographs for weld S2
4 radiographs for weld S3
4 radiographs for weld S4
Figure 12: Radiographic Image of Weld A2
Figure 13: Radiographic Image of Weld S1
18
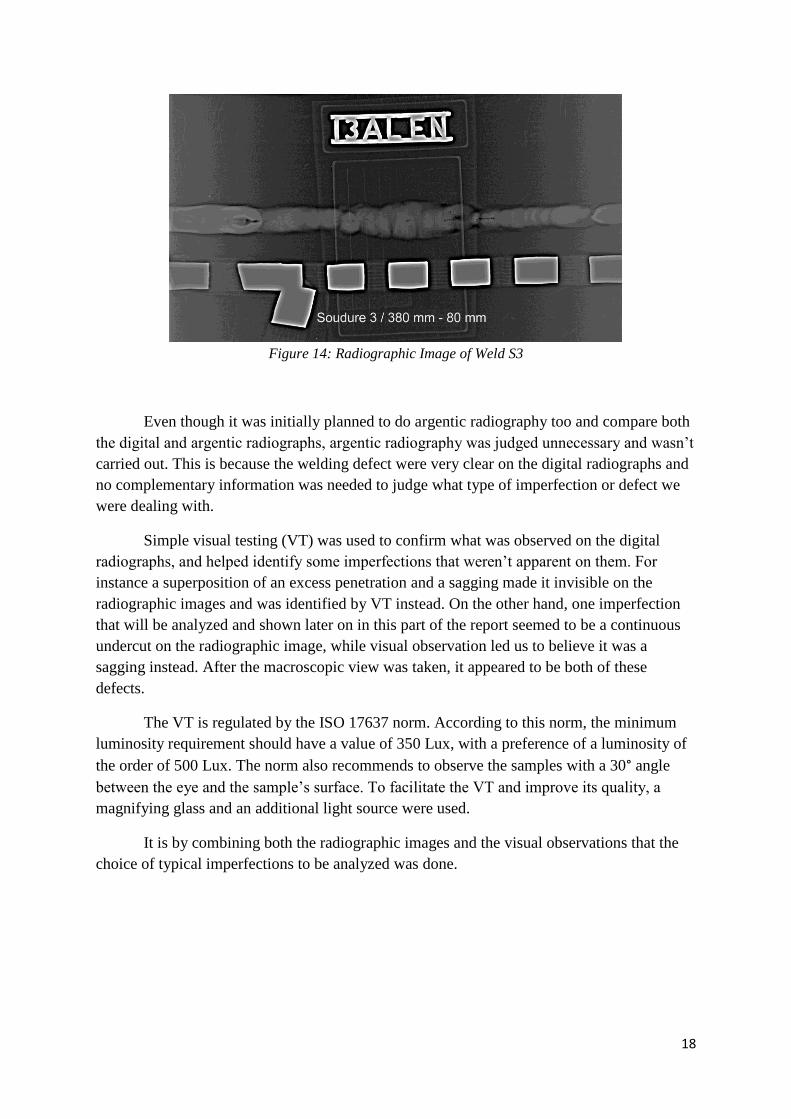
Figure 14: Radiographic Image of Weld S3
Even though it was initially planned to do argentic radiography too and compare both
the digital and argentic radiographs, argentic radiography was judged unnecessary and wasn’t
carried out. This is because the welding defect were very clear on the digital radiographs and
no complementary information was needed to judge what type of imperfection or defect we
were dealing with.
Simple visual testing (VT) was used to confirm what was observed on the digital
radiographs, and helped identify some imperfections that weren’t apparent on them. For
instance a superposition of an excess penetration and a sagging made it invisible on the
radiographic images and was identified by VT instead. On the other hand, one imperfection
that will be analyzed and shown later on in this part of the report seemed to be a continuous
undercut on the radiographic image, while visual observation led us to believe it was a
sagging instead. After the macroscopic view was taken, it appeared to be both of these
defects.
The VT is regulated by the ISO 17637 norm. According to this norm, the minimum
luminosity requirement should have a value of 350 Lux, with a preference of a luminosity of
the order of 500 Lux. The norm also recommends to observe the samples with a 30° angle
between the eye and the sample’s surface. To facilitate the VT and improve its quality, a
magnifying glass and an additional light source were used.
It is by combining both the radiographic images and the visual observations that the
choice of typical imperfections to be analyzed was done.
19
Metallographic Testing
After identifying the weld imperfections using visual and radiographic testing, typical
imperfections from each type were selected to be analyzed and included in the reference
catalogue. This section of the report will detail the successive steps that led to the
metallographic testing and macroscopic observation of the imperfections. The procedure
consists of four steps before the macroscopic observation: sectioning, mounting, polishing
and etching.
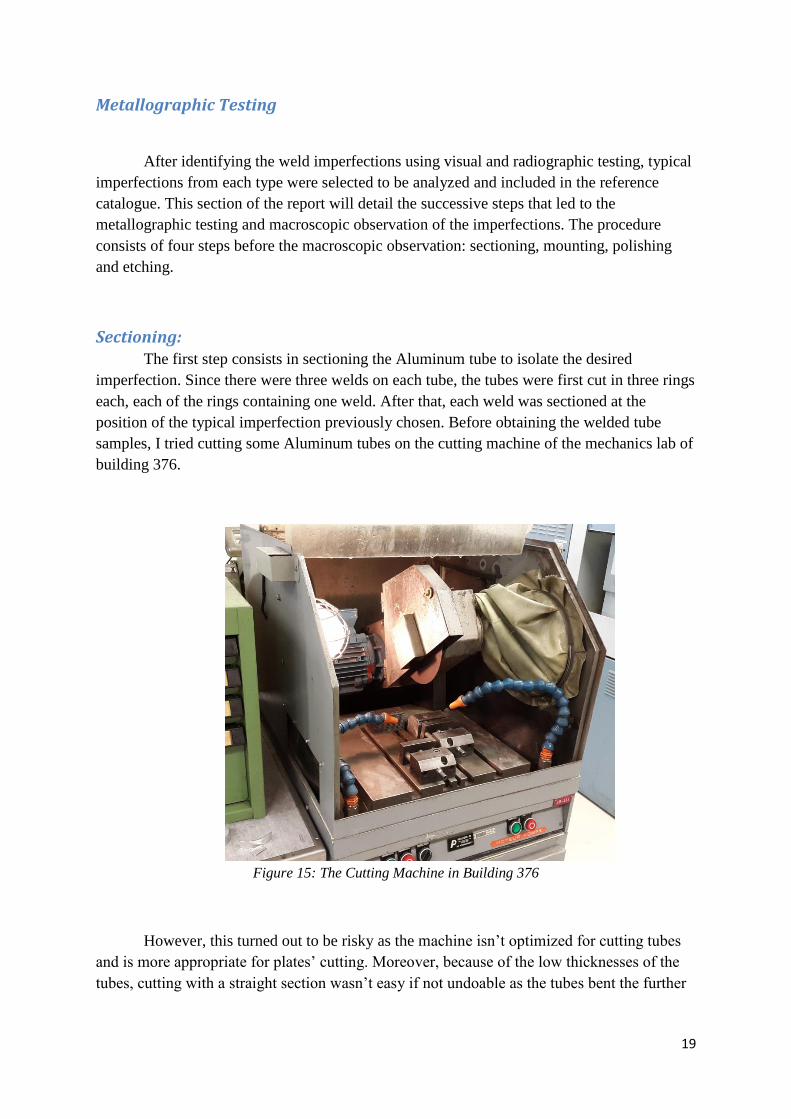
Sectioning: The first step consists in sectioning the Aluminum tube to isolate the desired
imperfection. Since there were three welds on each tube, the tubes were first cut in three rings
each, each of the rings containing one weld. After that, each weld was sectioned at the
position of the typical imperfection previously chosen. Before obtaining the welded tube
samples, I tried cutting some Aluminum tubes on the cutting machine of the mechanics lab of
building 376.
Figure 15: The Cutting Machine in Building 376
However, this turned out to be risky as the machine isn’t optimized for cutting tubes
and is more appropriate for plates’ cutting. Moreover, because of the low thicknesses of the
tubes, cutting with a straight section wasn’t easy if not undoable as the tubes bent the further
20
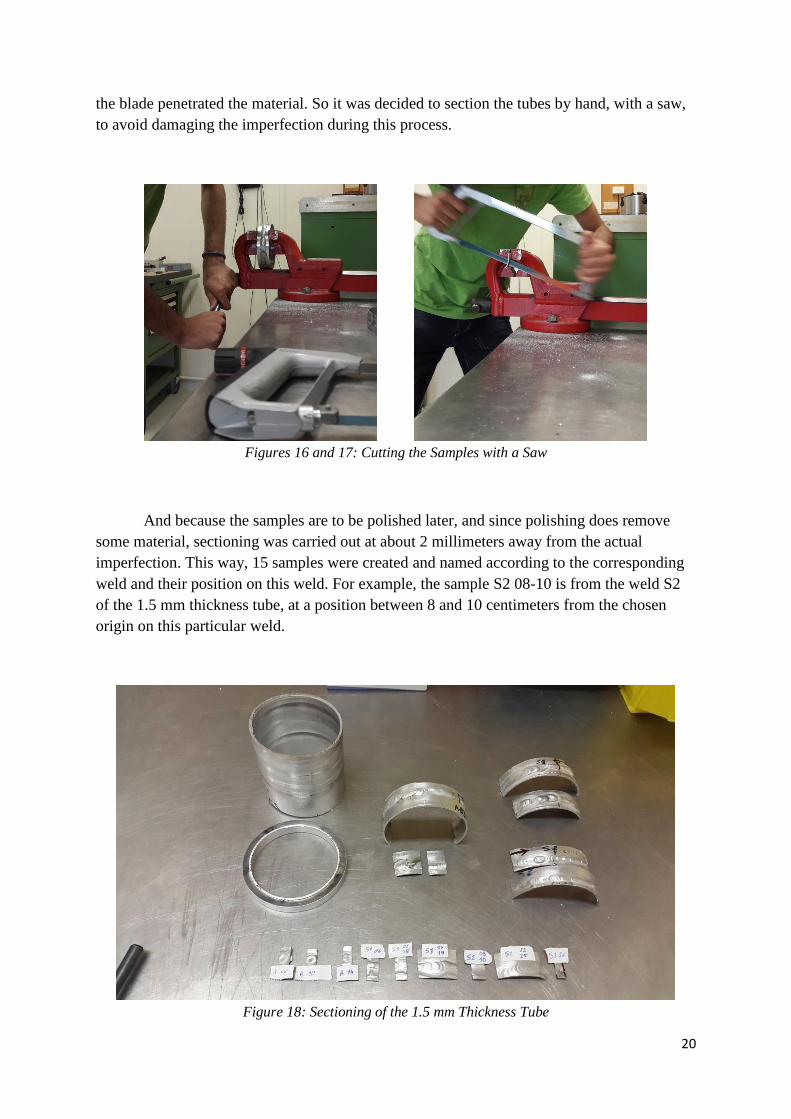
the blade penetrated the material. So it was decided to section the tubes by hand, with a saw,
to avoid damaging the imperfection during this process.
Figures 16 and 17: Cutting the Samples with a Saw
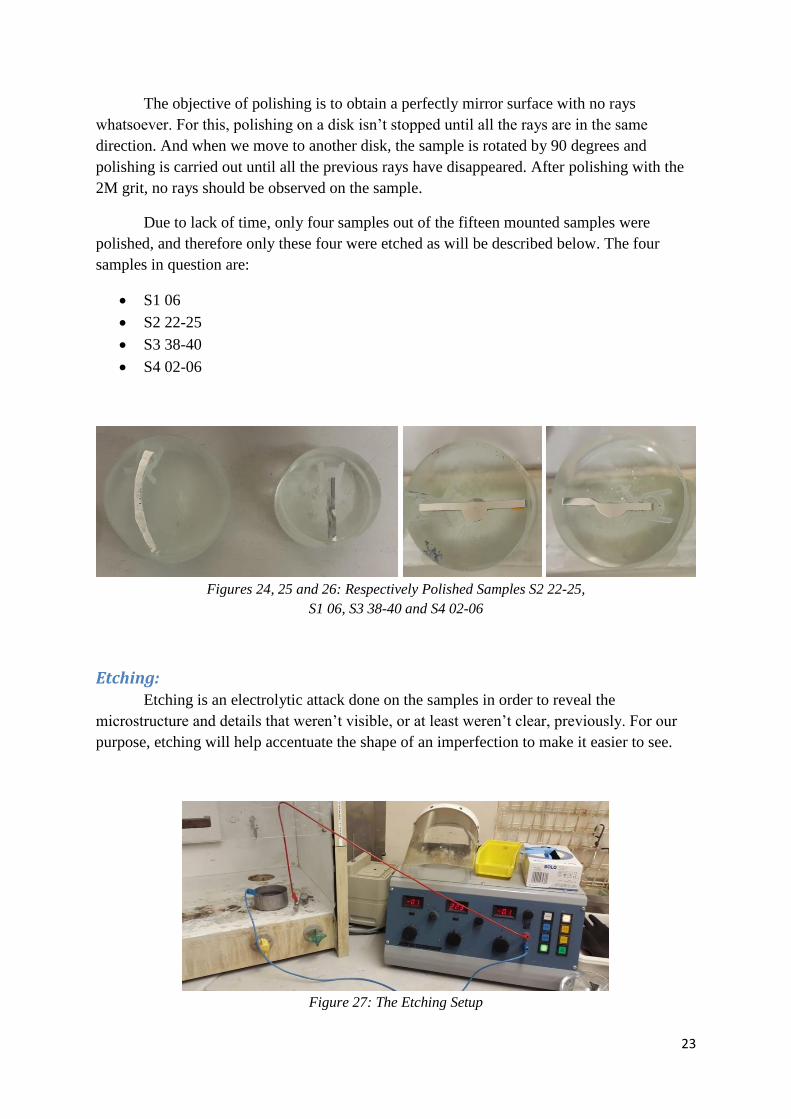
And because the samples are to be polished later, and since polishing does remove
some material, sectioning was carried out at about 2 millimeters away from the actual
imperfection. This way, 15 samples were created and named according to the corresponding
weld and their position on this weld. For example, the sample S2 08-10 is from the weld S2
of the 1.5 mm thickness tube, at a position between 8 and 10 centimeters from the chosen
origin on this particular weld.
Figure 18: Sectioning of the 1.5 mm Thickness Tube

21
Mounting: The sectioned samples were mounted in a methyl methacrylate resin to allow
manipulation for polishing. This resin is transparent and created by mixing two doses of
powder with one dose of liquid of “Technovit 4006”. Each sample is placed in a small mold
and the resin is poured on them to fill the mold completely. Note that the cross-section to be
analyzed has to be placed in contact with the bottom of the mold so that it remains a free
surface after the resin solidifies. The molds are then placed in a recipient creating a high
pressure of 2 atmospheres for 30 minutes, which allows the resin to solidify without humidity
contamination from the atmosphere. All 15 of the sectioned samples were mounted this way.
Figures 19, 20 and 21: Mounting in the Resin under High Pressure
Figure 22: The 15 Mounted Samples

22
Polishing: Polishing the Aluminum samples happened on successive rotating disks, each
mounted with an abrasive paper of silicon carbide with different grit size for each disk. The
six disks that were used are in order the P80, P180, P320, P400, P600 and P1200 grit. The
grit size went down with each of the disks. Finally, two finishing steps of polishing were
carried out, using successively a two micrometer diamond paste and a one micrometer
diamond spray.
Figure 23: Polishing with the 2M Grit
The following table shows the evolution of the grit size on the successive polishing
steps:
Polishing step Grit size Average particle
diameter (µm) Lubricant
1 P80 201
Water
2 P180 82
3 P320 46,2
4 P400 35
5 P600 25,8
6 P1200 15,3
7 2M 2 Diamond
8 1M 1
Table 4: Polishing Parameters
23
The objective of polishing is to obtain a perfectly mirror surface with no rays
whatsoever. For this, polishing on a disk isn’t stopped until all the rays are in the same
direction. And when we move to another disk, the sample is rotated by 90 degrees and
polishing is carried out until all the previous rays have disappeared. After polishing with the
2M grit, no rays should be observed on the sample.
Due to lack of time, only four samples out of the fifteen mounted samples were
polished, and therefore only these four were etched as will be described below. The four
samples in question are:
S1 06
S2 22-25
S3 38-40
S4 02-06
Figures 24, 25 and 26: Respectively Polished Samples S2 22-25,
S1 06, S3 38-40 and S4 02-06
Etching: Etching is an electrolytic attack done on the samples in order to reveal the
microstructure and details that weren’t visible, or at least weren’t clear, previously. For our
purpose, etching will help accentuate the shape of an imperfection to make it easier to see.
Figure 27: The Etching Setup

24
Etching is regulated by the ASM-E407 standard that lists the possible attacks with
their functions for various alloys and type of materials. The attack used on the EN AW 5083
samples was etching with HBF4, the tetrafluoroboric acid, etchant number 5 according to
table 2 of the E407 standard, as shown in Table 4 below.
Metal Etchants Uses
Aluminum
Base:
Pure Al 1a, 2, 3
4, 5
1b
general structure
grain structure under polarized light
grain boundaries and slip lines
1000 series 1a, 3, 2
4, 5
6, 7
general structure
grain structure under polarized light
phase identifications
2000 series 3, 2, 1a
8a, 6, 7
general structure
phase identifications
3000 series 3, 1a
4, 5
8a, 6, 7
general structure
grain structure under polarized light
phase identifications
4000 series 3, 1a general structure
5000 series 3, 1a, 2, 6, 8a
4, 5
general structure
grain structure under polarized light
6000 series 3, 1a, 2, 6, 8a,
222
4, 5
1a, 2, 7, 6, 8a
general structure
grain structure under polarized light
phase identifications
7000 series 3, 1a, 2
4, 5
3b, 6
general structure
grain structure under polarized light
phase identifications
Table 4: Possible Etchants with Their Functions According to Table 2 of the E407 Standard
The following table resumes the parameters chosen for etching.
Used Acid HBF4
Potential Difference 22V
Current Intensity 2.2A
Etching Time 30 s
Table 5: Etching Parameters
All four of the polished samples were etched this way.
25
Macroscopic Images and Results
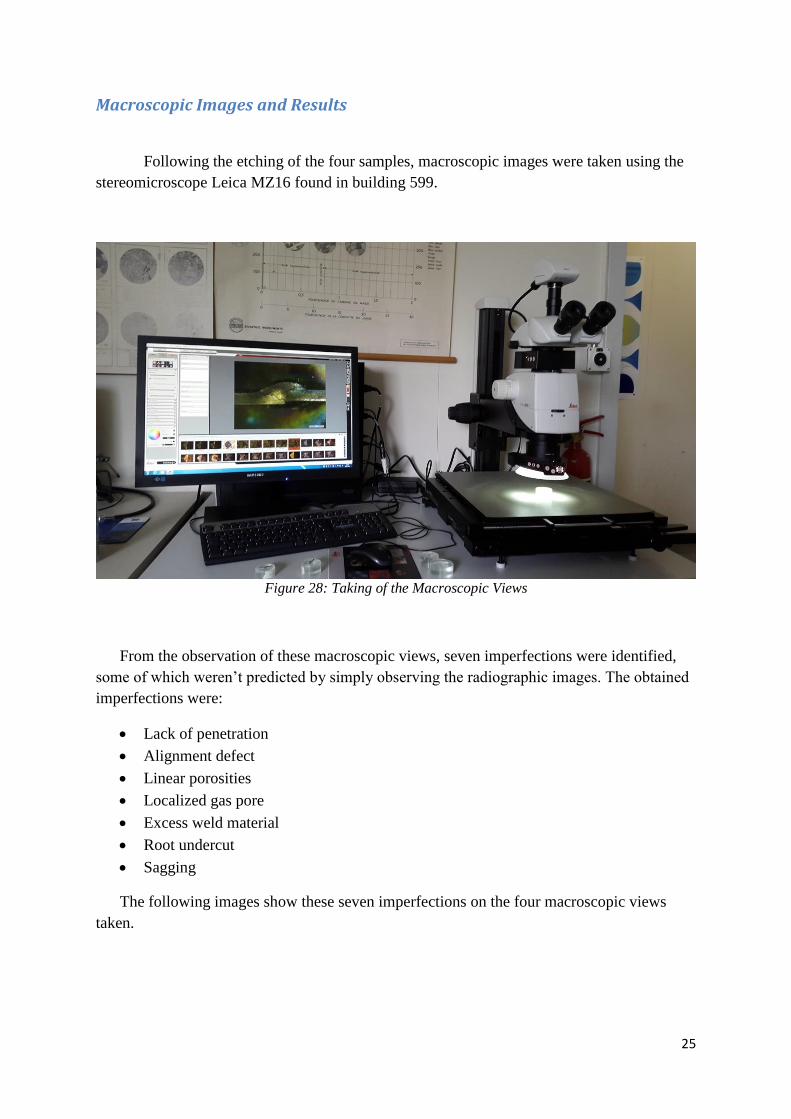
Following the etching of the four samples, macroscopic images were taken using the
stereomicroscope Leica MZ16 found in building 599.
Figure 28: Taking of the Macroscopic Views
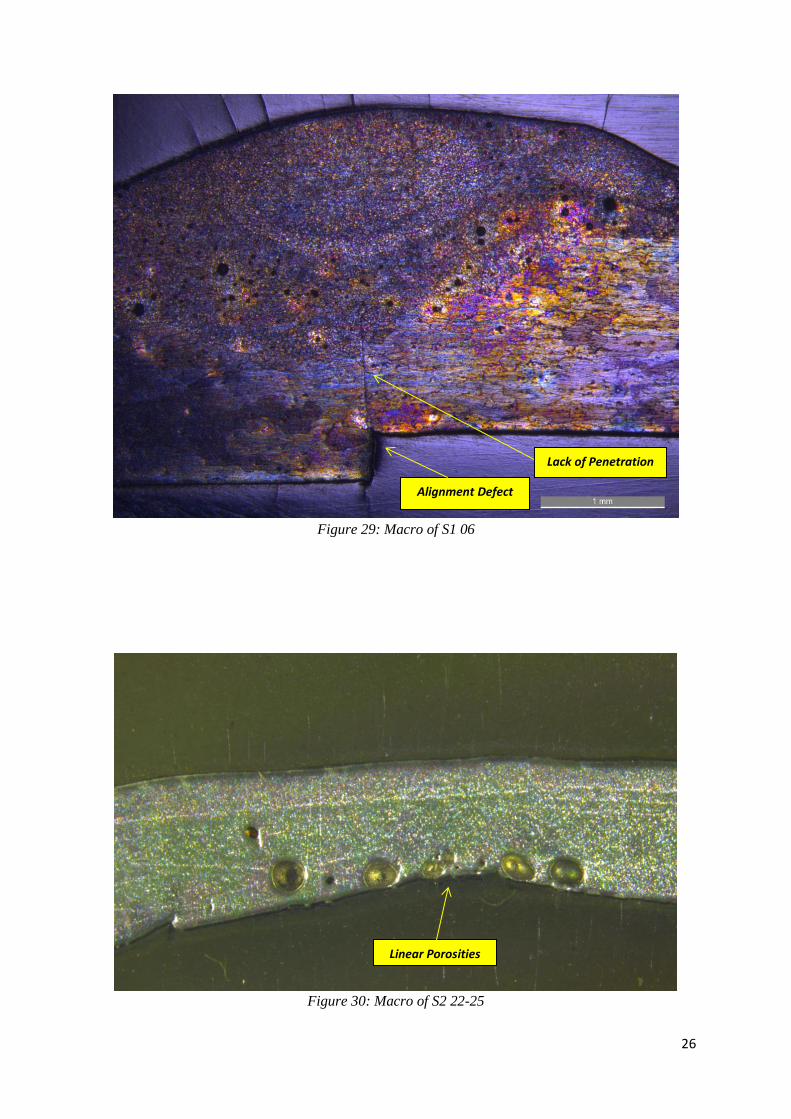
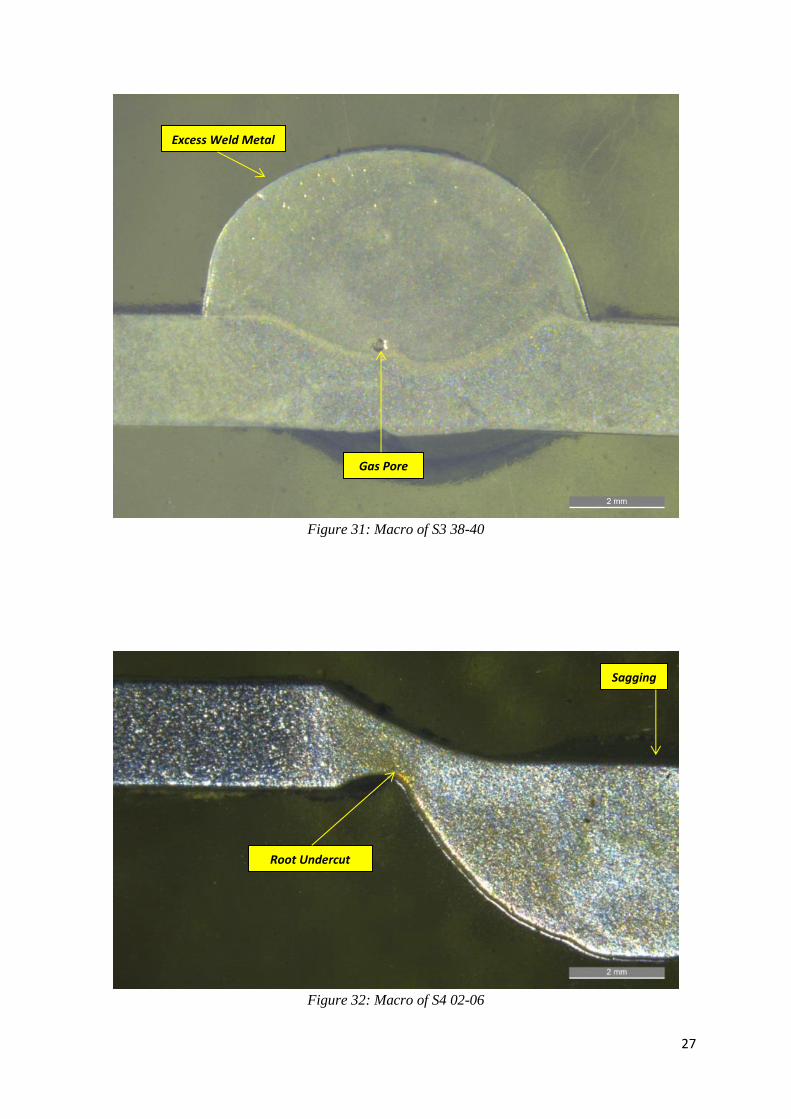
From the observation of these macroscopic views, seven imperfections were identified,
some of which weren’t predicted by simply observing the radiographic images. The obtained
imperfections were:
Lack of penetration
Alignment defect
Linear porosities
Localized gas pore
Excess weld material
Root undercut
Sagging
The following images show these seven imperfections on the four macroscopic views
taken.
26
Figure 29: Macro of S1 06
Figure 30: Macro of S2 22-25
Lack of Penetration
Alignment Defect
Linear Porosities
27
Figure 31: Macro of S3 38-40
Figure 32: Macro of S4 02-06
Gas Pore
Excess Weld Metal
Root Undercut
Sagging

28
Preparation of the Catalogue’s Forms
It is by combining the corresponding radiographic and macroscopic images of a particular
imperfection that a form is created in the reference catalogue. In addition, real pictures of the
weld from both the upper part and root part are included. Finally, since the imperfection is
already identified, what remains is measuring its size and comparing it to the quality level
requirements of the ISO 10042 norm, i.e., quality levels B, C and D, where the level B is the
most strict and the level D the least one.
The design of the catalogue’s forms took the forms of the Stainless Steel reference
catalogue based on the ISO 5817 as a model, and slight changes were made. The changes
mainly concerned the removing of the argentic radiographs that weren’t taken, and turning
the form to portrait view.
In order to compare the imperfections to the quality level requirements B, C and D of
the ISO 10042 norm, the size of the imperfections has to be measured. This was done directly
on the stereomicroscope Leica MZ16. To illustrate this, here are the pictures showing the
obtained measures for the four polished samples that have been analyzed.
Figure 33: Imperfections’ Dimensions on S1 06

29
Figure 34: Imperfections’ Dimensions on S2 22-25
Figures 35 and 36: Imperfections’ Dimensions on S3 38-40

30
Figure 37: Imperfections’ Dimensions on S4 02-06
With these measures of the imperfections’ dimensions, comparing with the quality
level requirements of the norm ISO 10042, i.e., quality level requirements B, C and D, was
done, and the results were placed in a table in a similar fashion as what can be seen in the
Stainless Steel reference catalogue based on the ISO 5817. Reading the results from the table
can be done by following the convention shown in Table 6 below.
B, C + D = Acceptance levels. a = Reference No. of ISO 10042. b = Reference No. of
ISO 6520-1. RT = Radiography testing. VT = Visual examination. S = Macroscopic
testing. X = not permitted.
Table 6: Convention for the Forms’ Table Reading
Next are the four forms that were created from the work described up till now.

31
FORM ONE
Designation Quality level
a b D C B
Su
rfa
ce I
mp
erfe
cti
on
s
Cracks 1.1 100
Crater cracks 1.2 104
Surface pore 1.6 2017
End crater pipe 1.7 2025
Lack of fusion 1.8 401
Lack of root penetration 1.9 4021 X X X
Continuous undercut 1.1 5011
Intermittent undercut 1.1 5012
Excess weld metal 1.11 502
Excess penetration 1.1 504
Sagging / Incompletely filled surface layer 1.2 509 / 511
Root concavity 1.18 515
Shrinkage groove 1.18 5013
Inte
rn
al
Imp
erfe
cti
on
s Cracks 2.1 100
Gas pore 2.3 2011
Uniformly distributed porosity 2.4 2012
Clustered (localized)porosity 2.5 2013
Linear porosity 2.6 2014
Elongated cavities / wormholes 2.7 2015 / 2016
Tungsten inclusions 2.9 3041
Lack of penetration 2.11 402
Imp
erfe
cti
on
s
in J
oin
t
Geo
metr
y
Linear misalignment 3.1 507 VT/S VT/S X
B, C + D = Acceptance levels. a = Reference No. of ISO 10042. b = Reference No. of ISO 6520-1. RT = Radiography testing. VT =
Visual examination. S = Macroscopic testing. X = not permitted.
Radiography Parameters
Technique Perpendicular with inner film
Distance from Source 50 cm
Current 4 mA
Voltage 50 kV
Exposure Time 60 s
Tube Characteristics
Base Metal EN AW 5083
Filler Metal EN AW 2319
Thickness 1.5 mm
Diameter 83 mm
Etching
Acid HBF4
Voltage 22V
Current 2.2A
Time 30 s

32
FORM TWO
Designation Quality level
a b D C B
Su
rfa
ce I
mp
erfe
cti
on
s
Cracks 1.1 100
Crater cracks 1.2 104
Surface pore 1.6 2017
End crater pipe 1.7 2025
Lack of fusion 1.8 401
Lack of root penetration 1.9 4021
Continuous undercut 1.1 5011
Intermittent undercut 1.1 5012
Excess weld metal 1.11 502
Excess penetration 1.1 504
Sagging / Incompletely filled surface layer 1.2 509 / 511
Root concavity 1.18 515
Shrinkage groove 1.18 5013
Inte
rn
al
Imp
erfe
cti
on
s Cracks 2.1 100
Gas pore 2.3 2011
Uniformly distributed porosity 2.4 2012
Clustered (localized)porosity 2.5 2013
Linear porosity 2.6 2014 X X X
Elongated cavities / wormholes 2.7 2015 / 2016
Tungsten inclusions 2.9 3041
Lack of penetration 2.11 402
Imp
erfe
cti
on
s
in J
oin
t
Geo
metr
y
Linear misalignment 3.1 507
B, C + D = Acceptance levels. a = Reference No. of ISO 10042. b = Reference No. of ISO 6520-1. RT = Radiography testing. VT =
Visual examination. S = Macroscopic testing. X = not permitted.
Radiography Parameters
Technique Perpendicular with inner film
Distance from Source 50 cm
Current 4 mA
Voltage 50 kV
Exposure Time 60 s
Tube Characteristics
Base Metal EN AW 5083
Filler Metal EN AW 2319
Thickness 1.5 mm
Diameter 83 mm
Etching
Acid HBF4
Voltage 22V
Current 2.2A
Time 30 s
33
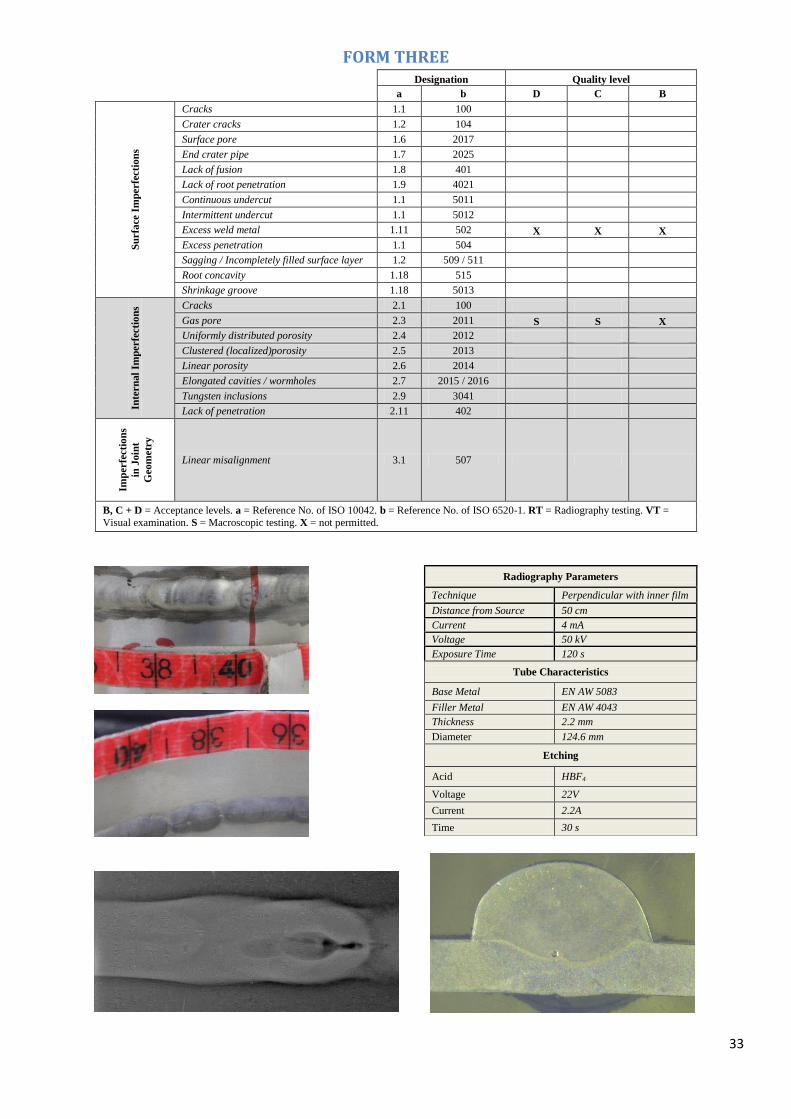
FORM THREE
Designation Quality level
a b D C B
Su
rfa
ce I
mp
erfe
cti
on
s
Cracks 1.1 100
Crater cracks 1.2 104
Surface pore 1.6 2017
End crater pipe 1.7 2025
Lack of fusion 1.8 401
Lack of root penetration 1.9 4021
Continuous undercut 1.1 5011
Intermittent undercut 1.1 5012
Excess weld metal 1.11 502 X X X
Excess penetration 1.1 504
Sagging / Incompletely filled surface layer 1.2 509 / 511
Root concavity 1.18 515
Shrinkage groove 1.18 5013
Inte
rn
al
Imp
erfe
cti
on
s Cracks 2.1 100
Gas pore 2.3 2011 S S X
Uniformly distributed porosity 2.4 2012
Clustered (localized)porosity 2.5 2013
Linear porosity 2.6 2014
Elongated cavities / wormholes 2.7 2015 / 2016
Tungsten inclusions 2.9 3041
Lack of penetration 2.11 402
Imp
erfe
cti
on
s
in J
oin
t
Geo
metr
y
Linear misalignment 3.1 507
B, C + D = Acceptance levels. a = Reference No. of ISO 10042. b = Reference No. of ISO 6520-1. RT = Radiography testing. VT =
Visual examination. S = Macroscopic testing. X = not permitted.
Radiography Parameters
Technique Perpendicular with inner film
Distance from Source 50 cm
Current 4 mA
Voltage 50 kV
Exposure Time 120 s
Tube Characteristics
Base Metal EN AW 5083
Filler Metal EN AW 4043
Thickness 2.2 mm
Diameter 124.6 mm
Etching
Acid HBF4
Voltage 22V
Current 2.2A
Time 30 s

34
FORM FOUR
Designation Quality level
a b D C B
Su
rfa
ce I
mp
erfe
cti
on
s
Cracks 1.1 100
Crater cracks 1.2 104
Surface pore 1.6 2017
End crater pipe 1.7 2025
Lack of fusion 1.8 401
Lack of root penetration 1.9 4021
Continuous undercut 1.1 5011
Intermittent undercut 1.1 5012
Excess weld metal 1.11 502
Excess penetration 1.1 504
Sagging / Incompletely filled surface layer 1.2 509 / 511 X X X
Root concavity 1.18 515
Shrinkage groove 1.18 5013 X X X
Inte
rn
al
Imp
erfe
cti
on
s Cracks 2.1 100
Gas pore 2.3 2011
Uniformly distributed porosity 2.4 2012
Clustered (localized)porosity 2.5 2013
Linear porosity 2.6 2014
Elongated cavities / wormholes 2.7 2015 / 2016
Tungsten inclusions 2.9 3041
Lack of penetration 2.11 402
Imp
erfe
cti
on
s
in J
oin
t
Geo
metr
y
Linear misalignment 3.1 507
B, C + D = Acceptance levels. a = Reference No. of ISO 10042. b = Reference No. of ISO 6520-1. RT = Radiography testing. VT =
Visual examination. S = Macroscopic testing. X = not permitted.
Radiography Parameters
Technique Perpendicular with inner film
Distance from Source 50 cm
Current 4 mA
Voltage 50 kV
Exposure Time 120 s
Tube Characteristics
Base Metal EN AW 5083
Filler Metal EN AW 4043
Thickness 2.2 mm
Diameter 124.6 mm
Etching
Acid HBF4
Voltage 22V
Current 2.2A
Time 30 s

35
Finishing of the Catalogue
The four forms that were done aren’t enough to complete the reference catalogue.
More forms showing more weld imperfections and comparing them to the ISO 10042 norm
need to be created, in a similar fashion as what was done here in Part I of the report. These
forms can use the mounted samples that weren’t polished yet to study the other desired
imperfections, as the samples that were sectioned were selected in order to show as many
types of weld imperfections as were available on the initial tubes. That mean that the
remaining mounted samples should present us other types of weld imperfections that would
complete the catalogue. The samples need to be polished and etched, before taking
macroscopic views.
Note however that other welds might be necessary if all possible imperfections that
could be obtained on Aluminum welding want to be referred to in the catalogue. Indeed,
some imperfections like the lack of fusion weren’t spotted on the radiographic images.
This will be the subject of another student internship.

36
Part II
Leak of the VJ Vacuum Chamber of ATLAS
One of the most important roles the tests of the MM section have is spotting leaks.
Vacuum chambers need to be perfectly isolated from the outside to create as much as
possible vacuum or ultra-high vacuum in the inside. Vacuum tests consist in running
Hydrogen in the vacuum chamber and then check if this Hydrogen is detected by the
detectors placed outside of the chamber. If it is, then the vacuum chamber is leaking.
This is how a leak was spotted on one of the VJ vacuum chambers of the ATLAS
experiment. The defected piece consisted of two types of Aluminum alloys, the EN AW 5083
and the EN AW 2219, welded by electron beam welding.
The weld was isolated on a ring as shown on Figure 38, and sent to be analyzed by
radiographic testing and penetrant testing. However the order of magnitude of the leak was of
10-7
mbar.l/s which was too small to catch by the testing methods available to the NDT team
at CERN.
Figure 38: The Defective Weld of the VJ Vacuum Chamber

37
Micro-Tomographic Testing
The weld was therefore sent to RX-solutions to follow a micro-tomographic testing.
The micro-tomographic testing consists in taking high quality radiographic images of the
cross section of the weld by moving 15 micrometers for every other new image. This way, a
complete mapping of the weld is done, and the radiographic images are used to recreate the
weld from various viewing angles, as well as creating a simulation of the cross-section of the
weld as we move along the welding bead by looking at the cross-section.
For this, the weld was sectioned to isolate the defected piece where the leak was
known to take place. A small piece of Copper, as can be seen on the purple mark in Figure
39, was attached to the sectioned sample to serve as a reference point during the testing. That
is because Copper appears much brighter than Aluminum on the radiographic views, due to
its higher density.
Figure 39: The Sectioned Piece Containing the Defect
The quality of the obtained radiographic images from the micro-tomographic testing
was as high as it could get, and the leak as well as its operation appeared clearly on them.
Moreover, it turned out that there were two main leaks on the weld.
The first leak, which was already spotted at CERN, was due to a huge crack that went
from one surface of the defective weld through the entire thickness all the way to the other
side. That led to the outer surface of the tube being connected to the inner surface through

38
this crack, and therefore created the leak. The micro-tomographic testing also showed us that
this crack emerged to the inner surface at several locations too.
The following three figures will show the leak due to this crack going from outer
surface to inner surface with Figure 40 showing various viewing angles of the defect, and
figures 41 and 42 pointing it out with a red arrow.
Figure 40: Leak Zone One
Figure 41: Leak Zone One
39
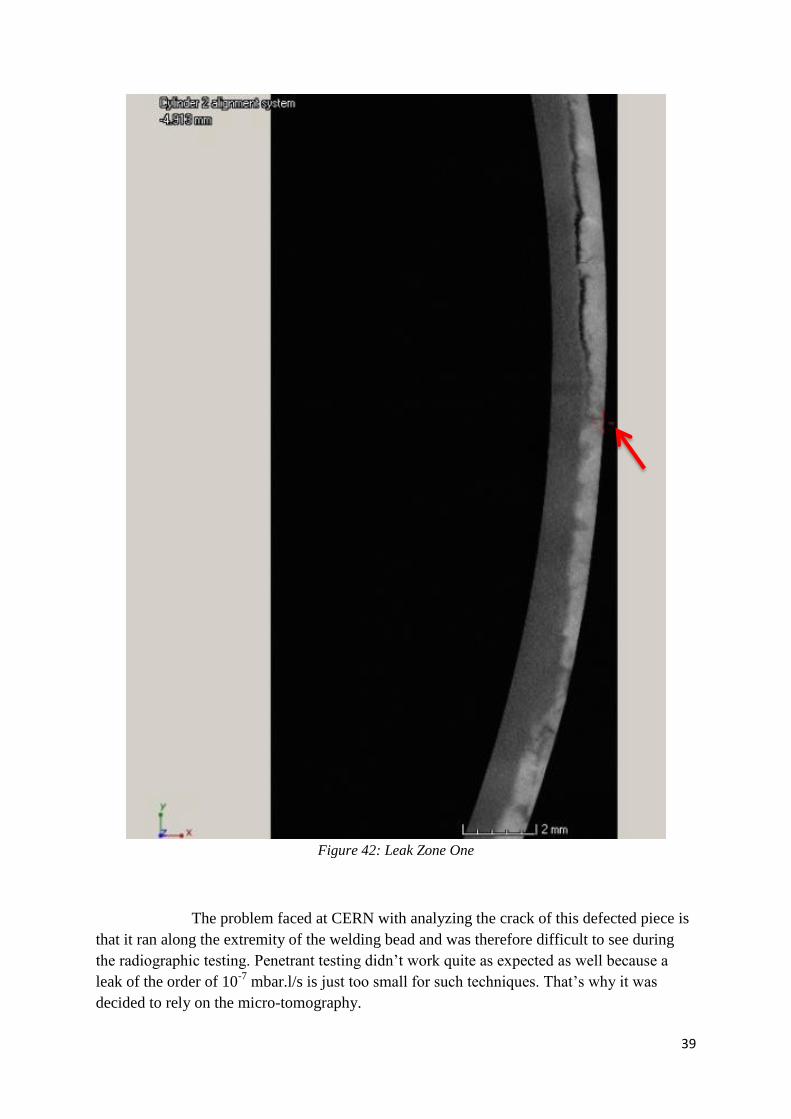
Figure 42: Leak Zone One
The problem faced at CERN with analyzing the crack of this defected piece is
that it ran along the extremity of the welding bead and was therefore difficult to see during
the radiographic testing. Penetrant testing didn’t work quite as expected as well because a
leak of the order of 10-7
mbar.l/s is just too small for such techniques. That’s why it was
decided to rely on the micro-tomography.

40
The second leak, that wasn’t detected at CERN and was only spotted thank to the
micro-tomographic testing, was due to the same crack having one of its many ramifications
running into a gas pore that was itself connected to a surface pore. This again connected the
outer surface to the inner surface, creating a leak.
The next figure will show the second leak zone, which is the one due to the crack
running into two porosities with the second of these porosities emerging at the surface. Note
that the size of the porosities is quite large. Porosities are more difficult to avoid in electron
beam welding as compared to TIG welding because of the much higher energy involved and
the faster cooling rate. This means that the outgassing is less effective in electron beam
welding and therefore, gas is more easily trapped. This is why some research is being
conducted nowadays to try to modify electron beam welding by reducing the input energy
and find a compromise that will increase the outgassing rate and therefore reduce the risk of
obtaining porosities.
Figure 43: Leak Zone Two
Advantages and Perspective
The micro-tomographic testing is fast. Analyzing this defect took one hour and a half
to completion. On the other hand, if we wanted to study it by applying the procedure I
followed in Part I, that is, cutting, mounting and then polish every 15 micrometers and
etching, before polishing again 15 micrometers and etching again till we finish the entire
piece, it would have easily taken a month to finish. This is considering that the work is so
precise that we won’t miss the leak by polishing too much. By “too much” I mean more than
15 micrometers.
41
Moreover, the quality and precision of the obtained images were incredibly high,
much higher than what can be attained at CERN.
Micro-tomographic testing however is expensive. Testing this small weld section of
about three centimeters long has cost 1100 euros. However, taking into consideration the time
saving and the results’ quality, this is probably worth the money.

42
Conclusion
Part I of the report ended up being the start of the reference catalogue’s development.
Because of lack of time since the weld samples didn’t arrive before the last two weeks of my
internship, the complete catalogue couldn’t be finished. However, what was done was very
satisfying with seven imperfections identified on four polished samples. Another eleven
samples containing other types of imperfections are already mounted, and only need to be
polished and etched before taking the macroscopic views. Also, four catalogue forms were
created and will serve as a model to follow for the rest of the catalogue. This will be the
subject of another student internship.
The development of this catalogue is just another step of the work started by Quentin
Drouhet and myself, as other reference catalogues of welding imperfections are planned to
follow, concerning both welding of thin plates and thin tubes, and on various materials like
Stainless Steels, Aluminum and Copper, and extending to other welding procedures than TIG
welding like electron beam welding for instance.
Part I of the report relied on the conventional methods for welding imperfections’
analysis, notably RT, VT and metallographic testing. These procedures, along with penetrant
testing and ultrasonic testing, are effective for relatively large imperfections and provide us
satisfying results in that case. Using micro-tomographic testing to analyze the samples used
in Part I would be unnecessary and pointless as the method is too precise for this, and that
would be a huge waste of money. However, these methods can’t quite deal with very small
defects like the leak of the VJ chamber of ATLAS showed us. The leak was identified during
a leak test, but studying the defect turned out to be very difficult because of the placement of
the crack and the order of magnitude of the leak which at 10-7
mbar.l/s was too small. This is
where micro-tomographic testing becomes interesting as it provides a degree of precision in
defect analysis that cannot be reached with the conventional methods, along with an excellent
quality of imaging and a huge time saving.
Now it is true that the engineering department of CERN isn’t a very big one that can
test everything or move to mass production for example. The EN department’s main function
is testing, and if it proves too difficult, the samples are sent to an outside company to be
analyzed there since not all the techniques are available at CERN which isn’t an engineering
facility anyway. However, it is very important to be able to analyze the smallest of defects as
they can be the cause of huge problems with catastrophic consequences. We all remember
what happened in 2008 at the LHC because of a defective solder joint. So the addition of a
technique like the micro-tomography, allowing CERN to spot and analyze such small defects
as the leak observed in Part II, might prove a good investment for the future.