study of very large aperture p-band antenna performance
TRANSCRIPT
General rights Copyright and moral rights for the publications made accessible in the public portal are retained by the authors and/or other copyright owners and it is a condition of accessing publications that users recognise and abide by the legal requirements associated with these rights.
Users may download and print one copy of any publication from the public portal for the purpose of private study or research.
You may not further distribute the material or use it for any profit-making activity or commercial gain
You may freely distribute the URL identifying the publication in the public portal If you believe that this document breaches copyright please contact us providing details, and we will remove access to the work immediately and investigate your claim.
Downloaded from orbit.dtu.dk on: Feb 06, 2022
Study of very large aperture P-band antenna performance verification methodologyand facilitiesSR9: Summary Report
Pivnenko, Sergey; Kim, Oleksiy S.; Breinbjerg, Olav
Publication date:2012
Document VersionPublisher's PDF, also known as Version of record
Link back to DTU Orbit
Citation (APA):Pivnenko, S., Kim, O. S., & Breinbjerg, O. (2012). Study of very large aperture P-band antenna performanceverification methodology and facilities: SR9: Summary Report.

Department of Electrical Engineering, Electromagnetic Systems Group Technical University of Denmark Ørsteds Plads, Building 348 DK-2800 Kgs. Lyngby, Denmark Phone: +45 4525 3800, Fax: +45 4593 1634, Homepage: www.elektro.dtu.dk
Study of Very Large Aperture P-Band Antenna
Performance Verification Methodology and Facilities
ESTEC Contract No. 4000102325/10/NL/JA
SR9: Summary Report
Revision 3.0
S. Pivnenko, O.S. Kim, O. Breinbjerg
Department of Electrical Engineering, Electromagnetic Systems Group Technical University of Denmark
June 2012
R758

Study of Very Large Aperture P-Band Antenna Performance Verification Page 2/38 Methodology and Facilities, ESTEC Contract No. 4000102325/10/NL/JA SR9: Summary Report
RECORD OF CHANGES
Issue Date Record of changes Authors
1.0 03/05/2012 All – first issue S. Pivnenko, O. Breinbjerg
2.0 30/05/2012 Page 6, section 2.1, first bullet: comment about meshed reflector is added. Page 16, section 5.2 is introduced with recommenda-tions of feed and reflector design. Page 18: comment about suitability of the DTU-ESA Facility is added (third last par.).
S. Pivnenko; O. Breinbjerg
3.0 06/06/2012 Page 16, section 5.2, bullet 2 is revised. S. Pivnenko

Study of Very Large Aperture P-Band Antenna Performance Verification Page 3/38 Methodology and Facilities, ESTEC Contract No. 4000102325/10/NL/JA SR9: Summary Report
CONTENTS
1. Introduction 4
1.1. Scope 4
1.2. Applicable documents 4
1.3. Reference documents 4
2. Investigation of Performance Verification Methodology 5
2.1. Available information and assumptions 5
2.2. Review of possible approaches 6
2.3. Conclusions 8
3. Proposed Performance Verification Methodology – Step by Step 9
3.1. Step by step procedure 9
3.2. Required input 10
3.3. Required measurement facility and simulation software 10
3.4. Assumptions and considerations 11
4. Measurement and Model Uncertainty 12
4.1. Radiation pattern and directivity 12
4.2. Gain 13
4.3. Beam pointing 14
5. Compliance Analysis and Recommendations 15
5.1. Compliance analysis 15
5.2. Recommendations on feed and reflector design 16
5.3. Recommendations on improvements of test procedures 16
5.4. Recommendations on updates of the DTU-ESA Facility 16
6. Summary and Conclusions 18
Appendix A: Measurement Facilities 19
Appendix B: Evaluation of LDA Performance using Measured Pattern 20

Study of Very Large Aperture P-Band Antenna Performance Verification Page 4/38 Methodology and Facilities, ESTEC Contract No. 4000102325/10/NL/JA SR9: Summary Report
1 Introduction
1.1 Scope This document provides a summary of results of the work performed in the project. The results of investigation of performance verification approaches are presented and the proposed performance verification methodology is described in details. An uncertainty budget based on extensive simulations and measurements on the representative hardware is given. Compliance analysis of the uncertainty budget and recommendations on improvement of test procedures to reduce critical uncertainty sources are provided.
1.2 Applicable documents [AD1] ESTEC Contract No. 4000102325/10/NL/JA, Appendix 1: Statement of Work.
[AD2] S. Pivnenko, O.S. Kim, and O. Breinbjerg, “Updated Proposal for Study of Very Large Aperture P-Band Antenna Performance Verification Methodology and Facilities, ESA/IPC(2010)11, Item No.: 09.156.10-AO/1-6328/10/NL/JA”. Revision 3. Report AR503, Technical University of Denmark, June 2011.
1.3 Reference documents [RD1] G. Orlando and P. Valle, “Study of Very Large Aperture P-Band Antenna
Performance Verification Methodology and Facilities. ESTEC Contract No. 4000102325/10/NL/JA. TN0: Feed and S/C Configuration Description”, Issue 1, TN0-SVLA-0001-TASR, Thales Alenia Space, 30-08-2011.
[RD2] K. Pontoppidan, “Study of Very Large Aperture P-Band Antenna Performance Verification Methodology and Facilities. ESTEC Contract No. 4000102325/10/NL/JA. TN1: LDA Performance Validation Approach”, Revision 3.0, Report S-1543-02, TICRA, April 2012.
[RD3] S. Pivnenko, “Study of Very Large Aperture P-Band Antenna Performance Verification Methodology and Facilities. ESTEC Contract No. 4000102325/10/NL/JA. TR5: Measurement Summary and Accuracies”, Revision 1.1, Report IR813, Technical University of Denmark, April 2012.
[RD4] S. Pivnenko and O. Breinbjerg, “Study of Very Large Aperture P-Band Antenna Performance Verification Methodology and Facilities. ESTEC Contract No. 4000102325/10/NL/JA. TN3: LDA Validation Uncertainty Budgets”, Revision 2.1, Report IR808, Technical University of Denmark, April 2012.
[RD5] S. Pivnenko and O. Breinbjerg, “Study of Very Large Aperture P-Band Antenna Performance Verification Methodology and Facilities. ESTEC Contract No. 4000102325/10/NL/JA. TR7-DTU-LDA: Test Report”, Revision 2.0, Report IR811, Technical University of Denmark, February 2012.
[RD6] K. Pontoppidan, “Study of Very Large Aperture P-Band Antenna Performance Verification Methodology and Facilities. ESTEC Contract No. 4000102325/10/NL/JA. WP8200: Evaluation of LDA Performance using Measured Pattern”, Revision 1.0, Report S-1543-03, TICRA, April 2012 (included in Appendix B of this report).

Study of Very Large Aperture P-Band Antenna Performance Verification Page 5/38 Methodology and Facilities, ESTEC Contract No. 4000102325/10/NL/JA SR9: Summary Report
2 Investigation of Performance Verification Methodology
2.1 Available information and assumptions The Statement of Work [AD1] provides the initial information and requirements for the P-band Synthetic Aperture Radar (SAR) payload for the BIOMASS candidate mission valid at the time of writing, i.e. February 2010. Following the project development, the BIOMASS Phase A Preliminary Concept Reviews were held during October-November 2010, in which the Large Deployable Reflector Antenna concept, LDA configuration, was selected as the baseline for the second part of the Phase A study.
Further information about the current LDA configuration and updated requirements were obtained from Tales Alenia Space – Italy (TAS-I) through the document ”TN0: Feed and S/C Configuration Description” [RD1] as well as through the drawings of the P-band SAR payload provided in the electronic form as a STP-file. It is noted that the detailed information about the LDA reflector cannot be provided to the Technical University of Denmark (DTU) and its sub-contractors in this project due to Non-Disclosure Agreement signed by TAS-I.
Since the information on the current LDA configuration is not available from just one source, this section summarizes the details and assumptions adopted and agreed with ESA within this project.
The following information is taken from the [AD1], Annex 1:
• Frequency plan • Power handling • Gain • Cross-polarization • Measurement accuracy • Scattering parameter measurements • Measurement conditions • Detailed data and documentation requirements
The following information is taken from the [RD1], Sections 6-8 and from the provided STP-file:
• Operative modes • Reflector geometry • Feed system architecture* • BIOMASS antenna mask • Feed array requirements • Feed array mechanical configuration • Feed array breadboard details** • Feed array support structure and spacecraft geometry
* For the feed system architecture, it is assumed that the feed is a 2x2 array and that two test ports, for the H- and V-polarizations, respectively, are available.
** It is noted that the doublet breadboard made available within this project was designed for the previous reflector geometry and thus may not be compatible with the current reflector geometry. Additional simulations were carried out to check the
Study of Very Large Aperture P-Band Antenna Performance Verification Page 6/38 Methodology and Facilities, ESTEC Contract No. 4000102325/10/NL/JA SR9: Summary Report
compatibility with the current reflector geometry; the details are given in [RD2].
The following information was agreed with ESA during Progress Meetings or obtained from ESA through several Action Items:
• For numerical analysis in this study, the reflector is assumed to be solid and perfectly conducting, with known root-mean-square deviation from the parabolic surface. Analysis of a meshed reflector surface is fully feasible subject to the definition of the meshed surface reflection and transmission properties, see Section 3.2.
• The angular range to be characterized is −91°…+42° in elevation and ±65° in azimuth with respect to the boresight of the SAR coordinate system.
• The predicted peak-to-peak depointing of the beam due to thermo-elastic effects is ±0.015°. The thermo-elastic distortions are allocated separately into the radiometric accuracy and stability budgets.
• The simulations are carried out at single frequency of 435 MHz unless otherwise necessary.
• The measurements are carried out at three frequencies: [432, 435, 438] MHz.
2.2 Review of possible approaches A detailed review of possible verification approaches of the P-band SAR payload for the BIOMASS candidate mission was performed in [RD2]. The following approaches were considered:
1. Measurement of the entire SAR antenna. In this approach, the SAR antenna is deployed in an appropriate anechoic chamber and its RF characteristics are measured with Planar Near-Field (PNF) technique. Although this approach has some advantages, in view of several significant technical difficulties and challenges it was considered not feasible.
2. Measurement of a scaled model. In this approach, a down-scaled model of the SAR antenna and the spacecraft are manufactured and measurements are performed at the correspondingly up-scaled frequencies. Again, in view of several significant technical difficulties and challenges this approach was considered not feasible.
3. Measurement of the feed array and pattern calculation. In this approach, the feed array is characterized separately by measurements, while the pattern and gain of the entire SAR antenna are calculated by a suitable electromagnetic modeling tool. This approach has been validated on a number of satellite reflector antennas, both commercial and scientific, such as Planck. This approach is considered as feasible and the most promising one for the P-band SAR payload, and it was investigated further, both by simulations and by measurements.
Extensive simulations using the GRASP software package were carried out to clarify several issues related to the considered verification approach. The following conclusions have been reached in [RD2]:
• Interactions between the reflector and the spacecraft with the feed can be considered negligible.

Study of Very Large Aperture P-Band Antenna Performance Verification Page 7/38 Methodology and Facilities, ESTEC Contract No. 4000102325/10/NL/JA SR9: Summary Report
• Influence of the reflector support arm can be considered negligible.
• The calculation uncertainty of the employed numerical tool, GRASP software based on the Method of Moments (MoM) approach can be considered negligible. Application of the combined PO/PTD approach was also investigated and found possible.
• Sensitivity analysis regarding relative pointing and displacement of the feed and reflector was carried out. It was concluded that all displacement and pointing uncertainties that keep the beam maximum within 0.05° from the nominal direction will not affect the pattern shape, only the pointing direction.
• Sensitivity analysis regarding reflector surface errors was carried out. It was concluded that for a typical value of 5 mm RMS for the reflector surface uncertainty it is recommended to keep the correlation distance below 2.5 m.
The following three feed configurations were investigated by simulations to determine the simplest configuration that is able to provide the required accuracy of the field incident on the reflector, see Fig. 1:
Configuration 1: the feed array alone
Configuration 2: the feed array with its support structure and spacecraft top plate
Configuration 3: the feed array with the complete spacecraft
It was concluded that the configuration 1 does not provide enough accuracy to conform to the pattern uncertainty and pointing requirements, while both configurations 2 and 3 provide sufficient accuracy of the incident field.
(a)
(c)
Fig. 1: Feed configurations considered in this project: configuration 1 (a), configuration 2 (b), and configuration 3 (c).
(b)

Study of Very Large Aperture P-Band Antenna Performance Verification Page 8/38 Methodology and Facilities, ESTEC Contract No. 4000102325/10/NL/JA SR9: Summary Report
In order to obtain realistic measurement uncertainty estimates and investigate possible problems related to characterization of the feed at P-band, two measurement campaigns were carried out [RD3]. The LDA feed in the configurations 1, 2, and 3 was measured with the Spherical Near-Field (SNF) technique at the DTU-ESA Facility and in the configurations 1 and 2 with the PNF and Cylindrical Near-Field (CNF) techniques at the Defence Materiel Organisation (DMO) near-field facility.
It was found that for the configurations 1 and 2 the SNF technique provides smallest uncertainty both for the directivity and gain, the CNF technique provides slightly larger uncertainty, while the PNF technique provides the largest uncertainty. For the configuration 3 the uncertainty was very large mainly due to extremely high level or multiple reflections between the antenna under test (AUT) and the measurement probe.
2.3 Conclusions Summarizing the conclusions in subsection 2.2, the most promising approach consists of measurement of radiation characteristics of the LDA feed with its support structure and spacecraft top plate (configuration 2) with the SNF technique followed by calculation of the pattern and gain of the entire SAR antenna by an electromagnetic modeling tool.

Study of Very Large Aperture P-Band Antenna Performance Verification Page 9/38 Methodology and Facilities, ESTEC Contract No. 4000102325/10/NL/JA SR9: Summary Report
3 Proposed Performance Verification Methodology – Step by Step In this section, the proposed performance verification methodology for the P-band SAR payload for the BIOMASS candidate mission is described.
3.1 Step by step procedure Measurements
Step 1: The S-parameters of the LDA feed in configuration 2 (feed array with its support structure and top plate of the spacecraft) are measured both for port H and port V with a calibrated Vector Network Analyzer in anechoic environment.
Step 2: The full-sphere complex relative pattern of the LDA feed in conf. 2 is measured with the SNF technique both for port H and port V.
Step 3: The radiation efficiency of the LDA feed in conf. 2 both for port H and port V is measured using the substitution technique with a calibrated gain standard.
Step 4: Measurements for establishing uncertainty budgets for the radiation pattern and efficiency are carried out.
Step 5: Post-processing of the measured data is carried out, including transformation from the measurement coordinate system (CS) to the feed CS, conversion to the necessary time convention, normalization, and data format.
The outputs from the measurements are:
• LDA feed radiation pattern
• LDA feed radiation efficiency
• LDA feed S-parameters
• Uncertainty estimates for the radiation pattern and radiation efficiency
Simulations
Step 6: The spherical wave expansion (SWE) of the LDA feed is calculated.
Step 7: The reflector model is established and the scattered field from the LDA feed SWE is calculated. Radiation efficiency of the reflector is calculated.
Step 8: Total LDA field is calculated from the sum of the incident and scattered fields. LDA directivity is calculated.
Step 9: LDA gain is calculated by a product of the LDA directivity, LDA feed radiation efficiency, and LDA reflector radiation efficiency.
Step 10: Transformation to the necessary output CS, conversion to the necessary time convention, normalization, and data format.
Step 11: Calculations for establishing uncertainty budgets for the radiation pattern and gain are carried out.

Study of Very Large Aperture P-Band Antenna Performance Verification Page 10/38 Methodology and Facilities, ESTEC Contract No. 4000102325/10/NL/JA SR9: Summary Report
3.2 Required input The following is required to perform the measurements described in sub-section 3.1:
• LDA feed as flight hardware in configuration 2 (feed array with its support structure and top plate of the spacecraft) with access to the feed ports H and V.
• An appropriate test support structure for the LDA feed in conf. 2 allowing its mounting to the antenna positioner in the SNF facility.
• SNF facility suitable for measurements of the LDA feed in conf. 2.
The following is required to perform the simulations described in sub-section 3.1:
• Measurement data for the LDA feed radiation pattern and radiation efficiency.
• Geometry of the reflector, location and orientation of the reflector with respect to the feed, reflection and transmission coefficients of the reflector mesh.
• Appropriate software for calculation of the SWE, establishing model of the reflector, calculation of the scattered and total field and its parameters, for example, GRASP software.
3.3 Required measurement facility and simulation software
The measurement facility for performing measurements described in sub-section 3.1 should satisfy the following requirements:
• Performing measurements on the LDA feed in conf. 2, which has the dimensions of about 1.6 m × 2.4 m × 1.6 m.
• Performing SNF measurements at 435 MHz, which includes appropriate absorber treatment, calibrated near-field probe, calibrated gain standard, established measurement and post-processing procedures.
• Performing S-parameters measurements with Vector Network Analyzer at P-band (400-470 MHz).
The simulation software for performing simulations described in sub-section 3.1 should satisfy the following requirements:
• Calculation of the SWE.
• Establishing model of the reflector with given position and orientation of the feed represented as SWE.
• Calculation of the scattered and total field and its parameters, like directivity, gain, radiation efficiency.
• Transformation to the necessary output CS, conversion to the necessary time convention, normalization, and data format.
Study of Very Large Aperture P-Band Antenna Performance Verification Page 11/38 Methodology and Facilities, ESTEC Contract No. 4000102325/10/NL/JA SR9: Summary Report
3.4 Assumptions and considerations The following assumptions and considerations were made in developing the proposed performance validation methodology:
• The LDA feed represents a 2x2 patch array with single H port and single V port and without any active elements, like amplifiers.
• The LDA reflector is assumed to have nominally parabolic shape with known root-mean-square surface deviations and correlation distance. The reflector is assumed to have a circular projected aperture and dimensions as given in [RD1]. The reflection and transmission coefficients for the reflector mesh are assumed known for the frequencies of interest (430-440 MHz).
• The spacecraft is assumed to be made of perfectly electrically conductive (PEC) materials and having shape and dimensions as given in [RD1]. No solar panel was considered.
In the case that any of the above assumptions in the final design of the BIOMASS satellite are not valid, it should be considered and decided, if further investigations are needed that may result in changes to the proposed performance validation methodology.
Study of Very Large Aperture P-Band Antenna Performance Verification Page 12/38 Methodology and Facilities, ESTEC Contract No. 4000102325/10/NL/JA SR9: Summary Report
4 Measurement and Model Uncertainty In this section, the measurement and model uncertainty budgets for the main parameters of the P-band SAR payload: directivity, gain, and beam pointing, are described. The total budget for each of the parameters consists of contributions from measurement uncertainty of the LDA feed and modeling uncertainty from the calculations of the secondary SAR pattern [RD4]. The estimated uncertainties based on the measurements and simulations carried out within this project are presented.
4.1 Radiation pattern and directivity The uncertainty budget for directivity measurement with the SNF technique implemented at the DTU-ESA Facility contains some 20 items. For the measurement of the LDA feed in conf. 2, most of the items have negligible effect on the measured radiation pattern, except few [RD5]. The largest measurement uncertainty items are found to be:
• multiple reflections between an AUT and measurement probe,
• antenna tower scattering,
• receiver amplitude non-linearity.
It is noted that scattering from the anechoic chamber is estimated to be small due to applied directive probe, which effectively suppresses signal reflected from the walls.
It is also noted that the found strong influence of the test support structure on the measurement results should not be attributed to the measurement uncertainties, but rather to the modeling uncertainties of the LDA feed. The detailed discussion on the test support structure is given in sub-section 5.1.
The combined effect of the above three measurement uncertainty items on the SAR pattern was estimated by performing calculations described in [RD6] given in Appendix B. It is seen from Fig. 11 in Appendix B that the difference field between the patterns with and without measurement uncertainties is at the level of −40 dB or less from the pattern peak corresponding to the peak-to-peak variation around the pattern peak of ±0.09 dB and 1σ deviation of 0.03 dB.
The effect of the test support structure, combined with the above three measurement uncertainty items, on the SAR pattern can be seen from Fig. 8 in Appendix B. The difference field between the patterns with and without measurement uncertainties is at the level of −27 dB or less from the pattern peak corresponding to the peak-to-peak variation around the pattern peak of ±0.39 dB and 1σ deviation of 0.13 dB. It is clear that the test support structure represents a dominant uncertainty item and its reduction must be considered.
The modeling uncertainty items for the proposed performance validation methodology were described in details in [RD2, RD4]; these are also listed in sub-section 2.2.
Taking into account all contributions, the derived uncertainty budget for the peak directivity in terms of 1σ is shown in Table 1.

Study of Very Large Aperture P-Band Antenna Performance Verification Page 13/38 Methodology and Facilities, ESTEC Contract No. 4000102325/10/NL/JA SR9: Summary Report
Table 1: Uncertainty budget for the peak directivity in terms of 1σ.
Uncertainty item Std. dev. σ, dB
1. Feed measurement uncertainty: with/without test support structure
0.13 / 0.03
2. Reflector-spacecraft interactions 0.01*
3. Reflector support arm influence 0.01*
4. Secondary pattern calculation (conf. 2) 0.04*
5. Deployment accuracy 0.03*
6. Reflector surface modeling 0.04*
7. Numerical tool 0.01*
Root Sum Square: with/without test support structure 0.15 / 0.07
* It is noted that 1σ estimates were calculated in [RD2] as 1/2 of the peak-to-peak variation. These estimates were then transferred to [RD4]. It was later found that more correct estimates are obtained using coefficient 1/3 and thus the 1σ values in the directivity budget in [RD4] should be multiplied by 2/3. The results shown in Table 1 above are the corrected ones.
4.2 Gain In the proposed performance validation methodology, the gain of the SAR antenna is represented by a product of the directivity and the radiation efficiency, where the latter consists of two contributions: measured feed radiation efficiency and calculated reflector radiation efficiency [RD4]. Thus the total gain uncertainty includes three terms: peak directivity uncertainty, uncertainty of the feed radiation efficiency, and uncertainty of the reflector radiation efficiency.
The measurement uncertainty of the feed radiation efficiency, in turn, consists of some 8 terms with the largest contributions from the peak directivity uncertainty1 and gain standard (SGH) uncertainty1 [RD5]. Considering that the strong effect of the test support structure is reduced, e.g. as the result of its proper design, and neglecting its contribution, the uncertainty budget for the peak gain of the SAR antenna including all terms from the measurements and simulations is shown in Table 2.
1 In the case that not gain, but radiation efficiency is determined with the substitution technique, uncertainty of the total radiated power for the antenna under test and uncertainty of the gain standard radiation efficiency must be estimated and included into the budget instead of uncertainties of the peak directivity and peak gain. The former uncertainties are approximately the same as the latter ones for the gain determination procedure implemented at the DTU-ESA Facility. The receiver non-linearity term is not considered in this case, since it is included into the total radiated power uncertainties.
Study of Very Large Aperture P-Band Antenna Performance Verification Page 14/38 Methodology and Facilities, ESTEC Contract No. 4000102325/10/NL/JA SR9: Summary Report
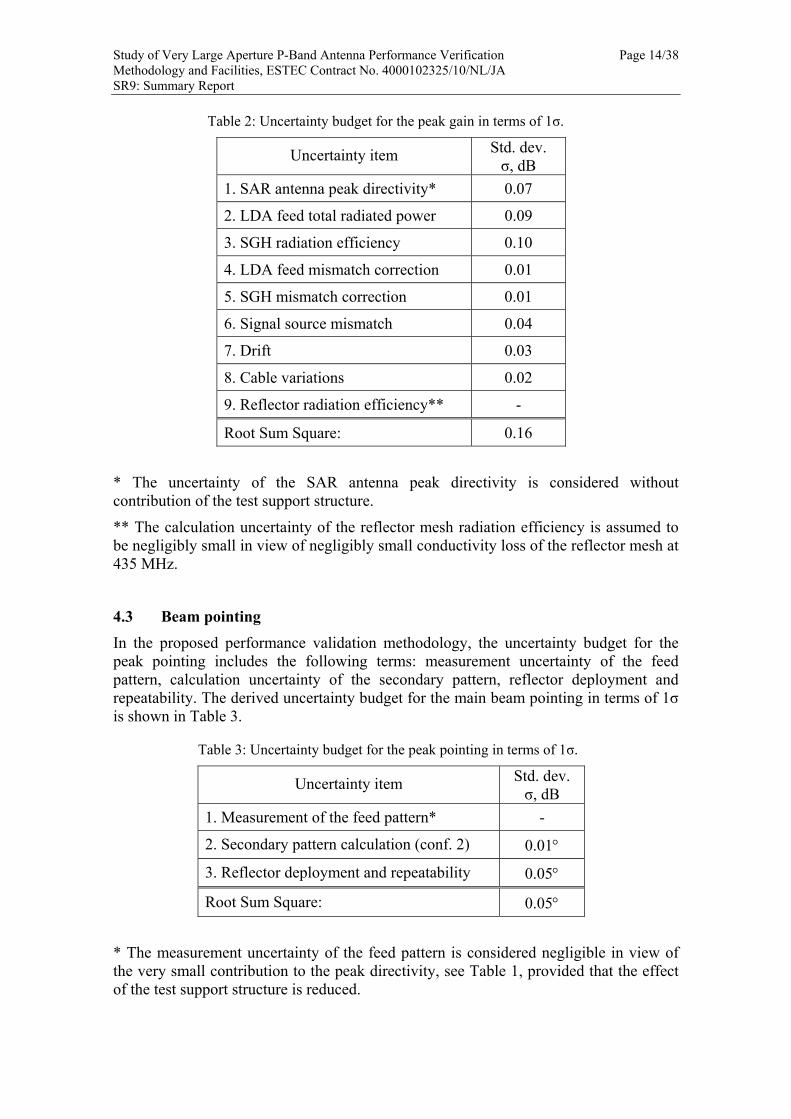
Table 2: Uncertainty budget for the peak gain in terms of 1σ.
Uncertainty item Std. dev. σ, dB
1. SAR antenna peak directivity* 0.07
2. LDA feed total radiated power 0.09
3. SGH radiation efficiency 0.10
4. LDA feed mismatch correction 0.01
5. SGH mismatch correction 0.01
6. Signal source mismatch 0.04
7. Drift 0.03
8. Cable variations 0.02
9. Reflector radiation efficiency** -
Root Sum Square: 0.16
* The uncertainty of the SAR antenna peak directivity is considered without contribution of the test support structure.
** The calculation uncertainty of the reflector mesh radiation efficiency is assumed to be negligibly small in view of negligibly small conductivity loss of the reflector mesh at 435 MHz.
4.3 Beam pointing In the proposed performance validation methodology, the uncertainty budget for the peak pointing includes the following terms: measurement uncertainty of the feed pattern, calculation uncertainty of the secondary pattern, reflector deployment and repeatability. The derived uncertainty budget for the main beam pointing in terms of 1σ is shown in Table 3.
Table 3: Uncertainty budget for the peak pointing in terms of 1σ.
Uncertainty item Std. dev. σ, dB
1. Measurement of the feed pattern* -
2. Secondary pattern calculation (conf. 2) 0.01°
3. Reflector deployment and repeatability 0.05°
Root Sum Square: 0.05°
* The measurement uncertainty of the feed pattern is considered negligible in view of the very small contribution to the peak directivity, see Table 1, provided that the effect of the test support structure is reduced.

Study of Very Large Aperture P-Band Antenna Performance Verification Page 15/38 Methodology and Facilities, ESTEC Contract No. 4000102325/10/NL/JA SR9: Summary Report
5 Compliance Analysis and Recommendations The requirements to the measurement accuracy are specified in [AD1, section A1.8] as follows:
The one way gain accuracy at 1 σ shall be lower than: 0.15 dB.
The relative accuracy is defined as follows: • The relative accuracy at 10dB below maximum at 1σ shall be lower than: 0.25 dB • The relative accuracy at 20dB below maximum at 1σ shall be lower than: 0.75 dB • The relative accuracy at 30dB below maximum at 1σ shall be lower than: 2.50 dB
The angular accuracy of the beam pointing relative to the antenna reference (including all instability errors) shall be lower than: 0.05 degrees
In order to simplify the analysis for the radiation pattern, the requirements at different levels are converted to the requirement for the peak directivity, which is calculated as 0.08 dB at 1σ [RD4].
5.1 Compliance analysis Analyzing the obtained estimates for the peak directivity shown in Table 1, it is seen that with the present test support structure the requirement is not satisfied. The effect of the test support structure exceeds all other contributions few times and thus some special countermeasures must be applied to strongly reduce its influence. The observed strong effect can be explained by two factors: inappropriate design of the test support structure and its close location to the sources of radiation. In view of the small size of the ground plane of the LDA feed, it can be assumed that the diffraction fields at the edges of the feed are rather strong and thus placement of large conductive objects in the vicinity of the edge must be avoided in order to ensure minimum disturbance to the radiated field. It is recommended that a special design of the test support structure is proposed, e.g. having an X-shape and/or made of non-conductive materials, which should be complemented by thorough analysis done by simulations to ensure minimum disturbance of the LDA feed pattern.
Assuming that the effect of the test support structure is reduced, e.g. to be below 0.03 dB (1σ), the total uncertainty for the peak directivity then does not exceed the required 0.08 dB (1σ) and the uncertainty requirements at the other pattern levels are also satisfied.
It is seen from Table 2 that the uncertainty estimate for the peak gain slightly exceeds the requirement even under assumption that the contribution of the test support structure is neglected. Two largest contributions in the budget are the uncertainty of the gain standard radiation efficiency and the uncertainty of the LDA feed total radiated power. Reduction of both of these items must be addressed.
It is seen from Table 3 that the uncertainty estimate for the peak pointing is within the requirement with the only major contribution from the deployment accuracy and repeatability.

Study of Very Large Aperture P-Band Antenna Performance Verification Page 16/38 Methodology and Facilities, ESTEC Contract No. 4000102325/10/NL/JA SR9: Summary Report
5.2 Recommendations on feed and reflector design On request from ESA, the recommendations on the feed and reflector design are summarized in this sub-section:
• It is recommended that the feed design is modified such that its back radiation and edge diffraction effects are reduced in order to minimize interactions with the test support structure during the on-ground feed characterization.
• It is recommended to ensure that the stiffness properties of the feed support and the spacecraft top plate allow on-ground feed characterization in 1g gravity force.
• It is recommended that the reflector has the RMS surface error not exceeding 5 mm with the correlation distance not exceeding 2.5 m.
5.3 Recommendations on improvements of test procedures According to the results of compliance analysis given in sub-section 5.1, the following is recommended:
• A special design of the test support structure should be considered in order to ensure its minimum disturbance on the LDA feed pattern. The design should be complemented by thorough analysis done by simulations and verified by measurements, if possible. The goal of the optimum test support structure design is to reduce its effect on the LDA feed pattern to be below 0.03 dB (1σ).
• The test procedures for determining the radiation efficiency of the AUT and gain standards should be reviewed. Proper estimates should be obtained for the following items in uncertainty budget: AUT total radiated power and SGH radiation efficiency. Improvements to the test procedures should be considered to reduce uncertainties of the above items.
5.4 Recommendations on updates of the DTU-ESA Facility
The measurement campaign carried out with the LDA feed in different configurations at the DTU-ESA Facility [RD5] has revealed a series of problems. The new directive probe for 0.4-1.2 GHz band has rather large weight (~22 kg) with otherwise excellent electrical characteristics. The probe tower at the DTU-ESA Facility is not designed to carry such large weight, while keeping precise alignment of the probe. For the measurements described in [RD5], some temporary solution was applied, which is not suitable for permanent use.
The antenna tower at the DTU-ESA Facility has rather short horizontal axis and thus the absorbers presently covering vertical part of the tower are small in order to not interfere with (large) AUTs. As a result, for measurements of low/middle-directive antennas at 435 MHz, e.g. such as Standard Gain Horns and the LDA feed, the scattering from the antenna tower represents a significant contribution limiting the overall uncertainty of the gain determination.
The following updates of the DTU-ESA Facility are recommended in order to resolve the above problems:

Study of Very Large Aperture P-Band Antenna Performance Verification Page 17/38 Methodology and Facilities, ESTEC Contract No. 4000102325/10/NL/JA SR9: Summary Report
• New probe tower table allowing mounting of large and heavy probes (up to 25-30 kg) with possibility of their axial translation by 20-40 cm.
• New longer horizontal axis on the antenna tower, e.g. extended by 100-150 mm as compared to the present one.
• New larger absorbers covering the vertical part of the antenna tower.
• Extension of the overhead crane rails to facilitate mounting of heavy probes on the probe tower.
• Establishing a clean-room for proper handling of the flight hardware.
• New automatic system for mechanical alignment of the antenna tower and the probe tower, based on lasers and electronic levels.

Study of Very Large Aperture P-Band Antenna Performance Verification Page 18/38 Methodology and Facilities, ESTEC Contract No. 4000102325/10/NL/JA SR9: Summary Report
6 Summary and Conclusions This report summarizes the main results obtained and conclusions made in the project “Study of Very Large Aperture P-Band Antenna Performance Verification Methodology and Facilities”. For the P-band SAR payload for the BIOMASS candidate mission, different performance verification approaches for the LDA configuration were reviewed and analyzed. The most promising approach was then selected and further investigated by extensive simulations with the GRASP software package. An optimum performance verification methodology for the P-band SAR payload was then proposed, which consists of measurement of radiation characteristics of the LDA feed followed by calculation of the pattern and gain of the entire SAR antenna by an electromagnetic modeling tool, see the detailed description in Section 3.
In parallel, for obtaining realistic measurement uncertainty estimates and investigating possible problems related to characterization of the LDA feed at P-band, two measurement campaigns were carried out. The LDA feed radiation characteristics were measured in different configurations with different near-field techniques, the results and measurement uncertainties were analyzed and compared in-between. The relevant simulations were then repeated with the obtained measurement data in order to establish a reliable uncertainty budget for the proposed performance verification methodology.
Compliance analysis of the derived uncertainty budgets for the main parameters of the P-band SAR payload was then carried out and recommendations on improvement of the test procedures to reduce critical uncertainty sources were provided. In particular, it was found critical to develop a suitable design of the test support structure for the LDA feed, which introduces minimum disturbance into the measured LDA feed pattern.
From this study, it is concluded that it will be possible to perform the on-ground performance verification measurements of the BIOMASS P-band antenna at the DTU-ESA Facility.
Some updates of the DTU-ESA Facility are recommended in order to improve measurement accuracy and efficiency at P-band and thus fulfill the requirements for the characterization of the LDA feed.
It is concluded that the proposed performance verification methodology for the P-band SAR payload allows achieving the specified requirements for all characteristics provided that the recommended updates are implemented.

Study of Very Large Aperture P-Band Antenna Performance Verification Page 19/38 Methodology and Facilities, ESTEC Contract No. 4000102325/10/NL/JA SR9: Summary Report
Appendix A. Measurement Facilities

Study of Very Large Aperture P-Band Antenna Performance Verification Page 20/38 Methodology and Facilities, ESTEC Contract No. 4000102325/10/NL/JA SR9: Summary Report
Appendix B. WP8200: Evaluation of LDA Performance using
Measured Pattern
The report [RD6] is included in this Appendix.

TICRA
LÆDERSTRÆDE 34 · DK-1201 COPENHAGEN K DENMARK VAT REGISTRATION NO. DK-1055 8697
TELEPHONE +45 33 12 45 72 TELEFAX +45 33 12 08 80 TICRA FOND, CVR REG. NO. 1055 8697
E-MAIL [email protected] http://www.ticra.com
TICRA
Study of Very Large Aperture P-Band
Antenna Performance Verification
Methodology and Facilities
ESTEC Contract No. 4000102325/10/NL/JA
WP8200: Evaluation of LDA Performance using
Measured Pattern
Revision 1.0
April 2012 Ticra report S-1543-03
Author: Knud Pontoppidan

RECORD OF CHANGES
Issue Date Record of changes Author
1.0 26/04/2012 All – first issue K. Pontoppidan

ii TICRA
TABLE OF CONTENTS
RECORD OF CHANGES i
1. Introduction 1
2. Summary of feed pattern measurements 1
3. Feed measurement uncertainties 7

TICRA 1
1. Introduction
One purpose of this report is to compare the calculated feed pat-
terns with measurements carried out in the DTU radio-anechoic
chamber. This is done for all three measurement configurations
and described in the following Section 2.
Another purpose is to determine the influence on the calculated
secondary far field from unavoidable uncertainties in the meas-
urement of the feed. This is described in Section 3.
2. Summary of feed pattern measurements
Figure 1 recalls the three measurement configurations. Configu-
ration 1 is the feed array alone consisting of two doublets and
where each doublet consists of two square patch elements.
Configuration 1 Configuration 2 Configuration 3
Figure 1 The three measurement configurations.
In Configuration 2 the feed array is supplemented by the top of
the satellite and the support structure. In Configuration 3 the
complete satellite body is included.

2 TICRA
In TN1 it was demonstrated how the feed array including both
the support structure and the satellite can be modelled by a
Method of Moments (MoM) approach. The feed array has eight in-
put ports and it can be excited in two orthogonal, linear polarisa-
tions. The excitations are determined in order to match measure-
ments of a single doublet carried out previously.
The following Figure 2, Figure 3 and Figure 4 show the compari-
son between the calculated and measured feed patterns for all
three configurations and for both polarisations. It may be noted
that the agreement between measurement and calculation is very
good, especially in the main beam and the first side lobes. This is
of course a very satisfactory result, since it is the main beam that
illuminates the reflector.

TICRA 3
-100.0 0.0 100.0-150.0 -100.0 -50.0 0.0 50.0 100.0 150.0deg-20.0
-10.0
0.0
10.0
-20.0
-15.0
-10.0
-5.0
0.0
5.0
10.0
15.0dBi
Configuration 1, x-polarisation
-100.0 0.0 100.0-150.0 -100.0 -50.0 0.0 50.0 100.0 150.0deg-20.0
-10.0
0.0
10.0
-20.0
-15.0
-10.0
-5.0
0.0
5.0
10.0
15.0dBi
Configuration 1, y-polarisation
Figure 2 Comparison between measured (full line) and cal-
culated (dotted line) feed patterns. Conf. 1,
Top: x-polarisation
Bottom: y-polarisation
Black curves: co-polarisation, phi = 0°
Red curves: co-polarisation, phi = 90°
Green curves: cross-polarisation, phi = 90°

4 TICRA
-100.0 0.0 100.0-150.0 -100.0 -50.0 0.0 50.0 100.0 150.0deg-20.0
-10.0
0.0
10.0
-20.0
-15.0
-10.0
-5.0
0.0
5.0
10.0
15.0dBi
Configuration 2, x-polarisation
-100.0 0.0 100.0-150.0 -100.0 -50.0 0.0 50.0 100.0 150.0deg-20.0
-10.0
0.0
10.0
-20.0
-15.0
-10.0
-5.0
0.0
5.0
10.0
15.0dBi
Configuration 2, y-polarisation
Figure 3 Comparison between measured (full line) and cal-
culated (dotted line) feed patterns. Conf. 2,
Top: x-polarisation
Bottom: y-polarisation
Black curves: co-polarisation, phi = 0°
Red curves: co-polarisation, phi = 90°
Green curves: cross-polarisation, phi = 90°

TICRA 5
-100.0 0.0 100.0-150.0 -100.0 -50.0 0.0 50.0 100.0 150.0deg-20.0
-10.0
0.0
10.0
-20.0
-15.0
-10.0
-5.0
0.0
5.0
10.0
15.0dBi
Configuration 3, x-polarisation
-100.0 0.0 100.0-150.0 -100.0 -50.0 0.0 50.0 100.0 150.0deg-20.0
-10.0
0.0
10.0
-20.0
-15.0
-10.0
-5.0
0.0
5.0
10.0
15.0dBi
Configuration 3, y-polarisation
Figure 4 Comparison between measured (full line) and cal-
culated (dotted line) feed patterns. Conf. 3,
Top: x-polarisation
Bottom: y-polarisation
Black curves: co-polarisation, phi = 0°
Red curves: co-polarisation, phi = 90°
Green curves: cross-polarisation, phi = 90°

6 TICRA
Since the measured and calculated feed patterns are very similar
also the secondary patterns will be similar. This is demonstrated
by an example in Figure 5 where the calculated far-field is shown
for both measured and calculated feed for Configuration 2 with x-
polarisation in the pattern plane, phi = 0.
The similarity of the two curves in Figure 5 is important because
it shows that the results obtained with the calculated feed model
are representative for the real feed. This means that all the con-
clusions obtained with the feed model in previous parts of the
study are valid.
-90.0 -60.0 -30.0 0.0 30.0 60.0 90.0deg
-20.0
-10.0
0.0
10.0
20.0
30.0
dBi
Configuration 2
Figure 5 Secondary field for Configuration 2, x-polarisation,
pattern plane: phi = 0°,
black curve: measured feed pattern,
red curve: calculated feed pattern.

TICRA 7
3. Feed measurement uncertainties
The measured results for the feed presented in the previous sec-
tion are of course subject to measurement uncertainties and for
the actual measurement configuration these uncertainties have
been identified and quantified.
In order to illustrate and evaluate the influence of the measure-
ment uncertainties two feed models are generated. The one feed
model is the actually measured pattern; we will denote this the
“reference feed pattern”. The other feed model is again the actual-
ly measured pattern, but now perturbed by the known measure-
ment uncertainties. We will denote this the “uncertain feed pat-
tern”. The secondary fields obtained with these two different feed
models are exemplified in Figure 6 for Configuration 1 with x-
polarisation in the pattern plane, phi = 0.
The difference between the two curves in Figure 6 is generated by
the feed measurement uncertainties. In order to quantify this ef-
fect the difference in amplitude is calculated and plotted as shown
in the top figure of Figure 7. The procedure used to generate these
difference plots is explained by the following example.
The top of Figure 7 shows that the maximum difference appears
for 2.4 . A careful inspection of the two curves in Figure 6 for
2.4 reveals that the directivity is 28.9719 dBi and 28.3751
dBi for the “reference” and the “uncertain” feed model, respective-
ly. These numbers correspond to amplitudes in real numbers of
28.0927 and 26.2273, respectively, and the difference is 1.8654
which corresponds to 5.42 dBi and this is the level of the peak in
Figure 7 (top).
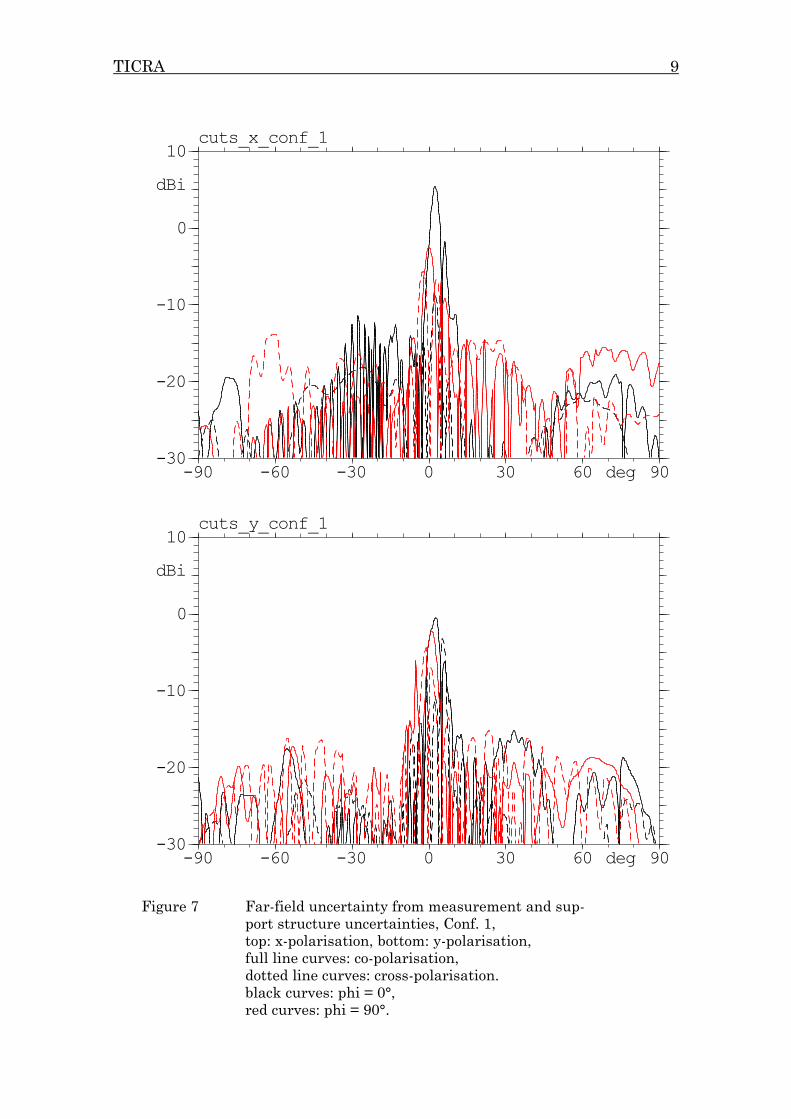
The difference plots for Configuration 1, 2 and 3 are given in Fig-
ure 7, Figure 8 and Figure 9, respectively, and including both x-
polarisation (top) and y-polarisation (bottom).

8 TICRA
Figure 6 Far-field for Configuration 1, x-polarisation,
co-polar component, phi = 0°
black curve: reference feed pattern,
red curve: uncertain feed pattern.
TICRA 9
-90 -60 -30 0 30 60 90deg-30
-20
-10
0
10
dBi
cuts_x_conf_1
-90 -60 -30 0 30 60 90deg-30
-20
-10
0
10
dBi
cuts_y_conf_1
Figure 7 Far-field uncertainty from measurement and sup-
port structure uncertainties, Conf. 1,
top: x-polarisation, bottom: y-polarisation,
full line curves: co-polarisation,
dotted line curves: cross-polarisation.
black curves: phi = 0°,
red curves: phi = 90°.

10 TICRA
-90 -60 -30 0 30 60 90deg-30
-20
-10
0
10
dBi
cuts_x_conf_2
-90 -60 -30 0 30 60 90deg-30
-20
-10
0
10
dBi
cuts_y_conf_2
Figure 8 Far-field uncertainty from measurement and sup-
port structure uncertainties, Conf. 2,
top: x-polarisation, bottom: y-polarisation,
full line curves: co-polarisation,
dotted line curves: cross-polarisation.
black curves: phi = 0°,
red curves: phi = 90°.

TICRA 11
-90 -60 -30 0 30 60 90deg-30
-20
-10
0
10
dBi
cuts_x_conf_3
-90 -60 -30 0 30 60 90deg-30
-20
-10
0
10
dBi
cuts_y_conf_3
Figure 9 Far-field uncertainty from measurement and sup-
port structure uncertainties, Conf. 3,
top: x-polarisation, bottom: y-polarisation,
full line curves: co-polarisation,
dotted line curves: cross-polarisation.
black curves: phi = 0°,
red curves: phi = 90°.

12 TICRA
The difference plots presented in Figure 7 to Figure 9 include all
relevant uncertainties in the feed measurement set-up. In partic-
ular, it includes the effect from the feed array support structure
which can be seen behind the feed array in Figure 1. This metallic
support frame was found necessary in order to make the whole
construction sufficiently stiff during the spherical near-field
measurements.
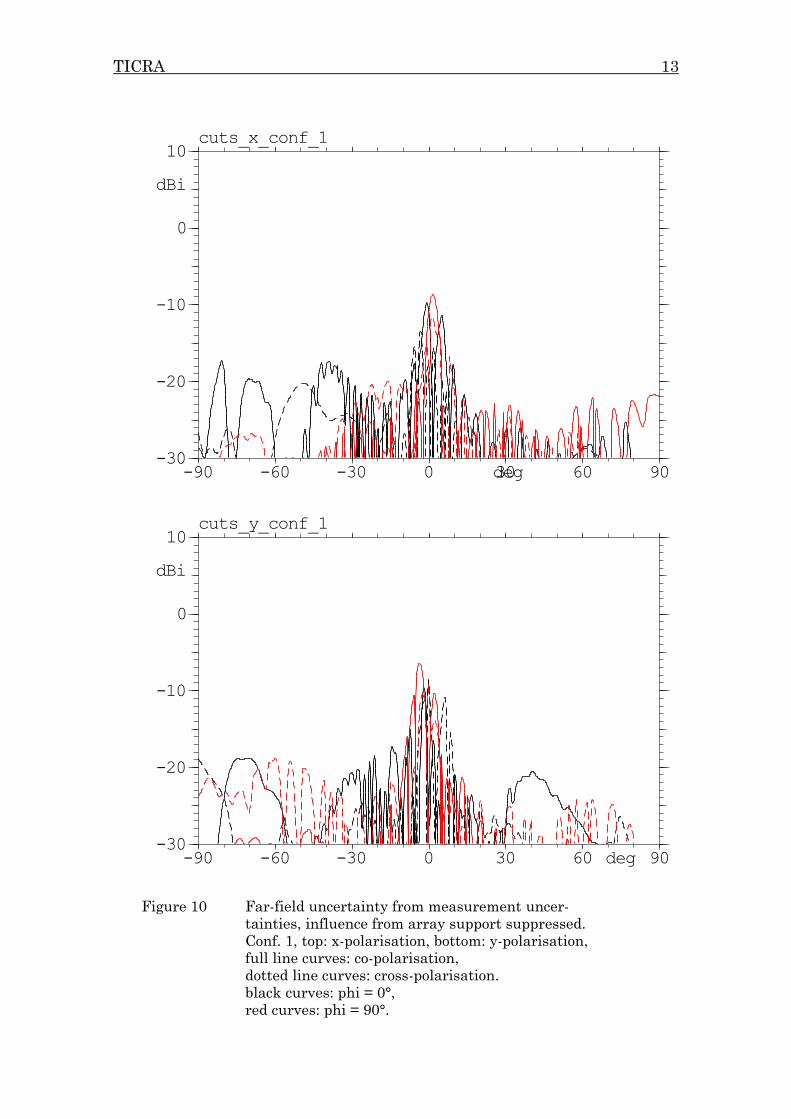
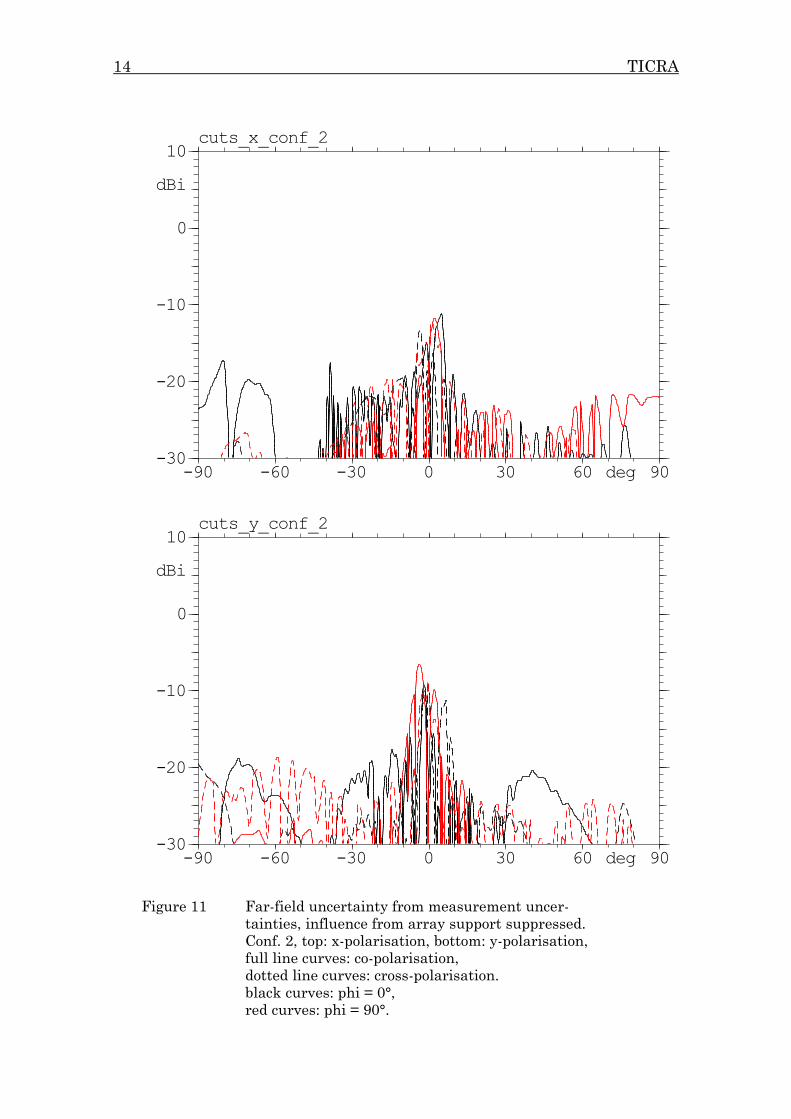
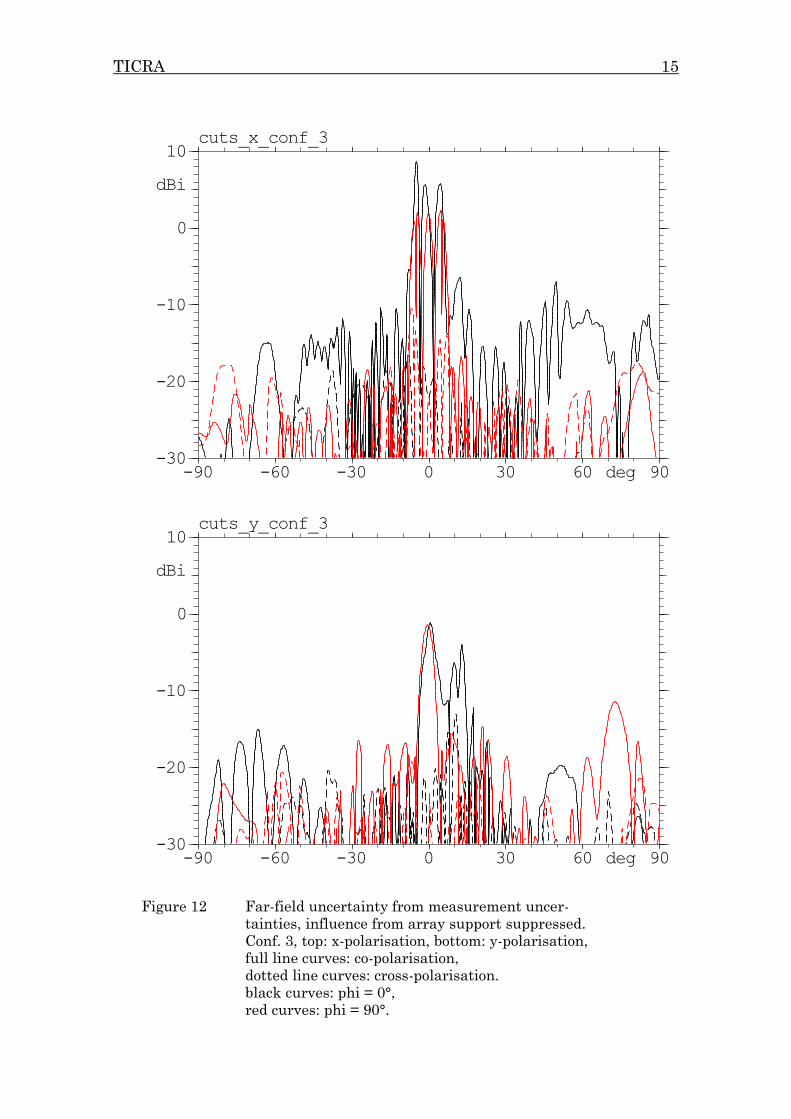
It is questionable whether it is reasonable to include this support
uncertainty to the overall uncertainty budget since, for a realistic
satellite, the support of the feed array must be an integral part of
the whole satellite structure. For this reason the difference plots
have been repeated without the contribution from the feed sup-
port and the results are shown in Figure 10 to Figure 12. It is
seen that the maximum difference is reduced 10 dB or more for
Configuration 1 and 2. For Configuration 3 there is no improve-
ment because in this case there are other contributions that are
just as large as the influence from the support frame.
TICRA 13
-90 -60 -30 0 30 60 90deg-30
-20
-10
0
10
dBi
cuts_x_conf_1
-90 -60 -30 0 30 60 90deg-30
-20
-10
0
10
dBi
cuts_y_conf_1
Figure 10 Far-field uncertainty from measurement uncer-
tainties, influence from array support suppressed.
Conf. 1, top: x-polarisation, bottom: y-polarisation,
full line curves: co-polarisation,
dotted line curves: cross-polarisation.
black curves: phi = 0°,
red curves: phi = 90°.
14 TICRA
-90 -60 -30 0 30 60 90deg-30
-20
-10
0
10
dBi
cuts_x_conf_2
-90 -60 -30 0 30 60 90deg-30
-20
-10
0
10
dBi
cuts_y_conf_2
Figure 11 Far-field uncertainty from measurement uncer-
tainties, influence from array support suppressed.
Conf. 2, top: x-polarisation, bottom: y-polarisation,
full line curves: co-polarisation,
dotted line curves: cross-polarisation.
black curves: phi = 0°,
red curves: phi = 90°.
TICRA 15
-90 -60 -30 0 30 60 90deg-30
-20
-10
0
10
dBi
cuts_x_conf_3
-90 -60 -30 0 30 60 90deg-30
-20
-10
0
10
dBi
cuts_y_conf_3
Figure 12 Far-field uncertainty from measurement uncer-
tainties, influence from array support suppressed.
Conf. 3, top: x-polarisation, bottom: y-polarisation,
full line curves: co-polarisation,
dotted line curves: cross-polarisation.
black curves: phi = 0°,
red curves: phi = 90°.