study of vehicle esp system and analysis of dynamics in
TRANSCRIPT

Kaunas University of Technology
Faculty of Mechanical Engineering and Design
Study of Vehicle ESP System and Analysis of Dynamics in
the Vehicle by Simulation using vedyna
Master’s Final Degree Project
Vinoth Chandrasekaran
Project author
Mantas Felneris
Supervisor
Kaunas, 2018

Kaunas University of Technology
Faculty of Mechanical Engineering and Design
Study of Vehicle ESP System and Analysis of Dynamics in
the Vehicle by Simulation using vedyna
Master’s Final Degree Project
Vehicle Engineering (621E20001)
Vinoth Chandrasekaran
Project author
Mantas Felneris
Supervisor
Assoc. prof. dr. Vaidas Lukoševičius
Reviewer
Kaunas, 2018

Kaunas University of Technology
Faculty of Mechanical Engineering and Design
Vinoth Chandrasekaran
Study of Vehicle ESP System and Analysis of Dynamics in
the Vehicle by Simulation using vedyna
Declaration of Academic Integrity
I confirm that the final project of mine, Vinoth Chandrasekaran, on the topic “Study of vehicle ESP
system and analysis of dynamics in the vehicle by simulation using veDYNA” is written completely
by myself; all the provided data and research results are correct and have been obtained honestly.
None of the parts of this thesis have been plagiarised from any printed, Internet-based or otherwise
recorded sources. All direct and indirect quotations from external resources are indicated in the list
of references. No monetary funds (unless required by law) have been paid to anyone for any
contribution to this project.
I fully and completely understand that any discovery of any manifestations/case/facts of dishonesty
inevitably results in me incurring a penalty according to the procedure(s) effective at Kaunas
University of Technology.
(name and surname filled in by hand) (signature)

4
KAUNAS UNIVERSITY OF TECHNOLOGY
FACULTY OF MECHANICAL ENGINEERING AND DESIGN
Study programme: VEHICLE ENGINEERING (621E20001)
TASK ASSIGNMENT FOR FINAL DEGREE PROJECT OF
MASTER STUDIES
Given to the student:
1. Title of the Project
Study of vehicle ESP system and analysis of dynamics in the vehicle by simulation using vedyna /
ESP sistemos transporto priemonės tyrimas ir transporto priemonės dinamikos analizė imituojant
vedyna.
2. Aim and Tasks of the Project
To study the ESP system and analyze various conditions leading to skidding, understeer, oversteer,
and rollover by using veDYNA.
3. Initial Data:
The dimensions of the Lamborghini Aventador LP 700 – 4 fed in veDYNA software is mentioned
below.
VEHICLE DIMENSIONS DIMENSIONS
Wheelbase 2.7 (m)
Wheel track rear 1.7 (m)
Wheel track front 1.72 (m)

5
Vehicle length 4.78 (m)
Vehicle width 2.02 (m)
Vehicle height 1.136 (m)
Vehicle mass 1731 (kg)
4. Main Requirements and Conditions
• The principle of ESP system and conditions leading to skidding, understeer, oversteer, and
rollover.
• Simulation in veDYNA vehicle dynamics software by using various regulations of testing
methods such as steerstep, steady-state circle drive, braking on mu-split, double lane change
and slalom test.
5. Structure of the Text Part
• Studying about the working method of Electronic Stability Programme.
• Analysing various methods leading to skidding, understeer, oversteer, and rollover.
• Choosing a specific vehicle model Lamborghini Aventador LP 700 – 4 to analyze the
dynamics of the vehicle.
• Using different regulations and testing methods to analyze conditions such as skidding,
understeer, oversteer, and rollover by using vehicle simulation software veDYNA.
• Discussion about the simulation results leading to skidding, understeer, oversteer, and
rollover.
• Conclusion about the research work done.

6
6. Structure of the Graphical Part
• The dimensions of the specific car model Lamborghini Aventador LP 700 – 4 was fed to
the veDYNA simulation software.
• Experimentation of different tests like steerstep, steady-state circle drive, braking on mu-
split, double lane change and slalom test.
• From the generated graphs of the plot–gui in veDYNA simulation software, it was found
that high lateral acceleration and yaw rate lead to skidding, understeer, oversteer, and
rollover of the vehicle.
7. Consultants of the Project
Student: Vinoth Chandrasekaran _________________________
(Name, Surname) (Signature, date)
Supervisor: Mantas Felneris _____________________
(Name, Surname) (Signature, date)
Programme Director of the Study Field: Lect. dr. Janina Jablonskytė _____________________
(Name, Surname) (Signature, date)

7
Table of contents
Introduction ..................................................................................................................................... 15
1. Literature review ...................................................................................................................... 17
2. Theoretical framework ............................................................................................................ 20
2.1. History and background of ESP ............................................................................................... 20
2.2. Skidding, oversteer, understeer, and rollover........................................................................... 21
2.2.1. Cause of rollover .................................................................................................................... 21
2.2.2. Cause of skidding .................................................................................................................. 23
2.2.3. Cause of oversteer and understeer ......................................................................................... 23
2.3. Major components of ESP system ........................................................................................... 23
2.4. Working of ESP ....................................................................................................................... 24
2.4.1. Differential braking ............................................................................................................... 24
2.4.2. Yaw stability control .............................................................................................................. 25
2.4.3. Roll stability control .............................................................................................................. 26
2.4.4. Single track model ................................................................................................................. 27
2.5. Accident statistics and importance of ESP .............................................................................. 29
2.6. Importance of vehicle modelling and simulation ..................................................................... 30
2.7. Regulations and testing methods of ESP ................................................................................ 31
2.7.1. ESP regulations ...................................................................................................................... 31
2.7.2. Testing methods ..................................................................................................................... 31
3. Research methodology ............................................................................................................. 35
3.1. Modelling in vedyna ................................................................................................................ 35
3.1.1. Vehicle configuration ............................................................................................................ 35
3.1.2. General vehicle data .............................................................................................................. 36
3.1.3. Determination of parameters ................................................................................................. 38
3.1.4. Model simulation ................................................................................................................... 38
4. Simulation results ..................................................................................................................... 43
4.1.1. Steerstep test .......................................................................................................................... 43
4.1.2. Steady-state circle drive test .................................................................................................. 44
4.1.3. Braking on mu-split test ......................................................................................................... 45
4.1.4. Double lane change test ......................................................................................................... 46
4.1.5. Slalom test ............................................................................................................................. 47
Conclusion ........................................................................................................................................ 48
List of references .............................................................................................................................. 49
Appendices ....................................................................................................................................... 52

8
List of figures
Figure 1. Vehicle ESP On and Off [35] .............................................................................................. 15
Figure 2. Testing ESP prototypes in a 1983 Mercedes-Benz 230 TE on Bosch ground [11] ............. 20
Figure 3. Rollover accident due to extreme maneuver [36] ................................................................ 21
Figure 4. Major components of ESP system [12] ................................................................................ 23
Figure 5. Flowchart of ESP components ........................................................................................... 24
Figure 6. Corrective yaw moment through braking intervention (left) and active steering system
through steering angle intervention (right) [33] .................................................................................. 25
Figure 7. Insurance Institute for highway safety and highway loss data institute [6] ......................... 26
Figure 8. Roll stability control mechanism [30] .................................................................................. 26
Figure 9. A vehicle with yaw on and roll rotation [31] ....................................................................... 27
Figure 10. Oversteer, neutral and understeer [8]................................................................................. 27
Figure 11. Installation rate of ESP worldwide [35] ............................................................................ 30
Figure 12. veDYNA GmbH [23] ......................................................................................................... 32
Figure 13. veDYNA GmbH [23] ......................................................................................................... 32
Figure 14. veDYNA GmbH [23] ......................................................................................................... 33
Figure 15. veDYNA GmbH [23] ......................................................................................................... 33
Figure 16. veDYNA GmbH [23] ......................................................................................................... 34
Figure 17. Flowchart of research methodology ................................................................................. 35
Figure 18. Specification of vehicle dimension .................................................................................. 36
Figure 19. Vehicle mass and load ...................................................................................................... 37
Figure 20. Steerstep yaw rate response due to steering wheel input graph ....................................... 43
Figure 21. Steerstep roll angle graph ................................................................................................. 43
Figure 22. Steady-state circle drive yaw velocity amplification oversteer graph ............................. 44
Figure 23. Steady-state circle drive yaw velocity amplification understeer graph ........................... 44
Figure 24. Mu-split yaw angle graph................................................................................................. 45
Figure 25. Mu-split yaw rate graph ................................................................................................... 45
Figure 26. Double lane change lateral acceleration graph................................................................. 46
Figure 27. Double lance change steering wheel angle graph ............................................................ 46
Figure 28. Slalom roll angle graph .................................................................................................... 47
Figure 29. Vehicle brake system ....................................................................................................... 54
Figure 30. Vehicle aerodynamics ...................................................................................................... 54
Figure 31. Front axle - general .......................................................................................................... 55
Figure 32. Front axle - tyre description ............................................................................................. 55
Figure 33. Front axle - brake parameters ........................................................................................... 56

9
Figure 34. Front axle - steering ......................................................................................................... 56
Figure 35. Front axle - mass and inertia ............................................................................................ 57
Figure 36. Front axle - initial wheel orientation ................................................................................ 57
Figure 37. Front axle - kinematic tables ............................................................................................ 58
Figure 38. Front axle - compliance .................................................................................................... 58
Figure 39. Front axle - spring characteristics .................................................................................... 59
Figure 40. Front axle - damper .......................................................................................................... 59
Figure 41. Front axle - anti-roll bar ................................................................................................... 60
Figure 42. Rear axle - general ........................................................................................................... 60
Figure 43. Rear axle - tyre description .............................................................................................. 61
Figure 44. Rear axle - damper ........................................................................................................... 61
Figure 45. Rear axle - spring characteristics ..................................................................................... 62
Figure 46. Rear axle - compliance ..................................................................................................... 62
Figure 47. Rear axle - kinematic tables ............................................................................................. 63
Figure 48. Rear axle - initial wheel orientation ................................................................................. 63
Figure 49. Rear axle - mass and inertia ............................................................................................. 64
Figure 50. Rear axle - brake parameters ............................................................................................ 64
Figure 51. Rear axle - anti-roll bar .................................................................................................... 65
Figure 52. Drivetrain - engine - transmission - manual ..................................................................... 65
Figure 53. Drivetrain - engine torque characteristics ........................................................................ 66
Figure 54. Steerstep - simulation control .......................................................................................... 66
Figure 55. Steerstep - user procedure ................................................................................................ 67
Figure 56. Steerstep - front axle force 3180 N .................................................................................. 67
Figure 57. Steerstep - front axle force 5000 N .................................................................................. 68
Figure 58. Circle drive - simulation control ...................................................................................... 68
Figure 59. Circle drive - user procedure ............................................................................................ 69
Figure 60. Circle drive - front axle more force (oversteer) ............................................................... 69
Figure 61. Circle drive - rear axle more force (understeer) ............................................................... 70
Figure 62. Double lane change - simulation control ......................................................................... 70
Figure 63. Double lane change 80 km/h - user Procedure ................................................................. 71
Figure 64. Double lane change 160 km/h - user procedure ............................................................... 71
Figure 65. Slalom - simulation control .............................................................................................. 72
Figure 66. Slalom - user procedure ................................................................................................... 72
Figure 67. Mu-split - simulation control ........................................................................................... 73
Figure 68. Mu-split - user procedure ................................................................................................. 73

10
Figure 69. Front tyre characteristics graph ........................................................................................ 74
Figure 70. Rear tyre characteristics graph ......................................................................................... 74
Figure 71. Steerstep yaw rate graph .................................................................................................. 75
Figure 72. Steerstep yaw angle graph ................................................................................................ 75
Figure 73. Steerstep tyre loads graph ................................................................................................ 76
Figure 74. Steerstep steering wheel angle graph ............................................................................... 76
Figure 75. Steerstep spring deflection graph ..................................................................................... 77
Figure 76. Steerstep sideslip angle graph .......................................................................................... 77
Figure 77. Steerstep lateral tyre force graph...................................................................................... 78
Figure 78. Steerstep lateral acceleration graph .................................................................................. 78
Figure 79. Steerstep pitch angle graph .............................................................................................. 79
Figure 80. Steerstep spring deflections graph ................................................................................... 79
Figure 81. Mu-split vehicle speed graph ........................................................................................... 80
Figure 82. Mu-split vehicle acceleration graph ................................................................................. 80
Figure 83. Mu-split steering wheel angle graph ................................................................................ 81
Figure 84. Mu-split lateral acceleration graph................................................................................... 81
Figure 85. Double lane change yaw angle graph............................................................................... 82
Figure 86. Double lane change vehicle velocity graph ..................................................................... 82
Figure 87. Double lane change sideslip angle graph ......................................................................... 83
Figure 88. Double lane change roll angle graph ................................................................................ 83
Figure 89. Double lane change yaw rate graph ................................................................................. 84
Figure 90. Slalom yaw rate graph ...................................................................................................... 84
Figure 91. Slalom yaw angle graph ................................................................................................... 85
Figure 92. Slalom velocity graph ...................................................................................................... 85
Figure 93. Slalom steering wheel angle graph .................................................................................. 86
Figure 94. Slalom sideslip angle graph ............................................................................................. 86
Figure 95. Slalom lateral acceleration graph ..................................................................................... 87
Figure 96. Slalom current gear and position of the clutch graph ...................................................... 87
Figure 97. Slalom engine speed and acceleration pedal position graph ............................................ 88

11
List of tables
Table 1. Accident statistics with ESP [17] .......................................................................................... 29
Table 2. Maneuver phases go steerstep ............................................................................................. 38
Table 3. Maneuver parameters of go steerstep .................................................................................. 39
Table 4. Maneuver phases go steady-state circle drive ..................................................................... 39
Table 5. Maneuver parameters of go steady state circular drive ....................................................... 39
Table 6. Maneuver phases go braking on mu-Split ........................................................................... 40
Table 7. Maneuver parameters of go braking on mu-split ................................................................ 40
Table 8. Maneuver phases go slalom ................................................................................................ 40
Table 9. Maneuver parameters of go slalom ..................................................................................... 41
Table 10. Maneuver phases of go double lane change ...................................................................... 41
Table 11. Maneuver parameters of go double lane change at 80 km/h ............................................. 41
Table 12. Maneuver parameters of go double lane change 160 km/h ............................................... 42
Table 13. The specifications of the Lamborghini Aventador LP 700 – 4 ......................................... 52

12
List of abbreviations
ABS: Antilock Braking System
AIS: Automotive Industry Standards
ARAI: Automotive Research Association of India
COG: Center of Gravity
DSC: Dynamic Stability Control
DOF: Degree of Freedom
ESP: Electronic Stability Programme
ESC: Electronic Stability Control
ECE: Economic Commission for Europe
ECU: Engine Control Unit
LTV: Light Transport Vehicle
NHTSA: National Highway Traffic Safety Adminstration
RSC: Roll Stability Control
SUV: Sport Utility Vehicle
TCS: Traction Control System
UNECE: United Nations Economic Commission for Europe
VSC: Vehicle Stability Control
YSC: Yaw Stability Control

13
Chandrasekaran, Vinoth. Study of vehicle ESP system and analysis of dynamics in the vehicle by
simulation using vedyna. Master's Final Degree Project / supervisor Mantas Felneris; Faculty of
Mechanical Engineering and Design, Kaunas University of Technology.
Study field and area (study field group): Transport Engineering (E12), Engineering Science.
Keywords: ESP, ECE, AIS, veDYNA, Matlab, Understeer, Oversteer, Skidding, Rollover, Yaw
stability, Roll stability, Braking, Robert Bosch, Vehicle, Dynamics.
Kaunas, 2018. 92 pages.
Summary
Electronic Stability programme is an active safety system which was introduced by Robert Bosch to
improve the stability of the vehicle and prevent the vehicle from an emergency situation such as
skidding, understeer, oversteer and rollover accident. With the increase in production of vehicle in
developing countries like India, China and introduction of more sports variants by countries like
Germany, Italy has lead to increase in number of accidents, so it is of utmost importance that active
safety system like ESP must be implemented in all vehicle to protect the passengers from fatalities
and reduce the road accidents.
To study about the ESP system and analyze the various properties that influence skidding, understeer,
oversteer, and rollover specific car model Lamborghini Aventador lp 700 – 4 was chosen and tested
by using various regulations in modelling simulation software veDYNA. The testing regulations such
as steer step, double lane change, slalom test, circle drive and mu-split was used with varied
parameters to know about the limits of the vehicle in various conditions. The graphs generated in the
plot - gui of veDYNA software was used to analyze the yaw rate, yaw angle, roll angle, sideslip angle,
steering wheel angle and lateral acceleration of the vehicle.
The aim of the research is to study about the effectiveness of ESP system using theoretical methods
and apply various methods leading to skidding, understeer, oversteer, and rollover using vehicle
simulation software veDYNA which is linked with Matlab/Simulink interface.

14
Chandrasekaran, Vinoth. ESP sistemos transporto priemonės tyrimas ir transporto priemonės
dinamikos analizė imituojant vedyna. Magistro baigiamasis projektas / vadovas / Mantas Felneris;
Kauno technologijos universitetas, Mechanikos inžinerijos ir dizaino fakultetas.
Studijų kryptis ir sritis (studijų krypčių grupė): Transporto inžinerija (E12), Inžinerijos mokslai.
Reikšminiai žodžiai: ESP, ECE, AIS, veDYNA, Matlab, nepakankamas pasukamumas, per didelis
pasukamumas, slydimas, virtimas, stabilumas sukimuisi, stabilumas virtimui, Robert Bosch
stabdymas, transporto priemonių dinamika.
Kaunas, 2018. 92 p.
Santrauka
Robertas Boschas sukūrė aktyvią saugos sistemą - elektroninę stabilumo programą, siekiant pagerinti
transporto priemonės stabilumą bei užkirsti kelią avarinėms situacijoms tokioms kaip slydimui,
nepakankamam ar per dideliam pasukamumui, kai prarandamas priekinių ar galinių ratų sukibimas
su keliu ir galiausiai apvirtimui. Dėl padidėjusių transporto priemonių gamybos apimčių
besivystančiose šalyse tokiose kaip Indija, Kinija ir padidėjusio susidomėjimo sportinių transporto
priemonių kategorijoje tokiose šalyse kaip Vokietija, Italija dėl ko padidėjo ir nelaimingų atsitikimų
atvejų. Todėl yra labai svarbu diegti aktyvias saugos sistemas kaip ESP, taip siekiant išvengti žūtčių
keliuose bei sumažinti nelaimingų atsitikimų kiekį keliuose.
Siekiant išsiaiškinti ESP sistemos veikimą ir pagrindines savybes, kurios įtakoja slydimą,
nepakankamą ar per didelį pasukamumą bei virtimą buvo pasirinktas Lamborghini Aventador lp 700
- 4 sportinis automobilis, kuris buvo analizuojamas programoje veDYNA sumodeliuojant įvairias
situacijas. Modeliuojamos tokios situacijos kaip žingsninis sukimas, dvigubas juostos keitimas,
slalomo testas, važiavimas ratu, važiavimo pradžia įkalnėje pritaikant skirtingus parametrus, siekiant
išsiaiškinti transporto priemonės ribas prie skirtingų situacijų. Programos veDYNA sugeneruoti
grafikai buvo panaudoti siekiant išanalizuoti transporto priemonės nuokrypio dydį ir kampą, virtimo
kampą, šoninio slydimo kampą, vairo pasukimo kampą ir skersinį pagreitį.
Pagrindinis tyrimo tikslas – išsiaiškinti ESP sistemos efektyvumą pritaikant teorinius metodus
skirtingose situacijose įskaitant transporto priemonės slydimą, nepakankamą ir per didelį
pasukamumą, bei virtimą. Įvairios situacijos sumodeliuotos taikant programą veDYNA, kurios
veikimas pagrįstas Matlab/Simulink programos principais.

15
Introduction
Electronic stability programme
Electronic stability programme (ESP) is an active safety system which has been evolved from antilock
braking system (ABS) and traction control system (TCS). Electronic stability programme is also
called as electronic stability control (ESC), vehicle stability control (VSC) or dynamic stability
control (DSC). It was mainly introduced into automobile industry by Robert Bosch to control the
vehicle from three important conditions such as skidding, self-steering behavior (oversteer and
understeer), and rollover.
The main function of ESC is to increase the performance of the vehicle by allowing the driver to
drive the car in the intended path during an emergency situation or extreme maneuvers to avoid
rollover (e.g. fast cornering or lane changing with emergency braking). It also increases the vehicle
stability by decreasing the loss of traction (skidding).
Figure 1. Vehicle ESP On and Off [35]
With the continuous rise in demand for the vehicle by the people for traveling and transportation of
goods, which has lead to the rise in a number of the vehicle produced every year by the automotive
industry. Further research and advancement in the field of automotive engineering have to lead to
advancement in the active and passive safety vehicle system. More system like ESP should be
invented to increase the stability of the vehicle and to decrease the number of fatality rate.

16
The thesis work is done to investigate the behavior of vehicle during skidding, self-steering behavior
(understeer, oversteer) and rollover by using the theoretical principle of ESP in simulation software
veDYNA/Matlab. For the better understanding of the vehicle behavior, particular car model
(Lamborghini Aventador LP 700 - 4) has been chosen and all the parameters for this car are fed to
the veDYNA vehicle simulation software. According to the ECE, AIS regulations test such as double
lane change, slalom test, steady-state circle drive, steer step and mu-split was experimented and
comparison from the simulated graph are made to study about the ESP system.
veDYNA
veDYNA is a vehicle simulation software by a German company TESIS and it is used for testing the
vehicle dynamics of passenger car, sports car, formula car, SUV, and truck. The veDYNA simulation
software is linked with Matlab/Simulink interface which shows the result as a graph in plot – gui of
veDYNA and programmed result in Matlab interface.
veDYNA is used for applications such as the desktop investigation of vehicle dynamics, concept
studies of vehicle parameters, driving performance test, virtual test, standard test or customized test
and evaluation of vehicle requirements and performance targets. It is being used by the automotive
industry such as AUDI, BMW, FORD, GENERAL MOTORS, MAGNA and VOLKSWAGEN for
vehicle testing.

17
1. Literature review
The research study was done by B.J.S. Van Putten on “Design of an electronic stability program for
vehicle simulation software” [1] using veDYNA vehicle simulation software to compare vehicle
system with and without ESP which shows the differences such as sideslip angle, steering wheel angle
and vehicle trajectory of the vehicle. The author had also compared the values of the redesigned cycle
with Duisburg cycle to show the effectiveness of the ESP system.
The research carried out by E.K. Liebemann, K.Meder, J. Schuh, G.Nenninger - Robert Bosch GmbH
Germany on ‘‘Safety and performance enhancement: the Bosch electronic stability control (ESP)” [2]
says that ESP is an active safety system which has been very effective and had reduced the number
of fatalities in accidents and avoiding rollovers. It has also been concluded that ESP increases the
stability of vehicles by controlling the yaw rate and lateral acceleration.
The study was done by authors Shengqin Li, Le He on ‘‘Co-simulation study of vehicle ESP system
based on Adams and Matlab” [3] describes the working principle of electronic stability System in the
theoretical method as well as by using the simulation software when the ESP system is disabled and
enabled. It has been concluded that the ESP braking system can increase the vehicle stability and
vehicle simulation software like veDYNA, Adams and carsim decreases the cost of testing.
The study carried out by Tejas Shrikant Kinjawadekar on “Model-based design of electronic stability
control system for passenger cars using carsim and Matlab-Simulink” [4], The Ohio State University
2009 describes the importance of vehicle simulation software in the testing of ESP system using
various testing methods to obtain accurate results rather using experimental methods in outdoor
conditions which requires lot of time and money. It was also found out that the roll stability control
and yaw stability control stabilized the self-steering behavior and rollover rate in the presence of ESP
system by comparing the graphs generated from the vehicle simulation software.
The research was done by Sohel Anwar on “Yaw stability control of an automotive vehicle via
generalized predictive algorithm” [5] 2005 American Control Conference June 8-10, 2005. Portland,
OR, USA has been studied that the testing of yaw stability control mode in extreme conditions like
snow in slalom method by using vehicle simulation software is better when compared to outdoor
testing conditions. It is difficult to test vehicle‘s Yaw stability control in Scandinavian countries
where the temperature is very low with extreme weather conditions like snow, ice which makes really
difficult for the automotive car makers to test the vehicle.

18
The study was done by Insurance Institute for Highway Safety on ‘‘Electronic stability programme -
reducing multiple-vehicle crashes as well as single-vehicle” [6] clearly shows that single vehicle
accidents are more when compared to multiple vehicle crashes. It is been confirmed by this study that
ESP can reduce single vehicle as well as multiple-vehicle crashes. The highway institute also studied
the effectiveness and importance of ESP system in saving lives of road users. Researchers made a
comparison of vehicle crashes for passenger cars, SUV with ESP system optional and mandatory
from 2001 - 2004 and found out that fatality rate of single vehicle accidents reduced a lot when the
car is equipped with ESP system.
According to the Federal Motor Vehicle Safety Standards ‘‘Electronic stability control systems;
controls and displays of national highway traffic safety administration” [7] - Department of
transportation it is mandatory for all the passenger cars, multipurpose passenger vehicles, trucks, and
buses to be equipped with Electronic stability programme. NHTSA states that installation of ESP
system reduced the single- vehicle accidents by 34 percent and single vehicle accidents of sports
utility vehicle by 59 percent. ESP has the capacity to avoid rollovers by 71 percent of passengers cars
and 84 percent of the SUV rollovers. From this NHTSA study, it is clearly evident that ESP plays a
huge role in preventing rollovers and accidents.
The study done by Maria Krafft, Anders Lie (Swedish Road Administration), Claes Tingvall
(Swedish Road Administration, Monash University Accident Research Centre), Anders Kullgren
(Folksam Research Sweden) on ‘‘The effectiveness of ESC (electronic stability control) in reducing
real-life crashes and injuries” [8] shows the different types of studies involving the reduction in rate
of single-vehicle crashes when the vehicle is equipped with ESP system. The study also states about
the involvement of ESP system in low friction surfaces when the road surface is covered by snow or
ice. From this study, it is very clear that the ESP should be mandatory in all vehicles.
The research done by Yiannis E. Papelis, Ginger S. Watson, Timothy L. Brown On ‘‘An empirical
study of the effectiveness of electronic stability control system in reducing loss of vehicle control” [9]
where the ESP systems were tested in different vehicles by male and female drivers and it was found
that vehicle equipped with ESP system was able to control the vehicle at high speed. The overall
investigation leads to the conclusion that 34 percent of drivers gained more control of the vehicle if
the vehicle is equipped with ESP. The comparison was done between SUV and passenger car in
different conditions without ESP system, which further lead to rollover in SUV due to the high center
of gravity and skidding in passenger cars due to light weight and loss of traction in tyres.

19
The regulations stated by automotive industry standards on ‘‘Electronic stability control systems” [10]
has many rules and test procedures to be followed for the vehicles fitted with ESP system in India. In
order to find the lateral acceleration, side slip angle, yaw rate, understeer and oversteer of the vehicle
certain requirements such as general requirements, performance requirements, test conditions and test
procedures are performed. By this regulation, it is concluded that ESP system can pass the test only
if it meets the regulations given by the AIS 133.
The literature review shows that the electronic stability programme should be made mandatory in all
vehicle as it improves the stability of the vehicle and avoids accidents in extreme conditions like
skidding, understeer, oversteer, and rollover. It is also clear that availability of more vehicle
simulation software in the automotive industry like veDYNA can reduce the time, money and human
error in the vehicle testing.

20
2. Theoretical framework
2.1. History and background of ESP
The main function of ESP is to increase the performance of the vehicle by allowing the driver to
drive the car in the intended path during an emergency situation or extreme maneuvers to avoid
rollovers (e.g. fast cornering or lane changing with emergency braking). It also increases the vehicle
stability by decreasing the loss of traction (skidding). Electronic stability programme is also called as
electronic stability control or dynamic stability control. The Electronic stability control was first
introduced by Robert Bosch and it was used in production by Mercedes-Benz (S) Class sedan in 1995.
When the journalist applied sudden brakes in order to avoid hitting the moose on the highway, which
lead to rollover of Mercedes-Benz A class in October 1997.
Father of the ESP, Anton Van Zanten, also patented an anti-skid concept for driving. The native
Dutchman, who had earned a Ph.D. in the natural sciences, joined Bosch in 1983. His remit was to
further develop the ABS to improve braking behavior in corners. Development work started on April
1984. ESP was invented by Anton van Zanten [11], who is a native Dutchman and he earned a Ph.D.
in the natural sciences and later on joined Bosch in 1983. He was keen on developing the ABS system
for a vehicle and after continuous testing, calculations lead to the development of electronic stability
programme.
Figure 2. Testing ESP prototypes in a 1983 Mercedes-Benz 230 TE on Bosch ground [11]

21
2.2. Skidding, oversteer, understeer, and rollover
2.2.1. Cause of rollover
A rollover happens more frequently while cornering and during the extreme maneuver. They can
happen due to several factors such as vehicle type, road conditions, environmental factors and
behavior of the driver. The causes of rollover can be classified into different types
Figure 3. Rollover accident due to extreme maneuver [36]
Vehicle type
Rollover mainly depends on the type of vehicle being driven by the driver, as the center of gravity of
the vehicle plays a major role in causing the vehicle to rollover.
Speed
Most of the rollover happens at high speed which causes the driver to make countersteering to the
desired direction. Rollovers due to speed are reported more on highways and roads where the speed
limit is very high.
Alcohol
An investigation done by highway department said that alcohol can make the driver lose control of
the vehicle and lead to rollover. Influence of alcohol had lead to more number of rollover accidents.
Location
Rural roads account for high rollover incidents than any other type of roads. As the roads in the rural
area are without a proper guardrail, median and road sign boards.

22
Routine driving
Daily commuting by people over long distance may lead to speeding, distraction, impaired driving
which may further lead to a rollover accident.
Single-vehicle crashes
This type of vehicle crash accounts for more than 85% of a rollover not involving any other types of
vehicle crashes, so it means that driver behavior is the main reason for rollover incidents.
Types of rollover
Rollover occurs in two different ways and can be classified as tripped and untripped.
Untripped
Untripped rollover occurs very less when compared to tripped rollover and they mostly occur in heavy
vehicles like bus, truck. It happens during an extreme maneuver at high speeds to avoid a collision
which leads to untripped rollover.
Tripped
Tripped rollover accounts for 95% and there are many reasons for this type of rollover where the
vehicles get tripped due to the guardrail, objects on the road which makes the vehicle to skid or turn
around causing tripped rollover.
Types of tripped rollovers
Guardrail
When the vehicle travels at high speed it loses control as the driver intends to take a right turn, where
the left side of the car touches the guardrail at high force causing the vehicle to rollover.
Steep slope
A rollover happens due to the steep slope and it happens mostly in off-road vehicles when the driver
evaluates the slope and tries to turn left or right causing the vehicle to rollover from top of the slope.
It also happens when the driver climbs the slope and loses traction in the tyre which further causes
the vehicle to topples over.

23
Soft Soil
This type of rollover occurs when the driver intends to take a sharp turn on the road curves and the
vehicle takes a sharp turn where one side of the wheel touches the soil, pavement, snow etc losing the
adhesion coefficient decreases making the vehicle to slip sideways and rolling of the wheels occurs
which causes a rollover.
2.2.2. Cause of skidding
Skidding mostly occurs when the vehicle travels at high speeds on snow, stone or uneven road surface
when a tyre loses the contact with road surface. They can also occur due to very hard braking or
accelerate very fast suddenly in the corner, forcing the vehicle to skid or allowing the driver to lose
control of the vehicle. It happens in the vehicle due to loss of traction in the front or rear of the tyre
and they can further lead to rollover if a system like ESP is not present in the vehicle.
2.2.3. Cause of oversteer and understeer
Self-steering behavior is one of the characteristics of vehicle dynamics and it can decrease the stability
of the system. Oversteer happens when the vehicle turns more than the intended path made by the
driver and understeer happens when the vehicle turns less than intended path made by the driver.
2.3. Major components of ESP system
Figure 4. Major components of ESP system [12]

24
Figure 5. Flowchart of ESP components
2.4. Working of ESP
The ESP system works on the principle of differential braking to control the yaw rate and roll of the
vehicle. Electronic stability programme controls the vehicle in different situations such as skidding,
oversteer, understeer, and rollover.
2.4.1. Differential braking
Differential braking is done to control the brake individually on the front or at the rear of the vehicle,
which in turn is used to control the understeer, oversteer and rollover condition. This method can be
well understood by single track model or bicycle model. If there is any unusual behavior in the car
stability, it is detected automatically by the ECU unit of the ESP system. Later on, bakes are applied
on the particular wheel and sometimes torque is also reduced in the engine to control the vehicle as
soon as possible.

25
Figure 6. Corrective yaw moment through braking intervention (left) and active steering system through
steering angle intervention (right) [33]
2.4.2. Yaw stability control
ESP uses the principle of differential braking to control the slip angle and yaw rate, yaw stability
control is part of the electronic stability programme. Yaw stability control acts immediately when
there is a loss of friction between tyre at high speed and prevents the vehicle from leaving the
pathway. Yaw disturbance[27] is caused by the decrease in the tyre pressure and also by the uneven
road surface which is covered by snow. YSC continuously calculates the angle of the steering wheel
and longitudinal speed to control the yaw rate.
Yaw rate is linearly related by steering wheel angle and yaw rate gain[13][29]: yaw rate = (steering
wheel angle) × (yaw rate gain) and for a vehicle with neutral steer with negligible slip angle: Yaw
rate = (lateral acceleration)/(vehicle speed). From the above relations, ideal yaw rate of the vehicle
can be found.
The vehicle slip rate is the difference between actual and ideal yaw rates[13][29] : (Vehicle slip rate) =
(actual yaw rate) – (ideal yaw rate). The vehicle is said to oversteering if the vehicle slip rate is
positive and the vehicle is said to be understeering if the vehicle slip rate is negative.
There is two type of self-steering behavior which is being controlled by YSC. When the oversteer
situation occurs, the vehicle tends to move away from the intended path and the understeer situation
happens when the vehicle tends to turn less than the intended path. But, oversteer is very dangerous
when compared to understeer which may lead to severe consequences. The vehicle slip rate is
continuously calculated by yaw stability sensor which applies the brake on the selective wheel and
reduces the torque to correct the yaw moment which in turn improves the vehicle stability.

26
Figure 7. Insurance Institute for highway safety and highway loss data institute [6]
2.4.3. Roll stability control
Roll stability control detects the rollover situation and automatically applies brake by using the
principle of differential braking. RSC reduces the vehicle speed by reducing the engine torque and it
regularly checks the lateral acceleration with its threshold frequency when the rollover situation
occurs. They usually brake on the front wheels to prevent rollovers and also decreases the speed of
the vehicle and in RSC mechanism lateral acceleration is taken as threshold frequency as the rollover
is caused by the side force acting on the vehicle [4] [14] [15] [16] [26].
Figure 8. Roll stability control mechanism [30]

27
2.4.4. Single track model
Single track model is a linear model with 2 DOF freedom, which is also called as “bicycle model”
[28]. They are used to calculate the forces and moments acting on the vehicle and the forces are
classified into longitudinal acceleration, lateral acceleration, and yaw rate. Longitudinal acceleration
is the specification of speed and velocity of motion and lateral acceleration is the force that tends to
push the vehicle sideways, and yaw rate is the angular velocity or rotation of change of the heading
angle when the vehicle is in a horizontal position.
Figure 9. A vehicle with yaw on and roll rotation [31]
In the neutral steer car when there is lateral acceleration the vehicle follows the route on an angled
path because the front and rear slip angles are same [8]. Whereas, in the understeer and oversteer car
the front and rear slip angles are different so there is a curvature in the path of the vehicle. In case of
the understeer car, there is more cornering stiffness in the rear and in case of oversteer car there is
more cornering stiffness in the front.
Figure 10. Oversteer, neutral and understeer [8]

28
By sine theorem,
𝑅𝑓
𝑠𝑖𝑛(900−𝛼𝑟)=
𝑙
𝑠𝑖𝑛(𝛿𝑓−(𝛼𝑓−𝛼𝑟))
𝑅𝑓 ≈ 𝑅,
l = wheelbase
𝛿𝑓 = steering angle
𝛼𝑓 = slip angle at the front
𝛼𝑟 = slip angle at the rear
R = distance between the center of gravity and center of the curve
𝑠𝑖𝑛(900 − 𝛼𝑟) ≈ 1,
𝑠𝑖𝑛 (𝛿𝑓 − (𝛼𝑓 − 𝛼𝑟)) ≈ 𝛿𝑓 − (𝛼𝑓 − 𝛼𝑟)
𝛿𝑓 =𝑙
𝑅+ (𝛼𝑓 − 𝛼𝛾)
𝑅 =𝑙
𝛿𝑓 − (𝛼𝑓 − 𝛼𝑟)
conditions
𝛼𝑓 − 𝛼𝑟 > 0 ∶ understeer
𝛼𝑓 − 𝛼𝑟 = 0 : neutral
𝛼𝑓 − 𝛼𝑟 < 0 : oversteer
Self steering gradient
𝐸𝐺 = 𝑑𝛿𝑓
𝑑𝑎𝑦, EG depends on design parameters of the vehicle
𝐸𝐺 = 0 : neutral
𝐸𝐺 > 0 : understeer
𝐸𝐺 < 0 : oversteer

29
𝐸𝐺 = 𝑚 ⋅ (𝐶𝑟 ⋅ 𝑆𝑟 − 𝐶𝑓 ⋅ 𝑆𝑓)
𝑙 ⋅ 𝐶𝑓 ⋅ 𝐶𝑟
m = mass of the vehicle
𝑆𝑓 = distance from the centre of gravity to the front axle
𝑆𝑟 = distance from the centre of gravity to the rear axle
𝐶𝑓,𝑟 = Cornering stiffness
𝐶𝑓,𝑟 =𝑑𝐹𝑦 𝑓,𝑟
𝑑 𝛼𝑓,𝑟 , Fy = side force, 𝛼 = slip angle
If the force in the rear 𝐶𝑟 ⋅ 𝑆𝑟 is more than the front 𝐶𝑓 ⋅ 𝑆𝑓, then the car will have understeer
behaviour, which causes the vehicle to turn less than intended the path. If the force in the front 𝐶𝑓 ⋅ 𝑆𝑓
is more than the rear 𝐶𝑟 ⋅ 𝑆𝑟, then the car will have oversteer behaviour which causes the vehicle to
turn more than intended path [12].
2.5. Accident statistics and importance of ESP
There are a lot of accidents which occurs due to several reasons and the main type of accident is the
single-vehicle accident, where the vehicle collides with animal, objects on the road, rollover accidents
or goes of the road. According to national highway traffic safety administration [17], overall crash
reduction got reduced by 14% in cars and 28% in LTV when the vehicle was fitted with ESP system.
Table 1. Accident statistics with ESP [17]
Crash reduction by ESP (%)
Accident types Cars LTV‘s
Run off-road crashes 36 70
Single vehicle crashes 36 63
Rollover crashes 70 88
Multi-vehicle crashes 19 34
Overall crash reduction 14 28

30
In the survey taken by Insurance Institute for highway safety [18] on ESP effectiveness during 10 years
in the USA, ESP reduced the fatal vehicle crash by 33 percent, 20 percent for multiple-vehicle
crashes, 49 percent for single vehicle crashes. The effectiveness of ESP was found higher for SUV
than for cars. It is confirmed by this statistics that fatal crashes are reduced when the system is
equipped with ESP.
ESP is very important active safety system and with the increase in installation rate of ESP all around
the world which has to lead to a decrease in a number of single vehicle accidents. From the installation
rate graph of Bosch braking system, it is clearly evident that ESP prevents single-vehicle crashes and
the installation rate of ESP is increased.
Figure 11. Installation rate of ESP worldwide [35]
2.6. Importance of vehicle modelling and simulation
ESP system requires a lot of time in tuning the model according to different parameters taken from
the track testing, off-road testing, and it also needs a lot of time [4]. Testing the vehicle involves a lot
of risk for the driver as the vehicle is tested beyond its limit and human error may occur. For testing
the limits of the vehicle in different conditions requires a team of engineers to change the parts every
time before the vehicle is tested.

31
When comparing the above condition, it is way better to use modelling and simulation method to test
the vehicle. Vehicle modelling takes very less time to change the parameters and results of various
testing methods are displayed fast. It may not be as accurate as real-life testing of the vehicle but its
almost same as outdoor testing methods [32].
2.7. Regulations and testing methods of ESP
2.7.1. ESP regulations
There are many types of regulations passed by different countries for the balanced technical
specifications and improvement of Electronic stability programme which is planned to be fixed its
cars and light vans [19] [20] [21].
In 2007, the United Nations Economic Commission for Europe (UNECE) passed a regulation that it
is compulsory for heavy vehicles and trucks to be fitted with Electronic stability Programme from
2010 [22].
According to Automotive Industry Standards, AIS-133 for Electronic Stability Control Systems by
Automotive Research Association of India (ARAI), the vehicles of the certain category which is fitted
with Electronic stability programme should perform several procedures and test conditions to test the
effectiveness of ESP [10].
2.7.2. Testing methods
There are various testing methods to analyze the conditions leading to skidding, understeer, oversteer,
rollover and they can be classified into
Go steer step
Go steer step [23] method is used to evaluate the vehicle handling characteristics, where the vehicle is
a accelerate by a given input speed and then the steering wheel is turned suddenly according to the
given parameters. The result from this method is used to find the lateral acceleration, which is the
main reason for a rollover situation.

32
Figure 12. veDYNA GmbH [23]
Go steady-state circular drive
Go steady state [23] is a type of test in which the vehicle is constantly accelerated on a circular path of
radius(r) until the lateral acceleration(ay) is achieved. This test is done to understand the oversteer
and understeer of the car which is called as the self-steering behavior.
Yaw velocity amplification describes the yaw angle above the average steering angle of the front axle
and the steering wheel angle is the function of lateral speed which is determined from steering
characteristics.
The velocity of the vehicle over the steering neutral line shows the oversteering behavior and velocity
below the steering neutral line shows the understeering behavior. The speed characteristics show the
maximum speed of an understeering vehicle and it also indicates the speed at which steering is very
active.
Figure 13. veDYNA GmbH [23]

33
Mu-split
Mu-split is the test done to find the braking effect on the road with different coefficients on the left
and right side of the road. The vehicle accelerates to the given speed and suddenly decelerated by full
pressing of brake pedal until the vehicle comes to halt. It is one of the best methods for a testing
vehicle with and without ABS, ESP system.
Figure 14. veDYNA GmbH [23]
Slalom test
Slalom test [25] procedure involves driving a vehicle through the road with series of cones placed at a
certain distance continuously. The vehicle is accelerated continuously and the vehicle follows the
sinusoidal path and the results obtained from this shows the vehicle trajectory, vehicle speed, yaw
angle, yaw rate. This procedure can be used for comparison of different types of vehicles such as a
car, SUV, truck etc to find the rate of rollover.
Figure 15. veDYNA GmbH [23]

34
Double lane change
Double lane change is also called as “moose test” and this test consists of several cones on the side
lane with the entry as well as exit point [24]. The width of the entry lane depends upon the size of the
vehicle and width of the exit lane is normally 3m wide. The throttle is released after 2m from starting
of the lane and the vehicle velocity is measured in overrun mode at top gear in the exit lane. In this
process, if the cones are not overturned by the vehicle, then the test is passed. In the vehicle simulation
software veDYNA [23], the same procedure is followed as mentioned above and once the test is
completed, results are plotted in the veDYNA graphical user interface. From the simulated graph, the
properties such as vehicle trajectory, steering wheel angle, lateral acceleration, roll angle are
displayed.
Figure 16. veDYNA GmbH [23]

35
3. Research methodology
Figure 17. Flowchart of research methodology
3.1. Modelling in vedyna
The modelling and simulation in vehicle simulation software veDYNA involve a lot of procedure to
get the desired output characteristics of the vehicle. For the better understanding and research
purpose, the specific model of car was chosen and tested under various conditions to understand the
situations leading to oversteer, understeer, and skidding. Modelling in veDYNA consist of three parts
such as vehicle configuration, simulation control, and user procedure.
3.1.1. Vehicle configuration
The specific model Lamborghini Aventador LP 700 – 4 was chosen for testing under different
conditions and parameters such as general vehicle data, front axle, rear axle and drive train were fed
into the veDYNA software. These parameters were further used for further simulation procedure.
There are four different types of sections in vehicle configuration of veDYNA.

36
Generic vehicle data - VEHICLE DIMENSIONS, MASS AND LOAD, AERODYNAMICS,
BRAKE SYSTEM
Front axle - TYRE, BRAKE, STEERING, AXLE MASS AND INERTIA, INITIAL WHEEL
ORIENTATION, AXLE MASS AND INERTIA, INITIAL WHEEL ORIENTATION, AXLE
KINEMATICS, AXLE COMPLIANCE, SPRING, DAMPER, STABILIZER
Rear axle - TYRE, BRAKE, AXLE MASS AND INERTIA, INITIAL WHEEL ORIENTATION,
AXLE MASS AND INERTIA, INITIAL WHEEL ORIENTATION, AXLE KINEMATICS, AXLE
COMPLIANCE, SPRING, DAMPER, STABILIZER
Drivetrain - ENGINE, DRIVELINE, MANUAL TRANSMISSION
3.1.2. General vehicle data
The general vehicle data consist of vehicle dimensions, mass, and load, aerodynamics and brake
system. In this step vehicle dimensions such as vehicle height, wheel track front, vehicle width, wheel
track rear, wheelbase, vehicle length of the vehicle were calculated and fed into the vehicle dimension
section and then in the mass and load section, the mass of the vehicle is given which further displays
the vehicle centre of gravity (COG). In the brake system of the vehicle, brake pressure was evenly
distributed as 50% in the front and 50% in the rear and for the aerodynamic properties, the assumption
was made by the software on its own without the side wind force acting on the vehicle.
Figure 18. Specification of vehicle dimension

37
Figure 19. Vehicle mass and load
Front axle
The front axle system in the veDYNA consists of several components such as a tyre, brake, steering,
axle mass and inertia, initial wheel orientation, axle kinematics, axle compliance, spring, damper and
anti-roll bar.
The front tyre is chosen according to European norm ECE R 30, front brake friction coefficient as
0.35, steering as parallel steering and for axle mass and inertia, initial wheel orientation, axle
kinematics, axle compliance, spring, damper, stabilizer values were assumed and given automatically
by the veDYNA software.
Rear axle
The rear axle system in the veDYNA consists of several components such as tyre, brake, axle mass
and inertia, initial wheel orientation, axle mass and inertia, initial wheel orientation, axle, kinematics,
axle compliance, spring, damper, stabilizer.
The front tyre is chosen according to European norm ECE R 30, rear brake friction coefficient as
0.35, and for axle mass and inertia, initial wheel orientation, axle kinematics, axle compliance, spring,
damper and stabilizer values were assumed and given automatically by the veDYNA software.

38
Drivetrain
The drivetrain consists of an important system like the engine, driveline, manual transmission or
automatic transmission. All the values are assumed by the veDYNA software automatically and value
changes accordingly when the parameter in the simulation control is changed.
3.1.3. Determination of parameters
It consists of divisions such as maneuver, driver, road, trace and user procedure where all the
procedure for basic modelling instruction is given.
Maneuver – Longitudinal dynamics, lateral dynamics, and constraints
Driver – Driver type, driver parameters, and driver speed
Road – Road type, XY – layout, Z – profile
Trace – Trace file, trace interval
User procedure – User procedure
3.1.4. Model simulation
1. Go steerstep
In the go steer, step procedure maneuver type was changed to steer step, driver as a basic driver, road
type two lane with straight and flat, trace file as steer step and user procedure to steady-state circular
drive. For this method, two test was done by using by changing the force in front axle of the vehicle
to test the rollover situation.
Table 2. Maneuver phases go steerstep
Phase Longitudinal Dynamics Lateral Dynamics Constraints
Maneuver definition SteerStep.m SteerStep.m SteerStep.m
Find Static Position Cruise Control (0) Absolute Steering Input (0) Neutral gear
Acceleration Cruise Control (target) Fixed Steering Wheel Gears 1-5
Stabilisation Cruise Control (vtarget)
Steering wheel step Absolute steering input (δh)
Stabilisation Fixed Steering Wheel

39
Table 3. Maneuver parameters of go steerstep
Specifier Description
Change of steering wheel angle [deg] 100
Steering rate [deg/s] 300
Vehicle speed [km/h] 60
2. Go steady-state circle drive
In the circular drive, method maneuver was changed to circle drive, driver as basic, road type as two-
lane with a circle and flat, trace as circle drive and user procedure as a steady-state circular drive. For
this type of testing two tests were done, where the force in the axles was changed in the front and rear
axle. During the first test, lateral force in the front axle was increased and in the second test lateral
force in the rear was increased to test the self-steering behavior.
Table 4. Maneuver phases go steady-state circle drive
Phase Longitudinal Dynamics Lateral Dynamics Constraints
Maneuver definition Circle Drive.m Circle Drive.m Start1s.m
Find Static Position Cruise Control (0) Abs. Steering Input (0) Neutral gear
Acceleration on a
circular drive with a
constant radius
Nominal lateral
acceleration control
Control steady-state
circular run
Gears 1-5
Table 5. Maneuver parameters of go steady state circular drive
Specifier Description
The radius of the driving circle [m] 100
Maximum lateral acceleration [m/s^2] 9
Time to reach maximum acceleration [s] 200
3. Go-braking-on-musplit: braking on mu-split
In this method maneuver was changed to mu-split, driver as basic, road as straight and flat, trace as a
brake on mu-split and user procedure as go braking on mu-split. For this method test was done for
two different coefficients of friction.

40
Table 6. Maneuver phases go braking on mu-Split
Phase Longitudinal
dynamics
Lateral dynamics Constraints
Maneuver definition Brake-on-Musplit.m Brake-on-Musplit.m Brake-on-Musplit.m
Find static position Acceleration Pedal
Input (0)
Abs. Steering Input (0) Neutral gear
Acceleration Cruise Control Controlled Straight
Line Driving
Gear 1 – 7
Drive slalom course Cruise control Fixed steering wheel
Straightline driving Acceleration pedal
input
Full brake
Table 7. Maneuver parameters of go braking on mu-split
Specifier Description
Lower friction coefficient 0.1 for 1st test, 1 for the 2nd test
Vehicle velocity [km/h] 80
4. Go slalom: slalom test
In this method maneuver was changed to slalom, driver as basic, road type two-lane as straight and
flat, trace as slalom and user procedure as go slalom. For this method, three test were done for three
different vehicle types such as a car, SUV, and truck at the same speed 80 kmph.
Table 8. Maneuver phases go slalom
PHASE LONGITUDINAL
DYNAMICS
LATERAL
DYNAMICS
CONSTRAINTS
Maneuver definition Slalom.m Slalom.m Slalom.m
Find static position Basic driver Fixed steering wheel Neutral gear
Acceleration Basic driver Gear 1- 5
Drive slalom course Basic driver
Straightline driving Basic driver

41
Table 9. Maneuver parameters of go slalom
Specifier Description
Distance between cones (ds) [m] 30
Number of cones 7
Vehicle velocity [km/h] 80
Maximum lateral displacement [m] 2
5. Go double lane change: double lane change
In this method, maneuver definition was changed to circle drive for longitudinal, lateral and
constraints. The two tests were done at different speed at 80 kmph and 160 kmph, using the same
vehicle configuration. By double lane change method, the rollover rate was tested.
Table 10. Maneuver phases of go double lane change
Phase Longitudinal Dynamics Lateral Dynamics Constraints
Maneuver definition Circle Drive.m Circle Drive.m Start1s.m
Find Static Position Cruise Control (0) Abs. Steering Input (0) Neutral gear
Acceleration on a circular
drive with a constant
radius
Nominal lateral
acceleration control
Control steady-state
circular run
Gears 1-5
Table 11. Maneuver parameters of go double lane change at 80 km/h
Specifier Description
Length of 1st lane (s _1) [m] 15
The distance between 1st and 2nd lane (s_2) [m] 30
Length of 2nd lane (s_3) [m] 25
The distance between 2nd and 3rd lane (s_4) [m] 25
Length of 3rd lane (s_5) [m] 30
Overall vehicle width (b) [m] 2
Vehicle speed (km/h) 80

42
Table 12. Maneuver parameters of go double lane change 160 km/h
Specifier Description
Length of 1st lane (s _1) [m] 15
The distance between 1st and 2nd lane (s_2) [m] 30
Length of 2nd lane (s_3) [m] 25
The distance between 2nd and 3rd lane (s_4) [m] 25
Length of 3rd lane (s_5) [m] 30
Overall vehicle width (b) [m] 2
Vehicle speed (km/h) 160

43
4. Simulation results
4.1.1. Steerstep test
The roll angle becomes high when there is an increase in yaw rate of the vehicle. When the lateral
force in the front tyre was changed from 3180 N to 5000 N, the tyre loads at the inner left wheel
became zero due to the high lateral force acting on the tyre and the wheel lifts. So, increasing the
lateral force increases the lift of the wheel, which further leads to rollover at later on stage. The roll
angle is abruptly increased when the lateral acceleration force is more on the tyres.
Figure 20. Steerstep yaw rate response due to steering wheel input graph
Figure 21. Steerstep roll angle graph

44
4.1.2. Steady-state circle drive test
The generated graphs show the understeer and oversteer behavior when the force is changed on the
front axle and rear axle.
Figure 22. Steady-state circle drive yaw velocity amplification oversteer graph
Front axle more force (oversteer)
In the graph 1, yaw velocity amplification which is yaw angle over the average steering angle has
changed abruptly due to the force on the front axle. From the graph 1, we can see that velocity
amplification is above the neutral steering line. As the velocity amplification is more than the neutral
steering line, it clearly shows the oversteer characteristics of the vehicle.
Figure 23. Steady-state circle drive yaw velocity amplification understeer graph

45
Rear axle more force (understeer)
In the graph 2, the yaw velocity amplification is below the neutral steering line due to the presence
of more force on the rear axle than on the front axle. The velocity amplification is well below the
neutral steering line which shows the understeer behavior of the vehicle.
4.1.3. Braking on mu-split test
The generated graphs show the braking effect on the left and right side of the road with a different
coefficient of friction.
From the generated graph 1, it can be seen that the yaw angle of the vehicle is more when the friction
coefficient is higher on one side than on the other side. It can be seen from the graph 2, that the yaw
rate is very high when the skidding occurs, as the coefficient of friction is very less on the left side
which leads to high yaw rate.
Figure 24. Mu-split yaw angle graph
Figure 25. Mu-split yaw rate graph

46
4.1.4. Double lane change test
The generated graphs show the test results for two different speeds in a double lane change at 80
kmph and 160 kmph.
From the graphs, it is evident that the lateral acceleration of the vehicle at 160 kmph is very high
when compared to lateral acceleration at 80 kmph. High lateral acceleration force will lead to rollover
accidents.
Figure 26. Double lane change lateral acceleration graph
Figure 27. Double lance change steering wheel angle graph

47
4.1.5. Slalom test
From the generated graphs of three different vehicles at 80 kmph, it can be seen that yaw angle of the
truck is very high when compared to car and SUV. The high roll angle is due to high center of gravity,
track width and mass of the vehicle.
Figure 28. Slalom roll angle graph

48
Conclusion
The ESP working principle was studied to analyze the conditions leading to skidding, understeer,
oversteer, and rollover in the vehicle. The paradigm vehicle model was simulated by using various
testing regulations and by comparing the results of the veDYNA, it is clearly evident that high lateral
acceleration and yaw rate leads to skidding, understeer, oversteer, and rollover in the vehicle.
1. For the steady state drive, when the force was changed in the front axle oversteer clearly happens
at 40 kmph and understeer happens at 26 kmph. It is well noted that high axle force leads to
understeer and oversteer of the vehicle.
2. In the steerstep test when the force of 3180 N and 5000 N was applied in the front axle, the yaw
rate in the front axle was found be 0.34 for 3180 N and 0.36 for 5000 N.
3. Braking on the mu-split at 80 kmph for two different coefficients 0.1 and 1, it was found that yaw
rate went as low as - 0.74 for 0.1 coefficient and it was constant for the coefficient of 1.
4. For the double lane change, the steering wheel angle at 80 kmph was maximum of 100 degrees
and at 160 kmph it was found to be 700 degrees. It shows steering angle is more at higher speeds
of the vehicle.
5. In the slalom test for three different vehicles at 80 kmph, the roll angle for car and SUV was 2
degree and 3 degrees, whereas for the truck it was maximum of 6 degree which clearly shows that
heavy vehicles have high rollover rate when compared to light passenger vehicles.
6. The vehicle simulation software veDYNA used for testing can decrease the cost and reduce the
human error in vehicle testing and
7. The various conditions leading to skidding, undesteer, oversteer and rollover shows that it can be
reduced only by implementing the active safety system like ESP.

49
List of references
1. B.J.S. Van Putten, “Design of an Electronic Stability Program for Vehicle Simulation Software”,
Eindhoven University of Technology, Department of Mechanical Engineering, Eindhoven,
November 2008.
2. Shengqin Li, Le He, ‘‘Co-simulation Study of Vehicle ESP System Based on ADAMS and
MATLAB” State Key Laboratory of Automotive Safety and Energy, Tsinghua University,
Beijing 100084, China, Journal of Software, Vol. 6, No. 5, May 2011.
3. Tejas Shrikant Kinjawadekar, “Model-based Design of Electronic Stability Control System for
Passenger Cars Using CarSim and Matlab-Simulink”, The Ohio State University 2009.
4. Sohel Anwar, on “Yaw Stability Control of an Automotive Vehicle via Generalized Predictive
Algorithm”, 2005 American Control Conference June 8 - 10, 2005, Portland, OR, USA.
5. Insurance Institute for Highway Safety ‘‘Electronic Stability Programme Reducing Multiple-
Vehicle Crashes as well as Single-Vehicle”, Status Report, Vol. 41, No. 5 | June 13, 2006.
6. Federal Motor Vehicle Safety Standards ‘‘Electronic Stability Control Systems, Controls and
Displays of National Highway Traffic Safety Administration”, Department of Transportation,
Docket No. NHTSA - 200727662.
7. Maria Krafft, Anders Lie (Swedish Road Administration), Claes Tingvall (Swedish Road
Administration, Monash University Accident Research Centre), Anders Kullgren (Folksam
Research Sweden) ‘‘The Effectiveness of Esc (Electronic Stability Control) in Reducing Real
Life Crashes and Injuries” Sweden Paper number 05-0135.
8. Yiannis E.Papelis, Ginger S.Watson, Timothy L.Brown ‘‘An Empirical Study of the
Effectiveness of Electronic Stability Control System in Reducing Loss of Vehicle Control”, Pages
38 - 43 | Received 18 Mar 2005, Accepted 10 Sep 2005, Published online: 15 Aug 2006.
9. Automotive Industry Standards, AIS-133 ‘‘Electronic Stability Control Systems”, Ministry of
Road Transport and Highways (Department of Road Transport and Highways) Government of
India, March 2016.
10. Dietrich Kuhlgatz, ‘‘The Electronic Stability Program ESP - Preventing Skidding”, Bosch
Invented for Life.

50
11. Prof. Dr. Rer. Nat F. Gauterin and Dr. Ing. Martin Giessler – ‘‘Fundamentals of Automotive
Engineering”, Karlsruhe Institute of Technology, Germany.
12. D. Rubin and S. Arogeti, ‘‘Design of a Differential Braking Yaw Stability Control System”,
Department of Mechanical Engineering, Ben Gurion University of the Negev, Beer - Sheva
84105, Israel.
13. Wabco Stability Support, Roll Stability Support
http://www.meritorwabco.com/Product,2,32,2,Roll-Stability-Support-(RSS).aspx.
14. Kenneth D. Lambert, ‘‘A Study of Vehicle Properties that Influence Rollover and their Effect on
Electronic Stability Controllers”.
15. US Department of transportation, ‘‘Analysis of Benefits and Costs of Roll Stability Control
Systems for the Trucking Industry”, February 2009.
16. National Highway Traffic Safety Administration - ‘‘Statistical Analysis of the Effectiveness of
Electronic Stability Control (ESC) Systems”.
17. Charles M. Farmer, ‘‘Effects of Electronic Stability Control on Fatal Crash Risk, Insurance
Institute for Highway Safety”, Arlington VA 22201.
18. Uniform Provisions Concerning the Approval of Passenger Cars with Regard to Electronic
Stability Control (ESC) Systems, (Addendum 139 – Regulation No. 140).
19. U.S. Department of Transportation National Highway Traffic Safety Administration Laboratory
Test Procedure for FMVSS 126, Electronic Stability Control Systems.
20. European Commission, Mobility and Road Transport - Road Safety - Electronic Stability Control.
21. United Nations, Latest Development in Vehicle Regulations - Economic and Social Council,
ECE/TRANS/2017/10, 13 December 2016.
22. veDYNA GmbH https://www.tesis-dynaware.com/en/products/vedyna/overview.html.
23. VEHICO GmbH – Double Lane Change Test
http://www.vehico.com/index.php/en/applications/iso-lane-change-test.
24. Kristoffer Lundahl, Jan Aslund, and Lars Nielsen - Vehicle Dynamics Platform, Experiments,
and Modelling Aiming at Critical Maneuver Handling, Division of Vehicular Systems,
Department of Electrical Engineering Linkoping University, SE-581 33 Linkoping, Sweden, June
18, 2013.

51
25. Kiyotaka Kawashima, Toshiyuki Uchida, Rolling Stability Control Based on ‘‘Electronic
Stability Program for In-Wheel-Motor Electric Vehicle”, Yoichi Hori University of Tokyo,
Tokyo, Japan, 27 March 2009.
26. B.A. Güvenç, L. Güvenç, and S. Karaman, “Robust Yaw Stability Controller Design and
Hardware - in - the Loop Testing for a Road Vehicle”, IEEE Transactions on Vehicular
Technology, Vol. 58, NO. 2, (2009).
27. William F. Milliken and Douglas L. Milliken, “Race Car Vehicle Dynamics”.
28. R. Rajamani, “Vehicle Dynamics and Control”, Springer (2006).
29. Naser Elmi, Abdolreza Ohadi, and Behzad Samadi, ‘‘Active Front-Steering Control of a Sports
Utility Vehicle using a Robust Linear Quadratic Regulator Method”, with Emphasis on the Roll
Dynamics.
30. Reza N. Jazar, ‘‘Vehicle Dynamics Theory, and Application”, Dept. of Mechanical Engineering
Manhattan College Riverdale, NY - 10471.
31. Anders Karlsson, ‘‘Test Procedures and Evaluation Tools for Passenger Vehicle Dynamics,
Chalmers University of Technology Goteborg, Sweden 2014.
32. Kiumars Jalali, Thomas Uchida, John McPhee, Steve Lambert, ‘‘Development of an Advanced
Fuzzy Active Steering Controller and a Novel Method to Tune the Fuzzy Controller”, SAE
International Journal of Passenger Cars - Electronic and Electrical Systems, April 2013.
33. Bosch invented for life https://www.bosch.com/.
34. Euro NCAP https://www.euroncap.com/en/vehicle-safety/the-ratings-explained/safety-
assist/esc/.
35. Performance drive http://performancedrive.com.au/lamborghini-gallardo-spyder-rolled-
mechanic-test-drive-0103/#! .

52
Appendices
Appendix 1
Table 13. The specifications of the Lamborghini Aventador LP 700 – 4
1. VEHICLE DIMENSIONS
VEHICLE LENGTH 4.78 m
WHEEL BASE 2.7 m
VEHICLE WIDTH 2.02 m
WHEEL TRACK FRONT 1.72 m
VEHICLE HEIGHT 1.136 m
WHEEL TRACK REAR 1.7 m
2. MASS AND LOAD
VEHICLE CENTRE OF GRAVITY (COG)
X -1.35 m
Y 0 m
Z 0.25 m
VEHICLE MASS 1731 kg
INERTIA MATRIX AT CENTRE OF
GRAVITY
X 581.064 [kgm^2]
Y 2611.53 [kgm^2]
Z 2834.98 [kgm^2]
3. FRONT AXLE (TYRE DESCRIPTION
ACCORDING TO EUROPEAN NORM
ECE R 30)
TYRE WIDTH 205 mm
RATIO OF TYRE HEIGHT TO TYRE WIDTH
[×100]
60
TYPE OF TYRE R
TYRE RIM DIAMETER 13 inch
LOAD INDEX 88
TYRE SPEED SYMBOL V = 240 km/h

53
4. REAR AXLE (TYRE DESCRIPTION
ACCORDING TO EUROPEAN NORM
ECE R 30)
TYRE WIDTH 225
RATIO OF TYRE HEIGHT TO TYRE WIDTH
[×100]
50
TYPE OF TYRE R
TYRE RIM DIAMETER 16
LOAD INDEX 88
TYRE SPEED SYMBOL H = 210 km/h
5. DRIVETRAIN – GENERAL
TRANSMISSION TYPE MANUAL
DRIVETRAIN – ENGINE TORQUE
CHARACTERISTICS
MAXIMUM ENGINE SPEED 7500 rpm
ENGINE SPEED AT MAXIMUM ENGINE
POWER
7000 rpm
ENGINE SPEED AT MAXIMUM ENGINE
TORQUE
6000 rpm
ENGINE IDLE SPEED 833 rpm
ENGINE TORQUE AT 1.2 * IDLE SPEED 232.9 Nm
MAXIMUM ENGINE TORQUE 292.1 Nm
ENGINE TORQUE MAXIMUM POWER 263.2 Nm
FRICTION TORQUE AT 1.2 * IDLE SPEED - 27.8 Nm
FRICTION TORQUE AT MAXIMUM
ENGINE SPEED
- 45.8 Nm
INERTIA OF FLYWHEEL 0.211 [kgm^2]
TORQUE DELAY 0.05 s
SCALING FACTOR 1

54
Appendix 2
Vehicle configuration
Figure 29. Vehicle brake system
Figure 30. Vehicle aerodynamics

55
Figure 31. Front axle - general
Figure 32. Front axle - tyre description

56
Figure 33. Front axle - brake parameters
Figure 34. Front axle - steering

57
Figure 35. Front axle - mass and inertia
Figure 36. Front axle - initial wheel orientation

58
Figure 37. Front axle - kinematic tables
Figure 38. Front axle - compliance

59
Figure 39. Front axle - spring characteristics
Figure 40. Front axle - damper

60
Figure 41. Front axle - anti-roll bar
Figure 42. Rear axle - general

61
Figure 43. Rear axle - tyre description
Figure 44. Rear axle - damper

62
Figure 45. Rear axle - spring characteristics
Figure 46. Rear axle - compliance

63
Figure 47. Rear axle - kinematic tables
Figure 48. Rear axle - initial wheel orientation

64
Figure 49. Rear axle - mass and inertia
Figure 50. Rear axle - brake parameters

65
Figure 51. Rear axle - anti-roll bar
Figure 52. Drivetrain - engine - transmission - manual

66
Figure 53. Drivetrain - engine torque characteristics
Figure 54. Steerstep - simulation control

67
Figure 55. Steerstep - user procedure
Figure 56. Steerstep - front axle force 3180 N

68
Figure 57. Steerstep - front axle force 5000 N
Figure 58. Circle drive - simulation control

69
Figure 59. Circle drive - user procedure
Figure 60. Circle drive - front axle more force (oversteer)

70
Figure 61. Circle drive - rear axle more force (understeer)
Figure 62. Double lane change - simulation control

71
Figure 63. Double lane change 80 km/h - user Procedure
Figure 64. Double lane change 160 km/h - user procedure

72
Figure 65. Slalom - simulation control
Figure 66. Slalom - user procedure

73
Figure 67. Mu-split - simulation control
Figure 68. Mu-split - user procedure

74
Appendix 3
Graphs
Figure 69. Front tyre characteristics graph
Figure 70. Rear tyre characteristics graph

75
Figure 71. Steerstep yaw rate graph
Figure 72. Steerstep yaw angle graph

76
Figure 73. Steerstep tyre loads graph
Figure 74. Steerstep steering wheel angle graph

77
Figure 75. Steerstep spring deflection graph
Figure 76. Steerstep sideslip angle graph

78
Figure 77. Steerstep lateral tyre force graph
Figure 78. Steerstep lateral acceleration graph

79
Figure 79. Steerstep pitch angle graph
Figure 80. Steerstep spring deflections graph

80
Figure 81. Mu-split vehicle speed graph
Figure 82. Mu-split vehicle acceleration graph

81
Figure 83. Mu-split steering wheel angle graph
Figure 84. Mu-split lateral acceleration graph

82
Figure 85. Double lane change yaw angle graph
Figure 86. Double lane change vehicle velocity graph

83
Figure 87. Double lane change sideslip angle graph
Figure 88. Double lane change roll angle graph

84
Figure 89. Double lane change yaw rate graph
Figure 90. Slalom yaw rate graph

85
Figure 91. Slalom yaw angle graph
Figure 92. Slalom velocity graph

86
Figure 93. Slalom steering wheel angle graph
Figure 94. Slalom sideslip angle graph

87
Figure 95. Slalom lateral acceleration graph
Figure 96. Slalom current gear and position of the clutch graph

88
Figure 97. Slalom engine speed and acceleration pedal position graph

89
Appendix 4
Matlab
1. Vedyna chassis initial output car
=================================I==========I==========I==========I=====
=====I==========I==========I==========I==========I==========I==========I
I Mass I x I y I z I Txx I Tyy I Tzz I Txy I Txz I
Tyz I
I [kg] I [m] I [m] I [m] I [kgm^2] I [kgm^2] I [kgm^2] I [kgm^2]
I [kgm^2] I [kgm^2] I
=================================I==========I==========I==========I=====
=====I==========I==========I==========I==========I==========I==========I
Vehicle Body I 1531.000 I -1.350 I 0.000 I 0.283 I 415.938 I 2227.295 I 2319.490 I 0.000
I 0.000 I 0.000 I
Unsprung Front Left I 50.000 I -0.000 I 0.860 I 0.000 I 1.200 I 1.400 I 1.200 I
0.000 I 0.000 I 0.000 I
Unsprung Front Right I 50.000 I -0.000 I -0.860 I 0.000 I 1.200 I 1.400 I 1.200 I -
0.000 I 0.000 I -0.000I
Unsprung Rear Left I 50.000 I -2.700 I 0.850 I 0.000 I 1.200 I 1.400 I 1.200 I 0.000
I 0.000 I 0.000 I
Unsprung Rear Right I 50.000 I -2.700 I -0.850 I 0.000 I 1.200 I 1.400 I 1.200 I -
0.000 I 0.000 I -0.000 I
=================================I==========I==========I==========I=====
=====I==========I==========I==========I==========I==========I==========I
Total I 1731.000 I -1.350 I 0.000 I 0.250 I 581.064 I 2611.527 I 2834.982 I 0.000 I -
0.000 I 0.000 I
=================================I==========I==========I==========I=====
=====I==========I==========I==========I==========I==========I==========I
Wheel base front to rear axle : 2.700 m
Wheel track front : 1.720 m
Wheel track(s) rear : 1.700 m 1.700 m
Tyre radius front : 0.288 m
Tyre radius rear : 0.315 m
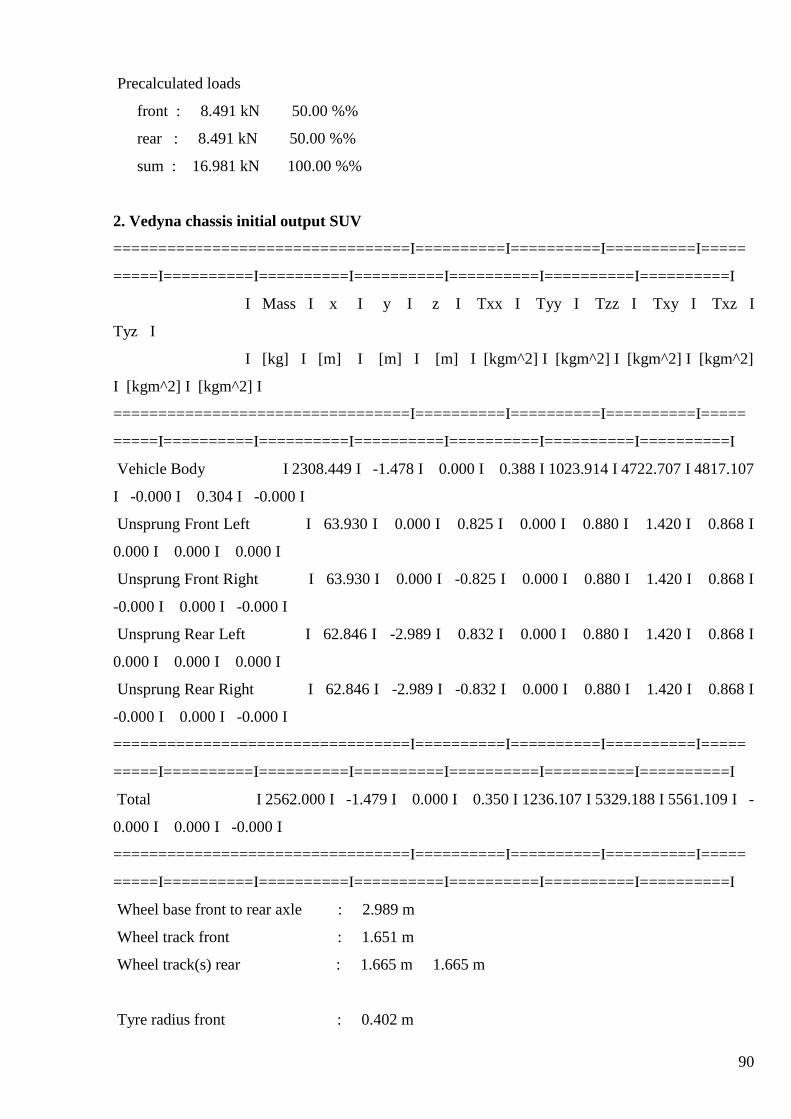
90
Precalculated loads
front : 8.491 kN 50.00 %%
rear : 8.491 kN 50.00 %%
sum : 16.981 kN 100.00 %%
2. Vedyna chassis initial output SUV
=================================I==========I==========I==========I=====
=====I==========I==========I==========I==========I==========I==========I
I Mass I x I y I z I Txx I Tyy I Tzz I Txy I Txz I
Tyz I
I [kg] I [m] I [m] I [m] I [kgm^2] I [kgm^2] I [kgm^2] I [kgm^2]
I [kgm^2] I [kgm^2] I
=================================I==========I==========I==========I=====
=====I==========I==========I==========I==========I==========I==========I
Vehicle Body I 2308.449 I -1.478 I 0.000 I 0.388 I 1023.914 I 4722.707 I 4817.107
I -0.000 I 0.304 I -0.000 I
Unsprung Front Left I 63.930 I 0.000 I 0.825 I 0.000 I 0.880 I 1.420 I 0.868 I
0.000 I 0.000 I 0.000 I
Unsprung Front Right I 63.930 I 0.000 I -0.825 I 0.000 I 0.880 I 1.420 I 0.868 I
-0.000 I 0.000 I -0.000 I
Unsprung Rear Left I 62.846 I -2.989 I 0.832 I 0.000 I 0.880 I 1.420 I 0.868 I
0.000 I 0.000 I 0.000 I
Unsprung Rear Right I 62.846 I -2.989 I -0.832 I 0.000 I 0.880 I 1.420 I 0.868 I
-0.000 I 0.000 I -0.000 I
=================================I==========I==========I==========I=====
=====I==========I==========I==========I==========I==========I==========I
Total I 2562.000 I -1.479 I 0.000 I 0.350 I 1236.107 I 5329.188 I 5561.109 I -
0.000 I 0.000 I -0.000 I
=================================I==========I==========I==========I=====
=====I==========I==========I==========I==========I==========I==========I
Wheel base front to rear axle : 2.989 m
Wheel track front : 1.651 m
Wheel track(s) rear : 1.665 m 1.665 m
Tyre radius front : 0.402 m

91
Tyre radius rear : 0.402 m
Precalculated loads
front : 12.700 kN 50.53 %%
rear : 12.433 kN 49.47 %%
sum : 25.133 kN 100.00 %%
3. Vedyna chassis initial output truck
=================================I==========I==========I==========I=====
=====I==========I==========I==========I==========I==========I==========I
I Mass I x I y I z I Txx I Tyy I Tzz I Txy I Txz I
Tyz I
I [kg] I [m] I [m] I [m] I [kgm^2] I [kgm^2] I [kgm^2] I [kgm^2]
I [kgm^2] I [kgm^2] I
=================================I==========I==========I==========I=====
=====I==========I==========I==========I==========I==========I==========I
Vehicle Body I 8070.000 I -1.505 I 0.000 I 1.001 I299677.186 I103251.739
I102960.353 I 0.000 I 302.816 I -0.000 I
Unsprung Front Left I 190.000 I 0.000 I 1.100 I 0.000 I 30.000 I 15.000 I 32.000 I
0.000 I 0.000 I 0.000 I
Unsprung Front Right I 190.000 I 0.000 I -1.100 I 0.000 I 30.000 I 15.000 I 32.000
I -0.000 I 0.000 I -0.000 I
Unsprung Rear Left I 190.000 I -3.880 I 1.100 I 0.000 I 30.000 I 15.000 I 32.000 I
0.000 I 0.000 I 0.000 I
Unsprung Rear Right I 190.000 I -3.880 I -1.100 I 0.000 I 30.000 I 15.000 I 32.000
I -0.000 I 0.000 I -0.000 I
=================================I==========I==========I==========I=====
=====I==========I==========I==========I==========I==========I==========I
Total I 8830.000 I -1.542 I 0.000 I 0.915 I301413.000 I107000.000 I107000.000
I 0.000 I 0.000 I -0.000 I
=================================I==========I==========I==========I=====
=====I==========I==========I==========I==========I==========I==========I
Wheel base front to rear axle : 3.880 m
Wheel track front : 2.200 m
Wheel track(s) rear : 2.200 m 2.200 m

92
Tyre radius front : 0.517 m
Tyre radius rear : 0.524 m
Precalculated loads
front : 52.196 kN 60.26 %%
rear : 34.426 kN 39.74 %%
sum : 86.622 kN 100.00 %%
4. Go steerstep
Evaluation of response at speed = 60.0 km/h
0.9 steady yaw rate at T = 0.38 sec
First max. of yaw rate at T = 0.55 sec
Ratio max. yaw rate / steady yaw rate = 1.024
TB value = 0.123 s*deg
5. Go steadystate circle drive
Front axle
Sideslip angle crosses zero at v = 59 [km/h]
Yaw velocity amplification gradient of neutral steering model = 0.318298 [1/s]
Characteristic speed = 108 [km/h]
Lateral acceleration gradient of neutral steering model = 0.004362 [rad*s^2/m]
Rear axle
Sideslip angle crosses zero at v = 59 [km/h]
Yaw velocity amplification gradient of neutral steering model = 0.319435 [1/s]
Characteristic speed = 72 [km/h]
Lateral acceleration gradient of neutral steering model = 0.004400 [rad*s^2/m]
6. Go slalom
Slalom test 80 kmph - drive through time is 8.105714s
Slalom test SUV 80 kmph - drive through time is 8.103946s
Slalom test truck 80 kmph - drive through time is -16.840000s