study of the relationship between retention...
TRANSCRIPT
Group 14
STUDY OF THE RELATIONSHIP BETWEEN
RETENTION STRATEGIES AND JOB
PERFORMANCE IN MALAYSIA BANKING
INDUSTRY
BY
CHUA BING LUEN
NG PEI SHI
TAN CHIU YEN
TEOH YUN ZHEN
WONG SIOK CHING
A research project submitted in partial fulfillment of the
requirement for the degree of
BACHELOR OF BUSINESS ADMINISTRATION
(HONS)
UNIVERSITI TUNKU ABDUL RAHMAN
FACULTY OF BUSINESS AND FINANCE
DEPARTMENT OF BUSINESS
AUGUST 2013

ii
Copyright @ 2013
ALL RIGHTS RESERVED. No part of this paper may be reproduced, stored in a
retrieval system, or transmitted in any form or by any means, graphic, electronic,
mechanical, photocopying, recording, scanning, or otherwise, without the prior
consent of the authors.

iii
DECLARATION
We hereby declare that:
(1) This undergraduate research project is the end result of our own work and
that due acknowledgement has been given in the references to ALL
sources of information be they printed, electronic, or personal.
(2) No portion of this research project has been submitted in support of any
application for any other degree or qualification of this or any other
university, or other institutes of learning.
(3) Equal contribution has been made by each group member in completing
the research project.
(4) The word count of this research report is 20,217.
Name of Student: Student ID: Signature:
1. Chua Bing Luen 09ABB02823 ________________
2. Ng Pei Shi 11ABB00258 ________________
3. Tan Chiu Yen 11ABB00189 ________________
4. Teoh Yun Zhen 10ABB00718 ________________
5. Wong Siok Ching 11ABB00158 ________________
Date: 15 August 2013

iv
ACKNOWLEDGEMENT
We hereby from the Faculty of Business and Finance (FBF) students would like to
acknowledge the contribution of number of people. Although it would be virtually
impossible to list each people who assisted in this research, certain people must be
credited because of their magnitude of their contribution and sacrificed their
precious time in assisting both the ideas and guideline in the development of this
research project. First of all, we would like to thank UTAR. UTAR gives us a
chance to participate in this thesis. Besides that, UTAR facilities such as library
and internet lab provide us a convenience in completing our thesis.
We extend a special thank you to Pn Che Natheera Banu Binti Syed Abdul Aziz,
who is supervisor for our thesis. She is a patience, experience, and kind supervisor.
She is willing to spend her time to assist and help us by providing useful
information and knowledge. We are grateful for encouragement, suggestion and
counseling provider by Pn Che Natheera Banu Binti Syed Abdul Aziz. Her unique
way of encouraging us with research opportunities and praise has benefited us
greatly.
At the same time, we also grateful to entire members that give full collaboration
and involvement to complete this research project. However, without the
supportive and guidance of all these people, we would not able to complete this
research on time. Thus, we are sincerely appreciated to those people in helping us
to completing this research project.

v
DEDICATION
Firstly, we actually dedicate our success to our lovely parents who support us as
always. They give us a chance to extend our study at Universiti Tunku Abdul
Rahman (UTAR). They also provide us with mental supports and financial backup
whenever we need.
Besides, we would like to show our appreciation to our honorable supervisor, Ms
Che Natheera Banu Binti Syed Abdul Aziz, who provides us supremacy guidance,
recommendations and motivation to help in our research.
Lastly, we are dedicated for the respects, understanding, cooperation and
motivation given by the members among ourselves, nevertheless our course mate
and friends. It is with great pleasure that we have all supporting hands throughout
this research process.

vi
TABLE OF CONTENTS
Page
Copyright Page.……………………………...………………………...…………. ii
Declaration……………………………………………………………...……...... iii
Acknowledgement…………………………………………………………...…... iv
Dedication...……………………………………………...………………..……... v
Table of Contents………………...………………………................................. vi-x
List of Tables...………………………………………………...…………...……. xi
List of Figures………………………...…………………...………………..…... xii
List of Appendices…………………...…………………...………………..…... xiii
List of Abbreviations……………………...…………...……………………...... xiv
Preface..………………………………………...……………………………...... xv
Abstract…...………………………………...……………………………..….... xvi
CHAPTER 1 INTRODUCTION ………………………………………...1
1.0 Introduction …………………………………………….....1
1.1 Research Background ……………………………………..1
1.2 Problem Statement ………………………………………..3
1.3 Research Objectives ………………………………………4
1.3.1 General Objective …………………………………4
1.3.2 Specific Objectives ………………………………..5
1.4 Research Questions ……………………………………….5
1.5 Hypotheses of the Study …………………….………..…...6
1.6 Significant of Research …………………………………...6
1.7 Chapter Layout ………………………………………...….7
1.8 Conclusion ……………………………………………..….8
CHAPTER 2 LITERATURE REVIEW ……………………………...….9
2.0 Introduction …………………………………………...…..9
2.1 Review of Literature …………………………………..…..9

vii
2.1.1 Job Performance….............................................….9
2.1.2 Training………………………………………..…11
2.1.3 Career Development……………………………...12
2.1.4 Working Environment…………………………....13
2.1.5 Reward Systems……………………………….…15
2.1.6 Fair Treatment……………………………………18
2.2 Review of Relevant Theoretical Models…………………21
2.3 Proposed Theoretical Framework………………………..26
2.4 Hypotheses Development…………………………….…..27
2.4.1 Training……………………………………….….27
2.4.2 Career Development…………………………..….28
2.4.3 Working Environment…………………………....29
2.4.4 Reward Systems………………………………….30
2.4.5 Fair Treatment…………………………………....31
2.5 Conclusion…………………………………………….…32
CHAPTER 3 RESEARCH METHODOLOGY.......................................33
3.0 Introduction …………………………………………..….33
3.1 Research Design……………………………………….....33
3.2 Data Collection Methods ………………………………...34
3.2.1 Primary Data ………………………………….…35
3.2.2 Secondary Data ……………………………….…35
3.3 Sampling Design ………………………………………...36
3.3.1 Target Population ……………………………..…36
3.3.2 Sampling Frame and Sampling Location ……..…37
3.3.3 Sampling Elements…………………………….…37
3.3.4 Sampling Technique …………………………..…37
3.3.5 Sampling Size …………………………………....38
3.4 Research Instruments ………………………………...….39
3.4.1 Distribution Methods………………………….…39
3.4.2 Questionnaire Design………………………...…..40
3.4.3 Pilot Test………………………………...……….40

viii
3.5 Constructs Measurement …………………………….......42
3.5.1 Nominal Scale…………………………………....42
3.5.2 Ordinal Scale…………………………………..…42
3.5.3 Interval Scale………………………….………….43
3.5.4 Ratio Scale…………………………..……………44
3.5.5 Summary of Questionnaire……….………………...44
3.6 Data Processing ……………………………...…………..45
3.6.1 Questionnaire Checking……………………….....45
3.6.2 Data Editing………………………………………45
3.6.3 Data Coding………………………...…………….45
3.6.4 Data Transcribing………………………….….….46
3.6.5 Data Cleaning………………………….…………46
3.7 Data Analysis …………………………………..………..47
3.7.1 Descriptive Analysis …………………...……......47
3.7.2 Scale Measurement……………………...……….47
3.7.3 Inferential Analysis …………………………..….48
3.7.3.1 Pearson Correlation Coefficient
Analysis…………………………..49
3.7.3.2 Multiple Regressions Analysis.......50
3.8 Conclusion …………………………………………….…50
CHAPTER 4 RESEARCH RESULTS ………………………...……….51
4.0 Introduction ……………………………………….……..51
4.1 Descriptive Analysis ……………………………….……51
4.1.1 Respondents Demographic Profile ………...……51
4.1.1.1 Gender…………………………....52
4.1.1.2 Age…………………………….…53
4.1.1.3 Education Level…………….….....54
4.1.1.4 Working Duration………………..55
4.1.1.5 Income Level…………………..…56
4.1.2 Central Tendencies Measurement of
Constructs ……………………………………..…58
ix
4.2 Scale Measurement ……………………………..……….65
4.2.1 Reliability Test………………………………...…65
4.3 Inferential Analyses ………………………………….......66
4.3.1 Pearson Correlation Coefficient Analysis ……….66
4.3.1.1 Training and Job Performance…...67
4.3.1.2 Career Development and Job
Performance……………………...67
4.3.1.3 Working Environment and Job
Performance……………………...68
4.3.1.4 Reward Systems and Job
Performance...................................69
4.3.1.5 Fair Treatment and Job
Performance……………………...70
4.3.2 Multiple Regression Analysis …………………...71
4.4 Conclusion ……………………………………………….73
CHAPTER 5 DISCUSSION AND CONCLUSION ……………...……74
5.0 Introduction………………………………………………74
5.1 Summary of Statistical Analysis…………………..……..74
5.1.1 Descriptive Analysis………………………..……74
5.1.2 Scale Measurement………………………………75
5.1.3 Inferential Analysis………………………………75
5.1.3.1 Pearson Correlation Coefficient……….75
5.1.3.2 Multiple Regression Analysis…………76
5.2 Discussion of Major Findings……………………………77
5.2.1 Relationship between Training and Employees’
Job Performance……………………………….…77
5.2.2 Relationship between Career Development and
Employees’ Job Performance………………….…78
5.2.3 Relationship between Working Environment and
Employees’ Job Performance……………….……79
5.2.4 Relationship between Reward Systems and
Employees’ Job Performance………………….…80
x
5.2.5 Relationship between Fair Treatment and
Employees’ Job Performance………………….....82
5.3 Implications of the Study…………………………….......83
5.3.1 Managerial Implications……………………….....83
5.4 Limitations of the Study……………………………….....84
5.5 Recommendations for Future Research…………….…....86
5.6 Conclusion……………………………………………......87
References………………………………………………………………….…….89
Appendices……………………………………………………………………….98
xi
LIST OF TABLES
Page
Table 3.1: Cronbach‘s Alpha Reliability Analysis 41
Table 3.2: Summary of the Questionnaire 44
Table 3.3: Cronbach’s Alpha Coefficient 48
Table 3.4: Pearson Correlation Coefficient 49
Table 4.1: Gender 52
Table 4.2: Age 53
Table 4.3: Education Level 54
Table 4.4: Working Duration 55
Table 4.5: Monthly Income Level 56
Table 4.6 Descriptive Statistics of Job Performance 58
Table 4.7: Descriptive Statistics of Training 59
Table 4.8: Descriptive Statistics of Career Development 60
Table 4.9: Descriptive Statistics of Working Environment 61
Table 4.10: Descriptive Statistics of Reward Systems 62
Table 4.11: Descriptive Statistics of Fair Treatment 64
Table 4.12: Reliability Statistics 65
Table 4.13: Correlation between Training and Job Performance 67
Table 4.14: Correlation between Career Development and Job Performance 68
Table 4.15: Correlation between Working Environment and Job
Performance
68
Table 4.16: Correlation between Reward Systems and Job Performance 69
Table 4.17: Correlation between Fair Treatment and Job Performance 70
Table 4.18: Model Summary 71
Table 4.19: Analysis of Variance 71
Table 4.20: Parameter Estimates 72

xii
LIST OF FIGURES
Page
Figure 2.1: The Relationship between Training and Job Performance 21
Figure 2.2: The Relationship between Employee Development and Job
Performance
22
Figure 2.3: Economic Effects of Inculcation of Employees’ Safety Culture
at the Company Level
23
Figure 2.4: The Relationship between Reward Systems and Employee’s
Performance
24
Figure 2.5: The Relationship between Organisational Justice and
Organisational Performance
25
Figure 2.6: Model of Proposed Theoretical Framework 26
Figure 4.1: Distribution of Gender 52
Figure 4.2: Distribution of Age 53
Figure 4.3: Distribution of Education Level 54
Figure 4.4: Distribution of Working Duration 56
Figure 4.5: Distribution of Income Level 57

xiii
LIST OF APPENDICES
Page
Appendix A: Certificate Letter from UTAR to Conduct Survey……………...…98
Appendix B: Survey Questionnaire…………………………………….…..........99
Appendix C: Survey Results Generated by SAS Enterprise Guide 5.1…...........105
xiv
LIST OF ABBREVIATIONS
CD Career Development
F Fair Treatment
H Hypothesis
JB Job Performance
RW Reward System
SAS Statistical Analysis System
T Training
WE Working Environment
xv
PREFACE
The research study that is conducted by our group is basically a part of the
requirement by our degree course. It is mandatory for us to conduct this research
study to complete our course Bachelor of Business Administration (Hons). Our
research study topic is ― a study of the relationship between retention strategies
and job performance in Malaysia banking industry. The research study that will be
conducted could probably prove vital in the field of banking industry.
The main reason we choose banking industry as our area is because we would like
to investigation Malaysian Banking nowadays. Furthermore, previous researchers
at Universiti Tunku Abdul Rahman (UTAR) did not focus on the factors that
affect the banking industry. Meanwhile, in our research study, we have covered a
wider scope since we were looking at banking industry as well as the job
performance of the staffs.
In this research study, we outline five important variables that influence towards
the job performance. The variables included training, career development,
working environment, reward systems and fair treatment. These five variables
play important roles in determining the possible factors that might influence the
job performance in Malaysia banking industry.
xvi
ABSTRACT
Job changing has been one of the major issues to organization in terms of
productivity and long-term plan. The turnover rate gives an impact on the
effectiveness and job performance of an organization. However, there are not
much research been done for this specific area. This study is designed to
investigate the relationship between retention strategies and job performance in
Malaysia banking industry. At the same time, the study is also aimed to examine
the relationship between job performance and factors such as training, career
development, working environment, reward systems, and fair treatment. Generally,
this study is sought to achieve the following: (1) to determine the job performance
of employees in banking industry; (2) to discuss the factors that affect the turnover
in banking industry; (3) to examine the relationship between retention strategies
and job performance. The data is collected from secondary sources and 300 sets of
survey questionnaires have been distributed. Statistical Analysis System (SAS)
Enterprise Guide 5.1 is used to conduct new findings on the relationship between
retention strategies and job performance in Malaysia banking industry.
Retention Strategies and Job Performance
Page 1 of 114
CHAPTER 1: INTRODUCTION
1.0 Introduction
The research proposal in this chapter provides a comprehensive background to
focus on the study the research topic that has been selected. More specific, this
research proposal seeks to a study of the relationship between retention strategies
and job performance in Malaysia banking industry. As overall, this chapter will
cover the problem statement that the research topic has been selected. Then,
follow by research objectives, research questions, hypotheses of the study and
significance of the study for this research. Finally end with the chapter layout.
1.1 Research Background
Nowadays, our world is approaching to a world without border because of rapid
improvement and transformation in the way of connecting people and sharing
information. However, these advantages create a competitive medium among the
organizations and talented employee’s retention has become the top priority of the
organization in order to survive in their field.
Retention is defined as “the ability to hold onto those employees you want to
keep, for longer than your competitors” (Johnson, 2000). Employee retention
become so much important in an organization as a consequence of the rapid
economic growth, high employee turnover and also lack of skilled labour in the
particular field. According to the framework done by Yukon Government (2010),
create an awareness of the employee retention is a major vital issue and far more
important than hiring an employee. An organization with high employee turnover
need to expect the lost of customers and business, and also the price of damaged
morale. Other than that, an organization with high employee turnover always
need to start all over again in screening, verifying credentials and references,
interviewing, hiring and training a new employee in order to compensate the lost.
Retention Strategies and Job Performance
Page 2 of 114
Right retention strategies made possible for the organizations to survive and grow
in the market (Gberevbie, 2010).
Yukon Government (2010) found out that high pay and employee welfare that
offer by an organization can attract and retain their employees to continue work
with the organization. Besides, work-life balance, employee’s health and safety,
flexible arrangements of work, recognition, wellness programs, workplace
diversity, employee career development, and engagement are some examples of
approaches that can become a part of the mix while developing retention
strategies. Gberevbie (2010) also shared some common opinions with Yukon
Government (2010) and stated that job satisfaction arising from reward systems,
performance pay, offer training to employee, career development, high level of
wage rate, empowerment in decision making and creation of social community in
the workplace that can actually improve social ties such as organization’s image,
job security, sharing of information, encouraging marriage between the employee
and also offer the jobs to the sibling can be serve as the part of the employee
retention strategies and all these strategies will affect the performance of the
organization.
Lau and Sholihin (2005) explain that the level of trust of the employees toward
their supervisors is so much important and is the parity of their organizations’
performance appraisal procedures. Other than that, Campion (1988) mentioned
that inescapable turnover was danger to an organization. Most of the researchers
supported that turnover reduces the organizational performance. Job performance
will be interrupted when employees are intended to leave an organization and this
will cause the organization less efficient and effective. Thus, employee retention
is so much essential for an organization.
Nowadays, banking industry play an important role in the commercial market.
Since Asian economic crisis, Malaysia’s banking scenario has changed drastically
in order to adapt to the world with rapid change. There is high turnover rate in
banking industry, and this will affect the efficiency and effectiveness of the
organization and finally will result in the poor performance of employee as well as
the accomplishment of predetermined organizational goals. The employees of the

Retention Strategies and Job Performance
Page 3 of 114
bank sectors may have the fear and worry towards the changes in working
environment, organization management and organizational culture. Thus, it is
very important that employees must be attached physically to their banks.
Banking industry is a service based industry; hence, employee’s performance has
the direct impact on the organization if the employee can offer good services
which satisfy the customers especially in this competitive market.
1.2 Problem Statement
Employee retention in banking industry is one of the largest struggles that
managers face currently. Financial institutions have been working hard to develop
and preserve gains as the financial markets keep on growing. Meanwhile,
financial institutions are also adapting the fluctuated regulations and the slump
effects on implementation. Today’s challenge would be the enhancement of
performance (Samsung, 2009). It is shown when financial institutions have
expanded insurance, mutual funds, and trading products into their services.
Therefore, staff is becoming significantly important to involve in those daily
operation mentioned. These major challenges affect the level of customer
satisfaction which ultimately impacts profits.
The specific problem is that few research efforts have addressed the high turnover
rates of employees in the banking industry, a problem that has plagued the
industry for a long time and that has resulted in high replacement and training
costs (Boushey & Glynn, 2012). Employee turnover has its good and bad. Some
industries might expect for a high level of turnover rate to be happened and the
replacement costs are mostly considered. However, a high level of employee
turnover rate costs a lot. The cost of replacement might range from 100% to 150%
of an individual’s base salary (Nelson & McCann, 2009). Those cost included
separation costs, and replacement costs in addition to training and development.
Some businesses depend on the longevity of employees in order to thrive, keep
costs down and succeed. The excessive turnover rates have caused the increase of

Retention Strategies and Job Performance
Page 4 of 114
costs and eventually affect the profitability of an organization (Harris, 2009).
Moreover, according to May (2013), high turnover rate might cause the morality
of employees become low as they follow their colleagues doing the same thing.
Nevertheless, for those who choose to stay, they tend to become more stressful as
they need to substitute the gaps until new recruit is hired.
The current study involved a bunch of retention strategies aimed at improving
short-term and long-term retention. The research method for the study was
quantitative analysis. The general population examined was the employees of
major banking institutions operating in Malaysia.
Turnover can cause negative impacts to a firm’s performance in accordance to
certain circumstances. Gregory (2008) has stated that the knowledge of employees
is a considerable asset for a company to possess. Everyone has something
valuable to be added to an organization. An employer that experiences much
turnover is going to see that valuable knowledge deviate for nothing (Goessl,
2009). Therefore, the relationship between job performance and turnover rate is
negative. An organization’s performance is strong when the turnover rate is
relatively low (Shaw, Gupta, & Delery, 2005).
Hence, we are going to conduct this research to study the relationship between
several types of retention strategies and job performance in Malaysia banking
industry.
1.3 Research Objectives
1.3.1 General Objective
Exactly, the main objective of this study is to study of the relationship
between retention strategies and job performance in Malaysia banking
industry.
Retention Strategies and Job Performance
Page 5 of 114
1.3.2 Specific Objectives
(1) To examine the relationship between training and job performance in
Malaysia banking industry.
(2) To examine the relationship between career development and job
performance in Malaysia banking industry.
(3) To examine the relationship between working environment and job
performance in Malaysia banking industry.
(4) To examine the relationship between reward systems and job
performance in Malaysia banking industry.
(5) To examine the relationship between fair treatment and job performance
in Malaysia banking industry.
1.4 Research Questions
In this research, there is several research questions have developed to a study of
the relationship between retention strategies and job performance in Malaysia
banking industry. Below has shown those research questions:
(1) What are the relationship between training and job performance in Malaysia
banking industry?
(2) What are the relationship between career development and job performance in
Malaysia banking industry?
(3) What are the relationship between working environment and job performance
in Malaysia banking industry?
(4) What are the relationships between reward systems and job performance in
Malaysia banking industry?
(5) What are the relationship between fair treatment and job performance in
Malaysia banking industry?
Retention Strategies and Job Performance
Page 6 of 114
1.5 Hypotheses of the study
There are several hypotheses have been developed to facilitate the objective of
this study to investigate the relationship between retention strategies and job
performance in Malaysia banking industry. After reviewing all the relevant
journals and articles, the following hypotheses have been generated:
H11: There is a significant relationship between training and job performance.
H21: There is a significant relationship between career development and job
performance.
H31: There is a significant relationship between working environment and job
performance.
H41: There is a significant relationship between reward systems and job
performance.
H51: There is a significant relationship between fair treatment and job
performance.
1.6 Significant of the study
Due to the banking industry is one of the sectors that always imposed high work
pressure on employees, it is a matter of concerned to study the relationship of
retention strategies has a significant role on job performance, with providing
training, career development, working environment, reward systems and fair
treatment in the banking industry. Company or organization that can remain
competitive in their sector definitely required retention strategies that are able to
attract and retain the employees’ need, thus, the potential for economic growth
and sustainability will be enhanced.
Nature of the work environment has been changed from time to time; employees
are facing with increased workloads, sarcastic bosses without appropriate rewards
in accordance with their performance and so on. All of these factors are lead to the
high employees’ turnover of a company. If the bank’s employees are satisfy with

Retention Strategies and Job Performance
Page 7 of 114
their current job, it can help the organizations survive in the market or industry
and it also can increase productivity in return. However, if the bank’s employees
are not satisfied with their current job, they may have an intention to leave their
current job and it may show high job turnover rates in banking sector and it
reflects poor performance or services in banking industry.
In brief, retention strategies application is needed in order to retain those
employees who outperformed beyond expectation, and also reduce the
unnecessary costs of recruit, hiring and training. In fact, findings of this study will
assist in providing a fundamental basis for the workplace area of developing
competitive pay or packages of the benefits for the employees in banking industry.
1.7 Chapter Layout
This research is composed and categorized into five chapters, which are:
Chapter 1: Introduction
This chapter provides an insight to the subject of interest to the readers through
the introduction of research background and problem statement. Meanwhile, the
research objective is aimed to address the purpose of the investigation. Thereafter,
research questions and hypotheses addressed the direction of the research.
Furthermore, the significance of the research briefly explained the dedication of
the research;
Chapter 2: Literature Review
This chapter includes the critical analysis of the relationship between retention
strategies and job performance. Besides, as a ground for formulating the
research’s questions, the proposed theoretical framework and hypotheses are
developed;

Retention Strategies and Job Performance
Page 8 of 114
Chapter 3: Research Methodology
This chapter will assess the extent to which the retention strategies have met its
intended aims to enhance the job performance. Primary and secondary data are
used to carry out the research. Research instrument, measurement, process and
analysis are indispensable to provide a pledge to guide researchers to the next
chapter for analysis;
Chapter 4: Research Results
This chapter discussed about the research results obtained in the survey. The
research objectives, hypotheses, and problem that have been identified in previous
chapters are then further discussed in this chapter. Statistical Analysis System
(SAS) Enterprise Guide 5.1 is used to examine the overall results and findings
from Chapter 3, charts and tables are illustrated;
Chapter 5: Discussion and Conclusion
This chapter consists of implications, recommendations and suggestions in order
to accelerate the discussed issues. It basically contains the overall conclusion for
the research carried. The limitations of the research study are evaluated and
studied to provide platforms for future researches.
1.8 Conclusion
As an overall of this chapter, in order to understand the relationship between the
retention strategies and job performance in Malaysia banking industry
identification of the problem from research background and examine the variable
to meet the research objective is very important. In next chapter, literature review
will be conducted by using different source of secondary data so it can provide a
better view in developing hypotheses for the study.

Retention Strategies and Job Performance
Page 9 of 114
CHAPTER 2: LITERATURE REVIEW
2.0 Introduction
In this chapter, there is a study of the relationship between retention strategies and
job performance in Malaysia banking industry. It begins present with the literature
review and follow by relevant theoretical models, conceptual framework and
lastly with hypotheses development. Based on the previous chapter, there are five
factors being studied that include training, career development, working
environment, recognition and fair treatment. We believe that these retention
strategies have a relationship with the job performance in Malaysia banking
industry. For this chapter, we will discuss about the definition of job performance
which is the dependent variable of the research as well as the relevant theories
regarding to independent variables. In addition, we will use secondary research,
such as journal article, textbooks, Web sites, magazines, online newspaper, etc., to
complete this chapter.
2.1 Review of Literature
2.1.1 Job Performance
According to Sonnentag, Volmer and Spychala (2010), job performance can
be defined as multi-dimensional concept. Basically it can differentiate
behavioural and an outcome aspect of performance. Behaviour is the
practices, and acting of an individual while doing a task and outcome aspect
are the impact of an individuals’ behaviour. Job performances are very
importance to an organization and individuals. An individual able to gain
high job performances when complete a task with a satisfied result, feelings
of self-efficiency and mastery.” An individual able to be promoted, get

Retention Strategies and Job Performance
Page 10 of 114
rewards and having career opportunities when an individual are having well
performance.
The efficiency of productivity of an organization is strongly influences by
job performance. To evaluate employee performance, an organization could
use task performance, contextual performance, and three items for
effectiveness which are productivity, quality and innovation (Kahya, 2007).
Furthermore, level of performance able to be increase with the involvement
on budgeting process which leads to rise of goal commitment (Jermias, &
Yigit, 2013).
Employee retention strategies having a positive effect or relationships to
employees’ job performance. As the result, an organization should practices
retention strategy which able to remain employee to increase the level of job
performance (Akuoko, 2012). The example employee retention strategies
are such as working environment, training and development, rewards and so
on.
Azman, Loh, Ajis, Dollah, and Boerhannoeddin (2009) had done research
on the relationship between retention strategy which is employee training
and development and employee job performance. On the study, the
supervisor will give a high support and encourage the employee to take part
on training programs. Those skill and knowledge that been gain by the
employee thorough the training are able to practices in their job and useful
from the support of the supervisor. Throughout this study, they found that
those employees are agrees that the support of the supervisor on training
programs, and attending training programs able to increase their job
performance.
Retention Strategies and Job Performance
Page 11 of 114
2.1.2 Training
According to Neo (as cited in Ken, Cheah & Mohd Salleh, 2012) training
defined as the part of organization planned activities in order to increase the
knowledge, skills and ability or adapt the employee’s attitude and
behaviours consistent with the job requirements and organizational goals.
Peretomode and Peretomode (as cited in Nakpodia, 2011) also found out
that the training is intended organizational efforts focus on helping the
employees to obtain a specific and useable knowledge, skills, ability and
others so that they can perform their job more efficiently and effectively.
Based on HR dictionary (as cited in Ango, Yakubu & Ismaila, 2011),
training defined as the amount or type of training should provide to the
employees so that it can comprise for shortage or abilities to put off the
organization from accomplishing its aims and operating effectively.
Besides, Huang (as cited in Ken et al., 2012) had stated that training
involves organized learning activities that changing the knowledge, skills,
and abilities in order to improve an individual performance. Stone R J.
Human Resource Management had study that by integrating the interests of
the workforce and organization, training has the different role in order to
achieve an organizational goal (as cited in Khan, Khan, & Khan, 2011). In
addition, in the business world today, the most significant issue is training.
This is because training can enhance the efficiency and effectiveness of
employees and organization.
Khan, Ahmed, Muhammad, and Muhammad (2012) studied that training is
necessary to add in on their previous job skills due to the changing of the
technologies brings new jobs and responsibilities; and employees require
getting familiar with the latest technologies. Salas and Connon-Bowers (as
cited in Khan et al., 2012) found out that training is difficult to execute
because it need to invest a huge money in human capital. In order to
increase the firm overall performance, innovations and abilities of learning
new technologies, improving and building up employee skills that creating
Retention Strategies and Job Performance
Page 12 of 114
aggressive return for a firm is very important. Consequently, companies are
continuously pumped in huge money in human capital and bosses of each
company are attempting to value the necessaries of investment and remain
competitive in the market.
2.1.3 Career Development
Employee decides the success or failure of an organization (Hameed &
Waheed, 2011). The job performance will highly affect the operation of the
organization. Thus, most of the companies are contributing money to help
on employees’ development. Career development is one of the major
functions of Human Resource whereby employee develops their
competencies through training to increase their job performance. The
development includes self-development, self-directed learning and work
recognition.
According to Monis and Sreedhara (2010), there is a relationship between
employee growth and development activities. A good career development
will lead to employee commitment, boost up productivity, and reduce
turnover rate of employees. The research has shown that employees are
willing to stay in a company if they are provided chances to develop. It is
stated that less opportunity of career development in India has caused the
employees to leave.
Luthans (2000) has stated that employee recognition is another effective
way to motivate the employees in job commitment. Employee commitment
has decreased due to downsizing of the workforce. With the increase of job
commitment, the job performance will be enhanced and reinforced.
Therefore, there is a need to award employee recognition in order to retain
the employees, at the same time improve productivity. The recognition will
tie up the top management and employees to work together, eventually
reaching a desired outcome.
Retention Strategies and Job Performance
Page 13 of 114
Besides, Goyer (2010) has stated that professional development that
provided to the employees in small and medium enterprises seems to be
beneficial to both employees and enterprises. There is a labour shortage
problem arising in certain sectors of the industries where employers are
hired on temporary contract. Most of the employees hired are unskilled or
semi-skilled. To encourage the independency of the employees, career
development is needed to deal with the low productivity problem.
Job performance involves the participation and collaboration of the
organizational, team and individual efforts to obtain the objectives and goals
of the organization (Nyakundi, 2012). Successive improvement and
evaluation are needed make sure the performance made is corresponding to
the organizational goals. Needs for recognition is what the employees desire
for. When they are recognized, it will lead to the enhancement of
productivity rate.
In addition, organizations in service industry have been working hard to
manage their employees so that they can contribute in a better job
performance (Alam, Ahmed, Sahabuddin, & Akter, 2013). The
organizations aim to balance up the employee’s contribution and
organization’s contribution. Whoever having good job performance will be
recognized. Thus, employees feel they are appreciated. People are more
willing to take challenges and perform better on their tasks when they are
motivated.
2.1.4 Working Environment
Currently, employee have a lot of working alternative, the working
environment have play a significant factor that influence the employee
whether remain in the job or leave the job. Employee retention could effects
the error rate, level of innovation and collaboration with other employees,
absenteeism and the duration of stay in the job. The level of employee’s
Retention Strategies and Job Performance
Page 14 of 114
motivation, following performance and productivity able been determined
by the quality of working environment (Leblebici, 2012).
Quality of working environment is a significant component to increase the
level of productivity. However, most of the organization might neglect of
the health, safety and security matters. This matter might cause the
organization having a poor performance and facing high absenteeism
(Leblebici, 2012). Quality of working environment are effected by fair
rewards, safe and healthy environment, training and development, and so
on. An organization are requires to provide a good working environment
including those financial or non-financial encouragements to remain their
employee and increase the level of performance (Kaur, 2010).
In term of safety and healthy environment, according to Agwu (2012) study,
employees’ safety culture can be defines as “a product of individual and
group values, attitudes, perceptions, competencies, and patterns of
behaviour that determine the level of commitment, style and proficiency of
an organization’s safety management”. Agwu (2012) had done a study about
the impact of employees’ safety culture on organizational performance.
According to the study, the effort of improve management or employees
safety practices, enhanced productivity, increased profitability and reduced
accident or incident rate have improve the employees’ safety and
organization performance. Furthermore, the development in some of the
physical measurements of the safety and healthy environment at the
workplace such as "internal climate" and "repetitive and strenuous activity"
are significantly affects organization productivity (Buhai, Cottini, &
Westergard-Nielseny, 2008).
In banking industry, the probabilities of the bank employees to be the
subject of armed violence are higher than others industry employee even-
though bank hold-ups are reducing in Australia. Severe physical and non-
physical damage might cause by those violent attacks (Bunn & Guthrie,
2009).

Retention Strategies and Job Performance
Page 15 of 114
2.1.5 Reward Systems
Employees’ reward defined as benefits, such as increased salary, bonuses
and promotion result from the assessing of their performance by their
superior or manager. It can be reinforce and define in terms of
organization’s structure whereby the impact of the reward systems on
structure is usually unintentional (Lawler, 1993). Besides that, according to
Huselid, Ngo, Daniel, Chung-Ming, and Siuyun; Paul and Anantharaman;
Collins and Smith; Minbaeva, Kassicieh and Yourstone; Lawler and Cohen
(as cited in Rahman, Hussain, & Hussain, 2011) suggested that rewards can
be considered as a significant factor that could influence the employees’ job
performance as well as their morale. According to Stredwick (2000), he
argued about reward policies that have start to follow the procession. In fact,
Smith (1992) stated that reward plays a significant part in order to develop a
highly performance workforce and would be able to discuss about it with
their employees in an organization. As evidence, past researchers have
mentioned about those multinational organizations for instance Textron and
Burger king; they have declared their increased salary and conditions for
their employees to transfer to become “the preferred employer” in their
particular industries (Walsh, 1998; Stredwick, 2000). In the meanwhile,
Thang (2004) and Wan (2008) also stressed that compensation and reward is
a powerful tool that can influence the staffs’ performance result in an
individual level as well as group level. A higher pay for the higher
contributors will lead to a better individual and organizational performance,
in the linkage with high collaborative efforts acquired to support the
performance outcome of the employees.
Through a structural equation modelling testing by inserting the idea of
concepts, theories and empirical researches, a theoretical framework was
developed and proved that there is a significant relationship between reward
systems either both financial or nonfinancial and the job performance level
of employees. Likewise, according to Heneman and von Hippel (1995);
Pearce and Ravlin as cited in Rahman et al (2011), they suggested that a

Retention Strategies and Job Performance
Page 16 of 114
combination of financial and nonfinancial incentives strategies would be
more effective in cultivating the performance level of the employees in an
organization.
Reward also can be classified into two categories- Financial (extrinsic) and
non-financial (intrinsic) rewards. Financial rewards include increased salary
and bonus system whereas non-financial rewards which are appreciation,
promotion and title. Reward systems contribute as a core function of human
resource discipline and strategically partner with the company management
and it has significant impact on the employees’ performance (Gungor,
2011). For instance, balance scorecard had emerged into focusing on the
non-monetary and monetary measures into the formal reporting system,
which helping managers to pay attention on the overall important
operational measures and supervise the needed for improvement in certain
area (Drury, 2009). In addition, Barber and Bretz as cited in (Gungor, 2011)
indicated that reward systems had an impact on retain and motivate the high
talented employees, as a result of high level performance of an individual
employee. Another past researcher, Bishop as cited in (Gungor, 2011) found
that discrepancy between the productivity of the employees is mainly
affected by the factor of recognition and reward of employee.
As in further indicated that reward system is one of the significance
variables which contributed to the performance level of employees, Gungor
(2011) had emphasized previous studies is proven the used of reward
systems as a strategies in order to motivate and retain employees, thus it is
directly increase their performance outcome in an organization. In fact, the
methodology piloted by Gungor (2011) through collecting sample of the
target populations about related study especially those bank employees in
the global banks and titled as administrative staffs, supervisor, and manager
or director positioning. A survey method will be carried out through online
system to the e-mails of the bank employees.
According to Babakus, Yavas, Karatepe and Avci (2003), the employees’
attitude was affected by the reward climate. Additionally, how the managers
Retention Strategies and Job Performance
Page 17 of 114
reward his or her employees also reflect the commitment of managers
towards the organization. Skinner as cited in (Khan, Shahid, Nawab, Wali,
2013), emphasis in referring the rewards in exchange for hard work is very
imperative when it comes to influencing the acuities of employees
especially in banks and other service industries. According to Khan et al.
(2013), through a Minnesota Satisfaction Questionnaire (MSQ) survey
which is to measure the level of satisfaction with intrinsic and extrinsic
rewards. The result of the level of satisfaction of banking employees was
assessed as satisfactory with the satisfactory self-rated performance. Overall
was showing that the respondents reach to an agreement that intrinsic and
extrinsic rewards increase overall job satisfaction and performance of
employees.
Meanwhile, Doeringer and Piore as cited in (Kim, 2010) also point out that
employee with high levels of opportunities in promotion in the future have a
tendency to perform better because of their high levels and advance
incentives. For the reason to be more validated, Petersen, Spilerman and
Dahl as cited in (Kim, 2010) had listed an example, which is the lack of
promotion opportunities constitute a prior reason for high turnover rates of
employees in a large bureaucratic and hierarchical organization, therefore
rewards system anticipated as significance element that determined the job
performance of the employee in an organization.
In accordance to the expectancy theory, it revealed there is a significant
relationship between reward systems and job performance. As the
employees believe that the effort they putting on the job will lead to a good
performance evaluation and thus, they will be rewarded bonuses, salary
increase or the high opportunity to be promoted, and it is definitely fulfil
their personal goals (Robbins, 1999).
However, according to Lazear as cited in (Johnson, 2005), he has underlined
that a double-edged sword could happened if the rewards are spreading too
wide in the sense of motivating effort in the job performance, in fact it can
also create a non-cooperative and sabotage among the employees in the

Retention Strategies and Job Performance
Page 18 of 114
organization, as the political culture exist in the organization could leads to
declining of productivity and damaging the reputation of the company.
Similarly, researcher notifies that managers should not rewarded too
frequently, they should emphasize on the non-rewards in order to increase
the level of performance of workers (Bowen, 2000), as it is also supported
by Shore and Shore (1995), employees who are experience and being
recognized by supervisor will have better perceptions towards their work,
colleagues and the place he or she worked for.
Buchanan (as cited in Aktar, Sachu, Ali, 2012) stated that when the well-
being is concerned by the organization (being promoted or recognized),
employees will definitely showing commitment towards the organizations’
goal and objectives. According to researchers, banking industry is particular
on the establishment of relationship between the bank personnel and
customers which constitute a driving force that lead to a higher level of
satisfaction of customers towards the bank services. A good product or
services will increase the perceived value and it is likely to satisfied
customer in terms of their needs (Reynolds & Beatty, 1999).
2.1.6 Fair Treatment
Fair treatment is a critical issue in an organization. Many researches show
that employees who perceive fairness in their workplace tend to contribute
high levels of commitment and satisfaction in the organization (Sabeen &
Mehboob, 2008; Simons & Roberson, 2003). Employees show high levels
of organizational commitment to the organization relatively have higher job
motivation and organization citizenship and hence generate higher level of
job performance (McShane & Von Glinow, 2010).
The perception of fairness is varies for each person and situation.
Organizational behaviour scholars had come out an equity theory to explain
how the people develop their perception of fairness in the organization

Retention Strategies and Job Performance
Page 19 of 114
(McShane & Von Glinow, 2010). From the view of equity theory, it indicates
that if employees feel they are treated fairly by the organization, employees
will provide something in value in return as show reciprocate to the
organization. This theory says that employees will be motivated in their
work when they perceive that they are being treated fairly (Williams, 2010).
Ketelaar and Koenig (2007) claimed that in relation to the “fairness”,
commonly human minds will routinely apply the judgement of fairness into
three categories, that is (a) judgments about the fairness of acts of
punishments and compensation, (b) judgements about fairness of
distributions, and (c) judgements about the fairness of the methods and
procedures employed to generate the outcomes. Traditionally, fairness is
said as three-dimensional construct which contain of procedural fairness,
distributive fairness and interactional fairness. In addition, according to
Colquitt (2001), the level of employees’ perceived fairness is manipulated
by the level of justice. Organizational justice has been separated into three
dimensions; they are distributive justice, procedural justice and interactional
justice (Colquitt, 2001).
Distributive justice is referring to the perceived fairness in the outcome the
people get according to their contributions and compared with the outcome
others get and their contributions (McShane & Von Glinow, 2010).
Procedural justice is referring to the perceived fairness in the policies and
procedures that used to implement decisions and distribution of resources
(McShane & Von Glinow, 2010). People who perceive procedural justice
feel greater control in the environment. They tend to respond with less
turnover intentions, lower levels of absenteeism, improve job performance
and commitment to the organization (Masterson, Lewis, Goldman & Taylor,
2000). Bies and Moag’s study (as cited in Masterson et al., 2000) indicated
that individual fairness judgment also base on how one is being treated in
the procedure and it is emphasizes on interpersonal aspects and
communication in the processes. They labelled this concept as interactional
justice.
Retention Strategies and Job Performance
Page 20 of 114
According to Dailey and Kirk’s study (as cited in Matlala, 2011), they
propose that managers must pay awareness on both procedural and
distributive justice of employees since these two constructs play a vital role
in relation to job disappointment and intentions to quit. They highlight the
importance of participation of employees in changing the organizational
systems. The fair distribution of allocation by seeking employees
appropriate opinions help to form positive perception of the organization
systems. This is because employees feel that they are being respected in the
organization. Hence, the more effective management is practiced as
employees perceive the fairness given by the organization.
Besides, in the study of Dayan and Benedetto (2007), there is interaction
between the procedural and interactional justice on the quality of the
teamwork. They claimed that mutual support, team cohesion,
communication, individual effort, and coordination of member will have
contributions and positive effect to both procedural and interactional justice.
Their study shows a strong relationship between interactional justice,
balance of member contributions and coordination. They proposed that the
path to achieve desire coordination will become very difficult when the
decision makers are bias or dishonesty towards their team members.
On the other hand, in the study of the effects of interactional justice on
egocentric bias in resource allocation decisions by Leung, Tong and Ho
(2004), they found out that a fair interpersonal treatment will cause a
smaller egocentric bias, fewer stalemates and quicker settlements.
Therefore, improvement on the perceptions of interactional justice should be
concerned by the managers in order to get more satisfactory performance.
As overall of the studies, fair treatment in workplace play an importance
role towards job performance.
Retention Strategies and Job Performance
Page 21 of 114
2.2 Review of Relevant Theoretical Models
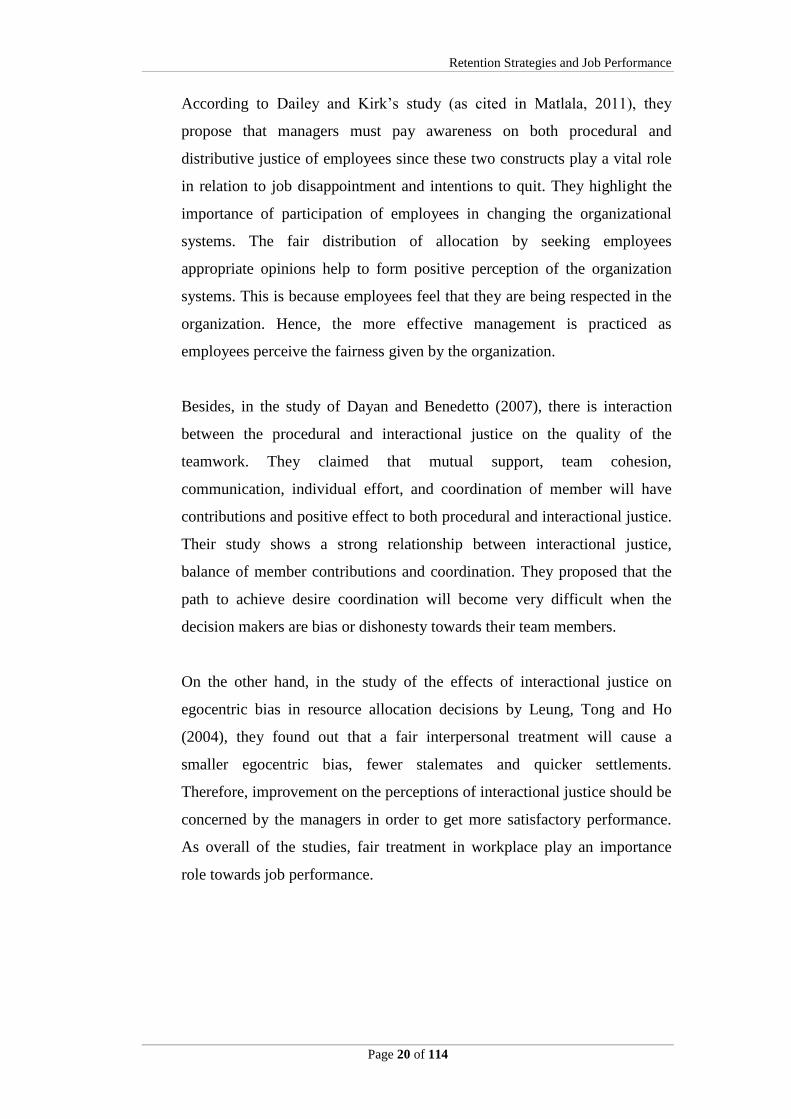
Figure 2.1: The Relationship between Training and Job Performance
Source: Khan, R. A. G., Khan, F. A. & Khan, M. A. (2011). Impact of training
and development on organizational performance. Global Journal of Management
and Business Research, p. 64
The above model is aimed to implement the training and development and its
affect to the organizational performance. There are total of three variables, such as
training design, on the job training and delivery style, that can affect the
relationship between the training and development with job performance. Michael
Armstrong and Ginsberg (as cited in Khan et al., 2011) stated that it is necessary
and carefully to design the training by the organization based on the needs of the
employees. It is proven that if an organization develops a good training design
based on employees’ need, then the good results can obtain by the organization.
Besides, on the job training benefits the employees in term of knowledge of the
job. In the study of Khan, et al., it is suggested that organization should give on
the job training to their employees so that employees can acquire in a practical
way. On the other hand, delivery style also considered as very significant part of
training and development. Mark A. Griffin et al. (as cited in Khan et al., 2011)
stated that if employees cannot carry the training in an impressive style, then the
employees cannot capture the attention of the managers. Consequently, in the
research saying that each organization should develop the suitable training to the
Retention Strategies and Job Performance
Page 22 of 114
need of the employees so that the organization can compete with other
competitors.
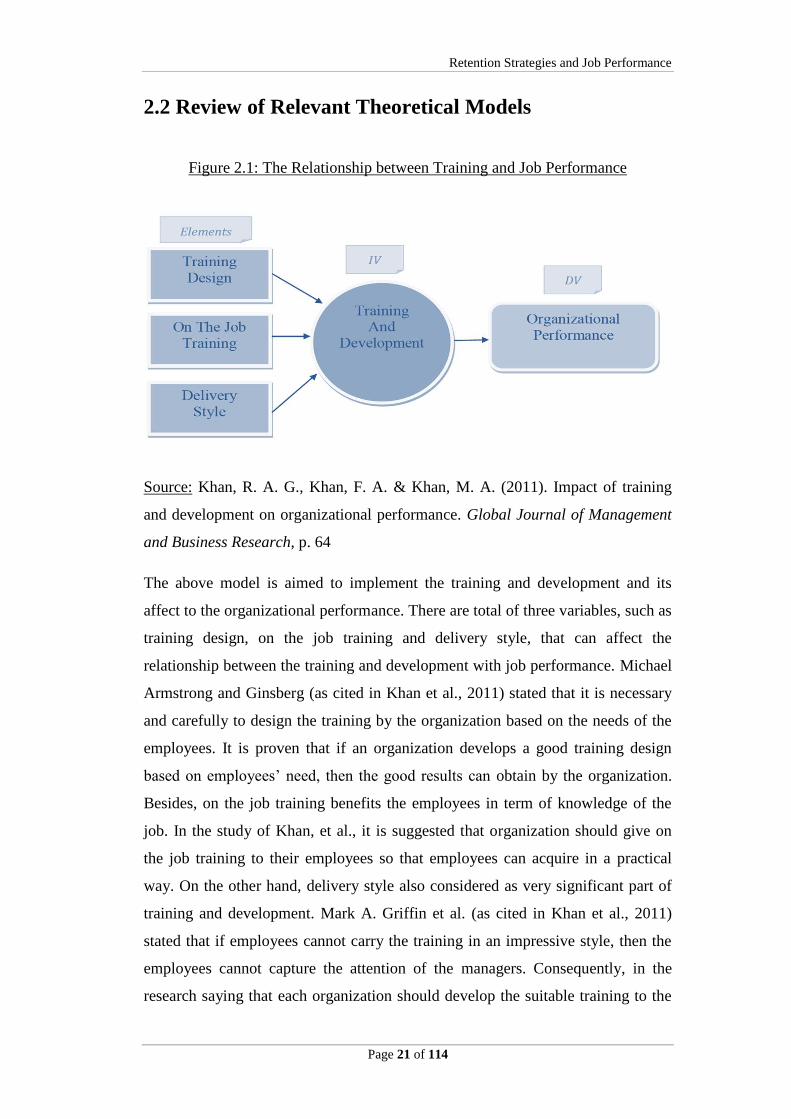
Figure 2.2: The Relationship between Employee Development and Job
Performance
Source: Hameed, A., & Waheed, A. (2011). Employee development and its affect
on employee performance a conceptual framework. International Journal of
Business & Social Science, p. 227.
The above model is developed by Hameed and Waheed (2011) aimed to study the
employee development and its effect on employee performance. There are total of
five exogenous variables (coaching, training and development, empowerment,
participation and delegation) are recognized as antecedents of employee
development that affect the job performance. Career development is definitely a
key element to success. It is stated that employee is a precious capital in an
organization. The growth or declined of an organization is always depends on the
job performance. It is relatively imperative for an organization to invest in human
capital as those developments would contribute to the organizational
effectiveness. When the organization concerns about the employees, it wants the
employees to develop to perform better. Poor performance is detrimental to
organization’s success. If an employee is given a full authority of performing a
task, he or she will improvise themselves in order to achieve the organizational
goals, and eventually increase their self-confidence and job performance.

Retention Strategies and Job Performance
Page 23 of 114
Figure 2.3: Economic Effects of Inculcation of Employees’ Safety Culture at the
Company Level
Source: Agwu, M. O. (2012). Impact of employees safety culture on
organizational performance in Shell Bonny Terminal Integrated Project (BTIP).
European Journal of Business and Social Sciences, p. 75.
The above model is developed by Agwu (2012) which is developed to study the
relationship between safety working environment culture and job performance.
Agwu (2012) stated that investment in metrics plus employee safety culture need
to meet HSE (Health and Safety Executive) measures, HSE rules and regulation
and throughout this will meet better company performance and employee HSE
performance.
Few HSE risk, better opportunities for rehabilitation and few accidents, damages,
liabilities, legal costs, less absenteeism, medical costs will lead to better employee
HSE performance and throughout better company performance. Less disruption of
work process, liabilities and better productivity efficiency, quality company image,
innovative capacity will lead to better company performance.
Retention Strategies and Job Performance
Page 24 of 114
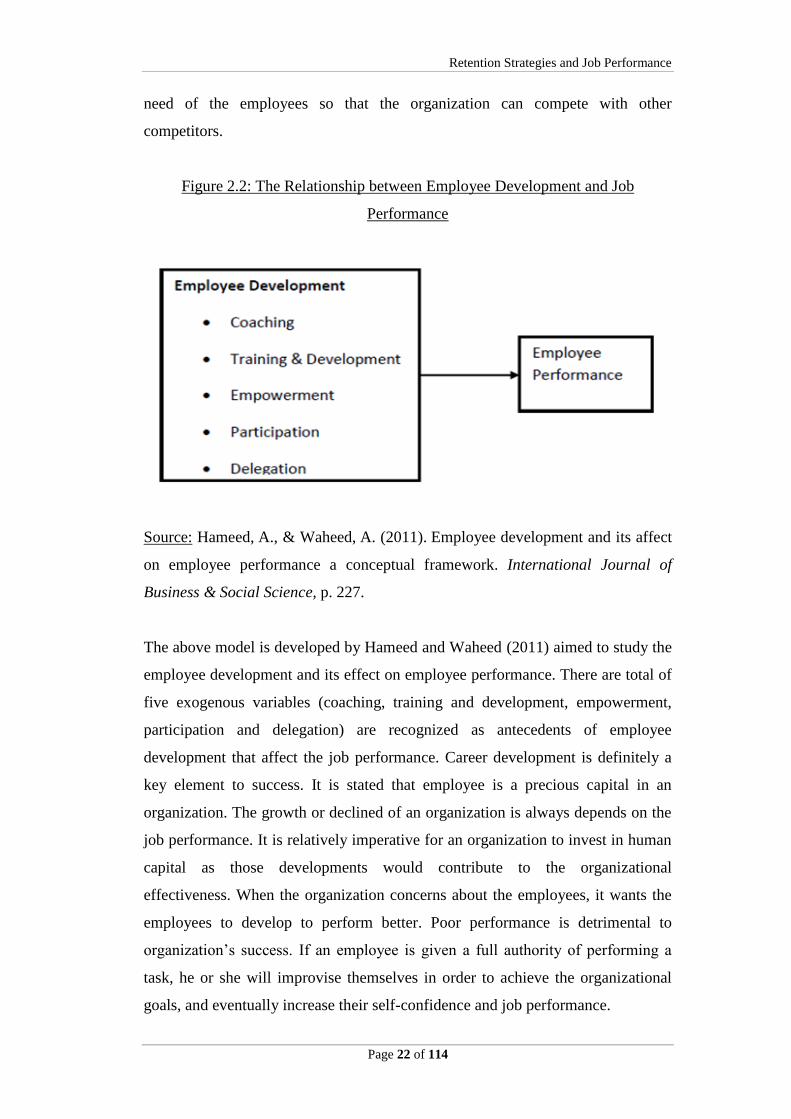
Figure 2.4: The Relationship between Reward Systems and Employee’s
Performance
Source: Rahman, M.S., Hussain, M. & Hussain, B. (2011). Assessing the
relationship between diversified workforce and reward on employees’
performance in the organization: An exploratory study of private organisations in
Bangladesh. Journal of Employment Studies, p. 91.
The first stage of the data analysis was done through exploratory factor analysis
(EFA) to pinpoint the factor structure and assessing the factor that affect
employees’ performance. The second part was employed with confirmatory factor
analysis (CFA) to confirm the factor structure. Hence, this study used structural
equation models to test the hypothesis and it has used the maximum likelihood
estimation method. As a result, it is strongly related with certain aspects of
perception of employees that will influence their performance in an organization.
In fact, the result revealed that financial reward variable is one of the highest
influential factors followed by the diversified workforce which were influencing
the performance level in the organization.

Retention Strategies and Job Performance
Page 25 of 114
Figure 2.5: The Relationship between Organisational Justice and Organisational
Performance
Source: Hornibrook, S., Fearne, A. & Lazzarine, M, 2009. Exploring the
association between fairness and organisational outcomes in supply chain
relationships. International Journal of Retail and Distribution Management, p.
793.
According to Hornibrook, Fearne and Lazzarine (2009), if the three justices
(procedural, distributive and interactional justice) are practiced in an organization,
then it will has direct effect on the organizational effectiveness and performance
through changes in the attitude and behaviour of the employees. This is because
improvement on the perceptions of fairness by an individual will enhance the
commitment, performance, and job satisfaction of the employees to the
organization. Due to the behaviour changed, the employees might identify the
organization’s objectives and involve themselves as their own; therefore they will
be more productive and benefit to the organization.

Retention Strategies and Job Performance
Page 26 of 114
2.3 Proposed Theoretical Framework
Figure 2.6: Model of Proposed Theoretical Framework
Independent Dependent
Variable Variable
Source: Developed for the research
Figure 2.6 above shows the proposed theoretical framework of our research study.
The purpose of conducting this study is to examine the relationship between the
retention strategies and job performance. There are five variables under retention
strategies in our study, which are training, career development, working
environment, reward systems and fair treatment.
Training
Career Development
Working Environment
Reward Systems
Fair Treatment
Job Performance

Retention Strategies and Job Performance
Page 27 of 114
2.4 Hypotheses Development
2.4.1 Training
Nelson, Hilary and Michael (2012) studied that training and job
performance had a significant relationship in completing different duties.
The researchers had proven that for those employees have taken and
involved in the trainings, they are more proficient in carrying out different
duties and vice versa. Therefore, training has positive relationship with the
job performance. Micheal Armstrong (as cited in Nelson et al., 2012)
proven that normally training is a proper and organised adaptation of
behaviour through learning which occurs in education, tutoring,
development and prearranged experience. Effective training is important
due to the practical consequences of training.
Khan, R. A. G. et al. (2011) stated that the most significant issue is derived
from the training in the business world due to it can enhance the efficiency
and effectiveness for both employees and organization. In fact, job
performance depends on several issues; nevertheless, the most significant
issue of job performance is training because training can improve the
proficiencies of employees. Fakhar Ul Afaq and Anwar Khan (as cited in
Khan, R. A. G. et al., 2011) the more training the employees’ experienced,
the better job performance that employees involved in terms of increasing
of knowledge, skills, ability and proficiencies.
Based on the literature review, the following hypothesis is being
formulated:
H10: There is no significant relationship between training and job
performance.
H11: There is a significant relationship between training and job
performance.
Retention Strategies and Job Performance
Page 28 of 114
2.4.2 Career Development
According to Nyakundi (2012), the study has pinpointed the significance
of employee recognition as one of the major factors that affect the job
performance. Recognition as one of the elements in career development is
the motivator to boost up the productivity of an organization. There is also
a significant relationship between employee growth and development
activities (Monis & Sreedhara, 2010). It is shown that high performer in
MNC firms tend to have close relationship towards development activities.
The employees need to have a strong career path to compete in an
organization.
Goyer (2010) stated that the study reviewed a significant relationship
between executive coaching and work performance where career
development is needed to solve the low rate productivity problem. Luthans
(2000) stated that recognizing employees for their work is highly desirable
to motivate the employees in enhancing their job performance.
Collaboration between top management and employees with highest
motivation will create an outstanding performance. The findings of Alam
et al. (2013) shown that there is a strong relationship between employee
contribution and recognition in an organization. There is a need to offset
between the recognition and job performance so that the employees feel
they are valuable.
Based on the literature review, the following hypothesis is being
formulated:
H20: There is no significant relationship between career development and
job performance.
H21: There is a significant relationship between career development and
job performance.
Retention Strategies and Job Performance
Page 29 of 114
2.4.3 Working Environment
According to Leblebici (2012), we found that in bank industry at Turkey,
there is a significant relationship between working environment and job
performance. Base on Leblebici (2012), the hypothesis that done which is
“There is a relationship between office environment and productivity of
employees”, “It is the behavioural components of office environment that
have a greater effect on productivity than the physical components” and “It
is the comfort level that has the significant impact on the performance
level of employees than office layout” had been accepted.
Paputungan (2013) stated that in banking industry it has a strong
relationship between safety and health working environment and job
performance. The study had proved that work stress is strongly affecting
the employee performance.
Agwu (2012) stated that, there is a positive relationship between safety
working environment and job performance. Having a safety culture will
lead to less accidents, damages, liabilities, legal costs, medical costs and
less disruption of work process and liabilities. Throughout this, the job
performance will be better.
Based on the literature review, the following hypothesis is being
formulated:
H30: There is no significant relationship between working environment
and job performance.
H31: There is a significant relationship between working environment and
job performance.

Retention Strategies and Job Performance
Page 30 of 114
2.4.4 Reward Systems
Relationship between reward systems and job performance has been well
studied in the journals. Rahman, Hussain and Hussain (2011) perceived
that rewards both financial and nonfinancial found to have a significant
and positive impact on their individual performance based on the empirical
findings. According to DeMatteo, Eby and Sundstom stated that it is
essential to manage and apply the reward strategy in order to enhance
overall performance (Rahman, Hussain & Hussain, 2011). Based on the
past researchers Heneman and Von Hippel, and Pearce and Ravlin, the job
performance at individual level will be more effective through
combination of the financial and nonfinancial rewards strategies (Rahman,
Hussain & Hussain, 2011).
Next, research conducted by Gungor (2011) on the relationship between
the reward management system applications and employee performance of
bank employees on global banks in Istanbul, the finding showed that
financial rewards have positive effects on employee performance. The
findings of the study is reliable which it is consistent with the previous
studies which Herpen, Praag, Cools (as cited in Gungor, 2011), which
have investigated empirically the effects of pay on performance and the
results bring out a positive relationship between the perceived features of
the reward systems and extrinsic motivation.
In Khan, Shahid, Nawab and Wali (2013) research, they suggest that top
management of banking sector of Pakistan requisite to be appropriately
promote the employee performance by using of rewards due to the
conducting research methodology’s resulted in a positively relationship
between the reward systems (intrinsic and extrinsic) and performance level
of employees. Furthermore, a customized set of rewards factors in an
understudied but vital banking sector been applied in the literature body
through contribution of study.

Retention Strategies and Job Performance
Page 31 of 114
Based on the literature review, the following hypothesis is being
formulated:
H40: There is no significant relationship between reward systems and job
performance.
H41: There is a significant relationship between reward systems and job
performance.
2.4.5 Fair Treatment
Aldrich and Ruef (as cited in Matlala, 2011) proposed that an organization
must expect to encounter a problem that happens in any situation where
burdens or benefits are distributed, that is when members become aware of
the system just in a procedural and distributive sense. Salimaki and Jamsen
(2010) found out that there are actually has some interaction between the
perception of fairness and politics. In their study, it is suggested that
perceptions of unfairness perceived might actually jeopardize the system,
and as a result it will cause the difficulty to meet the organization
objectives.
It is important for procedural justice to be perceived positively in an
organization in order for them to achieve full productivity, excellent
performance, and execution of its strategic objectives (Van Prooijen,
2009). Van Prooijen (2009) claimed that a fair decision making procedures
will affect on human perceptions, behaviours, emotions, and do so across
diverse social settings. The practice of procedural justice in an
organization will actually make the employees to have the increase sense
of being respected; thus, they will be more willing to volunteer themselves
to involve in the organization’s objectives. In contrast, De Cremer (2005)
indicate that if unfair procedure are used, trust between the employer and
employees will be low and employees will show low commitment and not
co-operative to the employers.

Retention Strategies and Job Performance
Page 32 of 114
According to Hopwood, and Lind and Tyler (as cited in Tan, S. L. C. &
Lau, C. M., 2012), study of perception of fairness is crucial because it is
connected with a series of important consequential behaviours. Basically,
employees will be pleased when serve and treat equally by their employers
and they will use fairness as a fundamental base to judge their relationship
with the organizations. The employees will be more committed to the
organization if the organization treats them without bias.
Based on the literature review, the following hypothesis is being
formulated:
H50: There is no significant relationship between fair treatment and job
performance.
H51: There is a significant relationship between fair treatment and job
performance.
2.5 Conclusion
In chapter 2, we cover the research topic which is the retention strategies and job
performance by providing the support from the review of literature background.
The literature review provided us with a better understanding of the current
research regarding the current topic which consists of total five variables: training,
career development, working environment, reward systems and fair treatment.
Furthermore, we proposed our own conceptual framework based on the relevant
model that we have mention above in this chapter. The framework generalizes our
research title to provide a better statement of the overall picture. In the last part of
chapter 2 we formulated the hypotheses based on literature review.
Retention Strategies and Job Performance
Page 33 of 114
CHAPTER 3: RESEARCH METHODOLOGY
3.0 Introduction
Research methodology is implemented in order to identify the relationship
between retention strategies and job performance in Malaysia banking industry.
This chapter portrays how the research is carried out in appropriate research
procedures, in terms of research design, data collection methods, sampling design,
research instrument, construct measurement, data processing and data analysis.
3.1 Research Design
Research design is a plan that providing comprehensive guidance for collecting
and analysing the desired data and information (Zikmund, 2003). It is an overall
operation framework for carrying out a research project. The research problems
faced in the process of obtaining the information needed is required to solve in the
best possible way. Research design can be categorized into three different groups:
exploratory research, descriptive research and causal research. The chosen
research design for this study is descriptive research.
Descriptive research is a type of authentic research that describes the situation,
which is the characteristics of phenomenon, people, objects, groups, or
organizations (Zikmund, 2003). Unlike exploratory research, descriptive research
is studied based on some prior understanding of the nature of research problem. It
seeks to address the answer for what is happening and what had happen in a
particular situation. Our research study is more to descriptive method because this
study deals with the description of the relationship between retention strategies
and employee’s job performance which is structured as it implies closed questions
which make it more descriptive. It involves the study of behaviours that are
measured in particular situation. On the other hand, it is easier for us to do the
research by using descriptive research method as it can get a lot of information
Retention Strategies and Job Performance
Page 34 of 114
through journals and researches that had done by other researchers. It is used to
describe the relationship among variables and not to make any conclusions.
Besides, descriptive research is less expensive and less time consuming than the
exploratory and casual research.
There are two types of business research paradigm, which are quantitative
research and qualitative research. We have adopted quantitative research method
upon our research study. Quantitative research is the most suitable tool to conduct
this research as it addresses the research objectives through the empirical
investigation that involve statistical analysis. According to Ticehurst and Veal
(2000), the result that obtained through questionnaire survey, secondary data or
observation is more reliable. The data is necessary to collect from a large number
of people and statistical analysis need to be done by using the computer software.
Numerical data is generated in the form of questionnaire survey upon our research
study. Questionnaires are distributed to the target respondents in order to get the
reliable data for our research study. We use numeric rating scales in our
questionnaire in order to measure the perception of our target respondents toward
the retention strategies and their job performance. Furthermore, quantitative
research is easier and less time consuming as compare to qualitative research
method.
3.2 Data Collection Methods
Within each general research approach, data collection has played an important
role. A researcher will determine one or more data collection methods which is
appropriate to be used in the study. Every single research is based on the data that
is analysed to gather information. Data can be collected through primary data or
secondary data. Primary data refers to the original data that has been gathered for
a particular purpose. It is a first-hand source of data which has not been published
before. Primary data is more valid compared to secondary data as the data has
never been modified. Secondary data is the data that people has already gathered.

Retention Strategies and Job Performance
Page 35 of 114
It is a data that is being reused. Secondary data is considered cheaper in cost and
faster in obtaining the data.
3.2.1 Primary Data
According to Sekaran and Bougie (2010), primary data is the information
obtained by the researcher in the first-hand on the area of interest for the
definite drive of the study. The sources of primary data comprise of
individuals, focus group, and so on. The most common methods to gain
primary data are distributing questionnaire, interview, observation, and
experiment research. The investigator will transform the data that being
collected into knowledge or information (Sekaran & Bougie, 2010). Our
group is using questionnaire to collect our primary data in our research
survey.
3.2.2 Secondary Data
Secondary data is the data obtained from a published source such as
journals, books, article, general websites, and magazine. The gathered data
is being processed by researcher for particular purposes and can only be
treated as references. This study is using relevant journals and articles as an
evidence to support the research. When there is difficult to obtain primary
data such as the respondents are not willing to provide information
regarding the study, secondary data will be the solution to conduct the study.
Secondary data can be less valid. However, it is understandable that it is
quite difficult to obtain primary data. By using the advancement of
technology, researcher can get the information through electronic media and
internet. It is relatively easy to access via online. This provides convenience
and standardized usage methods for all sources of secondary research.
However, there is disadvantage of using secondary data. As known, the
Retention Strategies and Job Performance
Page 36 of 114
originators of the primary research are mostly self-governed and controlled
by the marketer. Therefore, it is questionable for the secondary researcher
about the information gathered. Researchers need to take action in
evaluating the validity of the data provided.
For this research project, most of the secondary data are collected from
online journals, case study, books, and online articles. These are to provide
support in the research project which the data is obtained from Business
Research textbooks and online database. Those data is used as references to
enhance the validity and reliability of this research. Journals related to
retention of bank’s staff will be extracted from online database via UTAR
online database such as EBSCOhost, Lexis Malaysia, ProQuest, SAGE and
ScienceDirect. In addition, Google, the search engine has played a vital role
in collecting data. The information gathered will help in developing the
literature review and obtaining the information from respondents through
the questionnaire.
3.3 Sampling Design
3.3.1 Target Population
Zikmund, Babin, Carr and Griffin (2010) defined the population is the
researcher wishes to examine the entire group of people, events or things.
Besides, Zikmund et al. defined target population as the people who reply
the question which is considering to the essential characteristics of the
population. Based on the Malaysia Labor Force Survey Quarterly Report
2011, by referring to financial and insurance or takaful activities, there have
299,100 employees under this category. Hence, our target population for our
research is 299, 100 people.
Retention Strategies and Job Performance
Page 37 of 114
3.3.2 Sampling Frame and Sampling Location
Based on Zikmund et al. (2010), sampling is the process of choosing points
from the population so that the sample characteristics can be simplified from
the population. In this research, 300 sets of questionnaire have been
prepared and distribute to several types of Malaysia base’s banks in Perak
state. We choose to conduct our survey in Perak state because it is more
convenience for us to get the data within a short period.
3.3.3 Sampling Elements
In this research, the employees who are working in the banking industry are
the primary respondents of the survey. Targeted sample size of 300
respondents has been selected. 300 sets of questionnaire have been prepared
and distribute to several types of Malaysia base’s banks in Perak state. One
of the reasons to distribute the questionnaire in this way is to make the result
more reliable and reduce the occurrence of the research.
3.3.4 Sampling Technique
Base on Sekaran and Bougie (2010), there are basically having two types of
sampling techniques which are probability sampling method and non-
probability sampling method.
Probability sampling is where the component of the population are being
notice that having chances for being selected as sample. The types of
probability sampling such as simple random sampling, systematic sampling,
stratified random sampling, cluster sampling, area sampling, and double
sampling. Simple random sampling is used when the entire component in
population is having equal chance for being considered and selected as
sample. For systematic sampling, each of the nth components in the

Retention Strategies and Job Performance
Page 38 of 114
population is selected started from a random point in the sampling structure.
In term of stratified random sampling, initially, the population will been
allocate into meaningful segments. After that, sample is determined in
proportion to their original numbers in the population. For cluster sampling,
initially will determine the group that have heterogeneous members. After
that, each of the members of the group will be selected randomly as sample.
Area sampling is where practice cluster sampling at a specific area or
location. Double sampling are where study double time on the particular
sample or subset of the sample.
Besides that, in term of non-probability samples, the component in the
population unable to clarify have probability been select as sample. Non-
probability samples such as convenience sampling, judgment sampling and
quota sampling. Convenience sampling are where the most easily been
reached and available member are been selected as sample subjects. For
judgment sampling, the sample subjects are being chosen based on their
expertise, and knowledge in the subject studied. For quota sampling, the
sample subjects are being chosen randomly from targeted group based on
some predetermined number or quota (Sekaran & Bougie, 2010).
For our research, we are using probability sampling method-simple random
sampling technique to conduct our survey. We proceeding to the banks and
ask for the permission of the bank manager to conduct the survey and
randomly select the employees who are work in bank as our respondents.
We are using simple random sampling because it is easy to conduct and it is
free from human bias in conducting the survey.
3.3.5 Sampling Size
A total of 300 sets questionnaire had been distributed to the employees who
are working in banking industry in Perak state. 30 sets of questionnaire had
Retention Strategies and Job Performance
Page 39 of 114
been chosen for pilot testing to check the validity and accuracy of the
questions and identify the errors in the questions.
3.4 Research Instruments
To conduct our research, we are using close-ended questionnaire as instruments in
data collection. Initially, there are some research questions that have been
determined in order to come out with the questions that able to help us in gaining
information. It includes demographic characteristics of the target respondents such
as gender, age, education level, working duration and income level. Furthermore it
also includes relationship between job performance and retention strategies. For
instance, relationship between job performance and training, relationship between
job performance and career development, relationship between job performance
and working environment, relationship between job performance and reward
systems and relationship between job performance and fair treatment.
We are using close-ended format with Likert scale form for the questionnaires.
The Likert scale format is created to determine how strongly subjects agree or
disagree of the statement (Sekaran & Bougie, 2010). Furthermore, it is an optimal
from strongly disagree to strongly agree of the statement (Sekaran & Bougie,
2010).
3.4.1 Distribution Methods
According Sekaran and Bougie (2010) questionnaire are a well-organized
data collection tools when researcher clearly understand what is needed
and how to evaluate the variables of interest. Thus, effective questions
were created so that the quantitative data that been collected are more
reliable and relevant. Furthermore, we are using probability sampling for
this research. It means the component of the population are being notice
that having chances for being selected as sample subject. For this

Retention Strategies and Job Performance
Page 40 of 114
probability sampling, sample random sampling has been chosen as the
distribution methods. This is because sample random sampling has the
most litter bias and provides the most generalizability. It helps to generate
high complete large number of interviews quickly and also cost effectively.
In order to gather all the data from the target respondents, we are
physically visiting to bank door-by-door. We distribute the questionnaires
to the respondents by meeting them face to face. The overall process of the
distribution and collecting the questionnaires took a few hours’ time
because they are busying with their works, we cannot collect back the
questionnaires immediately even though it is only needed for few minutes
for them to answer the questions.
3.4.2 Questionnaire Design
The questionnaires involve of two parts, which are Section A and Section
B. In Section A, it requires the information regarding demographic
characteristic and personal information of the respondents. The questions
involved consist of gender, age, education level, working duration and
income level. For Section B, the questions are related to the dependent
variable (job performance) as well as the five independent variables
(training, career development, working environment, reward systems and
fair treatment) of the research. The questions have been divided into six
parts respectively for each variable in Section B. Each variable consists of
five questions. Section B is created specifically to evaluate how the five
retention strategies practices in organizational will be affect the job
performance.
3.4.3 Pilot Test
NC3Rs (2006) stated that a pilot, or feasibility study, is a small research
create to test logistics and gather information prior to a greater study in
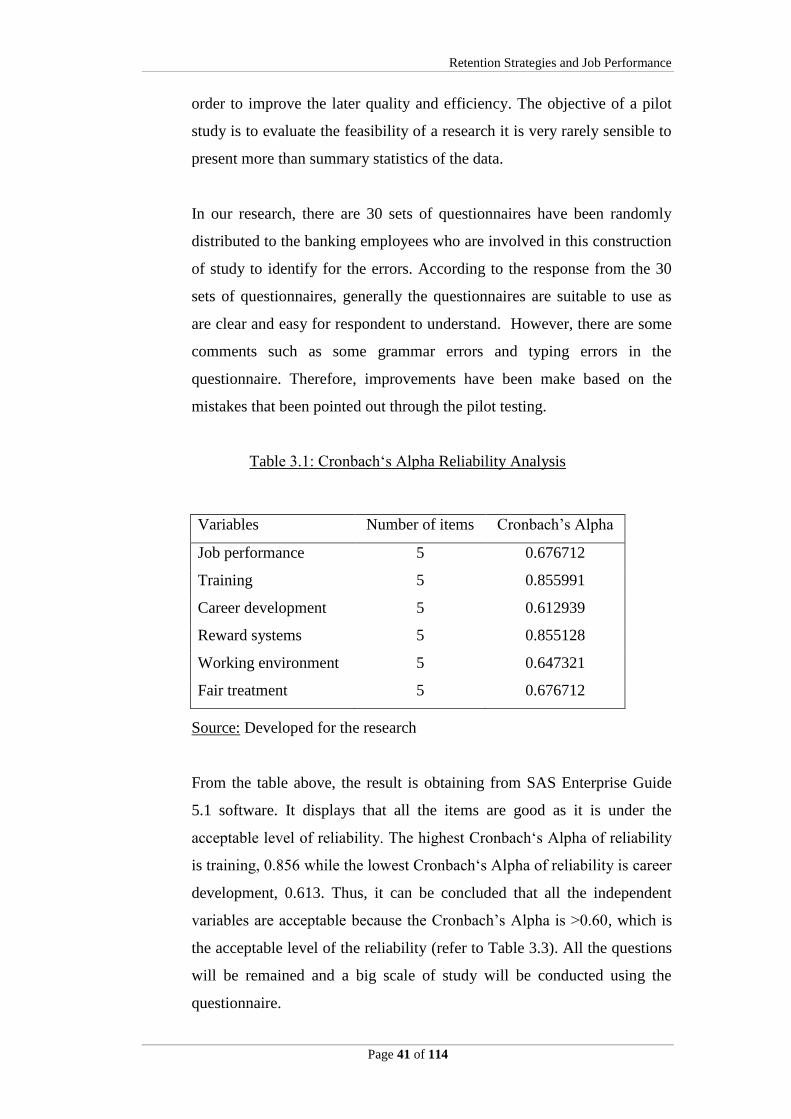
Retention Strategies and Job Performance
Page 41 of 114
order to improve the later quality and efficiency. The objective of a pilot
study is to evaluate the feasibility of a research it is very rarely sensible to
present more than summary statistics of the data.
In our research, there are 30 sets of questionnaires have been randomly
distributed to the banking employees who are involved in this construction
of study to identify for the errors. According to the response from the 30
sets of questionnaires, generally the questionnaires are suitable to use as
are clear and easy for respondent to understand. However, there are some
comments such as some grammar errors and typing errors in the
questionnaire. Therefore, improvements have been make based on the
mistakes that been pointed out through the pilot testing.
Table 3.1: Cronbach‘s Alpha Reliability Analysis
Source: Developed for the research
From the table above, the result is obtaining from SAS Enterprise Guide
5.1 software. It displays that all the items are good as it is under the
acceptable level of reliability. The highest Cronbach‘s Alpha of reliability
is training, 0.856 while the lowest Cronbach‘s Alpha of reliability is career
development, 0.613. Thus, it can be concluded that all the independent
variables are acceptable because the Cronbach’s Alpha is >0.60, which is
the acceptable level of the reliability (refer to Table 3.3). All the questions
will be remained and a big scale of study will be conducted using the
questionnaire.
Variables Number of items Cronbach’s Alpha
Job performance 5 0.676712
Training 5 0.855991
Career development 5 0.612939
Reward systems 5 0.855128
Working environment 5 0.647321
Fair treatment 5 0.676712
Retention Strategies and Job Performance
Page 42 of 114
3.5 Construct Measurement
According to Hair, Money, Page and Samouel (2007), measurement scale is a tool
that used to describe a question with the data of outcome. There are four levels of
measurement to analyse the data and from the data, conclusion is drawn. The
levels of measurement included nominal, ordinal, interval and ratio. In this study,
four of the measurement scales have been used.
A six-page survey questionnaire is conducted to examine the relationship between
retention strategies and job performance in Malaysia banking industry. The
questionnaire is divided into two sections which are Section A and Section B.
Section A consists of five demographic profile questions. Meanwhile, Section B
consists of thirty fixed-alternative questions which are divided into six parts. The
first part is about the dependent variable, whereas the next five parts are about the
independent variables.
3.5.1 Nominal Scale
Nominal scale is used for qualitative variables which the data is
categorized into discrete groups (Sekaran, 2003). There is no fixed
quantitative difference among the classifications. At first, the categories
are assigned with code numbers of 1 and 2 to determine the gender of an
individual (Sekaran, 2003). This scale has no order connection to other
variables. In this research study, nominal scale has been applied in the
demographic profile of Section A where respondent is asked to select their
gender (male or female).
3.5.2 Ordinal Scale
Ordinal scale is a rank-order observation. The categories have an inherent
order from more to less. The items are placed in rank order according to

Retention Strategies and Job Performance
Page 43 of 114
some criterion such as education level and preferences. Ordinal scale is
used on a statement of “greater than” or “less than” without stating the
range (Cooper and Schindler, 2008). Non-parametric statistics including
mode, median, and spearman rank order correlation are used in this scale
(Hair et al., 2007). In this study, ordinal scale has been applied in the
demographic profile of Section A where respondent is required to choose
their education level.
3.5.3 Interval Scale
Interval scale is used when the categories of a variable are legitimate
numbers and the distance is constant. The measurement is relatively
precise compared by using nominal or ordinal scale of measurement.
Interval scale has all the characteristics of nominal and ordinal scale. If the
categories are numbers, the numbers will have equal scale point between
them. Theoretically, interval scale does not have a true zero point (Hair et
al., 2007).
Besides, mean and standard deviation on variables are computed by using
interval scale (Sekaran, 2003). Even though the position of zero point is
not constant, but the zero point and unit of measurement are arbitrary.
Likert scale is one of the components in interval scale. It uses five point
scales where 1 represents strong disagree and 5 represents strongly agree.
It helps to strengthen the agreement of a statement.
In this study, Likert scale has been applied in the variables of Section B
where respondent is required to select either from 1 (strongly disagree) to
5 (strongly agree) for each statement in order to acquire information on the
relationship between retention strategies and job performance in Malaysia
Banking Industry.

Retention Strategies and Job Performance
Page 44 of 114
3.5.4 Ratio Scale
Ratio scale is the highest level of measurement where the variables
measured have all the characteristics of nominal, ordinal and interval scale.
Besides, this scale has a true zero point. The zero point refers to the
sensibility of multiplying and dividing the variables in each category. The
ratio data represents the actual capacity of a variable (Cooper & Schindler,
2008). Therefore, the use of ratio scale is legitimate as it compares the
intervals and rank objects according to magnitude. In this study, ratio scale
has been applied in the demographic profile of Section A where
respondent is required to choose their range of age, range of working
experience, and range of income level.
3.5.5 Summary of Questionnaire
Table 3.2 Summary of the Questionnaire
Variables Number of Items Items
Part A – Demographic
Gender 1 Part A – Item 1
Age 1 Part A – Item 2
Education Level 1 Part A – Item 3
Working Experience 1 Part A – Item 4
Income Level 1 Part A – Item 5
Part B
Job Performance 5 Part B – 1-5
Training 5 Part B – 6-10
Career Development 5 Part B – 11-15
Working Environment 5 Part B – 16-20
Reward Systems 5 Part B – 21-25
Fair Treatment 5 Part B – 26-30
Source: Developed for the research

Retention Strategies and Job Performance
Page 45 of 114
3.6 Data Processing
A description of data preparation processes comprises of questionnaire checking,
editing, coding, transcribing and data-cleaning (special treatments of data) that are
statistically adjusting the data before it is being analysed.
3.6.1 Questionnaire Checking
In this step, checking the questionnaire is to ensure there is completeness
and interviewing quality. This process begins after returned of the first set
of questionnaires in order to detect problem existed, and we able to take
immediate correction before a whole surveys to be conducted. Besides,
pilot test is performed to certify the validity and reliability of the
questionnaire.
3.6.2 Data Editing
Data editing is the second step of checking mistakes or error done by the
respondents during data collection undertakings. After the first process
being conducted, data editing will be implemented in order to review the
questionnaire in terms of accuracy and precision, because some of the
questionnaire collected may be incomplete or left unanswered by
respondents. In addition, missing or incomplete questionnaires will be
disregarded.
3.6.3 Data Coding
After the questionnaires are collected, coding can only be done. Data
coding is a process of assigning a code to each of the question whereby
these codes is being assigned with a specific numerical value to the

Retention Strategies and Job Performance
Page 46 of 114
response for each specific question in the survey instrument. For this
study, SAS Enterprise Guide is used for data coding. In coding phase, all
of the relevant data will be grouped into categories and numbers which
were assigned to each of the question.
Section A of the questionnaire is about respondent’s demographic
information. For instance in question 1, “male” is coded as “1” and
“female” is coded as “2”. Section B of the questionnaire is about the
measurement of dependent variable- job performance and independent
variables- training, career development, working environment, reward
systems and fair treatment, where the responses will be coded from 1 until
5 according to respondents’ level of agreement. For example, “strongly
disagree” is coded as “1” and “strongly agree” is coded as “5”.
3.6.4 Data Transcribing
Once the checking and editing of data are done, data transcribing is
performed. It is a process of transferring the coded data from
questionnaires into the computers through keypunching. In order to get an
accurate result for analysis purpose in this research study, we had to key
into the SAS Enterprise Guide, a computer software program.
3.6.5 Data Cleaning
Data cleaning involves of uniformity checking of conduct and treatment of
missing responses in order to ensure that the data have correctly recorded
from the data collection form. This process is more wide-ranging and more
detail than data editing. This step was the final procedure that the data has
to go through before it is proceed to data analysis phase.
Retention Strategies and Job Performance
Page 47 of 114
3.7 Data Analysis
After the data have been collected, researchers will analyse and interpret by using
SAS Enterprise Guide computer software program. There are three major
statistical techniques that were applied on this research study, which are
descriptive analysis, scale measurement and inferential analysis.
3.7.1 Descriptive Analysis
Descriptive analysis refers to the transformation of raw data into a form of
that is easy to comprehend and interpret, rearranging, ordering and also
manipulating data to provide descriptive information (Groenewald, 2010).
The most common descriptive techniques that been used are includes of
the calculating averages, percentage and frequency distributions. Based on
our study, the frequency of the respondents' includes of gender, age,
education level, working experience and income level. The descriptive
statistics will be presented through the forms of tables and charts in order
to show the frequencies and percentages from the calculation.
3.7.2 Scale Measurement
Reliability test is refers to the outcomes that are reliable over time and also
an accurate representation of total population under the research study
(Golafshani, 2003). The computer software program SAS Enterprise
Guide provides an internal consistency or reliability of the test items, with
the measurement of Cronbach’s Alpha. The higher the correlation among
the variables, the greater the alpha will be tested. According to Sekaran
(2003), Cronbach’s Alpha Technique is a common reliability coefficient
showing how well the items are positively correlated to one another. It
indicates a high level of reliability when the Cronbach’s Coefficient value
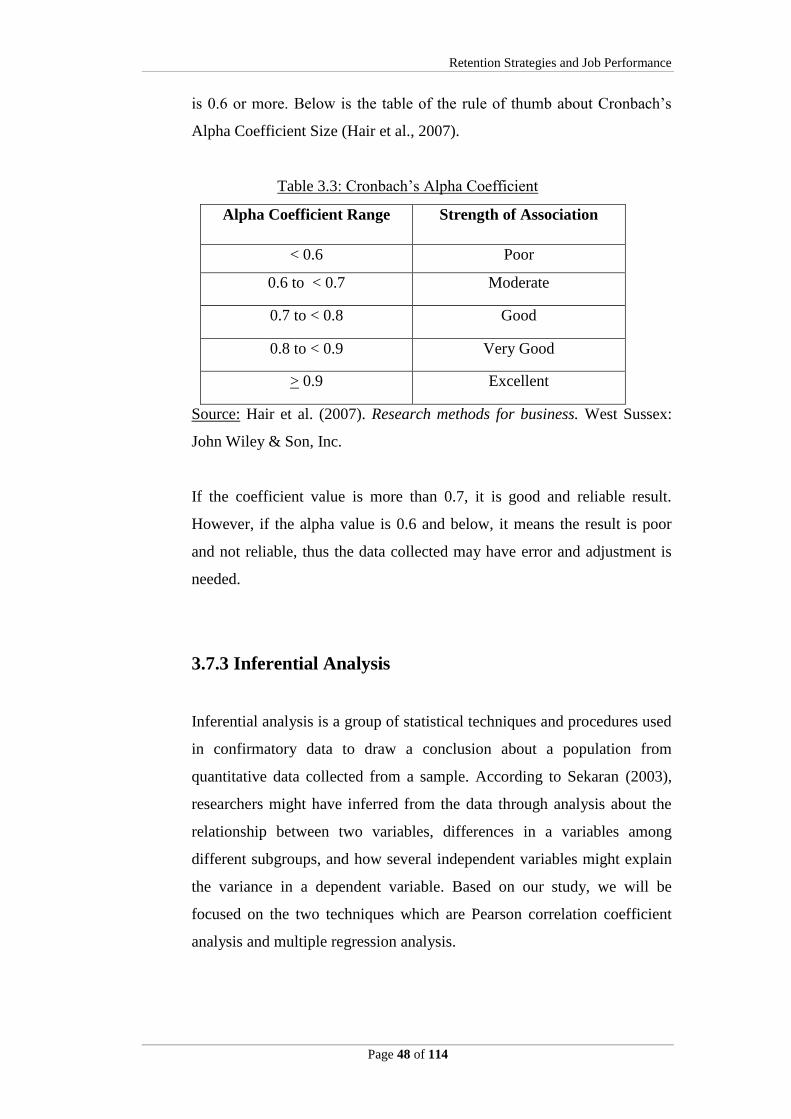
Retention Strategies and Job Performance
Page 48 of 114
is 0.6 or more. Below is the table of the rule of thumb about Cronbach’s
Alpha Coefficient Size (Hair et al., 2007).
Table 3.3: Cronbach’s Alpha Coefficient
Alpha Coefficient Range Strength of Association
< 0.6 Poor
0.6 to < 0.7 Moderate
0.7 to < 0.8 Good
0.8 to < 0.9 Very Good
> 0.9 Excellent
Source: Hair et al. (2007). Research methods for business. West Sussex:
John Wiley & Son, Inc.
If the coefficient value is more than 0.7, it is good and reliable result.
However, if the alpha value is 0.6 and below, it means the result is poor
and not reliable, thus the data collected may have error and adjustment is
needed.
3.7.3 Inferential Analysis
Inferential analysis is a group of statistical techniques and procedures used
in confirmatory data to draw a conclusion about a population from
quantitative data collected from a sample. According to Sekaran (2003),
researchers might have inferred from the data through analysis about the
relationship between two variables, differences in a variables among
different subgroups, and how several independent variables might explain
the variance in a dependent variable. Based on our study, we will be
focused on the two techniques which are Pearson correlation coefficient
analysis and multiple regression analysis.

Retention Strategies and Job Performance
Page 49 of 114
3.7.3.1 Pearson Correlation Coefficient Analysis
Pearson correlation coefficient refers to the measure of strength
and direction of linear relationship between independent and
dependent variable, with a test item R² which is a coefficient of
determinant that provides the information about the proportion of
variation in the dependent variable with the variation in the
independent variable. Besides, Pearson correlation coefficient
describes the degree and direction of those variables. It is values
from -1 to +1, which +0.1 indicates the variables are positively
correlated (increasing relationship). Whereas a value with -1
indicates that there is negative relationship. A zero value indicates
that the variables are not linear correlated to each other. There is a
strong correlation if the correlation coefficient is more than 0.70,
and is a weak correlation if the value is less than 0.40.
In our research study Pearson correlation analysis is used in order
to find a correlation between the independent and dependent
variable. Below is the table of the rule of thumb about correlation
coefficient size (Hair et al., 2007).
Table 3.4: Pearson Correlation Coefficient
Coefficient range Strength
+ 0.91 to + 1.0 Very Strong
+ 0.71 to + 0.90 High
+ 0.41 to + 0.70 Moderate
+ 0.21 to + 0.40 Small but definite relationship
0 to + 0.20 Slight, almost negligible
Source: Hair et al. (2007). Research methods for business. West
Sussex: John Wiley & Son, Inc

Retention Strategies and Job Performance
Page 50 of 114
3.7.3.2 Multiple Regressions Analysis
It is a set of independent variables describes a proportion of the
variance in a dependent variable which is used to measure the
strength association between two variables. The higher the
correlation, the more accurate of the prediction towards the results
of our research study. In associate to the multiple regressions is R2,
which indicates the percentage of variance of the dependent
variable can be explained by all the independent variables.
In our research study, the independent variables comprises of
training, career development, working environment, reward
systems and fair treatment. These independent variables might
significantly affect our dependent variable which is job
performance in banking industry. From this statistical technique,
we can make a clear standing point of which of these independent
variables gave the most accurate prediction of job performance.
3.8 Conclusion
As a conclusion, the research methodologies used in our research study are
descriptive method, quantitative research method, data collection method
including primary data (questionnaire) and secondary data, and sample random
sampling design method. Sample size of our survey is 300 people and the
sampling location of our survey is focus on Malaysia base banks in Perak state.
The research results that obtained from the 300 respondents will be further
discussed in Chapter 4.

Retention Strategies and Job Performance
Page 51 of 114
CHAPTER 4: RESEARCH RESULTS
4.0 Introduction
In this chapter, results are obtained by the way of data collection method from 300
sets of questionnaires that distribute to banks employees. The data are analyzed
and computed with the aid of SAS Enterprise Guide 5.1 software. The aim of this
chapter is to analyze and interpret the data that have been collected for our
research study. The results will be presented in tables and charts form in an
understandable manner. Several analyses have been done in this chapter. First, it
is started with descriptive analysis, which provided the analysis of respondent
demographic characteristics based on frequency analysis and the central
tendencies measurement of constructs. Next is the scale measurement that
provided the results of reliability analysis. This is followed by inferential analyses,
which are Pearson correlation coefficient analysis and multiple regression
analysis. Lastly, a summary is provided at the end of this chapter.
4.1 Descriptive Analysis
Descriptive analysis summarizes the sample by forming a basis quantitative
analysis with simple graphic analysis. In this section, 300 respondents’
demographic data have been analyzed by using frequency analysis. Besides, the
frequency of phenomena occurrence and the variability of the set of questions in
questionnaire also have been presented in this section.
4.1.1 Respondent Demographic Profile
In this section, the demographic characteristics data of 300 respondents
have been presented in table and chart form. They are gender, age,

Retention Strategies and Job Performance
Page 52 of 114
working duration, educational level and their salaries level in the
company.
4.1.1.1 Gender
Table 4.1: Gender
1=Male 2=Female
Gender Frequency Percent Cumulative
Frequency
Cumulative
Percent
1 104 34.67 104 34.67
2 196 65.33 300 100.00
Source: Developed for the research
Figure 4.1: Distribution of Gender
Source: Developed for the research
Table 4.1 shows the frequency of 300 respondents according to
gender in this study. There are 104 male respondents and 196
female respondents participated in the survey. Figure 4.1, the pie
chart demonstrates that 65.33% of respondents were female and
34.67% were male. From this, it indicates that female compose the
majority in the survey.
34.67%
65.33%
Gender
Male
Female

Retention Strategies and Job Performance
Page 53 of 114
4.1.1.2 Age
Table 4.2: Age
1=Below 26 years old 2=26-35 years old 3=36-45 years old
4=46-55 years old 5=Above 55 years old
Age Frequency Percent Cumulative
Frequency
Cumulative
Percent
1 56 18.67 56 18.67
2 60 20.00 116 38.67
3 118 39.33 234 78.00
4 66 22.00 300 100.00
5 0 0.00 0 0.00
Source: Developed for the research
Figure 4.2: Distribution of Age
Source: Developed for the research
Table 4.2 and Figure 4.2 indicate the age group of respondents in
the survey. The largest age group of respondents in this survey was
between 36 – 45 years old, which consisted of 118 respondents out
of the 300 respondents. The second highest age group was
between 46 – 55 years old, which consisted of 66 respondents. It
was followed by 60 respondents that age between 26 – 35 years
old, and 56 respondents were below 26 years old. None of the
56 60
118
66
0 0
20
40
60
80
100
120
140
Below 26
years old
26-35 years
old
36-45 years
old
46-55 years
old
Above 55
years old
Age

Retention Strategies and Job Performance
Page 54 of 114
respondents were fall under age group that above 55 years old in
this survey.
4.1.1.3 Education Level
Table 4.3: Education Level
1=Certificate 2=Diploma 3=Degree 4=Master 5=PHD 6=Others
Educatio
n Level
Frequency Percent Cumulative
Frequency
Cumulativ
e Percent
1 18 6.00 18 6.00
2 104 34.67 122 40.67
3 128 42.67 250 83.33
4 18 6.00 268 89.33
5 0 0.00 0 0.00
6 32 10.67 300 100.00
Source: Developed for the research
Figure 4.3: Distribution of Education Level
Source: Developed for the research
18
104
128
18
0
32
0
20
40
60
80
100
120
140
Certificate Diploma Degree Master PhD Others
Education Level

Retention Strategies and Job Performance
Page 55 of 114
Table 4.3 and Figure 4.3 show the education level of 300
respondents. Majority of the respondents were degree holders. It
consisted of 42.67%, which were 128 respondents out of 300
respondents in the survey. It was then followed by diploma holders
that consisted of 104 respondents which were 34.67%. 10.67% of
the respondents, that was 32 respondents were fall under other
educational level category that including STPM and SPM.
However, the percentages of respondents who hold certificate and
master level were the same; they were 6% which consisted of 18
respondents for each level. There was no PhD holder participated
in the survey.
4.1.1.4 Working Duration
Table 4.4: Working Duration
1=Below 1 year 2=1-5 years 3=6-10 years 4=11-15 years 5=16-
20 years 6=Above 20 years
Working
Duration
Frequency Percent Cumulative
Frequency
Cumulative
Percent
1 18 6.00 18 6.00
2 66 22.00 84 28.00
3 44 14.67 128 42.67
4 32 10.67 160 53.33
5 92 30.67 252 84.00
6 48 16.00 300 100.00
Source: Developed for the research

Retention Strategies and Job Performance
Page 56 of 114
Figure 4.4: Distribution of Working Duration
Source: Developed for the research
Table 4.4 and Figure 4.4 show the years of working experiences of
the respondents in the company. From the data that we had
collected, it showed that there were 92 respondents or 30.67% of
the respondents were working between 16 to 20 years in the
company. The second highest percentage of the respondents
working duration was 1 to 5 years, which was 22% that consisted
of 66 respondents. It was followed by the respondents that working
above 20 years in the company, which was 16% or 48 respondents.
Next, there were 44 out of 300 respondents were working for 6 to
10 years in the company and 32 out of 300 respondents were
working for 11 to 15 years. However, the least respondents’
working experiences in the company were below 1 year, which was
only 6% or 18 respondents.
4.1.1.5 Income Level
Table 4.5: Monthly Income Level
1=Below RM2000 2=RM2001-RM5000 3=RM5001-RM8000
4=RM8001-RM11000 5=Above RM11000
18
66
44
32
92
48
0
10
20
30
40
50
60
70
80
90
100
Below 1
year
1-5 years 6-10 years 11-15 years 16-20 years Above 20
years
Working Duration
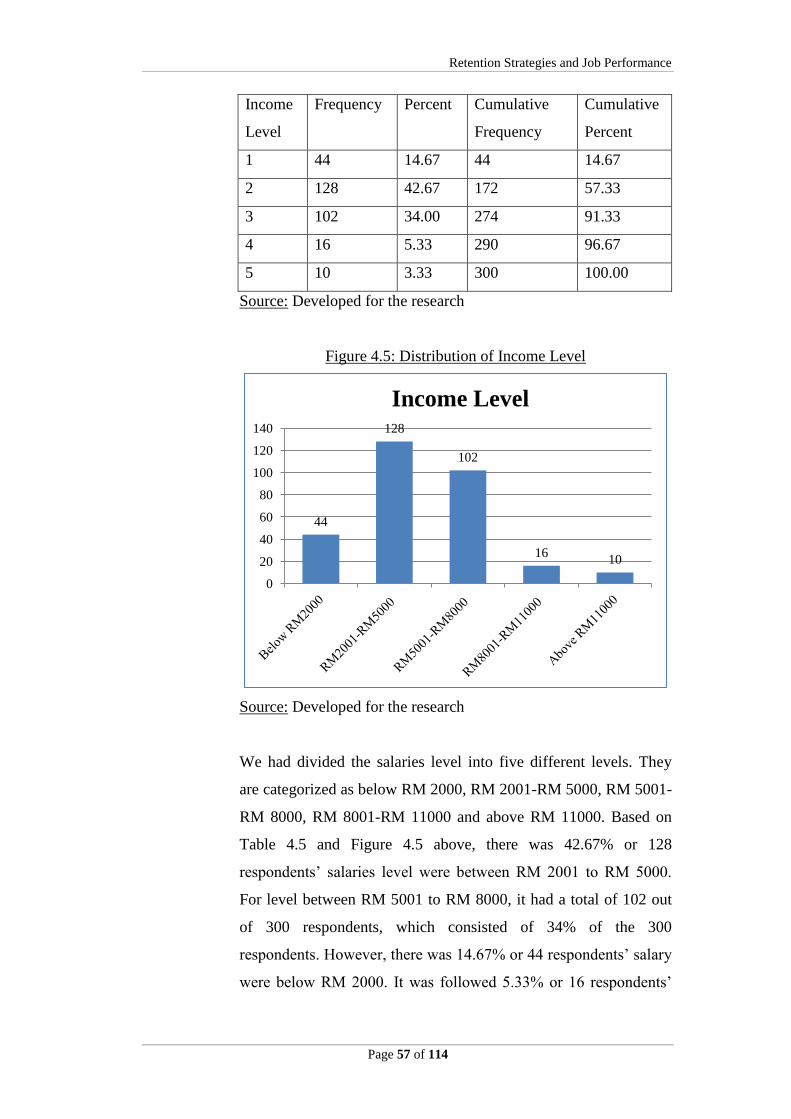
Retention Strategies and Job Performance
Page 57 of 114
Income
Level
Frequency Percent Cumulative
Frequency
Cumulative
Percent
1 44 14.67 44 14.67
2 128 42.67 172 57.33
3 102 34.00 274 91.33
4 16 5.33 290 96.67
5 10 3.33 300 100.00
Source: Developed for the research
Figure 4.5: Distribution of Income Level
Source: Developed for the research
We had divided the salaries level into five different levels. They
are categorized as below RM 2000, RM 2001-RM 5000, RM 5001-
RM 8000, RM 8001-RM 11000 and above RM 11000. Based on
Table 4.5 and Figure 4.5 above, there was 42.67% or 128
respondents’ salaries level were between RM 2001 to RM 5000.
For level between RM 5001 to RM 8000, it had a total of 102 out
of 300 respondents, which consisted of 34% of the 300
respondents. However, there was 14.67% or 44 respondents’ salary
were below RM 2000. It was followed 5.33% or 16 respondents’
44
128
102
16 10
0
20
40
60
80
100
120
140
Income Level

Retention Strategies and Job Performance
Page 58 of 114
salary were between RM 8001 to RM 11000. The least was 3.33%
or 10 respondents’ salaries that were above RM 11000.
4.1.2 Central Tendencies Measurement of Constructs
In this section, central tendencies of constructs have been measured. The
mean and standard deviation of the variables have been generated by SAS
software. The constructs of questions have been presented in table form to
show the mean and standard deviation of each question for each variable.
There are a total of one dependent variable and five independent variables
in the questionnaire.
Table 4.6: Descriptive Statistics of Job Performance
Statement N Mean Std.
Deviation
Rank
JP1:
I always complete projects and
works according to deadlines.
300 4.53333 0.53838 1
JP2:
I always manage information
and data effectively.
300 4.36667 0.59447 3
JP3:
I work without supervision
when necessary.
300 4.26000 0.69811 4
JP4:
I effectively collaborate with
other department members
when necessary.
300 4.37333 0.52428 2
JP5:
I take appropriate action on
problems when necessary.
300 4.36667 0.59447 3
Source: Developed for the research

Retention Strategies and Job Performance
Page 59 of 114
Table 4.6 consisted of five statements for job performance. “I always
complete projects and works according to deadlines” had the highest mean
score of 4.53333 and its standard deviation was 0.53838. The second
highest mean score was “I effectively collaborate with other department
members when necessary” with a mean score of 4.37333 and its standard
deviation was 0.52428. Thirdly, statement of “I always manage
information and data effectively” and “I take appropriate action on
problems when necessary” have the same mean score of 4.36667 and
standard deviation 0.59447. “I work without supervision when necessary”
statement was ranked the last with a mean score of 4.26 and its standard
deviation was 0.69811.
Table 4.7: Descriptive Statistics of Training
Statement N Mean Std.
Deviation
Rank
T1:
I am satisfied by the training
program that I received at the
company.
300 4.24000 0.57460 1
T2:
I feel that training provided by
my organization helps me to
understand the goals of my
department.
300 4.16000 0.51829 4
T3:
I become more committed
toward my job after getting
training.
300 4.20667 0.59312 2
T4:
I become more productive after
receiving training.
300 4.10667 0.51915 5
T5:
After received training, my
300 4.20000 0.60100 3

Retention Strategies and Job Performance
Page 60 of 114
attitude/behaviour becomes
willing to accept more
challenging assignments.
Source: Developed for the research
Table 4.7 shows the ranking of the five statements for training. “I am
satisfied by the training program that I received at the company” had the
highest mean score of 4.24 and its standard deviation was 0.5746. The
second highest was “I become more committed toward my job after
getting training” with a mean score of 4.20667 and its standard deviation
was 0.59312. Then it is followed by the statement of “After received
training, my attitude/behaviour becomes willing to accept more
challenging assignments” with a mean score of 4.20 and standard
deviation was 0.601. The fourth is “I feel that training provided by my
organization helps me to understand the goals of my department” with
mean score of 4.16 and its standard deviation was 0.51829. “I become
more productive after receiving training” had the lowest mean score,
which was 4.10667 and its standard deviation was 0.51915.
Table 4.8: Descriptive Statistics of Career Development
Statement N Mean Std.
Deviation
Rank
CD1:
I am aware of how current
social and labour market trends
may impact my career.
300 4.30000 0.59821 2
CD2:
I know that how to access and
who to consult regarding
information about career and
training alternatives in my
field.
300 4.15333 0.67181 4

Retention Strategies and Job Performance
Page 61 of 114
CD3:
I am systematically trying to
improve the skills I need to
success in my career.
300 4.26667 0.59728 3
CD4:
I want my career to benefit me
in the future.
300 4.30667 0.57770 1
CD5:
I do not think much about the
way my career might expand
10 years from now.
300 4.13333 0.71922 5
Source: Developed for the research
From table 4.8, among the statements of career development, it shows that
“I want my career to benefit me in the future” had the highest mean score
of 4.30667 and its standard deviation was 0.5777. “I am aware of how
current social and labour market trends may impact my career” was the
second highest with mean score of 4.30 and standard deviation of 0.59821.
“I am systematically trying to improve the skills I need to success in my
career” was the third highest with mean score of 4.26667 and standard
deviation of 0.59728. After that, it was followed by “I know that how to
access and who to consult regarding information about career and training
alternatives in my field”, which had a mean score of 4.15333 and standard
deviation of 0.67181. “I do not think much about the way my career might
expand 10 years from now” was ranked at the last with its mean score of
4.13333 and its standard deviation was 0.71922.
Table 4.9: Descriptive Statistics of Working Environment
Statement N Mean Std.
Deviation
Rank
WE1:
I am satisfied with the physical
working conditions.
300 4.33667 0.90889 1
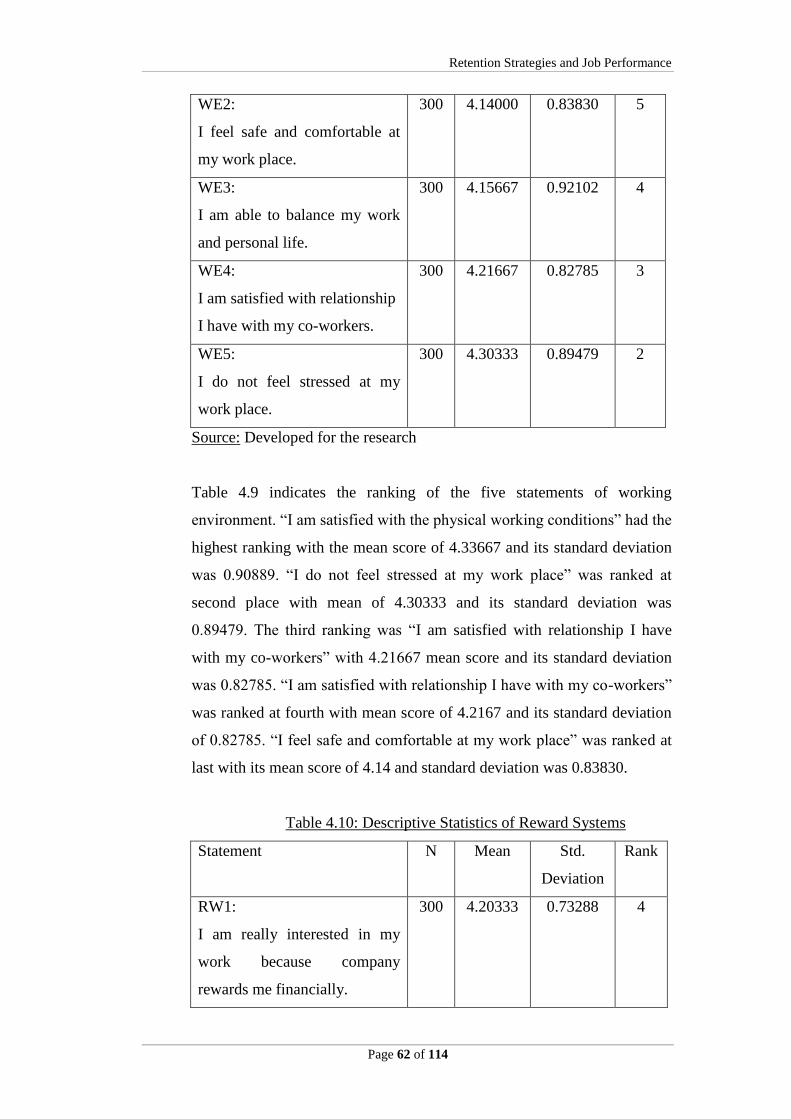
Retention Strategies and Job Performance
Page 62 of 114
WE2:
I feel safe and comfortable at
my work place.
300 4.14000 0.83830 5
WE3:
I am able to balance my work
and personal life.
300 4.15667 0.92102 4
WE4:
I am satisfied with relationship
I have with my co-workers.
300 4.21667 0.82785 3
WE5:
I do not feel stressed at my
work place.
300 4.30333 0.89479 2
Source: Developed for the research
Table 4.9 indicates the ranking of the five statements of working
environment. “I am satisfied with the physical working conditions” had the
highest ranking with the mean score of 4.33667 and its standard deviation
was 0.90889. “I do not feel stressed at my work place” was ranked at
second place with mean of 4.30333 and its standard deviation was
0.89479. The third ranking was “I am satisfied with relationship I have
with my co-workers” with 4.21667 mean score and its standard deviation
was 0.82785. “I am satisfied with relationship I have with my co-workers”
was ranked at fourth with mean score of 4.2167 and its standard deviation
of 0.82785. “I feel safe and comfortable at my work place” was ranked at
last with its mean score of 4.14 and standard deviation was 0.83830.
Table 4.10: Descriptive Statistics of Reward Systems
Statement N Mean Std.
Deviation
Rank
RW1:
I am really interested in my
work because company
rewards me financially.
300 4.20333 0.73288 4

Retention Strategies and Job Performance
Page 63 of 114
RW2:
I believe employees perform
well when reward is given
appropriately.
300 4.33000 0.60192 3
RW3:
Promoting the most talented
people will increase the
performance level of
employee.
300 4.35333 0.61895 2
RW4:
Higher opportunity for
employees to be promoted will
affect the performance of the
employee.
300 4.36333 0.62124 1
RW5:
Empowered employees to
make decisions at workplaces
will increase the level of
performance.
300 4.16333 0.58119 5
Source: Developed for the research
Table 4.10 shows the ranking for statements of reward systems. “Higher
opportunity for employees to be promoted will affect the performance of
the employee” had the highest mean score of 4.36333 and its standard
deviation was 0.62124. Second was “Promoting the most talented people
will increase the performance level of employee” which had a mean score
of 4.35333 and standard deviation of 0.61895. Thirdly was “I believe
employees perform well when reward is given appropriately”, it had a
mean score of 4.33 and standard deviation of 0.60192. “I am really
interested in my work because company rewards me financially” was
ranked at the fourth with mean score of 4.20333 and standard deviation of
0.73288. The last statement was “Empowered employees to make
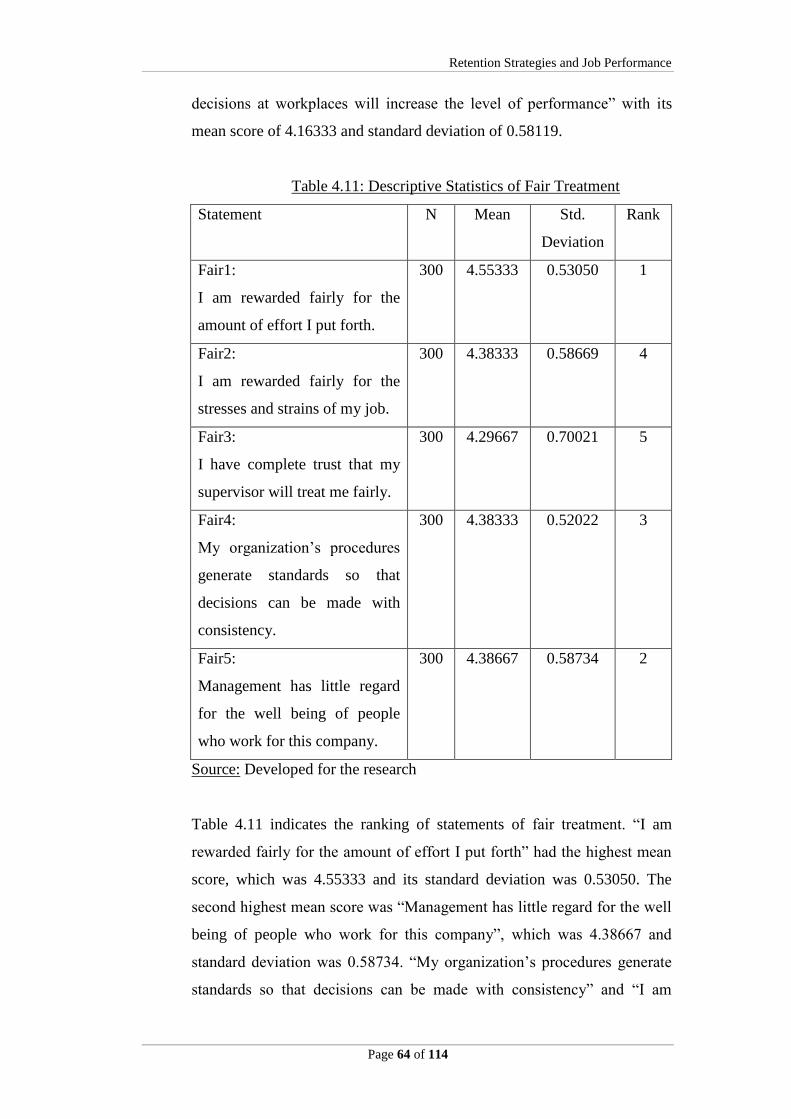
Retention Strategies and Job Performance
Page 64 of 114
decisions at workplaces will increase the level of performance” with its
mean score of 4.16333 and standard deviation of 0.58119.
Table 4.11: Descriptive Statistics of Fair Treatment
Statement N Mean Std.
Deviation
Rank
Fair1:
I am rewarded fairly for the
amount of effort I put forth.
300 4.55333 0.53050 1
Fair2:
I am rewarded fairly for the
stresses and strains of my job.
300 4.38333 0.58669 4
Fair3:
I have complete trust that my
supervisor will treat me fairly.
300 4.29667 0.70021 5
Fair4:
My organization’s procedures
generate standards so that
decisions can be made with
consistency.
300 4.38333 0.52022 3
Fair5:
Management has little regard
for the well being of people
who work for this company.
300 4.38667 0.58734 2
Source: Developed for the research
Table 4.11 indicates the ranking of statements of fair treatment. “I am
rewarded fairly for the amount of effort I put forth” had the highest mean
score, which was 4.55333 and its standard deviation was 0.53050. The
second highest mean score was “Management has little regard for the well
being of people who work for this company”, which was 4.38667 and
standard deviation was 0.58734. “My organization’s procedures generate
standards so that decisions can be made with consistency” and “I am

Retention Strategies and Job Performance
Page 65 of 114
rewarded fairly for the stresses and strains of my job” have the same mean
score of 4.38333. However, the standard deviations of these two
statements were different. “My organization’s procedures generate
standards so that decisions can be made with consistency” had a lower
standard deviation as compare to “I am rewarded fairly for the stresses and
strains of my job”. The last statement was “I have complete trust that my
supervisor will treat me fairly” with the lowest mean score of 4.29667 and
its standard deviation was 0.70021.
4.2 Scale measurement
In this section, we were using Cronbach’s Alpha coefficient to examine the
internal reliability of the variables. Cronbach’s Alpha coefficient was being used
to measure the consistency of a set of items correlated with each other as a group.
Based on the rule of thumb of Cronbach’s Alpha, coefficient of 0.60 is the
acceptable level for the reliability test. Coefficient ranges that lower than 0.60 is
consider as poor reliability. The range of 0.60 to below 0.70 is in moderate level,
0.70 and below 0.80 is consider as good reliability, 0.80 and below 0.90 is deem
to be a very good reliability and the range that more and equal to 0.90 is an
excellent association. Section 4.2.1 indicated the reliability of the variables in our
research. They are job performance, training, career development, working
environment, reward systems and fair treatment.
4.2.1 Reliability Test
Table 4.12: Reliability Statistics
Variables Number of items Cronbach’s Alpha
Job performance 5 0.707157
Training 5 0.834886
Career development 5 0.696655
Working environment 5 0.856257
Reward systems 5 0.665447
Fair treatment 5 0.694501
Source: Developed for the research

Retention Strategies and Job Performance
Page 66 of 114
Table 4.12 shows the result of the reliability test for each of the variables
that used in our research study. There are five items for each variable. The
coefficient for the five items in job performance was 0.707157. It was
slightly more than 0.70, it has a good internal consistency. The alpha
coefficient of training and working environment were 0.834886 and
0.856257 respectively. These two variables have the same level of
reliability, which they have a very good internal consistency. However, the
alpha coefficient of career development, reward systems and fair treatment
were 0.696655, 0.665447 and 0.694501 respectively. These three variables
were in the same range of alpha coefficient that is 0.60 to below 0.70, they
have moderate internal consistency.
4.3 Inferential Analyses
Inferential analyses are being used to make the judgment about the population
base on the 300 sample size. Pearson correlation and multiple regression were
used to measure the correlation between the independent variables and dependent
variable in this section.
4.3.1 Pearson Correlation Coefficient Analysis
Pearson correlation analysis determines the relationship between two
variables based on the degree of covariance between them. Pearson
correlation coefficient is used to measure the relationship between each
independent variable with the dependent variable in our study. A higher
values of the correlation coefficient, the stronger the relationship between
the two variables (refer to Table 3.4).
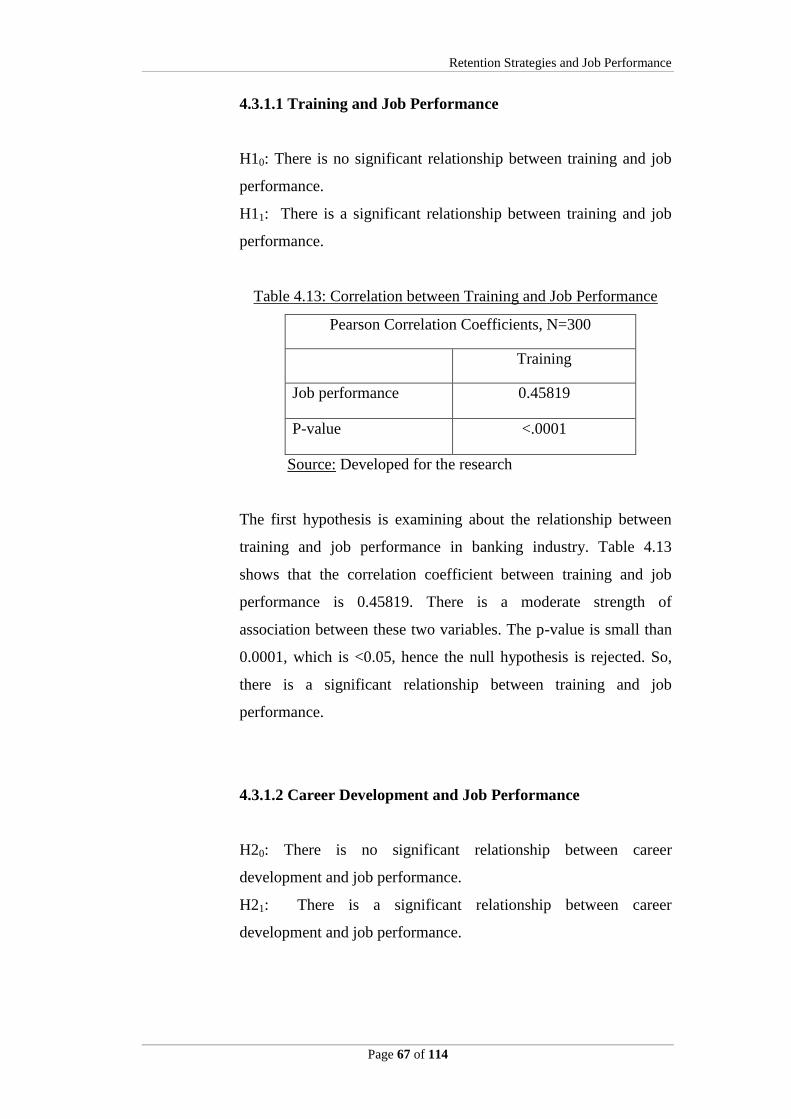
Retention Strategies and Job Performance
Page 67 of 114
4.3.1.1 Training and Job Performance
H10: There is no significant relationship between training and job
performance.
H11: There is a significant relationship between training and job
performance.
Table 4.13: Correlation between Training and Job Performance
Pearson Correlation Coefficients, N=300
Training
Job performance 0.45819
P-value <.0001
Source: Developed for the research
The first hypothesis is examining about the relationship between
training and job performance in banking industry. Table 4.13
shows that the correlation coefficient between training and job
performance is 0.45819. There is a moderate strength of
association between these two variables. The p-value is small than
0.0001, which is <0.05, hence the null hypothesis is rejected. So,
there is a significant relationship between training and job
performance.
4.3.1.2 Career Development and Job Performance
H20: There is no significant relationship between career
development and job performance.
H21: There is a significant relationship between career
development and job performance.

Retention Strategies and Job Performance
Page 68 of 114
Table 4.14: Correlation between Career Development and Job
Performance
Pearson Correlation Coefficients, N=300
Career development
Job performance 0.49224
P-value <.0001
Source: Developed for the research
The second hypothesis is examining about the relationship between
career development and job performance in banking industry.
Table 4.14 shows that the correlation coefficient between these two
variables is 0.49224 with a p-value of less than 0.0001. There is a
moderate strength of correlation between these two variables. The
null hypothesis is rejected since p-value is less than 0.05. Thus,
there is a significant relationship between career development and
job performance.
4.3.1.3 Working Environment and Job Performance
H30: There is no significant relationship between working
environment and job performance.
H31: There is a significant relationship between working
environment and job performance
Table 4.15: Correlation between Working Environment and Job
Performance
Source: Developed for the research
Pearson Correlation Coefficients, N=300
Working environment
Job performance 0.29711
P-value <.0001
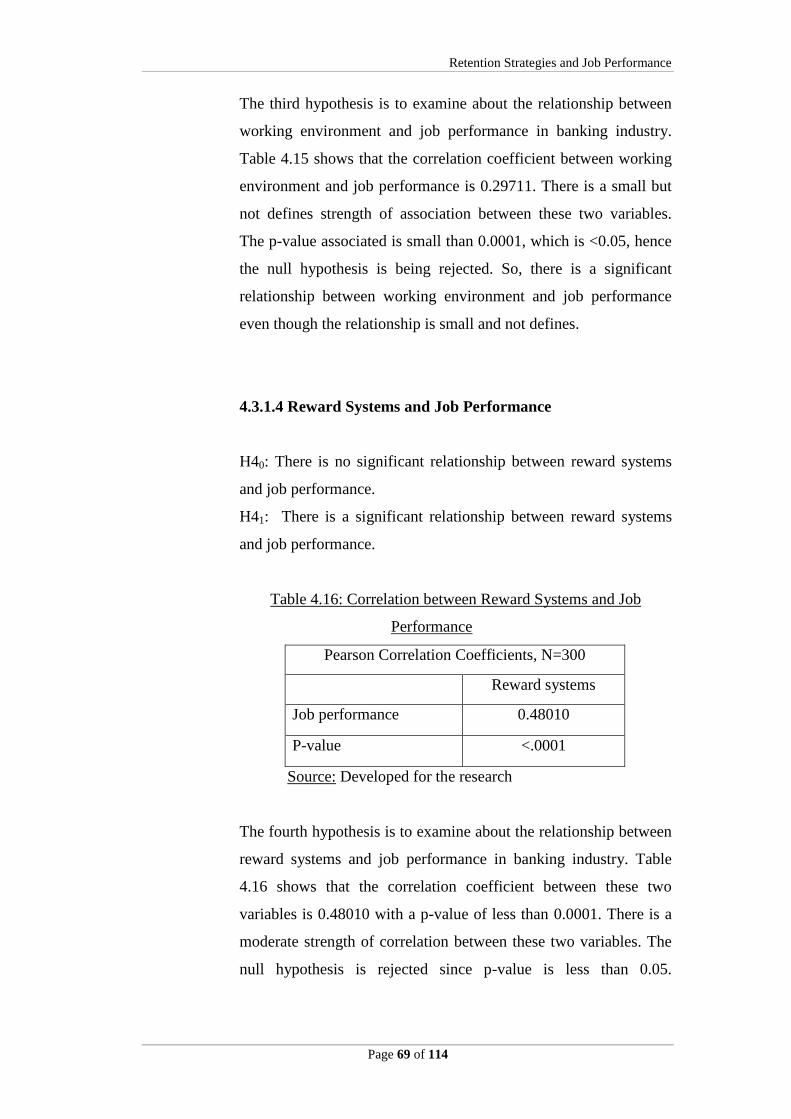
Retention Strategies and Job Performance
Page 69 of 114
The third hypothesis is to examine about the relationship between
working environment and job performance in banking industry.
Table 4.15 shows that the correlation coefficient between working
environment and job performance is 0.29711. There is a small but
not defines strength of association between these two variables.
The p-value associated is small than 0.0001, which is <0.05, hence
the null hypothesis is being rejected. So, there is a significant
relationship between working environment and job performance
even though the relationship is small and not defines.
4.3.1.4 Reward Systems and Job Performance
H40: There is no significant relationship between reward systems
and job performance.
H41: There is a significant relationship between reward systems
and job performance.
Table 4.16: Correlation between Reward Systems and Job
Performance
Pearson Correlation Coefficients, N=300
Reward systems
Job performance 0.48010
P-value <.0001
Source: Developed for the research
The fourth hypothesis is to examine about the relationship between
reward systems and job performance in banking industry. Table
4.16 shows that the correlation coefficient between these two
variables is 0.48010 with a p-value of less than 0.0001. There is a
moderate strength of correlation between these two variables. The
null hypothesis is rejected since p-value is less than 0.05.

Retention Strategies and Job Performance
Page 70 of 114
Therefore, there is a significant relationship between reward
systems and job performance.
4.3.1.5 Fair Treatment and Job Performance
H50: There is no significant relationship between fair treatment and
job performance.
H51: There is a significant relationship between fair treatment and
job performance.
Table 4.17: Correlation between Fair Treatment and Job
Performance
Pearson Correlation Coefficients, N=300
Fair treatment
Job performance 0.24178
P-value <.0001
Source: Developed for the research
The fifth hypothesis is to examine the relationship between fair
treatment and job performance in banking industry. Table 4.17
shows that the correlation coefficient between working
environment and job performance is 0.24178. There is a small but
not defines strength of association between these two variables.
The p-value associated is small than 0.0001, which is <0.05, hence
the null hypothesis is being rejected. So, there is a significant
relationship between working environment and job performance
even though the relationship is small and not defines.
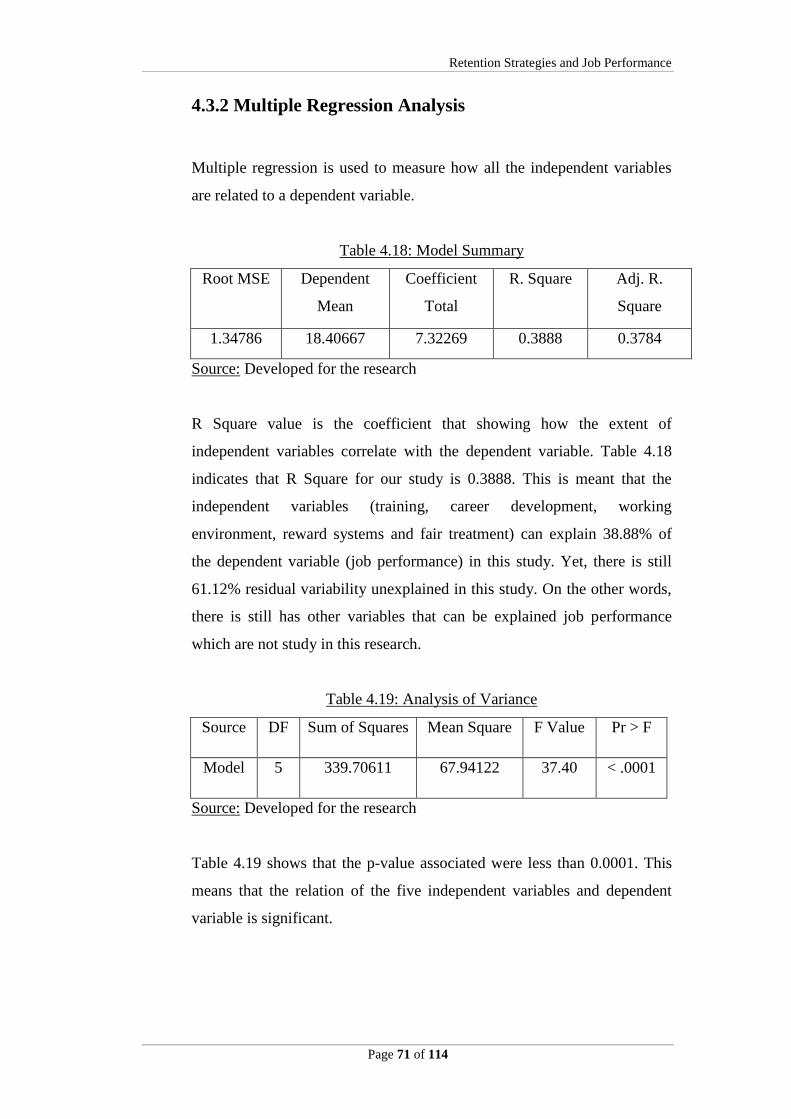
Retention Strategies and Job Performance
Page 71 of 114
4.3.2 Multiple Regression Analysis
Multiple regression is used to measure how all the independent variables
are related to a dependent variable.
Table 4.18: Model Summary
Root MSE Dependent
Mean
Coefficient
Total
R. Square Adj. R.
Square
1.34786 18.40667 7.32269 0.3888 0.3784
Source: Developed for the research
R Square value is the coefficient that showing how the extent of
independent variables correlate with the dependent variable. Table 4.18
indicates that R Square for our study is 0.3888. This is meant that the
independent variables (training, career development, working
environment, reward systems and fair treatment) can explain 38.88% of
the dependent variable (job performance) in this study. Yet, there is still
61.12% residual variability unexplained in this study. On the other words,
there is still has other variables that can be explained job performance
which are not study in this research.
Table 4.19: Analysis of Variance
Source DF Sum of Squares Mean Square F Value Pr > F
Model 5 339.70611 67.94122 37.40 < .0001
Source: Developed for the research
Table 4.19 shows that the p-value associated were less than 0.0001. This
means that the relation of the five independent variables and dependent
variable is significant.

Retention Strategies and Job Performance
Page 72 of 114
Table 4.20: Parameter Estimates
Variable DF Parameter
Estimate
Standard
Error
T
Value
Pr > |t| Ranking
Intercept 1 3.12592 1.21237 2.58 0.0104
Training 1 0.23033 0.04956 4.65 < .0001 1
Career
development
1 0.18071 0.05714 3.16 0.0017 3
Working
environment
1 0.07703 0.02877 2.68 0.0078 5
Reward
systems
1 0.20902 0.05258 3.98 < .0001 2
Fair treatment 1 0.15505 0.04723 3.28 0.0012 4
Source: Developed for the research
Table 4.20 indicates the p-value and the parameter estimation of the five
independent variables with dependent variable. P-value associated with the
t-test for each of the independent variables was less than 0.05. This
indicated that the relationship between all the independent variables with
dependent variable were significant in this study. Multiple regression
estimates a linear equation to indicate the relationship of all the
independent variables toward the dependent variable.
Regression equation is formed as follow:
Y = a + b1 (X1) + b2 (X2) + b3 (X3) + b4 (X4) + b5 (X5)
Y = Job performance (Dependent variable)
X1 = Training (Independent variable)
X2 = Career development
X3 = Working environment
X4 = Reward systems
X5 = Fair treatment
a = constant
b = Regression coefficient of Xi i = 1, 2, 3, 4, 5
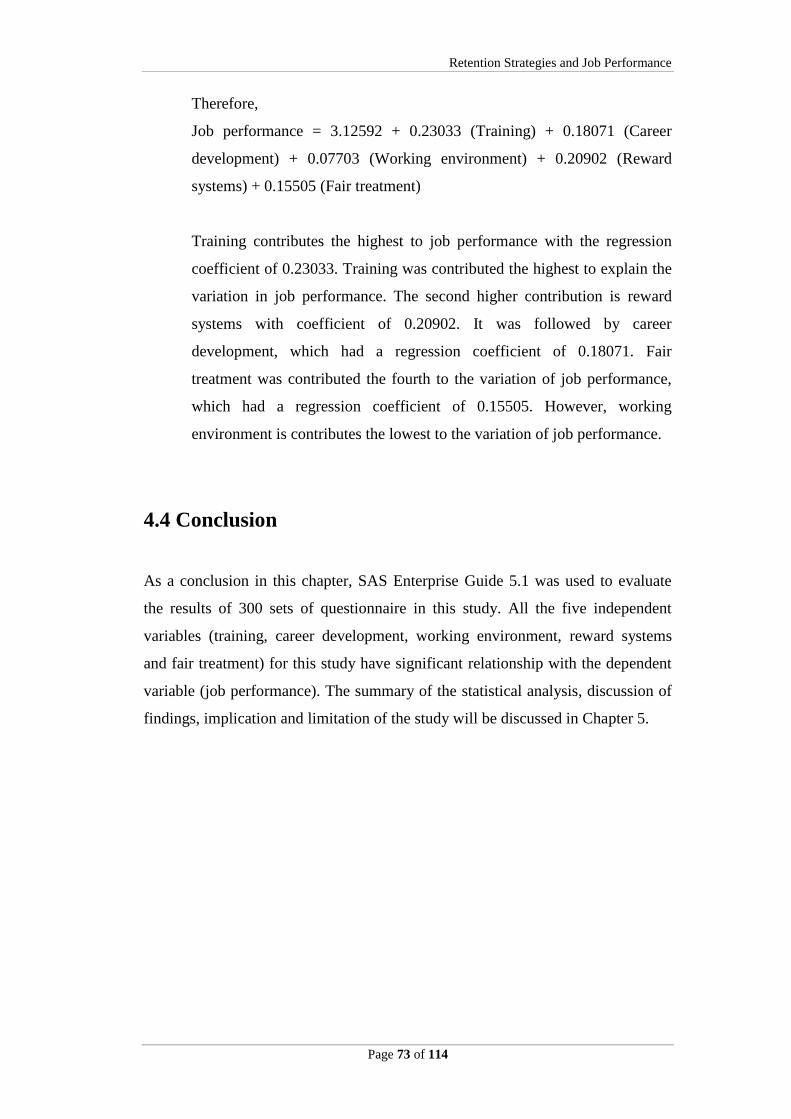
Retention Strategies and Job Performance
Page 73 of 114
Therefore,
Job performance = 3.12592 + 0.23033 (Training) + 0.18071 (Career
development) + 0.07703 (Working environment) + 0.20902 (Reward
systems) + 0.15505 (Fair treatment)
Training contributes the highest to job performance with the regression
coefficient of 0.23033. Training was contributed the highest to explain the
variation in job performance. The second higher contribution is reward
systems with coefficient of 0.20902. It was followed by career
development, which had a regression coefficient of 0.18071. Fair
treatment was contributed the fourth to the variation of job performance,
which had a regression coefficient of 0.15505. However, working
environment is contributes the lowest to the variation of job performance.
4.4 Conclusion
As a conclusion in this chapter, SAS Enterprise Guide 5.1 was used to evaluate
the results of 300 sets of questionnaire in this study. All the five independent
variables (training, career development, working environment, reward systems
and fair treatment) for this study have significant relationship with the dependent
variable (job performance). The summary of the statistical analysis, discussion of
findings, implication and limitation of the study will be discussed in Chapter 5.

Retention Strategies and Job Performance
Page 74 of 114
CHAPTER 5: DISCUSSION AND CONCLUSION
5.0 Introduction
In this final chapter of the research study, it highlights the discussion, conclusion
and implication which had been analyzed in previous chapter (chapter four), by
providing a summary view of both descriptive and inferential analyses, discussion
on the major findings to validate the research objectives and hypotheses, as well
as limitations and recommendations for future research before we end the chapter
with the conclusion of our research. In fact, limitations and recommendations of
the study can help the organization to identify and understand some of the key
areas in order to attain more comprehensive and defined of the future research.
5.1 Summary of Statistical Analyses
5.1.1 Descriptive Analyses
Base on chapter 4, demographic analysis is used to show an illustration of
respondent’s characteristics. From the demographic information, within
the sample of 300 respondents, in the term of gender, there are 34.67% of
male and 65.33% of female. In term of age, most of the respondents are
from the age group 36-45 years old which is 39.33% or 118 respondents.
However, none of the respondents were fall under age group that above 55
years old in this survey. For the education level, most of the respondents
were degree holders. It consisted of 42.67% of the respondents. However
there was no PhD holder participated in the survey. For working duration,
most of the respondents were working between 16 to 20 years in the
company which consist 30.67% of the respondents. However, there are the
least respondents working experiences in the company were below 1 year,
Retention Strategies and Job Performance
Page 75 of 114
which was only 6% of the respondents. For the income level, most of the
respondents’ salary level was between RM 2001 to RM 5000, which
consisted of 42.67%. However, there were only 3.33% of the respondents’
salaries level were above RM 11000.
5.1.2 Scale Measurement
We used Cronbach‘s Alpha to evaluate the internal reliability of the six
variables in our research. The six variables included job performance,
training, career development, working environment, reward systems, and
fair treatment.
Working environment has the highest alpha coefficient, which is
0.856257. It is followed by training with 0.834886, job performance with
0.707157, career development with 0.696655, fair treatment with
0.694501, and lastly is reward systems with 0.665447.
5.1.3 Inferential Analysis
5.1.3.1 Pearson Correlation Coefficient
According to the internal analysis, the five independent variables
which are training, career development, reward systems, working
environment and fair treatment are used to examine their
relationship with the job performance respectively by using
Pearson correlation analysis.
The results in Chapter 4 showed that the correlation between job
performance and training is 0.45819; with career development is
0.49224; with working environment is 0.29711; with reward
Retention Strategies and Job Performance
Page 76 of 114
systems is 0.48010; and fair treatment is 0.24178. As an overall,
the figures show that all the variables have positive relationship
towards job performance.
5.1.3.2 Multiple Regression Analysis
Referring to Table 4.20, training has the highest parameter
estimation with job performance, which is 0.23033. Secondly, is
followed by reward systems, which is 0.20902. Thirdly, it is
followed by fair treatment, which is 0.15505. Next, is followed by
career development, which is 0.18071. The lowest parameter
estimation was working environment, which is 0.07703. The result
shows that all the independent variables (training, career
development, working environment, reward systems, and fair
treatment) have significant relationship with the dependent
variables (job performance). This analysis indicates that training
has the highest influence on job performance as compare to the
other four variables. Whilst, working environment is the least.
The regression equation is formed as below:
Job performance = 3.12592 + 0.23033 (Training) + 0.18071
(Career development) + 0.07703 (Working environment) +
0.20902 (Reward systems) + 0.15505 (Fair treatment)
The parameter estimate table indicates that the p-value associated
were less than 0.0001. This means that the relation of the five
independent variables and dependent variable is significant. The
coefficient of determination (R2) is 0.3888 which means 38.88% of
the variances in job performance have been significantly explained
by the training, career development, working environment, reward
systems, and fair treatment.

Retention Strategies and Job Performance
Page 77 of 114
5.2 Discussion of Major Findings
The overall objective of this research is to examine relationship between retention
strategies and job performance in Malaysia banking industry. The study is to
determine whether there is a significant relationship between the five independent
variables (i.e. training, career development, working environment, reward
systems, and fair treatment) and the dependent variable (i.e. job performance).
5.2.1 Relationship between Training and Employees’ Job
Performance
Hypothesis 1
H11: There is a significant relationship between training and job
performance.
Based on the result computed by using Pearson Correlation test in Chapter
4, the analysis has shown a moderate positive relationship of 0.45819
between training and job performance. There is a positive significant
relationship between training and job performance. Hence, when more
training is provided, the job performance is high.
The result of the study showed that training has an impact towards the job
performance in banking industry. Therefore, the organization should
provide more training programs for the employees in order for them to
have self-improvement to take the challenge in doing their tasks assigned
(Owens, 2006). The job performance will be increased given the
employees received the benefits they wanted. The result is also agreed by
Bartlett (2001) who stated that cultivating the employees with training
program is supported as human capital plays a crucial role on the
employees’ commitment, and commitment will affect the job performance.

Retention Strategies and Job Performance
Page 78 of 114
Besides, Groen (2006) has stated that when less training is provided, the
turnover rate of employees is high.
5.2.2 Relationship between Career Development and
Employees’ Job Performance
Hypothesis 2
H21: There is a significant relationship between career development and
job performance.
The result from statistical data has shown there is a significant relationship
between career development and job performance for employees in
banking industry. Besides, a moderate positive correlation of 0.49224 is
reported between career development and job performance. In other
words, when career development is much provided, the job performance
will be higher.
The result has shown that career development will affect the job
performance of employees in banking industry. Hence, when the social
esteem (i.e. recognition) is high, employees feel they are worth-impressed;
the job performance will increase (Ellingsen and Johannesson, 2008).
Nelson (2002) also supported this finding that recognition helps to
improves job performance as management received expected outcome
from employee right after the recognition. Furthermore, Saunderson
(2004) also stated that formal recognition will rise up the compliance of
the employees and hence, increase the job performance. According to
Harter, Schmidt, and Hayes (2002), recognition as one of the component
of career development is the major drivers for employee engagement
which will alternatively affect the job performance. Employee feels happy
when they are praised or recognized, and thereafter they are motivated to
complete their task given.

Retention Strategies and Job Performance
Page 79 of 114
5.2.3 Relationship between Working Environment and
Employees’ Job Performance
Hypothesis 3
H31: There is a significant relationship between working environment
and job performance.
According to SAS result, there is a significant relationship between
working environment and job performance, with a small but not defines
strength of association between these two variables, as a result of figure of
0.29711. Therefore, H31 is accepted and it is supported with various
studies and research finding. The better working environment has been
provided, the higher the level of job performance in an organization.
According to Leblebici (2012), it is found that there is significant
relationship between working environment and job performance. In
Leblebici’s study, he had proved that office working environment has
significant impact on productivity of employees. Besides, the behavioral
components of office environment have a greater impact on productivity
than the physical components. It is the comfort level that has the
significant impact on the performance level of employees than the office
layout. Hence, a comfort working environment has significant impact on
the job performance.
Furthermore, Paputungan (2013) stated that there is a strong relationship
between safety and healthy working environment and job performance in
banking industry. According to the hypothesis tested in the study, the
finding has proved that work stress has significant affect towards the
employee performance. Otherwise, this statement is agreed by another
researcher. On the other hand, Agwu (2012) stated that, the relationships
between safety working environment and job performance is strong. By
having a safer working environment, it will lead to less accidents,

Retention Strategies and Job Performance
Page 80 of 114
damages, liabilities, legal costs, medical costs and less disruption of work
process. In all places, the job performance will be enhanced.
5.2.4 Relationship between Reward Systems and
Employees’ Job Performance
Hypothesis 4
H41: There is a significant relationship between reward systems and job
performance.
Based on the result computing in chapter 4 using Pearson Correlation Test,
the analysis is showing a figure of 0.48010, a moderate strength of
correlation between these two variables. The p-value of <0.0001 which is
less than the significant level of 0.05 (P>0.05), indicates that there is a
significant relationship between reward systems and job performance.
Thus, H1 will be accepted as when the reward is high, the performance of
the job carry out by the employees is high.
According to Rahman, Hussain, and Hussain, (2011) states that most of
the respondent perceived that rewards of both financial and non-financial
have a significant and positive impact on their individual performance.
That is why it is essential for the HRM practitioners of private companies’
requisite to bring about and apply the reward policy to human resource in
order to enrich their overall performance (DeMatteo, Eby & Sundstom,
1998). Additionally, the result of the research done by Aktar, Sachu and
Ali (2012) was identified that there was a positive relationship between
rewards and employees’ performance resulted from the strong correlation
between intrinsic and extrinsic rewards.
In fact, the capability of the human resource management in dealing with
the reward systems functions could lead to a success of the economics of

Retention Strategies and Job Performance
Page 81 of 114
an organization, as well as to the nation (Pieper, 1990; Selvarajah, Stanley
& Gladys, 2003). Based on the researchers, they allude to an example of
the Banglaeshi government, they are particular in capitalized the reward as
a fundamental of competitive advantage as to retain their employees in
achieving an industrial nation within the Asia Pacific region, where they
have achieved a high degree of industrialization and which to enjoys the
higher standards of living in that country (Morrison, 1992; Sessa, 1992).
Likewise, the researcher Zanelli (2004) states that when workers are
rewarded in a tangible way for instance increased in salary or in cash
bonuses, or intangible rewarded such as promotion and public recognition
as the result of desirable behaviors in the performance, they will perceived
to be more motivating to work. A fair and consistency reward systems will
be essential for the presence of commitment from the employees towards
the organization as well as superior performance of work. Hence, behavior
and performance of the employees will be influenced by the reward
systems have been proven by much empirical evidence (Maltz & Kohli,
2002; Furtado, Aquino, & Meira, 2009).
The result conducted by researcher Agwu (2013), there is significant
relationship between reward systems as perceived by the employees. If
reward fairly distributed which it is equal to their job performance, it
might lead to the satisfactory of individual. Otherwise, they will perceive it
as unfair and dissatisfied with their supervisor and they will tend to reduce
their input or no longer putting effort on their job since the inputs are not
fairly rewarded.
Retention Strategies and Job Performance
Page 82 of 114
5.2.5 Relationship between Fair Treatment and Employees’
Job Performance
Hypothesis 5
H51: There is a significant relationship between fair treatment and job
performance.
The result from statistical data has shown there is a positive relationship
between fair treatment and job performance for employees in banking
industry. A small but not defines strength of association of 0.24178 is
reported between fair treatment and job performance. This result has
shown that fair treatment will affect the job performance of employees in
banking industry.
Konovsky (as cited in Narcisse & Harcourt, 2008) stated that the fairness
plays a significant role in primary organizational value and understanding
the sequel of the employee perception on the fairness. The organization
which practices the ineffectiveness and unfairness of a performance
management system might result in poor performance, unproductive, and
sometimes destructive behaviour from the employees. Employees are
hoping to have fair treatment from the organizations regardless of the
issues in rewards or punishment, and also their evaluations on the
allocation process (Cho & Kessler, 2008).
According to Suliman (2007), in the condition in which the resources are
distributed unfairly, the systems can become so destructive in the way that
mistrust, disputes, disrespect and some social problems might arise.
Generally, employees will make comparisons with others that are in the
workplace to compare their salaries, working hours and benefits that are
offer by the organization. The employee will feel satisfy toward the system
and will have good performance in the organization if the comparison is
positive. But if the outcome is negative, the reverse is true.

Retention Strategies and Job Performance
Page 83 of 114
From the result we obtained and the supports from several researchers, it is
concluded that fair treatment a significant relationship with job
performance.
5.3 Implications of the Study
The managerial implications will be provided at below after the five variables are
tested in this study. It is useful to both human resource and employers in term of
better understanding on how the five independent variables (i.e. training, career
development, working environment, reward systems, and fair treatment) affect the
job performance in continuing banking industry.
5.3.1 Managerial Implications
This study has provided useful information to both management of
banking industry and future researchers who are doing related topic. With
the information available, employers would able to prevent unnecessary
problems and increase the job performance. By meeting the needs of
employees, turnover rate can be reduced. Furthermore, employers can get
to know more about the factors that affect the turnover and eventually
retain the employees, meanwhile increase job performance. With the
results proven in this study, the researchers can realize that training, career
development, working environment, reward systems, and fair treatment are
the factors that affect the job performance of the banking staffs.
The result of this study addresses that a skilled employee is retained at the
high levels of complying with the terms of retention issues. Human capital
is relatively important in resulting competitive advantage of an
organization. In this case, a well-trained employee may help in reducing
costs of supervision because they are able to censor their own tasks. Apart
of this, successive promoting the skills and knowledge of an employee via

Retention Strategies and Job Performance
Page 84 of 114
career development will help in increasing the job performance.
Nevertheless, a safe and comfortable working environment would increase
the morale of the employees and gradually boost up the job performance.
Management is able to understand and create an unrestrained environment
for the employees through this study.
Besides, rewards have also been a carrot and stick for the employees in
order to retain them in an organization. Employees feel a sense of
insecurity when the firm started to outsource its task. Hence, the employee
leaves the organization as they perceive the management does not look
after their best interests. This study would help the management to
understand better the heartfelt wishes of the employees in order to retain
them and enhance the job performance. The management would realize the
importance of rewarding the employees and would able to implement an
appropriate reward framework for effective spending through this study.
Lastly, this study indicated that treatment in the workplace in terms of
fairness conveys an important value to the staffs, and stimulate the staffs to
be committed to the organization in order to enhance the job performance.
5.4 Limitations of the Study
During the research process being carried out, there are several limitations of the
study that hinder the progress of the research, for example sample size and
questionnaire, limitation of time frame, financial and facilities, and methodology
of data collection of whole research study. Thus, the limitation will be explained
to meet the standard requirement of the research, and the recommendation will be
provided for the improvement in future research.
Sample size and questionnaire
The research study are grouped by five members and due to the constraint of
limited members and survey size, data analysis will be insufficiently comprehend
or precise to the attainment of requirement. Besides, the selected location for the
Retention Strategies and Job Performance
Page 85 of 114
research scope is lack of geographical coverage which is only chosen in Ipoh,
Perak, Malaysia, with consists of limited respondents of 300; this sample size
might not accurately represent all the employees in banking industry in Malaysia.
Therefore, the result might not be reliable in the presence of biasness. For the
questionnaire, due to the smaller survey size the questionnaire will be only
distributed for those who are willing to participate. However, cooperative and
willingness of certain banking industry seems reluctantly agreed upon the filling
of questionnaire due to the confidentiality which also restricted the research from
going smoother.
Limitation of time frame, financial and facilities
Inadequate time frame for research title, information searching, discover
prospective pool of respondents for questionnaires, questionnaire distribution,
analysis of data and others, all of these are the constraint to a more precise and
reliable results. Moreover, the limitation of financial and facilities for instance, the
cost of printing fee, administrative cost and transportation cost that are fully bear
by five members of the research team.
Methodology of data collection
The methodology use to obtain the result can be improvised instead of just using
the way of distributing it manually by the five members of research team; it could
lead to inefficiency as time will be dragging when the questionnaire is being
collecting back one by one. Furthermore, there is difficult to have those co-operate
respondent who are keen to answer the entire questionnaire. One might falsified
the answer since there is no obligation and sincerity of the respondent’s
participation. Additionally, since the questionnaire are not seriously answering by
the respondents, as a result of a weak correlation between the independent and
dependent variables. In short, if the information given was falsified, the validity
and reliability will be affected.
Nevertheless, throughout this study we can examine and identify the relationship
of retention strategies which contribute towards the job performance level of the
employees in an organization. However, there are some of the limitations with
underlying assumptions that may affect the reliability and validity outcome of the

Retention Strategies and Job Performance
Page 86 of 114
analysis. The identified limitation laid a background for potential future study to
better understand the retention strategies towards the employees’ job performance
in banking industry in Malaysia.
5.5 Recommendations for Future Research
From our research study, there are significant relationship between training, career
development, working environment, reward systems and fair treatment
commitment with the job performance of employees in banking industry. Several
limitation been identified and there are certain of the recommendations provided
for the future research.
For the sample size of respondents, a larger sampling size should be more
appropriate to cover all the state in Malaysia for future research in order to
represent the whole banking industry. A wider range of participants is more
essential to the reliability and accuracy result in order to avoid bias and unwanted
incongruities, correspondingly to increase the significance and to draw the final
conclusion for whole research study.
Besides, the geographical area should be expanding to more locations in order to
improve the reliability of data and to reduce the bias of the result. It is
recommended to conduct the research to other states in Malaysia because the more
data collected from different states, there is the higher possibility to acquired more
significant data in order to create a more comprehend and precise of the research
study.
In addition, the way of manually distributed of the survey cause a waste of time in
completing the research progress. It is recommended for different data collection
for instance through the channel of personal interview, observation, telephone
interview or internet distribution. In personal interview session, researchers can
explain more detail about the question to prevent ambiguity towards our research
purpose, and reduce the falsification of respondents. Observation might receive
more subjective interpretation towards the employee’s behavior but it is to declare
Retention Strategies and Job Performance
Page 87 of 114
the efficiency and effectiveness of the result. Telephone interview provided with a
courtesy attitude in questioning that can shorten the time to distribute and collect
the survey. Sending the questionnaire through internet deliberated as an easier and
faster method to distribute to the respondents, and it can indirectly overcome the
limitation in terms of financial and facilities which the process of data collection
will lower the cost and time saving.
5.6 Conclusion
A thorough and remarkable understanding on the independent variables which
comprises of training, career development, work environment, reward systems
and fair treatment, that will significantly affect the relationship with the dependent
variable which is job performance of employees in banking industry. Upon the
findings, the four factors undeniably play an important role and providing an
overview of how it influences the level of job performance, through SAS
Enterprise Guide, a software programs that used to run a test in terms the
measurement of Pearson Correlation Coefficient and Multiple Regression
Analysis.
There are several retention strategies in our research study which determined the
significant relationship which lead to boost of level of job performance and this
research findings not only beneficial by providing the useful insights for the
education industry but also vital for every aspect in the organization, which will
barely determine the perpetuity and sustainability of the particular organization in
the global marketplace.
Furthermore, organization is able to ascertain employees’ needs and wants. With
the result findings, employers can implement those strategies based on the priority
that have the most influential ranking with the intention of satisfying and
motivating the employees. Thus, employees are more likely to perform well by
exhibiting a higher level of commitment and tend to increase the productivity of
the organization. In fact, they will assist the organization to achieve their goals

Retention Strategies and Job Performance
Page 88 of 114
and objectives and it is directly retain the potential and talented employees in an
organization.
However, change is the only consistent philosophy where the world is keep
change over time. Therefore, the studies must be made accordingly with the
changes to fit into different situation whereby new factors will be identified in the
future. In brief, the retention strategies will be able to increase the overall job
performance and become more efficiently and effectively in the organization, in
the sense of achieving developing and successful organization.
Retention Strategies and Job Performance
Page 89 of 114
REFERENCES
Agwu, M. O. (2012). Impact of employees safety culture on organisational
performance in Shell Bonny Terminal Integrated Project (BTIP). European
Journal of Business and Social Sciences, 1(5), 70-82.
Agwu, M. O. (2013). Impact of fair reward system on employees job performance
in Nigerian Agip oil company Limited Port-Harcourt. British Journal of
Education, Society and Behavioral Science, 3(1), 47-64.
Aktar, S., Sachu, M. K., & Ali, M. E. (2012). The impact of rewards on employee
performance in Commercial Banks of Bangladesh: An Empirical Study.
Journal of Business and Management, 6(2), 9-15.
Akuoko, K. K. (2012). Employee retention strategies and workers’ performance:
general views of employees in Ashanti region of Ghana. International
Journal of Business and Management Tomorrow, 2(8), 1-9.
Alam, M. A., Ahmed, S., Sahabuddin, M., & Akter, S. (2013). Relationship
between Employee Recognition and Employee Contribution in Service
Industry, 1(1), 1-8.
Ango, A. K., Yakubu, A. A., & Ismaila, T. W. (2011). Training needs assessment
and its effects on the job performance of extension workers for argicultural
development of sokoto state, nigeria. Scholarly Journal of Agricultural
Science, 1(1), 5-15.
Antonacopoulou, E. P. (2000). Employee development through self-development
in three retail banks, 29(4), 491-508.
Azman, I., Loh, L. C.S., Ajis, M. N., Dollah, N. F., & Boerhannoeddin, A. (2009).
Relationship between supervisor’s role and job performance in the
workplace training program. Analele Stiinłifice Ale Universitałii,
Alexandru Ioan Cuza Din IASI Tomul LVI StiinŃe Economice, 237-251.

Retention Strategies and Job Performance
Page 90 of 114
Babakus, E., Yavas, U., Karatepe, S.M. & Avci, T. (2003). The effect of
management commitment to service quality on employees’ affective and
performance outcomes. Journal of Academy of Marketing Science, 31(3),
pp. 272-286.
Bartlett, K. (2001). The relationship between training and organizational
commitment: a study in the health care field. Human Resource
Development Quarterly, 12(4), 335-352.
Boushey, H., & Glynn, J. (2012). There are Significant Business Costs to
Replacing Employees. Retrieved March 2, 2013, from
http://www.americanprogress.org/wp-
content/uploads/2012/11/CostofTurnover.pdf
Bowen, B.B, (2000). Recognizing and rewarding employees. Mcgraw-Hill.
Bunn, A., & Guthrie, R. (2009). Occupational health and safety in the banking
industry. The Finance Industry, 11, 79-89.
Campion, M. A. (1988). Interdisciplinary Approaches to job design: a
constructive replication with extensions. Journal of Applied Psychology,
73(3), 467-481.
Cho, J. & Kessler, S.R. (2008). Employees’ distributive justice perceptions and
organisational citizenship behaviours: A social exchange perspective.
Review of Business Research, 8(6), 131-137.
Colquitt, J. A. (2001). On the dimensionality of organizational justice: a construct
validation of a measure. Journal of Applied Psychology, 86(3), 386-400.
Cooper, C. R., & Schindler, P. S. (2008). Business research methods (10 ed.).
Boston: McGraw-Hill.
Retention Strategies and Job Performance
Page 91 of 114
Dayan, M. & Benedetto, A.D. (2007). Procedural and interactional justice
perceptions and teamwork quality. Journal of Industrial and Business
Marketing, 23(8), 566-576.
De Cremer, D. (2005). Procedural and distributive justice effects moderated by
organisational identification. Journal of Managerial Psychology, 20(1). 4-
13.
DeMatteo, J. S., Eby, L. T., & Sundstom, E. (1998). Team-based rewards: current
empirical evidence and directions for future research. Research in
Organizational Behavior, 20, 141-83.
Drury, C. (2009). Management Accounting for Business, (4th
ed.). Hampshire:
Cengage Learning.
Ellingsen, T., Johannesson, M. (2008). Pride and prejudice: the human side of
incentive theory. American Economic Review, 98(3), 990-1008.
Furtado, F., Aquino, G., & Meira, S. (2009). Incentive systems in software
organizations. ICSEA 2009- The Fourth International Conference on
Software Engineering Advances. Porto, Puortugal. September 2009.
Furtado, F., Aquino, G., & Meira, S. (n.d.). Improving organizational performance
through reward systems. Business Dydamics in the 21st Century, 4-28.
Gberevbie, D. E. (2010). Organizational retention strategies and employee
performance of Zenith Bank in Nigeria. African Journal of Economic and
Management Studies, 1(1), 55-66.
Goessl, L. (2009). Pros and Cons of High Employee Turnover. Retrieved March 4,
2013, from http://www.helium.com/items/1582495-pros-and-cons-of-high-
employee-turnover

Retention Strategies and Job Performance
Page 92 of 114
Golafshani, N. (2003). Understanding reliability and validity in qualitative
research. The qualitative report, 8(4), 597-607.
Goyer, L. (2010). Career Development in SMEs, 82. Retrieved from
http://www.crwg-gdrc.ca/crwg/wp-content/uploads/2010/10/Report-3-
Literature-Review-Summary1.pdf
Gregory, K. (2008). The Importance of Employee Satisfaction. Retrieved March
13, 2013, from
http://www.neumann.edu/academics/divisions/business/journal/review201
1/gregory.pdf
Groen, J. A. (2006). Occupation-Specific Human Capital and Local Labour
Markets. Oxford Economic Papers, 58, 722-741.
Groenewald, D. (2010). Chapter 5: Research Design and Methodology Of The
Study. Retrieved August 5, 2013, from
http://upetd.up.ac.za/thesis/available/etd-04282010-
085324/unrestricted/03chapters5-6.pdf
Gungor, P. (2011). The relationship between reward management system and
employee performance with the mediating role of motivation: a
quantitative study on global banks. Journal of Procedia Social and
Behavioral Sciences, 24, 1510-1520.
Hair, J. F. Jr., Money, A. H., Samouel, P., & Page, M. J. (2007). Research
Methods for Business. West Susseex: John Wiley & Sons, Inc.
Hameed, A., & Waheed, A. (2011). Employee Development and its Affect on
Employee Performance A Conceptual Framework. International Journal
of Business & Social Science, 2(13), 224-229.
Harris, M. (2009). An Employee Retention Strategy Designed to Increase Tenure
and Profitability in the Fast Food Industry. Retrieved March 3, 2013, from

Retention Strategies and Job Performance
Page 93 of 114
http://udini.proquest.com/view/an-employee-retention-strategy-
goid:860122562/
Harter, J. K., Schmidt, F. L., and Hayes, T. L. (2002). Business-unit-level
relationship between employee satisfaction, employee engagement, and
business outcomes: a meta-analysis. Journal of Applied Psychology 87,
268-279.
Heneman, R.L. & von Hippel, C. (1995). Balancing group and individual rewards:
rewarding individual contributions to the team. Compensation and Benefits
Review, 27 (4), 63-8.
Hornibrook, S., Fearne, A. & Lazzarine, M, 2009. Exploring the association
between fairness and organisational outcomes in supply chain
relationships. International Journal of Retail and Distribution
Management, 37(9), 790-803.
Jermias, J., & Yigit, F. (2013). Budgetary participation in Turkey: the effects of
information asymmetry, goal commitment, and role ambiguity on job
satisfaction and performance. Journal of International Accounting
Research, 12(1), 29–54.
Johnson, J. (2005). Reward design and CEO succession in the UK. Applied
economics, 37, 1535-1541.
Johnson, M. (2000). Winning the people war, talent and the battle for human
capital. Copyright Licensing Agency, London.
Kahya. E. (2007). The effects of job characteristics and working conditions on job
performance. International Journal of Industrial Ergonomics, 37, 515–523.
Kaur, D. (2010). Quality of work life in ICICI Bank Ltd, Chandigarh.
International Research Journal, 1(11), 28-29.
Retention Strategies and Job Performance
Page 94 of 114
Ken, S. T. T., Cheah, Y. Y., & Mohd Salleh, N. S. (2012). Does effectiveness of
training program influenced teachers' job performance? Evidence from
malaysia. Journal of Education and Vocational Research, 3(6), 173-177.
Ketelaar, T. & Koenig, B. (2007). Justice, fairness and strategic emotional
commitment. In De Cremer, D. (Ed.). Advances in the psychology of
justice and affect, 133-153. Charlotte: Information Age Publishing.
Khan, I., Shahid, M., Nawab, S., & Wali, S. S. (2013). Influence of intrinsic and
extrinsic rewards on employee performance: The banking sector of
pakistan. Journal of Academic Research International, 4, 283-291.
Khan, N., Ahmed, S. F., Muhammad, I., & Muhammad, K. S. (2012). Impact of
on-job training on performance of telecommunication industry. Journal of
Social and Development Sciences, 3(2), 47-58.
Khan, R. A. G., Khan, F. A., & Khan, M. A. (2011). Impact of training and
development on organization performance. Global Journal of Management
and Business Research, 11(7), 62-68.
Kim, J. (2010). Strategic human resource practices: Introducing alternatives for
organizational performance improvement in the public sector. Public
Administration Review, 70(1), 38-49.
Lau, C. M. & Sholihin, M. (2005). Financial and nonfinancial measures: how do
they affect job satisfaction. The British Accounting Review, 37(4), 389-
413.
Lawler, E. E. (1993). Effective reward systems: Strategy, diagnosis, design and
change. Center for Effective Organizations, 1-41.
Leblebici, D. (2012). Impact of workplace quality on employee’s productivity:
case study of a bank in Turkey. Journal of Business, Economics, and
Finance, 1(1), 38-49.
Retention Strategies and Job Performance
Page 95 of 114
Leung, K., Tong, K. & Ho, S.S. (2004). Effects of interactional justice on
egocentric bias in resource allocation decisions. Journal of Applied
Psychology, 89(3), 405-415.
Luthans, K. (2000). Recognition: a powerful, but often overlooked, leadership tool
to improve employee performance. Journal of Leadership &
Organizational Studies, 7(1), 31-39.
Maltz, E. & Kohli, A. K. (2002). Reducing marketing’s conflict with other
functions: the differential effects of integrating mechanisms. Journal of the
Academy of Marketing Science, 28(4), 479-492.
Masterson, S. S., Lewis, K., Goldman, B. M., & Taylor, M. S. (2000). Integrating
justice and social exchange: The differing effects of fair procedures and
treatment of work relationships. Academy of Management Journal, 43(4),
738-748.
Matlala, M. M. (2011). Employee fairness perceptions of a performance
management system. Unpublished master’s thesis, University of South
Africa, Africa.
May, K. (2013). Causes & Effects of High & Low Staff Turnover. Retrieved
February 25, 2013, from http://smallbusiness.chron.com/causes-effects-
high-low-staff-turnover-33939.html
McShane, S. L., & Von Glinow, M. A. (2010). Organizational behavior: Emerging
knowledge and practice for the real world. (5th ed.). New York: McGraw-
Hill/Irwin.
Monis, S. H., & Sreedhara, T. N. (2010). Employee satisfaction with career
development practices: a comparative study of Indian and foreign MNC
BPO firms. Journal of Arts Science & Commerce ISSN 2229, 10(4), 215-
224.

Retention Strategies and Job Performance
Page 96 of 114
Morrison, A. M. (1992). The New Leaders: Guidelines on Leadership Diversity in
America. Jossey- Bass Publishers, San Francisco, CA.
Nakpodia, E. D. (2011). Training and utilization of staff and job performance in
post primary education board, in north senatorial district of delta state,
nigeria. Journal of Economics and International Finance, 3(5), 279-288.
Narcisse, S. & Harcourt, M. (2008). Employee fairness perceptions of
performance appraisal: a Saint Lucian case study. International Journal of
Human Resource Management, 19(6), 1152-1169.
NC3Rs (2006). Why do a pilot study? National Centre for the Replacement,
Refinement and Reduction of Animals in Research. Retrieved July 2,
2013, from http://www.nc3rs.org.uk/downloaddoc.asp?id=400
Nelson, J., Hilary, V. K., & Michael, N. M. (2012). Relationship between on the
job training and employee's performance in courier campanies in dar es
salaam, tanzania. International Journal of Humanities and Social Science,
2(22), 114-120.
Nelson, R. (2002). The Rewards of Recognition. Leader to Leader, 2002(23), 16-
19.
Nelson, K., & McCann, J. (2009). Designing for Knowledge Worker Retention &
Organization Performance. Retrieved March 8, 2013, from
http://www.aabri.com/manuscripts/09272.pdf
Nyakundi, A. W. (2012). Enhancing the Role of Employee Recognition towards
Improving Performance: A Survey of Kenyatta National Hospital,
Kenya, 1(7), 95-108.
Owens, P. L. (2006). One more reason not to cut your training budget: the
relationship between training and organizational outcomes. Public
Personnel Management, 35(2), 163-171.
Retention Strategies and Job Performance
Page 97 of 114
Paputungan, F. (2013). The effect of work stress to employee performance at
Bank Rakyat Indonesia in Manado branch. Journal EMBA, 1(3).
Pieper, R. (Ed.) (1990). Human Resource Management: An International
Comparison. Walter de Gruyter, Berlin.
Pouliakas, K. (2010). Pay enough, don’t pay too much or don’t pay at all? the
impact of bonus intensity on job satisfaction. Journal of Blackwell
Publishing Ltd, 63(4), 597-626.
Rahman, M.S., Hussain, M. & Hussain, B. (2011). Assessing the relationship
between diversified workforce and reward on employees’ performance in
the organization: An exploratory study of private organisations in
Bangladesh. Journal of Employment Studies, 19(2), 83-111
Reynolds, K.E., Beatt, S.E. (1999). Customer benefits and company consequences
of customer- salesperson relationships in retailing. Journal of Retailing,
75(1), 11-32.
Robbins, S. P. (1999). Comportamento organizacional (8a
edição), LTC, Rio de
Janeiro. Portuguese version only.
Sabeen, Z., & Mehboob, S. A. A. (2008). Perceived fairness of and satisfaction
with employee performance appraisal and its impact on overall job
satisfaction. The Business Review, Cambridge, 10(2), 185-191.
Salimaki, A & Jamsen, S. (2010). Perceptions of politics and fairness in merit pay.
Journal of Managerial Psychology, 25(3), 229-251.
Samsung (2009). Banking Industry. Retrieved March 2, 2013, from
http://www.samsung.com/us/it_solutions/innovation-
center/downloads/business/white_papers/Document_Management_and_Pri
nting_Solutions_for_the_Banking_Industry.pdf
Retention Strategies and Job Performance
Page 98 of 114
Saunderson, R. (2004). Survey findings of the effectiveness of employee
recognition in the public sector. Public Personnel Management, 33(3),
275.
Sekaran, U. (2003). Research method of business: A skill Building Approach (4th
ed.). New York: John Willey & Sons, Inc.
Sekaran, U., & Bougie, R. (2010). Research methods for business: A skill building
approach (5th ed.). Chichester, West Sussex: John Wiley & Sons, Inc.
Selvarajah, C., Stanley, P., & Gladys, C., (2003). The role of human resource
management (HRM) in Australian-Malaysian joint ventures. Journal of
European Industrial Training, 27(5), 244-262
Sessa, V. I. (1992). Managing diversity at the Xerox Corporation: balanced
workforce goals and caucas groups. In Jackson S.E. (Ed.). Diversity in the
Workplace: Human Resources Initiatives. Society for Industrial and
Organisational Psychology- The Professional Practice Series, Guildford
Press, New York, NY.
Shaw, J. D., Gupta, N., & Delery, J. E. (2005). Alternative conceptualizations of
the relationship between voluntary turnover and organizational
performance. Academy of Management Journal, 48(1), 50-68.
Shore, L.M., & Shore, T,H. (1995). Perceived organizational support and
organizational justice. In R. Cropanzano & K.M. kacmar (Eds.).
Organizational politics, justice and support: B. Managing social climate at
work ( pp. 149-164). Westport, CT: Quorum Press.
Simons, T., & Roberson, Q. (2003). Why managers should care about fairness: the
effects of aggregate justice perceptions on organizational outcomes.
Journal of Applied Psychology, 88(3), 432-443.

Retention Strategies and Job Performance
Page 99 of 114
Smith, I. (1992). Reward management and HRM’ in Blyton, P. and Turnbull, E.
(Eds). Reassessing Human Resource Management, Sage, London.
Sonnentag, S., Volmer, J. & Spychala, A. (2010). Job performance. Micro
approaches: Sage handbook of organizational behavior, (1), 427-447.
Stredwick, J. (2000). Aligning rewards to organizational goals – a multinational’s
experience. European Business Review, 12(1), 9-19.
Suliman. A.M.T. (2007). Links between justice, satisfaction and performance in
the workplace. Journal of Management Development, 26(4), 294-311.
Tan, S. L. C., & Lau, C. M. (2012). The impact of performance measures on
employee fairness perceptions, job satisfaction and organisational
commitment. Management Accounting Research,, 10(2), 57-72.
Thang, L.C. (2004). Managing human resources in Vietnam: An empirical study
of an economy in transition. Dissertation No. SM-04-07, School of
Management, Asian Institute of Technology, Thailand.
Ticehurst, B., & Veal, A. (2000). Research methods: A managerial approach.
Ticehurst, Gregory William, 1943: Longman.
Van Prooijen, J. (2009). Procedural justice as an autonomy. Journal of Personality
and Social Psychology, 96(6), 1166-1180.
Walsh, J. (1998). ‘McJob’s image first target in burger recruitment war’. People
Management, 22 January.
Wan, H.I. (2008). Current remuneration practices in the multinational companies
in Malaysia: a case study analysis. Research and Practice in Human
Resource Management, 16(1), 78-103.

Retention Strategies and Job Performance
Page 100 of 114
Williams, C. (2010). Effective management (5th ed.). Mason, Ohio: Thomson
South-Western.
Yukon Government. (2010). Recruitment and employee retention strategies-The
Labor Market Framework for Yukon. Retrieved February 4, 2013, from
http://www.labourmarketframeworkyukon.com/system/PDF/RR%20strate
gies.pdf
Zanelli, J. C., Andrade, J. E. B. & Bastos, A. V. B. (2004). Psicologin,
Organizações e Trabalho no Brasil, Artmed, Porto Alegre, Portuguese
version only.
Zikmund, W. G. (2003). Business research methods: A practical guide (7th
ed.).
New York: South-Western/Thomson.
Zikmund, W. G., Babin, B. J., Carr, J. C., & Griffin, M. (2010). Business research
methods (8th ed.). New York: South-Western/Cengage Learning.
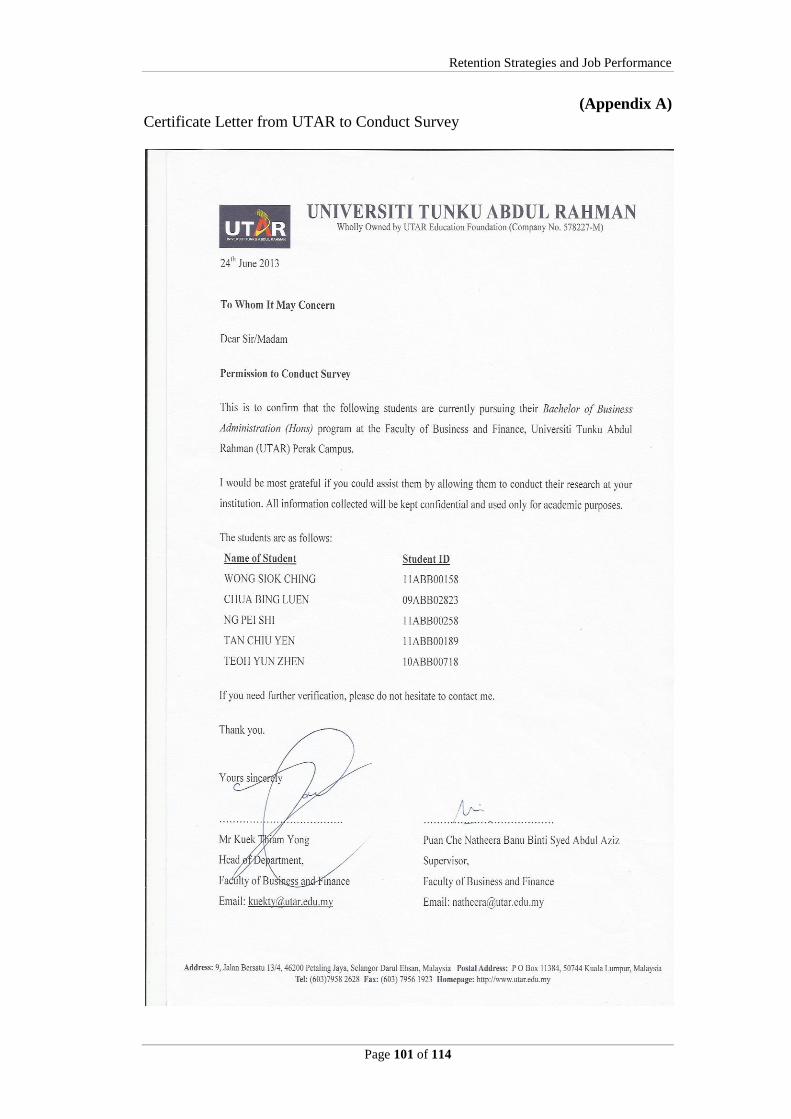
Retention Strategies and Job Performance
Page 101 of 114
(Appendix A) Certificate Letter from UTAR to Conduct Survey
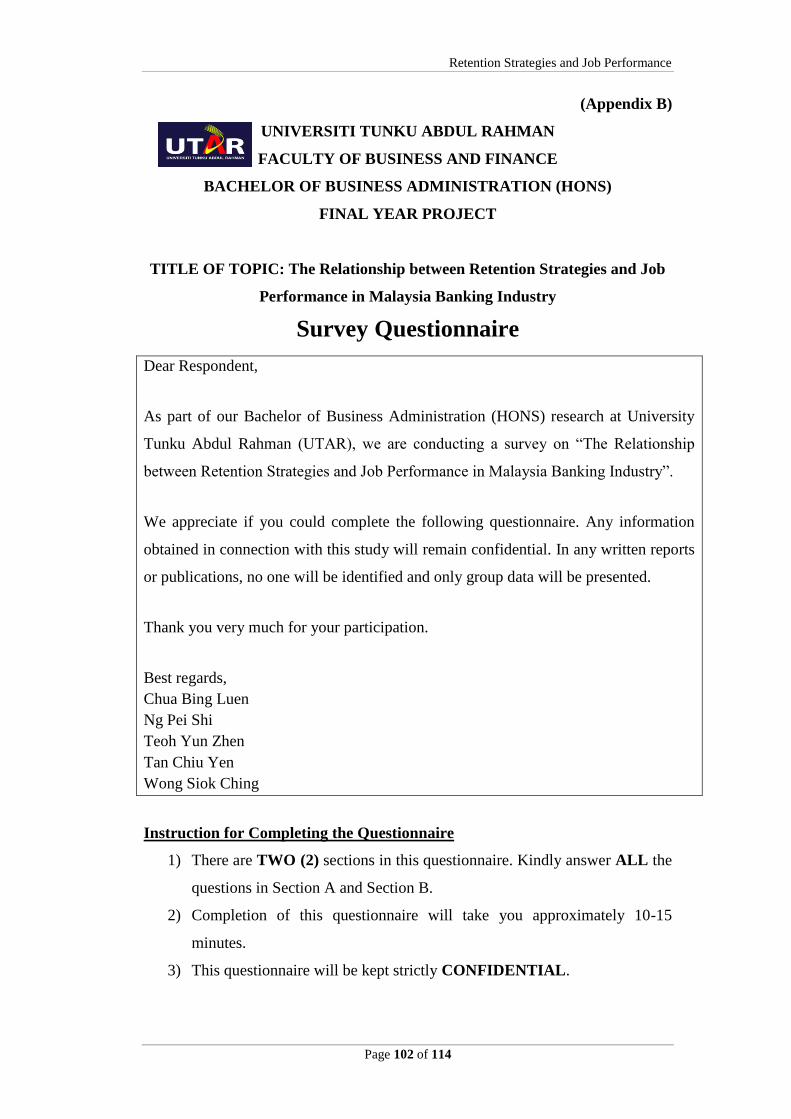
Retention Strategies and Job Performance
Page 102 of 114
(Appendix B)
UNIVERSITI TUNKU ABDUL RAHMAN
FACULTY OF BUSINESS AND FINANCE
BACHELOR OF BUSINESS ADMINISTRATION (HONS)
FINAL YEAR PROJECT
TITLE OF TOPIC: The Relationship between Retention Strategies and Job
Performance in Malaysia Banking Industry
Survey Questionnaire
Dear Respondent,
As part of our Bachelor of Business Administration (HONS) research at University
Tunku Abdul Rahman (UTAR), we are conducting a survey on “The Relationship
between Retention Strategies and Job Performance in Malaysia Banking Industry”.
We appreciate if you could complete the following questionnaire. Any information
obtained in connection with this study will remain confidential. In any written reports
or publications, no one will be identified and only group data will be presented.
Thank you very much for your participation.
Best regards,
Chua Bing Luen
Ng Pei Shi
Teoh Yun Zhen
Tan Chiu Yen
Wong Siok Ching
Instruction for Completing the Questionnaire
1) There are TWO (2) sections in this questionnaire. Kindly answer ALL the
questions in Section A and Section B.
2) Completion of this questionnaire will take you approximately 10-15
minutes.
3) This questionnaire will be kept strictly CONFIDENTIAL.

Retention Strategies and Job Performance
Page 103 of 114
SECTION A: Demographic Profile
Please place a tick “√” or fill in the blank for each of the following:
1. Gender:
□ Male
□ Female
2. Age:
□ 25 years old and below
□ 26 – 35 years old
□ 36 – 45 years old
□ 46 – 55 years old
□ Above 55 years old
3. Education level:
□ Certificate
□ Diploma
□ Degree
□ Master
□ PHD
□ Others, please specify:__________________________
4. How long have you been working in banking industry?
□ Below 1 year
□ 1 – 5 years
□ 6 – 10 years
□ 11 – 15 years
□ 16 – 20 years
□ Above 20 years
5. Monthly salary:
□ RM 2,000 and below
□ RM 2,001 to RM 5,000
□ RM 5,001 to RM 8,000
□ RM 8,001 to RM 11,000
□ Above RM 11,001

Retention Strategies and Job Performance
Page 104 of 114
SECTION B
Please circle your answer to each statement using 5 Likert scale [(1) =
strongly disagree; (2) = disagree; (3) = neutral; (4) = agree and (5) = strongly
agree]
Part 1:
Job Performance
No. Questions
Str
ongly
Dis
agre
e
Dis
agre
e
Neu
tral
Agre
e
Str
ongly
Agre
e
1. I always complete projects and works
according to deadlines.
1 2 3 4 5
2. I always manage information and data
effectively.
1 2 3 4 5
3. I work without supervision when
necessary.
1 2 3 4 5
4. I effectively collaborate with other
department members when necessary.
1 2 3 4 5
5. I take appropriate action on problems when
necessary.
1 2 3 4 5
Part 2:
Training
No. Questions
Str
ongly
Dis
agre
e
Dis
agre
e
Neu
tral
Agre
e
Str
ongly
Agre
e
1. I am satisfied by the training program that
I received at the company.
1 2 3 4 5
2. I feel that training provided by my
organization helps me to understand the
goals of my department.
1 2 3 4 5
3. I become more committed toward my job
after getting training.
1 2 3 4 5
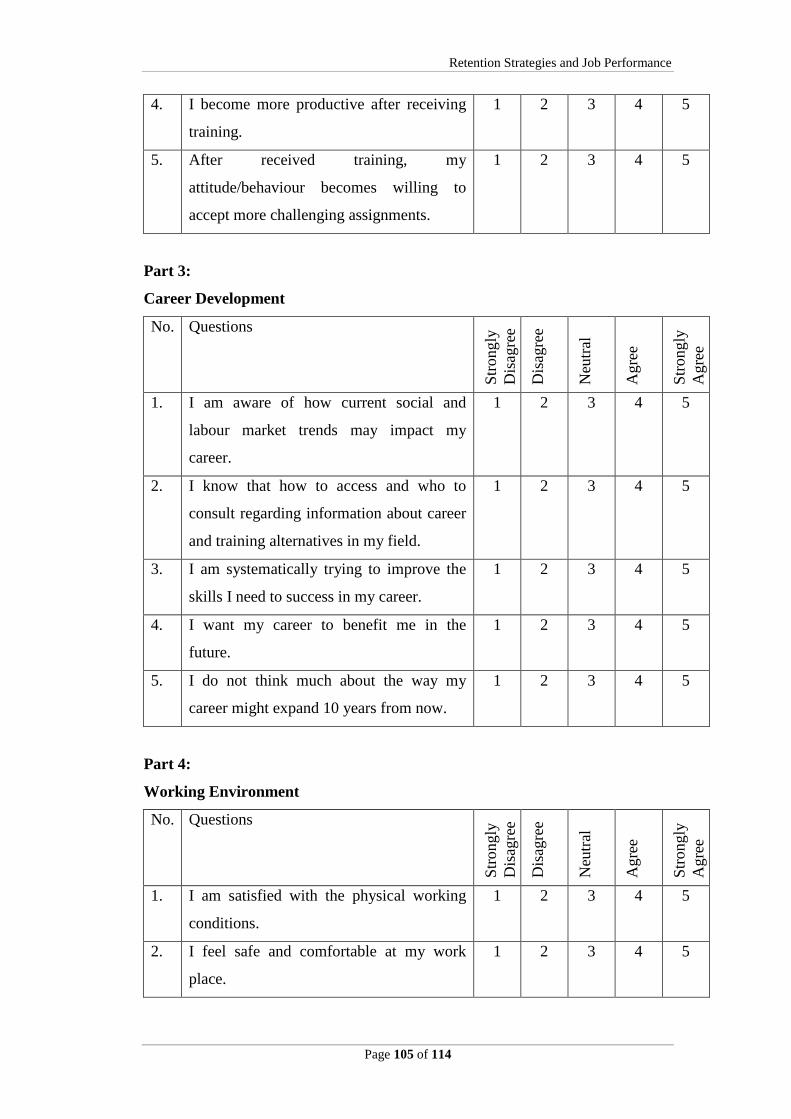
Retention Strategies and Job Performance
Page 105 of 114
4. I become more productive after receiving
training.
1 2 3 4 5
5. After received training, my
attitude/behaviour becomes willing to
accept more challenging assignments.
1 2 3 4 5
Part 3:
Career Development
No. Questions
Str
ongly
Dis
agre
e
Dis
agre
e
Neu
tral
Agre
e
Str
ongly
Agre
e
1. I am aware of how current social and
labour market trends may impact my
career.
1 2 3 4 5
2. I know that how to access and who to
consult regarding information about career
and training alternatives in my field.
1 2 3 4 5
3. I am systematically trying to improve the
skills I need to success in my career.
1 2 3 4 5
4. I want my career to benefit me in the
future.
1 2 3 4 5
5. I do not think much about the way my
career might expand 10 years from now.
1 2 3 4 5
Part 4:
Working Environment
No. Questions
Str
ongly
Dis
agre
e
Dis
agre
e
Neu
tral
Agre
e
Str
ongly
Agre
e
1. I am satisfied with the physical working
conditions.
1 2 3 4 5
2. I feel safe and comfortable at my work
place.
1 2 3 4 5

Retention Strategies and Job Performance
Page 106 of 114
3. I am able to balance my work and personal
life.
1 2 3 4 5
4. I am satisfied with relationship I have with
my co-workers.
1 2 3 4 5
5. I do not feel stressed at my work place. 1 2 3 4 5
Part 5:
Reward Systems
No. Questions
Str
ongly
Dis
agre
e
Dis
agre
e
Neu
tral
Agre
e
Str
ongly
Agre
e
1. I am really interested in my work because
company rewards me financially.
1 2 3 4 5
2. I believe employees perform well when
reward is given appropriately.
1 2 3 4 5
3. Promoting the most talented people will
increase the performance level of
employee.
1 2 3 4 5
4. Higher opportunity for employees to be
promoted will affect the performance of
the employee.
1 2 3 4 5
5. Empowered employees to make decisions
at workplaces will increase the level of
performance.
1 2 3 4 5
Part 6:
Fair Treatment
No. Questions
Str
ongly
Dis
agre
e
Dis
agre
e
Neu
tral
Agre
e
Str
ongly
Agre
e
1. I am rewarded fairly for the amount of
effort I put forth.
1 2 3 4 5
Retention Strategies and Job Performance
Page 107 of 114
2. I am rewarded fairly for the stresses and
strains of my job.
1 2 3 4 5
3. I have complete trust that my supervisor
will treat me fairly.
1 2 3 4 5
4. My organization’s procedures generate
standards so that decisions can be made
with consistency.
1 2 3 4 5
5. Management has little regard for the well
being of people who work for this
company.
1 2 3 4 5
Thank you for your time, opinion and comments.
~ The End ~

Retention Strategies and Job Performance
Page 108 of 114
(Appendix C)
Survey Results Generated by SAS Enterprise Guide 5.1:
1. Pilot Test Result for Job Performance
2. Pilot Test Result for Training
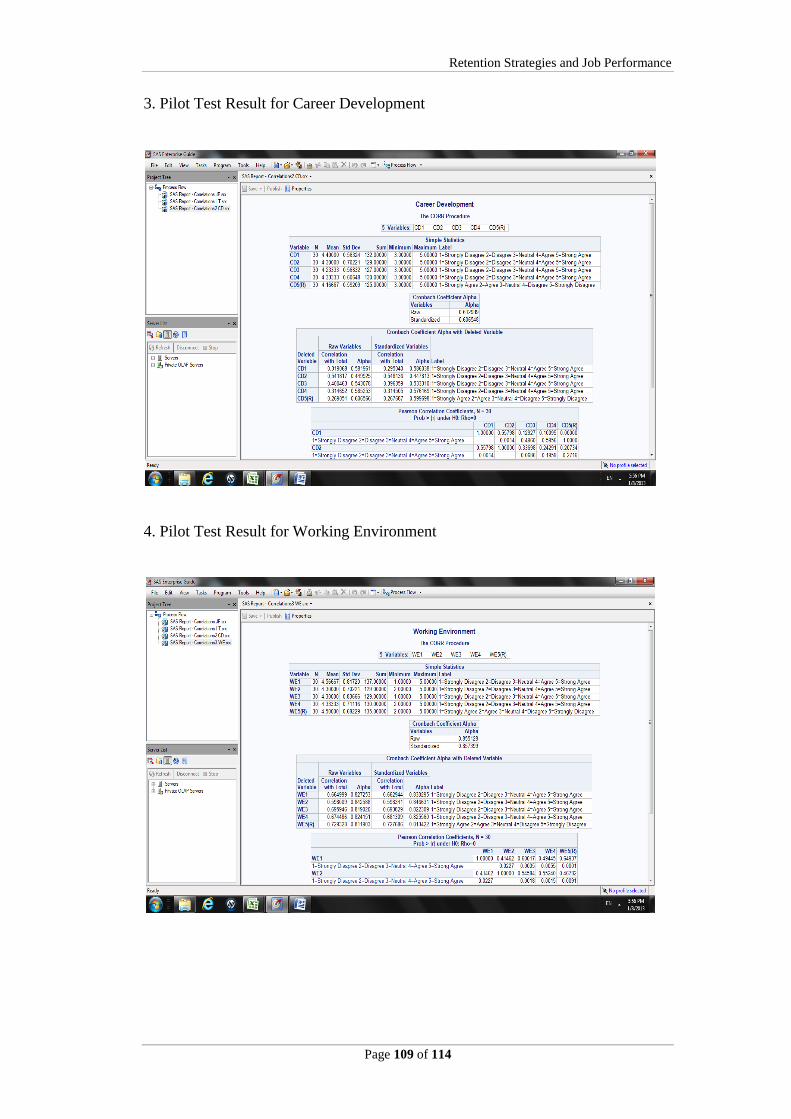
Retention Strategies and Job Performance
Page 109 of 114
3. Pilot Test Result for Career Development
4. Pilot Test Result for Working Environment

Retention Strategies and Job Performance
Page 110 of 114
5. Pilot Test Result for Reward Systems
6. Pilot Test Result for Fair Treatment

Retention Strategies and Job Performance
Page 111 of 114
7. Reliability Test for Job Performance
8. Reliability Test for Training
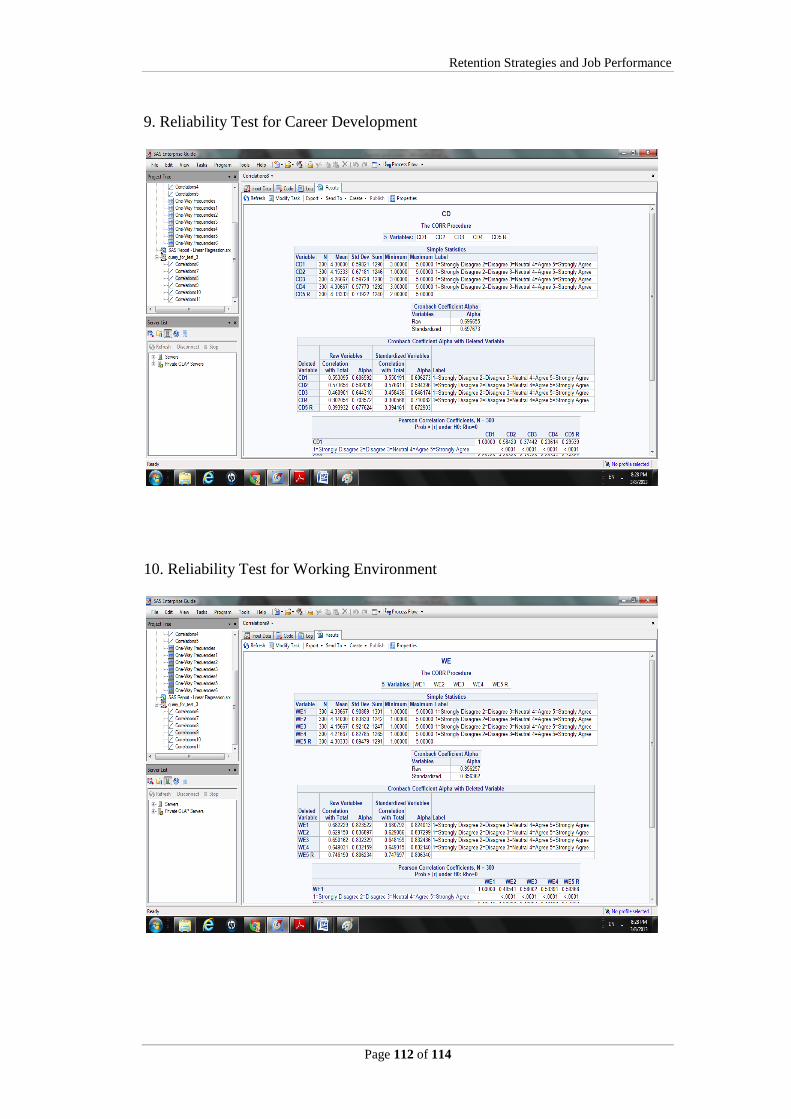
Retention Strategies and Job Performance
Page 112 of 114
9. Reliability Test for Career Development
10. Reliability Test for Working Environment
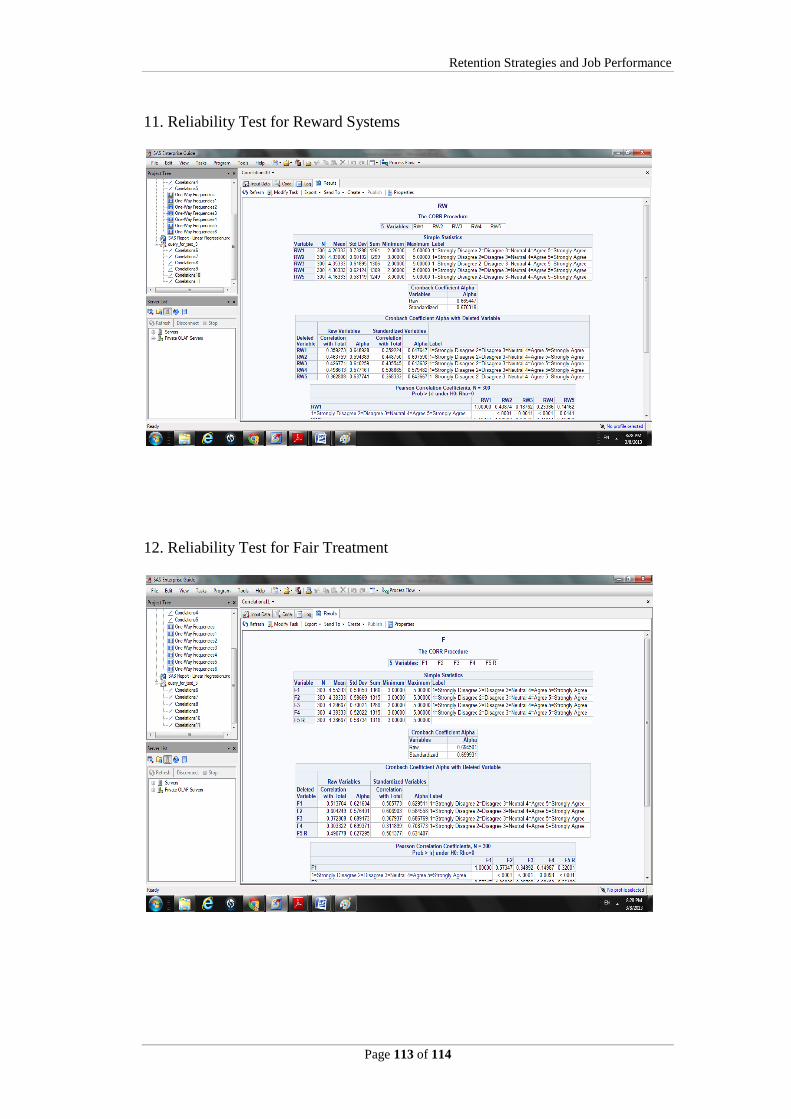
Retention Strategies and Job Performance
Page 113 of 114
11. Reliability Test for Reward Systems
12. Reliability Test for Fair Treatment
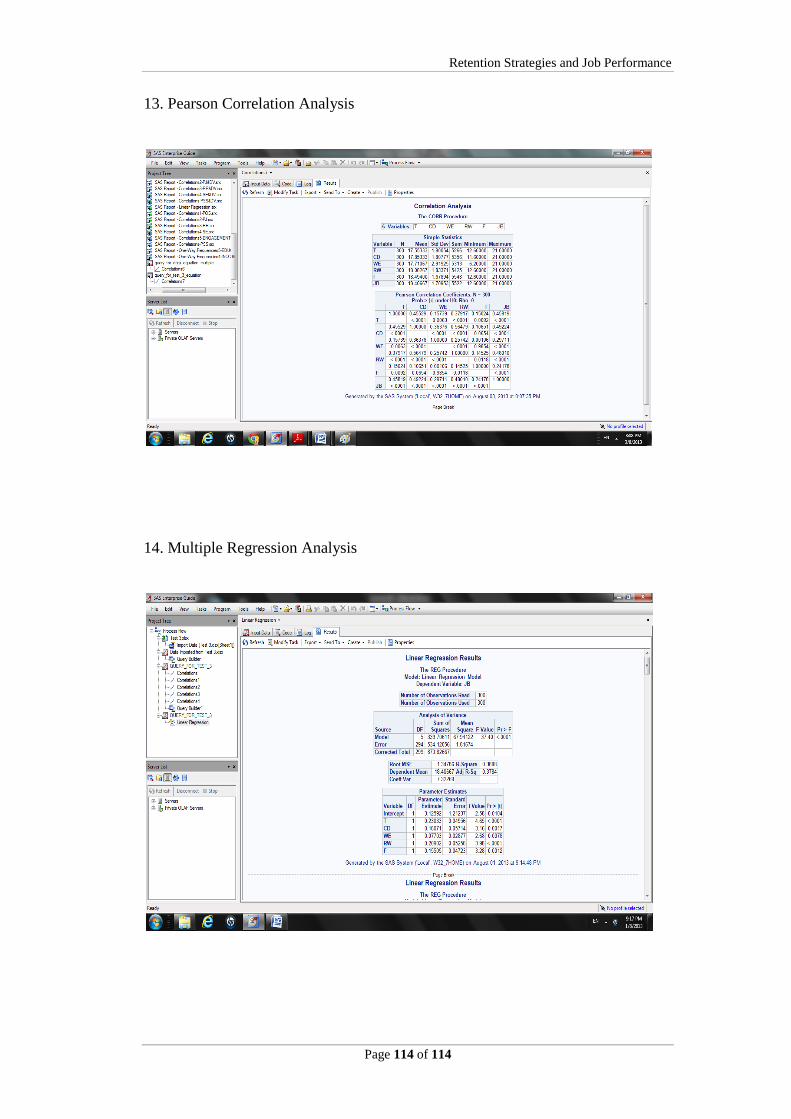
Retention Strategies and Job Performance
Page 114 of 114
13. Pearson Correlation Analysis
14. Multiple Regression Analysis