study of the hydrogenation and double bond
TRANSCRIPT

Instructions for use
Title STUDY OF THE HYDROGENATION AND DOUBLE BOND MIGRATION OF 1-BUTENE ONNICKEL CATALYST
Author(s) AMENOMIYA, Yoshimitsu
Citation JOURNAL OF THE RESEARCH INSTITUTE FOR CATALYSIS HOKKAIDO UNIVERSITY, 9(1):1-41
Issue Date 1961-06
Doc URL http://hdl.handle.net/2115/24734
Type bulletin
File Information 9(1)_P1-41.pdf
Hokkaido University Collection of Scholarly and Academic Papers : HUSCAP

STUDY OF THE HYDROGENATION AND DOUBLE BOND MIGRATION
OF I-BUTENE ON NICKEL CATALYST*)
By
Yoshimitsu AMENOMIYA**)
(Received November 10, 1960)
Abstruct
1. The hydrogenation and double bond migration of I-butene on reduced nickel catalyst
were followed by means of gas chromatography over the ranges respectively of the partial
pressure of hydrogen from 8 to 50 mmHg and of that of butene from 40 to 180 mmHg mainly
at O°C, and at -30°C, -20°C, 100°C and at 198°C as welL The rate of hydrogenation was
thus found to be of the first order in hydrogen and zeroth order in butene at O"C The rate
of double bond migration was the order of 0.5 and 0.6 with respect to hydrogen and I-butene
respectively at O°C. The order of reaction of hydrogenation was found unity both for
hydrogen and butene at 198°C.
The activation energies of hydrogenation and double bond migration were found to be
11.8 and 7.2 Kcal respectively between -30° and O°C at ca. 40 mmHg hydrogen partial pressure
and ca. 35 mmHg butene partial pressure. That of hydrogenation was reduced however to
-5.6 Kcal at temperatures above 100°C at the same partial pressures of reactants; the
appropriate optimum temperature of hydrogenation was estimated at 31°C.
2. The mechanism proposed by HORIUTI and POLANYI (Trans. Faraday Soc., 30, 663, 1164
(1934)) and developed by HORIUTI (This Journal 6, 250 (1958) for ethene was extended to
butene as:
I,
~ C~HBl II,
•• ~ ~.Il.~ "',
~ { ~--_____ --'..J CjH10
* The structure of the above scheme was constructed according to HORIUTI's method by which
the above experimental results were explained semi-quantitatively.
3. The difference of the experimental results of TWIGG (Proc. Roy. Soc., A 178, 106 (1941),
Disc. Faraday Soc. No.8, 152 (1950)) and DIBELER and TAYLOR (J. Phys. Chem., 55, 1036
(1951)) from those of the present author in the order of reaction and activation energies was
accounted for with reference to the location of temperature range of measurement relative to
") This work was reported in Shokubai (Catalysis), Vol. 2, No.1 P. 1 (1960) in Japanese. **) Tokyo Institute of Technology, Meguroku, Tokyo, Japan, present adress: National
Research Council, Ottawa, Canada.
-1-

Journal of the Research Institute for Catalysis
the optimum= temperature mentioned in 1. in the light of the above structure.
It was further predicted that at sufficiently low temperature the activation energy should
be the same for hydrogenation of every olefin on the nickel catalyst.
Introduction
The hydrogenation of olefins over reduced metal catalysts have been studied by many investigators and various mechanisms for this catalytic reaction have been proposed by them. Exchange reaction with deuterium and isomerization of higher olefins which take place simultaneously with hydrogenation have been increasingly studied along with the recent development of analytical methods.
The isomerization associated with the catalyzed hydrogenation in the presence
of nickel catalyst was first reported by TWIGG') in 1941. Since then, the isomerization of butene was investigated by TWIGG2
)3) himself and DIBELER and T AYLOR') together with exchange reaction using a nickel filament as catalyst, and they found the same order of reaction for hydrogenation and double bond migration (abbreviated to DBM in what follows), that is, the order of reaction of 1/2 with respect both to hydrogen and I-butene partial pressures in either case. The activation energies of the exchange, hydrogenation and DBM were determined respectively as 9.0, 2.5 and 5.9 Kcal by TWIGd) over the temperature range between 76 and 126°C, and as 7.1, 2.0 and 5.0 Kcal by DIBELER and TAYLOR') over the temperature range between 60 and 135°C.
The isomerization as well as the exchange is expected of course to provide important informations for elucidating the mechanism of the hydro- genation of olefin. However, the order of reaction observed by TWIGG2
) and DIBELER and TAYLOR') were not accounted for by the mechanisms so far proposed inclusive of that advanced by TWIGG') himself.
HORIUTI and POLANYI')6) concluded the mechanism of catalyzed hydrogenation of olefins in the presence of metallic catalysts and suggested in accordance with the mechanism that the hydrogenation should be accompanied by DBM as well as the exchange reaction as verified later by TWIGG et al. HORIUTI7
)8)
formulated the mechanism statistical mechanically and accounted for the experimental results of ZUR STRASSEN9
), concluding that the rate-determining step of hydrogenation was the adsorption of hydrogen on the surface at lower temperature but the combination of adsorbed ethyl radical with adsorbed hydrogen atom at higher temperature; the optimum temperature of hydrogenation was thus accounted for as the temperatnre, where the rate-determining step switched over from one to the other. Analogical extension of the mechanism to higher olefins predicts that the optimum temperature decreases with increase of molecular weight of olefins as shown in § 18. Hence it is possible that TWIGG and
2 -

Study of the Hydrogenation and Double Bond Migration of l-Butene on Nickel Catalyst
DIBELER and TAYLOR have determined the activation energy over a temperature range around the optimum temperature, where very small or even negative activation energy and a fractional order of reaction are expected as deduced in § 18_
The analogical extension of the mechanism leads to the conclusion, on the other hand, that the activation energy of hydrogenation on nickel catalyst must be common to olefins at sufficiently low temperature, where the adsorption of hydrogen determines rate_ However, TWIGG obtained 8_2, 6.0, 3.3 and 3.3 kcal as the activation energies of the catalyzed deuteration of ethene, propene, 2-butenes and iso-butene respectively over the temperature range from 55 to 120DC in the presence of nickel filament. This indicates again that the temperature range of the observation was around the optimum temperature, since then the observed activation energy should decrease as the optimum temperature shifts from higher to lower temperature with increase of the molecular weight of olefin.
The present work has been devoted to the experimental investigation of the hydrogenation and DBM of I-butene in the presence of nickel catalyst with particular stress on that at low temperature with the purpose of elucidating the above subject in question. Isomers of butene were analyzed by means of gas chromatography_ The experimental results were analyzed for the rate of DBM by a different method from that of TWIGG et al2)'>, which did not require 100% of I-butene as material.
Chapter 1. Experimental
§ 1. Catalyst
The catalyst was about 5% nickel by weight supported on a-alumina. The a-alumina was prepared by heating activated alumina (200 mesh) of W AKO Pure Chemicals Ltd., Tokyo, for 2 hrs at 1300DC, and checked by X-ray diffraction for the absence of r-alumina. Nickel was precipitated by ammonium carbonate from nicke nitrate solution in which a-alumina was suspended. The above nickel solution was prepared by dissolving metallic nickel of International Nickel Corp. in pure nitric acid. The precipitate was heated on a water bath for 30 min, filtered, washed, pelleted and dried at nODc. The pellet of catalyst was broken to small pieces for use.
§ 2. Reactants
Cylinder hydrogen was purified by passing it through calcium chloride, palladium asbestos at 350DC, sodium hydroxide, and liquid nitrogen trap to
3 -

Journal of the Research Institute for Catalysis
remove a trace of water. Butenes were prepared by dehydration of n-butyl alcohol over plain alumina
or alkali added alumina. Butene mixture which contained 30-50% 2-butenes was prepared with plain alumina kept at 350°C at LHSV (liquid hourly space velocity) below 0.6. Another mixture which contained more than 90% I-butene was obtained with alkali added alumina (3% alkali) kept at 350°C at ca. 1.0 LHSV'O
).
Butene mixtures prepared as above were dried over sodium hydroxide, twice distilled into dry ice-alcohol trap and evacuated, and finally condensed in liquid nitrogen trap and evacuated. These mixtures contained less than 1% of impurities consisting of C2 and C3 hydrocarbons and butane, which were neglected in calculating the compositions of butene mixtures.
§ 3. Apparatus and Experimental Method
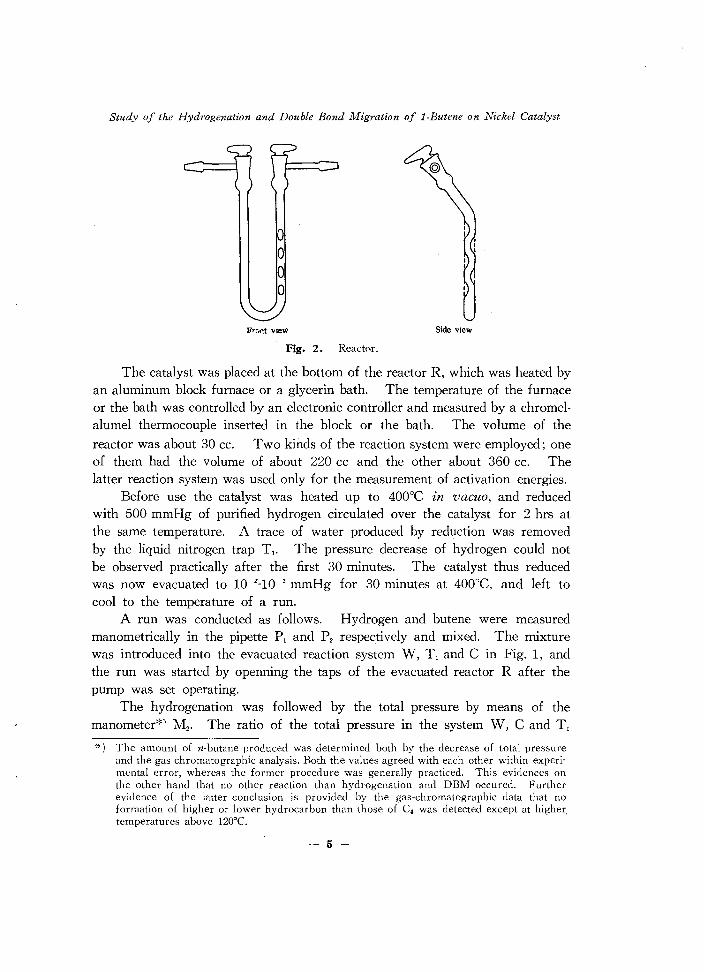
The apparatus was made of hard glass as illustrated in Fig. 1. The reaction system incorporated an U-shaped reactor and a circulating pump of centrifugal type which was operated by an outside magnet. The gas was circulated rapidly in the reaction system through C, W, T, and R to prevent the reaction from being controlled by diffusion. The inlet side of the reactor was given of zigzag shape as shown in Fig. 2, lest the catalyst should be cooled by the rapid flow of gas.
P\lmp
t
Fig. 1. Apparatus.
H 2 : Reservoir of hydrogen C: Circulation pump
B : Reservoir of butene M: Motor
M" M 2 : Manometer BG: Gas burette
Ph P2 : Gas pipette S: Serum cap
R: Reactor F: Furnace or bath
T" T 2 , T3: Liquid nitrogen trap
-4-
Study of the Hydrogenation and Double Bond Migration of l·Butene on Nickel Catalyst
o o o
Fr~"t v leW Side VIew
Fig. 2. React"L
The catalyst was placed at the bottom of the reactor R, which was heated by an aluminum block furnace or a glycerin bath. The temperature of the furnace or the bath was controlled by an electronic controller and measured by a chromel· alumel thermocouple inserted in the block or the bath. The volume of the
reactor was about 30 cc. Two kinds of the reaction system were employed; one of them had the volume of about 220 cc and the other about 360 cc. The latter reaction system was used only for the measurement of activation energies.
Before use the catalyst was heated up to 400°C in vacuo, and reduced with 500 mmHg of purified hydrogen circulated over the catalyst for 2 hrs at the same temperature. A trace of water produced by reduction was removed by the liquid nitrogen trap T,. The pressure decrease of hydrogen could not be observed practically after the first 30 minutes. The catalyst thus reduced was now evacuated to 1O- Z,lO- 3 mmHg for 30 minutes at 400°C, and left to cool to the temperature of a run.
A run was conducted as follows. Hydrogen and butene were measured manometrically in the pipette P, and Pz respectively and mixed. The mixture was introduced into the evacuated reaction system W, T, and C in Fig. 1, and the run was started by openning the taps of the evacuated reactor R after the pump was set operating.
The hydrogenation was followed by the total pressure by means of the manometer*) M z• The ratio of the total pressure in the system W, C and T,
*) The amount of n·butane produced was determined both by the decrease of total pressure and the gas chromatographic analysis. Both the values agreed with each other within experi' mental error, whereas the former procedure was generally practiced. This evidences on the other hand that no other reaction than hydrogenation and DBM occured. Further evidence of the latter conclusion is provided by the gas·chromatographic data that no formation of higher or lower hydrocarbon than those of C. was detected except at higher, temperatures above 120°C.
-5-
Journal of the Research Institute for Catalysis
before communicating R, to that after the communication was preliminarily determined at each reaction temperature using hydrogen. The initial total pressure of the run was calculated by dividing the pressure in W, C and T, observed before the communication by the above ratio. After a recorded time the reaction was stopped by closing the taps of R. The resultant gas in W, C and T, was led to the liquid nitrogen trap Tz and uncondensable gas was pumped off. The condensable component was now transferred by distillation into T3 and then collected in BG by evaporation. A portion of the gas in BG was taken out through the serum cap S by a small syringe and analyzed by means of gas chromatography.
After the run the catalyst was evacuated for 20 minutes at the reaction temperature and left at room temperature with 300 mmHg of hydrogen. Just before the next run the catalyst was kept at 390°C for 20 minutes in the same hydrogen and then evacuated for 30 minutes at the same temperature.
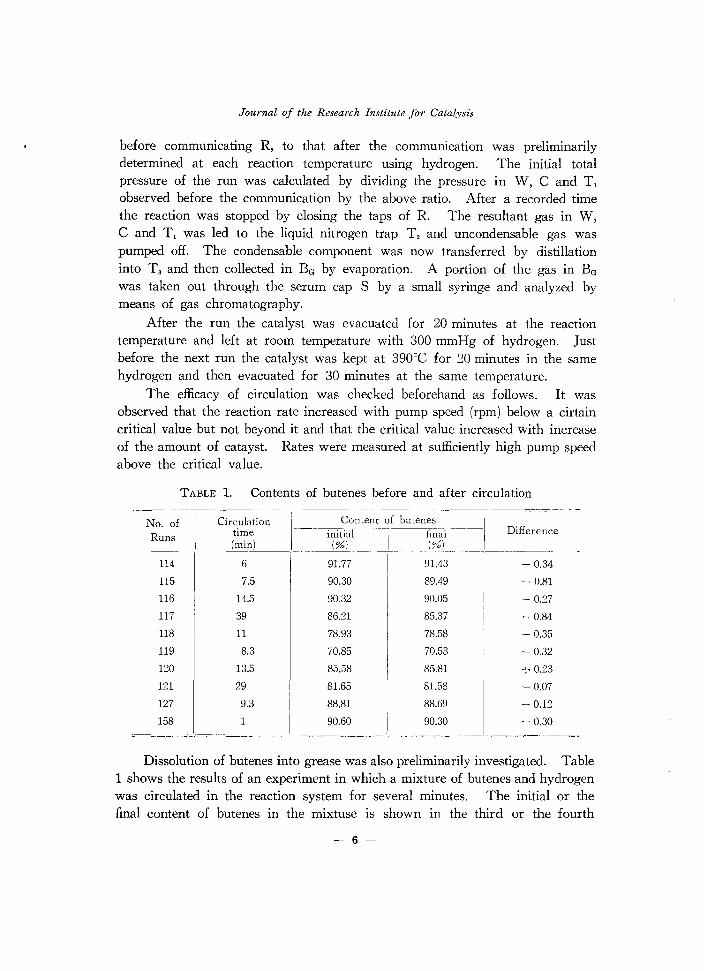
The efficacy of circulation was checked beforehand as follows. It was observed that the reaction rate increased with pump speed (rpm) below a cirtain critical value but not beyond it and that the critical value increased with increase of the amount of catayst. Rates were measured at sufficiently high pump speed above the critical value.
TABLE 1. Contents of butenes before and after circulation ~~~~-=~---I-=-'="'---~
No. of Circulation
Runs
114
115
116
117
118
119
120
121
127
158
time (min)
6
7.5
14.5
39
11
8.3
13.5
29
9.3
1
70.85 70.53 - 0.32
85.58 85.81 -:- 0.23
81.65 81.58 - 0.07
88.81 88.69 - 0.12
90.60 90.30 - 0.30 - .. _----- -------~ ---- ---_.- ~
Dissolution of butenes into grease was also preliminarily investigated. Table 1 shows the results of an experiment in which a mixture of butenes and hydrogen was circulated in the reaction system for several minutes. The initial or the final content of butenes in the mixtuse IS shown in the third or the fourth
-- 6

Study of the Hydrogenation and Double Bond Migration of l-Butene on Nickel Catalyst
column respectively of the Table. The difference between the initial and final butene content in the mixture was so small that the dissolution of butenes into
grease could be neglected.
§ 4. Analysis
The analysis of reactant and resultant gas was conducted at room temperature by means of a home-made gas chromatographic apparatus of thermal conductivity type with platinum filaments in conductivity cell using columns of dimethyl formamide on alumina (7-9 m) or triisobutylene on celite (5 m) and dioctyl phthalate on celite (3 m) in series. Hydrogen was employed as carrier gas, and the composition of gas was determined directly from the areas of chromatogram without correction. This procedure is justified by the coincidence of the quantity of butane thus determined with that observed by manometer.
Chapter II. Results
§ 5. Hydrogenation
Hydrogenation rate was found to vary so slowly with the lapse of time III each run that its extent in the first minute could be practically taken as the initial rate of hydrogenation.
Table 2 and Fig. 3 show the results obtained by maintaining butene pressure constant (about 94 mmHg) and varying hydrogen pressure from 8 to 50 mmHg at O°C. The activity of catalyst did not run down in this experiment conducted at comparatively high partial pressure of hydrogen. The initial rate determined as above was plotted against the partial pressure of hydrogen in Fig. 3, which showed that the rate of hydrogenation was proportional to the partial pressure
TABLE 2. Effect of hydrogen pressure on the rate of hydrogenation
No. of
166
167
169
170
171
172
temperature: O·C, catalyst: 0.042 g.
Initial hydrogen pressure
44.5
8.0
50.1
49.7
32.7
31.4
---- -_._----
- 7
Initial butene pressure
94.1
94.5
93.7
94.7
94.2
93.8
Initial rate
(mmHg/min)
13.5
1.7
13.1
12.4
9.3
9.0

Journal of the Research Institute for Catalysis
of hydrogen. The reactant hydrocarbon in the above experiment contained 91.1% of l·butene, 1.4% of trans·2·butene, 3.1% of cis·2·butene, and 4.4% of n·butane.
'-0 5 " ~ ] ]
Initial pressure of hydrogen (mmHg)
Fig. 3. Initial rate of hydrogenation~hydrogen pressure.
catalyst: 0.042 g, temperature: ooe, initial pressure of butene: 93.7 ~94.7 mmHg
Table 3 and Fig. 4 show the results obtained by maintaining hydrogen partial pressure constant at about 19 mmHg and by varying butene partial pressure from 40 to 180 mmHg at oDe. Some deactivation of the catalyst was observed in the course of this experiment. The effect of butene partial pressures on the rate of hydrogenation was deduced under the circumstances as follows
TABLE 3. Effect of butene pressure on the rate of hydrogenation temperature: oDe, catalyst: 0.071 g
No. of
I
Initial butene
I
Initial hydrogen Initial rate Mean initial pressure pressure rate
Runs (mmHg) (mmHg) (mmHg/min) (mmHg/min)
159 40.4 18.7 10.6 9.1
164 40.6 18.9 7.5
160 I
83.3 19.1 11.6 9.3
163 82.0 i 22.6 7.1
161 124.5
I 18.4 8.9
8.5 162 123.4
I
18.8 8.1
158 179.7
I
19.3 8.0 5.9
165 181.8 19.4 3.7
-8-
Study of the Hydrogenation and Double Bond Migration oIl-Butene on Nickel Catalyst
10
c ." ~ ~ .s c
.S: ;:; 5 ii ~
-:0
'" .0;
'C <-
~
~ ..:;
0 50 100 200 Initial pres,ure of butene (mmHg)
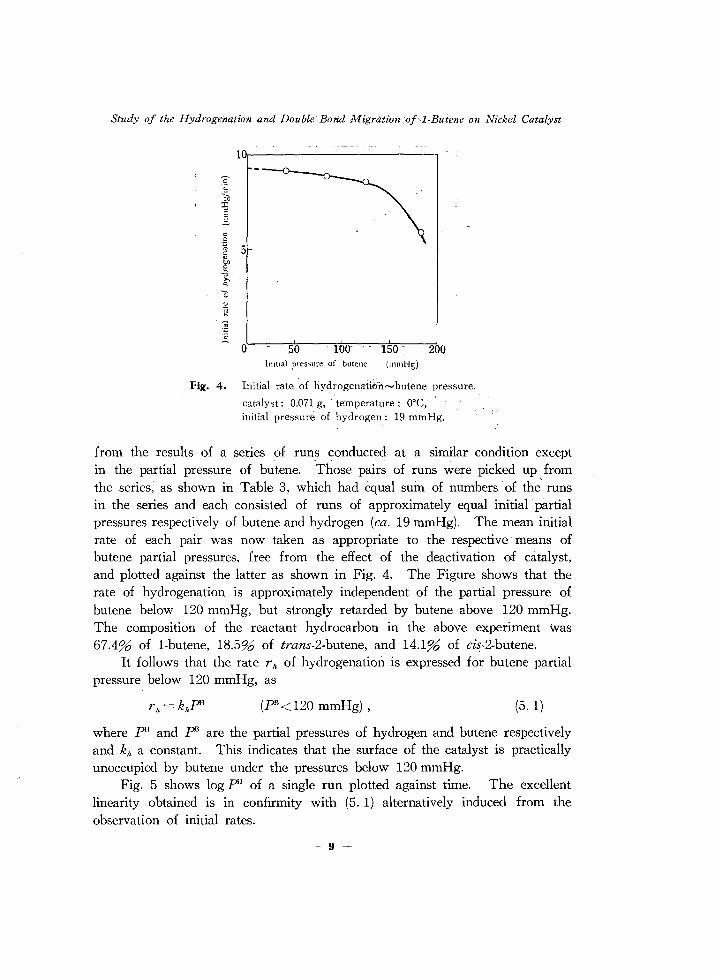
Fig. 4. Initial rate 6£ hydrogenati6n-butene pressure.
catalyst: 0.071 g, temperature: O'C, initial pressure of hydrogen: 19 mmHg.
from the results of a series of runs conducted at a similar condition except in the partial pressure of butene. Those pairs of runs were picked up from the series, as shown in Table 3, which had equal sum of numbers of th~ runs in the series and each consisted of runs of approximately equal initial partial pressures respectively of butene and hydrogen (ca. 19 mmHg). The mean initial rate of each pair was now taken as appropriate to the respective· means of butene partial pressures, free from the effect of the deactivation of catalyst, and plotted against the latter as shown in Fig. 4. The Figure shows that the rate of hydrogenation is approximately independent of the partial pressure of butene below 120 mmHg, but strongly retarded by butene above 120 mmHg. The composition of the reactant hydrocarbon in the above experiment Was 67.4% of I-butene, 18.5% of trans-2-butene, and 14.1% of cis-2-butene.
It follows that the rate r h of hydrogenation is expressed for butene partial pressure below 120 mmHg, as
(PB<120 mmHg) , (5.1)
where pH and pH are the partial pressures of hydrogen and butene respectively and kit a constant. This indicates that the surface of the catalyst is practically unoccupied by butene under the pressures below 120 mmHg.
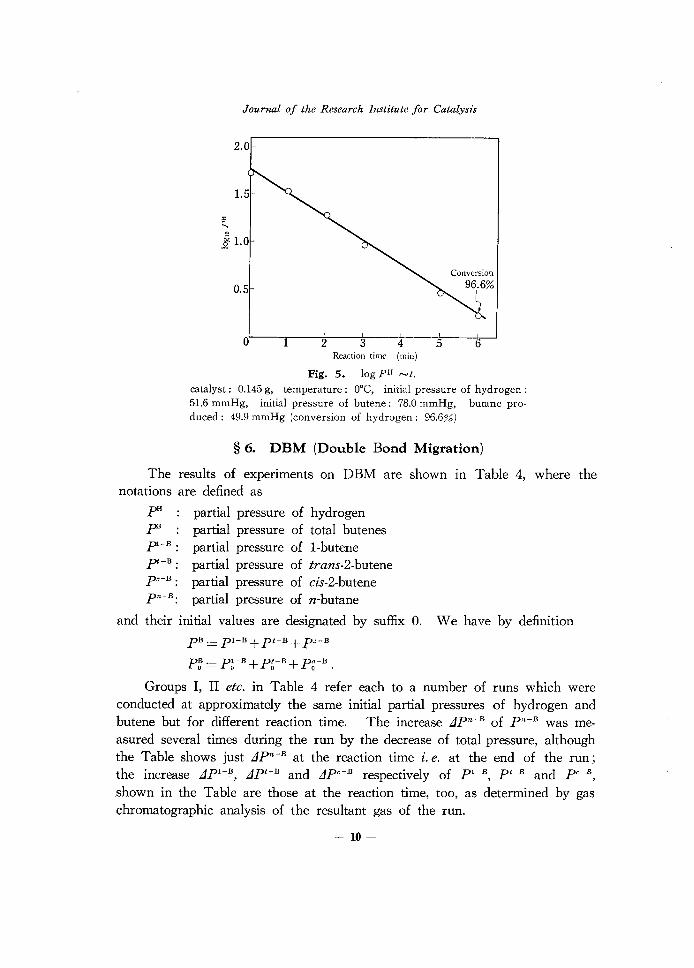
Fig. 5 shows log pH of a single run plotted against time. The excellent linearity obtained is in confirmity with (5. 1) alternatively induced from the observation of initial rates.
-9-
Journal of the Research Institute for Catalysis
2.0
o 1 2 3 4 .5 6 Reaction time (min)
Fig. 5. log pH ~t.
catalyst; 0.145 g, temperature; oce, initial pressure of hydrogen; 51.6 mmHg, initial pressure of butene; 78.0 mmHg, butane produced; 49.9 mmHg (conversion of hydrogen; 96.6%)
§ 6. DBM (Double Bond Migration)
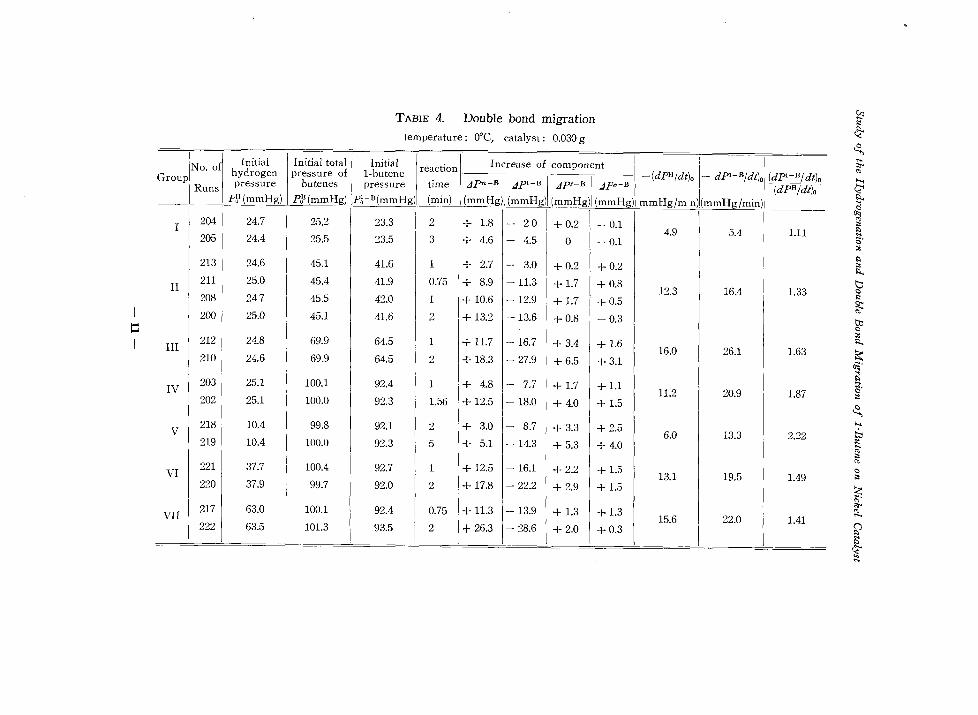
The results of experiments on DBM are shown in Table 4, where the notations are defined as
and
pH partial pressure of hydrogen pE partial pressure of total butenes PI-E: partial pressure of I-butene pt-B: partial pressure of trans-2-butene po-B: partial pressure of cis-2-butene pn-B: partial pressure of n-butane
their initial values are designated by suffix
pB = PI-B + pt-B + pJ-B
p~ = p~-B + p~-B + p~-B .
O. We have by definition
Groups I, II etc. in Table 4 refer each to a number of runs which were conducted at approximately the same initial partial pressures of hydrogen and butene but for different reaction time. The increase ilpn-B of pn-B was measured several times during the run by the decrease of total pressure, although the Table shows just ilpn-B at the reaction time i. e. at the end of the run; the increase ilPI-B, ilpt-B and ilpc-B respectively of PI-B, pt-B and pC-B,
shown in the Table are those at the reaction time, too, as determined by gas chromatographic analysis of the resultant gas of the run.
-10 -
No. of Initial Initial total
Group hydrogen pressure of
Runs pressure butenes
-- FIf(mmHg) PT; (mmHg)
I 204 24.7 25.2
205 24.4 25.5
213 24.6 45.1
II 211 25.0 45.4
208 247 45.5
200 25.0 45.1 t::
III 212 24.8 69.9
210 24.6 69.9
IV 203 25.1 100.1
202 25.1 100.0
V 218 10.4 99.8
219 10.4 100.0
VI 221 37.7 100.4
220 37.9 99.7
VII 217 63.0 100.1
222 63.5 101.3
TABLE 4. Double bond migration
temperature: O°C, catalyst: 0.030 g
Initial reaction Increase of component l·butene ---- -------- -(dPHldt)o pressure time ,jpn-B I ,jPI-B I ,jpt-B I ,jpc-B
p~-B(mmHg) (min) (mmHg) (mmHg) (mmHg) (mmHg) mmHg/m n)
23.3 2 + 1.8 - 20 +0.2 - 0.1 4.9
23.5 3 + 4.6 - 4.5 0 - 0.1
41.6 1 + 2.7 - 3.0 +0.2 +0.2 41.9 0.75 + 8.9 -11.3 + 1.7 +0.8
12.3 42.0 1 + 10.6 -12.9 + 1.7 +0.5
41.6 2 + 13.2 -13.6 +0.8 -0.3
64.5 1 + 11.7 -16.7 + 3.4 + 1.6 16.0
64.5 2 + 18.3 - 27.9 +6.5 +3.1
92.4 1 + 4.8 - 7.7 + 1.7 +1.1 11.2
92.3 1.56 + 12.5 -18.0 + 4.0 + 1.5
92.1 2 + 3.0 - 8.7 + 3.3 + 2.5 6.0
92.3 5 + 5.1 -14.3 + 5.3 + 4.0
92.7 1 + 12.5 -16.1 +2.2 + 1.5 13.1
92.0 2 + 17.8 - 22.2 +2.9 + 1.5
92.4 0.75 + 11.3 -13.9 + 1.3 + 1.3 15.6
93.5 2 + 26.3 - 28.6 + 2.0 +0.3
- dPI-Bldt)o (dPI-BI dt)o (dpH/dt)o
(mmHg/min)
5.4 1.11
16.4 1.33
26.1 1.63
20.9 1.87
13.3 2.22
19.5 1.49
22.0 1.41
~ ~
~ ~ ... ~
$ ~ <:l ~ ::!
~ c· ::!
'" ::! ~
~ ~
~ ~ ::! ~
~ ()Q' ~ ... c· ::!
~ ..... ti;, ~ ~ ::!
" c ::!
~ ;::...
~ ~ ~ ~
Journal of the Research Institute for Catalysis
2
-- Time (min)
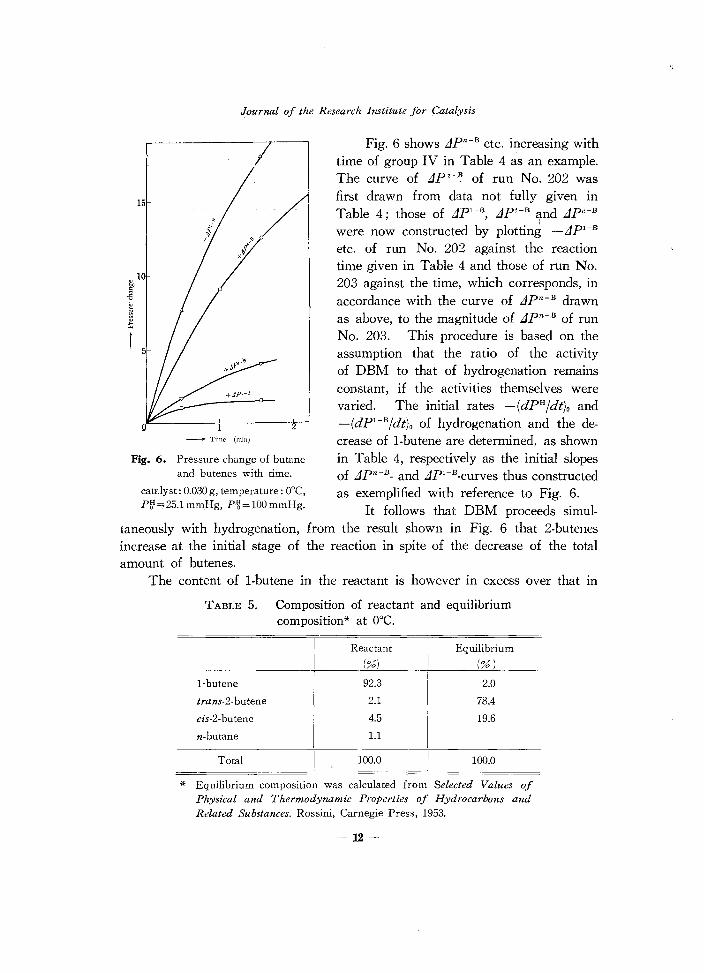
Fig. 6. Pressure change of butane and butenes with time.
catalyst; 0.030 g, temperature; O°C, P~ = 25.1 mmHg, p~ = 100 mmHg.
taneously with hydrogenation, increase at the initial stage of amount of butenes.
Fig. 6 shows LJpn-B etc. increasing with time of group IV in Table 4 as an example. The curve of LJpd3 of run No. 202 was first drawn from data not fully given in Table 4; those of LJplB, LJY-B ~nd LJpc-B were now constructed by plotting _LJpl-B etc. of run No. 202 against the reaction time given in Table 4 and those of run No. 203 against the time, which corresponds, in accordance with the curve of LJpn-B drawn as above, to the magnitude of LJpn-B of run No. 203. This procedure is based on the assumption that the ratio of the activity of DBM to that of hydrogenation remains constant, if the activities themselves were varied. The initial rates -(dPHldt)o and -(dP'-Bldt)o of hydrogenation and the decrease of I-butene are determined, as shown in Table 4, respectively as the initial slopes of LJpn-B_ and LJP'-B-curves thus constructed
as exemplified with reference to Fig. 6. It follows that DBM proceeds simul
from the result shown in Fig. 6 that 2-butenes the reaction in spite of the decrease of the total
The content of I-butene in the reactant is however in excess over that III
TABLE 5. Composition of reactant and equilibrium composition* at O°C.
Reactant Equilibrium
(%) (%)
I-butene 92.3 2.0
trans-2-butene 2.1 78.4
cis-2-butene 4.5 19.6
n-butane 1.1
Total 100.0 100.0
* Equilibrium composition was calculated from Selected Values of Physical and Thermodynamic Properties of Hydrocarbons and Related Substances. Rossini, Carnegie Press, 1953.
-12-
Study of the Hydrogenation and Double Bond Migration of l-Butene 011 Nickel Catalyst
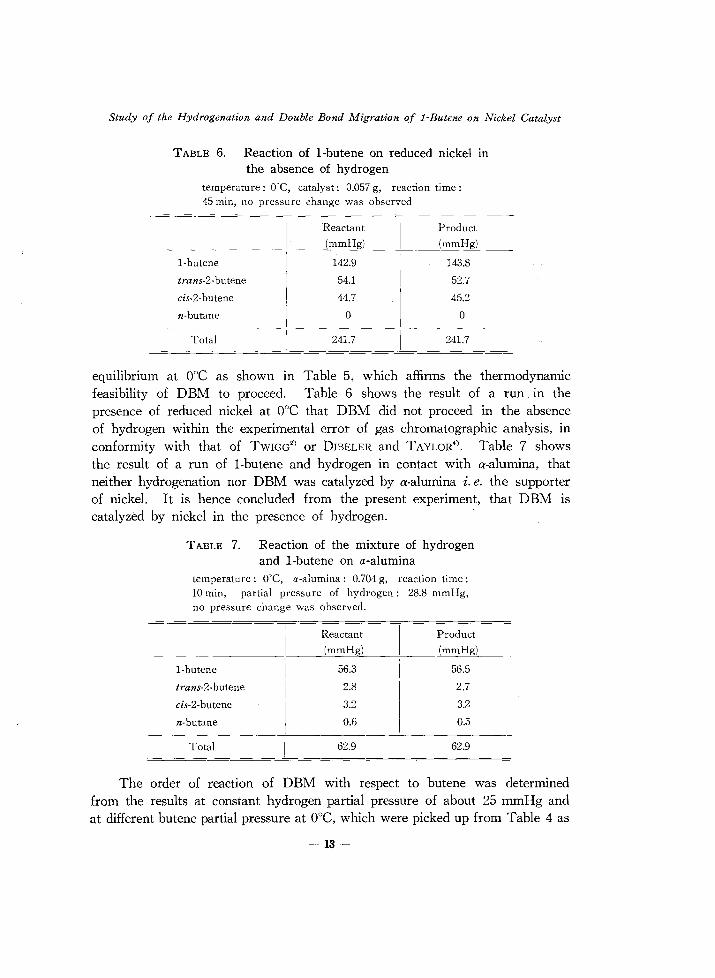
TABLE 6. R.eaction of I-butene on reduced nickel in the absence of hydrogen
temperature: O"C, catalyst: 0.057 g, reaction time: 45 min, no pressure change was observed
'Reactant Product
(mmHg) (mmHg)
I-butene 142.9 143.8
trans-2-butene 54.1 52.7
cis.2-butene 44.7 45.2
II-butane 0 0
Total 241.7 241.7
equilibrium at ooe as shown III Table 5, which affirms the thermodynamic feasibility of DBM to proceed. Table 6 shows the result of a run in the presence of reduced nickel at ooe that DBM did not proceed in the absence of hydrogen within the experimental error of gas chromatographic analysis, in conformity with that of TWIGG2
) or DIBELER and TAYLOR4). Table 7 shows
the result of a run of I-butene and hydrogen in contact with a-alumina, that neither hydrogenation nor DBM was catalyzed by a-alumina i. e. the supporter of nickel. It is hence concluded from the present experiment, that DBM is catalyzed by nickel in the presence of hydrogen.
TABLE 7. R.eaction of the mixture of hydrogen and I-butene on a-alumina
temperature: O°C, a·alumina: 0.704 g, reaction time: 10 min, partial pressure of hydrogen: 28.8 mmHg, no pressure change was observed.
Reactant Product
(mmHg) (mmHg)
I-butene 56.3 56.5
trans-2· butene 2.8 2.7
cis-2-butene 3.2 3.2
n-butane 0.6 0.5
Total 62.9 62.9
The order of reaction of DBM with respect to butene was determined from the results at constant hydrogen partial pressure of about 25 mmHg and at different butene partial pressure at ooe, which were picked up from Table 4 as
-13-

Journal of the Research Institute for Catalysis
shown in Table 8. The consistent value of (dpt-B/dt)o unaffected by the change of catalytic activity should be obtained by multiplying (dp·-B/dt)o/(dpH/dt)o, unaffected as assumed above by similarly unaffected value of (dPH /dt)o.
TABLE 8. Effect of I-butene pressure on the rate of decrease of I-butene
temperature: O°C, catalyst: 0.030 g
No. of I Initial hydrogen I Initial1·butene Il---.-=-8 I (C!f'-B/d~ Correction I pressure pressure Po (dPH/dt)o fact?~ of r=(a)x(b)
Runs .1 activIty PI} (mmHg) Pt-B (mmHg) mmHgz (a) (b)
204, 205 24.5 23.4 4.84 1.11 0.989
I
1.10 !
200, 208 24.8 41.8 6.47 1.33 0.979 1.30 211, 213
I 210, 212 24.7 ! 64.5 8.03 I 1.63 0.968 1.58
I 202, 203 25.1 92.3 9.61 1.87 0.946
I 1.77
The value of (dPH /dt)o, from which the effect of change of catalytic activity was eliminated as in § 5, is shown in Table 3 and Fig. 4. The corrected value of (dPH/dt)o decreases slightly with increase of butene pratial pressure even below 120 mmHg as seen from Fig. 4. Table 8 shows the ratio (b) of the value of (dPH/dt)o to that at zero butene partial pressure as derived from the result of Fig. 4. The product r of (b) and (a)=(dpt-B/dt)o/(dpH/dt)o shown in Table 8 is now the fraction of (dp·-B/dt)o over (dPH/dt)o at pB=O unaffected
p~-B mmHg by the change of catalytic activity.
2!.-__ ~20r-~4TO~~6rO __ ~80~~100 The product r is plotted in Fig. 7 against p~-B as well as its square root, which shows that r varies linearly with I P~-B. The intercept 0.36 of the straight line of r vs I p~-B on the ordinate gives now the ratio of the hydrogenation rate of I-butene to that of total butenes. Admitting that the hydrogenation rate is approximately constant independent of pB or p.-B, the excess r m of rover 0.36 should be the rate of DBM, which is proportional to the square root of I-butene pressure, i. e.
... 1
2 4 6 8
Fig. 7. r_n-B and r_lptog
temperature: ODC
10
(6.1)
The order of reaction of DBM
-14 -
Study of the Hydrogenation and Double Bond Migration of l·Butene on Nickel Catalyst
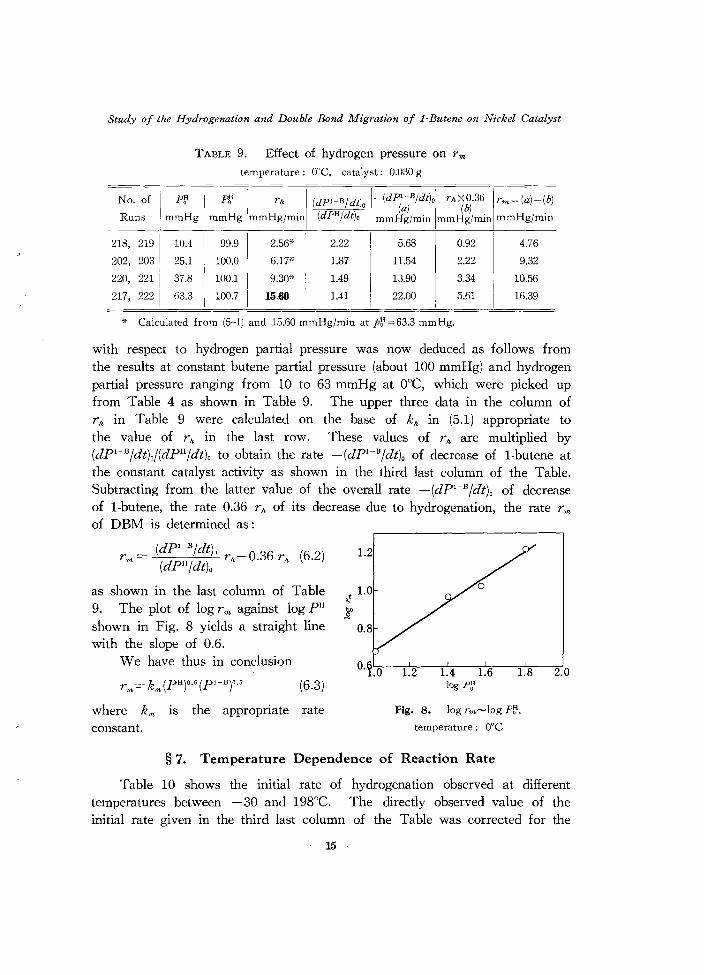
TABLE· 9. Effect of hydrogen pressure on r m
temperature: O°C, catalyst: 0.030 g
.' I No. of P/! . P~ I rlt (dPl-Bj dt)o _(dPl_Bjdt)ol rltxO.36
Runs I mmHg I mmHg ImmHgjmin (dPHjdt)o (a) (b)
mmHgjmin mmHg/min
219 I
I I
218,
203 !
10.4 99.9 2.56"
I
2.22 5.68 0.92
202, 25.1 100.0 6.17* 1.87 11.54 2.22
220, 221 I 37.8 I
100.1 9.30* I 1.49 13.90 3.34 I
I 217, 2221 63.3
I 100.7
I 15.60 1.41
I 22.00 5.61
I
-If Calculated from (5-1) and 15.60 mmHgjmin at p/!=63.3 mmHg.
rm=(a)-(b)
mmHgjmin
I 4.76
9.32
10.56
I 16.39
with respect to hydrogen partial pressure was now deduced as follows from the results at constant butene partial pressure (about 100 mmHg) and hydrogen partial pressure ranging from 10 to 63 mmHg at ooe, which were picked up from Table 4 as shown in Table 9. The upper three data in the column of r lt in Table 9 were calculated on the base of k,. in (5.1) appropriate to the value of rlt in the last row. These values of rlt are multiplied by (dPl-B/dt)o/(dpH/dt)o to obtain the rate -(dr-Bjdt)o of decrease of l·butene at the constant catalyst activity as shown in the third last column of the Table. Subtracting from the latter value of the overall rate _(dPl-B/dt)o of decrease of I-butene, the rate 0.36 r lt of its decrease due to hydrogenation, the rate rm of D BM is determined as:
r = (dPl-B/dt), r -0.36 r (6.2) m (dPH /dt)o It It
as shown in the last column of Table 9. The plot of log r m against log pH
shown in Fig. 8 yields a straight line with the slope of 0.6.
We have thus in conclusion
(6.3)
where k", is the appropriate rate constant.
1.2
1.0 .!! ~
1.4 1.6 1.8 log Pi]
Fig. 8. log rm-log P/!.
temperature: O°C
§ 7. Temperature Dependence of Reaction Rate
2.0
Table 10 shows the initial rate of hydrogenation observed at different temperatures between -30 and 198°e. The directly observed value of the initial rate given in the third last column of the Table was corrected for the
~ 15-

-
No. of
Runs
269
271
272
273
274
275
276
277
278
279
280
281
Journal of the Pesearch Institute for Catalysis
TABLE 10. Rate of hydrogenation catalyst: 0.023 g, f= 1.0759
I Temperature I prJ I P~ I Initial rate I
(0C) (mmHg) (mmHg) (mmHg/min)i
0 39.7 34.7 5.9
- 33 39.3 33.6 0.2
0 39.3 34.4 3.9
- 33 39.3 34.4 0.2
- 19.5 39.3 34.5 0.9
0 39.8 34.8 3.6
- 19.5 39.6 34.5 0.9
0 40.0 35.0 2.9
120 40.5 34.9 4.1
198 40.6 35.5 1.1
100 40.6 35.1 4.3
- 20.7 39.1 34.3 0.5
1.00
1.16
1.25
1.35
1.45
1.56
1.68
1.81
1.95
2.10
2.26
2.43
I
Corrected initial rate
(mmHg/min)
(5.9)
0.23
4.9
0.27
1.3
5.6
1.5
5.2
8.0
2.3
9.7
1.2
regular deactivation of the catalyst by multiplying by f n, where n was the
number of run and f the factor of deactivation for a run, which was fitted to several measurements of the initial rate at ooe (Nos. 269, 272, 275 and 277) inserted here and there in the series. of runs. The initial rates thus corrected are shown in the last column of Table 10 and plotted against the reciprocal of absolute temperature in Fig. 9.
Table 11 shows (dP'-Bjdt)o which was measured simultaneously with rio in the runs given in Table 10 at 0 and ca. -20oe, the appropriate value of (dP,-Bjdt)oj(dpHjdt)o and that of rno calculated from them by (6.2). The value of rm is plotted in Fig. 9 as shown by a chain line.
TABLE II. Temperature dependence of r m
catalyst: 0.023 g
No. of Runs Temperature (dP,-B/dt)o rio r", (0C) (dPH/dt)o (mmHg/min) (mmHg/min)
275 0 1.15 5.6 4.4
277 0 1.15 5.2 4.1
276 -19.5 1.39 1.5 1.6
281 - 20.7 1.42 1.2 1.3
-16 -

Study of the Hydrogenation and Double 130nd Migration of l-13utene on Nickel Catalyst
500
100
50
10
5
1.0
0.5
\ I \ /
'" /1 \ /' \ /' ,
/ \
I ' I ' I \
f'
(3P , ,
0.1L--_-+5_O _--, __ 0.l...-,--L' _5-L0-,--_1--'0_0....,-15,LO_. 2-,0_0,...-'.":C---1 ~5 ~O 15 10 ~5 ~O 1.5
1/Tx1O'
Fig. 9. Temperature dependence of reaction rate.
F~ = 39-40 mmHg, p~ = 34-35 mmHg
The rate of hydrogenation increases rapidly with temperature between -30 and oDe, but decreases slowly above lOOoe as shown in Fig. 9, the appropriate activation energies being 11.8 and -5.6 Kcal/mol respectively. The optimum temperature is located on the intersection at 31°e of the two lines in Fig. 9. The activation energy of DBM was found to be 7.2 Kcal from the slope of the chain line in Fig. 9.
§ 8. Reaction at High Temperature
A trace of iso-butane was found in the product at high temperatures above 120oe, whereas no isomerization of carbon skelton was observed at temperatures below oDe. The result obtained at 198°e is shown in Table 12 as an exmple.
The total pressure of hydrocarbons decreased by 4.8% through the reaction as shown in Table 12, which could not be attributed to the dissolution into grease according to § 3. This should be due to polymerization to higher
-17-

Journal of the Research Institute for Catalysis
TABLE 12. Distribution of hydrocarbons in the product at 198°C.
catalyst: 0.023 g, FfjI =40.6 mmHg, reaction time: 16.3 min mmHg
iso- n-C4HI011-C4H. trans-I cis-C4H lO
I 2-C4H. 2-C.H.
0.9 89.5 4.5 4.9
trace 12.4 7.4 8.6 5.1
Reactant I 35.5 trace 0.10 i 0.10 I
Product 33.8 0.03 i 0.09 ' 0.16 I
I I ,
hydrocarbons possibly accompanied or by cracking to lower hydrocarbons. The cracking took place actually as evidenced by the increase of total amount of C2 and C3 hydrocarbons through the reaction. Methane was not detectable, if formed at all, because it could not be condensed by liquid nitrogen trap. Neither the polymerization was ascertained because higher hydrocarbons than
o
p~ =40.6mmHg
p~ = 35.5 nunHg
Time {min)
15
Fig. 10 (a). Decrease fo total pressure with time at 198'C.
t ~
0.08
I 0.070 ~ ~
0.065
Time (min)
Fig. 10 (b). Fit of rate equations.
-18 -
t 1.50
~ 0
&. ~
.40
15
Study of the Hydrogenation and Double Bond Migration of l-Butene on Nickel Catalyst
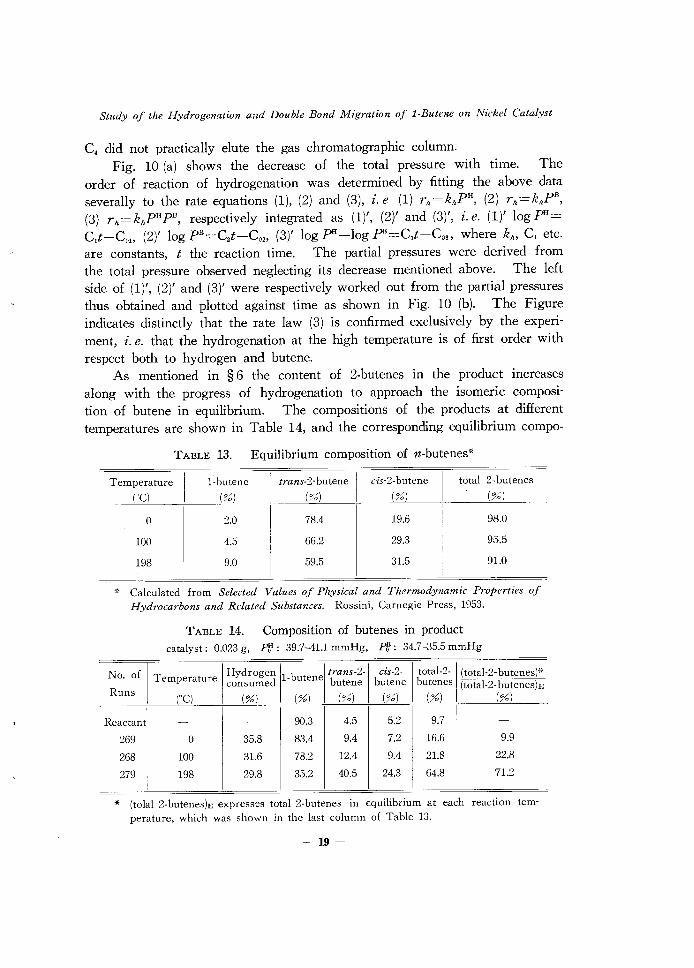
C. did not practically elute the gas chromatographic column_
Fig. 10 (a) shows the decrease of the total pressure with time. The order of reaction of hydrogenation was determined by fitting the above data severally to the rate equations (1), (2) and (3), i. e (1) rh=khPH
, (2) rh=khPB,
(3) rh=k"PHPB, respectively integrated as (1)" (2)' and (3)', i. e. (1)' log pn=
C,t-CO" (2)' log P B =C2t-C02 , (3)' log pn-Iog P 8 =C,t-Co" where kh' C, etc. are constants, t the reaction time. The partial pressures were derived from the total pressure observed neglecting its decrease mentioned above. The left side of (1)" (2)' and (3)' were respectively worked out from the partial pressures thus obtained and plotted against time as shown in Fig. 10 (b). The Figure indicates distinctly that the rate law (3) is confirmed exclusively by the experiment, i. e. that the hydrogenation at the high temperature is of first order with respect both to hydrogen and butene.
As mentioned in § 6 the content of 2-butenes in the product increases along with the progress of hydrogenation to approach the isomeric composition of butene in equilibrium. The compositions of the products at different temperatures are shown in Table 14, and the corresponding equilibrium compo-
TABLE 13. Equilibrium composition of n-butenes*
Temperature I-butene trans-2-butene cis-2-bu tene total 2-butenes (-C) (%) (%) (%) (%)
0 2.0 78.4 19_6 98.0
lOO 4.5 66.2 29.3 95.5
198 9.0 59.5 31.5 91.0
,,- Calculated from Selected Values of Physical and Thermodynamic Properties of Hydrocarbons and Related Substances. Rossini, Carnegie Press, 1953.
TABLE 14. Composition of butenes in product catalyst: 0.023 g, PI,!: 39.7-41.1 mmHg, Pff: 34.7-35.5 mmHg
No. of I Temperature I Hydroged 11-butenel tbans-2-1 bcis-2- I ~otal-2-1 (total-2-butenes)l' Runs consume utene utene utenes (total-2-butenes)E
(0C) (%) (%) (%) (%) (%) (%)
Reactant - - 90.3 4.5 5.2 9.7 -
269 0 35.8 83.4 9.4 7.2 16.6 9.9
268 lOO 31.6 78.2 12.4 9.4 21.8 22.8
279 198 29.8 35.2 40.5 24.3 64.8 71.2
* (tolal 2-butenes)E expresses total 2-butenes in equilibrium at each reaction temperature, which was shown in the last column of Table 13.
-19 -

Journal of the Research Institute for Catalysis
sition at each temperature in Table 13. The notation (total-2-butenes)B III
Table 14 represents the content of total 2-butenes in equilibrium, which is given in the last column of Table 13. Table 14 shows the content of 2-butenes approaches rapidly to that in equilibrium with rise of temperature, notwithstanding the smaller extent of hydrogenation at higher temperature than at lower temperature, i. e. that r m increases with temperature more rapidly than r,. does.
The results obtained in the present experiment are summerized in Table 15.
TABLE 15. Order of reaction and activation energy
Low temp. «O°C) I High temp. (>100'C)
Hydrogenation
Isomerization 1-butene-> 2-butenes
f Order of reaction
lActivation energy
f Order of reaction
lActivation energy
11.8 Kcal
{PH)O.' (P'-B)O.'
7.2 Kcal
Chapter III. Discussion
§ 9. TWIGG's Mechanism
-5.6 Kcal
TWIGG3) has proposed the following mechanism for the catalyzed hydro
genation of ethene in the presence of nickel catalyst:
(3) (1) +H2 (7)
CzR. ~ CR.-CR. ~ CR3 --> CR3-CR3
(2) I I (4) I Ni Ni CR. R
I I 8, Ni Ni
CR2-CR2 R I I I Ni Ni Ni
(5) ~CR3
(6) I CR. I Ni
83 8.
This mechanism leads to the relations at the steady state
8 .- [ k3k, pH]! 2- k.(k.+k,)
03
,= [ k3k. p]~e, k,(k. +k,) ,
- 20-
Study of the Hydrogenation and Double Bond Migration of l·Butene on Nickel Catalyst
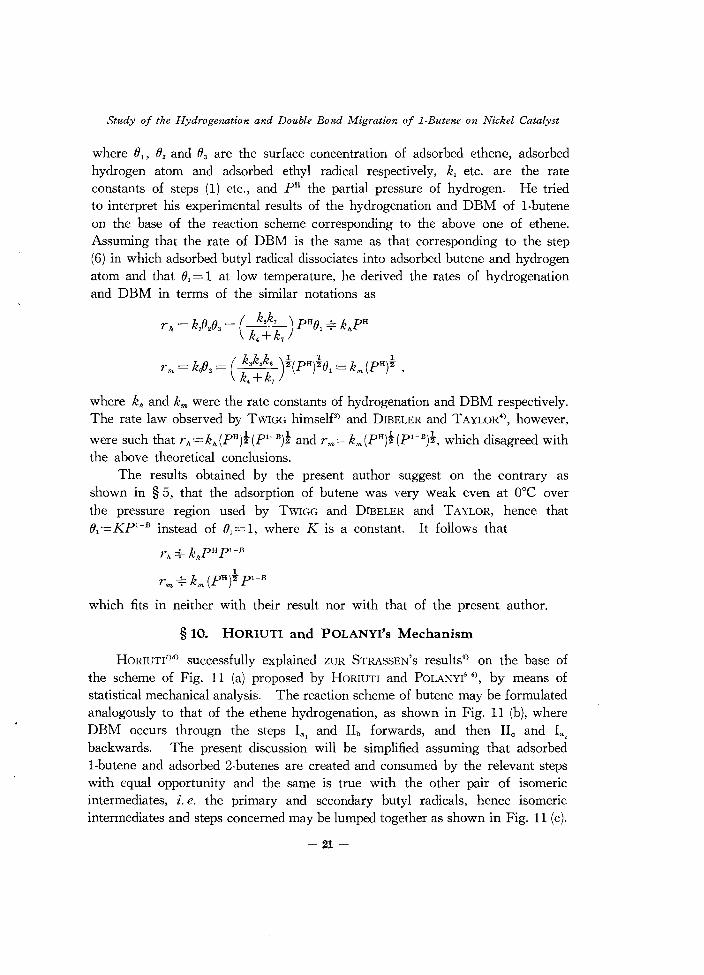
where 01 , O2 and 03 are the surface concentration of adsorbed ethene, adsorbed hydrogen atom and adsorbed ethyl radical respectively, kl etc. are the rate constants of steps (1) etc., and pH the partial pressure of hydrogen. He tried to interpret his experimental results of the hydrogenation and DBM of l·butene on the base of the reaction scheme corresponding to the above one of ethene. Assuming that the rate of DBM is the same as that corresponding to the step (6) in which adsorbed butyl radical dissociates into adsorbed butene and hydrogen atom and that 01 = 1 at low temperature, he derived the rates of hydrogenation and DBM in terms of the similar notations as
r - k {} 0 .- ( k3k, ) pHO -.:.. k pH It- 723- --- 1--;- h
k.+k,
r = k 0 = '5 6 2(PH)20 = k (PH)2 ( k k k)~ 1. ~
111> 63 k kim , .+ , where kh and k", were the rate constants of hydrogenation and DBM respectively. The rate law observed by TWIGG himself') and DIBELER and TAYLOR'>' however,
were such that r,t=kh(pH)!(r-B)l and rm=km(PH)!(r-B)i, which disagreed with the above theoretical conclusions.
The results obtained by the present author suggest on the contrary as shown in § 5, that the adsorption of butene was very weak even at aGe over the pressure region used by TWIGG and DIBELER and TAYLOR, hence that 01 =KP1-B instead of 01 = 1, where K is a constant. It follows that
r't '*' khPH PI-B 1
r", =i= k", (PH )2 r- B
which fits III neither with their result nor with that of the present author.
§ 10. HORIUT! and POLANYI's Mechanism
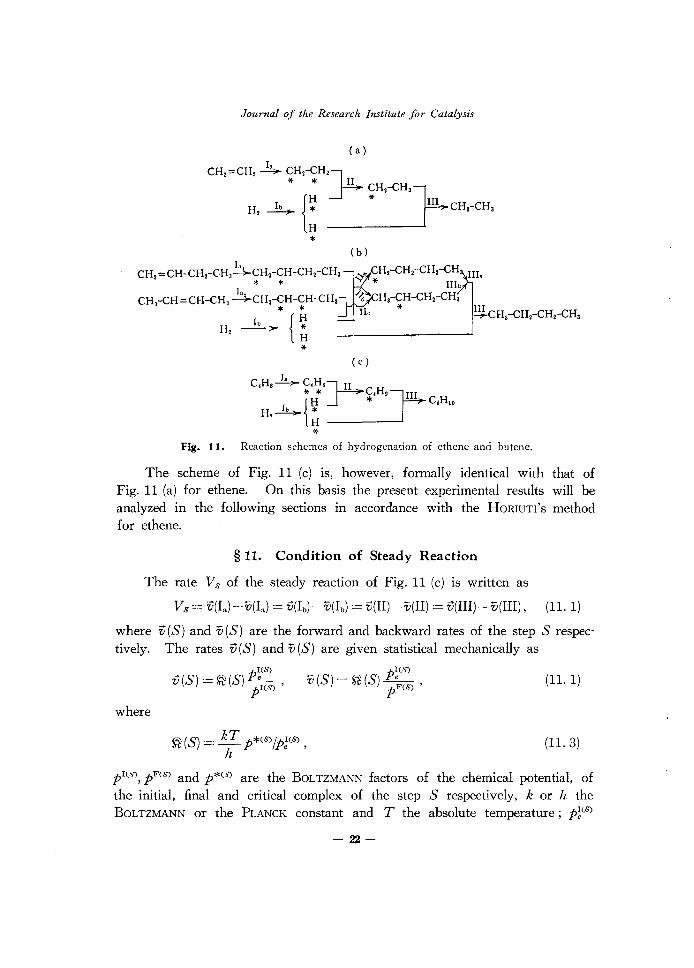
HORIUTr')8) successfully explained ZUR STRASSEN'S results') on the base of the scheme of Fig. 11 (a) proposed by HORIUTI and POLANYI5 6>, by means of statistical mechanical analysis. The reaction scheme of butene may be formulated analogously to that of the ethene hydrogenation, as shown in Fig. 11 (b), where DBM occurs througn the steps la, and IIb forwards, and then IIe and la, backwards. The present discussion will be simplified assuming that adsorbed l·butene and adsorbed 2·butenes are created and consumed by the relevant steps with equal opportunity and the same is true with the other pair of isomeric intermediates, i. e. the primary and secondary butyl radicals, hence isomeric intermediates and steps concerned may be lumped together as shown in Fig. 11 (c).
- 21-
Journal of the Research Institute for Catalysis
(a)
CH,=CH, ~ CH,-CH'i II
* * y CH,-CH'lm
H, ~ {: * J4" CH,-CH,
* (b)
)'1 CH CH,=CH-CH,-CH,-CH,-CH-CH,- ,
* * lao
,.? CH,-CH,-CH,-CH III. " * IIIb
H,-CH-CH,-CH, CHa-CH = CH-CH, ---+CH,-CH-CH-CH, * *
H ~ {It * ~CH,-CHcCH,-CH3
2 H
* (c)
C,H,~ c,H'}41 * * C.H, rIll
H,~ * {H * C,H lO
H *
Fig. 11. Reaction schemes of hydrogenation of ethene and butene.
The scheme of Fig. 11 (c) is, however, formally identical with that of Fig. 11 (a) for ethene. On this basis the present experimental results will be analyzed in the following sections in accordance with the HORJUTI'S method for ethene.
§ 11. Condition of Steady Reaction
The rate Vs of the steady reaction of Fig. 11 (c) is written as
Vs = v(Ia)-v(I,) = ti(Ib)-v(Ib) = ti(II)-v(II) = ti(III)-v(III), (l1.1)
where titS) and :O(S) are the forward and backward rates of the step S respectively. The rates titS) and v(S) are given statistical mechanically as
where
PI(s)
titS) = ~(S) er(S) ,
p
~ (S) = k: p*(S) /p;(S) ,
Pres)
v(S) = ~(S) ;"(S)' P
(11.1)
(11. 3)
pI(.'», pF(S) and p*(S) are the BOLTZMANN factors of the chemical potential, of
the initial, final and critical complex of the step S respectively, k or h the BOLTZMANN or the PLANCK constant and T the absolute temperature; p~(s)
- 22-
Study of the Hydrogenation and Double Bond Migration of i-Butene on Nickel Catalyst
and p;(f{) represent the particular values of pI(f{) and pF(f{) in the case, where every step but S is in equilibrium_ It is obvious from (11.2) that ~ (S) represents the rate of the forward reaction of the step S in the particular case, where pI(S) =p~(s).
Denoting hydrogen and butene in gas by Hand B respectively, p!(f{) IS
written as
(11. 4)
We introduce now the quantities r(H), r(CH.), r(C,Hg) and r defined as
r(H) = (pHy/z/pH(a) , r(C,H.)=pB/pc.H,(a) }
r (CHg) =pB (pH)'/Z /pC,H,(a), r =p;(III) /pF(III) =pBpH /p . (11. 5)
where (a) denotes the adsorbed state and A butane in gas. The quantity r (H), for example, is the relative activity of H (a) referred to the absolute activity of H(a) at the particular state, where all steps in Fig. 11 (c) which derive H(a) from the reactant H + B are respectively in equilibrium.
The rates v(S) and v(S) are expressed by (11.2), (11.4) and (11.5) as
v(I.) = ~(Ia) , v(Ib) = ~(Ib) , v(Il) = r(C.H.) r(H) ~ (II) }
v(IlI) = r(C,Hg)r(H)~(III) (11.6)
v(Ia) := r(C,H.) ~(Ia), V(Ib) = I(I-I)'~(Ib)' v(Il) = r(C,Hg)@(II)
v(IlI) = r~ (III) .
Hence (11. 1) is written as
Vs= @(Ia)(I-r(C,H.)) =~(h)(I-r(H)Z) 1 =~(II)(r(H)r(CH.)-r(C,Hg)):=~(III)(r(H)r(C,Hg)-F)). f (11.7)
The factor p*(S) is written for a step occuring on a surface as·)
(11. 8)
where e * is the probability of a site a; for the critical complex *(S) of oslO)
the step S being unoccupied, G*(f{) the number of sites at per unit area of the surface; q*(S) is the BOLTZMANN factor of the reversible work e*(S) i. e. that at statistical equilibrium required to bring up a critical complex *(S) from its standard state to set it up in a definite, preliminarily evacuated site at , z. e.
q*(S) = exp( -e*(S)/RT) .
And pH and pB are expressed as·)
pH=QH/NH, pB=QB/NB,
-23-
(11. 9)

Journal of the Research Institute for Catalysis
where QH and QB is the partition function of a single gaseous molecule in unit volume, N H or N B the concentration in gas of hydrogen or butene respectively.
Defining KN(s) as
(11. 10)
!R(S) is written by (11.3), (11.4), (11.8), (11.9) and (11.10) as
~(I,,.)=KN(Ia)NB/QB, !R(Ib),=KN(Ib)NH/QH }
~(II)=KN(II)NB(NH)1/2/QB(QHyI2, ~(III)=Kv(III)NBNH/QBQH.
(11.11)
We have on the other hand from (11. 7)
V .- r(H)2(1-r(C,H,)) ._ 1-r(H)2 ._ r(H)'J(C,H,)-r(H)r(C,H 9 )
s- r(H)2/~(Ia) -- 1m(Ib) - r(H)m(II)
._ r(H)r(C,H9)-r _ 1-r l/@(III) r(H)2/!R (ra ) + 1/~ (Ib) + r(H)/~ (II) + l/~(III)
(11.12)
hence
(11. 13)
or
1-r._ r(H)'QB QH r(H) (QHYI2QB QHQB -v.;- - KN(Ia)NB + KN(Ib)NH + KN(II) (NH)1/2NB + KN(III)NHNB
(11. 14) according to (11. 11).
§ 12. Rate-Determining Step
The quantity r is given according to (11.5) and (11.9) as')
pA 1 r=--·-pHpB Kp
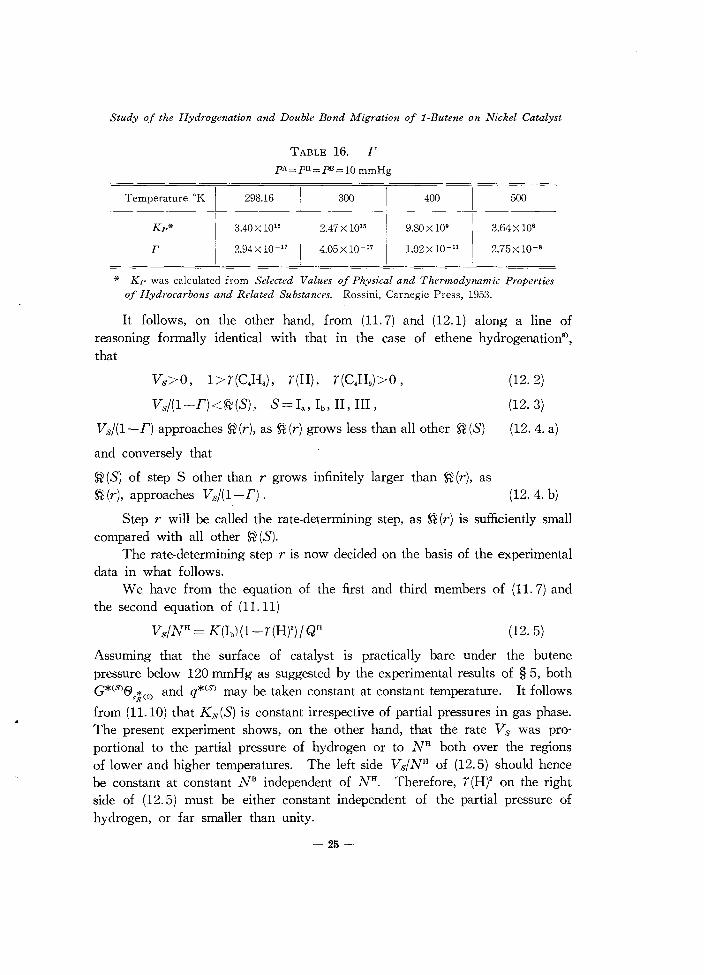
where pH, pB and pA are the partial pressures of hydrogen, butene and butane respectively under the condition of the experiment, Kp the equilibrium constant expressed by pressure. Table 16 shows the values of r calculated by the above equation for the condition pA=PH=PB=10 mmHg. It is obvious that r is negligibly smaller than unity, although positive by definition, i. e.
o<r<{l (12. 1)
- 24-
Study of the Hydrogenation and Double Bond Migration of I-Butene on Nickel Catalyst
Temperature oK
r
TABLE 16. r PA=PH=PB=10 mmHg
3.40 X 10¹⁵
2.94 X 10⁻¹⁷
300
2.47 X 10¹⁵
4.05xlO- 17
400
9.80x 10'
1.02 x 10- 11
500
3.64X 10⁶
2.75x lO-s
* Kp was calculated from Selected Values of Physical and Thermodynamic Properties of Hydrocarbons and Related Substances. Rossini, Carnegie Press, 1953.
It follows, on the other hand, from (11. 7) and (12.1) along a line of reasoning formally identical with that in the case of ethene hydrogenationS
\
that
Vs>O, 1 >r(c.Hs) , r(H), r(C.H.»O,
Vs/(I-F)<~(S), S=Ia , Ib , II, III,
Vs/(I- F) approaches ~ (r), as ~ (r) grows less than all other ~ (S)
and conversely that
~ (S) of step S other than r grows infinitely larger than s:f (r), as
(12.2)
(12.3)
(12.4. a)
~(r), approaches Vs/(I-F). (12.4. b)
Step r will be called the rate-determining step, as ~ (r) is sufficiently small compared with all other ~ (S).
The rate-determining step r is now decided on the basis of the experimental data in what follows.
We have from the equation of the first and third members of (11.7) and the second equation of (11.11)
(12.5)
Assuming that the surface of catalyst is practically bare under the butene pressure below 120 mmHg as suggested by the experimental results of § 5, both G* (S) (9.; (0) and q*(S) may be taken constant at constant temperature. It follows
from (11.10) that KN(S) is constant irrespective of partial pressures in gas phase. The present experiment shows, on the other hand, that the rate Vs was proportional to the partial pressure of hydrogen or to N H both over the regions of lower and higher temperatures. The left side VS/NH of (12.5) should hence be constant at constant N B independent of N H
• Therefore, r(H)' on the right side of (12.5) must be either constant independent of the partial pressure of hydrogen, or far smaller than unity.
- 25-
Journal of the Research Institute far Catalysis
First consider the case that r (H) is constant. Multiplying the both sides of (11. 14) by N H
, we have
NH(I-r) = r(H)"QBNH + QH riH)(QH)'/2QB(NH)'/2 + QHQB VS KN(Ia)NB KN(Ib) + KN (II) N B KN(III)NB
(12.6)
The left side NH(I-r)jVs of the above equation is practically constant independent of hydrogen pressure according to (12.1). Therefore, the first and third terms on the right side of (12.6), which depend on N H must be negligibly small compared with the other terms, i. e.
(12.7)
or by (11. 11)
1 1 1 -=--+--. Vs ~ (Ib) ~ (III)
(12.8)
As Vs is independent of N B at low temperature, the second term on the right side of (12.7) or (12.8) must be practically negligible there, t. e.
(12.9)
If r(H)"~I, the same equation as (12.9) is derived from (11.7). It follows from (12.4 b) and (12.9) that Ib is the rate-determining step at lower temperature.
At higher temperature, where Vs is proportional to NHNB, the first term
on the right side of (12.7) or (12.8) must practically vanish, i. e. as
Vs = ~(III) . (12.10)
The rate-determining step is III at higher temperature as deduced from (12.10) and (12.4. b).
§ 13. r (C.H,)
The quantity r(CJ-I,) will be determined for the case that Vs~ @(Ib ) at lower temperature.
It follows from (12.4. b), (12.9) and (12. 10) with reference to (12.1) that @ (Ia)?> Vs both at lower and higher temperature, hence from the equation of the first and second members of (11. 7), that
r(C,H,) =1= 1 (13.1)
Equation (11. 7) reduces now to the form
Vs=@(Ib)=~(II)(r(H)-r(C,H,))=~(III)(r(H)r(C4H,)-r). (13.2)
-26-

Study of the Hydrogel/atio!l and Double Bond Migration of 1·Butene on Nickel Catalyst
We have from (13.2),
~(Ib)/~(II) = r(H)-r(C.H9)'
~ (Ib)/~ (III) = r (H) . r (C.H9) - r , which is solved for r(C.H 9) as
(13.3)
(13.4)
r(CH)= @(Ib) f-l+ 11+4 !R(II)" (l+r~(III)) 1. (13.5) 4 9 2~ (II) l Y ~ (Ib) ~(III) ~ (Ib) j
Ignoring r~(III)/~ (Ib) compared with unity*>, we have
(13.6)
§ 14. 1'".
Let v (IIi) and v (Ifi) be the forward and backward rates of IIi, where i=a, b, c, as indicated in Fig. 11 (b). The rates v (II) or v (II) is the overall rate of formation both of primary and secondary butyl radicals from adsorbed 1· and 2·butenes or its reversal respectively as seen from the comparison of (b) and (c) of Fig. 11, so that we have
and
V (IIa) + V (lIb) + v (lIe) = V (II) I v (IIa) + V (lIb) + V (lIe) = V (II). f
We have in accordance with § 10
V (IIa) = V (lIb) = i v (II) x
v (lIe) = v(II)(I-x) , 1 f
V (IIa) = V (II) yC 1 V (lIb) = v (lIe) = v(II)(I-y)C, f
(14.1)
(14.2)
(14.3)
where x is the mole fraction of adsorbed I-butene in total adsorbed butenes, y is the mole fraction of primary butyl radical in total butyl radicals, and C a constant, which is determined from (14.1) and (14.3) as
hence
1 C=--2-y
*) It is shown in § 15 that r~ (III)/~ (Ib) is extremely small compared with unity.
- 27-
Journal of the Research Institute for Catalysis
v (IIa) = v(II)-Y- ) 2-y
V (lIb) = V (IIe) =v (II) l-y . 2-y
Similarly we have
V (IlIa) = V (III) y ,
V (IIIb) = V (III) (l-y) , }
(14.4)
(14.5)
where v(IIIa) and v (IIh) are the forward rates of IIIa and Illb indicated III
Fig. 11 (b). The conditions of steady reaction are now stated with respect to secondary
butyl radical and overall butyl radical, ignoring v (III), which is extremely small as compared with v(II) or v(II) as shown in § 16, as
v(Ih)-v(IIb)+v(IIe)-v(IIe)-(I-y)v(III) = 0,
v(II)-v(II) = v (III) . We have from (14.2), (14.4) and the above equations,
v(II)(~-y)-v(II) y(y-l) = O. 2 2-y
(14.6)
(14.7)
(14.8)
The same conclusion is arrived at from the steady condition with respect to primary butyl radical.
The rate r m is now that of the unidirectional formation of 2-butenes from I-butene through IIb and IIe minus the rate of its reversal. The former unidirectional rate is given by apportioning the rate v (IIb) of the unidirectional supply of secondary butyl radical from I-butene to the reverse rate of lIe by multiplying V (lIb) by the fraction of V (lIe) over the total rate V (IIb) -v (IIe)(l-y) v (III) of the consumption of secondary butyl radical. Formulating the latter unidirectional rate similarly, we have
r - v(II) V (IIe) ~(II) V (lIb) m - b v(IIb)+v(IIe)+(I-y)v(III) v e v(IIb)+v(IIe)+(I-y)v(III)'
or eliminating v (Ill)' v (IIi) and V (III) from (14.2), (14.4), (14.7) and the above equation,
v(II)v(II)( ~ x-I) r = -=~-,------:::=----
m v(II)(2-y)+v(II)y (14.9)
The rate r m is now expressed in terms of ~ (S) to deduce the order of
-28-

"
Study of the Hydrogenation and Double Bond Migration of l-Butene on Nickel Catalyst
reaction of DBM. The rate v (II) is given at lower temperature; where Ib determines the rate, according to (11. 6) and (13.6), as
v (II) = ~ fb) ( -1 + 11 + 4A:2) , (14.10. a)
where
(14.10. b)
The rate rm must, however, be smaller than v(II)*>, while ~(Ib)=rh by (12.9) at the specified condition. It follows that
2r m < -1 + 11 + 4A:2 . r,. (14.11)
As the right side of (14.11) increases monotonously with A:, 4A:2 is necessarily larger than 4A:~ which satisfy the equation
2r m = -1 + 11 + 4A:~ . r h
Table 17 shows the numeral value of 4A:~ which is calculated from the observed values of r m and rh in Tables 8 and 9.
Since 4A:~ is about 26 at least, as shown in Table 17, 4A:2 is larger than 26. Neglecting on this ground both the unities on the right side of (14.10. a),
TABLE 17. 4/1:~
Initial hydrogen I Initial1-butene pressure Jressure Po (mmHg) PJ-B (mmHg)
24.5 23.4 I 24.8 41.8
24.7 64.5
25.1 92.3
10.4 99.9
25.1 100.0
37.8 100.0
63.3 100.7
*) Equation (14.9) is written as
( 3) v(II) ~ rm = ZX-1 v(Il)+v(II)(l-y)+v(Il)y v (II) .
25.73
39.96
63.96
86.42
126.7
87.36
52.58
45.79
The first and second factors on the right side of the above equation are both smaller than unity, because xs1 and ys1, hence rm<v(II).
-29-
Journal of the Research Institute for Catalysis
we have approximately*)
V (II) :::;: ~ (II) I ~ (h)/si(IIff ,
and from (13.6) similarly
r(C,H.) = 1~(Ib)/~(III)
(L4.12)
(14.13)
The quantity r(H) is given by (13.4) and the above equation, neglecting r, as
r(H) = 1~(Ib)/~(III) . (14.14)
It follows from (11.6), (13. 1) and the above two equations, that
v(II) = v (II) . (14. 15)
Equation (14.9) is hence simplified by the above equation as
r", = ( ! x-+ )v(II) , (14.16)
which states that r m is proportional to v (II), hence that the order of reaction of DBM is the same as that of the reversal of II. There exist, on the other hand, the following relations according to (11.11);
1 ~ (h) ex pH , ~ (II) ex (PH)2 (P'-B) , ~ (III) ex pH P'-B.
Hence we have from (14. 12) and (14. 16)
r m ex v (II) ex (PH)"" 5 (P' -B)0.5 ,
(14. 17)
(14.18)
which agrees excellently with the experimental result (6.3). The order of reaction is just insignificantly changed as shown in Appendix, if deduced without the above approximation which leads to (14.16).
§ 15. Structure of Hydrogenation
HORIUTI determined the so-called structure of the hydrogenation of ethene which accounted for various experimental results, by evaluating ~ (Ib), ~ (II) and ~ (III) statistical mechanically')8). This method will be applied to deduce the structure of hydrogenation of I-butene on the basis of the scheme of Fig. 11 (c).
The rate ~ (S) is expressed statistical mechanically as
~ (Ib)/p = (~(Ib)oo/p) exp (-d*c(Ib)/RT) ,
~(II)/p = (~(II)oo/p) exp (-l1*e(II)/RT) ,
~(III)/p = (~(III)oo/p) exp (-d*e(III)/RT) ,
(15. 1. Ib)
(15. 1. II)
(15.1. III)
* ) Determination of the order of reaction of DBM without this approximation will be given in Appendix.
- 30-
Study of the Hydrogenation and Double Bond Migration of l-Butene on Nickel Catalyst
where
@(lb)OO/P = PH/Q~ , 1 1
@(II)oo/p = PB(PH)2 /QIJ,(QIj.)2,
@(III)oo/p = PBPH/QIJ,Q~ ,
(15.2. lb)
(15.2. II)
(15.2. III)
and p = kIN eG*(S)8q~(0) is a constant common to all @(S) at least in order
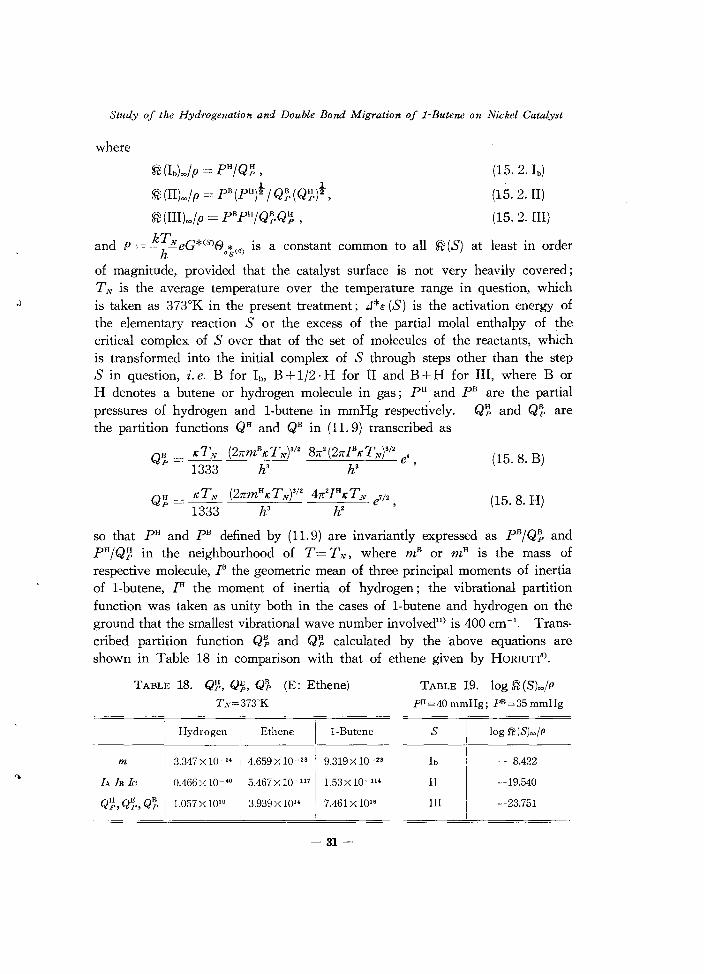
of magnitude, provided that the catalyst surface is not very heavily covered; TN is the average temperature over the temperature range in question, which is taken as 373°K in the present treatment; J*e (S) is the activation energy of the elementary reaction S or the excess of the partial molal enthalpy of the critical complex of S over that of the set of molecules of the reactants, which is transformed into the initial complex of S through steps other than the step S in question, i. e. B for lb' B + 1/2 . H for II and B + H for III, where B or H denotes a butene or hydrogen molecule in gas; pH and pB are the partial pressures of hydrogen and I-butene in mmHg respectively. Q~ and QIJ, are the partition functions QH and QB in (11.9) transcribed as
QB = ICTN (2nmBICTN)'/2 8n'(2nIBICTN)'/2 e' p 1333 h' h' '
(15.8. B)
QH _ ICTN (2nmHICTN)3/2 4n2I HICTN 7/2
p - 1333 h' h2 e, (15.8. H)
so that pH and pB defined by (11. 9) are invariantly expressed as PB/QIJ, and PH/QIJ. in the neighbourhood of T=TN , where mB or m H is the mass of respective molecule, IB the geometric mean of three principal moments of inertia of I-butene, IH the moment of inertia of hydrogen; the vibrational partition function was taken as unity both in the cases of I-butene and hydrogen on the ground that the smallest vibrational wave number involvedl1
) is 400 em-I. Transcribed partltIOn function QIJ, and Q~ calculated by the above equations are shown in Table 18 in comparison with that of ethene given by HORIUTI8
).
TABLE 18. QI]., QIJ" QIj, (E: Ethene) TN=373'K
Hydrogen Ethene I-Butene
m 3.347 x 10⁻²' 4.659xlO- 23 9.319xlO-2 '
lA lB Ie 0.466 X 10- 40
H E QB I Qp, Q}" p I 1.057 x 10¹⁰
5.467 x 10- 117 I 1.53 X 10- 11'
3.939 X 10" ! 7.461 X 10¹⁶
- 31-
TABLE 19. log ~(S)oo/p pH = 40 mmHg; pH = 35 mmHg
S
II
III
log ~(S)oo/p
- 8.422
-19.540
-23.751
Journal of the Research Institute for Catalysis
Table 19 shows the value of log ~ (S\,,jP calculated by (15.2) for the condition of the experiment described in § 7 on the basis of the values of Qr;, and Q~ in Table 18.
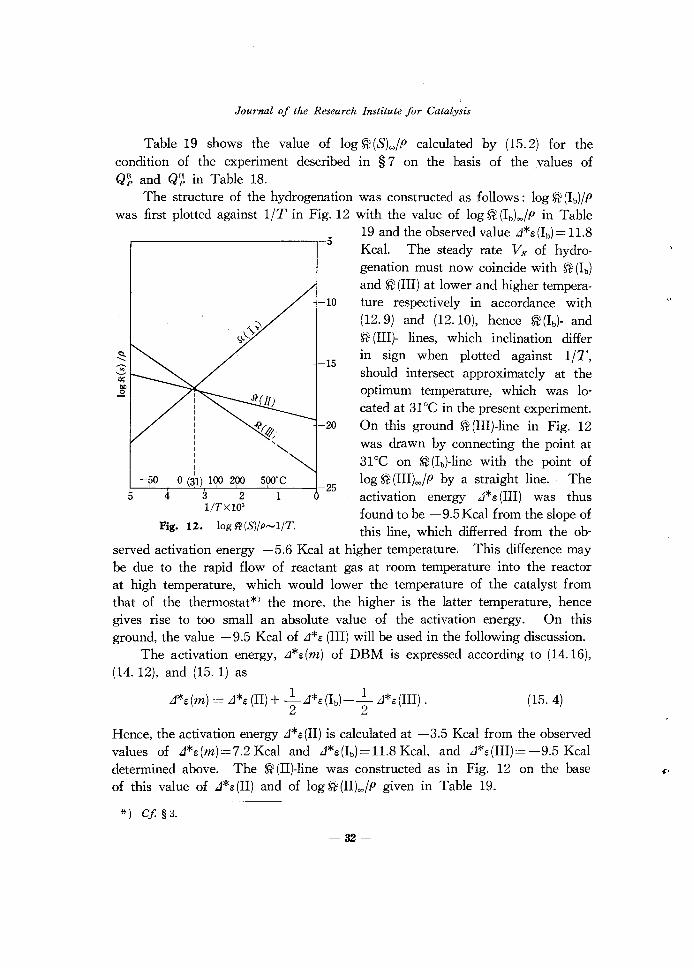
The structure of the hydrogenation was constructed as follows: log ~(Ib)/P was first plotted against l/T in Fig. 12 with the value of log ~ (Ib)",,/p in Table
.----------------------,-0
-10
-15
-20
o (31) 100 200 500'C ~~-r~~-L--~--~--~-25
43210
-50
5 l/T x 10'
Fig. 12. log ff:(S)/p~l/T.
19 and the observed value d*e(Ib) = 11.8 Kcal. The steady rate Vs of hydro-genation must now coincide with ~ (Ib) and ~ (III) at lower and higher temperature respectively in accordance with (12.9) and (12.10), hence ~(Ib)- and ~ (III)- lines, which inclination differ in sign when plotted against l/T, should intersect approximately at the optimum temperature, which was located at 31°C in the present experiment. On this ground ~(III)-line in Fig. 12 was drawn by connecting the point at 31°C on ~(Ib)-line with the point of log ~ (IIl)",,/ P by a straight line. The activation energy J*c (III) was thus found to be -9.5 Kcal from the slope of this line, which differred from the ob
served activation energy -5.6 Kcal at higher temperature. This difference may be due to the rapid flow of reactant gas at room temperature into the reactor at high temperature, which would lower the temperature of the catalyst from that of the thermostat*) the more, the higher is the latter temperature, hence gives rise to too small an absolute value of the activation energy. On this ground, the value -9.5 Kcal of i1*e (III) will be used in the following discussion.
The activation energy, i1*e(m) of DBM is expressed according to (14.16), (14. 12), and (15. 1) as
1 1 d*e(m) = J*c (II) + -J*e(Ib)-- J*e(III) . 2 2
(15.4)
Hence, the activation energy J*e(Il) is calculated at -3.5 Kcal from the observed values of J*e(m) '--= 7.2 Kcal and J*e (Ib) = 11.8 Kcal, and J*e(III) = -9.5 Kcal determined above. The ~ (Il)-line was constructed as in Fig. 12 on the base of this value of J*e(Il) and of log ~ (Il)",,/P given in Table 19.
*) Cf § 3.
-32-

Study of the Hydrogenation and Double Bond Migration of l-Butene on Nickel Catalyst
It is now shown that the condition rS1 (III) < S1 (Ib) ~ 1 assumed with regard to (13_ 6) holds on the basis of the structure constructed above. Table 20 shows the value of ~ (III)/S1 (h) calculated by (15.1) from the value of log ~(S)oo/P in Table 19, hence that rS1 (III)/~(Ib) is
TABLE 20. .~(IlI)/~(h)
Temperature
QOC 5.27xlO- 1
-50 4.17 X 10⁵
smaller than 10-", inasmuch as r is 2.94 x 10⁻¹⁷ at 25°C and smaller at lower temperature as reviewed in § 12.
§ 16. Determination of Vs, r(H), r(C,H.) ,~.'j
The steady rate Vs, r(H) and r(C,H,) are derived from the structure just determined as follows. Equation (11. 7) is written, according to (13.1), as
Vs= S1(Ib)(I-r(H)") = S1(II)(r(H)-r(C,H.) = S1(III)(r(C.H.)· r(H)-r).
(16.1)
Neglecting r as compared with unity by (12.1), we have from the above equation
1 Vs= ---------_1_+ r(H) +_1_ S1 (Ib) S1 (II) S1 (III)
(16.2)
The values of V~ and r(H) ar~ determined by (16.2) and the equation Vs = S1(Ib)(l-r(H)") of the first and the second members of (16.1) from the values of S1 (S) calculated as in the foregoing section.
The value of r (C.H.) is now determined by the equation of the second and last members of (16.1), i. e.
r(c H) = ~(Ib) . l-r(H)" +~ ,. ~(III) r(H) r(H) ,
(16.3)
from the value of r (H) determined above.
The rates v(II) and v (II) are expressed by (11.6) and (13.1) as
v(II) ='=;: S1(II)r(H) , v (II) = S1(II) r(C,H.) , (16.4)
by which their values are calculated as shown in Table 21 and Fig. 13 for the present experimental condition pH = 40 mmHg, pH = 35 mmHg of hydrogenation. The Table shows also that v (III) calculated by (11.6) is extremely small as compared with 'B(Il) and v(Il).
As shown in Fig. 13, the steady rate V.s lies, on the structure diagram,
-33-

I ~ I
tOC
TOK
~(Ib)/p
~(II)/p
~(III)/p
Vs/p
r(H)
r(C.H9)
v (II)/p
v (II)/p
v (III)/p
Y v(II)(,¥x-1)
v(II)(2-y)+v(II)y
rm/P -- -_ .. _-
,.,
TABLE 21.
[
- 23
[ . 250
1.738 x 10- 19
3.162 X 10- 17
3.715 X 10- 16
1.737 X 10- 19
0.02340
0.01998
7.399 X 10- 19
6.318 X 10- 19
2.09 X 10⁻³⁵
0.603
0.209
I 1.320 X 10- 19
VS, r(H), r(C.H9), v(II), NIl), v (III), rm
pH = 40 mmHg, J?B = 35 mmHg
0 27
[
57
273 300 330
1.356 x 10⁻¹⁸ 9.623 X 10 -18 5.816 x 10- 17
1.828 X 10- 17 1.022 x 10⁻¹⁷ 5.995 X 10⁻¹⁸
7.143xlO- 1 ~ 1.475 X 10⁻¹⁷ 3.465 X 10- 18
1.315 X 10- 18 4.070 X 10- 18 2.130xlO- 18
0.1710 0.7600 0.9815
0.1067 0.3626 0.6274
3.126x10- 18 7.767 X 10- 18 5.884 X 10⁻¹⁸
1.950 X 10⁻¹⁸ 3.706 X 10- 18 3.761 X 10- 18
3.19 X 10⁻³⁴ 5.97 X 10- 33 1.20 X 10- 31
0.574 0.548 0.576
0.224 0.233 0.223
4.369 X 10⁻¹⁹ 8.638 X 10- 19 8.387 X 10- 19
87
360
2.344 X 10 - 16
3.802 X 10- 18
1.023 X 10⁻¹⁸
8.040 X 10- 19
0.9983
0.7802
3.796 X 10- 18
2.966 X 10 - 18
1.51 X 10- 30
0.214
0.214
6.4~1 X 10-19
---
4:.
-
~ !: '!
t .:; ;;. '"' ~ ~ ~ ~ .... ~ ~ ~.
~
~ '!
Q ~ ~ '" ;;:.

Study of the Hydrogenation and Double Bond Migration of 1-Butene on Nickel Catalyst
-,50 -,30 Q 3,1'
4
5op'C -22 1
liT x 1000
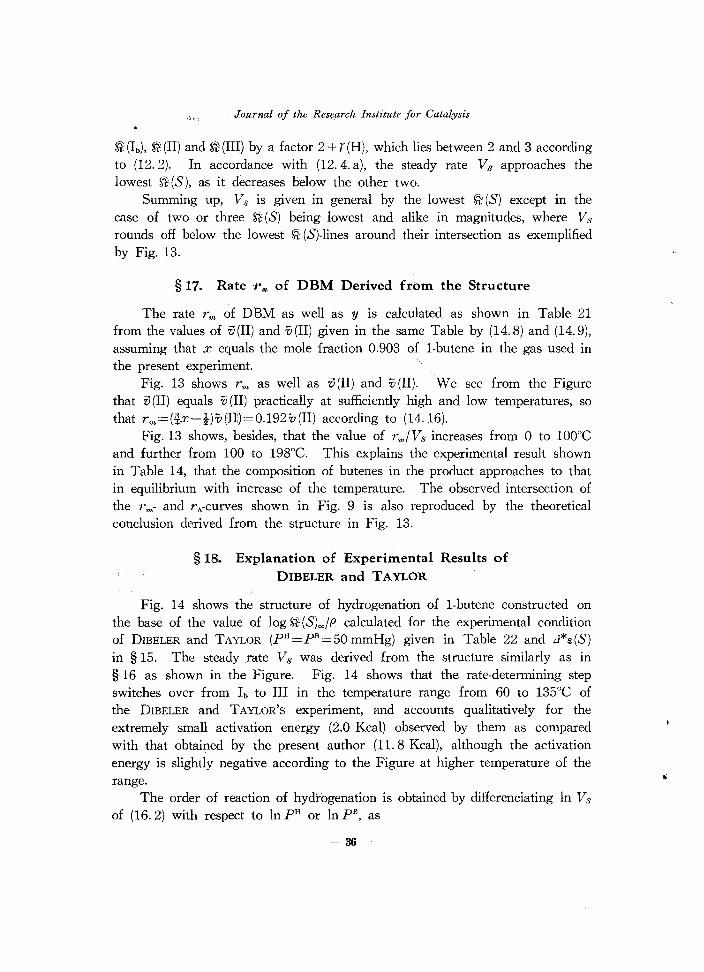
Fig. 13. Structure of hydrogenation of I-butene.
F~=40 mmHg, PI,l=35 mmHg.
below the lowest ~ (S) according to (12.3) and practically coincides with the latter, as the lowest @(S) grows lower than all other ~(S) according to (12.4.a) and (12.1). The deviation downwards of Vs from the lowest one occurs, when more than one lowest ~(S) are alike in magnitudes. Apart from ~'(Ia) shown to be situated high above other @ (S), the relative height of Vs is located generally as follows. If ~ (Ib) and ~ (III) are sufficiently low compared with ~ (II) and coincident with each other, we have 2Vs=~(Ib)=~(III) from (12.6) and (11.11). The steady rate Vs deviates thus from the value of ~(Ib)=~(III) by the factor 2, while it approaches the lowest value, as one of ~ (I b) and ~ (III) increases above the other according to (12.4. a).
If ~(Ib)' @(II) and ~(III) are coincident with each other, we have from (16.2)
(2+r(H)) Vs= ~(Ib) = ~(II) = ~(III). This equation states that v:~ deviates downwards from the common value of
-35-
Journal of the Research Institute for Catalysis
@ (Ib), @ (II) and @ (III) by a factor 2 + r (H), which lies between 2 and 3 according to (12.2). In accordance with (12.4. a), the steady rate VB approaches the lowest ~ (S), as it decreases below the other two.
Summing up, VB is given in general by the lowest @ (S) except in the case of two or three ~ (S) being lowest and alike in magnitudes, where VB rounds off below the lowest ~ (SHines around their intersection as exemplified by Fig. 13.
§ 17. Rate ''',,, of DBM Derived from the Structure
The rate rm of' DBM as well as y is calculated as shown in Table 21 from the values of v (II) and v (II) given in the same Table by (14.8) and (14.9), assuming that x equals the mole fraction 0.903 of I-butene in the gas used in the present experiment.
Fig. 13 shows r". as well as v (II) and v (II). We see from the Figure that v (II) equals v (II) practically at sufficiently high and low temperatures, so that r m =(ix-i)v(II)=0.192v(II) according to (14.16).
Fig. 13 shows, besides, that the value of rm/VS increases from 0 to 100°C and further from 100 to 198°C. This explains the experimental result shown in Table 14, that the composition of butenes in the product approaches to that in equilibrium with increase of the temperature. The observed intersection of the r m- and rl,-curves shown in Fig. 9 is also reproduced by the theoretical l:onclusion derived from the structure in Fig. 13.
§ 18. Explanation of Experimental Results of DIBELER and TAYLOR
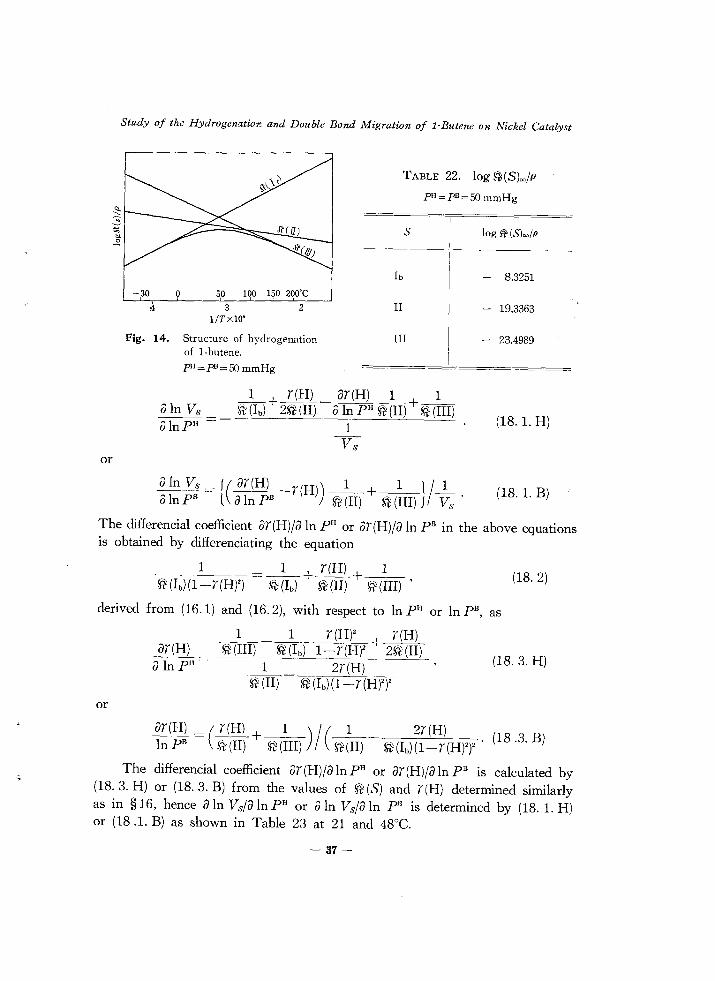
Fig. 14 shows the, structure of hydrogenation of I-butene constructed on the base of the value of log @(S)=/p calculated for the experimental condition of DIBELER and TAYLOR (PH=PB=50 mmHg) given in Table 22 and J*e(S) in § 15. The steady rate VB was derived from the structure similarly as in § 16 as shown in the Figure. Fig. 14 shows that the rate-determining step switches over from h to III in the temperature range from 60 to 135°C of the DIBELER and TAYLOR'S experiment, and accounts qualitatively for the extremely small activation energy (2.0 Kcal) observed by them as compared with that obtained by the present author (11. 8 Kcal), although the activation energy is slightly negative according to the Figure at higher temperature of the range.
The order of reaction of hydrogenation is obtained by differenciating In VB of (16.2) with respect to In pH or In pR, as
-36-
or
Study of the Hydrogenation and Double Bond Migration of 1-Butene on Nickel Catalyst
TABLE 22_ log ~(S)=/p
PH=pB=50 mmHg
S
-30 o 100 150 200'C
,4 II I/TXI0'
Fig. 14. Structure of hydrogenation of I-butene.
PH=pB=50mmHg
III
aln Vs ainPH -
1 r(H) ar(H) 1 1 !ff(fJ + ~-aIJ1PIl ~(IIj + ~
1 Vs
a In V~ = f( ar(H) -r(H)) _1~ + 1 1/_1 a In pB l a In pB g'jl (II) ~ (III) J Vs'
log ~(S)=I(J
- 8.3251
- 19.3363
- 23.4989
(18.1. H)
(18.1. B)
The differencial coefficient ar(H)/a In pH or ar(H)/a In pB in the above equations is obtained by differenciating the equation
1 =_1~+ r(H) +_1_ g'jl (Ib) (1-r (H)") ~ (h) g'jl (II) ~ (III) ,
(18.2)
derived from (16.1) and (16.2), with respect to In pH or In pB, as
1 1 r(H)2 r(H) 1f(ITf) -~ 1- r(H)2 + -2W(fI)
1 2r(H) (18.3. H)
~(II) g'jl(h)(1-r(H)2)2
or
ar(H) =( r(H) + 1 )/(_1~_ 2r(H) (18 3 B) In pB ~(II) ~(III) ~(II) ~(Ib)(1-r(H)2)" - ..
The differencial coefficient ar(H)/ainPH or ar(H)/alnPB is calculated by (18. 3. H) or (18. 3. B) from the values of ~ (S) and r (H) determined similarly as in § 16, hence a In vs/a In pH or a In vs/a In pE is determined by (18. 1. H) or (18.1. B) as shown in Table 23 at 21 and 48°C.
- 37-
Journal of the Research Institute for Catalysis
TABLE 23. a In Vs/a In pH, a In Vs/a In pB
Tempera'j ~(lb)lp ture ~(II)/p I ~(III)lp I r(H) /olnvslolnPHjolnvsl3lnpB
2lT 1.318 x 10¹⁷ 6.026 x 10¹⁶ 6.026 x 10¹⁵ 0.4500 0.88 0.30
48'C 2.512 x 10¹⁶ 1.000 x 10¹⁷ 2.512 x 10¹⁶ 0.9062 0.66 0.89
The Table shows that both the order of reaction of hydrogenation with respect to hydrogen and butene are less than unity, which conforms qualitatively with the DIBELER and TAYLOR'S experimental results that Vs was proportional
1 1 to (PH)2(P)2.
§ 19. Explanation of Experimental Results of TWIGG
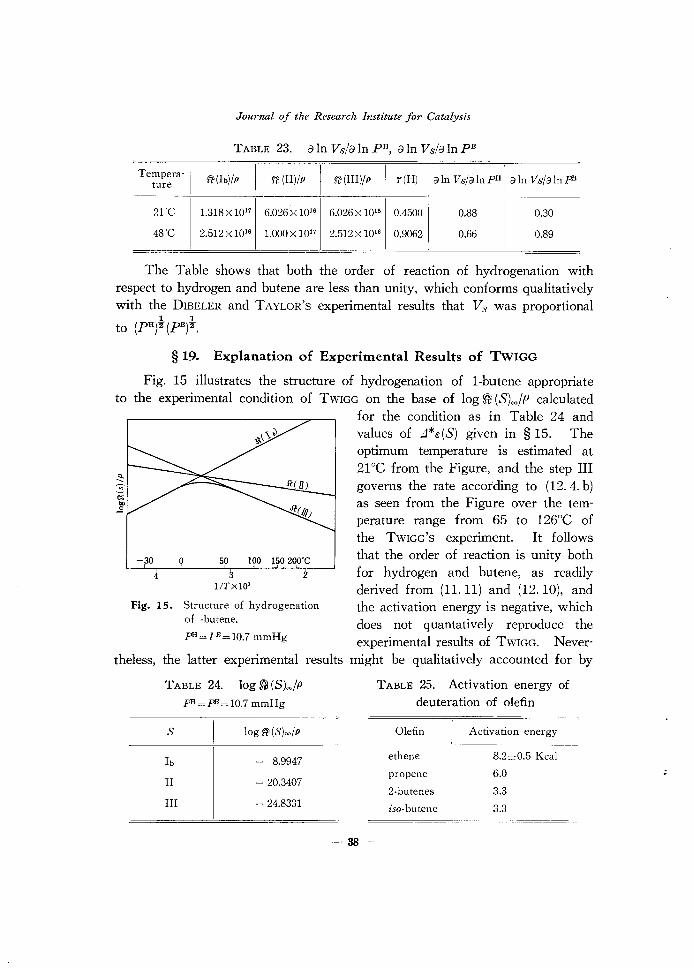
Fig. 15 illustrates the structure of hydrogenation of I-butene appropriate to the experimental condition of TWIGG on the base of log ~ (S)",,/p calculated
-30 0 50 100
4 l/TxIO'
Fig. 15. Structure of hydrogenation of -butene.
for the condition as in Table 24 and values of L1*e(S) given in § 15. The optimum temperature is estimated at 21°C from the Figure, and the step III governs the rate according to (12.4. b) as seen from the Figure over the temperature range from 65 to 126°C of the TWIGG'S experiment. It follows that the order of reaction is unity both for hydrogen and butene, as readily derived from (11. 11) and (12.10), and the activation energy is negative, which does not quantatively reproduce the experimental results of TWIGG. Never-
theless, the latter experimental results might be qualitatively accounted for by
TABLE 24. log S'/) (S)=/p
pH =pB= 10.7 mmHg
s
II
III
log ~(S)""lp
- 8.9947
- 20.3407
- 24.8331
-38-
TABLE 25. Activation energy of deuteration of olefin
Olefin
ethene
propene
2-butenes
iso-butene
Activation energy
S.2±0.5 Kcal
6.0
3.3
3.3
Study of the Hydrogenation and Donble Bond Migration 00 i-Butene on Nickel Catalyst
the small activation energy (2.5 Kcal) and the fractional order of reaction deduced from the structure in the neighbourhood of the optimum temperature similarly as in § 18.
TWIGG observed besides, as shown in Table 25, the activation energies of deuteration of ethene, propene and butenes on nickel catalyst between 55 and 120°C, which decreased with increase of the molecular weight. This effect may be accounted for on the basis of the structure of olefin hydrogenation as follows. The excess of the partial molal enthalpy J*c (S) of the critical complex over that of the appropriated set of the molecules*) may be taken not much affected by the substituent of the hydrogen atoms of ethene, which makes the difference of olefins. The magnitudes of J*c(Ib), J*c(II) and J*c(III) determined for butene in this work approximately confirms the above expectations as compared with those for ethene8
). It is inferred on its basis that ~ (II) and ~ (III) are lowered relative to ~ (Ib ), without changing the relative height of ~ (II) and ~ (III), with increase of the molecular weight of olefin, since the moment of inertia increases rapidly with increase of the molecular weight to decrease ~ (II) and ~ (III) by the same factor as seen from (15.1), (15.2) and (15.3). This factor amounts ca. 2 x 10² for the transition from ethene to I-butene as seen from Table 18. It follows as seen from Fig. 15 that the optimum temperature lowers and the inclination of Vs against liT, i. e_ the activation energy at a fixed temperature around the optimum decreases, in accordance with the behavior of Vs discussed in § 16, with increase of the molecular weight qualitatively in accord with the observation of TWIGG').
Acknowledgement
The author wishes to express his sincere thanks to Professor ]. HORIUTr (Hokkaido University) for his kind discussion and to Professors T_ SHIBA and
T. KEIr (Tokyo Institute of Technology) for their kind guidance.
[Appendix]
Order of Reaction of DBM
The order of reaction DBM has been derived in § 14 with an approximation leading to the relation that v (II) =v (II). The derivation will be given below without the approximation.
The order of reaction a In r,,,la In P of DBM is developed according to (14.9) as
*) Cj. § 15.
- 39-
Journal of the Research Institute for Catalysis
a In rm = a In v(Il) + alnv(Il) _ 1 alnP alnP alnP v(Il)(2-y)+v(Il)y
x f av(Il)(2_ )+ au(Il) -~(ii(Il)-v(Il))l (AI) l a In pYa In pYa In P J '
where P is the partial pressure of reactant, i. e. hydrogen or I-butene. The differencial coefficients ay/a In P, a In v (Il)/a In P and a In v (Il)/a In P in the above equation are expressed as follows. Differenciating (14.8) with respect to In P, we have
~ = f ( -1) avrIl) -(2- )('~_ ) avrIl) 1 / a In PlY Y a In P Y 2 Y a In P J /
{(2Y-2- ~)v(Il)-(2Y-1)v(Il)} . (A 2)
Expressions of v(Il) of (11.6) yield on differenciation with respect to In P with reference to (13. 1)
av (II) = a~ (II) r (H) + ar (H) ~ (II) , a In P a In P a In P
(A 3)
au(Il) := a~m) r(C4H,)+~JC.H,) ~(Il), a In P a In P a In P
(A 4)
where ar(H)/a In P is given by (18.3) or (18.5) for P==-PH or P=PE respectively, and ar(C.H,)/a In P is expressed by differenciation of the equation of the second and third member of (16.1) with respect to pH or p E as
ar(c.H,):=~ ar(H) +~r(H)-(l-r(HY) ~~(Ib) ainPH ainPH 2 ~(Il)
+2r(H) ~(Ib) ar(H) __ ~ r(CH) (AS) ~(Il) ainPH 2 " ,
ar (C,H,) = ar (H) + r (H) _ r (C H ) + 2r (H) ~ (Ib) ar (Hl. (A 6) a In p E a In p E
• , ~ (II) a In p 3
The values of r (H) and r (C.Hg) are determined according to § 16 on the one hand, and those of v (II), v (II) and Y according to § 17 on the other hand respectively for the experimental condition in question. The differencial coefficient a In r",/a In pH is now evaluated for the condition by (A 5), (18.3. H), (A 3), (A 4), (A 2) and (A 1), and a In r m/a In p E by (A 6), (18.3. B), (A 3), (A 4), (A 2) and (A 1).
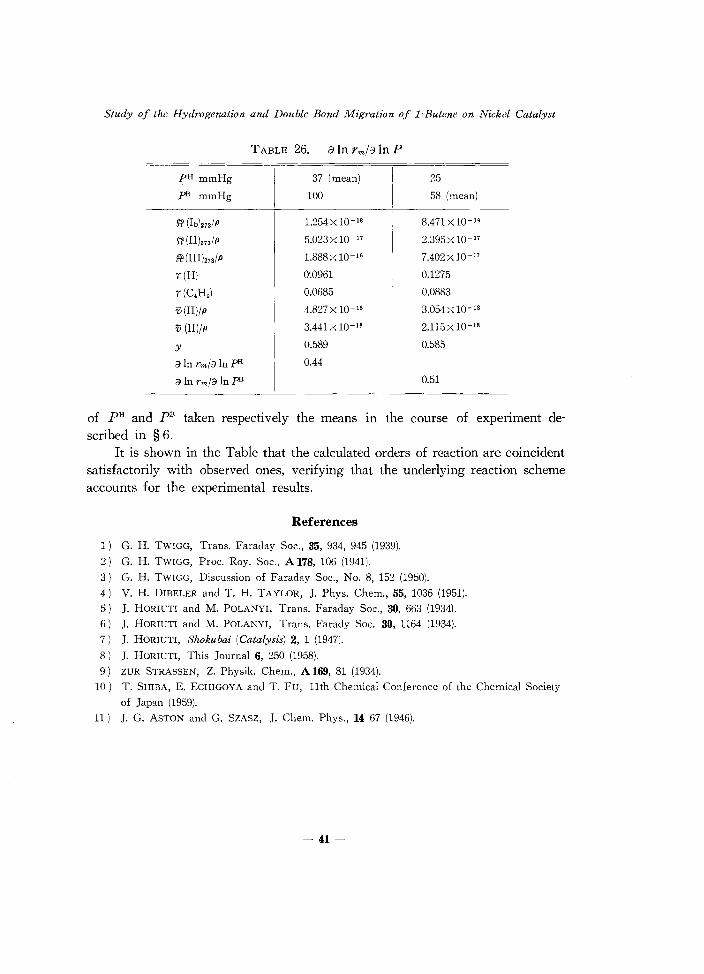
The order of reaction of DBM is calculated as shown in Table 26, on the base of x assumed to be the same as that in gas (:=0.903), and the values
- 40-
Study of the Hydrogenation and Double Bond Migration of l-Butene on Nickel Catalyst
TABLE 26. a In rm/a In P
pH rnrnHg 37 (mean) 25
pB rnrnHg 100 58 (mean)
l'l' (h:m/p 1.254 X 10⁻¹⁸ 8.471xlO- I '
l'l' (II)27./p 5.023 X 10- 17 2.395xlO- 17
l'l' (III).,./ p 1.888 X 10 -16 7.402 X 10- 17
r(H) 0'.0961 0.1275
r(C.H,) 0.0685 0.0883
v (II)/p 4.827 X 10⁻¹⁸ 3.054x10- 18
V (II)/p 3.441 X 10- 18 2.1l5x 10- 18
y 0.589 0.585
a In rm/a In pH 0.44
a In rm/a In pB 0.51
of pH and pB taken respectively the means in the course of experiment described in § 6.
It is shown in the Table that the calculated orders of reaction are coincident satisfactorily with observed ones, verifying that the underlying reaction scheme accounts for the experimental results.
References
1) G. H. TWIGG, Trans. Faraday Soc., 35, 934, 945 (1939).
2) G. H. TWIGG, Proc. Roy. Soc., A 178, 106 (1941).
3) G. H. TWIGG, Discussion of Faraday Soc., No.8, 152 (1950).
4) V. H. DIBELER and T. H. TAYLOR, J. Phys. Chern., 55, 1036 (1951).
5) J. HORIUTI and M. POLANYI, Trans. Faraday Soc., 30, 663 (1934).
6) J. HORIUTI and M. POLANYI, Trans. Farady Soc. 30, 1164 (1934).
7) J. HORIUTI, Shokubai (Catalysis) 2, 1 (1947).
8) J. HORIUTI, This Journal 6, 250 (1958).
9) ZUR STRASSEN, Z. Physik. Chern., A 169, 81 (1934).
10) T. SHIBA, E. ECHIGOYA and T. Fu, 11th Chemical Conference of the Chemical Society
of Japan (1959).
11) J. G. ASTON and G. SZASZ, J. Chern. Phys., 14 67 (1946).
- 41-