study of stability constants of metal ... - core.ac.uk filestudy of stability constants of metal...
TRANSCRIPT

STUDY OF STABILITY CONSTANTS OF METAL COMPLEXES WITH
SULFA DRUGS
DISSERTATION SUBMITTED IN PARTIAL FULFILLMENT OF THE REQUIREMENTS
FOR THE AWARD OF THE DEGREE OF
iWajftcr of $l)rtos(opl)|» IN
CHEMISTRY
BY
MOHD. NAZIM
UNDER THE SUPERVISION OF
PROF. K. S. SIDDIQI
DEPARTMENT OF CHEMISTRY ALIGARH MUSLIM UNIVERSITY
ALIGARH (INDIA)
2008
V «.'"
, ^ ^ " - ' i %
^ 9 S y 20tt
D,S4II50


^lof. *?C< . Siddifi/ DEPARTMENT OF CHEMISTRY ALIGARH MUSLIM UNIVERSITY ALIGARH-202002 (INDIA)
Certificate
This is to certify that the dissertation entitled ''Study of Stability
Constants of Metal Complexes with Sulfa Drugs" is the original work
carried out by Mr. Mohd. Nazim under my supervision and is suitable for
submission for the award of M.Phil, degree in Chemistry of the Aligarh
Muslim University, Aligarh.
V A
Date a^^ (Prof. K.S. Siddi
In the name of ALLAH, the most beneficent and merciful who enabled me to complete this work,
I hereby wish to express my sincere thanks and deep sense of
gratitude to my supervisor Prof, K.S. Siddiqi, Department of Chemistry,
Aligarh Muslim University, Aligarh for his keen interest and help in this
work and interpretation of the results, I am particularly grateful to him for
his encouragement, removing the obstacles and patching my ignorance.
Thanks are also due to Prof, (Mrs,) A. Lai, Chairperson, Department
of Chemistry Aligarh Muslim University, Aligarh for providing necessary
research facilities,
I am also thankful to all of my lab colleagues specially
Ahmad Husain and friends specially Mohd. Shahid for their cooperation
and useful suggestions during this work.
Eventually I would like to express my gratitude to my parents for their
belief in me. They always encourage and guide me properly. No words can
express my indebtedness to my uncle Mr. Shafiq Ahmad, who always
inspired me to strive hard to achieve my goal.
Mohd. Nazim

ABSTRACT
The potentiometric studies have been carried out on divalent metal
ions with sulfamethazine, Pyridoxal 5-phosphate and DL-cystine. The
Calvin-Bjerrum pH-metric titration technique, as modified by Irving and
Rossotti, has been applied to determine the stepwise protonation constants
and stepwise formation constants of the metal complexes in aqueous
medium. The ionic strength was maintained constant at 0,1 M by adding
NaCl(lM) solution.
The results indicate that one proton of sulfamethazine and two protons
each of pyridoxal 5-phosphate and DL-Cystine were being released in the
pH range 4.0 to 10.0.
Stability of sulfamethazine, Pyridoxal-5-phosphate and DL-Cystine
upon complexation with divalent metal ions deceases with an increase in pH
following Irving William series:
Mn(II) < Fe(II) < Co(II) < Ni(II) < Cu(II)
The thermodynamic parameters that is, Gibbs free energy (AG),
Entropy (AS) and Enthalpy (AH) have also evaluated from the stability
constant.

CONTENTS
Title Page No.
1. Introduction 1-11
2. Experimental 12-15
3. Results and Discussion 16-59
4. References 60-65

INTRODUCTION
The sulfa drugs are synthetic antimicrobial agents with a wide
spectrum encompassing most gram positive and gram negative
organisms. These drugs are employed systematically for the
prevention and cure of bacterial infections.
The first sulfa drug, prontosil was discovered by the German
physician and chemist, Gerhard Domagk in 1935. He observed that
prontosil protects mice against streptococcal infections. The
sulfonamide is a generic name for derivatives of para-
aminobenzenesulfonamide (sulfanilamide). In the liver it exists as
follows:
H2N- /y -N=N-HfJ ) -S02-NH2 ^ ^ ^ > H^N-Z^V-NH^ 2i
Prontosil NH2 +
H 2 N - / V-SO2NH2
Sulfanilamide
Sulfa drugs are white crystalline powder and sparingly
soluble in water. They readily react with alkali and form salts
which are more soluble than the parent drug.
They kill bacteria and fungi by interfering with their
metabolism. They were the "wonder drugs" before penicillin was
discovered. They are used mainly for the treatment of urinary tract
infections (UTI).
Sulfa drugs are usually not allergic by themselves but when a
sulfonamide molecule is metabolized in the body, it becomes
capable of attaching to proteins. The allergy is, therefore, not
related to the original drug but a drug-protein complex. The
antibacterial activity of sulfonamides is related to its pKa value.
Maximum activity is found in those having pKa value between
6.0-7.5. Various types of complexes of sulfa drugs Schiff bases of
rare-earth metal ions were synthesized and characterized by
potentiometric studies earlier [1,2].
Due to the presence of amino group, sulfa drugs form schiff
bases with various types of aldehyde and keto compounds. The
voltammetric and potentiometric studies of some sulfa drug-Schiff-
base compounds and their metal complexes have been described
earlier [3]. Spectral and thermal studies of ternary complexes of
nickel with sulfasalazine and some amino acids were studied in
which sulfasalazine is used as primary ligand and amino acids as
secondary ligand [4].

N=^ *^M-H >-S02-NH-< )
The metal complexes of Schiff-base derived from sulfadiazine
and an amine display obvious inhibitor effects against gram
positive and gram negative bacteria. Transition metal complexes of
Schiff base derived from sulfadiazine and salicylaldehyde have
been extensity studied by UV-Vis, conductance, polarography, ESR
and TGA. They have also exhibited antibacterial and anti-fungal
properties in solution [5],
\ /
NHR'
^ B u ^ O ^ \ = /
NHR
The organotin (IV) form complexes with biologically active
sulfa drug Schiff base. They have also been found to be highly
active against bacteria and fungi [6]. Sulfamethazine has been used
to treat bacterial diseases in human and veterinary medicine and to

promote growth in cattle, sheep, pigs and poultry. It produces
thyroid-tumours in mice and rats by a non-genotoxic mechanism,
which involves inhibition of thyroid peroxidase resulting in
alterations in thyroid ,
(sulfamethazine)
Sulfamethazine is widely used in veterinary medicine in
combination with chlorotetracycline and penicillin in pigs for
maintenance of weight gain in the presence of atrophic rhinitis,
growth promotion and increased feed efficiency. The potentiometric
and thermodynamic studies of 2-acrylamidosulfamethazine and its
metal complexes in mono and polymeric forms have been
characterized by elemental analysis and IR studies in 40% (v/v)
ethanol water mixture [7].
Synthesis and equilibrium studies of metal complexes of
sulfamethazine have been investigated by potentiometric techniques
in acidic solution and also characterized by elemental analysis,
electrolytic conductance, IR, 'H NMR, mass spectra and
thermogravimetric studies [8].
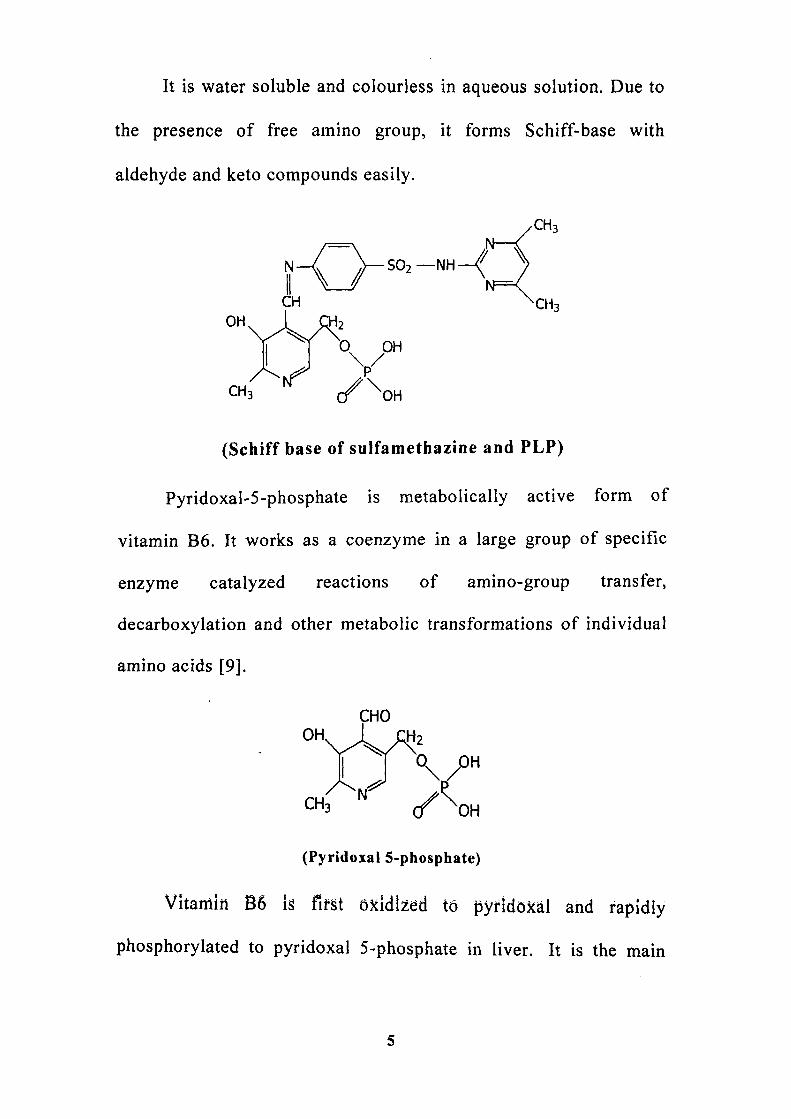
It is water soluble and colourless in aqueous solution. Due to
the presence of free amino group, it forms Schiff-base with
aldehyde and keto compounds easily.
, , . . . „._// \ S O 2 — N H — ^
(Schiff base of sulfamethazine and PLP)
Pyridoxal-5-phosphate is metabolically active form of
vitamin B6. It works as a coenzyme in a large group of specific
enzyme catalyzed reactions of amino-group transfer,
decarboxylation and other metabolic transformations of individual
amino acids [9].
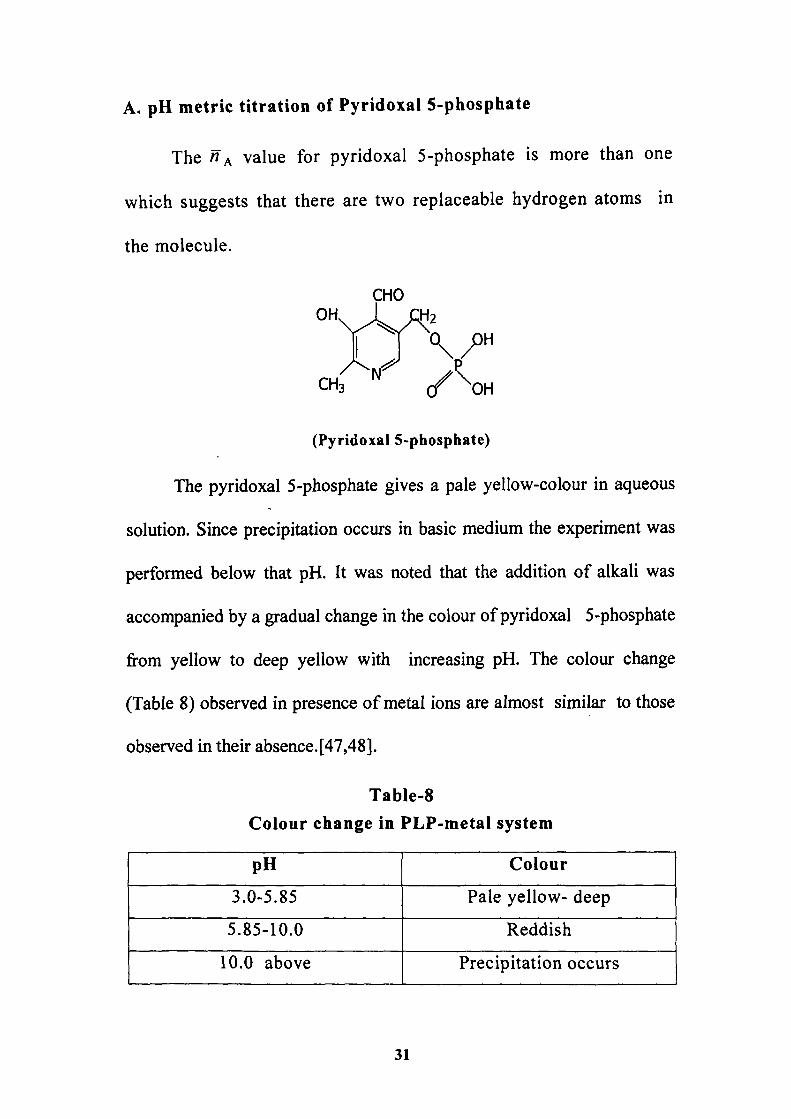
(Pyridoxal 5-phosphate)
Vitamin B6 is first Okidlzed to pyridoxal and rapidly
phosphorylated to pyridoxal 5-phosphate in liver. It is the main

circulating form of vitamin B6. It is a brown powder and dissolves
in water to give a pale yellow colour. Only this form can be used by
enzyme involved in the biological process of nitrogen, protein and
haeme synthesis [10].
Pyridoxal 5-phosphate is used as coenzyme in many
biological reactions. Coenzymes are low molecular weight
substances that provide unique chemical functionalities for certain
enzyme complexes.
All water soluble vitamins, except vitamin-C are coenzymes
or precursor of coenzymes. They can act as carriers of specific
functional groups i.e. methyl, acetyl groups. . The second order rate
constant for complex formation between PLP and cysteine has been
determined as function of pH [11]. Pyridoxal 5-phosphate participates
in a wide variety of reactions involving amino acids, as:
1. Transamination reaction.
2. a and p decarboxylation.
3. p and y elimination.
4. Racemization.
5. Aldol reactions
These reactions occur due to the ability of pyridoxal 5-phosphate
to form stable Schiff base with amino group of a amino acids [12].
The rate constant of hydrolysis and formation of Schiff bases
formed by pyridoxal 5-phosphate with L-tryptophan and their
methyl and n-butyl esters at variable pH and IS^C and at O.IM
ionic strength has been reported [13]. Pyridoxal 5-phosphate has
two absorption maxima, one at 415 nm in acidic medium and the
other at 340 nm in basic medium. PLP has been found to undergo a
rapid benzoin type condensation in oxygen free solution when
exposed to light [14, 15].
The screening of PLP dependent activities toward amino
acids were studied which confirms that the Schiff base is an
obligatory intermediate in all PLP dependent reactions of amino
acids [16]. The role of PLP in the structural stabilization has been
studied by fluorescence and ^ P NMR [17].
Equilibria and absorpation spectra of various Schiff bases of
PLP have been studied and the kinetic and thermodynamic
parameters have been evaluated in aqueous solution as a function of
pH and constant ionic strength [18-20].
Since cystine partially dissolves in water, 1-2 drops of acid
were added to make it water soluble.lt contains two amino groups
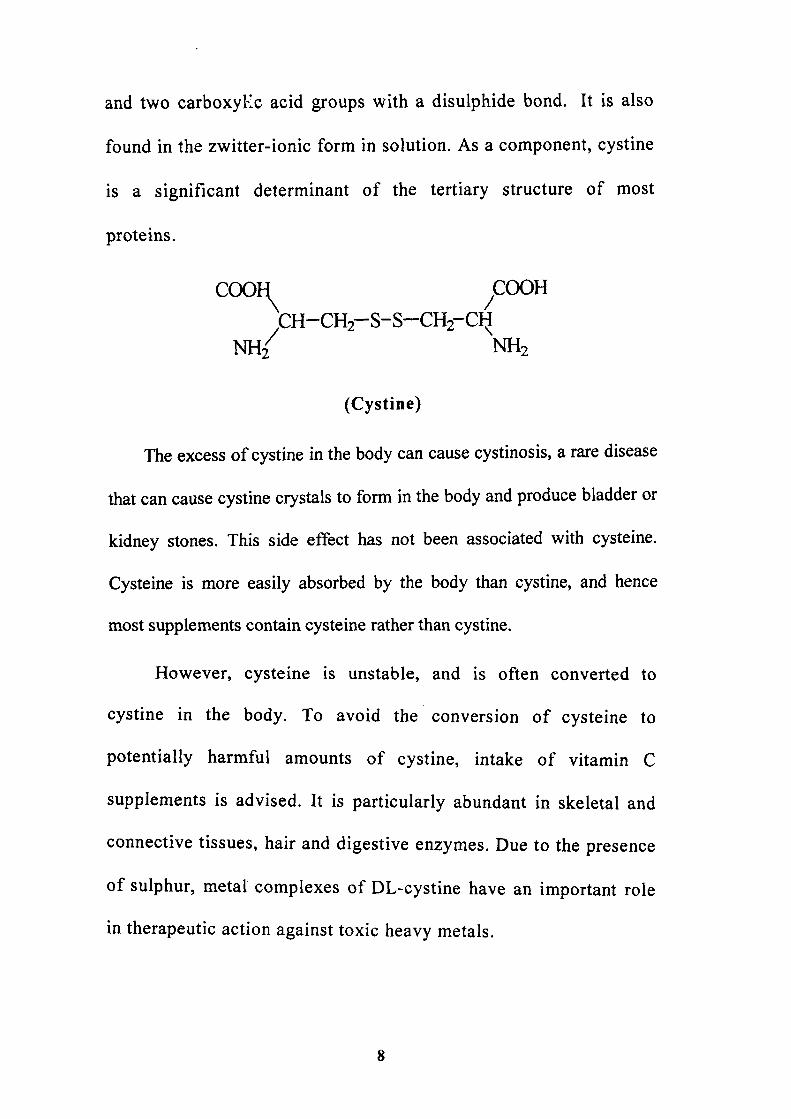
and two carboxyKc acid groups with a disulphide bond. It is also
found in the zwitter-ionic form in solution. As a component, cystine
is a significant determinant of the tertiary structure of most
proteins.
COOH ^COOH
CH-CH2-S-S-CH2-CI^
NH2^ NH2
(Cystine)
The excess of cystine in the body can cause cystinosis, a rare disease
that can cause cystine crystals to form in the body and produce bladder or
kidney stones. This side effect has not been associated with cysteine.
Cysteine is more easily absorbed by the body than cystine, and hence
most supplements contain cysteine rather than cystine.
However, cysteine is unstable, and is often converted to
cystine in the body. To avoid the conversion of cysteine to
potentially harmful amounts of cystine, intake of vitamin C
supplements is advised. It is particularly abundant in skeletal and
connective tissues, hair and digestive enzymes. Due to the presence
of sulphur, metal complexes of DL-cystine have an important role
in therapeutic action against toxic heavy metals.

Cysteine is oxidized to cystine at neutral pH. In acidic
medium, reaction does not take place while cystine is a non
essential amino acid and synthesized by the body itself [21].
However, food such as eggs, meat, dairy products, and whole grains
are also good sources of cystine. It functions as a powerful anti
oxidant in detoxifying harmful toxins, protects the body from
radiation damage, liver and brain damage due to alcohol, drugs, and
toxic compounds. It has been also used in the treatment of
rheumatoid arthritis and hardening of the arteries, promotes the
recovery from severe burns and surgery, promotes the burning of
fat and the building of muscle and slows down the aging process.
Cysteine is used as a secondary ligand in the complex reactions
with transition metal ions reported earlier [22]. People suffering from
diabetes should be careful while taking supplementation, as it could
inactivate insulin.
H HC=S I
H2N—CH— COOH
L-cystine is used as precursor of p-lactum ring of penicillin.
For biosynthesis of penicillin, cystine related compounds are
necessary. Various methods of synthesis of a and p-methyl DL-
cystine from DL-allothreonine are described [24].
Many a-substituted cystines are synthesized by using a-
haloketone condensed with sodium salt of a-toluenethiol followed
by treatment with KCN and ammonium carbonate in aqueous
ethanol (50%) solution at 60-70 T , hydrolyzed then reduced [25].
Adsorption and desorption behaviour of cystine and cysteine
in neutral and basic media were studied with gold(III) in which
absorption of cystine takes place at different potentials. It confirms
that cysteine monolayer presents a higher packing density than
cystine [26].
The polarographic study of cystine in O.IN HCl with thymol
as suppresser has been done. The system was not reversible and
potentiometric titration curves were obtained for a-substituted
cystines [27]. Incorporation of sulphur from DL-cystine to
glutathione and protein in rat has indicated that cystine-sulphur was
incorporated much more rapidly in glutathione than in proteins[28].
Metabolic studies of DL-cystine in rat showed that cystine was
converted into pyruvate first, then it gives alanine, aspartic acid and
glutamic acid [29].
10

In this project, the stability constant and thermodynamic
parameters of sulfamethazine, pyridoxal 5-phosphate and DL-cystine
were determined by Calvin-Bjerrum pH-metric titration technique, as
modified by Irving and Rossotti at O.IM ionic strength at room
temperature. The strength of complexation between organic ligand and
metal ions is usually expressed in terms of stability constant (LogK).
The composition of the complex formed during the
interaction of transition metal ions with PLP, sulfamethazine and
DL-cystine were established by measuring the magnitude of proton
displacement during the titration of these molecules in absence and
presence of metal ions.
Metal ligand stoichiometry of all the ligands was also
determined by conductivity measurements.
11

EXPERIMENTAL
Apparatus and Reagents:
All chemicals were obtained from BDH or Loba Chemie.
Hydrated metal chlorides (BDH), sulfamethazine(sigma), pyridoxal
5-phosphate(Koch-Light) and DL-cystine were used as received. A
digital pH meter (Elico LI-120) fitted with combined glass
electrode was used.
Titration procedure:
The following solutions were prepared in double distilled water.
1. O.INHCIO4
2. 1 M NaCl
3. 0.005 M Ligand
4. 0.005 M Metal Chloride
5. 0.2 M NaOH
Strength of stock solution of perchloric acid was determined
by titrating against standard NaOH solution. Calvin-Bjerrum
titration technique, as modified by Irving and Rossotti was
followed [30-32]. The following solutions were titrated separately
against standard NaOH (0.2 M). 1 Molar NaCl solution was added
to maintain the constant ionic strength (|i = 0.1). The total volume
12

in each case was made up to 50 mL by adding appropriate volume
of CO2 free double distilled water. The metal contents were
estimated by standard methods using EDTA titration [33].
Solution A: 5 mL, 0.1 N HCIO4 + 4.5 mL, 1 M NaCl + 40.5 water
Solution B: 5 mL, 0.1 N HCIO4 + 4.5 mL, 1 M NaCl + 20 mL, 0.005
M Ligand + 20.5 water
Solution C: 5 mL, 0.1 N HCIO4 + 4.5 mL, 1 M NaCl + 20 mL, 0.005
M Ligand + 5 mL, 0.005 M MCI2 + 15.5 water.
The titration curve of solution A, B and C with alkali is called
acid titration, ligand titration and metal-ligand titration curves,
respectively. A plot between volume of alkali added and the
corresponding pH values was made for each set. The complex formation
results in the lowering of buffer region due to proton displacement.
Calculation of n (Proton Ligand Formation Number):
The acid, ligand and metal-ligand titration curves were obtained by
plotting pH values of solutions A, B and C against volume of NaOH
added, respectively. The ligand curve deviates from pure acid curve at
pH-2.5, which suggests that deprotonation starts from this pH. The value
of proton ligand formation number has been evaluated by the pointwise
calculation method using the following equation:
13

^, ( V " - V ) ( N ° + E ° )
( V ° + V ' ) T °
where Y is the average number of dissociable protons present in the
ligand. V and V" are the volume of NaOH consumed during acid
and ligand titration respectively. V° is the total volume of the
mixture. N° is the concentration of NaOH. E° is the concentration
of acid. T°L is the initial concentration of Ligand.
The proton ligand formation curves were obtained by plotting
proton ligand formation number (HA) against pH. The approximate
value of the proton ligand stability constants, LogK"and LogK" were
evaluated by pointwise calculation using the following equations:
LogK," = p H + L o g , „ - % - (n, <1)
LogK," = pH+ Log,„ ^ ^ (1< n, < 2)
Calculation of n (Metal ligand formation number):
Metal ligand formation number is the average number of
ligands attached per metal ion and was evaluated by using
following equation:
_ ^ ( V " - V " ) ( N ° + E < ' )
( V + V j i l . T "
where T°M is the initial concentration of metal ion. V" and V" are
14

the volumes of NaOH consumed during ligand and complex
titration respectively. The values of n were determined at various
pH by pointwise calculation method.
Calculation of pL (Free ligand exponent):
The free ligand exponent was evaluated at various n values
using the following equation:
pL = Log 10 i = 0
>"
anti log pH^ rv°+v"
Where |3"n is the overall proton ligand stability constant. The
pL values were also calculated at different pH by pointwise
calculation method.
Calculation of Log K (Stability Constant);
The formation curves of the metal ligand complexes were
obtained by plotting ii versus pL and stability constant can be
directly estimated from them by half-integral method [34,35]. The
stability constant was also evaluated by using following equations:
n LogK, = pL + Log— -1-n
LogKj =pL + Log—— 2 - n
15

RESULTS AND DISCUSSION
A. pH metric titration of Sulfamethazine,
In the case of sulfamethazine, proton ligand formation
number (w A) shows that the molecule contains only one replaceable
hydrogen atom.
H2 \ /
S O 2 — N H — ^
Sulfamethazine
The proton ligand formation number ( « A ) was obtained by
potentiometric titration curves of acid and ligand at different pH
(Fig. 1-5) by using pointwise-calculation method. Since « A is less
than one (Table-1) there is only one replaceable hydrogen atom and
therefore only LogK" is obtained.
16

12
10
« 6
-Connplex Titration witliMn(ll)
I I I I 1 I I I I I I I I I I I I — I — \ — I — I — I — I — \ — \ — I — I — I — I — I — I — I — r
0 0.5 1 1.5 2 2.5 3 3.5 4 4.5 5 5.5 6 6.5 7 7.5 8
Volume of NaOH (ml)
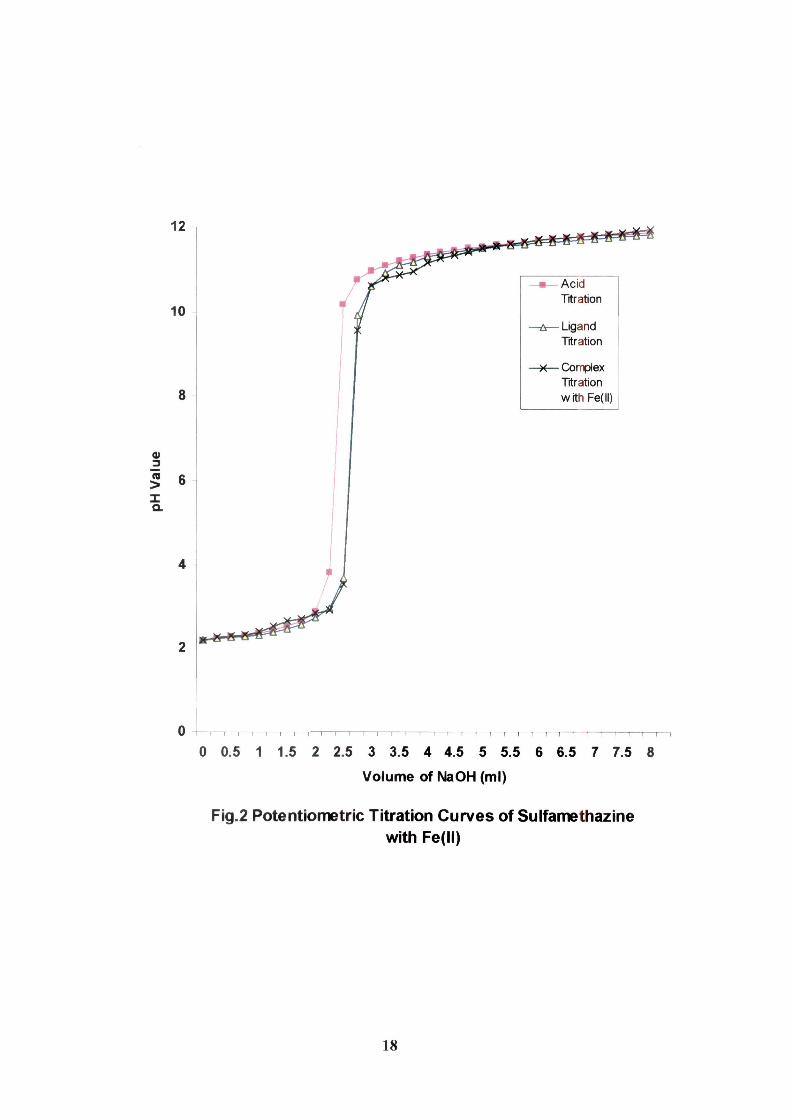
Fjg.1 Potentiometric Titration Curves of Sulfamethazine with IVIn(ll)
17
12
10
0)
« 6 X
a
- Ligand Titration
-)<—Complex Titration withFe(ll)
T I I I t I 1 1 ; I I I 1 I I I I I 1 1 1 1 1 — I 1 — I — 1 \ 1 1 1 — \ r
0 0.5 1 1.5 2 2.5 3 3.5 4 4.5 5 5.5 6 6.5 7 7.5 8
Volume of NaOH (ml)
Fig.2 Potentiometric Titration Curves of Sulfamethazine with Fe(ll)
18

12
10
I I I I — I — I — I — I — I \ I I I — I — I — I — I — I — I — I — I — 1 — I — t — I — I — I — I — I — i — I — I — I — I
0 0.5 1 1.5 2 2.5 3 3.5 4 4.5 5 5.5 6 6.5 7 7.5 8
V o l u m e of NaOH (ml)
Fig.3 Potent iometr ic Titration Curves of Sui famethazlne
w i t h C o ( l l )
19

12
10
I I \ t I ] 1 I I i I 1 I I I I I I I 1 1 1 — i — I — \ — I — I — 1 — 1 — ] — 1 — \ — 1 — I
0 O.S 1 1.S 2 2.S 3 3.5 4 4.5 5 S.S 6 6.5 7 7.5 8
Volume o f N a O H (ml)
Fig.4 Potentiometrjc Titration Curves of Sulfamethazine
with Ni(il)
20

12 -,
10
-[—I—I—I—I—I—r T ! I i I — I — I — I — \ — r 1 I I I I I I
0 0,5 I 1.5 2 2.5 3 3,5 4 4.5 5 5.5 6 6.5 7 7.5
Volume o f N a O H j m l )
Fig.5 PotentJometric Titration Curves of Suifamethazine
wi thCu( l l )
21
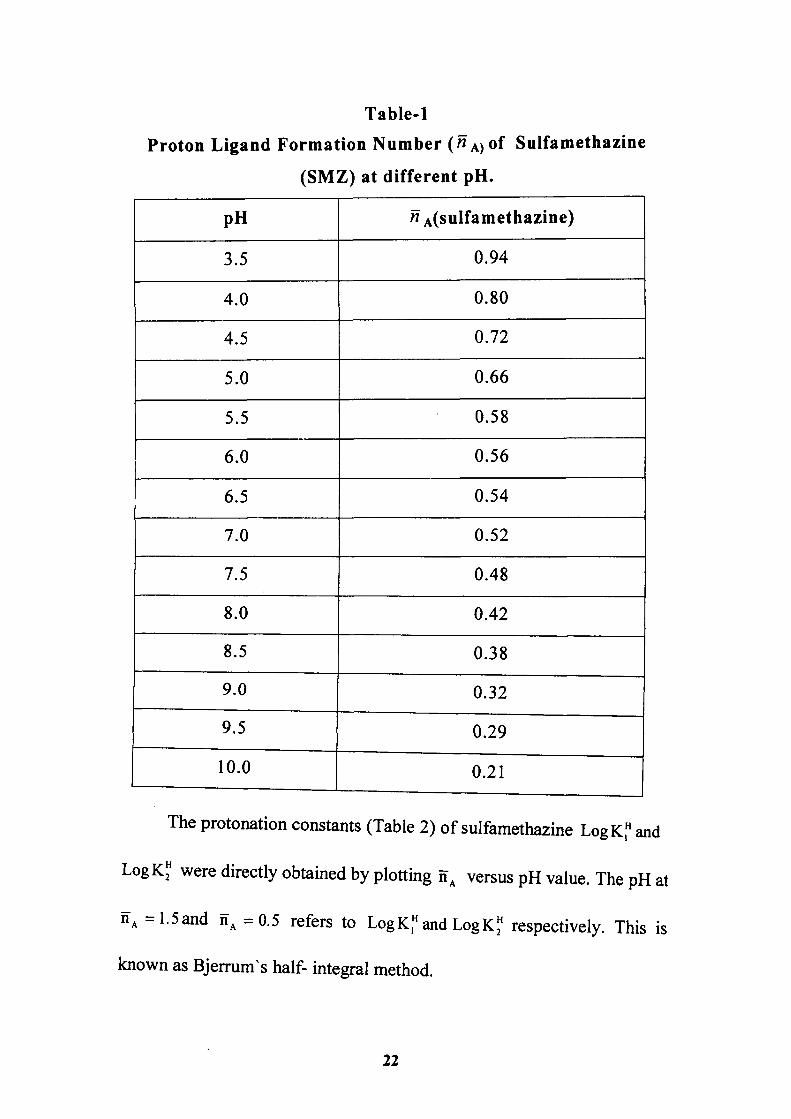
Table-1
Proton Ligand Formation Number («A)Of Sulfamethazine
(SMZ) at different pH.
pH
3.5
4.0
4.5
5.0
5.5
6.0
6.5
7.0
7.5
8.0
8.5
9.0
9.5
10.0
n A(sulfamethazine)
0.94
0.80
0.72
0.66
0.58
0.56
0.54
0.52
0.48
0.42
0.38
0.32
0.29
0.21
The protonation constants (Table 2) of sulfamethazine LogK," and
LogK," were directly obtained by plotting n^ versus pH value. The pH at
fi, =1.5and iT =0.5 refers to LogK," and LogK * respectively. This is
known as Bjerrum^s half- integral method.
22

Table-2
Protonation constants of sulfamethazine
Half-integral method
Pointwise calculation method
LogK"
7.00
7.02
LogPi:
7.00
7.02
Proton ligand formation curve (Fig, 6) were obtained by plotting
n^ versus pH of the system. The protonation constant can be directly
obtained by using Bjerrum's half-integral method [38, 39].
1.0-,
0.9
I 0.8-E
0.7-
0.6-
•O 0.5-1 c 3> = 0.4 H c o 1 0.3-Q.
0.2.
- | ' 1 ' 1 9 10 11
Fig.6 Proton ligand fonnation curve of Sulfomethazine at u = 0.1 M
23
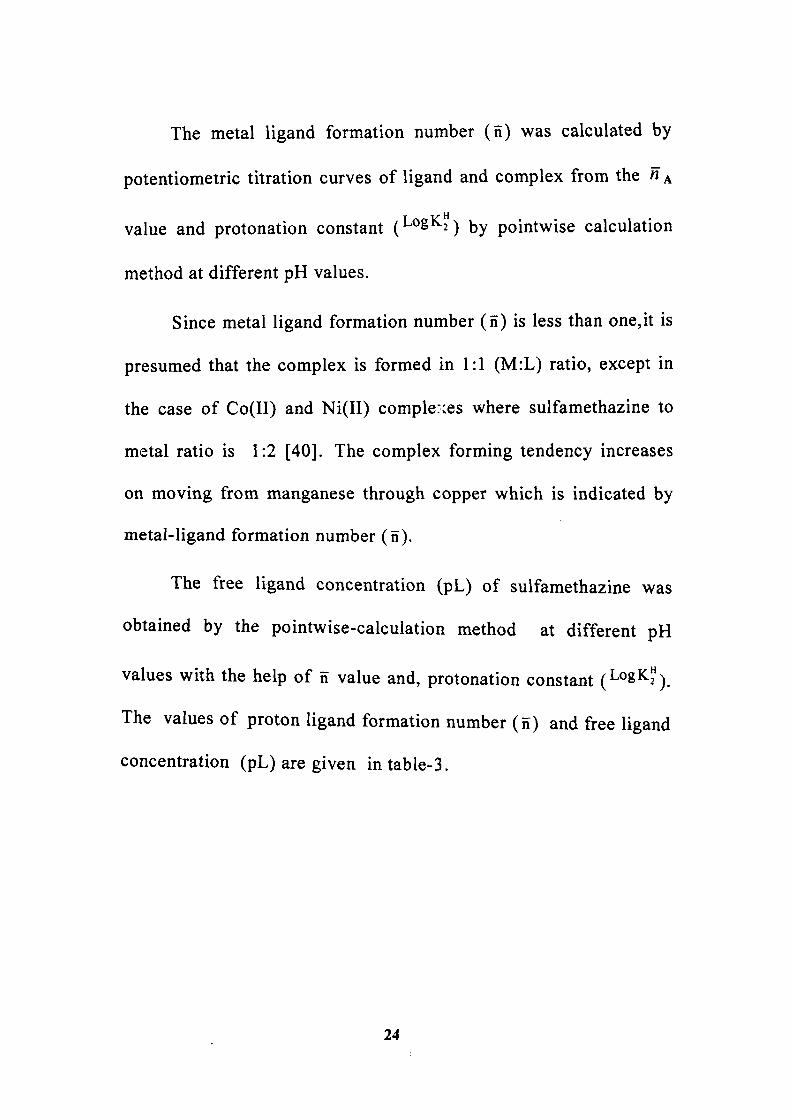
The metal ligand formation number (n) was calculated by
potentiometric titration curves of ligand and complex from the n ^
value and protonation constant (^^8*^2) by pointwise calculation
method at different pH values.
Since metal ligand formation number (ii) is less than one,it is
presumed that the complex is formed in 1:1 (M:L) ratio, except in
the case of Co(II) and Ni(II) complexes where sulfamethazine to
metal ratio is 1:2 [40]. The complex forming tendency increases
on moving from manganese through copper which is indicated by
metal-ligand formation number (n).
The free ligand concentration (pL) of sulfamethazine was
obtained by the pointwise-calculation method at different pH
values with the help of ii value and, protonation constant (LogK^^
The values of proton ligand formation number (n) and free ligand
concentration (pL) are given intable-3.
24

Table-3 Metal Ligand Formation Number and Free Ligand-
Concentration (pL) of Sulfamethazine.
pH
3.5
4.0
4.5
5.0
5.5
6.0
6.5
7.0
7.5
8.0
8.5
9.0
9.5
10.0
Mn
n
0.16
0.18
0.20
0.26
0.30
0.37
0.42
0.49
0.52
0.58
0.62
0.64
0.66
0.69
pL
8.68
8.19
7.72
7.21
6.25
6.06
5.19
4.32
3.81
3.50
3.10
2.88
2.62
2.40
Fe
n
0.17
0.19
0.21
0.30
0.33
0.37
0.44
0.5
0.55
0.6
0.64
0.67
0.70
0.72
pL
8.81
8.35
7.86
7.39
6.88
6.35
5.60
5.12
4.60
4.21
3.80
3.36
2.80
2.43
Co
n
0.18
0.22
0.29
0.35
0.46
0.61
0.71
0.89
1.05
1.32
1.40
1.56
1.70
1.88
pL
8.84
8.42
7.90
7.50
6.92
6.45
5.60
5.13
4.56
4.20
3.82
3.41
2.90
2.56
Ni
n
0.21
0.30
0.34
0.41
0.56
0.78
0.88
1.02
1.24
1.47
1.61
1.72
1.83
1.95
pL
8.92
8.51
7.95
7.56
6.96
6.48
5.66
5.19
4.39
3.98
3.53
3.05
2.70
2.31
Cu
n
0.39
0.46
0.52
0.59
0.61
0.66
0.70
0.75
0.79
0.82
0.85
0.89
0.92
0.96
pL
9.12
8.61
8.11
7.68
7.19
6.71
6.30
5.71
5.28
4.75
4.29
3.76
3.25
2.71
Since metal ligand formation number (n) increases with
increasing pH, it suggests that complex formation is favourable in
basic medium.
The metal-ligand formation curves (Fig.7) were obtained by
plotting n versus pL values [41,42]. The stability constants of the
sulfamethazine-complexes can also be directly obtained by half-
25
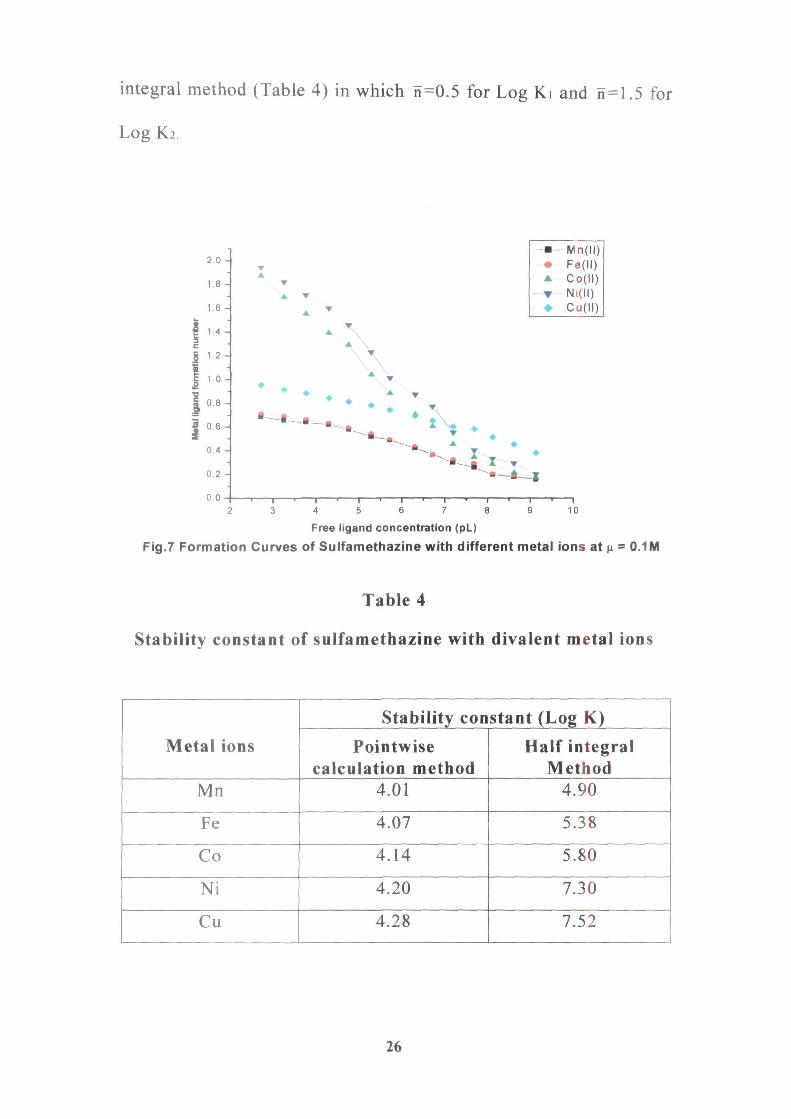
integral method (Table 4) in which n=0.5 for Log Ki and n=1.5 for
Log Ki
2 . 0 -
1 .8 -
1 .6 -
I J I 10-
i 0.8
0 . 6 -
0.4 -
0 . 2 -
0.0
• . ^ >
-•-Mn(l l ) • Fe(ll) A Co(ll) • Ni(ll) • Cu(ll)
—I 10 2 3 4 5 6 7 8 9
Free ligand concentration (pL)
Fig.7 Formation Curves of Sulfamethazine witfi different metal ions at ^ = 0.1 M
Table 4
Stability constant of sulfamethazine with divalent metal ions
Metal ions
Mn
Fe
Co
Ni
Cu
Stability constant (Log K)
Pointwise calculation method
4.01
4.07
4.14
4.20
4.28
Half integral Method
4.90
5.38
5.80
7.30
7.52
26

The stability constants (Log Ki and Log K2) were also
calaulated by pointwise calculation method (Table 5) at different pH
values. The stability constant decreases gradually with increasing pH.
Table 5
Stability constants of sulfamethazine (Log K) by pointwise
calculation
pH
3.5
4.0
4.5
5.0
5.5
6.0
6.5
7.0
7.5
8.0
8.5
9.0
9.5
10
Mn
6.61
6.12
5.76
5.40
4.96
4.58
4.12
3.80
3.39
3.02
2.68
2.31
1.92
1.61
Fe
6.72
6.25
5.84
5.46
5.01
4.64
4.20
3.85
3.45
3.10
2.71
2.36
1.94
1.65
Co
6.81
6.30
5.90
5.51
5.05
4.69
4.36
3.92
3.52
3.15
2.78
2.40
1.97
1.68
Ni
6.92
6.41
5.95
5.62
5.12
4.73
4.41
3.96
3.62
3.18
2.84
2.42
2.02
1.75
Cu
6.98
6.51
6.04
5.68
5.18
4.82
4.48
4.04
3.76
3.25
2.91
2.52
2.06
1.79
27

The stability constant increases gradually from Mn through
Copper. It follows the Irving -Wil l iam's order [43].
Mn < Fe < Co < Ni < Cu
A plot of LogK of the sulfamethazine-complexes vs e /r of
metal ions (Table 6) showed a straight line (Fig.8) indicating that the
metal-ligand(M-L) interaction is predominantly electrostatic in nature
and results in the formation of ionic complexes although the
possibility of some covalent interaction cannot be excluded [44,45].
Table 6
Log K of sulfamethazine and e /r value of divalent metal ions
Mn"^
Fe^^
Co^^
Ni ^
Cu^^
LogK
4.01
4.07
4.14
4.20
4.28
e ' / r
4.12
4.35
4.52
4.82
4.60
4.3
4.25
4.2-j
^ 4.15
o 4.1
4.05-
4
3.95
4 4.1 4.2 4.3 4.4 4.5 4.6 4.7 4.8 4.9
e'/r
Fig.8 A plot of e /r verus Log K of Sulfamethazine
28

B. Conductometric Titration
In the conductivity titrations, 20ml of sulfamethazine(lxlO'^M)
was titrated against different metal chloride (IxlO^^M) solutions in
aqueous medium. It was found that a 2:1 (M.L) complexes were formed
with Co(Il) and Ni(Il) although 1:1(M:L) complexes are obtained with
other metal ions. Precipitation of the complexes does not occur under the
experimental conditions at room temperature.
14
13
12
? i i
5 10 c 3 « 9 •o § 8 O
7
6
5 0 5 10 15 20 25 30 35 40 45 50 55 60 65 70
Volume of Metal ions (ml)
Fig. 9 ConduGtometriG Titration Curves of Sulfamethazine with different metal ions
The thermodynamic parameters (Table 7) were also calculated
from the stability constants by using the following formulas [46].
AG=-2.303RT Log K
AG=AH-TAS
29
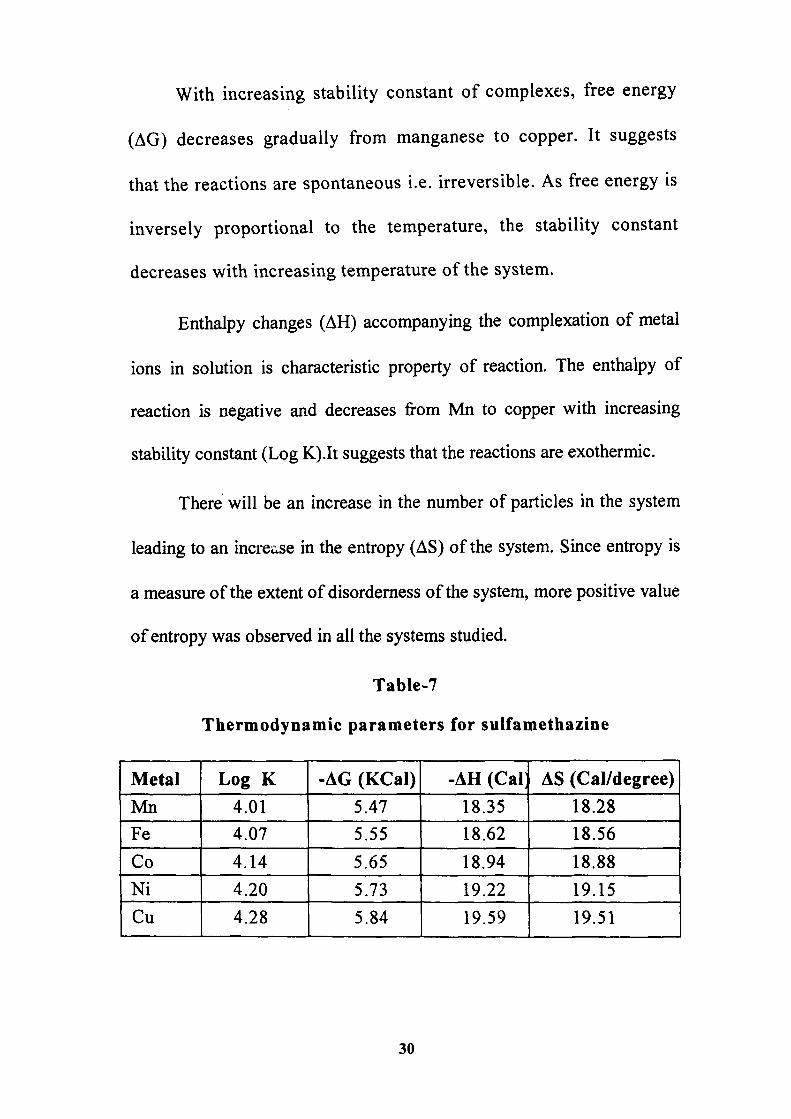
With increasing stability constant of complexes, free energy
(AG) decreases gradually from manganese to copper. It suggests
that the reactions are spontaneous i.e. irreversible. As free energy is
inversely proportional to the temperature, the stability constant
decreases with increasing temperature of the system.
Enthalpy changes (AH) accompanying the complexation of metal
ions in solution is characteristic property of reaction. The enthalpy of
reaction is negative and decreases from Mn to copper with increasing
stability constant (Log K).It suggests that the reactions are exothermic.
There will be an increase in the number of particles in the system
leading to an mcrease in the entropy (AS) of the system. Since entropy is
a measure of the extent of disordemess of the system, more positive value
of entropy was observed in all the systems studied.
Table-7
Thermodynamic parameters for sulfamethazine
Metal Mn Fe Co Ni Cu
Log K 4.01 4.07
4.14 4.20 4.28
-AG (KCal) 5.47 5.55
5.65 5.73 5.84
-AH (Cal 18.35 ^ 18.62
18.94 19.22 19.59
AS (Cal/degree) 18.28 18.56
18.88
19.15 19.51
30
A. pH metric titration of Pyridoxal 5-phosphate
The "A value for pyridoxal 5-phosphate is more than one
which suggests that there are two replaceable hydrogen atoms in
the molecule.
CHO OH, 1 Oil
\ / ^
CH3 ^ cf ^OH
(Pyridoxal 5-phosphate)
The pyridoxal 5-phosphate gives a pale yellow-colour in aqueous
solution. Since precipitation occurs in basic medium the experiment was
performed below that pH. It was noted that the addition of alkali was
accompanied by a gradual change in the colour of pyridoxal 5-phosphate
from yellow to deep yellow with increasing pH. The colour change
(Table 8) observed in presence of metal ions are almost similar to those
observed in their absence,[47,48].
Table-8 Colour change in PLP-metal system
pH
3.0-5.85
5.85-10.0
10.0 above
Colour
Pale yellow- deep
Reddish
Precipitation occurs
31
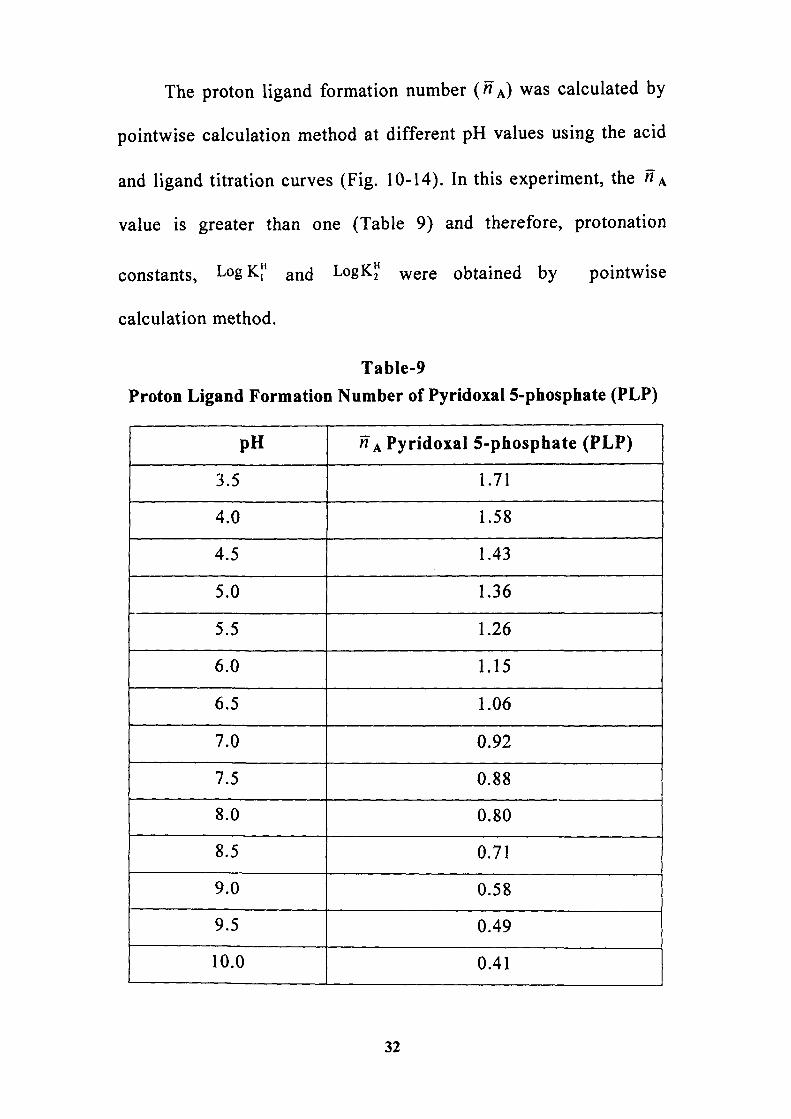
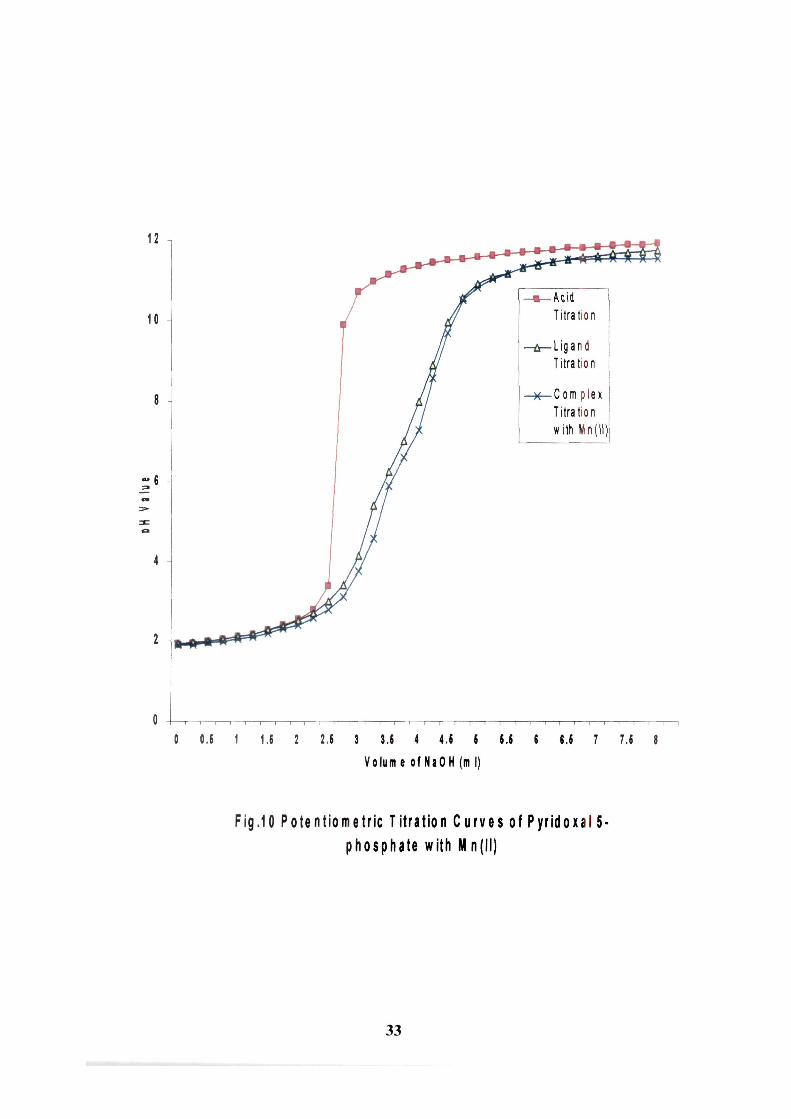
The proton ligand formation number (« A) was calculated by
pointwise calculation method at different pH values using the acid
and ligand titration curves (Fig. 10-14). In this experiment, the w ^
value is greater than one (Table 9) and therefore, protonation
constants, LogK" and LogK" were obtained by pointwise
calculation method.
Table-9 Proton Ligand Formation Number of Pyridoxal 5-phosphate (PL?)
pH
3.5
4.0
4.5
5.0
5.5
6.0
6.5
7.0
7.5
8.0
8.5
9.0
9.5
10.0
« A Pyridoxal 5-phosphate (PLP)
1.71
1.58
1.43
1.36
1.26
1.15
1.06
0.92
0.88
0.80
0.71
0.58
0.49
0.41
32
12
10
??^»4^
.6 1 1,S 2 2.S 3 3,6 4 4.S i (.6 G
V o l u n i e o f N a O H ( m l )
(.6 7 7.5
Fig.10 Potent iometr ic Titration Curves of Pyr idoxalS-phosphate with Mn(l l )
33
12
10
- ^ f - C o m plex Titralion with Fel
0.6 1 1.< 2 2.6 3 3.6 4 4.6 6 6.6
V o l u m e of NaOH |m I)
6.6 7 7.6
F i 9 . l l Potent iometr ic Titration C u r v e s of PyridoxalS>pl\ospl \ate with Fe(ll)
34

12
10
-T \ n
- C o m p lex T i t ra t ion wi th Co ( l l )
T I I I [ r~n I I 1 r i 1—~i 1—i 1 r—~r
0 O.S 1 1.5 2 2.6 3 3.S 4 4.5 5 5.S .6 7 7.6
V o l u m e Of N a O H (m I j
Fig.12 Potent iometr ic Titrat ion C u r v e s of Pyr idoxai S-pl iosphate
with Co(l i )
35

12
10
"1 ] r — I [- -1 1 n "1 1 1 r-
0 0 .5 1 1.S 2 2.S 3 3.S 4 4 . 5 5 5 .5
Volume of NaOH (ml)
.5 7 7.5
Fig.13 Po ten tic me trie T i t ra t ion C u r v e s of Pyr idoxa l 5 - p h o s p h a t e
with Ni(l l)
36

12
10
— I r—\ r"~i r—1 i \ i — T I I I I I 1 1 1 1 1 1 1 1 1 1 1 \ ] 1 \ 1 —
0 0.5 1 1.5 2 2.5 3 3.5 4 4.5 5 5.5 6 6.5 7 7.5 8
Volum« of NaOH (ml)
F ig .14 P o t e n t i o m e t r i c T i t r a t i o n C u r v e s of P y r i d o x a l 5 - p h o s p h a t e
with C u d ! )
37

The protonation constants (Table 10) of pyridoxal 5-phosphate,
LogK" and LogK" were directly obtained by plotting n^ versus pH value
(Fig. 15) by noting the pH at which n^ = 1.5 and n^ = 0.5 respectively.
Table 10
Protonation constants of Pyridoxal 5-phosphate.
Half integral method
Point wise calculation method
LogKf
4.52
4.68
LogK;"
9.35
8.96
Logpr
13.87
13.64
1.8
1.6
I.., c .2 12 •s
, .
0.8
I 0.6-
0.4-
- 1 1 1 1 1 1 1 1 1 . 1 1 1 1 , 1 1
3 4 5 6 7 8 9 10 11
pH
Fig. 15 Proton ligand formation curve of Pyridoxal 5-phosphate
Since metal ligand formation number (n) increases (Table 11)
with increasing pH, the complex formation is favoured in basic
medium. The metal-ligand formation number indicates that there is
38
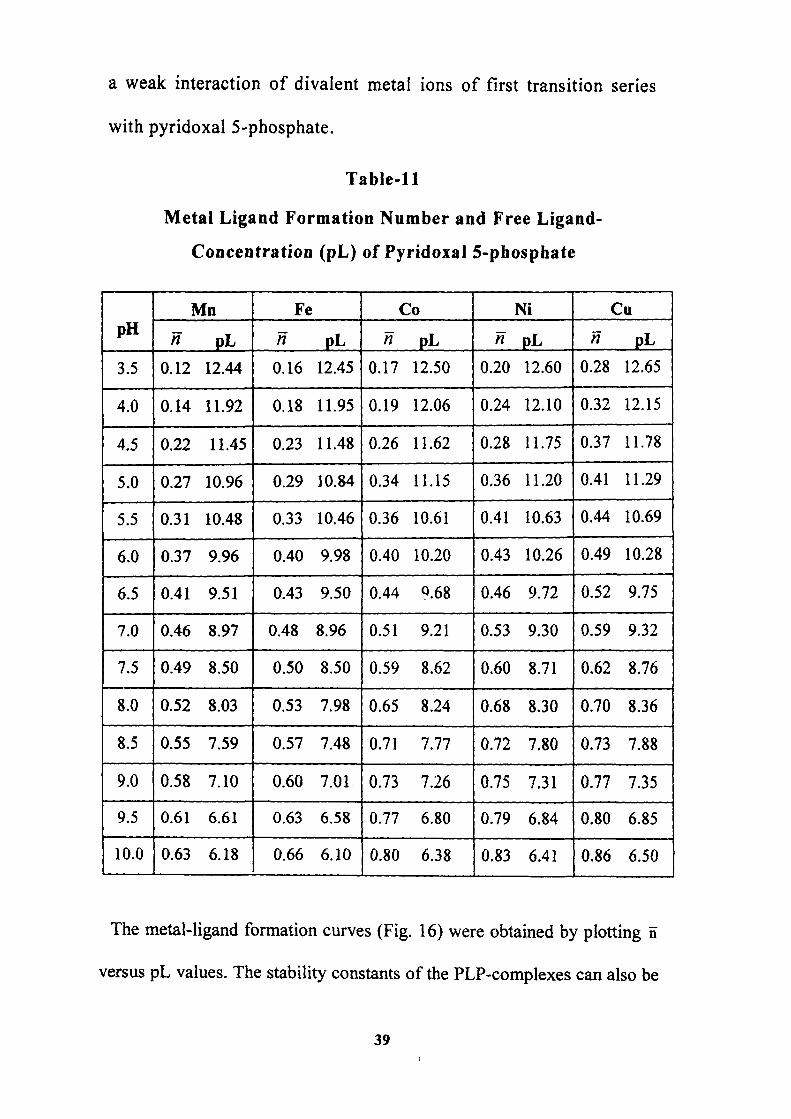
a weak interaction of divalent metal ions of first transition series
with pyridoxal 5-phosphate.
Table-11
Metal Ligand Formation Number and Free Ligand-
Concentration (pL) of Pyridoxal 5-phospliate
pH
3.5
4.0
4.5
5.0
5.5
6.0
6.5
7.0
7.5
8.0
8.5
9.0
9.5
10.0
Mn
n
0.12
0.14
0.22
0.27
0.31
0.37
0.41
0.46
0.49
0.52
0.55
0.58
0.61
0.63
pL
12.44
11.92
11.45
10.96
10.48
9.96
9.51
8.97
8.50
8.03
7.59
7.10
6.61
6.18
Fe
n
0.16
0.18
0.23
0.29
0.33
0.40
0.43
0.48
0.50
0.53
0.57
0.60
0.63
0.66
pL
12.45
11.95
11.48
10.84
10.46
9.98
9.50
8.96
8.50
7.98
7.48
7.01
6.58
6.10
Co
n
0.17
0.19
0.26
0.34
0.36
0.40
0.44
0.51
0.59
0.65
0.71
0.73
0.77
0.80
pL
12.50
12.06
11.62
11.15
10.61
10.20
Q.68
9.21
8.62
8.24
7.77
7.26
6.80
6.38
]
n
0.20
0.24
0.28
0.36
0.41
0.43
0.46
0.53
0.60
0.68
0.72
0.75
0.79
0.83
Ni
pL
12.60
12.10
11.75
11.20
10.63
10.26
9.72
9.30
8.71
8.30
7.80
7.31
6.84
6.41
Cu
n
0.28
0.32
0.37
0.41
0.44
0.49
0.52
0.59
0.62
0.70
0.73
0.77
0.80
0.86
pL
12.65
12.15
11.78
11.29
10.69
10.28
9.75
9.32
8.76
8.36
7.88
7.35
6.85
6.50
The metal-ligand formation curves (Fig. 16) were obtained by plotting n
versus pL values. The stability constants of the PLP-complexes can also be
39

directly obtained from half- integral method (Table 12) in which n=0.5 for
Log Ki and n=1.5 for Log Ki.
0.9 •
0.8-
S 0.7 •
E n 0.6-c p
I 0.5.
E 0.4. D)
I 0.3 •
0.2-
0.1
—•-- • -- A -
—T-•
-Mn(ll) Fe{ll)
-Co(ll) -Ni(ll)
Cu(ll)
—r-10
—r 11 12 13
Free ligand concentration (pL)
Fig. 16 Metal ligand formation curves of PLP at ^ = 0.1 M
Table 12
Stability constant of Pyridoxal 5-phosphate with divalent metal ions
Metal ions
Mn
Fe
Co
Ni
Cu
Stability cons
Pointwise calculation method
7.91
8.03
8.15
8.45
8.58
tant (Log K)
Half integral Method
8.35
8.50
9.30
9.42
9.86
40

The stability constants (Log K ) of pyridoxal 5-phosphate were
calaulated by the pointwise calculation method (Table 13) at
different pH. It was observed that the stability constant decreases
gradually with increasing pH of the system.
Table-13 Stability constants of pyridoxal 5-phosphate (Log K) by
Pointwise Calculation Method
pH
3.5
4.0
4.5
5.0
5.5
6.0
6.5
7.0
7.5
8.0
8.5
9.0
9.5
10.0
Mn
10.79
10.18
9.87
9.38
8.92
8.47
8.21
7.56
7.28
6.64
6.41
5.96
5.67
5.44
Fe
10.81
10.21
9.88
9.40
8.98
8.52
8.26
7.60
7.36
6.78
6.60
^ 6.12
5.76
5.50
Co
10.83
10.22
9.90
9.50
9.08
8.60
8.55
8.06
7.79
7.25
6.67
6.20
6.16
5.77
Ni
10.86
10.24
9.94
9.68
9.15
8.91
8.46
8.17
7.85
7.42
6.83
6.50
6.22
5.87
Cu
10.99
10.44
10.06
9.78
9.26
9.05
8.76
8.36
8.00
7.53
6.96
6.56
6.30
5.98
The stability constant increases gradually from Mn through
Cu according to the Irving -William^ s order .
Mn < Fe <Co < Ni < Cu
41

A plot of logK of the PLP-complexes vs e^/r of different
metal ions (Table 14) shows a straight line (Fig. 17) indicating that
the metal-ligand (M:L)interaction is predominantly electrostatic in
nature and results in the formation of ionic complexes although the
possibility of some covalent interaction cannot be excluded [49].
Table 14
Log K of Pyridoxal 5-phosphate and e /r value of divalent metal ions
Mn"'
Fe ^
Co ^
Ni"^
Cn''
LogK
7.91
8.03
8.15
8.45
8.58
eVr
4.12
4.35
4.52
4.82
4.60
8.6 n
8 .4 -i^
— 1
8 .
78-1 . U
i
-
1
\ 42
• ^ ^^—•
^
^ 4
1 - 1 1 • - — 1
4.4 46 48 I e^/r
Fig.lTAplotofe^/rvslogKofPLP
42

The plot suggests interaction of electrostatic type between
the metal ion and the pyridoxal 5-phosphate.A 1:1 (M:L) complex
is formed between PLP and transition metal ions.
It has been shown by Viswanathan and coworkers from NMR
spectral data that Mn(II) and Co(II) complexes are simultaneously
bound to the phosphate group and aldehyde-oxygen in the PLP-
complex system and stability constants of complexes indicate a
definite interaction with ring[50,51].
C H 3 ^ r ^
where M = Mn (II), Co (II)
B. Conductivity Titration of Pyridoxal 5-phosphate:
In the conductivity measurements, 10ml of PLP(lxlO~'*M) was
titrated (Fig, 18) against different metal chloride (lxlO'"*M) solutions
in aqueous medium. It was found that a 1:1(M:L) complexes were
formed with all the metal ions without any precipitation under the
experimental conditions at room temperature.
43

55-,
50 -
•^ 4 5 -
a> o c (0
ts = 40 c o O
35-
30
- • -Cu( l l ) - • - Co(ll) - A - Nb((()
— I — 10
—T—
20 —r-30
I 40
Volume of metal ions (ml)
Fig. 18 Conductometiic Titration curves of PLP-metai system
As free energy (Table 15) decreases gradually from manganese
to copper with increasing the stability constant,it suggests that the
reactions are spontaneous.
There is a decrease in the enthalpy of reaction from Mn to
copper suggesting that reactions are exothermic. As entropy is the
measure of randomness and it increases gradually from Mn to
copper suggesting that complex formation tendency also increases
from Mn to copper.
44
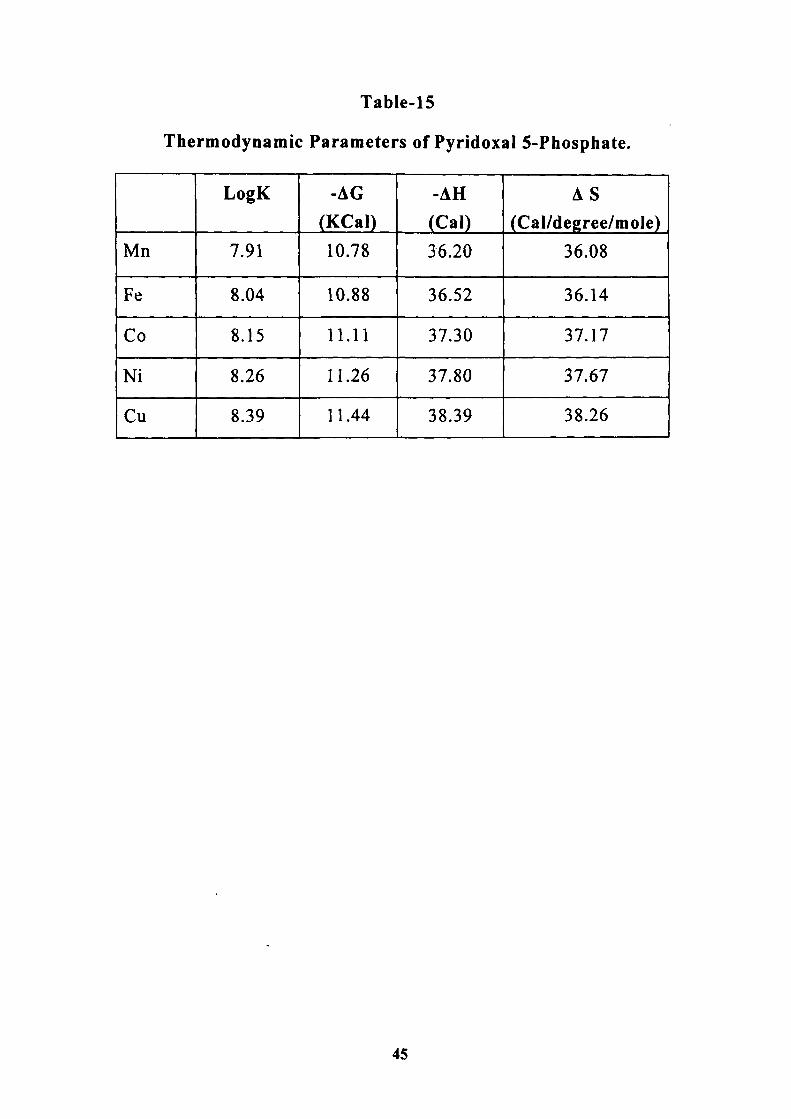
TabIe-15
Thermodynamic Parameters of Pyridoxal 5-Phosphate.
Mn
Fe
Co
Ni
Cu
LogK
7.91
8.04
8.15
8.26
8.39
-AG
(KCal)
10.78
10.88
11.11
11.26
11.44
-AH
(Cal)
36.20
36.52
37.30
37.80
38.39
AS (Cal/degree/mole)
36.08
36.14
37.17
37.67
38.26
45

A. pH metric titration of DL-Cystine
The w A value for DL-cystine is greater than one (Table 16) which
suggests that there are two replaceable hydrogen atoms in the molecule.
COOJ ' \
COOH /
CH-CH2-S-S-CH2-CH Mi{ NH2
(Cystine)
In acidic medium, the amino acids exist as HsN' RCOOH.The pH of
initial solutions of amino acids is higher than the free acid because
TabIe-16 Proton Ligand Formation Number of DL-Cystine
pH
3.5
4.0
4.5
5.0
5.5
#.0
• ^ 1 - 1 ^ ^ . 5
/ \ ^ . 0
WA(Cystine)
1.89
1.72
1.61
1.57
1.45
1.28
1.13
0.95
0.88
0.71
0.58
0.42
0.36
^ 0.29

A. pH metric titration of DL-Cystine
The « A value for DL-cystine is greater than one (Table 16) which
suggests that there are two replaceable hydrogen atoms in the molecule.
COO^ ^ /
,CH-CH2-S-S-CH2-CI^
COOH
NH-/ NHo
(Cystine)
In acidic medium, the amino acids exist as HsN^RCOOH.The pH of
initial solutions of amino acids is higher than the free acid because
TabIe-16 Proton Ligand Formation Number of DL-Cystine
pH
3.5
4.0
4.5
5.0
5.5
6.0
6.5
7.0
7.5
8.0
8.5
9.0
9.5
10.0
/7A(Cystine)
1.89
1.72
1.61
1.57
1.45
1.28
1.13
0.95
0.88
0.71
0.58
0.42
0.36
0.29
46

of the protonation of the basic -COO group and the dipolar ion has
been converted to the acid form, HsN^RCOOH.
The colourless complexes of DL-cystine formed in solution in
acidic medium, and readily gives precipitate in alkaline medium.Due to
very low concentration of metal ions used, the formation of polynuclear
species was considered to be unimportant[52,53].
The proton ligand formation number ( « A ) was calculated by
pointwise calculation method at different pH values using the acid
and ligand titration curves (Fig. 19-23).
The protonation constants (Table 17) of DL-cystine, LogKf
and LogK" were directly obtained from a plot of n^ versus pH (Fig. 24)
the value corresponds to n^ = 1.5 and n^ = 0.5 respectively.
TabIe-17
Protonation constants of DL-Cystine
Half integral method
Pointwise calculation method
LogKj^
4.80
4.86
LogK^
8.78
8.24
LogPi:
13.58
13.10
47
12
10
8
o 3 7i > 6 z a.
- Complex Trtration w jth lUh(n)
~T 1 ^ I I I I i I I I I I i I 1 1 1 1 1 1 1 1 i 1 \ 1 1 1 1 1 1 1
0 0.6 1 1.6 2 2.6 3 3.6 4 4.6 6 6.6 6 6.6 7 7.6 8
Volume of NaOH (ml)
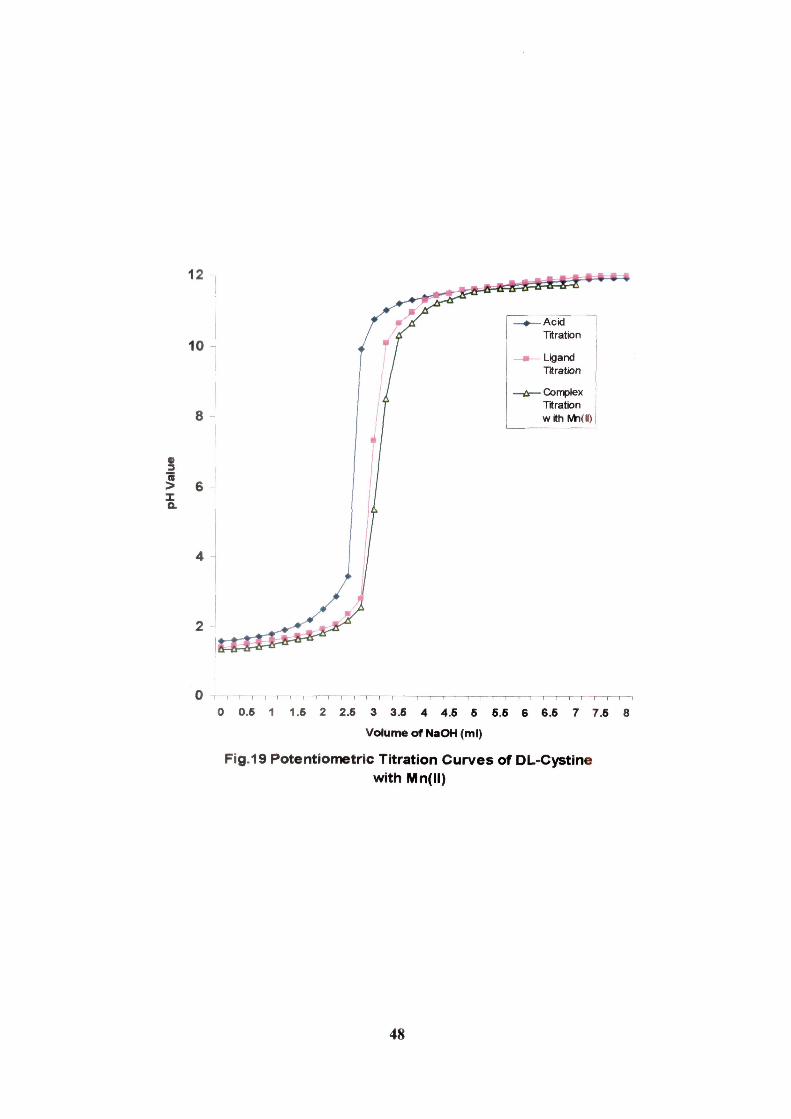
Fig.19 Potentiometric Titration Curves of DL-Cystine with Mn(ll)
48

12 n
10
»=#=•=»
I.S 1.25 2 2.75 3.5 4.25 5 5.75
V o l u m e o f N a O H (ml)
6.5 7 ,25
F i g . 2 0 P o t e n i i o m e t r i c T i t r a t i o n C u r v e s o f D L - C y s t i n e
w i t h F e ( l i )
49
12
10
3
— [ — ( — ~ [ — 1 1 1 1 ( — I 1 1 [ — I 1 — I — I — I 1 — I 1 1 ; — \ — T — ; — ; i — ; — i ; i — \ — i
0 0.6 1 1.S 2 2.6 3 3 .6 4 4.6 5 5.6 6 6,6 7 7.6 8
V o l u m e of NaOH (ml)
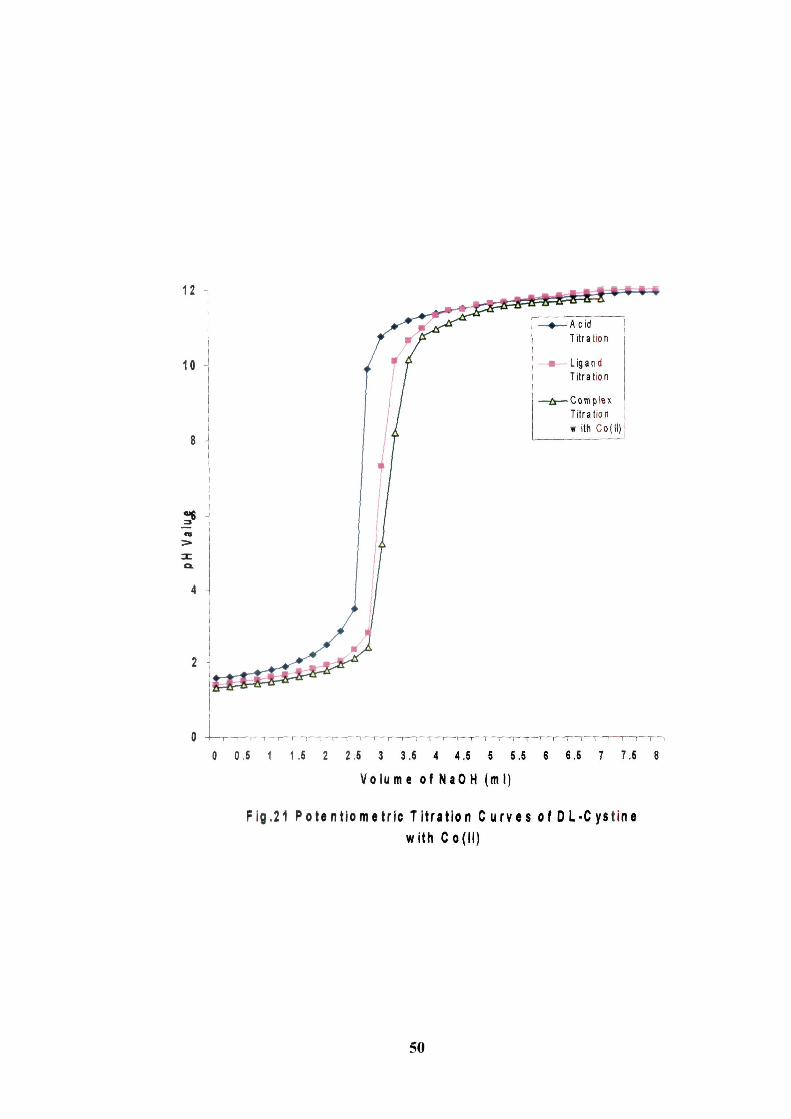
Fig .21 P o t e n t j o m e t r i c T lira tie n C u r v e s of D L - C y s t i n e with C o ( l l )
50

12
10
~\ 1 1 i 1 r- n r '1 r~-i r~T~i—i—n *n—1—I—r-
0 0.5 1 1.5 2 2.5 3 3.5 4 4.5 5 5.5 6 6.5 7 7.5 8
Volume of NaOH (ml)
Fig.22 Potentlometrjc Titration Curves of DL-Cystine
with Nj/ll)
51

12
10
"T""' J'" "I r-^r—r
0 0.5 1 1.5 2 2.5 3 3.5 4 4.5 5 5.5 6 6.5 7 7.5 8
Volumt of NiOH (mil
Fig.23 P o t e n t i o m e t r i c T i t ra t ion C u r v e s of DL-Cyst ine
with Cu( l l )
52
E 3 C C o
•S3
n
• D c (0
c S 2
2.0-1
1.8
1.6
1.4-
1.2-
1.0-
0.8-
0.6-
0.4-
0.2-
- i — I — r -»—r 6 7 8
pH value 10 11
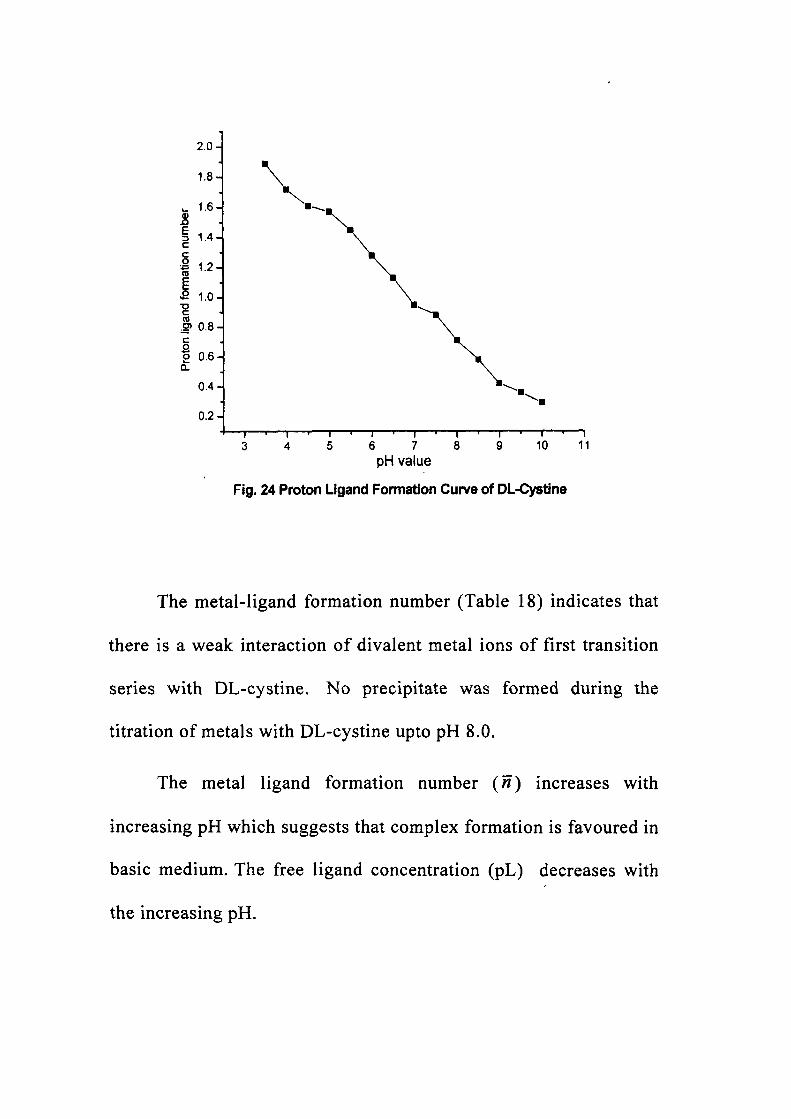
Fig. 24 Proton Ligand Formation Curve of OL-Cystine
The metal-ligand formation number (Table 18) indicates that
there is a weak interaction of divalent metal ions of first transition
series with DL-cystine. No precipitate was formed during the
titration of metals with DL-cystine upto pH 8.0.
The metal ligand formation number (« ) increases with
increasing pH which suggests that complex formation is favoured in
basic medium. The free ligand concentration (pL) decreases with
the increasing pH.

Table-18
Metal Ligand Formation Number and Free Ligand
Concentration of DL-Cystine.
PH
3.5
4.0
4.5
5.0
5.5
6.0
6.5
7.0
7.5
8.0
8.5
9.0
9.5
10.0
Mn
n
0.09
0.1
0.12
0.16
0.2
0.28
0.33
0.39
0.42
0.44
0.49
0.52
0.55
0.58
pL
12.88
12.4
11.9
11.39
10.9
10.4
9.91
9.38
8.95
8.43
7.96
7.44
6.92
6.51
Fe
n
0.062
0.1
0.13
0.21
0.32
0.35
0.4
0.43
0.47
0.49
0.51
0.53
0.58
0.61
pL
12.9
12.4
11.92
11.44
10.93
10.45
9.96
9.45
8.96
8.46
7.98
7.51
6.98
6.55
Co
n
0.1
0.12
0.15
0.23
0.33
0.37
0.41
0.44
0.48
0.52
0.55
0.58
0.61
0.64
pL
12.93
12.4
11.95
11.43
10.96
10.45
9.99
9.5
9.03
8.58
8.1
7.52
7.18
6.57
Ni
n
0.15
0.16
0.19
0.28
0.39
0.41
0.46
0.5
0.53
0.58
0.61
0.64
0.69
0.72
pL
12.96
12.5
11.96
11.46
11.02
10.51
10.02
9.42
9.02
8.46
8.06
7.5
7.12
6.6
Cu
n
0.21
0.25
0.29
0.32
0.41
0.45
0.49
0.52
0.55
0.6
0.65
0.69
0.72
0.78
pL
12.98
12.52
12.08
11.55
11.05
10.55
10.1
9.58
9.11
8.61
8.26
7.78
7.41
6.92
From a plot (Fig. 25) of « and pL, the formation curves of
metal-complexes were obtained from which the stability constants
(Table 19) can be obtained by half-integral method.
54

0.8 •
0.7 •
5 0.6 E 3 c 0.5 g TO
0.4-
I 0.3
0) 0.2
0.1
0.0.
'''^ l^n^ytx^'^
X —•-- • -- A -
— • -
- Mn(ll) - Fe(ll) -Co(ll) - Ni(ll) -Cu(ll)
- I — ' — I — ^ 11 12 6 7 8 9 10 11 12 13
Free ligand concentration (pL)
Fig. 25 Metal ligand formation curves of DL-cystine
Table 19
Stability constant of DL-Cystine with divalent metal ions
Metal ions
Mn
Fe
Co
Ni
Cu
Stability constant (Log K)
Pointwise calculation method
8.75
8.88
9.24
9.34
9.43
Half integral Method
7.80
8.22
8.82
9.53
9.95
55

As the pH value increases, the stability constant decreases
(Table 20) gradually. The stability constants were also calculated
by pointwise calculation method at different pH.
Table-20
Stability Constants of DL-Cystine (Log K) by Pointwise
Calculation Method
pH
3.5
4.0
4.5
5.0
5.5
6.0
6.5
7.0
7.5
8.0
8.5
9.0
9.5
10.0
Mn
11.65
11.17
10.79
10.27
9.90
9.40
8.95
8.41
8.06
7.71
7.24
6.71
6.19
6.06
Fe
11.76
11.36
10.88
10.45
9.96
9.56
8.98
8.58
8.12
7.84
7.44
6.84
6.32
6.16
Co
11.96
11.53
11.14
10.71
10.33
9.82
3.49
9.00
8.60
8.13
7.73
7.32
7.06
6.44
Ni
12.03
11.65
11.26
10.84
10.47
10.02
9.60
9.18
8.76
8.30
7.80
7.36
7.08
6.48
Cu
12.26
12.50
11.62
11.11
10.62
10.14
9.65
9.25
8.84
8.35
7.92
7.38
7.20
6.56
The stability constant increases gradually from Mn through
Copper which follows Irving -William's order:-
Mn < Fe<Co < Ni < Cu
56

A plot of logK of the Cystine-complexes vs e /r of metal ions
(Table 21) shows a straight line (Fig.26) indicating that the metal-
ligand interaction is predominantly electrostatic in nature and
results in the formation of ionic complexes although the possibility
of some covalent interaction cannot be excluded.
Table 21 Log K of DL-cystine and eVr value of divalent metal ions
Mn"2
Fe^^
Co^^
Ni"'
Cu^
LogK
8.78
8.95
9.25
9.36
9.47
eVr
4.12
4.35
4.52
4.82
4.60
9.6 9.5 9.4 9.3
? 9.1 9
8.9 8.8 8.7 — , J —
4.1 4.2 4.3 4.4 4.5 4.6 4.7 4.8 4.9 e»/r
Fig. 26 A plot of e /r vs log K of DL-cystine
The free energy (AG) decreases gradually from manganese to
copper with increasing stability constant of complexes. It suggests
57

that the reactions are spontaneous i.e. irreversible. As free energy is
inversely proportional to the temperature, the stability constant
decreases with increasing temperature of the system.
The enthalpy of reaction is negative and decrease from Mn to
copper with increasing stability constant (Log K).It suggests that
the reactions are exothermic. Enthalpy changes (AH) accompanying
the complexation of metal ions in solution is characteristic property
of reaction
There will be an increase in the entropy (AS) of the system
during experiment. Since entropy is a measure of the extent of
disordemess of the system, more positive value of entropy was
observed in all the system studied.
Table-22
Thermodynamic parameters for DL-cystine
Metal
Mn
Fe
Co
Ni
Cu
LogK
8.75
8.88
9.24
9.34
9.43
-AG
(KCal)
11.93
12.24
12.60
12.71
12.86
-AH
(Cal)
40.04
40.45
42.28
42.65
43.15
AS
(Cal/degree/mole)
39.91
40.26
42.14
42.50
43.00
58

Stability of sulfamethazine, pyriodoxal 5-phosphate and
DL-cystine upon complextion with divalent metal ions decreases with
an increase in pH value.
The values of Gibbs free energy change is negative which
indicates that the reaction is spontaneous.The enthalpy change is
also negative which suggests that the reactions are exothermic[56-
58]. As entropy is positive so it also favours the complexation
reactions.
59

REFERENCES
1. Khan, L.A, Siddiqi, K.S., Kureshey, R.I. and Zaidi, S.A.A.,
Ind.J.Chem., 26A, 969 (1987).
2. Tabassum, S., Siddiqi, K.S. Zaidi, S.A.A., Khan, N.H. and
Kureshey, R.I., Ind. J. Chem., 29A, 82 (1990).
3. Soliman, A.A., Sepectrochimica Acta, 65, 5, 1180 (2006).
4. Ghoneim, M.M., Mabrouk, E.M., Hassanein, A.M., El-Attar,
M.A. and Hesham, E.A., Central Eur. J. Chem., 5, 3, 898
(2007).
5. El-Baradie, K.Y., Chemical monthly, 136, 1136 (2005).
6. Gupta, M.K., Singh, H.L., Varshney, S. and Varshney, A.K.,
Bioinorg. chem. Appl, 1, 3. 309 (2003).
7. Mubarak, A.T., J. Inorg. Organometal. Polym., 14, 3, 201
(2004).
8. Hosny, W.M., Synth. React. Inorg. Met.-org. chem., 11, 2,
197(1997).
9. Buell, M.V. and Hansen, R.E., J. Am. Chem. Soc, 82, 6042
(1960).
10. Gorostidi, G.R.E,, Santos, J.G., Basagotia, A. and Blanco,
F.G., Bull. Chem. Soc. Jpn., 75,2471 (2002).
60

11. Gorostidi, G.R.E., Santos, J.G., Basagotia, A. and Blanco,
¥.G.,BulL Chem. Soc. Jpn., 76, 335 (2003).
12. Strausbauch, P. and Fischer, E.H., Biochem., 9, 2, 233 (1970).
13. Gramatikowa, S.I. and Christen, P.,J. Biol Chem., 111., 15,
9779(1997).
14. Bettati, S., Benci, S., Campanini, B., Raboni, S., Chirico, G.,
Bretta, S., Schnackerz, K.D., Hazlett, T.L., Gratton, E. and
Mozzarelli, A., J. Biol Chem., 275, 51,40244(2000).
15. Metzler, CM., Cahill, A. and Metzler, D.E., J. Am. Chem.
Soc, 102.6075(1980).
16. Tobias, P.S. and Kallen, R.G., J.Am. Chem Soc, 6530 (1987).
17. Garcia del Vado, A.M., Donoso, J., Munoz, F., Echevarria,
G.R. and Blanco, F.G., J. Chem. Soc, Perkin Trans. II, 445
(1987).
18. Shanbhag, V.M. and Martell, A.E., Inorg. Chem., 29, 1023
(1990).
19. Wrobleski, J.T. and Long, G.J., Inorg. Chem., 16, 11, 2752
(1977).
20. Nakamoto, K. and Martell, A.E., J. Am. Chem. Soc, 81, 5857
(1959).
61

21. Dewey, D. L. and Beecher, J., Nature, 206, 1369 (1965).
22. Hassan, F.S.M., Arab. J. Eng., 30, 1 A, 29 (2005).
23. Meester, P. and Hodgson, D.J., J. Am. Chem. Soc, 99, 6884
(1977).
24. Thiebert, R.J., Diederich J.F.G. and Rutherford, K.G., and
Cand J. Chem., 43,206(1965).
25. Hager, G. and Brolo, A.G., J. Electroanal. Chem., 550, 291
(2003).
26. Thiebert, R.J. and Walton, R.J., Cand. J. Chem., 45, 713
(1967).
27. Vogel, A.I., "^ text book of Quantitative Inorganic Analysis,
2)^^ Edn., Chap. 5, Longmans, London (1961).
28. Schwarzenbach, G., ""Complexometric titrations'", 60,
Methuen & Co., London (1956).
29. Bjerrum, J., ""Metal Ammine Formation in Aqueous
solutions", P. Hase, Copenhagen (1941).
30. Iriving, H. and Williams, R.J.P., J. Chem. Soc, 3192 (1953).
31. Iriving, H. and Rossotti, H.S., J. Chem. Soc, 3397 (1953).
32. Iriving, H.M. and Rossotti, H.S., J. Chem. Soc, 2904 (1954).
62

33. Calvin, M. and Wilson, K.W., J. Am. Chem. Soc, 67, 2003
(1945).
34. Jabalpurwala, K.E., Venkatachalam, K.A. and Kabadi, M.B.,
J. Inorg. Nucl Chem., 26, 1011 (1964).
35. Jabalpurwala, K.E., Venkatachalam, K.A. and Kabadi, M.B.,
J. Inorg. Nucl. Chem., 26, 1026 (1964).
36. Rossotti, F.J.C. and Rossotti, ""'The determination of stability
constants", McGraw-Hill Book company. Inc., New York
(1961).
37. Irving, H. and Williams, R.J.P., Nature, 162, 746 (1948).
38. Martell, A.E. and Motekaitis, R.J., ''Determination and use of
stability constants," VCH Publishers, Inc., New York.
39. Rossotti, H'., ''Chemical Applications of Potentionmetry," D.
Van Nastrand Company Inc., Princeton, London.
40. Kolthoff,I.M. and Furman, N.H., "Potentiometric Titrations",
John Wiley & sons, Inc., London.
41. Yatsimirskii, K.B. and Vasil'ev, V.P., "Instability constants
of complex compounds", Pergamon, New York (1960).
42. Pearson, R.G. and Basolo, F., "Mechanism of Inorganic
Reactions- Study of Complexes in solution", J_6, John Wiley,
New York (1958)..
63

43. Mattock, G., ""pH-measurements and Titrations, "Heywood &
Company Ltd., London (1961).
44. Bera, C.R., Chattopadyaya, S. and Sengupta, G.P., J. Ind.
Chem.Soc, 56, 416 (1979).
45. Sengupta, G.P. and Bera, C.R., J. Ind. Chem. Soc, 57, 546
(1980).
46. Jahagirdar, D.V. and Khanolkar,D.D., J. Inorg. Nucl. Chem.,
35.921 (1973).
47. Mohan Das, P. N., Sunar,0. P. and Trivedi,C. P., J. Inorg.
Nucl. C/iem., 35,849(1973).
48. Nayan,R. and Dey, A, K., J. Ind. Chem. Soc, 50, 98 (1973).
49. Kaur, R. and Sekhon, B. S., / Ind. Chem. Soc, 83, 645
(2006).
50. Viswanathan, T.S. and Swift, T.J., Cand, J. Chem., 57, 9,
1050(1979).
51. Viswanathan, T.S. and Swift, T.J., Cand, J. Chem., 58, 10,
1118(1980).
52. Chidambaram, M. V. and Bhattacharya, P. K., Ind. J. Chem.,
9, 1294 (1971).
64

53. Chidambaram, M. V. and Bhattacharya, P. K., J. Inorg. Nucl.
Chem., 32,3271 (1970V
54. Nath, B. B. and Chattopadhyay, J. Ind. Chem. Soc, 55, 122
(1978).
55. Agrawal, Y. K.,Menon, S. K. & Parekh, P. C , Ind. J. Chem.,
40A. 1313(2001).
56. Dixit, K. R. and Munshi, K. N., J .Ind. Chem. Soc, 47, 576
(1980).
57. Sigel, H., ''Metal ions in Biological systems", 1, Marcel
Dekker, Inc., New York (1974).
58. Yang, I., Khomutov, R.M. and Metzler, D.E., Biochem., 13,
19,3877(1974).
6S