study of self assembly systems formed by malic acid … · study of self assembly systems formed by...
TRANSCRIPT
Study of Self Assembly Systems Formed by Malic Acidand Alkyloxy Benzoic Acids
Vellalapalayam Nallagounder Vijayakumar and Mathukumalli Lakshmi Narayana Madhu Mohan
Liquid Crystal Research Laboratory (LCRL), Bannari Amman Institute of Technology,Sathyamangalam 638 401, India
Reprint requests to M. L. N. M. M.; E-mail: [email protected]
Z. Naturforsch. 65a, 1156 – 1164 (2010); received February 4, 2010 / revised April 30, 2010
Self assembly systems formed by malic acid and alkyloxy benzoic acids are characterized. Theferroelectric ingredient malic acid formed double hydrogen bond with p-n-alkyloxy benzoic acids.Various hydrogen bonded complexes have been synthesized with malic acid and pentyl to dodecyloxybenzoic acid, respectively. Fourier transformation infrared (FTIR) studies confirm the hydrogen bondformation. Polarizing optical microscopic (POM) studies revealed the textural information while thetransition and enthalpy values are calculated from differential scanning calorimetry (DSC) studies. Aphase diagram has been constructed from the POM and DSC studies. A new smectic ordering, smecticX*, has been identified which exhibits a finger print type texture. This phase has been characterizedby POM, DSC, helix, and tilt angle studies. The transition from traditional cholesteric to smectic X*phase is observed to be first order. The tilt angle data in this phase has been fitted to a power law andthe temperature variation of the tilt angle follows mean field theory predictions. The results of FTIR,POM, DSC, tilt angle, and helicoidal studies are discussed.
Key words: Malic Acid; p-n-Alkyloxy Benzoic Acid; Smectic X* Ordering.
1. Introduction
Since the discovery of the first ferroelectric liquidcrystal by Meyer et al. [1] interest on these soft mate-rials have grown enormously. In the recent times hy-drogen bonded liquid crystals (HBLC) [2 – 13], aredesigned and synthesized from materials selected onthe basis of their molecular reorganization and selfassembly capability. The applicational aspects [14 –18] and commercial viabilities made many researchgroups to work on these soft materials. Hydrogenbonded liquid crystalline materials are known sinceearly 1960 [3, 4], however, in the recent times muchwork has been done on these complexes [5 – 13, 19 –22]. A hydrogen bond enables various mesogenic andnon-mesogenic compounds to form complexes whichexhibit rich phase polymorphism. HBLC usually arecomposed of a proton donor and acceptor molecules.The reported data [5 – 12, 19 – 22] indicate the fact thatif the HBLC materials are mesogenic, it is enoughif one of the proton donor or an acceptor moleculeexhibits mesogenic property. The chemical molecularstructure [19 – 22] of HBLC is co-related to the physi-cal properties exhibited by it.
The reported literature [2, 7, 10, 13 – 21] suggeststhe formation of HBLC through carboxylic acids as
0932–0784 / 10 / 1200–1156 $ 06.00 c© 2010 Verlag der Zeitschrift fur Naturforschung, Tubingen · http://znaturforsch.com
well as from mixtures of unlike molecules capableof interacting through H-bonding. Usually in all theseHBLC the rigid core is made up of covalent and non-covalent hydrogen bonding. The discovery of hydro-gen bonded liquid crystals by Kato and Frechet [14]opened a new chapter in synthesis, design, and char-acterization of these mesogens which facilitated manyresearch groups to work in this field [23 – 32].
With our previous experience [23 – 26, 33 – 46] indesigning and synthesizing liquid crystals, and in con-tinuation of our efforts to understand hydrogen bondedmesogens in the present work a successful attempthas been made to design and isolate a homologousseries of hydrogen bonded ferroelectric liquid crys-tals (HBFLC). The mesogenic p-n-alkyloxy benzoicacids (where n represents the alkyloxy carbon num-ber from 5 to 12) formed a hydrogen bond ferroelec-tric liquid crystal with malic acid, respectively. Phasediagrams, mesogenic phase, and thermal range are dis-cussed.
2. Experimental
Optical textural observations were made with aNikon polarizing microscope equipped with a Nikondigital CCD camera system with 5 mega pixels and

V. N. Vijayakumar and M. L. N. Madhu Mohan · Self Assembly Systems of Malic Acid and Alkyloxy Benzoic Acids 1157
Table 1. Transition temperatures obtained by different techniques. Enthalpy values (J/g) given in parenthesis.Carbon Phase variance Technique Crystal to Melt Ch X* C* F* G* Crystal
5 F* DSC (h) 124.3 (57.68) 141.5 (13.43)DSC (c) 136.8 (9.68) 112.7 (66.59)POM (C) 137.5 113.2
6 F* DSC (h) 69.6 (47.0) 80.6 (50.61)DSC (c) 94.1 Merged 81.5 (64.43)
with crystalPOM (C) 94.6 81.9
7 Ch F* DSC (h) 92.6 (72.6) # Mergedwith melt
DSC (c) 130.3 (3.63) 84.5 (28.49) 71.3 (34.54)POM (C) 130.9 84.9 71.8
8 Ch X* C* F* DSC (h) 76.9 (62.64) 146.7 (2.32) # # #DSC (c) 140.9 (2.02) 137.3 (3.53) 99.6 (3.94) 91.7 (38.43) 52.2 (46.99)POM (C) 141.3 137.7 100.0 92.1 52.5
9 Ch X* C* F* DSC (h) 94.3 (71.71) # 127.3 (0.91) 113.8 (2.84) #DSC (c) 134.5 (4.36) 124.5 (9.40) 110.1 (1.35) 87.7 (21.88) 66.3 (46.52)POM (C) 134.9 124.9 110.6 91.1 66.6
10 Ch X* C* F* DSC (h) 86.23 (29.08) # 132.2 (0.65) # 95.5 (14.90)DSC (c) 134.5 (0.77) 131.7 (0.26) 118.6 (1.74) 89.2 (10.37) 69.4 (15.34)POM (C) 134.9 132.1 119.0 89.6 69.7
11 Ch X* C* F* G* DSC (h) 100.0 (94.63) # 131.8 (1.50) 123.8 (0.15) # #DSC (c) 133.1 (2.28) 130.6 (0.48) 121.1 (3.8) 81.3 (25.03) 69.5 (17.99) 53.6 (40.2)POM (C) 133.5 130.9 121.5 81.6 69.8 53.9
12 Ch X* C* F* G* DSC (h) 96.1 (101.29) 136.9 (1.59) 131.6 (0.33) # # #DSC (c) 131.0 (2.93) 126.1 Merged 125.0 (1.13) 83.0 (19.72) 66.9 (9.46) 47.1 (24.07)
with C*POM (C) 131.4 126.5 125.3 83. 3 67.3 47.4
# Monotropic transition; (h) Heating run; (c) Cooling run.
Fig. 1. Molecular struc-ture of malic acid andalkyloxy benzoic acidhydrogen bonded com-plex.
2560 × 1920 pixel resolution. The liquid crystallinetextures were processed, analyzed, and stored with theaid of an ACT-2U imaging software system. The tem-perature control of the liquid crystal cell was equippedby Instec HCS402-STC 200 temperature controller(Instec, USA) to a temperature resolution of ±0.1 ◦C.This unit is interfaced to the computer by IEEE–STC 200 to control and monitor the temperature. Theliquid crystal sample is filled by capillary action in itsisotropic state into a commercially available (Instec,USA) polyamide buffed cell with 4 micron spacer. Anoptical extinction technique was used for the determi-nation of the tilt angle. The transition temperatures andcorresponding enthalpy values were obtained by DSC(Shimadzu DSC-60). FTIR spectra was recorded (ABBFTIR MB3000) and analyzed with the MB3000 soft-ware. The p-n-alkyloxybenzoic acids (nBA) and malic
acid were supplied by Sigma Aldrich, Germany, andall the solvents used were E. Merck grade.
2.1. Synthesis of HBFLC
Intermolecular hydrogen bonded ferroelectric meso-gens are synthesized by the addition of two moles of p-n-alkyloxybenzoic acids (nBA) with one mole of malicacid in N,N-Dimethyl formamide (DMF), respectively.Further, they are subject to constant stirring for 12 hat ambient temperature of 30 ◦C till a white precip-itate in a dense solution is formed. The white crys-talline crude complexes so obtained by removing ex-cess DMF are then recrystallized with dimethyl sulfox-ide (DMSO) and the yield varied from 85 % to 95 %.Yield of higher homologues complexes are observedto be more compared to its lower counterparts. The

1158 V. N. Vijayakumar and M. L. N. Madhu Mohan · Self Assembly Systems of Malic Acid and Alkyloxy Benzoic Acids
Fig. 2. FTIR spectraof MA+9BA com-plex.
molecular structure of the present homologous seriesof p-n-alkyloxybenzoic acids with malic acid is de-picted in Figure 1, where n represents the alkyloxy car-bon number. From this figure, the alternate hydrogenbonded sites along with a chiral carbon can be identi-fied.
3. Results and Discussion
All the mesogens isolated under the present in-vestigation are white crystalline solids and are sta-ble at room temperature. They are insoluble in wa-ter and sparingly soluble in common organic sol-vents such as methanol, ethanol, benzene, and dichloromethane. However, they show a high degree of sol-ubility in coordinating solvents like dimethyl sulfox-ide (DMSO), dimethyl formamide (DMF), and pyri-dine. All these mesogens melt at specific tempera-tures below 150 ◦C (Table 1). They show high ther-mal and chemical stability when subjected to re-peated thermal scans performed during POM and DSCstudies.
3.1. Phase Identification
The observed phase variants, transition tempera-tures, and corresponding enthalpy values obtained byDSC in cooling and heating cycles for the MA+nBAcomplexes are presented in Table 1.
3.2. MA+nBA Homologous Series
The mesogens of the malic acid and alkyloxy ben-zoic acid ferroelectric homologous series are found toexhibit characteristic textures [47], viz., Cholesteric(threaded texture), smectic X* (fingerprint texture),smectic C* (schlieren texture), smectic F* (chequeredboard texture), and smectic G* (multi colored mosaictexture), respectively. The general phase sequence ofthe malic acid and alkyloxy benzoic acids in the cool-ing run can be shown as:
Isotropic → SmF∗ →Crystal
(MA+ 5BA),(MA+ 6BA),
Isotropic →CH → SmF∗ →Crystal
(MA+ 7BA),
Isotropic →CH → SmX∗ → SmC∗ → SmF∗
→Crystal
(MA+ 8BA),(MA+ 9BA),(MA+ 10BA),
Isotropic →CH → SmX∗ → SmC∗ → SmF∗
→ SmG∗ →Crystal
(MA+ 11BA),(MA+ 12BA).
3.3. Infrared Spectroscopy (FTIR)
IR spectra of free p-n-alkyloxybenzoic acid, malicacid, and their intermolecular H-bonded ferroelectric
V. N. Vijayakumar and M. L. N. Madhu Mohan · Self Assembly Systems of Malic Acid and Alkyloxy Benzoic Acids 1159
Table 2. Peak assignments of the FTIR data of alkoxy ben-zoic acid and hydrogen bonded complex.p-n-alkyloxybenzoic acid Hydrogen bonded complexPeak Assignment Peak Assignment
1685 and1695 cm−1
ν(C=O)Conforms thedimericnature
1690 cm−1
and absenceof 1685 and1695 cm−1
Conforms themonomeric nature
Absence of2935 cm−1
Absence ofν(O-H) mode 2935 cm−1
ν(O-H) mode ofthe the carboxylicacid group
complexes are recorded in the solid state (KBr) atroom temperature. Figure 2 illustrates the FTIR spec-tra of the hydrogen bonded complex of MA+9BA inthe solid state at room temperature as a representativecase. Respective peaks and their assignments are listedin Table 2. Data in this table and the related litera-ture [20, 22, 48] strongly conform the formation of hy-drogen bond and its existence in the monomeric formupon complexation.
3.4. DSC Studies
DSC thermograms are obtained in heating and cool-ing cycle. The sample is heated with a scan rateof 10 ◦C/min and hold at its isotropic temperature fortwo minutes so as to attain thermal stability. The cool-ing run is performed with a scan rate of 10 ◦C/min.The respective equilibrium transition temperatures andcorresponding enthalpy values of the mesogens of thehomologous series are listed separately in Table 1. Po-larizing optical microscopic studies also confirm theseDSC transition temperatures.
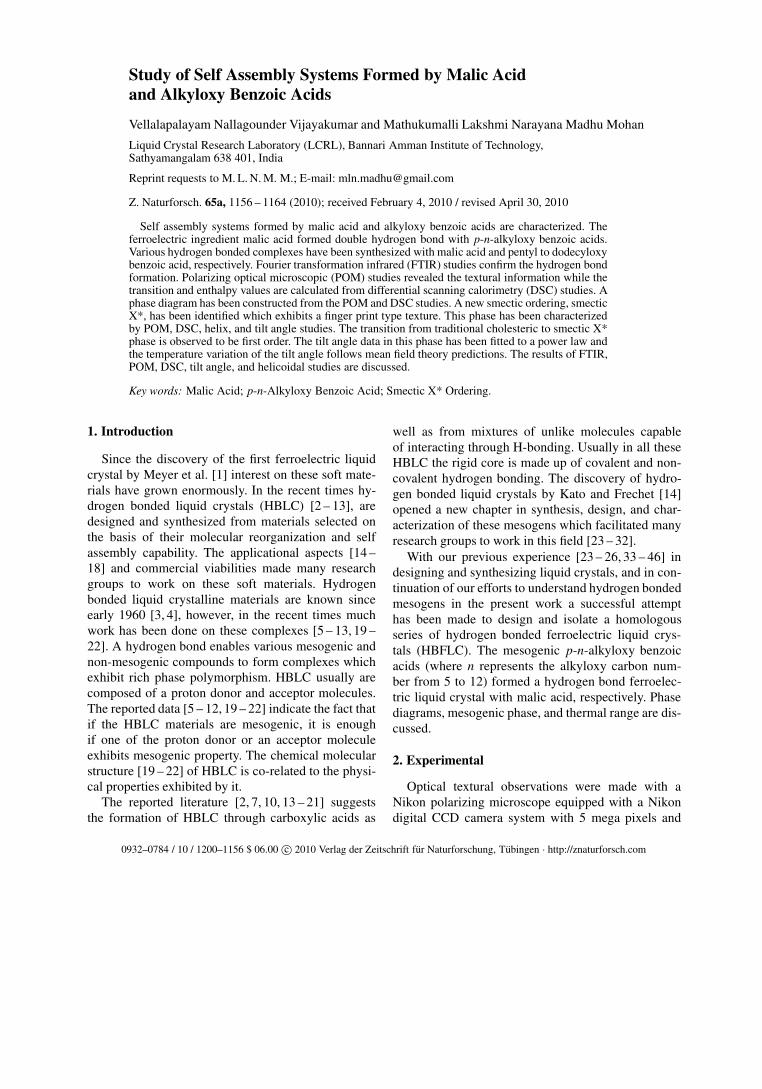
3.4.1. DSC Studies of MA+5BA
The phase transition temperatures and enthalpy val-ues of pentyloxy benzoic acid and malic acid meso-gen (MA+5BA) are discussed. The DSC thermogramof MA+5BA is illustrated in Figure 3. From this figureand Table 1 it can be inferred that in the DSC heatingrun of the MA+5BA complex, two exothermic peaksare observed at 124.3 ◦C and 141.5 ◦C with enthalpyvalues of 57.68 J/g and 13.43 J/g, respectively. Thesetwo peaks corresponds to the crystal to melt and melt tosmectic F* transitions. In the cooling run of this sampletwo peaks are observed at 136.8 ◦C and 112.7 ◦C withenthalpy values of 9.68 J/g and 66.59 J/g, respectively.These endothermic peaks corresponds to isotropic tosmectic F* and smectic F* to crystal transitions, re-spectively.
Fig. 3. DSC thermogram of MA+5BA complex.
3.5. Phase Diagram of Pure p-n-AlkyloxybenzoicAcids
The phase diagrams of pure p-n-alkyloxybenzoicacids are reported [23] while the LTA+nBA homol-ogous series are constructed through optical polar-izing microscopic studies and by the phase transi-tion temperatures observed in the cooling run of theDSC thermogram. The phase diagram of pure p-n-alkyloxybenzoic acid is reported [20, 23] to be com-posed of two phases namely, nematic and smectic C.
3.5.1. Phase Diagram of MA+nBA
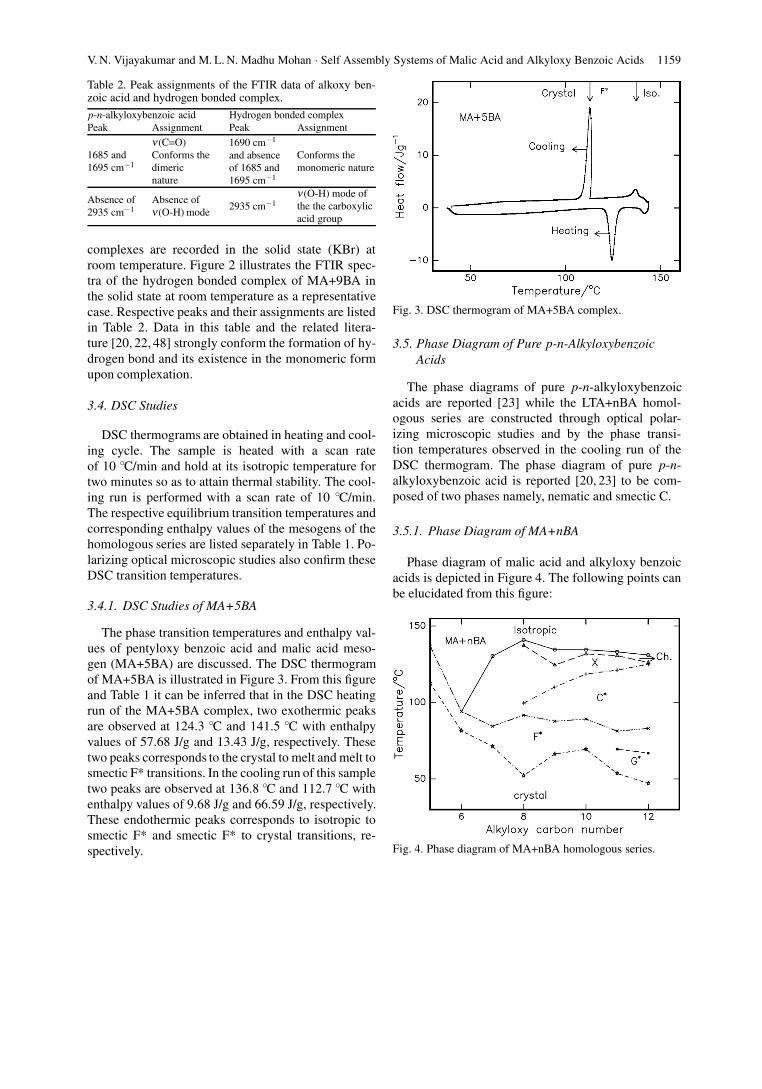
Phase diagram of malic acid and alkyloxy benzoicacids is depicted in Figure 4. The following points canbe elucidated from this figure:
Fig. 4. Phase diagram of MA+nBA homologous series.
1160 V. N. Vijayakumar and M. L. N. Madhu Mohan · Self Assembly Systems of Malic Acid and Alkyloxy Benzoic Acids
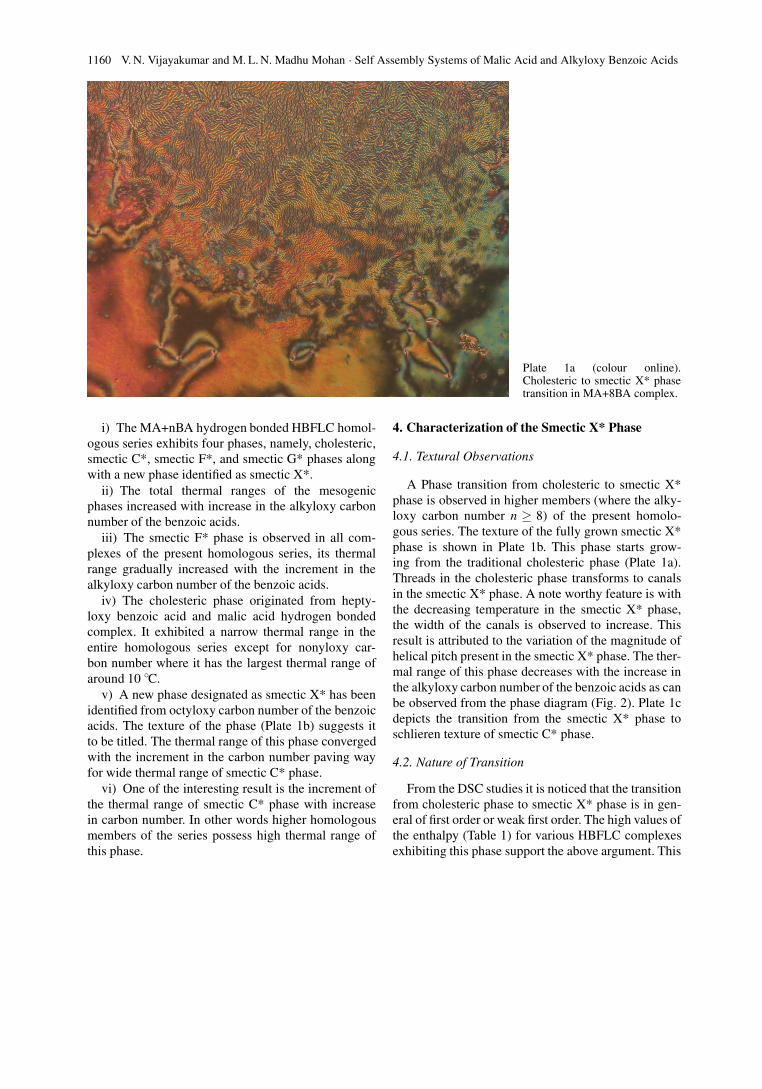
Plate 1a (colour online).Cholesteric to smectic X* phasetransition in MA+8BA complex.
i) The MA+nBA hydrogen bonded HBFLC homol-ogous series exhibits four phases, namely, cholesteric,smectic C*, smectic F*, and smectic G* phases alongwith a new phase identified as smectic X*.
ii) The total thermal ranges of the mesogenicphases increased with increase in the alkyloxy carbonnumber of the benzoic acids.
iii) The smectic F* phase is observed in all com-plexes of the present homologous series, its thermalrange gradually increased with the increment in thealkyloxy carbon number of the benzoic acids.
iv) The cholesteric phase originated from hepty-loxy benzoic acid and malic acid hydrogen bondedcomplex. It exhibited a narrow thermal range in theentire homologous series except for nonyloxy car-bon number where it has the largest thermal range ofaround 10 ◦C.
v) A new phase designated as smectic X* has beenidentified from octyloxy carbon number of the benzoicacids. The texture of the phase (Plate 1b) suggests itto be titled. The thermal range of this phase convergedwith the increment in the carbon number paving wayfor wide thermal range of smectic C* phase.
vi) One of the interesting result is the increment ofthe thermal range of smectic C* phase with increasein carbon number. In other words higher homologousmembers of the series possess high thermal range ofthis phase.
4. Characterization of the Smectic X* Phase
4.1. Textural Observations
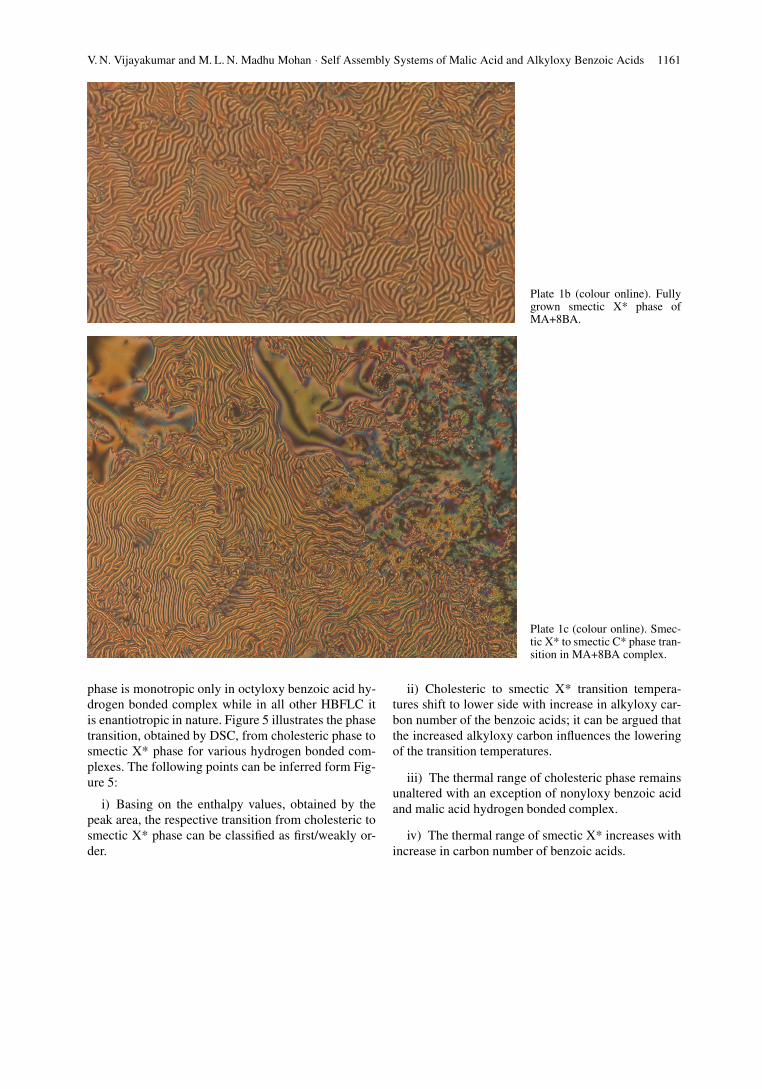
A Phase transition from cholesteric to smectic X*phase is observed in higher members (where the alky-loxy carbon number n ≥ 8) of the present homolo-gous series. The texture of the fully grown smectic X*phase is shown in Plate 1b. This phase starts grow-ing from the traditional cholesteric phase (Plate 1a).Threads in the cholesteric phase transforms to canalsin the smectic X* phase. A note worthy feature is withthe decreasing temperature in the smectic X* phase,the width of the canals is observed to increase. Thisresult is attributed to the variation of the magnitude ofhelical pitch present in the smectic X* phase. The ther-mal range of this phase decreases with the increase inthe alkyloxy carbon number of the benzoic acids as canbe observed from the phase diagram (Fig. 2). Plate 1cdepicts the transition from the smectic X* phase toschlieren texture of smectic C* phase.
4.2. Nature of Transition
From the DSC studies it is noticed that the transitionfrom cholesteric phase to smectic X* phase is in gen-eral of first order or weak first order. The high values ofthe enthalpy (Table 1) for various HBFLC complexesexhibiting this phase support the above argument. This
V. N. Vijayakumar and M. L. N. Madhu Mohan · Self Assembly Systems of Malic Acid and Alkyloxy Benzoic Acids 1161
Plate 1b (colour online). Fullygrown smectic X* phase ofMA+8BA.
Plate 1c (colour online). Smec-tic X* to smectic C* phase tran-sition in MA+8BA complex.
phase is monotropic only in octyloxy benzoic acid hy-drogen bonded complex while in all other HBFLC itis enantiotropic in nature. Figure 5 illustrates the phasetransition, obtained by DSC, from cholesteric phase tosmectic X* phase for various hydrogen bonded com-plexes. The following points can be inferred form Fig-ure 5:
i) Basing on the enthalpy values, obtained by thepeak area, the respective transition from cholesteric tosmectic X* phase can be classified as first/weakly or-der.
ii) Cholesteric to smectic X* transition tempera-tures shift to lower side with increase in alkyloxy car-bon number of the benzoic acids; it can be argued thatthe increased alkyloxy carbon influences the loweringof the transition temperatures.
iii) The thermal range of cholesteric phase remainsunaltered with an exception of nonyloxy benzoic acidand malic acid hydrogen bonded complex.
iv) The thermal range of smectic X* increases withincrease in carbon number of benzoic acids.

1162 V. N. Vijayakumar and M. L. N. Madhu Mohan · Self Assembly Systems of Malic Acid and Alkyloxy Benzoic Acids
Fig. 5. DSC peaks corresponding to isotropic to cholestericand cholesteric to smectic X* phase transition of variousmembers of the MA+nBA homologous series.
Fig. 6. Temperature variation of tilt angle in smectic X*phase of MA+8BA complex. Solid line denotes the powerlaw fit.
5. Optical Tilt Angle Measurements
The optical tilt angle has been experimentally mea-sured by an optical extinction method [49] in the smec-tic X* phase on all the members of the present HBFLChomologous series. Figures 6 and 7 depict the vari-ation of the optical tilt angle with the temperaturefor MA+8BA, MA+9BA, MA+10BA, MA+11BA, andMA+12BA, respectively. In the above figures the the-oretical fit obtained from the mean field theory is de-noted by a solid line. From the Figures 6 and 7 it isobserved that the tilt angle increases with decreasingtemperature and attains a saturation value. These large
Fig. 7. Temperature variation of tilt angle in smectic X*phase of various homologous members of the series. Solidline denotes the power law fit.
Fig. 8. Temperature variation of helix in smectic X* phase ofMA+12BA complex.
magnitudes of the tilt angles are attributed to the di-rection of the soft covalent hydrogen bond interactionwhich spreads along molecular long axis with finite in-clination [31].
The tilt angle is a primary order parameter [18] andthe temperature variation is estimated by fitting the ob-served data of θ (T ) to the relation
θ (T ) ∝ (TCh X∗ −TX∗)β . (1)
The value of the critical exponent β estimated by fit-ting the data of θ (T ) to the above equation (1) is foundto be 0.50 to agree with the mean field prediction [50].

V. N. Vijayakumar and M. L. N. Madhu Mohan · Self Assembly Systems of Malic Acid and Alkyloxy Benzoic Acids 1163
The solid line in Figures 6 and 7 depicts the fitteddata. Further, the agreement of β with the mean fieldvalue infers the long-range interaction of the transversedipole moment for the stabilization of tilted smectic X*phase.
It is noteworthy to point out that from Figures 6and 7 it can be observed that the variation of the tiltin MA+8BA, MA+9BA, and MA+12BA follows onepattern while compounds MA+11BA and MA+12 BAshow a different pattern of results. In the former casethe thermal range of the smectic X* phase is wide and,hence, there is a gradual increment of the tilt anglewhile in the latter case the narrow thermal rage of thesmectic X* phase forces the steep increment of the tiltangle with temperature.
6. Helical Pitch Studies
The pitch of FLC materials is typically in the orderof 1 – 100 µm [51], whereas the thickness of one layeris of the order of 20 – 30 A. In order to have bistableswitching, the helicoidal structure has to be unwound.The most common way of doing this is to sandwichthe FLC material between two conducting glass plates
in such a way that the layers are perpendicular to thesestructures. The helical pitch is measured by the diffrac-tion of He-Ne red laser light on the sample, filled in acommercial cell. This method can be used for measure-ment of the helical pitch of limited length. For a pitchshorter than 0.8 µm the diffraction ring is diffused orcompletely disappears.
Figure 8 illustrates the variation of the helical pitchcorresponding to the smectic X* phase of MA+12BAcomplex. The magnitude of the helical pitch in thesmectic X* phase is found to increase with decreasingtemperature and attain a maximum value of 80 µm.Thus from these studies it can be concluded that thesmectic X* phase in the MA+12BA complex is smec-tic ordering.
Acknowledgements
One of the authors (M.L.N.M. M.) acknowledgesthe financial support rendered by All India Council forTechnical Education, Department of Science and Tech-nology, and Defence Research Development Organi-zation, New Delhi. Infrastructural support provided byBannari Amman Institute of Technology is gratefullyacknowledged.
[1] R. B. Meyer, L. Liebert, L. Strezelecki, and P. Keller, J.Phys. Lett. 36, 69 (1975).
[2] N. A. Clark and S. T. Lagerwall, Appl. Phys. Lett. 36,899 (1980).
[3] G. Andersson, I. Dhal, P. Kellr, W. Kuczynski, S. T.Lagerwall, K. Skarp, and B. Stebler, Appl. Phys. Lett.51, 640 (1987).
[4] F. Gouda, K. Skarp, and S. T. Lagerwall, Ferroelectrics113, 165 (1991).
[5] G. Andersson, I. Dhal, W. Kuczynski, S. T. Lagerwall,K. Skarp, and B. Stebler, Ferroelectrics 84, 285 (1988).
[6] J. M. Wang, Y. J. Kim, C. J. Kim, and K. S. Kim, Ferro-electrics 277, 185 (2002).
[7] H. Aira, H. Ray, and T. Kohki, Jpn. J. Appl. Phys. 43,6243 (2004).
[8] S. L. Wu, and C. Y. Lin, Liq Cryst. 30, 205 (2003).[9] P. A. Kumar and V. G. K. M. Pisipati, Advc. Mater. 2,
1617 (2000).[10] C. Kittle, Introduction to Solid State Physics, Wiley
Eastern Private Limited, New Delhi 1974.[11] G. R. Luckhurst and G. W. Gray, The Molecular
Physics of Liquid Crystal, Academic Press, New York1979.
[12] T. Niori, T. Sekine, J. Watanabe, J. Furukawa, S. W.Choi, and H. Takezoe, J. Matter. Chem. 6, 1231 (1996);ibid. 7, 1307 (1997)
[13] H. Adams, N. Braily, D. W. Bruce, R. Dhillon,
D. A. Dunmur, S. E. Hunt, E. Lalinde, A. A. Maggs,R. Orr, P. Styring, M. S. Wragg, and P. M. Maitlies,Polyhedron 7, 1861 (1988); M. A. Mikhaleva, G. A.Kolesnichenko, K. I. Rubina, Yu. Sh. Goldberg, V. A.Savelev, L. Ya. Leitis, M. V. Shimanskaya, and V. P.Mamaev, Chem. Hetro. Compound 22, 310 (1986).
[14] T. Kato and J. M. J. Frechet, J. Am. Chem. Soc. 111,8533 (1989); T. Kato, Hydrogen Bonded Liquid Crys-tals: Moleculare Self-Assembly for Dynamically Func-tional Materials, Springer, Heidelberg 2000.
[15] H. Kihara, T. Kato, T. Uryu, S. Ujiie, U. Kumar, J. M. J.Frechet, D. W. Bruce, and J. D. Price, Liq. Cryst. 21,25 (1996); M. Parra, P. Hidalgo, and J. Alderete, Liq.Cryst. 32, 449 (2005).
[16] H. R. Brand, P. E. Cladis, and H. Pleiner, Macro. Mol.25, 7223 (1992); A. G. Cook, U. Baumeister, andC. Tschierske, J. Mater. Chem. 15, 1708 (2005).
[17] J. W. Goodby, R. Blinc, N. A. Clark, S. T. Lagerwall,S. A. Osipov, S. A. Pikin, T. Sakurai, Y. Yoshino,and B. Zecks, Ferro Electric Liquid Crystal, Princi-ples, Properties, and Applications, Gorden and BreechPress, Philadalphia 1991.
[18] P. G. de Gennes, The Physics of Liquid Crystals, Ox-ford Press, London 1974.
[19] B. Sreedevi, P. V. Chalapathi, M. Srinivasulu,V. G. K. M. Pisipati, and D. M. Potukuchi, Liq. Cryst.31, 303 (2004).

1164 V. N. Vijayakumar and M. L. N. Madhu Mohan · Self Assembly Systems of Malic Acid and Alkyloxy Benzoic Acids
[20] P. Swathi, P. A. Kumar, V. G. K. M.Pisipati, A. V. Ra-jeswari, S. Sreehari Sastry, and P. Narayana Murty, Z.Naturforsch. 57a, 797 (2002).
[21] C. Noot, S. P. Perkins, and H. J. Coles, Ferroelectrics244, 331 (2000).
[22] P. Swathi, P. A. Kumar, and V. G. K. M. Pisipati, Z.Naturforsch. 56a, 691 (2001).
[23] P. A. Kumar, V. G. K. M.Pisipati, A. V. Rajeswari, andS. Sreehari Sastry, Z. Naturforsch. 57a, 184 (2002).
[24] M. L. N. Madhu Mohan, B. Arunachalam, and C. Ar-ravindh Sankar, Metal Mater. Trans. A 39, 1192(2008).
[25] M. L. N. Madhu Mohan and B. Arunachalam, Z. Natur-forsch. 63a, 435 (2008).
[26] M. L. N. Madhu Mohan and V. G. K. M. Pisipati, Liq.Cryst. 26, 1609 (2000).
[27] P. Letellier, D. E. Ewing, J. W. Goodby, J. Haley, S. M.Kelly, and G. Mackenzie, Liq. Cryst. 22, 609 (1997).
[28] P. A. Kumar, M. Srinivasulu, and V. G. K. M. Pisipati,Liq. Cryst. 26, 1339 (1999).
[29] P. Rudquist, E. Korblova, D. M. Walba, R. Shao,N. A. Clark, and J. E. Maclennan, Liq. Cryst. 26, 1555(1999).
[30] M. Srinivasulu, P. V. V. Satyanarayana, P. A. Ku-marand, and V. G. K. M. Pisipati, Liq. Cryst. 28, 132(2001).
[31] E. B. Barmatov, A. Bobrovsky, M. V. Barmatova, andV. P. Shibaev, Liq. Cryst. 26, 581 (1999).
[32] Z. Sideratou, D. Tsiourvas, C. M. Paleos, andA. Skoulios, Liq. Cryst. 22, 51 (1997).
[33] T. Chitravel, M. L. N. Madhu Mohan, V. Krishnaku-mar, Mol. Cryst. Liq. Cryst. 493, 17 (2008).
[34] V. N. Vijayakumar and M. L. N. Madhu Mohan, Braz.J. Phys. 39, 677 (2009).
[35] V. N. Vijayakumar and M. L. N. Madhu Mohan, SolidState Commun. 149, 2090 (2009).
[36] V. N. Vijayakumar, K. Murugadass, and M. L. N.Madhu Mohan, Mol. Cryst. Liq. Cryst. 515, 37 (2009).
[37] V. N. Vijayakumar and M. L. N. Madhu Mohan, Braz.J. Phys. 39, 601 (2009).
[38] V. N. Vijayakumar and M. L. N. Madhu Mohan, Ferro-electrics 392, 81 (2009).
[39] P. A. Kumar, M. L. N. Madhu Mohan, and V. G. K. M.Pisipati, Liq. Cryst. 27, 1533 (2000).
[40] V. N. Vijayakumar and M. L. N. Madhu Mohan, Ferro-electrics (in press).
[41] M. L. N. Madhu Mohan, P. A. Kumar, B. V. S. Goud,and V. G. K. M. Pisipati, Mater. Res. Bull. 34, 2167(1999).
[42] M. L. N. Madhu Mohan, P. A. Kumar, and V. G. K. M.Pisipati, Ferroelectrics, 227, 105 (1999).
[43] M. L. N. Madhu Mohan, D. M. Potukuchi, andV. G. K. M. Pisipati, Mol. Cryst. Liq. Cryst. 325, 127(1998).
[44] V. N. Vijayakumar and M. L. N. Madhu Mohan,Solid State Sci. (in press), DOI: 10.1016/j.solidstate-sciences.2009.12.012.
[45] V. N. Vijayakumar and M. L. N. Madhu Mohan, J.Opto. Adv. Matter. 11, 1139 (2009).
[46] M. L. N. Madhu Mohan, P. A. Kumar, and V. G. K. M.Pisipati, Mol. Crys. Liq. Cryst. 366, 431 (2001).
[47] G. W. Gray and J. W. G. Goodby, Smectic Liquid Crys-tals: Textures and Structures, Leonard Hill, London1984.
[48] K. Nakamoto, Infrared and Raman Spectra of In-organic and Co-ordination Compounds, Interscience,New York 1978.
[49] J. S. Patel and J. W. Goodby, Mol. Crys. Liq. Cryst.144, 117, (1987).
[50] H. E. Stanley, Introduction to phase transition and crit-ical phenomena, Clarendon Press, New York 1971.
[51] R. Karapinar, Turk. J. Phys. 24, 115 (2000).