study of seepage losses from irrigation canals …
TRANSCRIPT

PINSTECH-170 Revision 1 June 2004
STUDY OF SEEPAGE LOSSES FROM IRRIGATION CANALS USING RADIOACTIVE TRACER TECHNIQUE
Manzoor Ahmad
Jamil Ahmad Tariq
Abid Rashid*
Muhammad Rafiq
Naveed Iqbal
Radiation and Isotope Application Division Pakistan Institute of Nuclear Science and Technology
P.O. Nilore, Islamabad, Pakistan Phone No. 92 51 9290261
Fax No. 92 51 9290275 E-mail: [email protected]
* Pakistan Council of Research in Water Resources House No. 3 Street 17, F-6/2, Islamabad, Pakistan

ABSTRACT
Pakistan has an intricate irrigation system comprising a huge network of canals. A significant fraction of water in irrigation canals is lost through seepage, which is further responsible for water logging and salinity in some areas. Government is considering lining of irrigation canals to overcome this twin menace. Due to involvement of huge costs, highly pervious sections where the seepage rate is appreciably high, are needed to be identified for planning and execution of remedial actions to eliminate or minimize seepage losses. The conventional methods of measuring seepage rate from canals are limited to 'ponding' and 'inflow-outflow' methods. The ponding method is usually restricted to small canals because of the costly bulkheads and water requirement, unaffordable closure of canal, non-representation of the line source and variation in the rate of seepage loss with time due to the sealing effects of fine sediments settling out. Inaccurate measurement of discharge under field conditions and complication due to diversions do not favour the inflow-outflow method. It is believed that the analytical methods represent the most accurate and convenient means of determining seepage values using accurate insitu hydraulic conductivity of the subsoil determined by radiotracer, geometry of the canal and position of the groundwater.
As a practical application, radiotracer experiments were carried out at Rakh branch canal near Sukhiki, District Hafizabad (Punjab) to determine groundwater filtration velocity by single well point dilution technique using Technetium-99m (99mTc) radioactive tracer. Hydraulic conductivity (determined from filtration velocity and hydraulic gradient) and canal parameters were used in the parametric equation of phreatic curve to estimate the seepage rate. The average seepage rate was 4.05 cubic meter per day per meter length of the canal (equivalent to 3.795 cusec per million square feet or 1.157 cumec per second per million square meter of wetted area of the canal.
The radiotracer ( mTc) having very short half-life (6 hrs) poses no health hazards as it decays in one day after traveling a very short distance, at the most a few meters. A very small quantity of the tracer required for a test can be met from the leftover activity of mTc imported for medical centers. However ECNEC has approved a project to produce mTc locally at PINSTECH which will ensure its availability at competitive cost.
In this study it has been proven that radioactive tracer technique can be used to determine seepage losses from distributaries to biggest canal either unlined or lined in running condition without its closure or disturbing flow. Cost per test based on few tests is about Rs 100,000/- which could be reduced to Rs. 60,000/- per test for the large scale investigations by creating facilities for drilling and fabrication off Iters. The seepage tests can be repeated at the same locations using the existing wells at a cost of Rs. 15000/-. Therefore, this technique is also useful to evaluate the effectiveness of the lining or any other remedial measure.
Considering the accuracy of the radiotracer technique and availability of facilities at reasonable cost, this novel technique may be applied at national level.
Key words: canals, seepage losses, radioactive tracer, lining

CONTENTS
1. INTRODUCTION 1
2. METHODS FOR MEASUREMENT OF SEEPAGE LOSSES 2
2.1 Ponding Method 3
2.2 Inflow-Outflow Method r 4
2.3 Seepage-meter Method 4
2.4 Radioactive Tracer Method 5
3. EXPERIMENTAL APPLICATION 6
3.1 Selection of Sites 6
3.2 Drilling of Test Holes 7
3.3 Design and Construction of Experiment Wells 8
3.4 Measurement of Groundwater Filtration Velocity 10
3.5 Calculation of Seepage Losses 11
4. RESULTS AND DISCUSSION 12
4.1 Environmental Isotopes 14
5. RADIATION HAZARD 15
6. COST 16
7. RECOMMENDATIONS 17
ACKNOWLEDGEMENTS 17
REFERENCES 18
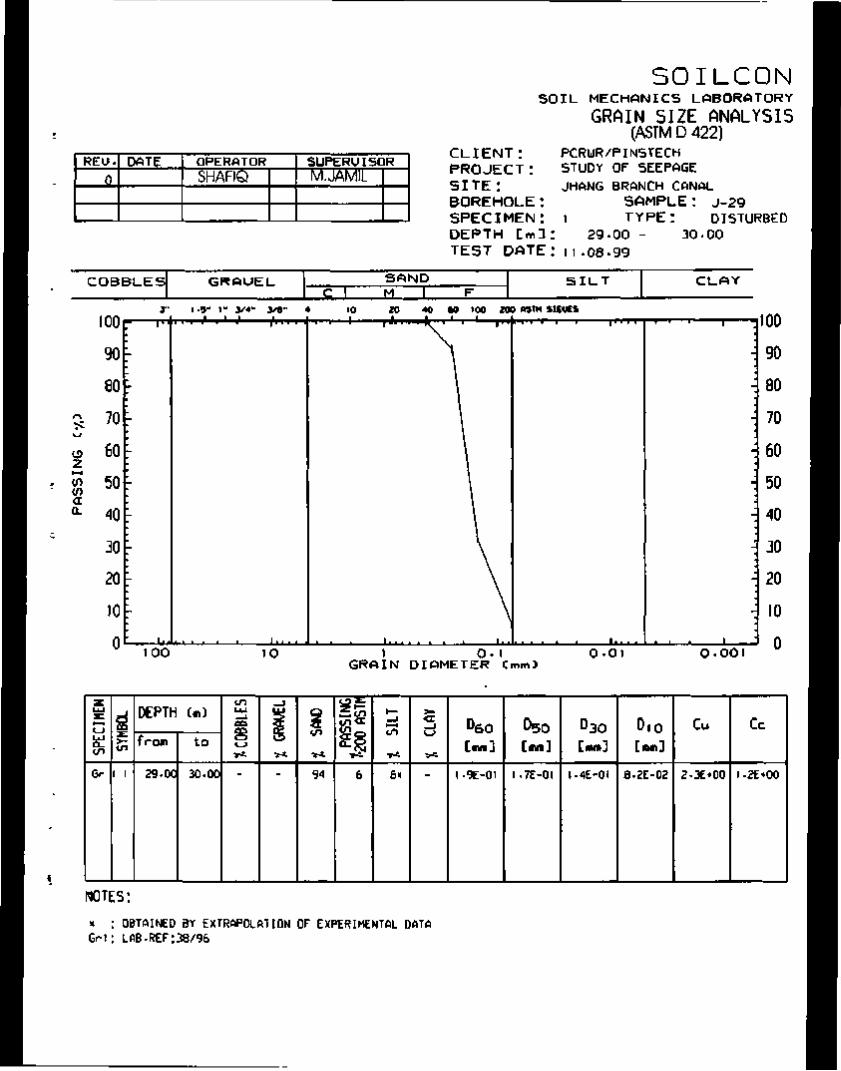
APPENDIX-1: Results of soil texture at Jhang Branch Canal
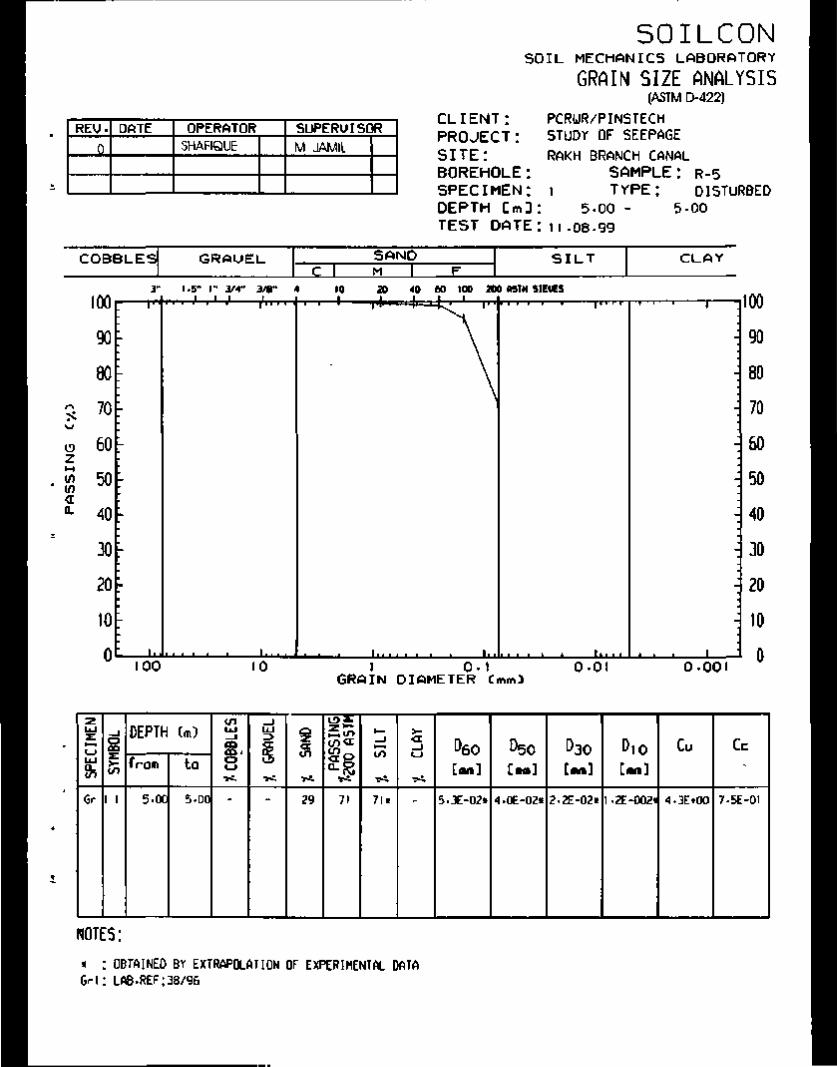
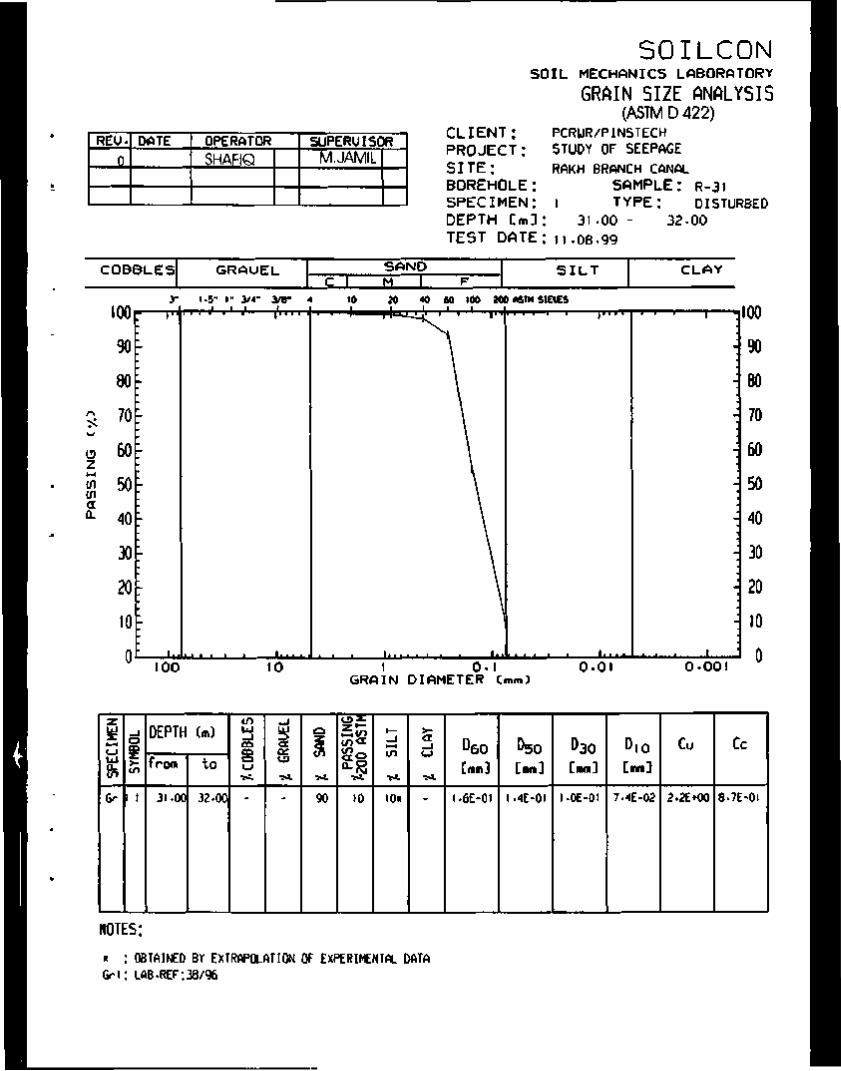
APPENDIX-2: Results of soil texture at Rakh Branch Canal
APPENDIX-3: Photographs of various activities
STUDY OF SEEPAGE LOSSES FROM RAKH BRANCH CANAL USING RADIOACTIVE TRACER TECHNIQUE
1. INTRODUCTION
Pakistan is an agricultural country and lies in the arid and semi-arid
region. In order to sustain agriculture, an intricate irrigation system comprising a
huge network of canals has been in operation for more than one hundred years.
Though the country needs every drop of water to be effectively used but a
significant fraction of water is being lost from the system through seepage, which
is further responsible for water logging and salinity. Seepage rates of different
canals of Punjab range from 2.24 cfs/msf (cubic feet per second per million
square feet of wetted area) to 48.92 cfs/msf [1]. One way to stop the seepage is
total lining of the canals, which is not economically feasible. At highly pervious
sections where the seepage rate is appreciably large, such measures can be
taken to stop this loss at reasonable cost. Hence the study of seepage from
various canals would be pre-requisite for planning and execution of remedial
measures to eliminate or minimize seepage losses. Normally, the objectives of
seepage measurements are [2]:
• to determine seepage losses from unlined canals and to locate
reaches with excess seepage as a basis for lining considerations;
• to check seepage losses through different designs of completed
reaches of a canal system with the aim of predicting seepage rates in
the planned system and adapting the design according to the findings.
This may involve lining, where this had not been foreseen, and vice-
versa, changing the type of lining or changing the size of canal cross-
section and structures according to actual flow rates;
l

• to record seepage rates on lined or unlined canals as comparative data
for the planning and design of other irrigation projects;
• to determine the exact amount of water conveyed in the canal system
in order to operate the system properly.
2. METHODS FOR MEASUREMENT OF SEEPAGE LOSSES
A variety of methods have been developed for the calculation of seepage
from irrigation canals. Those most useful may be grouped into:
• empirically developed formulae;
• solutions arrived at by analytical approaches;
• solutions derived from electrical analogy.
The use of empirical formulae can only produce rough estimates, whereas
analytical methods have given highly accurate results when applied to conditions
for which they are developed. It is believed that these solutions today represent
the most accurate and convenient means of determining seepage values from
known hydraulic conductivity of the subsoil, geometry of the canal and position of
the groundwater table.
Currently accepted methods of measuring the quantity of water lost by
seepage from existing canals are limited to ponding, inflow-outflow and
seepagemeter determinations [2,3]. Special methods are: the use of tracers,
electrical logging or resistivity measurement, piezometric surveys and remote
sensing. These special methods are essentially limited to qualitative indication of
seepage, that is, its distribution along the canal. Each method has advantages
and limitations. No single method is adaptable to all conditions encountered in
the field.
2

2.1 Ponding Method
Two cut-offs are erected in a canal to isolate a stretch, which is filled with
water. After applying the evaporation correction, the quantity of water lost is
considered seepage. The rate of seepage loss is determined by one of the two
methods viz. falling level and constant level. Neither sophisticated equipment nor
very trained manpower is required for application of this technique. It is a direct
method to measure seepage loss from a considerable length of a canal. The
disadvantages of this technique are:
1) Closing of canal is impracticable and is very expensive depending upon
the size of the canal.
2) When the canal is closed the measurement is not representative of the
line source (i.e. canal) as a small portion is filled with water.
3) Large quantities of water are required if the canal under test is initially dry.
4) Costly watertight bulkheads are to be built at each end of the reach.
Hence the method is usually restricted to small canals.
5) The rate of seepage loss from the test section can vary with time because
of the sealing effects of fine sediments settling out, or in the case of canal,
which is initially dry, because of the time taken to saturate the underlying
formation, or a combination of both.
6) The rate of seepage loss determined by ponding can be very different
from that measured in flowing water because of restoration or self- sealing
effects.
3
2.2 Inflow-Outflow Method
Inflow and outflow of the canal is measured at two pre-selected sections.
The difference between the quantities of water flowing into and out of the canal
reach, after accounting for evaporation, is attributed to seepage loss.
Disadvantages of this method are:
1) This method requires accurate measurement of discharge, which is
usually not practicable under field conditions.
2) Only heavy seepage losses produce meaningful differences in the
discharge.
3) Presence of diversions from a canal complicates the determination of
seepage rate.
2.3 Seepage-meter Method
Although, it is the simplest and cheapest device regarding construction as
well as operation, but it is unreliable due to certain errors and limitations. It
consists of a watertight cylindrical metallic cup connected by a hose to a flexible
(plastic) water bag floating on the water surface. The cup is pushed into the canal
bed with the help of its handle. The water flows from the bag into the cup, where
it seeps through the canal subgrade area isolated by the cup. By keeping the
water bag submerged, it will adapt itself to the shrinking volume so that the
heads on the area within and outside the cup are equal. The seepage rate is
computed from the weight of water lost in a known period of time and the area
covered by the meter. Various types of seepage-meters have been developed.
Generally the disadvantages are following.
4
1. Seepage-meters can only be used in unlined canals.
2. They are restricted only to beds and the seepage through the banks
cannot be encountered.
3. Disturbance of the soil during insertion of the meter can cause
indicated seepage rates to be higher than actual.
4. They cannot be used in very gravely soil, because of the difficulty of
forcing the cup into the bed of the canal, and in sandy soil as it is
likely to be washed away by the water current.
2.4 Radioact ive Tracer Method
This is an indirect method and involves the measurement of filtration
velocity (Darcy velocity) of groundwater in the near vicinity of the canal by single
well tracer dilution technique. Information about the canal parameters is used to
represent mathematically the vetted perimeter of the canal from which seepage
rate can be calculated. The method is based on the confomnal transformation of
z-plane of the canal cross-section to the region of Zhukovsky's Function to obtain
the seepage from the canals with curvilinear perimeter. Considering the shape of
region of Zhukovsky's Function to be a semi-ellipse, Numerov derived the
parametric equations for the perimeter of the canal and the shape of phreatic
curves involving the contribution of the seepage resulting from canal [4]. This
method has the following advantages over the conventional methods.
1) The test is carried out without interrupting the normal flow in the canal and
so the disadvantages resulting from the closure of the canal are not
encountered.
5

2) Discharge in the canal need not be measured so the inaccuracies
resulting therefrom (e.g. those in case of inflow-outflow method) do not
come up in the calculated seepage loss.
3) It does not change any parameter of the canal (such as permeability) on
which seepage rate depends.
4) The time required to carry out the test is much less as compared to that in
case of other methods mentioned above.
5) It is applicable to lined/unlined canals of any dimensions.
6) Experiment can be repeated as it usually takes short time.
This method has also some disadvantages:
1) It is the point method and the seepage rate varies with the variation of soil
texture and the watertable conditions.
2) A delicate & costly equipment is required to carry out tracer experiments.
3) Radiotracer is not easily available as it is imported or produced in a
nuclear reactor. In Pakistan such facility (Pakistan Atomic Research
Reactor) is only available at PINSTECH.
3. EXPERIMENTAL APPLICATION
3.1 Selection of Sites
To select the experimental sites the following criteria were used.
6

• the site should be in the canal section having significant seepage
losses,
• the site should not be under the influence of any other canal, river or
tube well etc.,
• the site should be easily approachable.
To fulfill the major criterion (i.e. first one), results of the study
"Identification and relative contribution of various sources towards water logging
and salinity in Rechna Doab using isotopic techniques" carried out by PINSTECH
under ISM-R CGP (PCRWR) Research Programme were used [5], This study
shows that the upland area in the North East of Rechna Doab between Marala-
Ravi Link Canal and Qadirabad Balloki Link Canal (QBLC) in which UCC and its
branches/distributaries and upper reaches of Lower Chenab Canal (LCC) are
present, does not show any significant recharge from the canals. This area has
about 3-4 m thick layer of clayey silt at the top, which restricts the seepage from
the canals. Due to this reason, no section of UCC was selected, and LCC and its
branches were considered. As far as LCC is concerned, it is accompanied by
other canals up to Kaleki Headworks, where it splits into Jhang Branch and Rakh
Branch. According to the isotopic study, the groundwater of this area has
significant contribution from canal water. During the survey, big patches of land
affected by water logging and salinity were also observed in this area. Keeping in
view the set criteria, two sites: one at Rakh Branch Canal (RBC), to the east of
Sukhiki Town near Astana Alia Pir Shabbir Hussain Bukhari and the other at
Jhang Branch Canal (JBC) to the west of the same town near Mona Jhal Bridge
were selected.
3.2 Drilling of Test Holes
Two test holes of 7 cm dia., one at the site along RBC (13.5 m deep) and
7
the other at the site along JBC (10 m deep) were drilled by hand percussion
method. Piezometers of 3 cm dia were also installed in both the test holes. Water
samples from piezometers and canals were collected and water table was
measured. Soil samples from different depths were collected for grain size/soil
texture analysis. All the samples were visually examined and selected samples
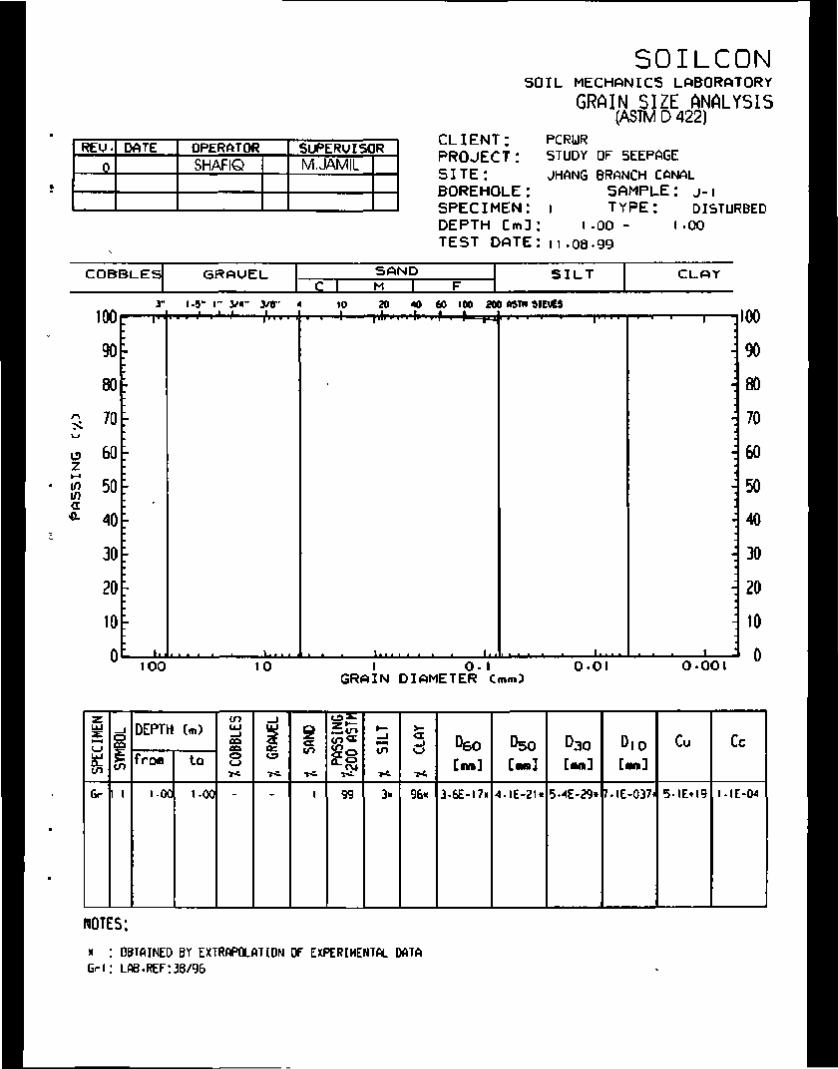
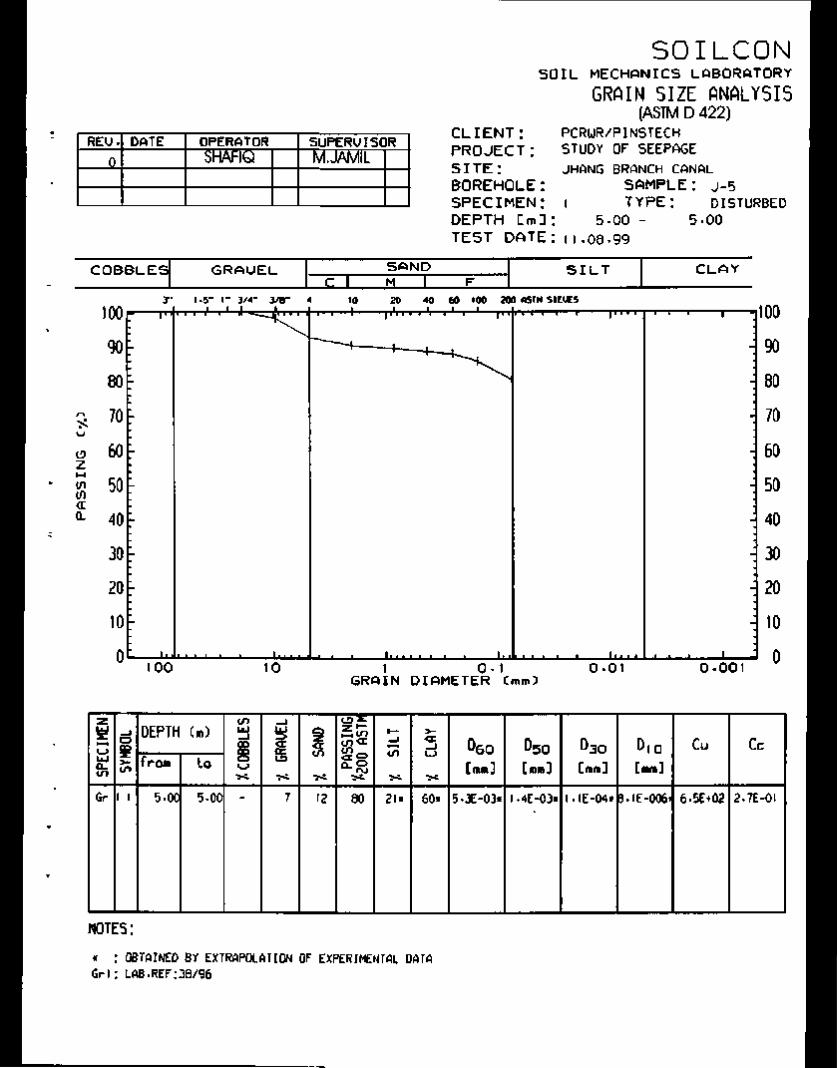
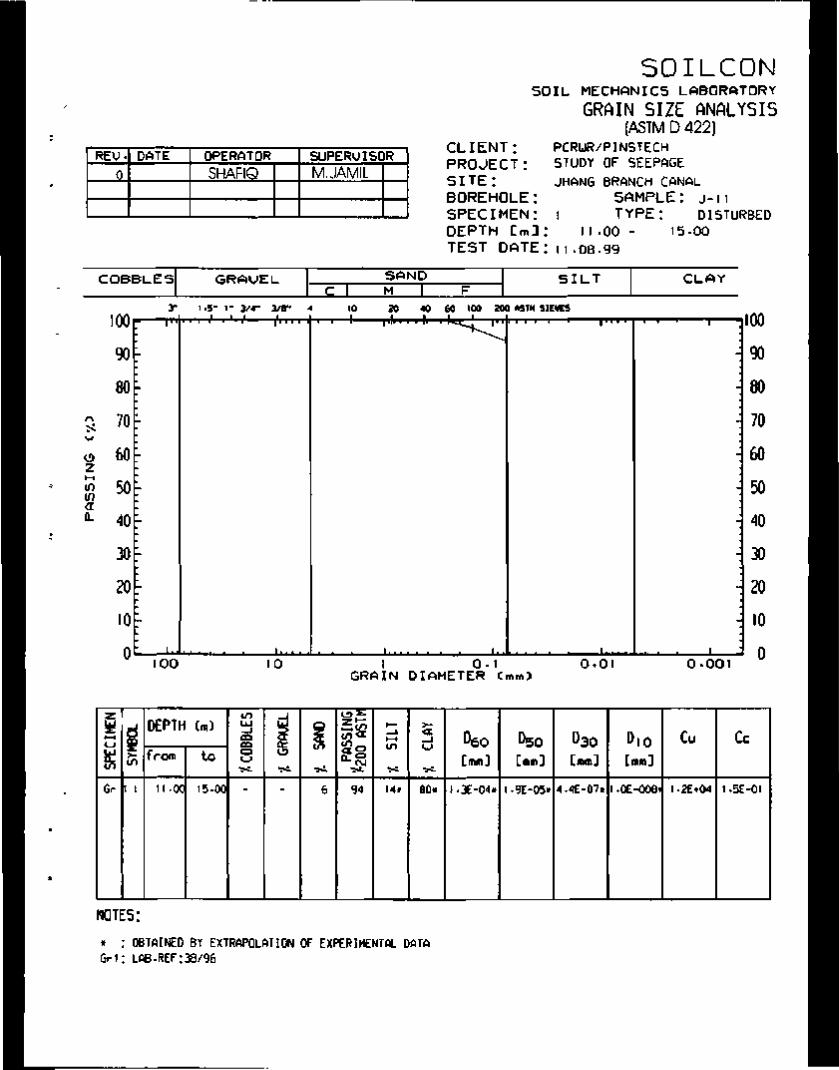
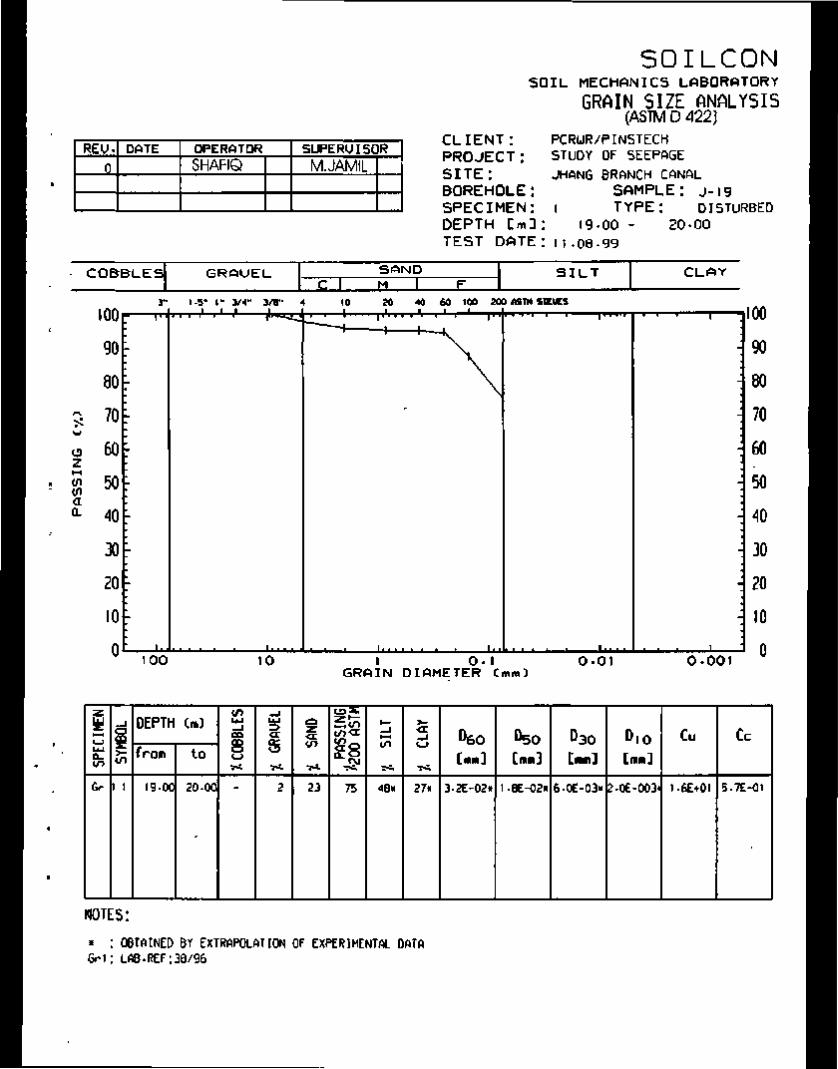
were got analyzed for grain size distribution. The soil at the site along JBC was
clayey up to 6.5 m depth so this site was rejected because the seepage loss
through such a thick clayey bed is normally not measurable. Results of grain size
analysis of samples collected from this site are given in Appendix A. The site at
RBC having sandy/silty soils was selected for study of seepage losses. Results
of grain size analysis of samples collected from this site are given in Appendix B.
Discharge of the canal at this section is about 31 cubic meter per second (1100
cusecs).
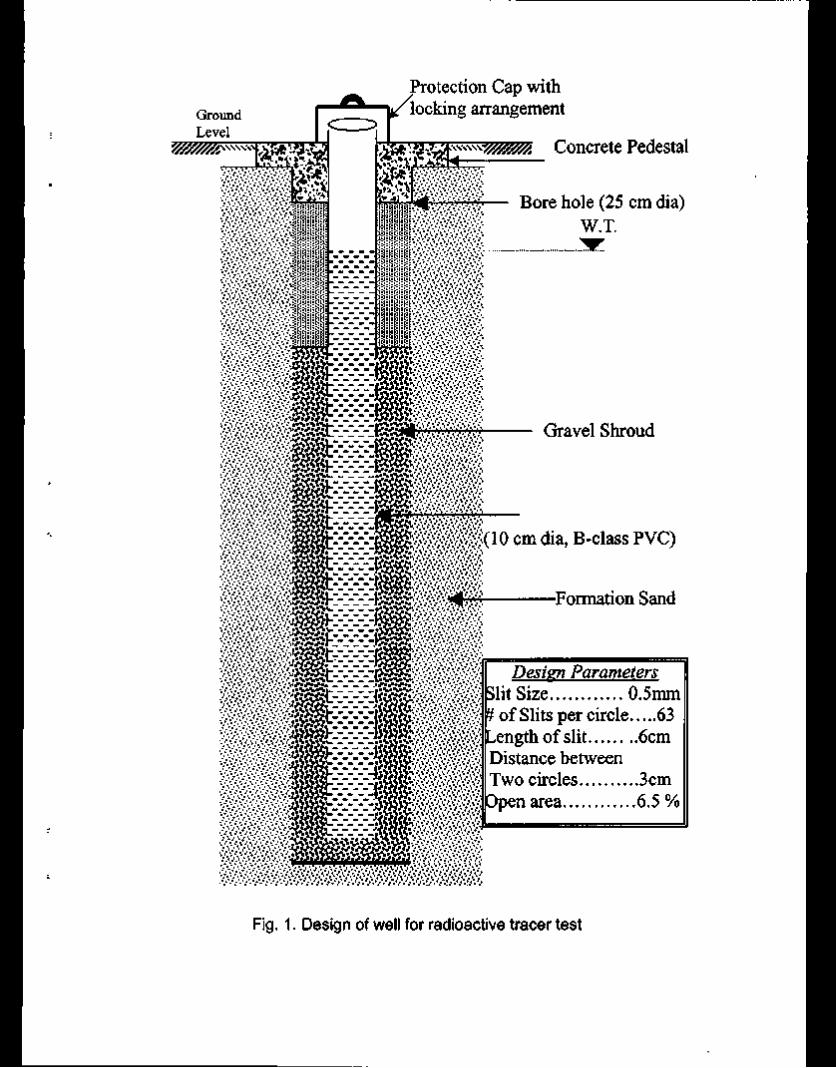
3.3 Design and Construction of Experiment Wells
Two experimental wells, about 13 m deep, were constructed along the
Right Bank of RBC near Sukheki, Distt. Hafizabad. For this purpose boreholes of
25 cm dia. were drilled by hand percussion method and casings having filter
about 9.5 m at the bottom were installed. Hydraulic conductivity of the soil was
estimated which was used to design the filter tube and select the gravel for
shrouding [6]. Selection of the gravel size and design of the filter tube were made
according to the following important condition for single well point dilution
technique [7].
Ki > K2 > K3
Where Ki, K2 & K3 are hydraulic conductivities of filter tube, gravel and porous
medium (soil). These parameters are not needed to be measured very
accurately. Hydraulic conductivity of the soil (K3) was determined using D10 & D6o
of soil samples. In the present case, considering the type of saturated soil of
8
upper layers as sandy clay, K3 was estimated to be 0.001 cm/s. Ki and K2 were
assigned to fulfill the above said condition. D50 of gravel was calculated using the
following relation [6],
(D50)2 = K 2 /C 2
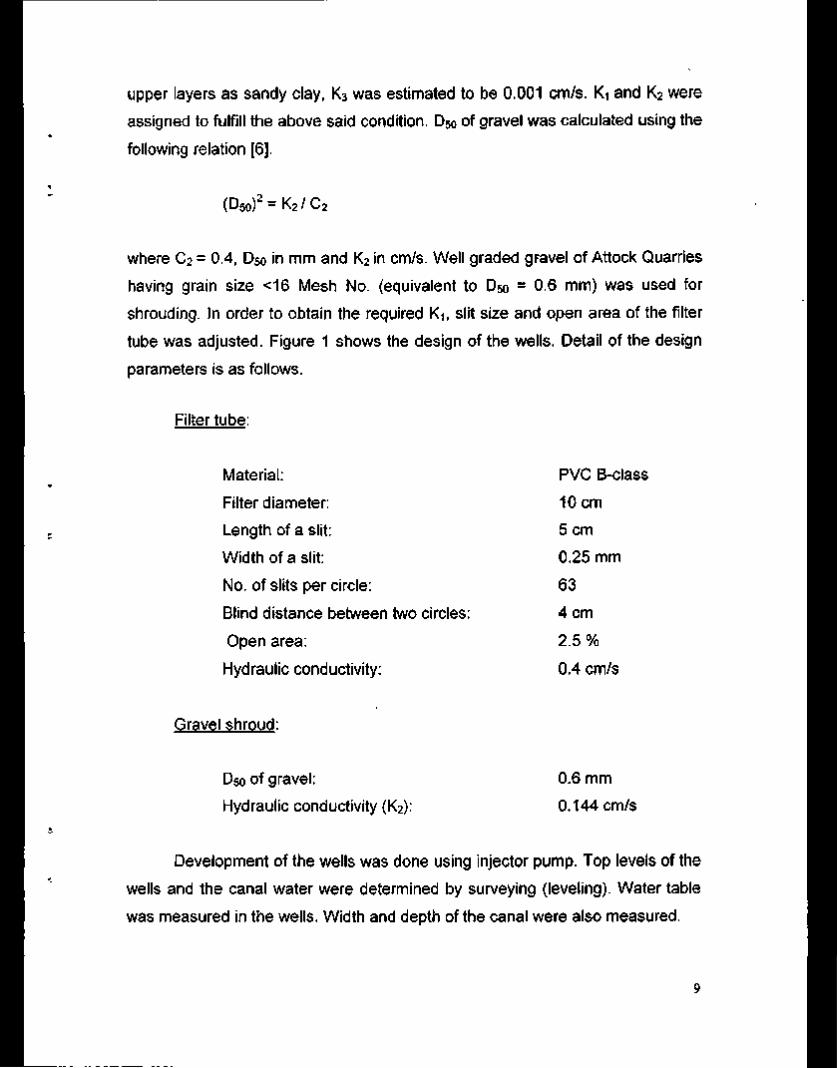
where C2 = 0.4, D50 in mm and K2 in cm/s. Well graded gravel of Attock Quarries
having grain size <16 Mesh No. (equivalent to D50 = 0.6 mm) was used for
shrouding. In order to obtain the required K1; slit size and open area of the filter
tube was adjusted. Figure 1 shows the design of the wells. Detail of the design
parameters is as follows.
Filter tube:
Material:
Filter diameter:
Length of a slit:
Width of a slit:
No. of slits per circle:
Blind distance between two circles:
Open area:
Hydraulic conductivity:
Gravel shroud:
PVC B-class
10 cm
5 cm
0.25 mm
63
4 cm
2.5 %
0.4 cm/s
D50 of gravel: 0.6 mm
Hydraulic conductivity (K2): 0.144 cm/s
Development of the wells was done using injector pump. Top levels of the
wells and the canal water were determined by surveying (leveling). Water table
was measured in the wells. Width and depth of the canal were also measured.
9
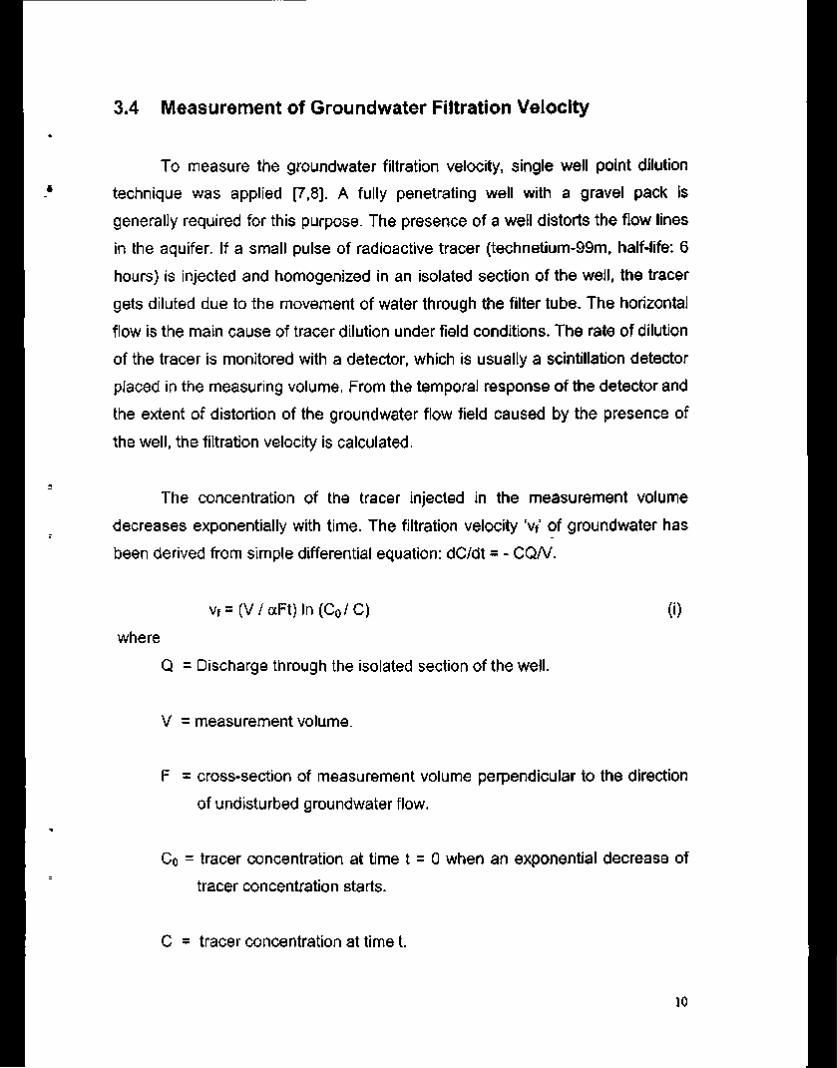
3.4 Measurement of Groundwater Filtration Velocity
To measure the groundwater filtration velocity, single well point dilution
technique was applied [7,8]. A fully penetrating well with a gravel pack is
generally required for this purpose. The presence of a well distorts the flow lines
in the aquifer. If a small pulse of radioactive tracer (technetium-99m, half-life: 6
hours) is injected and homogenized in an isolated section of the well, the tracer
gets diluted due to the movement of water through the filter tube. The horizontal
flow is the main cause of tracer dilution under field conditions. The rate of dilution
of the tracer is monitored with a detector, which is usually a scintillation detector
placed in the measuring volume. From the temporal response of the detector and
the extent of distortion of the groundwater flow field caused by the presence of
the well, the filtration velocity is calculated.
The concentration of the tracer injected in the measurement volume
decreases exponentially with time. The filtration velocity 'v/ of groundwater has
been derived from simple differential equation: dC/dt = - CQ/V.
vf = (V/aFt) ln(C0 /C) (i)
where
Q = Discharge through the isolated section of the well.
V = measurement volume.
F = cross-section of measurement volume perpendicular to the direction
of undisturbed groundwater flow.
C0 = tracer concentration at time t = 0 when an exponential decrease of
tracer concentration starts.
C = tracer concentration at time t.
10

a = convergence factor for the lines of flow intercepted by the borehole
and is the ratio of asymptotic width of tracer cloud to the inner
diameter of the well screen.
For a well screen of inner radius Ri, the equation (i) can be written as:
vf = (n RT / 2 a t ) In ( C0 / C) (ii)
The value of a depends on the construction of the borehole and the nature
of the porous medium and may be calculated by using the following equation:
a = 8 / {A (1 + K3/ K2 ) + B (1 - K3 / K2 )} (iii)
where A = {1 + ( R, I R2 f) + K2 / Ki {1 - ( Ri / R2 f}
B = {( Ri / R2 f + ( R2 / R3 f } + K2/ Ki {( Ri / R3 f- ( R2 / R3 )2}
Ri, R2 are internal & external radii of filter tube, R3 is the radius of bore.
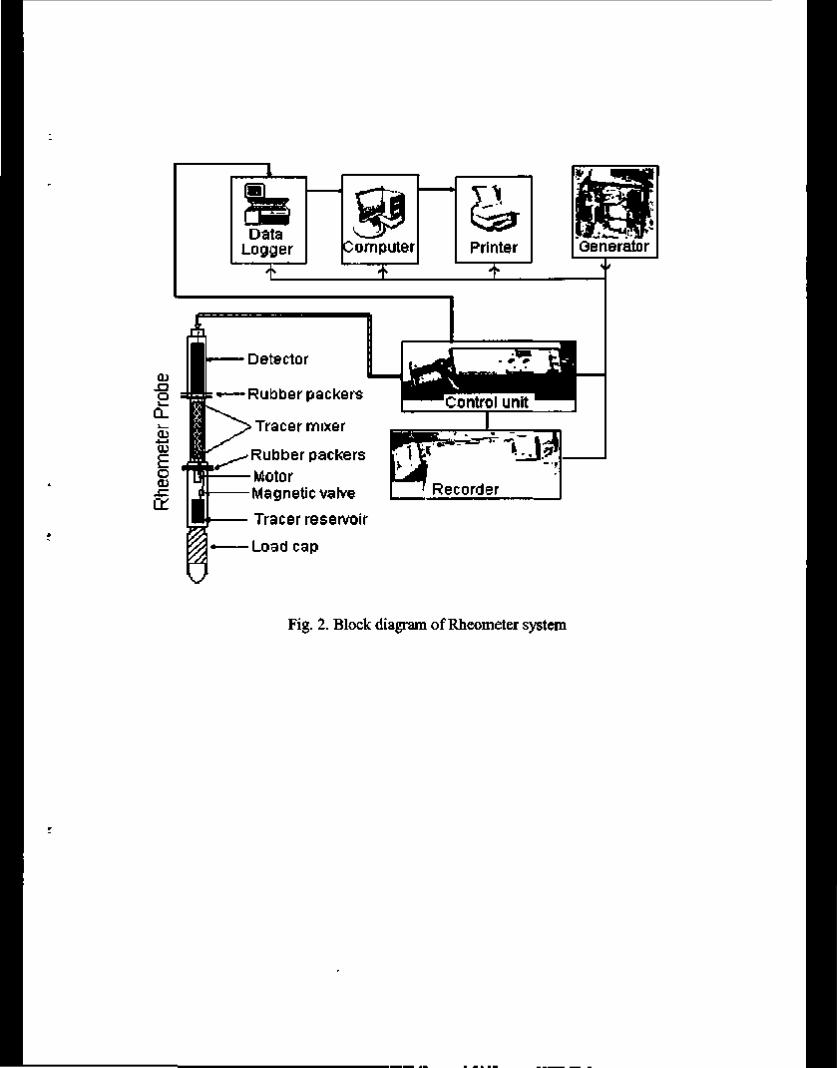
Value of a for both the wells was calculated as 3.45 [6]. The experiment
for measurement of filtration velocity was carried out in each well. For this
purpose, a comprehensive system comprising a Rheometer probe, control unit,
data logger, computer and a recorder was used. Schematic diagram of the
system has been shown in Figure 2. The probe is equipped with tracer injection
system, homogenization system and a radiation detection system.
3.5 Calculation of Seepage Losses
The rate of seepage from the canal was determined by the following
n

parametric equation of the phreatic curve [4,9].
x = (q / 2K ) + {(B - q / K) / 2} cosh (nKy / q) + H sinh (nKy / q) (iv)
where q = Seepage rate in cubic meter per day per meter length of canal
(m3/d.m)
x,y = Co-ordinates of any point on the phreatic line (m).
H = Maximum depth of water in the canal (m).
K = Coefficient of permeability (m/d).
B = Top width of canal (m).
In this case, the value of q can be obtained by measuring the value of K and the
x and y co-ordinates of any point on the phreatic line as well as the top width (B)
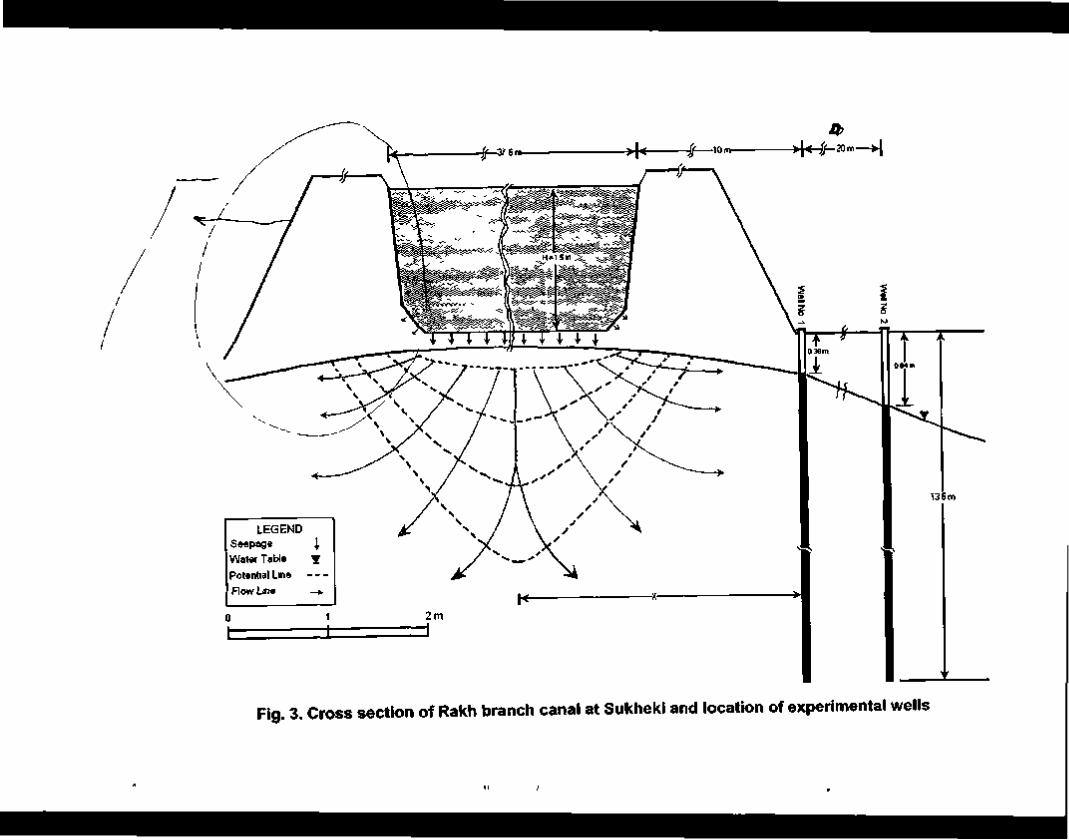
and the maximum depth (H) of the canal flow. Cross-section of the canal at the
experimental site of the present case study has been shown in Figure 3. The
values of x, y, H and B were measured at the experimental site. Coefficient of
permeability (K) was determined by Darcy's law: K = vf / I, where T is the
hydraulic gradient calculated by measuring the water table in the wells. All these
values were put in the Eq. No. (iv) and the value of 'q' was varied by iterative
method. Convergence of the right hand to the left hand side gave the value of 'q'.
4. RESULTS AND DISCUSSION
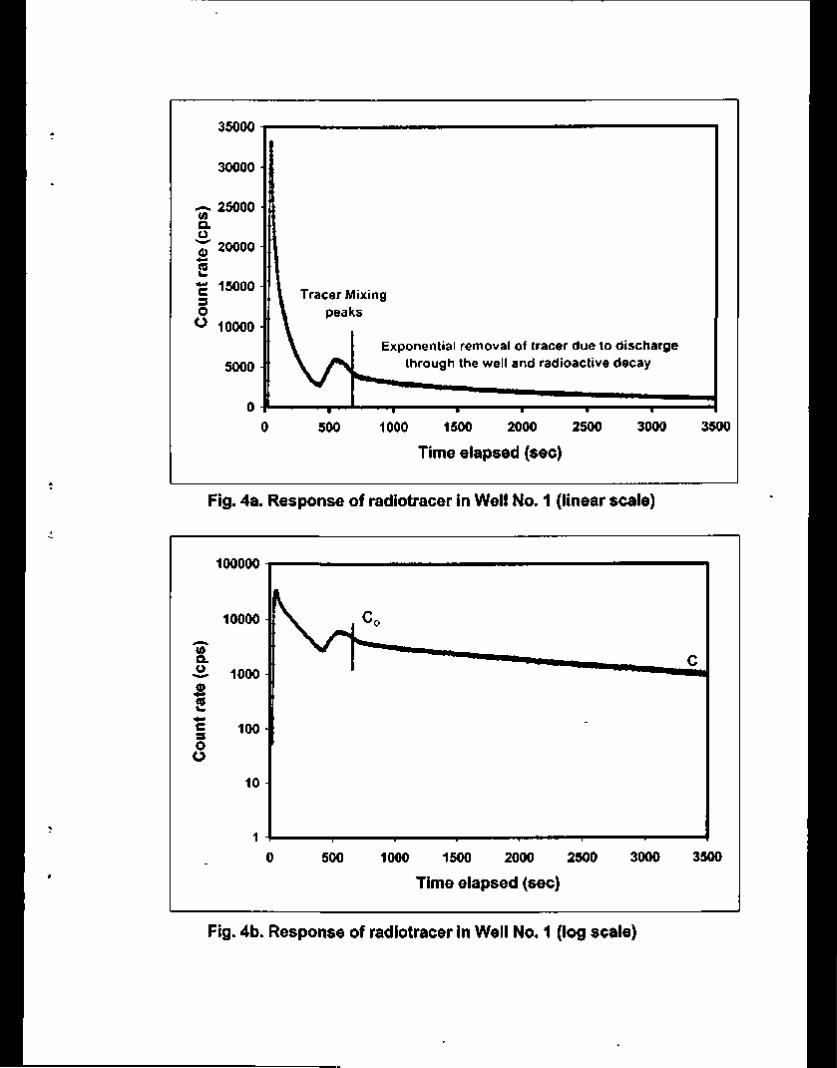
For measurement of groundwater flow velocity, the radiotracer responses
in Well No. 1 and 2 are shown in Fig. 4a and Fig 5a. The peaks at the beginning
are due to cyclic movement of the tracer plume towards the detector. When the
tracer is completely mixed in the isolated volume, its concentration is decreased
exponentially due to dilution resulting from the discharge through the well and
radioactive decay. Fig. 4b and Fig 5b indicate the tracer responses in both the
wells on log scale. After the mixing peaks, a straight line is obtained along which
12
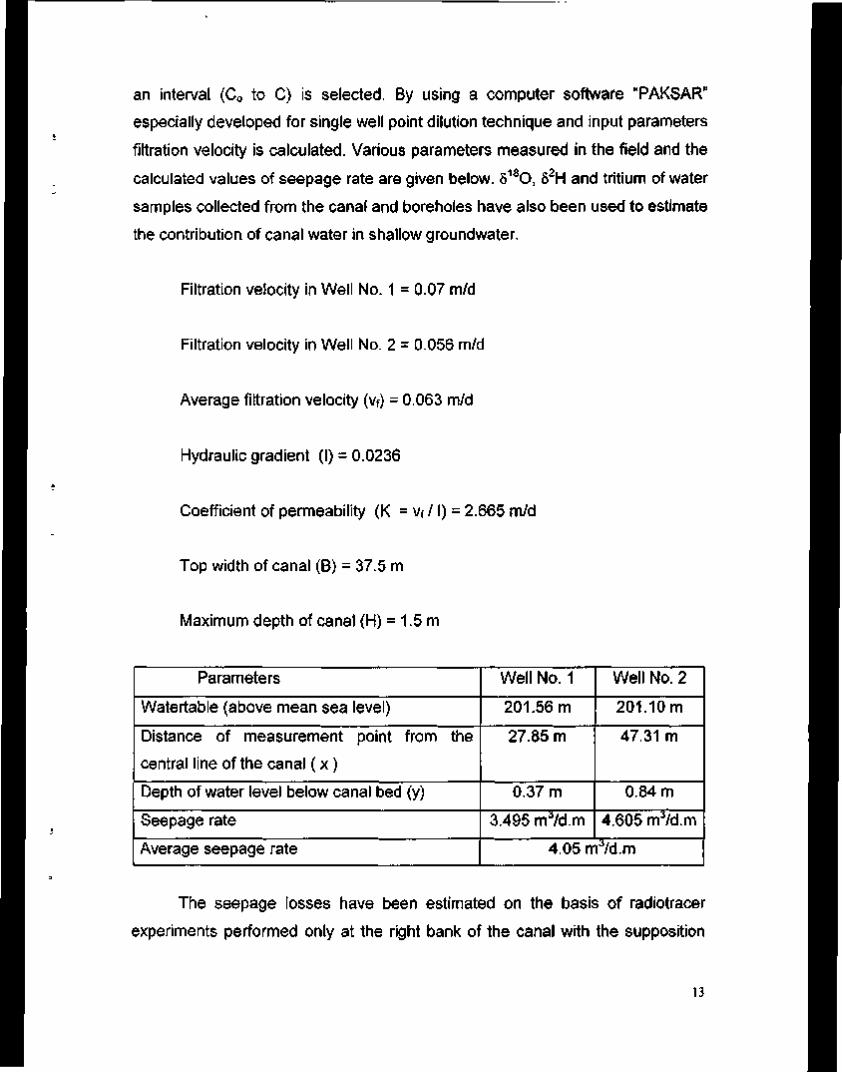
an interval (C0 to C) is selected. By using a computer software "PAKSAR"
especially developed for single well point dilution technique and input parameters
filtration velocity is calculated. Various parameters measured in the field and the
calculated values of seepage rate are given below. 5180, 52H and tritium of water
samples collected from the canal and boreholes have also been used to estimate
the contribution of canal water in shallow groundwater.
Filtration velocity in Well No. 1 = 0.07 m/d
Filtration velocity in Well No. 2 = 0.056 m/d
Average filtration velocity (Vf) = 0.063 m/d
Hydraulic gradient (I) = 0.0236
Coefficient of permeability (K = vf /1) = 2.665 m/d
Top width of canal (B) = 37.5 m
Maximum depth of canal (H) = 1.5 m
Parameters
Watertable (above mean sea level)
Distance of measurement point from the
central line of the canal ( x )
Depth of water level below canal bed (y)
Seepage rate
Average seepage rate
Well No. 1
201.56 m
27.85 m
0.37 m
3.495 nrrVd.m
Well No. 2
201.10 m
47.31 m
0.84 m
4.605 rrrVd.m
4.05 nrVd.m
The seepage losses have been estimated on the basis of radiotracer
experiments performed only at the right bank of the canal with the supposition
13
that the phreatic curves for both the banks are similar. However, it is advisable to
make the measurements on both the banks and average value will actually
represent the seepage rate. Being a point method, it gives the seepage loss for
the section at which the experiment was performed so it may not be applied for
the sections having different soil and watertable conditions.
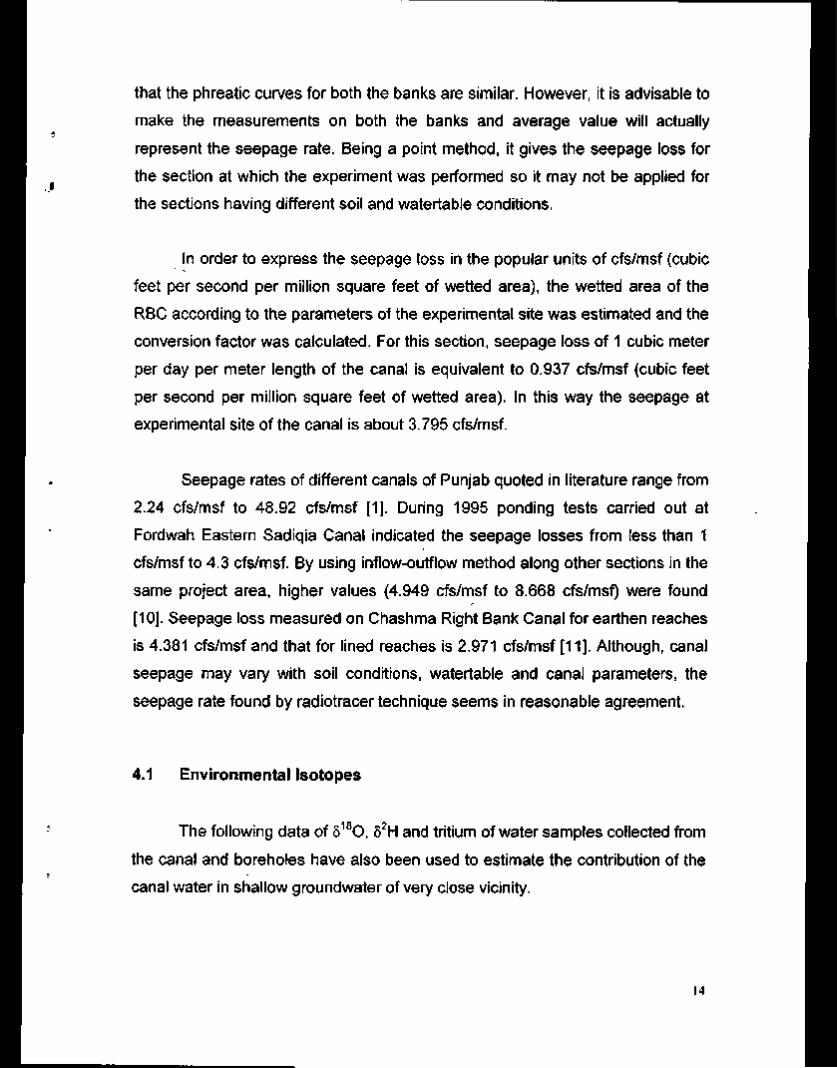
In order to express the seepage loss in the popular units of cfs/msf (cubic
feet per second per million square feet of wetted area), the wetted area of the
RBC according to the parameters of the experimental site was estimated and the
conversion factor was calculated. For this section, seepage loss of 1 cubic meter
per day per meter length of the canal is equivalent to 0.937 cfs/msf (cubic feet
per second per million square feet of wetted area). In this way the seepage at
experimental site of the canal is about 3.795 cfs/msf.
Seepage rates of different canals of Punjab quoted in literature range from
2.24 cfs/msf to 48.92 cfs/msf [1]. During 1995 ponding tests carried out at
Fordwah Eastern Sadiqia Canal indicated the seepage losses from less than 1
cfs/msf to 4.3 cfs/msf. By using inflow-outflow method along other sections in the
same project area, higher values (4.949 cfs/msf to 8.668 cfs/msf) were found
[10]. Seepage loss measured on Chashma Right Bank Canal for earthen reaches
is 4.381 cfs/msf and that for lined reaches is 2.971 cfs/msf [11]. Although, canal
seepage may vary with soil conditions, watertable and canal parameters, the
seepage rate found by radiotracer technique seems in reasonable agreement.
4.1 Environmental Isotopes
The following data of 5180, 82H and tritium of water samples collected from
the canal and boreholes have also been used to estimate the contribution of the
canal water in shallow groundwater of very close vicinity.
14
Source Well No. 1
Well No. 2 Canal Water Rain water
(Sargodha)
5180 (%o) -9.3
-9.4 -10.0
-4.5
52H (%o) -65.8
-64.8 -68.2
-22.0
Tritium (TU) 13
11
12
—
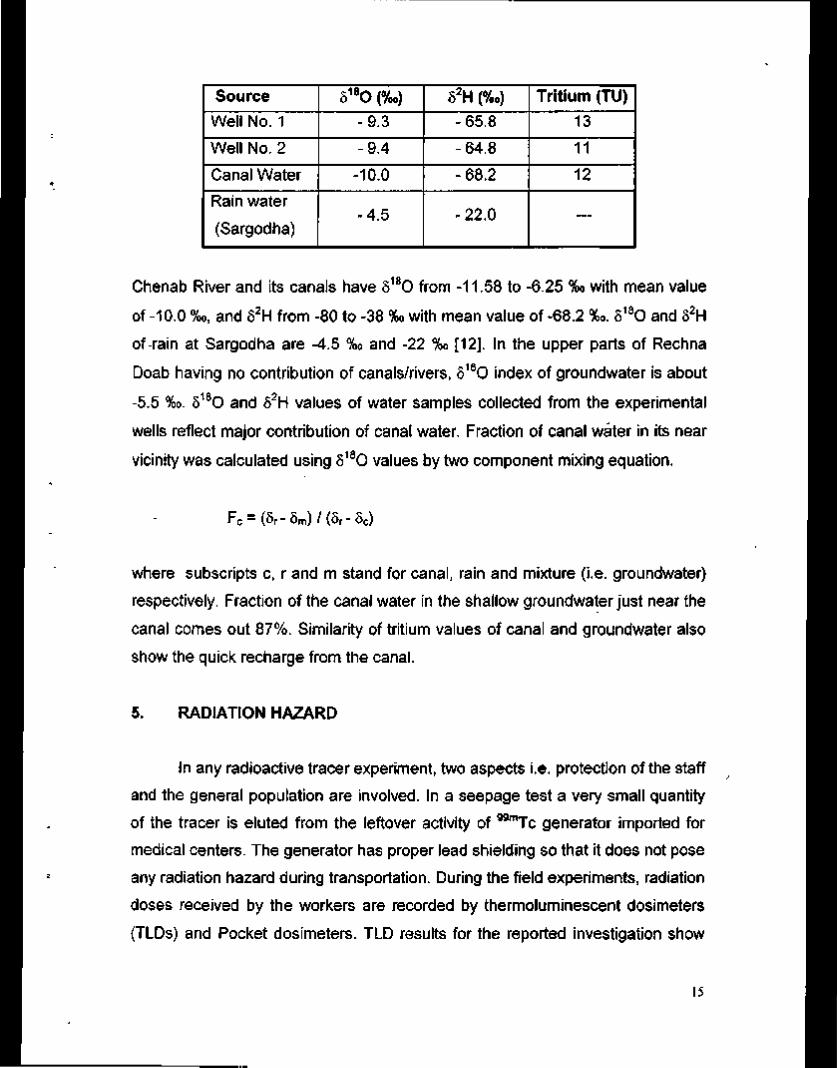
Chenab River and its canals have 5180 from -11.58 to -6.25 %o with mean value
of -10.0 %o, and 82H from -80 to -38 %o with mean value of -68.2 %0. 5180 and 52H
of rain at Sargodha are -4.5 %o and -22 %o [12]. In the upper parts of Rechna
Doab having no contribution of canals/rivers, 5180 index of groundwater is about
-5.5 %o. 5180 and 62H values of water samples collected from the experimental
wells reflect major contribution of canal water. Fraction of canal water in its near
vicinity was calculated using 5180 values by two component mixing equation.
Fc=(5 r-5m) /(5 r-5c)
where subscripts c, r and m stand for canal, rain and mixture (i.e. groundwater)
respectively. Fraction of the canal water in the shallow groundwater just near the
canal comes out 87%. Similarity of tritium values of canal and groundwater also
show the quick recharge from the canal.
5. RADIATION HAZARD
In any radioactive tracer experiment, two aspects i.e. protection of the staff
and the general population are involved. In a seepage test a very small quantity
of the tracer is eluted from the leftover activity of 99mTc generator imported for
medical centers. The generator has proper lead shielding so that it does not pose
any radiation hazard during transportation. During the field experiments, radiation
doses received by the workers are recorded by thermoluminescent dosimeters
(TLDs) and Pocket dosimeters. TLD results for the reported investigation show
15
that the maximum dose to any individual was a very small fraction (0.05 mSv) of
the maximum permissible dose (0.4 mSv per week) [13].
In order to ensure the safety of the general public, area under
investigation is kept isolated and out of reach of general public. Generally the
selected test point is away from any hand pump/tubewell used for exploitation of
groundwater for drinking or any other purpose. The radiotracer (99mTc) having
very short half-life (6 hrs) is not harmful as it decays in one day traveling very
short distance, at the most a few meters. Therefore, the radioactive isotope used
as a tracer was not hazardous for public health.
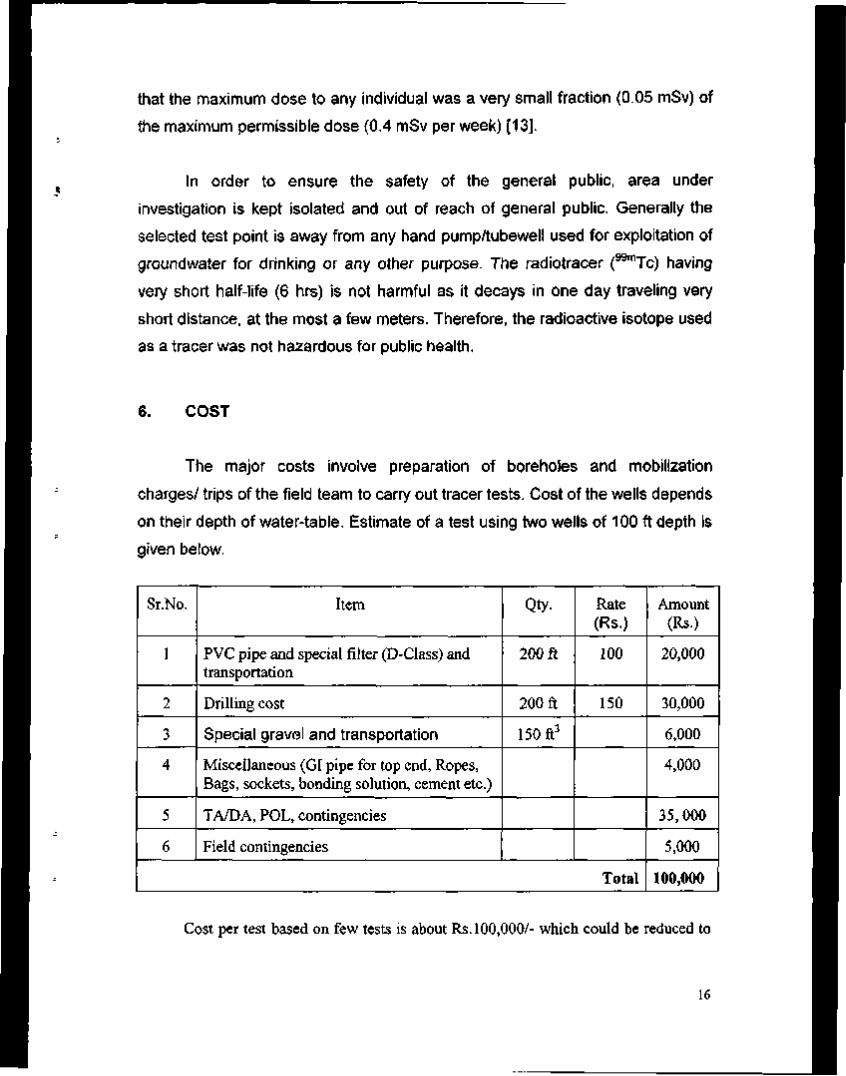
6. COST
The major costs involve preparation of boreholes and mobilization
charges/ trips of the field team to carry out tracer tests. Cost of the wells depends
on their depth of water-table. Estimate of a test using two wells of 100 ft depth is
given below.
Sr.No.
1
2
3
4
5
6
Item
PVC pipe and special filter (D-Class) and transportation
Drilling cost
Special gravel and transportation
Miscellaneous (GI pipe for top end, Ropes, Bags, sockets, bonding solution, cement etc.)
TA/DA, POL, contingencies
Field contingencies
Qty-
200 ft
200 ft
150 ft3
Rate (RS.)
100
150
Total
Amount (Rs.)
20,000
30,000
6,000
4,000
35, 000
5,000
100,000
Cost per test based on few tests is about Rs. 100,000/- which could be reduced to
16

Rs.60,000/- per test for the large scale investigations by creating facilities for drilling and
fabrication of filters.
7. RECOMMENDATIONS
It is recommended that the most pervious canal sections where the
seepage rate is appreciably high, may be identified as a first step to plan lining or
other remedial measures. Considering accuracy of the radiotracer technique and
availability of the facilities at reasonable cost, it may be applied at national level.
ACKNOWLEDGEMENTS
We express our profound gratitude to Chairman PAEC for his valuable guidance
and keen interest in establishing the facilities and expertise for application of
nuclear techniques in this field of vital national importance. The equipment for
field measurements and staff training were provided by the International Atomic
Energy Agency under a Technical Cooperation Project. The field investigation
was" partially funded by the Pakistan Council of Research in Water Resources
(PCRWR) for which we are highly indebted to Chairman, PCRWR. We are also
highly thankful to Director General PINSTECH for his keen interest. Special
thanks are due to Isotope Production Division, PINSTECH for providing
radiotracer and Health Physics Division, PINSTECH for providing dosimeters.
We would like to express our deep appreciation to Mr. Waheed Akram for his
help in compilation of the report and Muhammad Islam Pasha for his support
during fieldwork.
17
REFERENCES
1. Ahmad, N., Groundwater Resources of Pakistan, 61-B/2 Gulberg-lll,
Lahore, 1995.
2. Kraatz.D.B., Irrigation canal lining, Irrigation and Drainage Paper-2, Water
Resources and Development Service, Land and Water Development
Division, Food and Agriculture Organization of the United Nations, Rome,
1971.
3. Weller.J.A. and McAter,P., Seepage measurement techniques and
accuracy, Proceedings Workshop on Canal Lining and Seepage, 18-21
October, 1993, Lahore, Pakistan.
4. Krishnamurthy, K. and Rao, S.M., Theory and experiment in canal seepage
estimation using radioisotopes, Journal of Hydrology 9(1969) 277-293.
5. Sajjad.M.I., Tasneem.M.A., Ahmad,M., Hussain,S.D., Khan.l.H., Akram.W.
and Qureshi.R.M., Identification and Relative Contribution of Various
Sources Towards Water logging & Salinity in Rechna Doab-Using Nuclear
Techniques, Final Report on ISM-R CGP (PCRWR) Research Project (July,
1988 to July, 1991).
6. Klotz, D., a - Werte Ausgebauter Bohrungen, Gesellschaft fur Strahlen-und
Umweltforschung mbH Institut fur Radiohydrometrie, GSF-Bericht R
176,1978.
7. Halevy,E., Borehole dilution techniques: A critical review, in: Isotopes in
Hydrology, I.A.E.A Vienna, 1967.
18

8. Drost.W and Klotz.D, .Aquifer Characteristics In Guidebook on Nuclear
Techniques in Hydrology, I.A.E.A, Vienna, 1983.
9. Halek,V. and Svec.J., Groundwater Hydraulics, Elsevier Publishing
Company, Amsterdam ,1979.
10. Mian,H.U., A discussion paper on seepage experiments and project
alternatives, Presented in Project Coordination Committee Meeting, 28
June, 1995.
11. Siddique, M., Pasha, F.H. and Choudhri, A.M., Seepage loss measurement
on Chashma Right Bank Canal, Proceedings Workshop on Canal Lining
and Seepage, 18-21 October, 1993, Lahore, Pakistan.
12. Hussain,S.D., Sajjad.M.I., Akram.W., Ahmad.M., Tasneem.MA, Tariq,J.A.,
Surface water / groundwater relationship in Chaj Doab, PINSTECH Report
No. PINSTECH/RIAD-122 (1990).
13. IAEA, (1996), International Basic Safety Standards for Protection Against
Ionizing Radiation and for the Safety of Radiation Sources, IAEA Safety
Series No. 115, International Atomic Energy Agency, Vienna, Austria.
19

F i g u r e s
Ground Level
Protection Cap with u/locking arrangement
£'"&'■
:->f?f;fzr . .•■/••■■■/•'_ _ _ _ _ . :->f:f;fn * • H V '
Concrete Pedestal
Bore hole (25 cm dia) W.T.
■ f i f ' f i t : If i f If •• : >•%■%■■■'■.
. • ^ ^ . . ■ (
I ftfifit'i. ■•V.V.v
'ftftfiC ffififi' •■.■ ■''•■■•«■■• — — - — • ' ' . • < ; ' . • • ■".■ •'fififir J ' J ' J ' J • .".■
■ • • - S l V V •* .^ , .^ # >". -.' ' . '■■■^•^•. _ _ j f ' f ' f :
', ■•>•>•%!-
■.■J,SJ,S^S]-_-_-_.
:->fffi+i* • "M l f tS j ■ •.■.•\«\«S(_~_~_~. . ■ " ' j f ; i •JJWWJ •,'i»S»S»st---"--. •'.•S«S«Vl___~_-. pfjflfji •ififmfm '
r ■ • S ' S f v L . t ' .^V^".^" ••fififir I f ' f i f ' i ' . • f W M r.W.^"■.•■■. :<f-f'f-m Afzf;f:•■•:■ ■•: '.••.'••S'VA >".
%".^".
v .■■.
s-flfif;' 'fiS'f-..;. ' ■■ .> I> ;V ■1>1>1>" ."■ "f'fifii — *■'■"'."'.•• ■".■ •f;fff;r ff;f;f;,.;. f:f;f;C fr'r'r
■■."■ ■■.■
frfffi- ■"■';';'.■■ ■■.■ . ' • v ; ' . " ' ; r - - - - ( f i - t " ■■.--■ : ' .■■>">">i . * i > i > i ^ " . ■.■-■ .•■•f;f;f;. ■■'.■'."'.■■■'.■■'. ■•fif i f it f'."'."'."'■■.■■■/ ■ i V l V V *".V>%»v..■.. Jf'f'f'm — — ■'flflf!' .■,
■•ffflffi !'.••'.■'.•■ ■".■■J ■ . - S ' S ' S I ■■S 'S 'S" , .■.■..', ■'fif i f it — — - - J ' . " ' . " ' . * " .■,■■','
:-<fififit 'fi*i+i'■•:•■•: ■'fififir '+i*i*i'■•:■■•: i " , s » S " S ^ _ _ _ _••%•%•>■'.••,•.•■, ■'fififii — ~ - A*!*!*!' :'■ ■'fififir ' ' . • ' .■' .*•.• .• .■. ■'fififir ■«■'.■'.•• ■•.• ■'fififi* -~fi*ifi> ••:•■•:
■ t ' S ' S ' S t —■■>•%•"•"• .■■.■■ •'fififi' - - -'f!*!*!• .".■•'.■
■ i " S « S » S ^ - _ - -•■>"S"%".••■.■' ■<fififi' — — - - -'fif if!'■•:•.•: i ' S ' S ' S ^ _ ■■/»■>•%'■,.'■.. ■'fififim ■''.■'.■'.■■■•.•■•.
■ ■ " > » > » > t - - - -•■%•>■/■".■•.•..'. ■.i.-..-i J . . . . . . - . - . - i J i J i Jn .-;. s'flfiflflfiflflflflflflJ ■:■
Gravel Shroud
J(10cmdia,B-classPVC)
-Formation Sand
•.•..'.■..•■.■■.̂ ■.v.v
Design Parameters Slit Size
; ^ of Slits per circle • Length of slit Distance between
. Two circles Open area
0.5mm 63
..6cm
..3cm 6.5 %
Fig. 1. Design of well for radioactive tracer test
Computer
Detector
Rubber packers
Tracer mixer
Rubber packers Motor Magnetic valve Tracer reservoir
Load cap
\s Fig. 2. Block diagram of Rheometer system
LEGEND Seepage Water Table Potential Line Flow Line
I *
-*
Fig. 3. Cross section of Rakh branch canal at Sukheki and location of experimental wells
J J U U U
30000 -
- - 25000 (/) a o ^ 20000
^ 15000 -3 o ° 10000
5000
g
0
I 1 \ Tracer Mixing \ peaks
Exponential removal of tracer due to discharge through the well and radioactive decay
500 1000 1500 2000 2500 3000
Time elapsed (sec)
3500
Fig. 4a. Response of radiotracer in Well No. 1 (linear scale)
(A Q.
0) (S
c 3 o o
-
mnnnn -. IUUUUU
10000
1000
100 -
10
0 500
C0
1000 1500 2000 2500
Time elapsed (sec) 3000
C
3500
Fig. 4b. Response of radiotracer in Well No. 1 (log scale)

35000 i
30000
~. 25000 w Q. O *£ 20000
c 15000
O O 10000
5000
o-M
Tracer Mixing peaks
Exponential removal of tracer due to discharge through the well and radioactive
1000 2000 3000
Time elapsed (Sec)
4000
Fig. 5a. Response of radiotracer in Well No. 2 (linear scale)
(A Q. O
0) (0
c O
o
10000
1000
100 I
10
1
0 1000
hCo
2000 3000
Time elapsed (sec) 4000
c
Fig. 5b. Response of radiotracer in Well No. 2 (log scale)
Appendix-I
Results of soil texture at Jhang Branch canal
SOILCON 50IL MECHANICS LABORATORY
GRAIN SIZE ANALYSIS (ASTM D 422)
R E U .
o DATE OPERATOR
SHAFIQ SUPERUISQR M.JAMIL
CLIENT; PROJECT: SITE: BOREHOLE: SPECIMEN: DEPTH Cm] TEST DATE
PCRUR STUDY OF SEEPAGE JHANG BRANCH CANAL
S A M P L E : j - i I T Y P E : DISTURBED
I - 0 0 - I - 0 0 I I - 0 8 - 9 9
C O B B L E S GRAUEL SAND M
S I L T C L A Y
z I—I in in <r
<&.
100 90 80 70 60 50 40 30 20 10 0 L L
1.5" l" 3/4" 3/B . ,1 i l J JU
10 20 10 60 100 200 ASTN SIEVES | ill i i i fi i f i f 11 i r-r-i—i—i r*
,l,i i l l .i 1 0 0 10 1 0 - 1
G R A I N D I A M E T E R Cmm3 0 - 0 1 0 - 0 0 J
00
90
80 70 60 50 40 30 20
■3 10 0
LU
UJ O-
Gr
1 o CD
1 1
DEPTH Cm)
from
I -00
to
1-00
on LU
1 OO co o
_ i LLJ i d
■z.
1
on<r
99
i— _ i en
3*
<r
96*
Deo [mm]
3-6E-17.
D50 [mm]
4 . 1 E - 2 I "
D30 [mm]
5-4E-29*
Dio [mm]
7-IE-037*
Cu
5-1E+I9
Cc
1-IE-01
NOTES: * : OBTAINED BY EXTRAPOLATION OF EXPERIMENTAL DATA Grl; LAB-REF:38/96
REU.
0 DATE OPERATOR
SHAFIQ SUPERVISOR M.JAMIL
C L I E N T : P R O J E C T ; S I T E : B O R E H O L E : S P E C I M E N : DEPTH Cm] TEST DATE
SOILCON S O I L MECHANICS LABORATORY
GRAIN SIZE ANALYSIS (ASTM D 422)
PCRUR/PINSTECH STUDY OF SEEPAGE JHANG BRANCH CANAL
: S A M P L E : j - 5 : I T Y P E : DISTURBED
5-00 - 5-00 1 -08-99
C O B B L E S G R A U E L SAND jcZL M
S I L T C L A Y
w
z
<I Q.
100
90F-
80=-
70 L
60
ili 50
40
30
20
10
0
1.5" I" 3/4" 3/B" 10 20 40 60 100 200 ASTM SIEVES
"T
0 0 10 1 0 - 1 GRAIN DIAMETER Cmrr.3
0 - 0 1 _L
0 - 0 0 1
100 90 80 70 60 50 40 30
: 20 ■3 10
0
z LU
LJ LU Q_ t o
Gr
_ l
>-
1 1
DEPTH Cm)
f rom
5-00
to
5-00
i n LU _ i ca ca a
_ i LU => <r az to
7
o z <r
12
z ►— t-t i n tn<E <r O
CM
80
i— _ i i n
21*
<r _ i i_>
60M
Deo [mm]
5-3E-03*
D50 [mm]
1-4E-03*
D30 [mm]
l-IE-04*
D.o [mm]
3-1E-O06*
Cu
6-5E+02
Cc
2-7E-OI
NOTES * : OBTAINED BY EXTRAPOLATION OF EXPERIMENTAL DATA Grl ; LAB.REF;38/96
R E U -
0
DATE OPERATOR
SHAFIQ SUPERUISOR M.JAMIL
C L I E N T : P R O J E C T : S I T E : B O R E H O L E : S P E C I M E N : D E P T H C m ] T E S T D A T E
SOILCON S O I L M E C H A N I C S LABORATORY
GRAIN SIZE ANALYSIS (ASTM D 422)
PCRUR/PINSTECH STUDY OF SEEPAGE JHANG BRANCH CANAL
: SAMPLE: j - i i : 1 T Y P E : DISTURBED
1 I -00 - 15-00 1 . 0 8 - 9 9
C O B B L E S G R A U E L S A N D j c T M I
S I L T CLAY
100
90
80
70
60
1-5" 3/4" 3/8"
z
£ 50
°- 40
30
20
10
0 IOO i..,. . J
20 40 60 I ill i i i f i
100 200 ASTM SIEVES
1 O- 1 G R A I N D I A M E T E R Cmm3
O-Ol O-OOI
100
90
80
70
60
50
40
30
- 20
- 10
0
z LU
LJ LU ci-i n
Gr
_J o CD >-i n
1 I
DEPTH Cm)
f rom
11-00
t o
15-00
i n _ j as CG o
LU r> < i a:
a z <L i n
6
S o
94
i—
i n
14*
>-<X _ l
ao»
Deo [mm]
l -3E-04*
D50 [mm]
I.9E-05*
D30 [mm]
4-4E-07i
DlO [mm]
I -0E-008<
Cu
1-2E+04
Cc
1-5E-0I
NOTES:
* ; OBTAINED BY EXTRAPOLATION OF EXPERIMENTAL DATA G r l ; LAB-REF;38/96

REU
0 DATE OPERATOR
SHAFIQ SUPERUISOR M.JAMIL
SOILCON SOIL MECHANICS LABORATORY
GRAIN SIZE ANALYSIS (ASTM D 422)
C L I E N T ; PCRUR/PINSTECH P R O J E C T : STUDY OF SEEPAGE S I T E : JHANG BRANCH CANAL B O R E H O L E : S A M P L E : J 1 7 S P E C I M E N : 1 T Y P E : DISTURBED D E P T H C m : 1 6 0 0 T E S T D A T E : 1 1 . 0 8 9 9
1800
C O B B L E 5 G R A U E L S A N D M
S I L T C L A Y
100
90
80
3"
S-w
KD Z in 1/) <r LL
70
60
W
40
30
20
10
0
5" l " 3/4" 3/8" 10 20 40 60 100 200 ASTH SIEVES ^ r r . n f f ■■■4'~|—lgfr
1 0 0 10 1 0 1 0 0 1 G R A I N D I A M E T E R CmrrO
0 0 0 1
00 90 80 70 60 50 40 30 20 10 0
z LU
LU LT_ i n
Gr
—i 0 CD >
i n
1 1
DEPTH Cm)
f rom
16.00
to
1800
i n LU
1
0
LU
<r an ID
<r i n
2
z, l
~ in<E
2g
98
_ i i n
4«
><r <—>
93*
Deo [mm]
53E12*
D 5 0 [mm]
1 IEI4«
D30 [mm]
43E20*
D i o [mm]
!BE025*
Cu
30E+I3
Cc
20E03
NOTES: * : OBTAINED BY EXTRAPOLATION OF EXPERIMENTAL DATA Grl ; LAB.REF;38/96
R E V -
0
DATE OPERATOR
SHAFIQ 5 U P E R U I S 0 R
M.JAMIL
CLIENT: PROJECT: SITE: BOREHOLE: SPECIMEN: DEPTH Cm: TEST DATE
SOILCON SOIL MECHANICS LABORATORY
GRAIN SIZE ANALYSIS (ASTM D 422)
PCRUR/PINSTECH STUDY OF SEEPAGE JHANG BRANCH CANAL
: S A M P L E : j - 1 9 : 1 T Y P E : DISTURBED
19 -00 - 2 0 - 0 0 l l - 0 8 - 9 9
C O B B L E S G R A U E L S A N D 5Z M I
S I L T C L A Y
Z in in <r D.
100
90
80 t-
70
60
50
40
30
20
10
0 -L J_ 0 0 10 1 0 - 1
G R A I N D I A M E T E R CmrrO O - O I O-OOI
100
90
80
70
60
50
40
30
20
10
0
z LU
(_J LU Q_ i n Gr
O QQ
>-i n
1 i
DEPTH Cm)
from
19-00
t o
20-00
i n LU _ l CO CD
—1 LU z> <r a: i s
2
z <r i n
23
. P
AS
SIN
G!
/■20
0 A
5TM
|
75
_ i i n
48*
>-<r
27*
Deo [mm]
3-2E-02*
D50 [mm]
1-8E-02i
D 3 0
[mm]
6-OE-03*
D,o [mm]
2-0E-003*
Cu
1-6E+0I
Cc
5-7E-0I
NOTES:
* : OBTAINED BY EXTRAPOLATION OF EXPERIMENTAL DATA Gri; LAB-REF;38/96

R E U -
0
DATE OPERATOR SHAFIQ
SUPERVISOR M.JAMIL
CLIENT; PROJECT: SITE: BOREHOLE: SPECIMEN: DEPTH Cm: TEST DATE
SOILCON SOIL MECHANICS LABORATORY
GRAIN SIZE ANALYSIS (ASTM D 422)
PCRUR/PINSTECH STUDY OF SEEPAGE JHANG BRANCH CANAL
S A M P L E : J - 2 I 1 T Y P E : DISTURBED
2 1 - 0 0 - 2 2 - 0 0 1 1 - 0 8 . 9 9
C O B B L E S G R A U E L S A N D M
S I L T C L A Y
>.
100
90
80
70
o 2 in in <E (L
60
hO
40
30
20
10
0
1.5"
100
3/4- 3/e- 4 10 iTT—. 1 -
40 60 100 200 ASTn SIEVES -1— U
1 0-1 0-01 GRAIN DIAMETER CmnO
0 - 0 0 1
00
90
80
70
60
50
40
30
20
10
0
z LU
LU CL in Gr
_ l o QD
>-in
i I
DEPTH Cm)
from
21 -00
to
22-00
i n LU
o
_ i LU <r 13
i n
74
., P
AS
SIN
G!
'■200
AST
MJ
26
i—
tn
26*
>-<r _ i Deo
[mm]
1 -2E-01
D50 [mm]
I-1E-01
D30 [mm]
7-8E-02
Dio [mm]
5-BE-002*
Cu
2-1E+00
Cc
8.6E-01
NOTES:
* : OBTAINED BY EXTRAPOLATION OF EXPERIMENTAL DATA Grl ; LAB.REF;38/96

REU
Q DATE OPERATOR
SHAFIQ SUPERUISOR M.JAMIL
CLIENT; PROJECT: SITE: BOREHOLE: SPECIMEN: DEPTH Cm::
SOILCON SOIL MECHANICS LABORATORY
GRAIN SIZE ANALYSIS (ASTM D 422)
PCRUR/PINSTECH STUDY OF SEEPAGE JHANG BRANCH CANAL
SAMPLE : j 2 5 : 1 T Y P E : DISTURBED
2500 2600 TEST D A T E : i i .0899
COBBLES GRAUEL SAND M
S I L T CLAY
100
90
80
^ 70
I .5" 1" 3/4" 3/8" 20
60 ID Z
8 50
<r 40
30
20
10
0 IOO
40 60 100 200 ASTH SIEVES »■ ■ I ...,,-L
_Li 1 0-1 0-01
GRAIN DIAMETER CmnO
_L 0-001
00 90 80 70 60 50 40 30 20 10 0
2 LU
U J lai n
Gr
_ I o QQ
>i n
1 1
DEPTH Cm)
from
2500
to
26.00
i n LU _ i CO
_ i LU
<r 1=1
<E i n
71
z *— . . i n tnCE
2g
29
_ i i n
29*
><E _ l Deo
[mm]
1 1E01
D50 [mm]
97E02
D30 [mm]
75E02
Dio [mm]
5.8E002*
Cu
19E+00
Cc
8.8E0I
NOTES:
* ; OBTAINED BY EXTRAPOLATION OF EXPERIMENTAL DATA Gri: LAB-REF:38/96
R E U -
0
DATE OPERATOR SHAFIQ
S U P E R V I S O R M.JAMIL
CLIENT : PROJECT: SITE: BOREHOLE: SPECIMEN: DEPTH Cm3 TEST DATE
SOILCON SOIL MECHANICS LABORATORY
GRAIN S I Z E ANALYSIS (ASTM D 422)
PCRUR/PINSTECH STUDY OF SEEPAGE JHANG BRANCH CANAL
; S A M P L E : j - 2 9 : i T Y P E : DISTURBED
29-00 - 30-00 1-08.99
C O B B L E S G R A U E L SAND M
S I L T C L A Y
100
90
80
70 F-
o -z in U) <E CL
60
50
40
30
20
10
0 -lul
1-5" 1" 3/4" 3/8" ■■■■■■■ i W r
10 20 -plTT
OO 200 A5TH SIEVES
100 1 0-1 GRAIN DIAMETER CmmD
O-OI J_
O-OOI
100 90
80 70 60 50 40 30 20 10 0
LU
<_> LU Ci-i n
Gr
o CO >-t n
1 1
DEPTH Cm)
from
29-00
t o
30-00
i n LU
i en CO o
1 LU r> a:
z <r i n
94
2 g
6
i—
In
6*
>-<r _ i Deo
[mm]
1-9E-01
D50 [mm]
1-7E-01
D30 [mm]
1-4E-Q1
D i o [mm]
8-2E-02
Cu
2-3E+00
Cc
l-2E+00
NOTES: * : OBTAINED BY EXTRAPOLATION OF EXPERIMENTAL DATA Grl: LAB-REF:38/96

Appendix-II
Results of soil texture at Rakh Branch canal

SOILCON
REU. 0
DATE OPERATOR SHAFIQ
SUPERVISOR M.JAMIL
CLIENT: PROJECT: SITE: BOREHOLE: SPECIMEN: DEPTH Cm] TEST DATE
SOIL MECHANICS LABORATORY GRAIN SIZE ANALYSIS
(ASTM D 422) PCRUR/PINSTECH STUDY OF SEEPAGE RAKH BRANCH CANAL
; S A M P L E : R i 1 T Y P E : DISTURBED
1.00 100 1 1 0 8 9 9
C O B B L E S G R A U E L S A N D zz M
S I L T C L A Y
100
90
80
70
60 z. in 50
°- 40
30
20
10
0
5" 1" 3/«" 3/8" r i i i i i r
10 10 60 100 200 ASTM SIEUES
IOO 10 1 0-1 GRAIN DIAMETER Cmm3
0 0 1 J_
0 0 0 1
00
90
80
- 70
- 60
-. 50
- 40
- 30
: 20
10
0
LU
l_J LU Q_ i n
Gr
^ l a □o >
t 1
DEPTH Cm)
from
1 oc
t o
1.00
i n LU J ca CO a
LU
a: z <E i n
27
St tn<t
73
In
73*
>< i _ J i_> D6o
[mm]
50E02»
D50 [mm]
36E02»
D 3 0 [mm]
19E02"
Dio [mm]
1 .OE002*
Cu
4.8E*00
Cc
7.3E01
NOTES:
* : OBTAINED BY EXTRAPOLATION OF EXPERIMENTAL DATA G r i ; LABREF:38/96
PROJECT: STUDY OF SEEPAGE LOSSES FROM IRRIGATION CANALS
REU
0
DATE OPERATOR SHAFIQUE
SUPERUISOR M JAMIL
CLIENT; PROJECT: SITE: BOREHOLE: SPECIMEN: DEPTH Cm: TEST DATE
SOILCON SOIL MECHANICS LABORATORY
GRAIN SIZE ANALYSIS (ASTM D-422)
PCRUR/PINSTECH STUDY OF SEEPAGE RAKH BRANCH CANAL
S A M P L E : R5 ; 1 T Y P E : DISTURBED
5 0 0 5 0 0 1 I 0 8 9 9
C O B B L E S G R A U E L S A N D
j3Z M S I L T C L A Y
100
90
80
70 i?
60
1-5" 3/4" 3/B"
ID Z
s 50 a 40
30
20
10
0 i . ,
.' . ' J.
i . . ■
10 I
20 40 60 100 200 ASTM SIEVES H =c
I . . . ■ I 1 0 0 1 0 1 0 0 1
G R A I N D I A M E T E R CmmD 0 0 0 1
00
90 80 70 60 50 40 30 20 10 0
z LU
LU Q_ en
Gr
CD CO E: >t n
1 1
DEPTH Cm)
f rom
500
to
500
i n LU
i CO CO . o
_ ] LU
U1
29
, P
AS
SIN
G
1-20
0 A
ST
M
71
i— _ i on
71*
>-<r _ i <_i Deo
[mm]
53E02*
&50 [mm]
40E02*
D30 [mm]
22E02*
Dio [mm]
12E002«
Cu
43E+Q0
Cc
75E01
NOTES: * ; OBTAINED BY EXTRAPOLATION OF EXPERIMENTAL DATA Grl : LAB-REF;38/96

REU-
0 DATE OPERATOR
SHAFIQ SUPERVISOR M.JAMIL
CLIENT; PROJECT: SITE: BOREHOLE: SPECIMEN: DEPTH Cm: TEST DATE
50ILC0N SOIL MECHANICS LABORATORY
GRAIN SIZE ANALYSIS (ASTM D 422)
PCRUR/PINSTECH STUDY OF SEEPAGE RAKH BRANCH CANAL
; S A M P L E : R-9 : I T Y P E : DISTURBED
9 - 0 0 - 1 I -00 11 - 0 6 - 9 9
C O B B L E S G R A U E L S A N D S~L M
S I L T CLAY
>^
Z
<r a.
100
90
80
70
60
en 50
40
30
20
10
0
1.5" I " 3/4" 3/8" ■ ■' ■ '
20 10 60 100 200 ASTM SIEVES
100
l I'I i ■ i ■■ I. ■ I _1_
■Lu.,1.1. 10 1 0 - 1 0 - 0 1
G R A I N D I A M E T E R Cmm)
_L O-OOl
ilOO
\ 90
- 80
: 70
- 60
- 50
- 40
\ 30
\ 20
\ 10
J 0
z LU
LJ LU Q_ t n
6r
_ l o CO >-i n
1 1
DEPTH (m)
f rom
9-00
t o
11-00
t n LU _ i ca co
_ i LU <x a:
23
z t n
27
— t n
a. °
50
_ i
18*
>-<r _ i
32*
Deo [mm]
1-9E-01
D 5 0 [mm]
7-2E-Q2*
D30 [mm]
3-5E-03*
D.o [mm]
1-7E-0011
Cu
l-IE+03
Cc
3-7E-0I
NOTES:
* : OBTAINED BY EXTRAPOLATION OF EXPERIMENTAL DATA G r i : LAB-REF;38/96

RELJ-0
DATE OPERATOR SHAFIQ
SUPERUI50R M.JAMIL
CLIENT: PROJECT; SITE: BOREHOLE: SPECIMEN: DEPTH Cm:
SOILCON SOIL MECHANICS LABORATORY
GRAIN SIZE ANALYSIS (ASTM D 422)
PCRUR/PINSTECH STUDY OF SEEPAGE RAKH BRANCH CANAL
; S A M P L E : R-13 I 1 T Y P E : DISTURBED
13-00 - 13-00 TEST DATE: i | -08-99
COBBLES GRAUEL SAND M
SILT CLAY
1.5" 1" 3/<" 3/8 40 60 100 200 ASTM SIEVES
1 0-1 GRAIN DIAMETER Cmmj
0 - 0 1 0 - 0 0 1
z L U
L J L U Cli n
Gr
_ i
CO
>-i n
1 1
DEPTH Cm)
from
13-00
to
13-00
i n L U _ i CO CO CD (_)
_ l LU :> <r CC
A
O z <r i n
B4
z1— — i n
^ R
12
i—
i n
12*
>-_ J LJ
Deo [mm]
2-0E-01
D50 [mro]
1-8E-01
D30 [mm]
I-4E-0I
Dio [mm]
S.9E-002i
Cu
2-8E+00
Cc
I.4E+00
NOTES:
* \ OBTAINED BY EXTRAPOLATION OF EXPERIMENTAL DATA GH ; LAB.REF;38/96

REU-0
DATE OPERATOR SHAFIQ
SUPERUISOR M.JAMIL
CLIENT: PROJECT: SITE: BOREHOLE: SPECIMEN; DEPTH CmD TEST DATE
SOILCON SOIL MECHANICS LABORATORY
GRAIN SIZE ANALYSIS (ASTM D 422)
PCRUR/PINSTECH STUDY OF SEEPAGE RAKH BRANCH
; S A M P L E : R - ) 5 : 1 T Y P E : DISTURBED
1 5 - 0 0 - 1 5 - 0 0 1 . 0 8 - 9 9
C O B B L E S G R A U E L S A N D M
S I L T C L A Y
40 60 100 200 ASTM SIEVES
0 - 1 G R A I N D I A M E T E R Cmmj
0 - 0 1 0 - 0 0 1
z LU
L J L U CL. i n
Gr
CD CO
>-i n
1 1
DEPTH Cm)
f r om
15-00
t o
15-00
i n LU
i CO CO
o LJ
LU z> <L ce LD
z <r i n
91
; f ; m m-cc S o
9
i— _ i t n
9*
>-<r _ i L J DGO
[mm]
I-9E-01
Dso [mm]
I.7E-01
D30 [mm]
I-3E-01
D.o [mm]
7-6E-02
Cu
2-5E+00
Cc
' 1 .2E+00
NOTES:
* : OBTAINED BY EXTRAPOLATION OF EXPERIMENTAL DATA G r l : LAB.REF:38/96

REU-
0 DATE OPERATOR
SHAFIQ SUPERVISOR M.JAMlL
CLIENT; PROJECT; SITE: BOREHOLE: SPECIMEN: DEPTH Cm] TEST DATE
SOILCON SOIL MECHANICS LABORATORY
GRAIN SIZE ANALYSIS (ASTM D 422)
PCRUR/PINSTECH STUDY OF SEEPAGE RAKH BRANCH CANAL
S A M P L E : R-19 1 T Y P E : DISTURBED
1 9 . 0 0 - 2 0 - 0 0 I 1 - 0 8 - 9 9
C O B B L E S G R A U E L S A N D
JTI M S I L T C L A Y
O- 1 G R A I N D I A M E T E R Cmmj
0 - 0 1 0 - 0 0 1
z LU
L J LU □_ i n
Gr
a co >-i n
i I
DEPTH Cm)
f rom
19-00
t o
20-00
i n LU _ i CO co o L J
_ J LU
<r LD
<r i n
91
.—.in
£g
6
i— i
i n
6*
>-<r _ i L J Deo
[mm]
2-5E-01
DSO [mm]
2-1E-01
D 3 0 [mm]
1 -4E-01
D,o [mm]
8-2E-02
Cu
3-1E+00
Cc
9- IE-0I
NOTES:
* : OBTAINED BY EXTRAPOLATION OF EXPERIMENTAL DATA G r i ; LAB-REF:38/96

R E V
0
DATE OPERATOR
SHAFIQ SUPERVISOR M JAMIL
CLIENT: PROJECT; SITE: BOREHOLE : SPECIMEN: DEPTH Cmj
SOILCON SOIL MECHANICS LABORATORY
GRAIN SIZE ANALYSIS (ASTM D 422)
PCRUR/PINSTECH STUDY OF SEEPAGE RAKH BRANCH CANAL
S A M P L E : R21 I T Y P E : DISTURBED
21OO 2200 TEST D A T E : | \ 0899
COBBLES GRAUEL SAND M
S I L T CLAY
100
90
80
s 70
LD 60 z in 50 in <E <L 4o
30
20
10
0
.5" r i i
3/4" 3/8" i i
10 40 60 lOO 200 ASTM SIEVES
100 10 1 O-l GRAIN DIAMETER Cmmj
OOI 0 0 0 1
100
90
80
70
60
50
40
30
20
10
0
z LU
L J LU Q_ t n
Gr
o co >m
1 1
DEPTH Cm)
from
21 00
to
2200
i n L U
1 CO CO
o L J
_ l LU :> <r LO
m
97
,. P
AS
SIN
G!
/■20
0 A
STM
J
3
•— _ i
i n
3*
><x _ i I_J Deo
[mm]
31E01
DSO [mro]
26E01
D30 [mm]
22E01
DlO [mm]
16E01
Cu
2OE+00
Cc
96E0I
NOTES:
» : OBTAINED BY EXTRAPOLATION OF EXPERIMENTAL DATA Grl: LAB-REF:38/96

REU-0
DATE OPERATOR
SHAFIO SUPERUISOR
M.JAMII
CLIENT; PROJECT: SITE: BOREHOLE: SPECIMEN: DEPTH Cm} TEST DATE
SOILCON SOIL MECHANICS LABORATORY
GRAIN SIZE ANALYSIS (ASTM D 422)
PCRUR/PINTECH STUDY QF SEEPAGE RAKH BRANCH CANAL
: S A M P L E : R-23 : 1 T Y P E : DISTURBED
2 3 - 0 0 - 2 4 - 0 0 1 1 - 0 8 - 9 9
C O B B L E S l G R A U E L S A N D J T I M
S I L T C L A Y
CD Z
in in a o.
40 60 100 200 ASTM SIEVES
0 - 1 G R A I N D I A M E T E R Ci
0 - 0 1 0 - 0 0 1
z LU !£ LJ LU Q_ i n Gr
—1 o co >-i n
i I
DEPTH Cm)
from
23-00
to
21-00
i n LU _ i CO CO o LJ
i LU
or L3
z <I in
96
z-± — in tn<r
2g
1
i— _ l i n
4*
>-<r LJ Deo
[mm]
3-2E-0I
Dso [mm]
2-9E-0I
D30 [mm]
2-3E-01
D.o [mm]
l-6E-01
Cu
2-0E+00
Cc
1-0E+00
NOTES:
* : OBTAINED BY EXTRAPOLATION OF EXPERIMENTAL DATA G r l : LAB.REF;38/96

RED
0
DATE OPERATOR SHAFIQ
SUPERUISOR M.JAMIL
CLIENT: PROJECT: SITE: BOREHOLE: SPECIMEN: DEPTH Cm]:
SOILCON 50IL MECHANICS LABORATORY
GRAIN SIZE ANALYSIS (ASTM D 422)
PCRUR/PINSTECH STUDY OF SEEPAGE RAKH BRANCH CANAL
S A M P L E : R27 T Y P E : DISTURBED
2700 2800 TEST D A T E : ■08-99
COBBLES GRAUEL SAND J^Z M
S I L T CLAY
100
90
80
s
o z in U) <L D_
70
60
M)
40
30
20
10
0
3" 1.5" I " 3/4" _L_J
3/B" - 4 l - P -
60 100 200 ASTM SIEVES J — l_
_Li 100 10 1 0 1 OOI
GRAIN DIAMETER Cmm3 OOOI
00
90
80
70
60
50
40
- 30
~. 20
■d 10
0
z LU
LJ LU 0i n
Gr
i CD CO S. >i n
1 1
DEPTH Cm)
f r o m
2700
to
2800
i n L U _ i CO CO CD L J
_ 1 L U 1>
ai LD
z <r i n
97
z\^ ™ i n
S o
3
i—
i n
3*
>-<r _ i LJ Deo
[mm]
35E01
Dso [mm]
32E01
D3o [mm]
26E0I
Dio [mm]
I.7E01
Cu
21E+00
Cc
12E+00
NOTES:
* ; OBTAINED BY EXTRAPOLATION OF EXPERIMENTAL DATA Gri: LAB-REF;38/96
REU-
0 DATE OPERATOR
SHAFIQ SUPERVISOR
M.JAMIL CLIENT: PROJECT: SITE: BOREHOLE: SPECIMEN: DEPTH Cml;
SOILCON SOIL MECHANICS LABORATORY
GRAIN SIZE ANALYSIS (ASTM D 422)
PCRUR/PINSTECH STUDY OF SEEPAGE RAKH BRANCH CANAL
; S A M P L E : R-31 : 1 T Y P E : DISTURBED
31 -00 - 3 2 - 0 0 T E S T D A T E : n . 0 8 - 9 9
C O B B L E S G R A U E L S A N D J 3 Z M
S I L T C L A Y
0 - 1 G R A I N D I A M E T E R Cmm)
0 - 0 1 0 - 0 0 1
LU x: LJ LU Q-m Gr
- J O CO
>-i n
1 1
DEPTH Cm)
f rom
31.00
t o
32-00
i n LU _ i CO CO
o LJ
_J LU Z> <r C£ L3
o <r t n
90
L3 E
S i n
2g 10
i— _ i i n
I0«
>-<r _ i Deo
[mm]
1-6E-01
Dso [mm]
1 .4E-0I
D30 [mm]
1-0E-01
Dio [mm]
7.1E-02
Cu
2-2E+00
Cc
8.7E-01
NOTES:
* : OBTAINED BY EXTRAPOLATION OF EXPERIMENTAL DATA G r l ; LAB-REF:38/96

REU-
0 DATE OPERATOR
SHAFIQ SUPERVISOR M.JAMIL
CLIENT: PROJECT: SITE: BOREHOLE: S P E C I M E N : DEPTH Cm: TEST DATE
SOILCON SOIL MECHANICS LABORATORY
GRAIN SIZE ANALYSIS (ASTM D 422)
PCRUR/PINSTECH STUDY OF SEEPAGE RAKH BRANCH CANAL
; S A M P L E : R-35 : 1 T Y P E : DISTURBED
35-00 - 36-00 1-08-99
COBBLES GRAUEL SAND M I SILT CLAY 20 40 GO 100 200 ASTM SIEVES
-J, _ 1 _ l_
1 0-1 GRAIN DIAMETER Cmm3
0-01 0-001
z LU 2E
L J LU Q_ t n
Gr
O CO :E >-i n
1 1
DEPTH Cm)
f rom
35-00
t o
36-00
i n L U _ i CO CO L J
LU
<E
LO
O Z <L
m
93
. P
AS
SIN
GI
'■200
AS
Tfvj
7
i— _ i i n
7*
>-<r _ i LJ Deo
[mm]
2-0E-01
Dso [mm]
1-8E-01
D 3 0 [mm]
1-4E-0I
Dio [mm]
a-OE-02
Cu
2-5E+00
Cc
1-2E+00
NOTES:
* ; OBTAINED BY EXTRAPOLATION OF EXPERIMENTAL DATA G r l ; LAB.REF:38/96

Appendix-III
Photograph of various activities
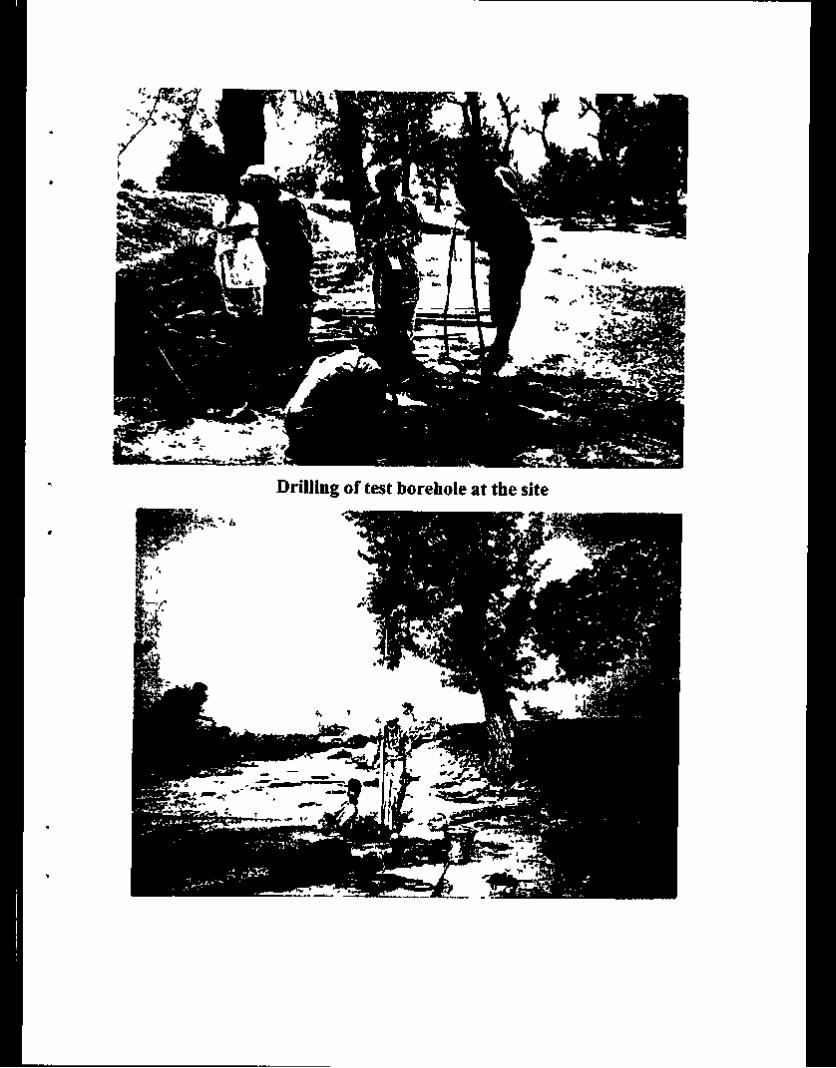
Drilling of test borehole at the site

*w TilSW
Percussion drilling of 10 inches dia for experimental wells (not the same site)

A view of Rakh Branch Canal
Cleaning of experimental well by injector pump
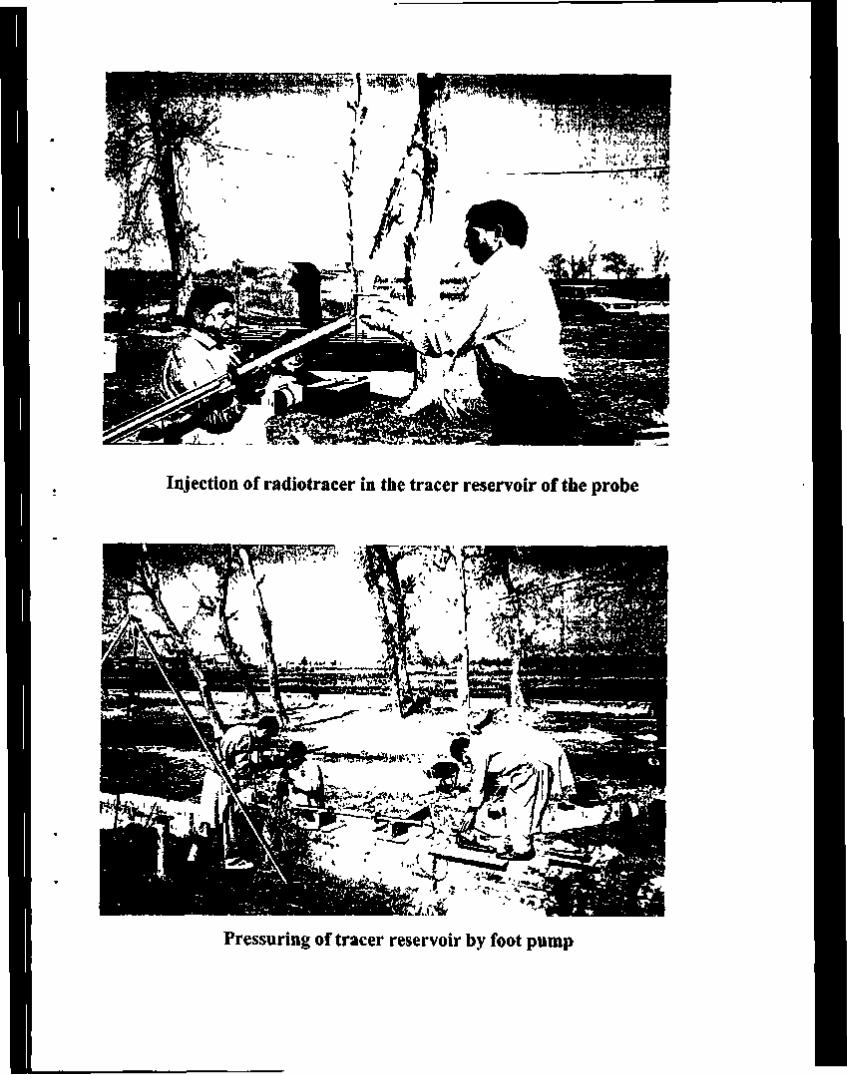
Injection of radiotracer in the tracer reservoir of the probe
Pressuring of tracer reservoir by foot pump
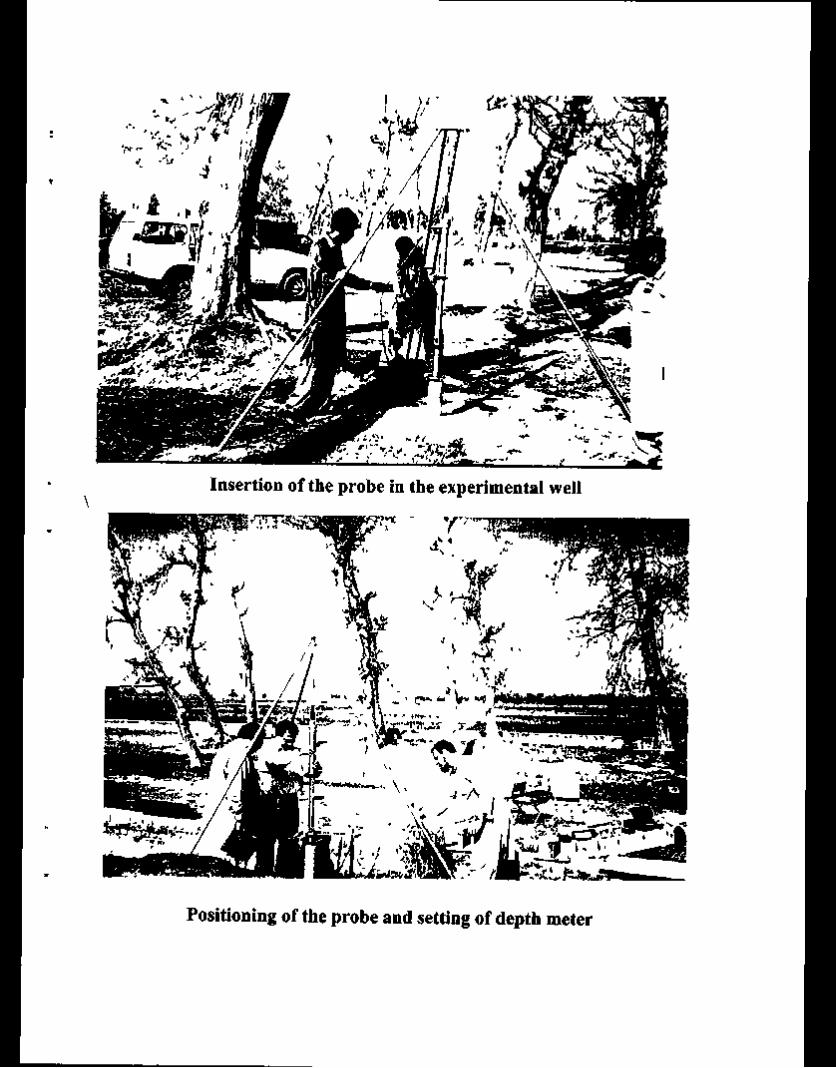
Insertion of the probe in the experimental well
Positioning of the probe and setting of depth meter
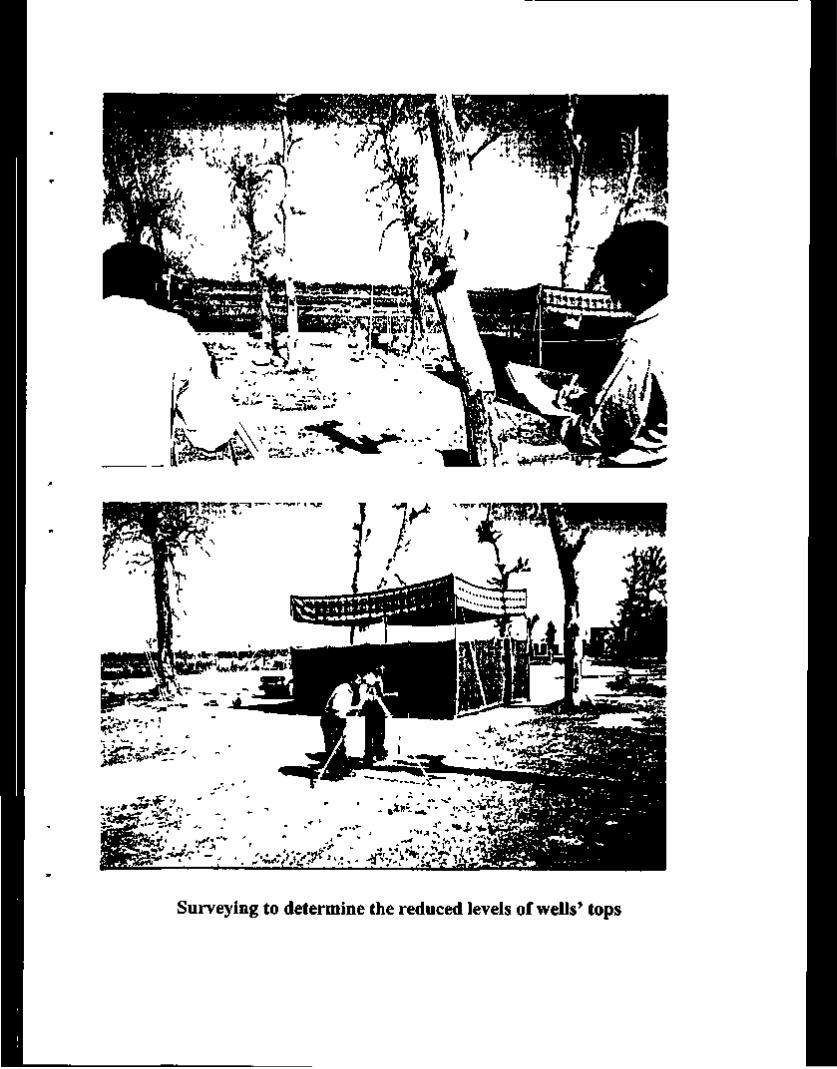
Surveying to determine the reduced levels of wells' tops
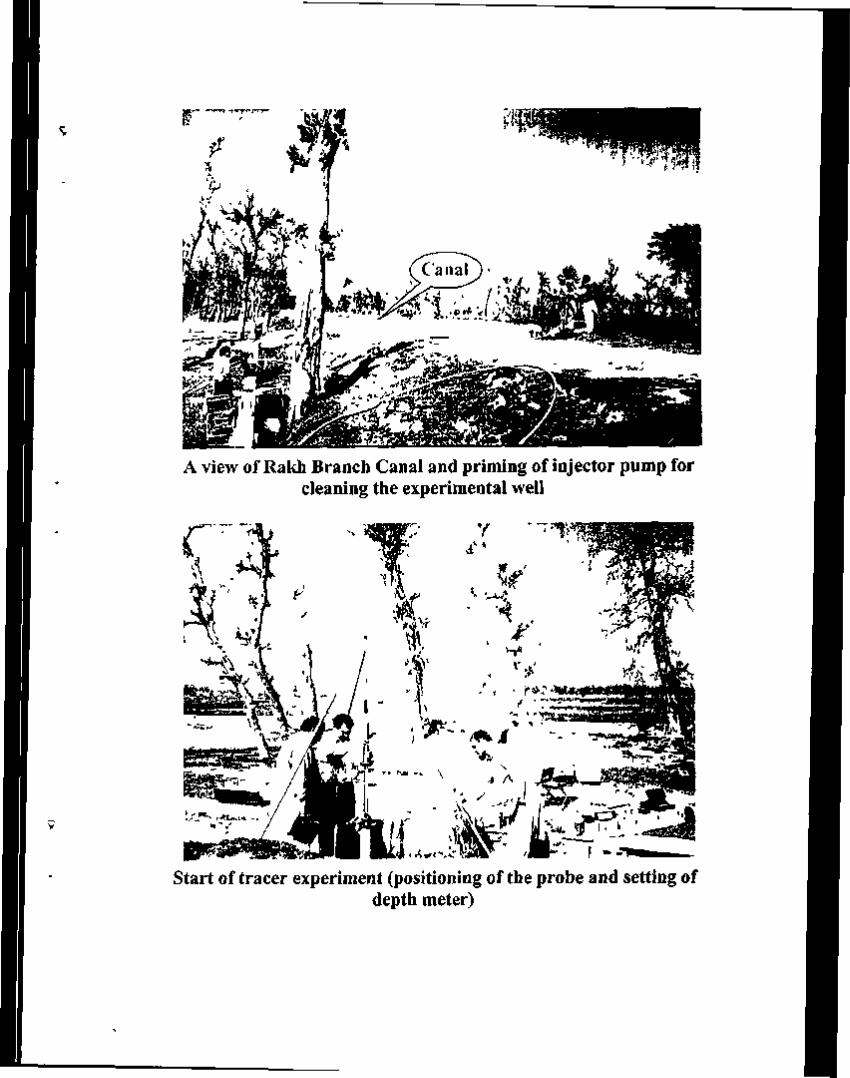
A view of Rakh Branch Canal and priming of injector pump for cleaning the experimental well
Start of tracer experiment (positioning of the probe and setting of depth meter)
Surface electronics: control unit, data logger, printer, computer, etc.
Demonstration of the tracer experiment to the foreign participations of IAEA Training Course on Isotope Hydrology