study of mechanical properties of pva fiber-reinforced
TRANSCRIPT

Western Kentucky UniversityTopSCHOLAR®
Masters Theses & Specialist Projects Graduate School
5-2015
Study of Mechanical Properties of PVA Fiber-Reinforced Concrete With Raman SpectroscopicAnalysisRamyasree AnnamWestern Kentucky University, [email protected]
Follow this and additional works at: http://digitalcommons.wku.edu/theses
Part of the Inorganic Chemistry Commons, Materials Chemistry Commons, and the PolymerChemistry Commons
This Thesis is brought to you for free and open access by TopSCHOLAR®. It has been accepted for inclusion in Masters Theses & Specialist Projects byan authorized administrator of TopSCHOLAR®. For more information, please contact [email protected].
Recommended CitationAnnam, Ramyasree, "Study of Mechanical Properties of PVA Fiber-Reinforced Concrete With Raman Spectroscopic Analysis" (2015).Masters Theses & Specialist Projects. Paper 1460.http://digitalcommons.wku.edu/theses/1460

STUDY OF MECHANICAL PROPERTIES OF PVA FIBER-REINFORCED
CONCRETE WITH RAMAN SPECTROSCOPIC ANALYSIS
A Thesis
Presented to
The Faculty of the Department of Chemistry
Western Kentucky University
Bowling Green, Kentucky
In Partial Fulfillment
Of the Requirements for the Degree
Master of Science
By
Ramyasree Annam
May 2015


iii
ACKNOWLEDGEMENTS
I would like to thank my advisor, Dr. Cathleen Webb, for extending her full-
fledged support. Without her supervision and constant help, nothing would have been
possible. I would like to thank Dr. Shane Palmquist, my co-advisor, who never ceased in
helping in my research work. His help has been invaluable to the progress of my
education and the construction of this thesis. I would like to thank Dr. Celestian, my
thesis committee member, for guiding me and giving useful suggestions throughout my
research. I am grateful to Dr. Edward Kintzel for helping me out with Large Chamber
SEM. I would like to thank Dr. Bangbo Yan for being in my committee. I would also like
to thank the entire Chemistry Department for their support during my studies.
My parents, Ganesh Reddy and Pramila, receive my deepest gratitude and love for
their encouragement and support throughout my journey. I would like to thank them for
inculcating in me the discipline and dedication for my work. I consider myself the
luckiest daughter in the world to have such wonderful parents. I would like to thank my
fiancée, Ankur, for all his love and support and being there for me all the time. I would
also like to thank my friends for their moral support and motivation because they have
always been there and extended their helping hands without fail.
Finally, I thank the Almighty for giving me the strength and patience to work
through all these years.

iv
LIST OF CONTENTS
CHAPTER 1:INTRODUCTION ..................................................................................... 1 Mechanical properties of concrete ...................................................................................... 4 PVA fibers .......................................................................................................................... 7 Carbon microfibers ............................................................................................................. 8 Carbon nanofibers and nanotubes ..................................................................................... 12
Carbon microfiber/Carbon nanotubes reinforced concrete ............................................... 14 Raman Spectroscopy ......................................................................................................... 14
CHAPTER 2:EXPERIMENTAL METHODS............................................................. 17 Compressive strength and Split tensile strength testing ................................................... 17
Crack formation and Propagation ..................................................................................... 19
Effect of moisture on PVA fibers ..................................................................................... 20 Effect of applied stress on the PVA fiber ......................................................................... 21
CHAPTER 3:RESULTS AND DISCUSSION ............................................................. 24 Compressive strength of baseline concrete cubes ............................................................. 25
Compressive strength of concrete cubes with fibers......................................................... 25 Split tensile strength of baseline concrete cubes............................................................... 27
Split tensile strength of concrete cubes with fibers .......................................................... 27 Effect of moisture on the PVA fibers ............................................................................... 28 Crack formation and Propagation ..................................................................................... 29
Effect of the applied stress on the PVA fiber ................................................................... 31
CHAPTER 4:CONCLUSIONS ..................................................................................... 34
PERSPECTIVE............................................................................................................... 35
APPENDIX ...................................................................................................................... 36
REFERENCES ................................................................................................................ 40

v
LIST OF TABLES
Table 1. Chemical composition of type III ordinary portland cement. .............................. 3
Table 2. Chemical composition of silica fume. ................................................................ 11
Table 3. Mix design of baseline concrete cubes............................................................... 17
Table 4. Mix design of concrete cubes with fibers. ......................................................... 19
Table 5. Relative humidities of different salt solutions at room temperature. ................. 21
Table 6. Compressive strength test results of baseline concrete cubes on Day 1, 3, 7, 14,
21 and 28. .......................................................................................................................... 36
Table 7. Compressive strength test results of concrete cubes with fibers on Day 1, 3, 7,
14, 21, and 28. ................................................................................................................... 37
Table 8. Split tensile strength test results of baseline concrete cubes on Day 1, 3, 7, 14,
21, and 28. ......................................................................................................................... 38
Table 9. Split tensile strength test results of concrete cubes with fibers on Day 1, 3, 7, 14,
21, and 28. ......................................................................................................................... 39

vi
LIST OF FIGURES
Figure 1. Microstructural image of concrete showing C-S-H gel ...................................... 4
Figure 2. KURALON® ultra high performance nycon PVA fibers .................................. 8
Figure 3. Microstructure of PAN carbon fibers ................................................................. 8
Figure 4. Carbon fiber synthesis process ......................................................................... 10
Figure 5. TEM and SEM images of different structural forms of carbon nanofibers ...... 12
Figure 6. Types of CNTs.................................................................................................. 13
Figure 7. Thermo scientific DXR Raman microscope ..................................................... 15
Figure 8. Energy level diagram showing different scattering states ................................ 16
Figure 9. Incorporation of PVA fibers into concrete ....................................................... 18
Figure 10. Large chamber scanning electron microscope at WKU NOVA Center ......... 20
Figure 11. Fiber glued to the carbide jaws of the micrometer ......................................... 22
Figure 12. Nikon optical microscope ............................................................................... 23
Figure 13. Testing of concrete cube under compression ................................................. 24
Figure 14. Compressive strength of baseline concrete cubes at various ages .................. 25
Figure 15. Compressive strength of concrete cubes with fibers at various ages ............. 26
Figure 16. Split tensile strength test showing the vertical crack in the cube ................... 26
Figure 17. Split tensile strength of baseline concrete cubes at various ages ................... 27
Figure 18. Split tensile strength of concrete cubes with fibers at various ages ............... 28
Figure 19. Raman spectra of the PVA fibers in different salt solutions .......................... 29
Figure 20. SEM images showing the fibers bridging the crack ....................................... 30
Figure 21. Raman spectra of the PVA fiber under stress ................................................. 31
Figure 22. Schematic diagram of PVA fiber showing the optic axis and optic normal....33
vii
Figure 23. Optical microscope images of the PVA fiber under stress. A) Fiber is in red
color before it was pulled B) Fiber is in green color when it was pulled ......................... 34

viii
LIST OF ABBREVIATIONS
C3A - Tricalcium Aluminate
CF - Carbon Microfibers
CNFs - Carbon Nanofibers
CNTs - Carbon Nanotubes
C-S-H - Calcium Silicate Hydrate Gel
C3S - Tricalcium Silicate
C2S - Dicalcium Silicate
MWCNTs - Multi Walled Carbon Nanotubes
OPC - Ordinary Portland Cement
PAN - Polyacrylonitrile
PVA - Polyvinyl alcohol
SEM - Scanning Electron Microscope
SWCNTs - Single Walled Carbon Nanotubes
TEM - Transmission Electron Microscope
W/C - Water to Cement ratio

ix
STUDY OF MECHANICAL PROPERTIES OF PVA FIBER-REINFORCED
CONCRETE WITH RAMAN SPECTROSCOPIC ANALYSIS
Ramyasree Annam May 2015 43 Pages
Directed By: Cathleen Webb, Shane Palmquist, Bangbo Yan, and Aaron Celestian
Department of Chemistry Western Kentucky University
The brittleness of concrete has always been a safety and economic issue of great
concern. The low tensile strength of concrete is the cause of its intrinsic brittle nature.
This is critical considering the amount of concrete used for the construction of highways,
buildings, and other facilities. The mechanical properties of concrete must be improved to
provide upgraded construction. Crack resistant and durable concrete has always been a
major goal for engineers.
Many approaches have been tried to make concrete a better construction material.
Fiber reinforcement is an approach which has been shown to improve the quality and
durability of concrete. The focus of this research is to develop a mix design of fiber
reinforced concrete and then test these materials for both compressive and tensile strength
after casting into cubes. The effect of polyvinyl alcohol fibers on the mechanical
properties of concrete was also studied. The impacts of moisture and the stress applied on
the fibers were determined using Raman spectroscopy.

1
CHAPTER 1
INTRODUCTION
Concrete is one of the most widely used construction materials in the world. It is
composed of Portland cement and water along with aggregates such as sand, gravel, or
crushed stone. Concrete typically has a compressive strength of 70 to 350 megapascals
(White, 2006). Concrete is a relatively brittle material. The compressive strength of
concrete is eight times more than its tensile strength (Alawode and Idowu, 2011). On
impact of a heavy load, concrete is susceptible to cracking.
The two main properties which determine the quality of concrete are strength and
durability. An indicator which is considered to be significant in determining the strength
of concrete is the water to cement ratio (w/c) which is the ratio of water absorbed by
aggregates (sand, gravel, or crushed stone) to the amount of cement present in the
concrete mixture. The higher the w/c ratio, the higher the hydration rate (Lin and Meyer,
2009). High strength and low workability are the result of low w/c (Arum and Olotuah,
2006).
The water to cement ratio also has an effect on hydration kinetics. The spacing
between the cement particles plays an important role in determining the strength of
concrete. The smaller the distance between the particles, the stronger is the bond between
the hydrates and cement particles and, in turn, the concrete is stronger. Cement hydration
is a factor that has a high impact on the performance of concrete. Therefore, a complete
knowledge of cement hydration reactions is valuable for improving the quality of
concrete. Cement hydration involves critical chemical processes including dissolution,
dissociation, nucleation, adsorption, growth, complexation, or/and diffusion (Bullard etal,
2011).

2
The major component of ordinary portland cement (OPC) is tricalcium silicate,
symbolized by C3S. It is about 50-70% of the total composition of cement. The primary
product formed in the hydration reaction is calcium silicate hydrate gel (C-S-H). C3S
plays a major role in the formation of C-S-H. Therefore, the hydration characteristics of
C3S are considered to be more important compared to the other components present in
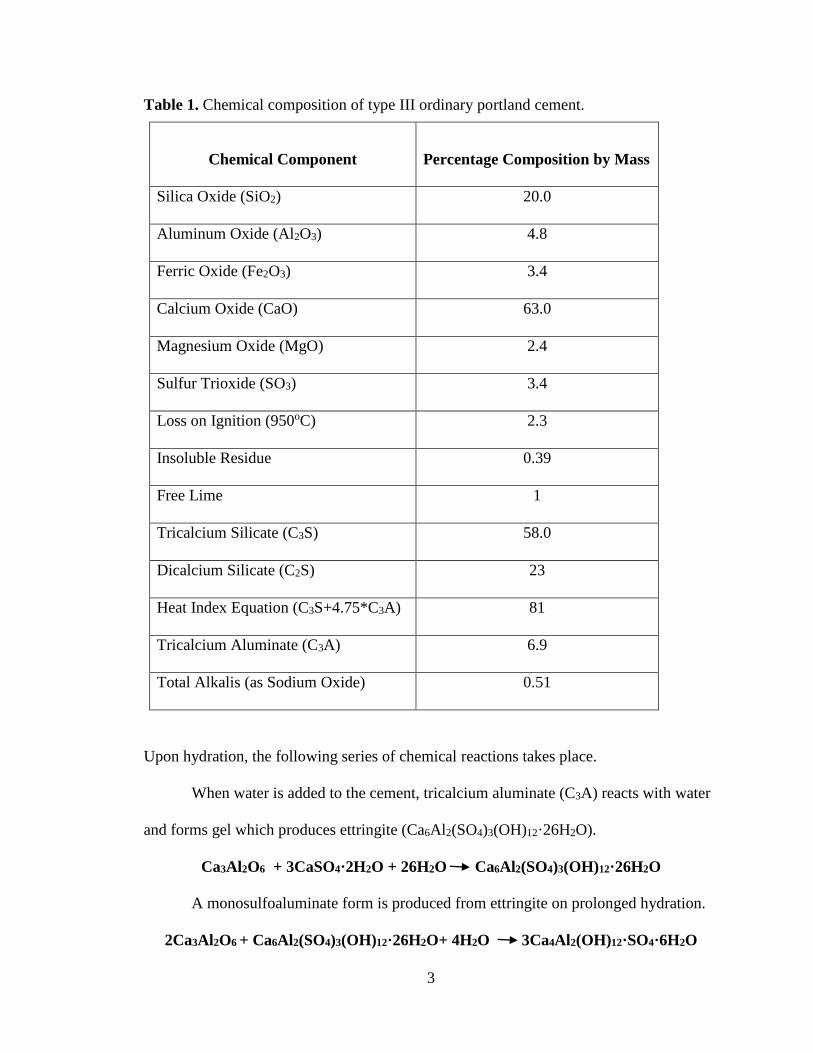
OPC (Chakraborty et al, 2013). Table 1 provides the full chemical composition of type III
ordinary portland cement.
3
Table 1. Chemical composition of type III ordinary portland cement.
Chemical Component Percentage Composition by Mass
Silica Oxide (SiO2) 20.0
Aluminum Oxide (Al2O3) 4.8
Ferric Oxide (Fe2O3) 3.4
Calcium Oxide (CaO) 63.0
Magnesium Oxide (MgO) 2.4
Sulfur Trioxide (SO3) 3.4
Loss on Ignition (950oC) 2.3
Insoluble Residue 0.39
Free Lime 1
Tricalcium Silicate (C3S) 58.0
Dicalcium Silicate (C2S) 23
Heat Index Equation (C3S+4.75*C3A) 81
Tricalcium Aluminate (C3A) 6.9
Total Alkalis (as Sodium Oxide) 0.51
Upon hydration, the following series of chemical reactions takes place.
When water is added to the cement, tricalcium aluminate (C3A) reacts with water
and forms gel which produces ettringite (Ca6Al2(SO4)3(OH)12·26H2O).
Ca3Al2O6 + 3CaSO4·2H2O + 26H2O Ca6Al2(SO4)3(OH)12·26H2O
A monosulfoaluminate form is produced from ettringite on prolonged hydration.
2Ca3Al2O6 + Ca6Al2(SO4)3(OH)12·26H2O+ 4H2O 3Ca4Al2(OH)12·SO4·6H2O
4
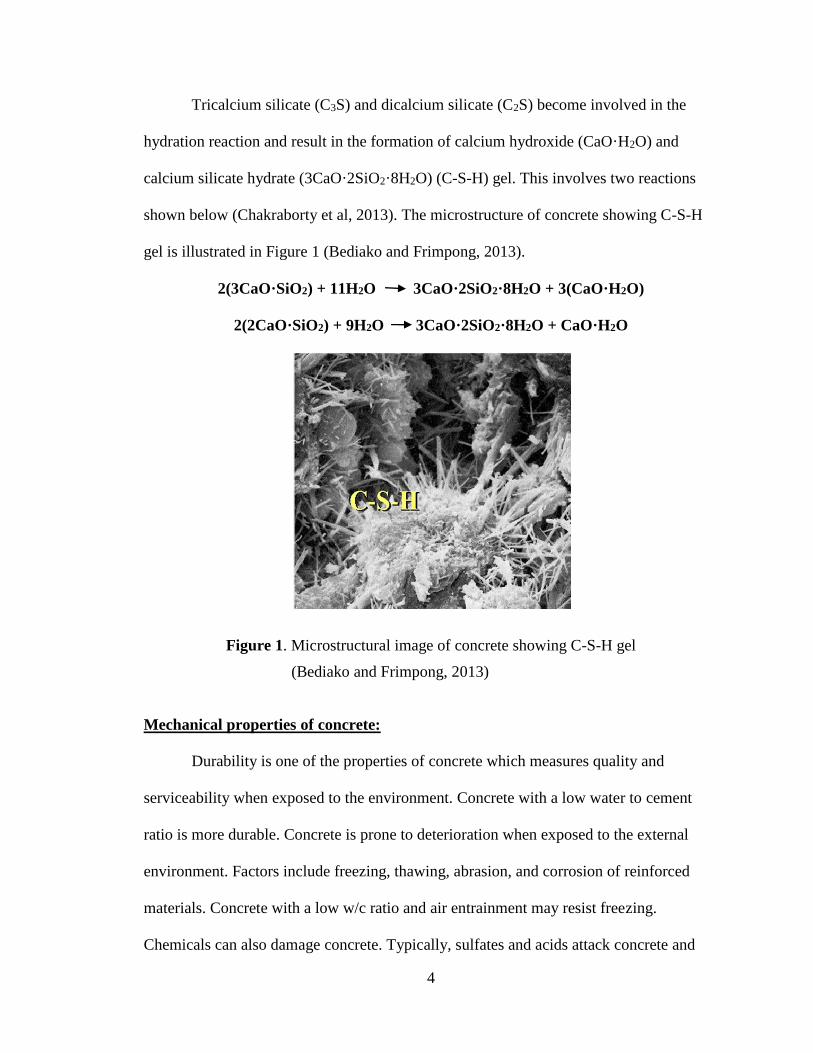
Tricalcium silicate (C3S) and dicalcium silicate (C2S) become involved in the
hydration reaction and result in the formation of calcium hydroxide (CaO·H2O) and
calcium silicate hydrate (3CaO·2SiO2·8H2O) (C-S-H) gel. This involves two reactions
shown below (Chakraborty et al, 2013). The microstructure of concrete showing C-S-H
gel is illustrated in Figure 1 (Bediako and Frimpong, 2013).
2(3CaO·SiO2) + 11H2O 3CaO·2SiO2·8H2O + 3(CaO·H2O)
2(2CaO·SiO2) + 9H2O 3CaO·2SiO2·8H2O + CaO·H2O
Figure 1. Microstructural image of concrete showing C-S-H gel
(Bediako and Frimpong, 2013)
Mechanical properties of concrete:
Durability is one of the properties of concrete which measures quality and
serviceability when exposed to the environment. Concrete with a low water to cement
ratio is more durable. Concrete is prone to deterioration when exposed to the external
environment. Factors include freezing, thawing, abrasion, and corrosion of reinforced
materials. Concrete with a low w/c ratio and air entrainment may resist freezing.
Chemicals can also damage concrete. Typically, sulfates and acids attack concrete and

5
decrease the durability.
The mechanism of sulfate attack involves two reactions. First, sulfates like
magnesium sulfate react with calcium hydroxide which is the product of the hydration
reaction. This results in the formation of gypsum. Gypsum (CaSO4·2H2O) then combines
with tricalcium aluminate (3CaO·Al2O3) and water and gives rise to ettringite
(CaO·Al2O3·3CaSO4·32H2O). The previous reaction is considered to be the main cause
for the deterioration of concrete (Mehta, 1983).
Ca(OH)2 + MgSO4 + 2H2O CaSO4·2H2O + Mg(OH)2
3CaO·Al2O3 + 3(CaSO4·2H2O) + 26H2O 3CaO·Al2O3·3CaSO4·32H2O
Sulfate attack can be overcome by the addition of pozzolans or calcium chloride
to concrete. Pozzolans are the finely divided siliceous and/or aluminous materials that
react with calcium hydroxide to form compounds with cementitious properties.
Acid attack involves a reaction between chemicals/acids and calcium hydroxide in
cement that result in the formation of water soluble calcium compounds. These
compounds cause leaching of calcium hydroxide from cement which results in a decrease
of strength and an increase in porosity of concrete. Thus, leaching affects both
mechanical and physical properties of cement (Carde and Francois, 1997). Generally,
concrete with a low w/c ratio or a surface coating is recommended to minimize
vulnerability to acid attack.
Porosity is also an important factor in determining the strength of concrete. It is
defined as the ratio of volume of pores in concrete to the volume of concrete including
the pores. Studies have shown that an increase in porosity of cement mortar causes a
decrease in the compressive strength. Porosity has been determined using the equation:

6
Porosity = (Wssd-Wd)/(Wssd-Ww) x 100%
Wssd - specimen weight in the saturated surface dry condition
Wd - specimen dry weight
Ww - weight of saturated specimen
Porosity also influences compressive and indirect tensile strength including
flexural and tensile strength of concrete. The ratio of compressive strength to tensile
strength decreases with increase in porosity (Chen et al, 2013). Frost resistance is also
influenced by pore density of concrete. Therefore, deterioration of concrete by freezing
can be prevented by concrete with a higher pore density (Nagrockiene et al, 2011).
Active research is currently ongoing to improve the performance of concrete.
Durability and crack resistance are the primary properties of concern. Reinforcement is
an approach that has had tremendous impact on concrete manufacturing. This technique
was first introduced in the late 19th century. Since then, a variety of reinforcement
methods and materials have been developed. Materials include steel, glass, carbon and
other materials such as polymeric fibers. One of the effective methods to improve the
strength and durability of concrete is fiber reinforcement.
Shrinkage is another factor affecting the durability of concrete. It occurs as a
function of time due to external load on the concrete. Experiments with polypropylene
microfiber reinforced concrete have shown that shrinkage of microfiber reinforced
concrete was lower when compared to concrete without fibers. Displacement transducer
of 0.001 mm precision was used to measure shrinkage (Saje et al, 2011).
Cracking caused by plastic shrinkage is another problem of concern. This kind of
shrinkage occurs during the initial stages of the setting of concrete and leads to early

7
cracking. When the evaporation rate of water from the concrete surface is higher than the
bleeding rate (the rate at which the water moves upward due to the settling of solid
particles in the concrete mixture), plastic shrinkage and cracking of concrete begins.
Polypropylene fiber reinforcement limits the plastic shrinkage and cracking in concrete
by acting as bridges across them (Banthia and Gupta, 2006).
PVA fibers:
PVA consists of repeated structural units of -[-CH2-CH(OH)-]n-. Usage of PVA
fibers as a reinforcement material leads to many benefits. Apart from being economical,
the PVA fiber reinforcement improves the quality of concrete by making it fatigue and
corrosion resistant. Polyvinyl acetate is the starting material in the manufacturing of
polyvinyl alcohol (PVA).
PVA is hydrolyzed by treating it with an alcoholic solution in the presence of an
aqueous acid or alkali. OH groups present in PVA are capable of forming hydrogen
bonds between the fibers and the cement matrix. The resulting surface bonding helps in
bridging the cracks.

8
Figure 2. KURALON® ultra high performance nycon PVA fibers (fiber balls of size 0.5
to 1 inch)
Carbon microfibers:
Carbon microfibers (CF) help in increasing the flexural and tensile strength of
concrete. Generally, these fibers are made from polyacrylonitrile (PAN). PAN is
illustrated in Figure 3.
Figure 3. Microstructure of PAN carbon fibers (Huang, 2009)

9
The technique involved in making carbon fibers starts with wet spinning of PAN.
The carbon fibers are further processed by pyrolysis. The process of CF manufacturing
involves stabilization, carbonization, and graphitization. First, PAN is oxidized in the
temperature range of 200-300oC. The fibers are then carbonized under an atmosphere of
nitrogen at 1000oC. Later, pyrolysis is done in the presence of an inert gas, generally
argon, at 1500-3000oC to remove impurities from the fibers. This process is known as
graphitization. The flow chart of the procedure is illustrated in Figure 4. Pyrolysis also
results in fibers of strength up to 400 GPa (Rahaman et al, 2007). Usually, short carbon
fibers are manufactured from the vapor of hydrocarbon compounds with low molecular
weights.

10
Figure 4. Carbon fiber synthesis process (Rahaman et al, 2007)
The structure of carbon fibers also influences their properties. These properties
include "thermal stability, electrical resistivity, chemical inertness, high tensile strength,
and the elastic modulus" (Chung, 1994) and often make them more desirable compared to
steel, glass as well as other polymeric fiber reinforcements. The structural features which
determine these properties are "the degree of crystallinity, the interlayer spacing, the
crystallite sizes, the domain structure, the texture parallel and perpendicular to fiber axis,
the transverse and longitudinal radii of curvature of the carbon layers, and the volume
fraction, shape, and orientation of microvoids" (Chung, 1994). Continuous fibers are

11
preferred to short carbon fibers as the latter forms weak bonds with the cement matrix
(Chung, 2001).
One of the most important factors influencing properties of carbon fibers is their
uniform distribution in the composite. Carbon fiber composites are often challenging due
to their uneven dispersion of fibers in the concrete mixture. Dispersion of the carbon
fibers can be achieved using silica fume (Chung, 2000). Silica fume, also known as micro
silica, is a type of pozzolan used as an admixture to improve the mechanical properties of
cement. Table 2 shows the chemical composition of silica fume (Siddique and Khan,
2011).
Table 2. Chemical composition of silica fume.
Chemical Component Percentage Composition by Mass
Silica Oxide (SiO2) 96.65
Calcium Oxide (CaO) 0.3
Aluminum Oxide (Al2O3) 0.2
Ferric Oxide (Fe2O3) 0.07
Sulfur Trioxide (SO3) 0.17
Potassium Oxide (K2O) 0.56
Sodium Oxide (Na2O) 0.15
Magnesium Oxide (MgO) 0.04
Loss on ignition (LOI) 2.27

12
In concrete, cracking begins with nanocracks, which join to form microcracks and
eventually leads to macrocracks. Carbon microfibers delay the development of formed
cracks but do not prevent the initiation of the formation of the crack. This has led to the
development of carbon fibers at the nanoscale which helps to control the formation of
cracks in concrete.
Carbon nanofibers and nanotubes:
Nanotechnology has helped enhance the desirable properties of concrete. The
thermal, electronic, flexibility and mechanical properties of carbon nanofibers and
nanotubes make them more advantageous than carbon microfibers. Carbon nanofibers
range in size from 0.4 to 500 nm in diameter and micrometers to millimeters in length.
They are found in different forms based on the angle of graphene layers which include
stacked, herringbone, and nanotubes (Teo et al, 2003) as illustrated in Figure 5.
Figure 5. TEM and SEM images of different structural forms of carbon nanofibers
(Mochida et al, 2006)
Due to distinct electrical, chemical and mechanical properties, carbon nanotubes
are considered to be unique in nanosized reinforcement. First discovered in 1991, carbon
nanotubes are made from graphite sheets. They exhibit elastic behavior and have a
Platelet Herring bone Tubular
TEM
M
SEM

13
Young's modulus around 1 TPa (terapascals) (Konsta et al, 2006). They are available in
different forms such as single walled carbon nanotubes (SWCNTs), double walled carbon
nanotubes (DWCNTs) and multi walled carbon nanotubes (MWCNTs). MWCNTs were
the first discovered nanotubes.
Generally SWCNTs are preferred as fillers to MWCNTS because the inner layers
of MWCNTS do not perform well under structural loading. Other types include
nanohorns, nanotesttubes, armchair structure, zigzag structure and nanotube rope
(Scarselli et al, 2012). A representation of these types can be seen in Figure 6.
Figure 6. Types of CNTs (Scarselli et al, 2012)
Carbon nanotubes are generally produced by laser ablation, arc discharge, thermal
and plasma enhanced chemical vapor deposition methods. Chemical vapor deposition is
preferable as the carbon nanotubes or nanofibers can be used directly without further
purification. The performance of fibers mainly depends on "fiber diameter, fiber length,
fiber distribution in mixture, fiber orientation in mixture, bond between fiber and
cementitious composite, surface texture of fiber, and fiber material" (Palmquist et al,

14
2011).
The most important factor influencing properties of nanocomposites is the
dispersion of carbon nanotubes and carbon nanofibers. Ultrasonication is a commonly
used technique for the dispersion of CNTs in liquid bases. These suspensions are then
mixed with cement for the proper distribution of CNTs throughout the mixture. The most
effective dispersion was seen when used along with a surfactant (Konsta et al, 2010).
Carbon microfiber/Carbon nanotubes reinforced concrete:
Studies have shown that CF reinforced concrete is stronger and tougher when
compared to steel fiber reinforced concrete (Banthea and Dubeau, 1994). Short pitch-
based carbon fibers, when added to concrete along with silica fume and a dispersant,
showed an increase in flexural strength by 85%, compressive strength by 22% and
flexural toughness by 205% (Chen and Chung, 1993). Carbon nanotubes have also been
used in composites which resulted in high strength and durable concrete. Nanoparticles
also accelerate hydration by allowing crystallization of cement hydrates. Carbon
nanotubes have high surface area which improves the bond between the cement paste and
aggregates thereby enhancing the mechanical properties of the cement matrix (Rana et al,
2009).
Raman Spectroscopy:
Raman spectroscopy is considered to be a valuable research and characterization
technique due to its sensitivity and nondestructive nature. Raman spectroscopy, based on
the inelastic scattering of light, was first observed in 1928 by the famous Indian scientist,
Sir C. V. Raman. It is now used in many fields like chemistry, biopharmaceutical
industries, and materials science. Raman has many advantages like
15
Sample preparation is minimal or not needed.
Non-destructive method where the sample can be used later for analysis.
Water and CO2 interference is minimal.
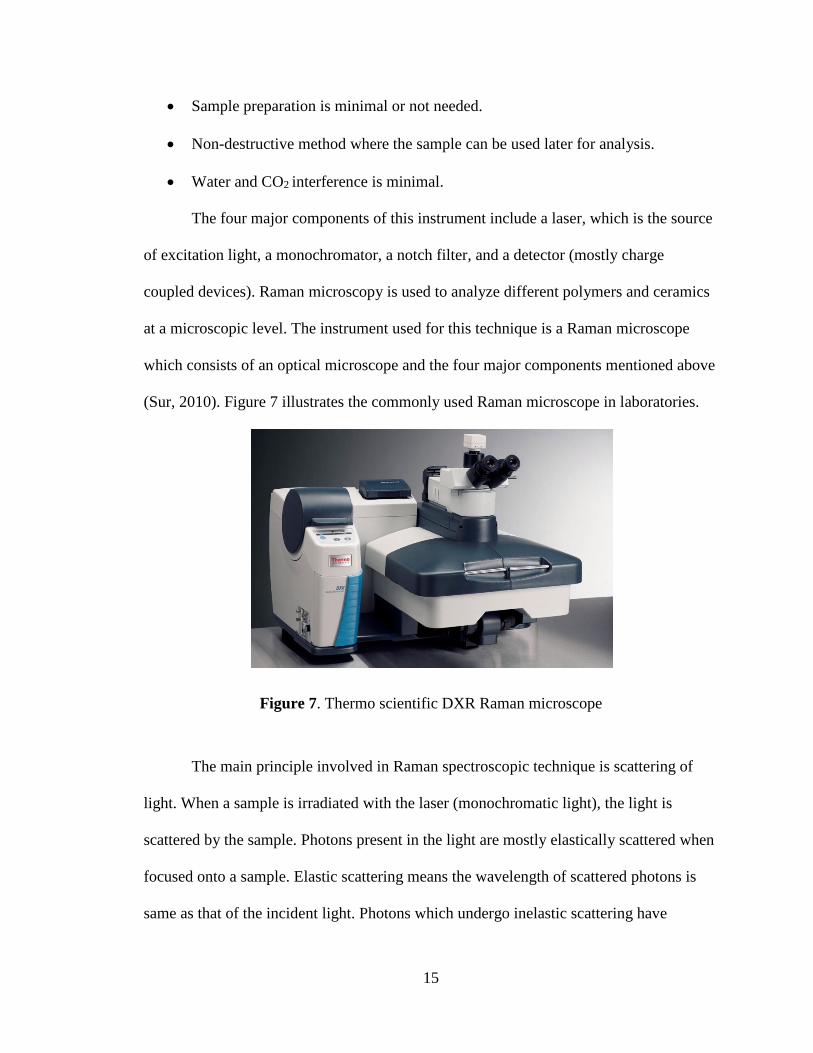
The four major components of this instrument include a laser, which is the source
of excitation light, a monochromator, a notch filter, and a detector (mostly charge
coupled devices). Raman microscopy is used to analyze different polymers and ceramics
at a microscopic level. The instrument used for this technique is a Raman microscope
which consists of an optical microscope and the four major components mentioned above
(Sur, 2010). Figure 7 illustrates the commonly used Raman microscope in laboratories.
Figure 7. Thermo scientific DXR Raman microscope
The main principle involved in Raman spectroscopic technique is scattering of
light. When a sample is irradiated with the laser (monochromatic light), the light is
scattered by the sample. Photons present in the light are mostly elastically scattered when
focused onto a sample. Elastic scattering means the wavelength of scattered photons is
same as that of the incident light. Photons which undergo inelastic scattering have

16
different wavelengths from that of the incident light (Colthup et al, 1990).
When the resulting frequency of the scattered photons is lower than the frequency
of photons absorbed by the molecule, it is called Stokes Raman scattering and when the
resulting frequency of the scattered photons is higher than the frequency of photons
absorbed by the molecule it is known as anti Stokes Raman scattering. Figure 8 illustrates
the energy levels of Stokes and anti Stokes Raman scattering (Colthup et al, 1990).
The changes in the wavelength of photons occur due to the interaction of the
photons with the functional groups or the molecules present in the sample. Photons
interact with the electrons present in a bond of a functional group and excite an electron.
The electron then relaxes into its ground state by losing some amount of energy. The loss
of energy is related to the kind of functional group present in the sample.
Figure 8. Energy level diagram showing different scattering states
This technique can be used to investigate the molecular changes in a polymer
embedded in the concrete.

17
CHAPTER 2
EXPERIMENTAL METHODS
The main objective of this study was to investigate the effect of PVA fibers on the
mechanical properties of concrete. In addition, studies of applied stress and the effect of
moisture on PVA fibers were also examined. Raman spectroscopy was used to observe
the changes which occurred in PVA fibers due to the moisture content and applied stress.
The type of cement used was type III Portland cement. Super plasticizer (Glenium
3000 NS) was used to increase the workability of concrete. Glenium 3000 NS is a water
reducing admixture. The concrete mix was prepared with a water to cement ratio of 0.58.
The details of mix design employed to establish baseline concrete cubes are summarized
in Table 3.
Table 3. Mix design of baseline concrete cubes.
Component Amount (lbs)
Portland cement (type III) 4.2
Fine aggregate (sand) 3.36
Fly ash (type C) 5.04
Water 2.45
Super plasticizer 0.11
Compressive strength and Split tensile strength testing:
The first batch of 24 cubes was prepared without the addition of fibers. The
following procedure was followed to prepare the concrete mixture.
All the required ingredients were weighed.
Initially all the ingredients were dry mixed. Sand was put in a mixing container

18
and later fly ash and cement were added and mixed with a spatula.
Later water was added and mixed for a while. Thereafter, super plasticizer was
added as a water reducing admixture. The concrete mix was self-consolidating.
The above mixture was poured into 2-cubic inch plastic molds. These molds were
left for 24 hours. After 24 hours the cubes were de-molded and then were cured for 28
days. The mechanical properties of the cubes were determined by compressive strength
and split tensile strength tests. These tests were done on the 1st, 3rd, 7th, 14th, 21st and
28th days.
The second batch was prepared using Portland cement with a fiber loading of 1.3
wt%. Figure 9 shows the incorporation of PVA fibers into the concrete. The mix design
was similar to the first batch except for the addition of fibers and a 50% reduction in the
amount of the super plasticizer. This was done because the baseline mixture was so
separated that the aggregates tend to settle at the bottom.
Figure 9. Incorporation of PVA fibers into concrete

19
Table 4 summarizes the mix design of the second batch. The split tensile strength
and compressive strength tests were run on 3 cubes each day. A total of 18 replicates
were tested on the 1st, 3rd, 7th, 14th, 21st and 28th days as shown in Figure 11 and 12.
Table 4. Mix design of concrete cubes with fibers.
Component Amount (lbs)
Portland cement (type III) 4.2
Fine aggregate (sand) 3.36
Fly ash (type C) 5.04
Water 2.45
Super plasticizer 0.055
PVA fibers 0.2
Crack formation and Propagation:
The large chamber scanning electron microscope (LC-SEM) was used for the
imaging of cubes with fibers. These cubes were initially tested for split tensile strength. A
vertical crack was formed after the test and the fibers were observed bridging the crack.
To better demonstrate the bridging of fibers in between the crack, imaging was done
using LC-SEM.
LC-SEM is a scanning electron microscope used for high resolution imaging. This
instrument accommodates large samples without the need of cutting them into small
pieces. The magnification power of the instrument is up to 300,000x. The images
generated by the instrument have a resolution greater than 10 nm. This instrument has
allowed getting a better understanding on the nature of PVA fibers. Figure 10 illustrates
the LC-SEM available at the WKU NOVA Center.

20
Figure 10. Large chamber scanning electron microscope at WKU NOVA Center
Effect of moisture on PVA fibers:
PVA fibers are generally used to bridge the cracks in concrete formed due to
factors such as plastic shrinkage, mechanical loads, and heat of hydration. Previously
explained, the polyvinyl alcohol fibers contain many hydroxyl groups. To understand the
effect of water in concrete mixture on these fibers, Raman spectroscopic analysis was
performed.
Saturated solutions of different salts such as sodium chloride, potassium chloride,
magnesium chloride, potassium nitrate and magnesium nitrate were prepared and stored
in glass bottles. Fibers were then placed in screw caps and left in these bottles for a
month. These salt solutions have different humidities which allow the fibers to absorb
different amounts of moisture. The amount of moisture absorbed by the fibers depends on
the relative humidities of these salts. Table 5 illustrates the relative humidities of the
different salt solutions.

21
Table 5. Relative humidity of different salt solutions at room temperature.
Salt Solution Percentage Relative Humidity
Magnesium Chloride 33
Magnesium Nitrate 53
Sodium Chloride 75
Potassium Chloride 83
Potassium Nitrate 93
The spectra of dry fibers were first collected. There was an interference of glass
slide in the spectra used for placing the fiber. To avoid this, the glass slide was wrapped
with the aluminum foil and then the fiber was placed on it. The fiber was focused through
a 50X objective lens and the spectra were collected for every sample present in the
environment of different saturated salt solutions using DXR Raman microscope. To
obtain the peaks at higher frequency full range grating was used.
DXR Raman microscope is mainly used for the analysis of small particles. It has a
spatial resolution of 1 micron. The detector used in this instrument is highly sensitive
silicon charge-coupled device or CCD. There are four laser wavelengths usually used in
this instrument which include 473 nm, 532 nm, 633 nm, and 780 nm. The laser
wavelength used in the analysis of these fibers was 780 nm. This laser wavelength has
high power and is usually used in fiber optic measurements.
Effect of applied stress on the PVA fiber:
When a crack is formed in PVA fiber-reinforced concrete, the fibers act as bridges
in between the cracks and prevent or limit the formation of macro cracks. These fibers
might undergo some tension as they are pulled in between the cracks. To study the strain
which occurs as the fiber is pulled, Raman spectroscopic analysis was done.

22
A micrometer was used to pull the fiber. A single fiber was glued to the carbide
jaws of the micrometer using a mixture of Loctite® professional heavy duty epoxy resin
and hardener as shown in Figure 11 and was left overnight for curing. The micrometer
along with the fiber was glued to a glass slide using the same glue to prevent its
movement while on the stage of microscope. This set up was placed on the stage of the
DXR Raman microscope and the fiber was pulled by turning the ratchet stop of the
micrometer. One of the shutters of the instrument was kept open to allow for the manual
turning of ratchet stop. The fiber was focused through a 50X objective lens and the
spectra were collected while the fiber was pulled for every five seconds.
Figure 11. Fiber glued to the carbide jaws of the micrometer
Optical microscopy:
Optical microscope is an instrument shown in Figure 12 used for imaging samples
at micron and sub-micron level. It uses visible light to magnify the images. A PVA fiber
was glued to the micrometer as discussed earlier. This setup was placed on the stage of
microscope and the fiber was observed while it was pulled.
23
Figure 12. Nikon optical microscope

24
CHAPTER 3
RESULTS AND DISCUSSION
Compressive strength and split tensile strength tests were run on the samples with
and without PVA fibers.
A batch of 24 cubes without fibers was cast. The molds containing the concrete
mixture were left to air drying for one day before curing. Demolding of these cubes was
done on the second day and testing under compression was done on first four sample
cubes as shown in Figure 13. Compressive strength of each sample was calculated by
dividing the maximum load by the square of surface area of the cube. The cubes were left
in the curing room.
Figure 13. Testing of concrete cube under compression
The cubes were tested on day 1, 3, 7, 14, 21, and 28. Four samples were used for
the testing each day. Table 6 in the appendix shows the results of the compressive

25
strength tests that were run on different days.
Compressive strength of baseline concrete cubes:
A graph was plotted between the average compressive strength and the age of the
baseline concrete cubes as shown in Figure 14. There is a gradual increase in the
compressive strength as a function of curing time.
Figure 14. Compressive strength of baseline concrete cubes at various ages
Cubes with fibers were then cast and tested. Testing of cubes under compression
was done on the 1st, 3rd, 7th, 14th, 21st, and 28th days. Table 7 in the appendix
illustrates the compressive strength test results on different days.
Compressive strength of concrete cubes with fibers:
A graph was plotted between the average compressive strength and the age of
concrete cubes with fibers as shown in Figure 15. The fiber-reinforced concrete cubes
exhibited 23% less compressive strength than the cubes without fibers. The fibers in the
composite cause the formation of voids in the presence of filling material (sand). This
results in the improper packing of the concrete there by decreasing the compressive
0
2000
4000
6000
8000
10000
12000
14000
16000
0 5 10 15 20 25 30
Av
era
ge
com
pre
ssiv
e st
ren
gth
(p
si)
Age (days)

26
strength (Nuruddin etal, 2014).
Figure 15. Compressive strength of concrete cubes with fibers at various ages
A second batch of concrete cubes with and without fibers was cast and tested for
split tensile strength as shown in Figure 16.
Figure 16. Split tensile strength test showing the vertical crack in the cube
0
2000
4000
6000
8000
10000
12000
14000
16000
0 5 10 15 20 25 30
Av
era
ge
com
pre
ssiv
e st
ren
gth
(p
si)
Age (days)

27
Split tensile strength testing was done on 1st, 3rd, 7th, 14th, 21st, and 28th days.
Table 8 in the appendix shows the results for split tensile strength test done on 1st, 3rd,
7th, 14th, 21st, and 28th days. Split tensile strength is calculated using the formula-
σsp = 0.519P/S2
Where P is the load at failure and S is side of the concrete cube (Badagha and Modhera,
2013).
Split tensile strength of baseline concrete cubes:
A graph was plotted between the average split tensile strength and age of the
concrete cubes as shown Figure 17.
Figure 17. Split tensile strength of baseline concrete cubes at various ages
Table 9 in the appendix illustrates the split tensile strength test results of concrete
cubes with fibers on Day 1, 3, 7, 14, 21, and 28.
200
400
600
800
1000
1200
1400
1600
0 5 10 15 20 25 30
Av
era
ge
spli
t te
nsi
le s
tren
gth
(p
si)
Age (days)

28
Split tensile strength of concrete cubes with fibers:
A graph was plotted between the average split tensile strength and the age of the
concrete cubes with fibers as shown Figure 18. The fiber-reinforced concrete exhibited
33% more tensile strength than the baseline concrete cubes which shows that the concrete
cubes have gained ductility.
Figure 18. Split tensile strength of concrete cubes with fibers at various ages
Effect of moisture on the PVA fibers:
Figure 19 shows the water fall spectra of the PVA fibers in different salt
solutions, obtained from the DXR Raman microscope.
0
200
400
600
800
1000
1200
1400
1600
0 5 10 15 20 25 30
Av
era
ge
spli
t te
nsi
le s
tren
gth
(p
si)
Age (days)

29
Figure 19. Raman spectra of the PVA fibers in different salt solutions
There was no remarkable change in the spectra of the PVA fiber unlike the PVA
crystalline powder when salt solutions of different humidity were used (Thomas and
Stuart, 1997).
Crack formation and Propagation:
SEM images of concrete cubes tested for split tensile strength were collected.
Figure 20 shows the fibers bridging across the crack. It also shows that the fibers are
pulled between the crack and they are under stress.
Raman shift (cm-1)

30
Figure 20. SEM images showing the fibers bridging the crack

31
Effect of the applied stress on the PVA fiber:
Figure 21 shows the water fall spectra of the PVA fiber under stress. About 50
spectra were collected while the fiber was pulled simultaneously.
Figure 21. Raman spectra of the PVA fiber under stress
There was no change in the spectra of the PVA fiber under stress because the
fiber recoiled within nanoseconds due to its high tensile strength of 160,000 psi, when it
was pulled.
Optical microscopy:
When the fiber was pulled under the microscope using a micrometer, the color of
the fiber has changed from red to green as shown in Figure 22 when it was under stress.
Raman shift (cm-1)

32
When the fiber recoiled, the color has changed back to red. The PVA fiber optic axes
were measured using the microscope. It was determined that the fiber is biaxial, and the
angle between the optic axes (2V) is ≈17° as shown in Figure 22.
Figure 22. Schematic diagram of PVA fiber showing the optic axis and optic normal
The interference color is a result of the different ray paths of the double refracted
polarized ray paths through the fiber. As the refractive index (RI) difference between the
ray paths increases, the δ (birefringence) increases. In this case the δ has decreased which
resulted in the decrease of the difference between the RI along the ray paths, which
means as the fiber is stretched, the PVA molecules doesn’t change geometry (as indicated
by Raman), but the PVA packing density changes.
ON
OA OA
2V=17o
OA-optic axis
ON-optic normal

33
A
B
Figure 23. Optical microscopic images of the PVA fiber under stress. A) Fiber is in red
color before it was pulled B) Fiber is in green color when it was pulled

34
CHAPTER 4
CONCLUSIONS
The effect of PVA fiber loading of 1.3 wt% on the mechanical properties of
concrete was examined. Compressive strength and split tensile strength testing was done
for both baseline concrete cubes and PVA fiber-reinforced concrete cubes. When
compressive strength was examined as a function of curing time, the fiber-reinforced
concrete exhibited 23% less compressive strength than the cubes without fibers. Whereas
when split tensile strength was examined as a function of curing time, the fiber-reinforced
concrete cubes exhibited 33% more tensile strength than the baseline concrete cubes.
Increase in the split tensile strength shows that the concrete has gained ductility.
The impacts of moisture and the stress applied on the PVA fibers were also
studied. SEM imaging of the samples was done to observe the fibers bridging the crack.
The spectra of the PVA fibers collected during these studies have not shown any
remarkable changes. Optical microscopy was also done to observe the changes in the
fiber due to stress. There was a color change in the fiber from red to green when it was
pulled using the micrometer under the optical microscope. This proved that there was a
strain in the fiber when the stress was applied.

35
PERSPECTIVE
Concrete has been in use since ages because of its wide applications in the
construction world. Fibers in concrete have been done for decades for treating the
temperature and also the shrinkage cracks. Recently fibers are added for improving the
additional properties of concrete. Concrete is partially a brittle material. In this research
the fibers were added to the concrete mixture to improve its ability to deform like a wire
under stress. The fibers added to the concrete are in contact with water. The effect of
moisture on these fibers was studied. Images of fibers in different salt solutions were
taken using a microscope. There was no change seen in these images. When a crack is
formed in concrete, these fibers act like bridges across the crack and prevent the further
development of the crack. These fibers are under stress when they are pulled across the
crack. To examine the fiber under stress, the fiber was pulled using an instrument and
images were taken using a microscope. There was no change in these images either
because of the high strength of the fiber. Color change in the fiber under stress was
observed when images were taken through a microscope.

36
APPENDIX
Table 6. Compressive strength test results of baseline concrete cubes on Day 1, 3, 7, 14,
21 and 28.
Test day Sample Force (lbs) Average compressive strength (psi)
1 1 4080 1136±128.5
2 4170
3 5170
4 4760
3 1 27700 6729.3±741.15
2 28970
3 22540
4 28460
7 1 36450 10434±1418.7
2 48780
3 43820
4 37900
14 1 44670 11571±405.34
2 48390
3 45440
4 46650
21 1 43530 11678±703.97
2 50100
3 45570
4 47650
28 1 48920 12280±231.27
2 50210
3 49370
4 47990

37
Table 7. Compressive strength test results of concrete cubes with fibers on Day 1, 3, 7,
14, 21, and 28.
Test day Sample Force (lbs) Average compressive strength (psi)
1 1 12940
2 12690 3110.8±163.92
3 11700
2 1 20300
2 21886 5301.3±203.81
3 21420
7 1 25800
2 28240 6782.5±308.76
3 27350
14 1 34530
2 32420 8293.3±294.34
3 32570
21 1 35490
2 35670 8736.6±275.11
3 33680
28 1 37530
2 39060 9373.3±396.32
3 35890

38
Table 8. Split tensile strength test results of baseline concrete cubes on Day 1, 3, 7, 14,
21, and 28.
Test day Sample Force (lbs) Average tensile strength (psi)
1 1 2050
2 2390 288.4±22.07
3 2230
3 1 4480
2 5360 620.6±64.82
3 4510
7 1 4800
2 3830 593.3±85.61
3 5090
14 1 4980
2 5490 725.2±86.36
3 6300
21 1 5760
2 5380 760.7±70.37
3 6450
28 1 3910
2 5370 640.5±115.8
3 5530

39
Table 9. Split tensile strength test results of concrete cubes with fibers on Day 1, 3, 7, 14,
21, and 28.
Test day Sample Force (lbs) Average tensile strength (psi)
1 1 7470 671.7±201.5
2 4170
3 4270
4 4800
3 1 5110 789.8±110.8
2 6650
3 6940
4 5650
7 1 8270 924.7±107.9
2 7200
3 6640
4 6400
14 1 6820 794.1±168.6
2 5950
3 4370
4 7340
21 1 7590 1385±299.7
2 13170
3 10780
4 11180
28 1 8960 966.6±170.1
2 6790
3 6600

40
REFERENCES
Alawode, O.; Idowu, O.; "Effects of Water-Cement Ratios on the Compressive Strength
and Workability of Concrete and Lateritic Concrete Mixes." The Pacific Journal of
Science and Technology. 2011, 12, 99-105.
Arum, C.; Olotuah, A.; "Making of Strong and Durable Concrete." Emirates Journal for
Engineering Research. 2006, 11, 25-31.
Badagha, G.D.; Modhera, D.C.; "Studies on harden properties of mortar using carbon
fibers." International Journal of Advancements in Research and Technology. 2013, 2,
249-252.
Banthia, N.; Dubeau, S.; "Carbon and Steel Microfiber Reinforced Cement Based
Composites for Thin Repairs." Journal of Materials in Civil Engineering. 1994, 6, 88-99.
Banthia, N.; Gupta, R.; "Influence of Polypropylene Fiber Geometry on Plastic Shrinkage
Cracking in Concrete." Cement and Concrete Research. 2006, 36, 1263-1267.
Bediako, M.; Frimpong, A.; "Alternative Binders for Increased Sustainable Construction
in Ghana-A Guide for Building Professionals." Materials Sciences and Applications.
2013, 4, 20-28.
Bullard, J.; Jennings, H.; Livingston, R.; Nonat, A.; Scherer, G.; Schweitzer, J.;
Scrivener, K.; Thomas, J.; "Mechanisms of Cement Hydration." Cement and Concrete
Research. 2011, 41, 1208-1223.
Carde, C.; Francois, R.; "Effect of the Leaching of Calcium Hydroxide from Cement
Paste on Mechanical and Physical Properties." Cement and Concrete Research. 1997, 27,
539-550.
Chakraborty, S.; Kundu, S.; Roy, A.; Adhikari, B.; Majumder, S.; "Effect of Jute as Fiber
Reinforcement Controlling the Hydration Characteristics of Cement Matrix." Industrial
and Engineering Chemistry Research. 2013, 52, 1252-1260.

41
Chen, P.; Chung, D.; "Concrete Reinforced with up to 0.2 vol% of Short Carbon Fibers."
Composites. 1993, 24, 33-52.
Chen, X.; Wu, S.; Zhou, J.; "Influence of Porosity on Compressive and Tensile Strength
of Cement Mortar." Construction and Building Materials. 2013, 40, 869-874.
Chung, D.; "Cement Reinforced with Short Carbon Fibers: A Multifunctional Material."
Composites: Part B. 2000, 31, 511-526.
Chung, D.; "Interface Engineering for Cement-Matrix Composites." Composite
Interfaces. 2001, 8, 67-81.
Chung, D. Carbon Fiber Composites: Properties of Carbon Fibers; Butterworth-
Heinemann: Massachusetts, 1994. ISBN 978-0750691697.
Colthup, N.B.; Daly, L.H.; Wiberley, S.E. Introduction to Infrared and Raman
Spectroscopy: Vibrational and Rotational Spectra, 3rd ed.; Academic Press: California,
1990.
Huang, X.; "Fabrication and Properties of Carbon Fibers." Materials. 2009, 2, 2369-
2403.
Konsta-Gddoutas, M.; Metaxa, Z.; Shah, S.; "Highly Dispersed Carbon Nanotube
Reinforced Cement Based Materials." Cement and Concrete Research. 2010, 40, 1052-
1059.
Lin, F.; Meyer, C.; "Hydration Kinetics Modeling of Portland Cement Considering the
Effects of Curing Temperature and Applied Pressure." Cement and Concrete Research.
2009, 39, 255-265.
Mehta, P.K.; "Mechanism of Sulfate on Portland Cement Concrete-Another look."
Cement and Concrete Research. 1983, 13, 401-406.
Mochida, I.; Yoon, S.; Qiao, W.; "Catalysts in Synthesis of Carbon and Carbon
Precursors." Journal of Brazilian Chemical Society. 2006, 17, 1059-1073.

42
Nagrockiene, D.; Skripkiunas, G.; Girskas, G.; "Predicting Frost Resistance of Concrete
with Different Coarse Aggregate Concentration by Porosity Parameters." Materials
Science. 2011, 17, 203-207.
Nuruddin, F.M.; Khan,U.S.; Shafiq, N.; Ayub, T.; "Strength Development of High-
Strength Ductile Concrete Incorporating Metakaolin and PVA Fibers." The Scientific
World Journal. 2014, 2014, 1-11.
Palmquist, S.; Kintzel, E.; Andrew, K.; Scanning Electron Microscopy to Examine
Concrete with Carbon Nanofibers. 5th PAN Conference for NDT, Cancun (Mexico),
October 2-6, 2011.http://www.ndt.net/article/panndt2011/papers/129_Palmquist.pdf.
Rahaman, M.; Ismail, A.; Mustafa, A.; "A Review of Heat Treatment on Polyacrylonitrile
Fiber." Polymer Degradation and Stability. 2007, 92, 1421-1432.
Rana, S.; Alagirusamy, R.; Joshi, M.; "A Review on Carbon Epoxy Nanocomposites."
Journal of Reinforced Plastics and Composites. 2009, 28, 461-487.
Saje, D.; Bandelj, B.; Sustersic, J.; Lopatic, J.; Saje, F.; "Shrinkage of Polypropylene
Fiber-Reinforced High-Performance Concrete." Journal of Materials in Civil
Engineering. 2011, 23, 941-952.
Scarselli, M.; Castrucci, P.; Crescenzi, M.; "Electronic and Optoelectronic Nanodevices
based on Carbon Nanotubes." Journal of Physics: Condensed Matter. 2012, 24, 1-36.
Siddique, R and Khan, I.Supplementary Cementing Materials: Silica Fume; Springer:
Heidelberg,2011. ISBN 978-3642178665.
Sur, U.; "Surface Enhanced Raman Spectroscopy." Resonance. 2010, 154-164.
Teo, K.; Singh, C.; Chhowalla, M.; Milne, W.; "Catalytic Synthesis of Carbon Nanotubes
and Nanofibers." Encyclopedia of Nanoscience and Nanotechnology. 2003, 10, 1-22.
Thomas, P.S.; Stuart, B.S.; "A Fourier Transform Raman Spectroscopy Study of Water
Sorption by Polyvinyl Alcohol." Spectrochimica Acta Part A. 1997, 53, 2275-2278.

43
White, M.; "Concrete." Journal of Chemical Education. 2006, 83, 1425-1427.