study of mathematically precocious youth (smpy) · study of mathematically precocious youth after...
TRANSCRIPT

Special Section: Doing Psychological Science
Study of MathematicallyPrecocious Youth After 35 YearsUncovering Antecedents for the Development ofMath-Science ExpertiseDavid Lubinski and Camilla Persson Benbow
Vanderbilt University
ABSTRACT—This review provides an account of the Study
of Mathematically Precocious Youth (SMPY) after 35
years of longitudinal research. Findings from recent
20-year follow-ups from three cohorts, plus 5- or 10-year
findings from all five SMPY cohorts (totaling more than
5,000 participants), are presented. SMPY has devoted
particular attention to uncovering personal antecedents
necessary for the development of exceptional math-science
careers and to developing educational interventions to
facilitate learning among intellectually precocious youth.
Along with mathematical gifts, high levels of spatial ability,
investigative interests, and theoretical values form a par-
ticularly promising aptitude complex indicative of poten-
tial for developing scientific expertise and of sustained
commitment to scientific pursuits. Special educational
opportunities, however, can markedly enhance the devel-
opment of talent. Moreover, extraordinary scientific ac-
complishments require extraordinary commitment both in
and outside of school. The theory of work adjustment
(TWA) is useful in conceptualizing talent identification and
development and bridging interconnections among edu-
cational, counseling, and industrial psychology. The lens
of TWA can clarify how some sex differences emerge in
educational settings and the world of work. For example,
in the SMPY cohorts, although more mathematically pre-
cocious males than females entered math-science careers,
this does not necessarily imply a loss of talent because the
women secured similar proportions of advanced degrees
and high-level careers in areas more correspondent with
the multidimensionality of their ability-preference pattern
(e.g., administration, law, medicine, and the social sci-
ences). By their mid-30s, the men and women appeared to
be happy with their life choices and viewed themselves as
equally successful (and objective measures support these
subjective impressions). Given the ever-increasing im-
portance of quantitative and scientific reasoning skills in
modern cultures, when mathematically gifted individuals
choose to pursue careers outside engineering and the
physical sciences, it should be seen as a contribution to
society, not a loss of talent.
Society is becoming more knowledge based, technological, and
international (Friedman, 2005); the physical and social systems
within which people operate are increasingly complex and dy-
namic, and economies are built upon ideas. Those countries that
flourish will be the ones most effective in developing their human
capital and in nurturing individuals who will come up with the best
ideas and innovations of tomorrow. A recent report issued by the
National Academy of Sciences (2005), Rising Above the Gathering
Storm, highlights the importance of these trends for all countries
concerned about their future prosperity and speaks to the im-
portance of developing intellectual talent. Indeed, identifying and
developing talent for science, technology, engineering, and math-
ematics (STEM) was the dominant reason that Julian C. Stanley
founded the Study of Mathematically Precocious Youth (SMPY) in
1971. Longitudinal findings emerging out of SMPY have special
relevance today as the United States considers, for example,
launching an American Competitiveness Initiative (2006).
The purpose of this article is twofold. First, we outline the
SMPY longitudinal study and how its findings over the past
35 years have informed both basic and applied psychological
science on identifying and nurturing intellectual talent. Much
has been learned about effective ways to identify potential
for and to facilitate the development of scientific expertise.
Address correspondence to David Lubinski or Camilla Benbow,Department of Psychology and Human Development, Peabody 512,Vanderbilt University, Nashville, TN 37203, e-mail: [email protected] or [email protected].
PERSPECTIVES ON PSYCHOLOGICAL SCIENCE
316 Volume 1—Number 4Copyright r 2006 Association for Psychological Science

Because the work on educational facilitation has been sum-
marized elsewhere (Benbow & Lubinski, 1996; Benbow &
Stanley, 1996; Stanley, 2000),1 our second purpose is to focus
attention on the critical personal antecedents for developing
outstanding scientific careers. Which individuals are most
likely to become exceptional STEM professionals? We say less
here on how to facilitate the educational development of such
individuals.
SMPY was not designed for, nor is this article about, enhancing
the scientific literacy of the general population. Enhancing sci-
entific literacy is clearly important. The public needs to make
informed decisions on topics ranging from whether evolution
should be taught in the schools to whether tax dollars should be
used to fund stem cell research. Fostering scientific literacy,
however, is different from identifying future scientific leaders and
creating supportive environments for them. Although the two
certainly have common components, the talent and commitment
necessary to develop as a scientific leader require both personal
attributes and learning environments that are truly beyond the
norm. The intellectual abilities, personal commitment, and edu-
cational experiences needed to ameliorate global warming or to
create an environmentally safe, oil-independent energy source are
of a much different order of magnitude than those required for
developing scientific literacy (Simonton, 1994; Zuckerman, 1977).
An overabundance of STEM leaders has emerged from SMPY.
Their distinguishing psychological characteristics and the devel-
opmental choices structuring the paths they traversed from age 12
have become evident from experiential and personal data collected
at earlier time points. Not surprisingly, the personal attributes of
future STEM leaders reveal that it takes much more than excep-
tional abilities to develop truly exceptional scientific expertise.
SMPY
SMPY was founded by Stanley on September 1, 1971, at Johns
Hopkins University (Keating & Stanley, 1972; Stanley, 1996).
The study moved to Iowa State University in 1986, and was
directed by Camilla P. Benbow from 1986 to 1990; from 1991
through 1998, we co-directed SMPY at Iowa State, and then in
1998, we moved it to Peabody College of Vanderbilt University.
The initial idea motivating SMPY was to conduct research while
providing services to intellectually talented adolescents, par-
ticularly those with mathematical talent. The underlying phi-
losophy driving this study is based on the best educational
practices for all students, namely, ‘‘appropriate developmental
placement’’ (Lubinski & Benbow, 2000, p. 138)—providing
students with educational opportunities tailored to their rates of
learning (Benbow & Stanley, 1996; Colangelo, Assouline, &
Gross, 2004). In the words of Stanley (2000), the idea is to teach
students ‘‘only what they don’t already know’’ (p. 216).
From the beginning, SMPY focused as much on serving the
social and emotional well-being of intellectually precocious
youth as on experimenting with differential opportunities for
promoting intellectual development (Benbow, Lubinski, &
Suchy, 1996). To inform these two agendas, Stanley planned an
after-high-school follow-up that ultimately evolved into a
50-year longitudinal study, which currently includes more than
5,000 intellectually talented individuals identified over a 25-
year period (1972–1997). The aim of this research is to develop a
better understanding of the unique needs of intellectually pre-
cocious youth, the determinants of the varying developmental
trajectories they display, and the role of education in talent
development. ‘‘Study of Mathematically Precocious Youth’’ has
become a bit of a misnomer, however, because many of our
participants are more verbally than mathematically talented,
and the participants are now all adults. Nevertheless, to main-
tain consistency, we have chosen not to rename the study.
Above-Level Testing and Criteria Used to Identify SMPY
Participants
The members of four of SMPY’s five cohorts were selected
(primarily) at around age 12 or 13, when they were in the seventh
or eighth grade (a fifth cohort of top math-science graduate
students was identified for longitudinal study as well). The se-
lection process was tiered: Almost all students were first re-
quired to earn scores within the top 3% on a conventional
achievement test routinely administered in their schools (e.g.,
the Iowa Test of Basic Skills). This select group was then given
the opportunity to take the SAT through a talent search (TS;
Benbow & Stanley, 1996; Colangelo et al., 2004; Keating &
Stanley, 1972; Stanley, 1996). The SATwas designed for college-
bound high school juniors and seniors, to assess mathematical
(SAT-M) and verbal (SAT-V) reasoning abilities critical for
college work (Donlon, 1984). Because few of the potential cohort
members had received formal training in algebra or more ad-
vanced mathematics, and because they were 4 to 5 years
younger than the population for whom the SAT was designed,
this assessment falls into the category of above-level testing.
SAT-M and SAT-V score distributions among seventh and eighth
graders in the top 3% are indistinguishable from the score dis-
tributions observed among high school students (Benbow, 1988).
This finding is especially noteworthy for SAT-M, because despite a
lack of formal training in algebra, geometry, and other areas of
math tested, several of these seventh and eighth graders score
above the admissions cutoff for many elite universities. Given the
abstract nature of this measuring tool and the sheer novelty of the
problems for this population, the SAT functions at more of an
analytical reasoning level for these students than it does for older
students who have been explicitly exposed to SATcontent through
course work in high school (Benbow, 1983; Stanley & Benbow,
1986; Brody & Benbow, 1990; Minor & Benbow, 1996).
1Many findings from SMPY’s first decade have been reported in edited vol-umes published by the Johns Hopkins University Press (Benbow & Stanley,1983; Fox, Brody, & Tobin, 1980; George, Cohn, & Stanley, 1979; Keating,1976; Stanley, George, & Solano, 1977; Stanley, Keating, & Fox, 1974). Stan-ley’s Festschrift (Benbow & Lubinski, 1996) concluded this series (cf. Benbow& Lubinski, 2006; ‘‘In Appreciation,’’ 2005).
Volume 1—Number 4 317
David Lubinski and Camilla Persson Benbow

Conventional age- or grade-based achievement tests routinely
administered in schools are insensitive to much of the individuality
of intellectually talented young adolescents. Normatively based
instruments do not have high enough ceilings for these students,
and most of their ability and achievement scores pile up at the top,
with profile variation masked. This fosters an underappreciation
not only of their potential, but also of their unique strengths and
relative weaknesses. Superficial inferences based on such assess-
ments amount to erroneous attributions of ‘‘multipotentiality,’’
namely, that they are all equally good at everything and can do
almost anything (cf. Achter & Lubinski, 2005; Achter, Lubinski, &
Benbow, 1996). In reality, this special population (like almost all
special populations) contains an enormous amount of psychological
diversity, including diversity in relative strengths and weaknesses.
Above-level tests offer the kind of measuring stick needed for
assessing the learning rates of highly able students because such
tests can uncover the profound range of individual differences in
learning readiness that these students display. SMPY chose the
SAT for this purpose, but other instruments can be used in this
way as well. The SAT’s high ceiling for this age group distin-
guishes the able from the exceptionally able and, simultaneously,
assesses their relative math and verbal strengths. Capturing the
level and pattern of their intellectual potential more precisely
than is possible with grade-level tests allows one to harness the
nature and scope of their precocity to inform practice (Benbow &
Stanley, 1996; Colangelo et al., 2004), research (Corno et al.,
2002; Vale & Vale, 1969), and theory development (Lubinski,
1996, 2000, 2004; Lubinski & Benbow, 2000; Underwood, 1975).
For example, intellectually able adolescents scoring 500 or
higher on SAT-M or SAT-V before age 13 (top 1 in 200) can
assimilate a full high school course (e.g., chemistry, English,
mathematics) in 3 weeks at a summer residential program for
intellectually precocious youth; yet exceptionally able adoles-
cents, those scoring 700 or more (top 1 in 10,000), can assimilate
at least twice this amount (Benbow & Stanley, 1996; Colangelo
et al., 2004; Stanley, 2000).2 Above-level assessments are
critical, therefore, for properly structuring educational curricula
and being responsive to individuality. The exceptionally able
certainly require different opportunities for optimal develop-
ment than the able (Lubinski, Webb, Morelock, & Benbow,
2001; Muratori et al., 2006), the former needing a more abstract,
deeper, and faster-paced curriculum to avoid boredom. Fur-
thermore, individual differences in learning rates between the
able and the exceptionally able portend commensurate differ-
ences in occupational accomplishments many years later. Like
their earlier academic accomplishments, the occupational ac-
complishments of the profoundly gifted tend to develop at an
accelerated pace and with greater depth. The profoundly gifted
simply have greater capacity for accomplishment and creative
contributions.
In our 20-year follow-up studies of adolescents identified at
age 12, for example, 30% of participants with SAT-M or SAT-V
scores of 500 or above secured doctorates, compared with 50%
of those scoring 700 or above (Benbow, Lubinski, Shea, & Ef-
tekhari-Sanjani, 2000; Lubinski, Benbow, Webb, & Bleske-
Rechek, 2006). The base rate for earning a doctorate (i.e., J.D.,
M.D., or Ph.D.) in the United States is 1%. That a 2-hr test can
identify 12-year-olds who will earn this ultimate educational
credential at 50 times base-rate expectations is remarkable.
Moreover, a 200-point difference in SAT scores at age 12 (500
vs. 700) eventuates, by middle age, in marked differences in
income, patents earned, and tenure-track academic positions
secured at top U.S. universities (cf. Lubinski et al., 2006; Wai,
Lubinski, & Benbow, 2005). More than one third of the ability
range is found within the top 1% of ability, above-level testing
affords valid assessments of individual differences within this
range, and these differences make a difference in school, work,
and life. Models of exceptional human development need to
incorporate these individual differences.
The Five SMPY Cohorts
SMPY’s five cohorts were formed using different selection cri-
teria (see Table 1). The first three cohorts are successively more
able (top 1.0%, 0.5%, and 0.01% in ability, respectively). The
fourth cohort consists of participants who met a top-3% criter-
ion, but a large subset of these participants took the SAT at age
12 or 13 and achieved scores within the top 0.5%. Finally, a fifth
cohort consists of top first- and second-year graduate students in
math and science; they were selected for a retrospective test of,
among other things, the fidelity of TS procedures for identifying
scientific talent. Collectively, these five cohorts include more
than 5,000 participants.
THEORETICAL MODEL
Given the number of variables facilitating the development of
talent, we used a model from counseling psychology to help
organize findings and structure our longitudinal research and
2That cognitive abilities can be enhanced through learning is, of course, true,but a common finding is that the relationship is not linear. When all students areprovided with opportunities to learn at their desired rate, those who begin withmore ability typically profit more from these opportunities (Ceci & Papierno,2005; Gagne, 2005; Jensen, 1991, p. 178; Kenney, 1975; Robinson, Abbott,Berninger, & Busse, 1996; Robinson, Abbott, Berninger, Busse, & Mukh-opadhyah, 1997). This nonlinearity is intensified when one considers the fullrange of ability. Students with developmental delays assimilate much less thantypically developing students even in the best of conditions, yet this fanning outin achievement is observed throughout the ability spectrum and within thesepopulations as well (D. Fuchs et al., 2001; L.S. Fuchs, Fuchs, Karns, Hamlett,& Katzaroff, 1999). The idea that opportunities for optimal growth expand in-dividual differences in achievement has been discussed periodically for dec-ades (e.g., Pressey, 1946, 1955; Seashore, 1922; Thorndike, 1911; Thurstone,1948), yet it is conspicuously absent in many modern treatments. Two excellentexceptions, however, are articles by Ceci and Papierno (2005) and Gagne(2005). Ceci and Papierno depicted this phenomenon nicely by subtitling theirtreatment ‘‘When the ‘Have Nots’ Gain but the ‘Haves’ Gain Even More.’’ Withthis in mind, consider the following proposal for evaluating schools: ‘‘The goodschool, as I have suggested, does not diminish individual differences; it in-creases them. It raises the mean and increases the variance’’ (Eisner, 1999,p. 660).
318 Volume 1—Number 4
Antecedents of Math-Science Expertise

educational interventions (Lubinski & Benbow, 2000). Specif-
ically, we extended the theory of work adjustment (TWA; Dawis
& Lofquist, 1984; Lofquist & Dawis, 1969, 1991) to education
and talent development (Lubinski & Benbow, 1992; Lubinski
& Humphreys, 1990b), just as Katzell (1994) drew on TWA
for modeling phenomena in industrial-organizational psychol-
ogy. From our point of view, the applied psychological pre-
cincts of educational, counseling, and industrial psychology
may be viewed sequentially from a life-span developmental
perspective (Scarr & McCartney, 1983). All three specialties
involve the scientific study of how individual differences may be
used to structure interventions or opportunities to enhance
positive psychological growth, but each area concentrates on
a somewhat different stage of development. TWA organizes
important variables common to all three areas (Lubinski &
Benbow, 2000).
TWA is predicated on devoting equal attention to assessing
the individual and assessing the environment (see Fig. 1). The
individual’s learning or work personality is parsed into two major
components, abilities and preferences (interests and values),
whereas the environment is parsed into commensurate domains
of ability requirements (for meeting performance expectations)
and reinforcer systems (for acknowledging and compensating
performance). Profound individual differences in capability and
motivation exist within cultures and subcultures, and even
among siblings (Lubinski, 2000, 2004; Murray, 1998; Rowe,
1994; Scarr, 1996), and these differences eventuate in important
outcome differences in education and the world of work. This is
why assessing individual differences in psychological attributes
is so important for both personal and professional development
(Dawis, 1992, 2001; Lubinski, 1996; Roe, 1956, p. ii; Tyler,
1974; Williamson, 1965).3 According to TWA, educational
commitment and occupational tenure are a joint function of two
major dimensions of correspondence: satisfaction (correspon-
dence between needs and rewards) and satisfactoriness (corre-
spondence between ability and ability requirements). The for-
mer is determined subjectively (or intra-individually) by
students and workers and is based on their feelings; the latter is
determined objectively (or interindividually) by teachers and
supervisors and is based on performance.
Satisfaction determines how much an individual is motivated
to maintain contact with a particular environment (commitment
to a discipline or occupation), whereas satisfactoriness deter-
mines how much the people in the environment who evaluate
performance are motivated to keep the person (or are committed
to retaining the person). Both must be present for the individual
to remain in the environment. If satisfaction is in place but
satisfactoriness is not, the person will be asked to leave (al-
though the person may like to stay), whereas if the inverse is the
case, the person will choose to leave (although people in the
environment may want to keep him or her). Satisfaction and
satisfactoriness determine the extent to which the person-en-
vironment relationship is likely to maintain harmony and re-
ciprocally nurture personal and organizational development
over extended time frames (resulting in lengthy tenure). (For
TABLE 1
The Five Cohorts of the Study of Mathematically Precocious Youth
Cohort NYears whenidentified
Students’ agewhen identified Identification criteria
1 2,188 1972–1974 12–13 SAT-M � 390 or SAT-V � 370 (top 1 in 100)
2 778 1976–1979 12 SAT-M � 500 or SAT-V � 430 (top 1 in 200)
3 501 1980–1983 12 SAT-M � 700 or SAT-V � 630 (top 1 in 10,000)
4 1,130 1992–1997 12–14 Top 3% on any subtest of a grade-level achievement test
5 714 1992 23–25 Enrollment as a 1st- or 2nd-year student in a graduate program
at a top-ranked engineering, math, or science department in
the United States
Note. SAT-M 5 score on the mathematics subtest of the SAT; SAT-V 5 score on the verbal subtest of the SAT. (Cutting scores wereestablished before the SAT-V was recentered in the mid-1990s.) The cutoffs selected for Cohort 1 represented the average performance ofa random sample of high school girls and also represented approximately the top 1% in ability when achieved by age 13. Participants weredrawn primarily from the state of Maryland, with a heavy concentration in the greater Baltimore area. Cohort 2 was drawn from the mid-Atlantic states, and Cohort 3 is national in its representation. Cohort 4 consisted primarily of Midwesterners; a subset of these partic-ipants, in addition to achieving a top-3% score on a subtest of a grade-level achievement test, also took the SAT and met at least one of thetop-0.5% criteria (i.e., SAT-V � 430 or SAT-M � 500). Talent-search participants have been or are to be followed up at ages 18, 23, 33,50, and 65. Cohorts 1, 2, and 3 have completed follow-ups through age 33 (Benbow, Lubinski, Shea, & Eftekhari-Sanjani, 2000; Lubinski,Benbow, Webb, & Bleske-Rechek, 2006). An age-50 follow-up of Cohort 1 will be launched in approximately 3 years. The age-18 follow-up(after high school) for Cohort 4 is complete (Webb, Lubinski, & Benbow, in press). A 10-year follow-up of Cohort 5 was conductedsimultaneously with the 20-year follow-up of Cohort 3 (Lubinski et al., 2006).
3There are many different kinds of cognitive abilities, but it is generallyagreed that they are hierarchically organized (Carroll, 1993; Snow & Lohman,1989). In our treatment of specific abilities, we focus on those that are longi-tudinally stable and that have been shown to be widely generalizable in mul-tiple contexts and to be related to individual differences in learning ineducational settings, as well as to learning and performance in the world ofwork.
Volume 1—Number 4 319
David Lubinski and Camilla Persson Benbow

further information about this model and its extension to other
domains, see Achter & Lubinski, 2003, 2005; Dawis, 2005;
Dawis & Lofquist, 1984; Katzell, 1994; Lofquist & Dawis, 1991;
and Lubinski & Benbow, 2000.)
SMPY’S EMPIRICAL FINDINGS
We open this section by discussing cognitive abilities. First, we
present descriptive data highlighting the individual differences
in cognitive ability among young adolescents in the top 1% of
quantitative reasoning ability and showing that these individual
differences made a difference in education, the world of work,
and creative accomplishments. We deal with this topic first
because there is a long-standing and widely held supposition of
an ‘‘ability threshold’’ in the scientific literature (i.e., an as-
sumption that beyond a certain point, more ability does not
matter; Getzels & Jackson, 1962; Howe, 2001; Renzulli, 1986).
Second, the psychological significance of ability pattern is ex-
plicated. After treating cognitive abilities, we discuss the in-
cremental validity of adding preferences to ability assessment
for modeling intellectual development more comprehensively
and then review the importance of time devoted to work and time
willing to devote to work. Next, the role of special educational
programs and the developmental particulars of top math-science
graduate students are touched upon. A focus on the math-sci-
ence pipeline is maintained throughout, but the personal at-
tributes relevant to other kinds of expertise are also covered. The
role of sex differences is also a focus of the discussion, and we
provide an appendix with some normative data illustrating how
sex differences in level and dispersion can collectively operate
to create disparate male:female ratios at high as well as low
extremes of ability. And finally, a concluding section places our
model and longitudinal findings in a broader historical context
and underscores the importance of the developmental sciences
and human-capital initiatives incorporating concepts and find-
ings from the study of individual differences.
Cognitive Abilities
Ability Level
The statement that more than one third of the ability range
is contained in the top 1% gives one pause initially, but con-
sider the following for a familiar illustration. Modern talent
searches and educational programs for intellectually talented
students have moved well beyond IQ, but let us take IQ as
a reference point. IQs in the top 1% begin at approximately
Fig. 1. The theory of work adjustment (TWA). In this framework, personal attributes (abilities and interests) and the environment (abilitiesrequirements and reinforcer system) are given equal emphasis; occupational tenure is a joint function of the correspondence between abilities andability requirements (satisfactoriness) and of the correspondence between interests and the reinforcer system (satisfaction). We have extended TWAto the domain of talent development. The diagrams on the left illustrate how cognitive abilities and interests have been conceptualized in our model(Lubinski & Benbow, 2000). In the diagram of the radex scaling of cognitive abilities, each region of concentration is denoted by a different letter,and higher numbers indicate increasing complexity. The diagram of Holland’s (1996) hexagon of interests (referred to as RIASEC, after the initialletters of the interests) shows a simplification following Prediger (1982); in this simplification, interests are modeled by a two-dimensional structureof independent dimensions: people-things and data-ideas.
320 Volume 1—Number 4
Antecedents of Math-Science Expertise
137 and extend beyond 200 (an IQ range of more than 63
points is thus found in the top 1%). (The same phenomenon
occurs in physical measurements such as height and weight.)
The important psychological question is, do ability differences
within the top 1% make a difference in life? To answer this
question, we examine educational credentials, occupational
outcomes, and creative accomplishments as a function of SAT-
M scores at age 13 (not all of our participants had SAT-V scores
available).
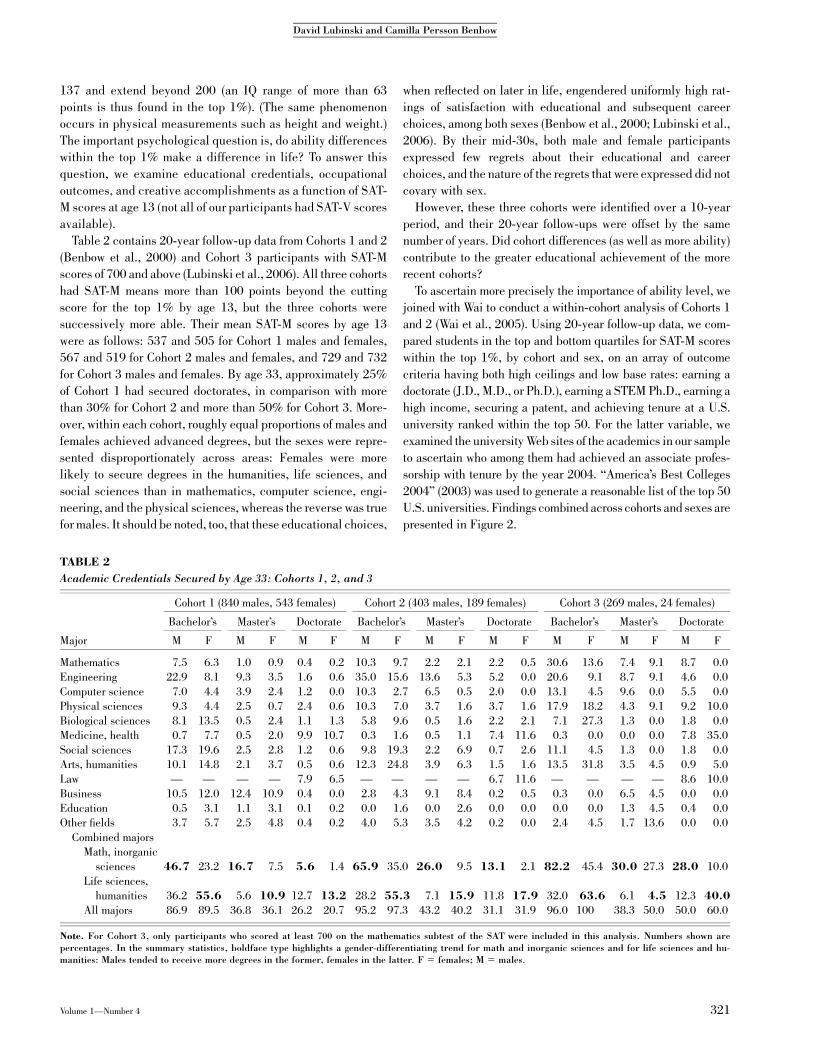
Table 2 contains 20-year follow-up data from Cohorts 1 and 2
(Benbow et al., 2000) and Cohort 3 participants with SAT-M
scores of 700 and above (Lubinski et al., 2006). All three cohorts
had SAT-M means more than 100 points beyond the cutting
score for the top 1% by age 13, but the three cohorts were
successively more able. Their mean SAT-M scores by age 13
were as follows: 537 and 505 for Cohort 1 males and females,
567 and 519 for Cohort 2 males and females, and 729 and 732
for Cohort 3 males and females. By age 33, approximately 25%
of Cohort 1 had secured doctorates, in comparison with more
than 30% for Cohort 2 and more than 50% for Cohort 3. More-
over, within each cohort, roughly equal proportions of males and
females achieved advanced degrees, but the sexes were repre-
sented disproportionately across areas: Females were more
likely to secure degrees in the humanities, life sciences, and
social sciences than in mathematics, computer science, engi-
neering, and the physical sciences, whereas the reverse was true
for males. It should be noted, too, that these educational choices,
when reflected on later in life, engendered uniformly high rat-
ings of satisfaction with educational and subsequent career
choices, among both sexes (Benbow et al., 2000; Lubinski et al.,
2006). By their mid-30s, both male and female participants
expressed few regrets about their educational and career
choices, and the nature of the regrets that were expressed did not
covary with sex.
However, these three cohorts were identified over a 10-year
period, and their 20-year follow-ups were offset by the same
number of years. Did cohort differences (as well as more ability)
contribute to the greater educational achievement of the more
recent cohorts?
To ascertain more precisely the importance of ability level, we
joined with Wai to conduct a within-cohort analysis of Cohorts 1
and 2 (Wai et al., 2005). Using 20-year follow-up data, we com-
pared students in the top and bottom quartiles for SAT-M scores
within the top 1%, by cohort and sex, on an array of outcome
criteria having both high ceilings and low base rates: earning a
doctorate (J.D., M.D., or Ph.D.), earning a STEM Ph.D., earning a
high income, securing a patent, and achieving tenure at a U.S.
university ranked within the top 50. For the latter variable, we
examined the university Web sites of the academics in our sample
to ascertain who among them had achieved an associate profes-
sorship with tenure by the year 2004. ‘‘America’s Best Colleges
2004’’ (2003) was used to generate a reasonable list of the top 50
U.S. universities. Findings combined across cohorts and sexes are
presented in Figure 2.
TABLE 2
Academic Credentials Secured by Age 33: Cohorts 1, 2, and 3
Major
Cohort 1 (840 males, 543 females) Cohort 2 (403 males, 189 females) Cohort 3 (269 males, 24 females)
Bachelor’s Master’s Doctorate Bachelor’s Master’s Doctorate Bachelor’s Master’s Doctorate
M F M F M F M F M F M F M F M F M F
Mathematics 7.5 6.3 1.0 0.9 0.4 0.2 10.3 9.7 2.2 2.1 2.2 0.5 30.6 13.6 7.4 9.1 8.7 0.0
Engineering 22.9 8.1 9.3 3.5 1.6 0.6 35.0 15.6 13.6 5.3 5.2 0.0 20.6 9.1 8.7 9.1 4.6 0.0
Computer science 7.0 4.4 3.9 2.4 1.2 0.0 10.3 2.7 6.5 0.5 2.0 0.0 13.1 4.5 9.6 0.0 5.5 0.0
Physical sciences 9.3 4.4 2.5 0.7 2.4 0.6 10.3 7.0 3.7 1.6 3.7 1.6 17.9 18.2 4.3 9.1 9.2 10.0
Biological sciences 8.1 13.5 0.5 2.4 1.1 1.3 5.8 9.6 0.5 1.6 2.2 2.1 7.1 27.3 1.3 0.0 1.8 0.0
Medicine, health 0.7 7.7 0.5 2.0 9.9 10.7 0.3 1.6 0.5 1.1 7.4 11.6 0.3 0.0 0.0 0.0 7.8 35.0
Social sciences 17.3 19.6 2.5 2.8 1.2 0.6 9.8 19.3 2.2 6.9 0.7 2.6 11.1 4.5 1.3 0.0 1.8 0.0
Arts, humanities 10.1 14.8 2.1 3.7 0.5 0.6 12.3 24.8 3.9 6.3 1.5 1.6 13.5 31.8 3.5 4.5 0.9 5.0
Law — — — — 7.9 6.5 — — — — 6.7 11.6 — — — — 8.6 10.0
Business 10.5 12.0 12.4 10.9 0.4 0.0 2.8 4.3 9.1 8.4 0.2 0.5 0.3 0.0 6.5 4.5 0.0 0.0
Education 0.5 3.1 1.1 3.1 0.1 0.2 0.0 1.6 0.0 2.6 0.0 0.0 0.0 0.0 1.3 4.5 0.4 0.0
Other fields 3.7 5.7 2.5 4.8 0.4 0.2 4.0 5.3 3.5 4.2 0.2 0.0 2.4 4.5 1.7 13.6 0.0 0.0
Combined majors
Math, inorganic
sciences 46.7 23.2 16.7 7.5 5.6 1.4 65.9 35.0 26.0 9.5 13.1 2.1 82.2 45.4 30.0 27.3 28.0 10.0
Life sciences,
humanities 36.2 55.6 5.6 10.9 12.7 13.2 28.2 55.3 7.1 15.9 11.8 17.9 32.0 63.6 6.1 4.5 12.3 40.0All majors 86.9 89.5 36.8 36.1 26.2 20.7 95.2 97.3 43.2 40.2 31.1 31.9 96.0 100 38.3 50.0 50.0 60.0
Note. For Cohort 3, only participants who scored at least 700 on the mathematics subtest of the SAT were included in this analysis. Numbers shown arepercentages. In the summary statistics, boldface type highlights a gender-differentiating trend for math and inorganic sciences and for life sciences and hu-manities: Males tended to receive more degrees in the former, females in the latter. F 5 females; M 5 males.
Volume 1—Number 4 321
David Lubinski and Camilla Persson Benbow

Figure 2 reveals that the top quartile of the top 1% in ability
outperformed the bottom quartile. Note especially the propor-
tion of tenured faculty within top U.S. universities. Individual
differences in the top 1% make a difference. It is important to
bear in mind that these participants were initially assessed by
the SAT before age 13. By the time they reached high school,
both quartiles were bumping their heads on the ceiling of the
SAT (and the exceptionally able were not readily distinguished
from the able). Thus, when highly talented youth reach high
school, the SAT is no longer sensitive to the full range of their
intellectual capabilities; for them, the SAT in high school
functions like age- or grade-based achievement tests did when
they were in seventh grade.
Data from Cohort 3, SMPY’s most able cohort (the top-1-in-
10,000 group), reinforce this idea (Lubinski et al., 2006). Some
of these participants bumped their heads on the SAT’s ceiling as
young adolescents! As a group, they are more able than the top
quartile analyzed in the study just described (Wai et al., 2005),
and their adult accomplishments are correspondingly more
impressive. We compared their outcomes at their 20-year follow-
up with the 10-year outcomes for SMPY’s Cohort 5: first- and
second-year graduate students attending the top 15 STEM
programs in the United States in 1992 (Lubinski, Benbow, Shea,
Eftekhari-Sanjani, & Halvorson, 2001).
When the follow-up data were collected (Lubinski et al.,
2006), the mean ages of the TS participants and the graduate
students were 33.6 and 35.4, respectively. Figure 3 graphs the
percentages of participants securing each of two important
outcomes (each parsed into three gradations): a tenure-track
position (at a U.S. university ranked within the top 25, from 26
through 50, or 51 or lower) or a high annual income ($100,000–
$249,000, $250,000–$499,000, or $500,0001). Although the
TS participants were identified merely by having one very high
test score by age 13, and the graduate students were identified
after they had secured admission to a world-class STEM de-
partment, their achievements are highly comparable.
Achieving tenure, and especially a full professorship, at a
top-ranked university requires internal and external evaluations
by leaders in the field, who look for documentation of creativity
and advancing the discipline. Indeed, at such institutions,
promotion to associate professor with tenure is considered
around a $3 million investment in human capital. That above-
level assessments can identify young adolescents who will
achieve top-50 tenure-track positions at rates comparable to
those of graduate students attending the top U.S. math, science,
and engineering doctoral programs is truly remarkable. Argu-
ably, the TS participants could be viewed as a bit more suc-
cessful overall, inasmuch as by their mid-30s, 21.7% of the TS
participants who were in tenure-track positions in the top 50
U.S. universities were already full professors, compared with
‘‘only’’ 6.5% of the graduate students. Moreover, an inordinate
number of TS participants earned especially high incomes (e.g.,
$500,0001), although the graduate students were 1.8 years
older than them at the follow-up.
Other outcome criteria in this study are noteworthy because
they underscore the creative accomplishments of both groups.
For example, earning patents is an excellent indicator of
creativity, or ‘‘inventive and scientific productivity’’ (Huber,
Fig. 2. Outcomes as a function of ability level (top vs. bottom quartile of scores on the SAT math subtest). The graphs showthe percentage of Cohort 1 and 2 participants who earned a doctorate (upper left; doctorate in science, technology, engi-neering, or math—STEM—is indicated by black shading), had an income equal to or greater than the median for their sex,earned a patent, and achieved tenure at a top-50 U.S. university. The mean SAT scores, at age 12, were 455 for the bottomquartile (Q1) and 620 for the top quartile (Q4). Outcomes were assessed 201 years later. Adapted from Wai, Lubinski, andBenbow (2005).
322 Volume 1—Number 4
Antecedents of Math-Science Expertise

1999, p. 49). Discussing the documentation on what constitutes
intellectual property, Huber (1998) remarked, ‘‘It would be hard
to find a field of study where so much effort has been expended in
establishing a definition. Perhaps the definition of invention is
the most solid definition in the field of creativity’’ (p. 61). The
percentages of graduate students (males: 32.1%, females:
20.9%) and TS participants (males: 17.8%, females: 4.3%) who
had earned patents was well beyond base-rate expectations.
Approximately 1% of the entire adult U.S. population holds at
least one patent (J.C. Huber, personal communication, October
27, 2004). Epidemiologists and other scientists take notice when
base rates double (Lubinski & Humphreys, 1997); therefore,
these percentages reflect an exceptional degree of creative ac-
complishment in science and technology. Graduate students
earned more patents than TS participants overall (26.6% vs.
14.5%, respectively), w2(1, N 5 966) 5 19.9, p< .001, which is
not surprising given that the graduate students were selected
from career tracks in which patents are commonly achieved, and
some TS participants were identified on the basis of their SAT-V,
rather than SAT-M, scores. When analyses were restricted to TS
participants who qualified on the basis of top-1-in-10,000 SAT-
M scores, the percentages of males and females who earned
patents rose to 20.1% and 9.1%, respectively; the difference in
the rates for graduate students and TS participants was still
statistically significant, but diminished (26.6% vs. 19.0%,
respectively), w2(1, N 5 807) 5 5.0, p < .05.4
SMPY’s findings on ability level are useful for multiple rea-
sons. Perhaps the most important is that they call into question
the ability-threshold hypothesis, the belief in which has been
Fig. 3. Percentage of graduate students (Cohort 5) and talent-search participants (Cohort 3, top 1 in 10,000) with tenure-track ortenured positions (left) and annual incomes of $100,000 or more (right) at follow-up. The data shown here are based on samples of299 and 287 male and female graduate students, respectively, and 286 and 94 male and female talent-search participants, re-spectively. From Lubinski, Benbow, Webb, and Bleske-Rechek (2006).
4This analysis illustrates the differential validity of measures of quantitativeversus verbal reasoning ability for creative technical accomplishments. Instudent selection, specific abilities also have differential validity in identifyingcontrasting potentialities. For example, in what is arguably psychology’s mostfamous longitudinal study (Terman, 1925, 1954), two future Nobel laureateswere assessed but rejected for longitudinal tracking (Shurkin, 1992): Luis Al-varez and William Shockley both came in under the cutting score on Terman’shighly verbal Stanford-Binet. Contemporary TS programs have broadened tal-ent-identification procedures by assessing both quantitative and verbal rea-soning, and an assessment of the former undoubtedly would have identified bothof these distinguished individuals during adolescence. One of our most ex-ceptional participants was identified well before adolescence using an above-level assessment of quantitative reasoning, SAT-M (Muratori et al., 2006); just afew months ago, at age 31, he was awarded the Fields Medal (equivalent to theNobel prize in mathematics). But talent searches still could do better. Theycould be expanded to include spatial ability, because talent searches currentlymiss approximately 50% of the top 1% in three-dimensional spatial visual-ization (Humphreys, Lubinski, & Yao, 1993; Shea, Lubinski, & Benbow, 2001;Webb, Lubinski, & Benbow, in press). Although modern talent searches areprobably missing few people with the quantitative potential of Alvarez andShockley (Lubinski, Benbow, et al., 2001), because of the inclusion of mathe-matical-reasoning measures, they are undoubtedly missing a number of peoplewith the intellectual strengths in nonverbal ideation characterizing individualssuch as Thomas Edison and Henry Ford, because of the exclusion of spatial-ability measures (Lubinski, 2004).
Volume 1—Number 4 323
David Lubinski and Camilla Persson Benbow

hard to shake. A recent letter published in Science, and signed
by 79 academic administrators and research scientists, working
primarily at major universities (Muller et al., 2005), stated:
‘‘There is little evidence that those scoring at the very top of the
range in standardized tests are likely to have more successful
careers in the sciences. Too many other factors are involved’’
(p. 1043). However, SMPY findings falsify this idea. The SMPY
longitudinal follow-ups have resolved the methodological diffi-
culties historically encountered in falsifying an ability threshold
(Lubinski & Dawis, 1992), such as securing an appreciable
sample of individuals within the top 1% of ability, being able to
distinguish the exceptionally able from the able (within the top
1%), finding criteria with sufficiently high ceilings and low base
rates, and implementing an appreciable longitudinal delay so
that extraordinary accomplishments can develop. All of these
design features were met in the studies discussed in this section.
To be sure, factors other than ability level are important, and
we review a number of them later in this section. Nevertheless,
other things being equal, more ability is always better, and there
was evidence to suggest this long before the letter appeared in
Science (Benbow, 1992; Benbow & Lubinski, 1996; Lubinski &
Humphreys, 1990b; Lubinski, Webb, et al., 2001). In addition to
Science, psychological outlets routinely disregard the impor-
tance of distinguishing between the able and the exceptionally
able in modeling outstanding achievement. For example, a re-
cent article in the American Psychologist stated:
Standardized tests are thus not sufficiently predictive of future
performance. Individuals are not necessarily more meritorious if
they obtain the highest scores on standardized tests, thus rendering
invalid the argument that students with the highest scores should
have priority in admissions. (Vasquez & Jones, 2006, p. 138)
This is simply not the case.
Ability Pattern
That quantitative reasoning ability contributes to securing an
advanced degree and, in particular, an advanced degree in
STEM areas is unquestionably true. However, given the gener-
ality of quantitative reasoning ability (Rivera-Batiz, 1992),
ability level speaks primarily to level of achievement, rather
than to the nature of achievement. To predict the latter, more
complex models are needed, and ability configuration is an
important consideration. Analyses reveal that patterns of spatial
and verbal abilities among mathematically gifted adolescents,
as for students in general (Humphreys, Lubinski, & Yao, 1993),
are critical for understanding qualitative differences in their
development (e.g., development that moves toward the human-
ities vs. the sciences vs. business, corporate, and marketing
arenas). The following description illustrates how.
A subset of Cohort 2 participants (393 males, 170 females)
was assessed during early adolescence on all three ability di-
mensions found in our model (see Fig. 1): mathematical, verbal,
and spatial reasoning abilities (Shea, Lubinski, & Benbow,
2001). Figure 4 presents 5-, 10-, and 20-year longitudinal
findings on four criteria: favorite and least favorite high school
course (reported at age 18), college major (at age 23), and oc-
cupation (at age 33). These outcomes are graphed as a function
of all three abilities. The x-axis represents mathematical ability
(SAT-M), the y-axis represents verbal ability (SAT-V), and the
z-axis represents spatial ability. Position on the z-axis is indi-
cated by the direction and length of the arrow emanating from
each data point; a right-pointing arrow indicates spatial ability
above the grand mean, and a left-pointing arrow indicates spa-
tial ability below the grand mean. The arrows were scaled on the
same units of measurement as the SAT scores (viz., z scores, or
standard deviation units).
Figure 4 shows that across all three time frames, exceptional
verbal ability, relative to mathematical and spatial ability, is
characteristic of participants whose favorite courses, college
majors, and occupations were in the social sciences and hu-
manities, whereas higher levels of math and spatial abilities,
relative to verbal abilities, characterize participants whose
favorite courses, college majors, and occupations were in en-
gineering and math or computer science. Physical sciences
appear to require appreciable amounts of all three abilities.
These developmentally sequenced outcomes tell an important
story. Among other things, they illustrate that individual
differences factor into life outcomes whether or not they are used
in selecting individuals for opportunities with the potential to
lead to these outcomes. Indeed, spatial ability is rarely, if ever,
assessed among applicants for advanced degree programs.
Moreover, although bright students are well aware of the im-
portance of scoring high on quantitative and verbal reasoning
abilities in order to gain access to subsequent educational op-
portunities, educational counselors and academic selection
committees hardly ever take spatial ability into consideration or
even mention it. Yet individual differences in this attribute
markedly influence whether students approach or avoid STEM
domains.
The importance of taking ability pattern into account also
holds for profoundly gifted individuals. Focusing exclusively on
one ability is never wise, because it could pale when viewed
alongside a stronger ability. Consider the following study. We
(Lubinski, Webb, et al., 2001) divided Cohort 3 participants (top
1 in 10,000) into three groups based on their ability pattern: Two
groups had contrasting intellectual strengths, with greater
ability in one area than the other (i.e., SAT-M score more than 1
SD above SAT-V score or vice versa; high-math and high-verbal
groups), and one group was more intellectually uniform (i.e.,
SAT-M and SAT-V scores within 1 SD of each other; high-flat
group). These three ability patterns, determined from assess-
ments at age 12, eventuated in distinct developmental trajec-
tories 10 years later. For example, the ability profiles predicted
differential course preferences among these three groups in high
school and college (see Fig. 5). On average, the high-math group
324 Volume 1—Number 4
Antecedents of Math-Science Expertise
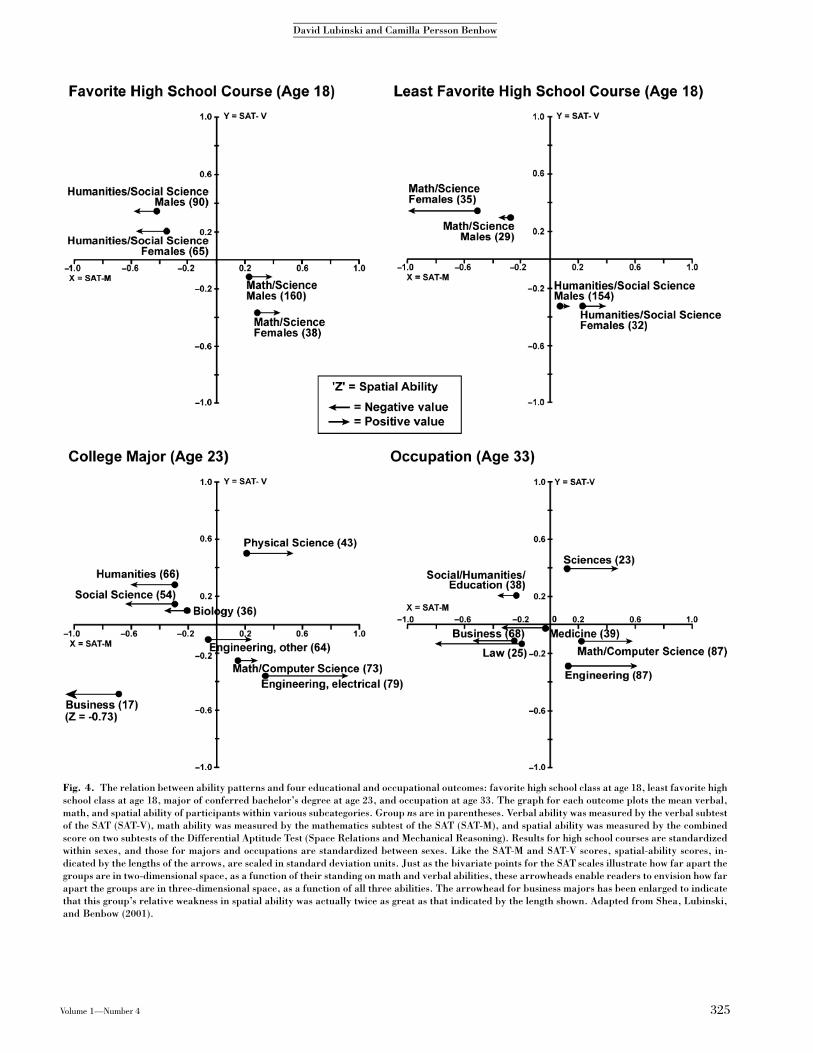
Fig. 4. The relation between ability patterns and four educational and occupational outcomes: favorite high school class at age 18, least favorite highschool class at age 18, major of conferred bachelor’s degree at age 23, and occupation at age 33. The graph for each outcome plots the mean verbal,math, and spatial ability of participants within various subcategories. Group ns are in parentheses. Verbal ability was measured by the verbal subtestof the SAT (SAT-V), math ability was measured by the mathematics subtest of the SAT (SAT-M), and spatial ability was measured by the combinedscore on two subtests of the Differential Aptitude Test (Space Relations and Mechanical Reasoning). Results for high school courses are standardizedwithin sexes, and those for majors and occupations are standardized between sexes. Like the SAT-M and SAT-V scores, spatial-ability scores, in-dicated by the lengths of the arrows, are scaled in standard deviation units. Just as the bivariate points for the SAT scales illustrate how far apart thegroups are in two-dimensional space, as a function of their standing on math and verbal abilities, these arrowheads enable readers to envision how farapart the groups are in three-dimensional space, as a function of all three abilities. The arrowhead for business majors has been enlarged to indicatethat this group’s relative weakness in spatial ability was actually twice as great as that indicated by the length shown. Adapted from Shea, Lubinski,and Benbow (2001).
Volume 1—Number 4 325
David Lubinski and Camilla Persson Benbow

preferred math and science courses to humanities courses,
whereas the inverse was true for the high-verbal group; results
for the high-flat group were intermediate.
We grouped participants’ responses to open-ended queries
about their accomplishments and awards into three clusters:
humanities and arts, science and technology, and unclassifiable
(‘‘other’’; see Tables 3 and 4) and then went back to ascertain
whether these three clusters were occupied differentially by the
three ability groups (Lubinski, Webb, et al., 2001). Table 4 re-
veals that three fourths of the classifiable accomplishments and
awards of high-math participants were in science and technol-
ogy; by comparison, two thirds of the classifiable accomplish-
ments of high-verbal participants were in the humanities and
arts. High-flat participants reported similar numbers of ac-
complishments in the two clusters. It appears that ability pattern
relates to the time and effort devoted to various activities.
These findings on course preferences, individual awards, and
creative pursuits illustrate a common finding in counseling and
vocational psychology: Ability pattern is critical for choice
(Dawis, 1992; Dawis & Lofquist, 1984; Gottfredson, 2003;
Humphreys et al., 1993). Administering one test in isolation to a
group of talented adolescents is not enough to appreciate their
psychological diversity. All three groups in the study just dis-
cussed had impressive mathematical and verbal abilities, but
tilted profiles were highly related to differential development. If,
for instance, one were to focus exclusively on the quantitative
reasoning abilities of the high-verbal group (viz., mean SAT-M
5 556 before age 13), extraordinary promise for STEM domains
might be readily inferred. Yet despite the impressive quanti-
tative reasoning abilities of these students, their even more
exceptional verbal prowess appears to have pushed their de-
velopment in other directions.
Preferences
The foregoing review of ability level and pattern is helpful in
understanding the magnitude of development of the exception-
ally able and the distinct educational and occupational niches
that individuals with contrasting ability profiles seek out and
ultimately occupy. But there is more to the story. Abilities
capture only one class of TWA person variables: those relevant
to satisfactoriness. Also important are preferences, the person
variables relevant to satisfaction. Although research has dem-
onstrated a number of small correlations between abilities and
Fig. 5. Cohort 3 participants’ favorite course in high school and in college as a function of ability profile (Lubinski, Webb, Morelock, & Benbow,2001). Participants in the high-math group had SAT-math (SAT-M) scores more than 1 standard deviation above their SAT-verbal (SAT-V) scores, andparticipants in the high-verbal group had the reverse profile; participants in the high-flat group had SAT-M and SAT-V scores within 1 standarddeviation of each other. Percentages in a given column do not necessarily sum to 100% because only data from participants indicating math-science orhumanities courses are displayed.
326 Volume 1—Number 4
Antecedents of Math-Science Expertise

interests (Ackerman, 1996; Ackerman & Heggestad, 1997;
Schmidt, Lubinski, & Benbow, 1998), they are sufficiently un-
correlated that they must be assessed independently for optimal
educational and vocational counseling (Dawis, 1992, 2001;
Lubinski, 1996, 2001; Savickas & Spokane, 1999).
Holland’s (1996) hexagon of interests (referred to as the
RIASEC model because the six interests are Realistic, Inves-
tigative, Artistic, Social, Enterprising, and Conventional) is the
most widely accepted model of educational-vocational interests
(Day & Rounds, 1998). We use this framework to represent the
preference component in our model (Fig. 1), although other
preference inventories could be used instead (Dawis, 1991;
Dawis & Lofquist, 1984; Savickas & Spokane, 1999).
A conspicuous sex difference in interests and values, one that
goes back at least to Thorndike (1911), involves the prominence
of a people-versus-things dimension (Lippa, 1998, 2006; Lu-
binski, 2000). This dimension runs from Social (people contact)
to Realistic (things and gadgets) in Holland’s hexagon, and it is
salient in other preference instruments and models as well.
Females and males consistently display a mean difference larger
than 1 standard deviation on this dimension. Girls and women,
on average, tend to prefer to learn about and work with people
(or, more generally, organic content), whereas boys and men, on
average, tend to prefer to learn about and work with things (or,
more generally, inorganic content). Unfortunately, the contem-
porary social science literature often fails to highlight the
relevance of male-female differences on this dimension for
STEM pursuits, despite voluminous evidence supporting its
importance for these pursuits (Achter et al., 1996; Campbell,
1971; Savickas & Spokane, 1999; Strong, 1943; Tyler, 1974;
Williamson, 1965).
Lippa (1998), for example, published three studies on this
robust dimension of individuality and discussed the role it plays
in personality development. Examining the effect of gender on
preference for people versus things, he obtained an effect size
(female minus male) of 1.20 standard deviation units or greater
in each study (Lippa, 2006). This preference difference between
men and women, which is also conspicuous in intellectually
precocious samples, undoubtedly contributes to the prepon-
derance of females with profound mathematical gifts who choose
to become physicians rather than engineers and physical sci-
entists (see Table 2). Highly talented males, by contrast, are
much more likely to become STEM professionals.
Preference Findings from SMPY
Over the 1990s, a series of articles documented the utility of
conducting above-level preference assessments with intellec-
tually precocious youth (i.e., studying this population using
preference questionnaires initially developed on older adoles-
cents and young adults). In a study of Cohort 4, Achter et al. (1996)
documented the amount of their psychological diversity on the
TABLE 3
Awards and Special Accomplishments of Cohort 3
Science and technology
Published scientific work (11)
Developed software (8)
Patented an invention (4)
Received National Science Foundation fellowship (2)
Designed image-correlation system for navigation for Mars Landing
Program (1)
Received the American Physical Society’s Apker Award (1)
Graduated from MIT in 3 years at age 19 with a perfect grade
point average and graduated from Harvard Medical School (M.D.)
at age 23 (1)
Received teaching award for ‘‘Order of Magnitude Physics’’ (1)
Humanities and arts
Published creative writing (7)
Created noteworthy art or music (6)
Received Fulbright award (2)
Wrote proposal for a novel voting system for the new
South African Constitution (1)
Made solo violin debut (age 13) with the Cincinnati
Symphony Orchestra (1)
Named Mellon Fellow in the Humanities (1)
Named Presidential Scholar for Creative Writing (1)
Received Hopwood writing award (1)
Received Creative Anachronisms Award of Arms (1)
Won first place in midreal-medieval poetry (1)
Received fellowship for foreign-language study (1)
Received international predissertation award (1)
Other
Inducted into Phi Beta Kappa (71)
Inducted into Tau Beta Pi (30)
Inducted into Phi Kappa Phi (14)
Received award for entrepreneurial enterprises (2)
Inducted into Omicron Delta Kappa (1)
Received Olympiad silver medal (1)
Finished bachelor’s and master’s degrees in 4 years (1)
Received private pilot’s license in 1 month at age 17 (1)
Note. The numbers in parentheses indicate the number of participants witheach accomplishment (also see Table 4). Adapted from Lubinski, Webb,Morelock, and Benbow (2001).
TABLE 4
Number of Accomplishments and Awards Classified as Science-
Technology Versus Arts-Humanities as a Function of Ability
Group in Cohort 3
GroupSciences andtechnology
Humanitiesand arts
High math 16 5
High flat 6 6
High verbal 7 13
Note. High flat 5 participants with SAT-mathematics (SAT-M) and SAT-ver-bal (SAT-V) scores within 1 standard deviation of each other; high math 5
participants with SAT-M scores more than 1 standard deviation beyond theirSAT-V scores; high verbal 5 participants with SAT-V scores more than 1standard deviation beyond their SAT-M scores. All participants earned anSAT-V score of 630 or more or an SAT-M score of 700 or more (or both) by age13. The outcome data were collected in their 10-year after-college follow-up.
Volume 1—Number 4 327
David Lubinski and Camilla Persson Benbow

individual differences indexed by the Strong-Campbell Interest
Inventory’s RIASEC dimensions (Harmon, Hansen, Borgen, &
Hammer, 1994) and the Study of Values (SOV; Allport, Vernon, &
Lindzey, 1970). Table 5 reports the rank orders of the six themes
on each instrument, among all participants in Cohorts 1 through 4
at their initial assessment (but for Cohort 4, only participants with
abilities in the top 1% were included in this analysis). Counselors
tend to focus on the top two or three themes in working with
students and clients, and it is clear from these rank orders that the
sexes differ in their priorities. For example, 72% of males and
35% of females had Theoretical values ranked as one of their top
two SOV dimensions. In contrast, 16% of males and 61% of
females had Artistic interests ranked as one of their top two
RIASEC dimensions, and 15% of males and 41% of females had
Aesthetic values ranked as one of their top two SOV dimensions.
Social interests and values were nearly 3 times as likely to be in
the top two for females as for males, whereas males were 4 times as
likely as females to rank Realistic interests as one of their top two
themes. Clearly, these results show a people-versus-things sex
difference. (Contrast these findings with the lack of sex differen-
ces on these measures among top math-science graduate students,
discussed later, in Top STEM Graduate Students.)
Two independent investigations documented the longitudinal
stability of scores on these instruments for intellectually tal-
ented youth. RIASEC preferences were examined for Cohort 2
(N 5 162, age 13 to age 28; Lubinski, Benbow, & Ryan, 1995),
and SOV preferences were examined for Cohort 1 (N 5 202, age
13 to age 33; Lubinski, Schmidt, & Benbow, 1996). Not only do
these studies support the temporal stability of scores on these
instruments, but the variability of the scores highlights the
breadth of psychological diversity among intellectually talented
youth on a class of variables that are relatively independent of
abilities and relevant to educational-vocational choice (Dawis,
1991, 1992). Other studies have provided evidence for the
construct validity of these preference measures (Schmidt et al.,
1998)—including the improvement in prediction obtained by
including preferences along with abilities in forecasting college
degree major 10 years later (Achter, Lubinski, Benbow, & Ef-
tekhari-Sanjani, 1999) and occupation 20 years later (Wai et al.,
2005). The findings of the latter two studies are sufficiently
noteworthy to justify further review.
Teaming Abilities and Preferences
We conducted one of these studies (Achter et al., 1999) to as-
certain whether the SOV provides incremental validity beyond
the SAT in predicting college majors. Across SMPY Cohorts 1, 2,
and 3, a total of 432 participants had scores for both instruments
and had reported earning a college degree by their 10-year
follow-up. These participants were grouped into three categories
based on whether they secured their degree in the humanities,
math or science, or something else. Then, we conducted a dis-
criminant function analysis, utilizing the SAT and SOV scores,
to uncover the psychological variables differentiating these
groups.
Table 6 provides the discriminant function loadings of the two
dimensions derived from this analysis. These loadings form
distinct math-science and humanities amalgams, with math
ability and Theoretical values loading most strongly on Function
1 (coupled with negative loadings for Social and Religious val-
ues), and verbal ability and Aesthetic values loading most
strongly on Function 2. Incremental-validity analyses revealed
the SAT-M and SAT-V measures accounted for 10% of the
variance among these three groups, and the five SOV scales
accounted for an additional 13% of the variance. Given the
heterogeneity within these three broad degree groupings, and
considering that the assessment occurred a decade earlier at age
13, the fact that the scores accounted for 23% of the variance is
impressive. By showing that age-13 preference assessments
provided incremental validity to SAT assessments in predicting
educational outcomes at age 23, this study established the im-
portance of assessing both abilities and preferences for working
with talented youth in applied psychological services and for
TABLE 5
Rank Order of Preferences for Cohorts 1 through 4
Rankorder
Interest/Value theme
Investigative/Theoretical
Artistic/Aesthetic
Enterprising/Economic Social/ Social
Realistic/Political
Conventional/Religious
M F M F M F M F M F M F
1 52/45 37/19 5/7 35/22 7/15 3/7 2/8 9/29 19/21 4/12 18/10 16/15
2 24/27 27/16 11/8 26/19 11/28 7/12 5/11 21/25 22/22 5/18 28/5 15/13
3 11/15 19/18 11/9 9/20 22/21 15/13 10/18 22/18 20/26 18/18 27/9 18/10
4 8/7 10/20 17/22 11/13 29/17 20/20 11/24 16/14 19/17 19/20 15/10 21/12
5 4/5 6/15 24/22 9/14 22/13 26/26 30/28 14/10 13/11 26/16 7/20 17/16
6 1/2 2/12 32/32 11/12 10/6 29/22 42/12 18/4 7/3 27/16 4/47 13/33
Note. The table presents the percentage of male (M) and female (F) participants for whom each preference had the indicated rank. Themes designed tomeasure conceptually similar constructs were aligned as much as possible. In each cell, results for the Strong-Campbell Interest Inventory (RIASECdimensions) are given first, followed by results from the aligned dimension from the Study of Values (SOV). The data come from the initial assessments ofCohorts 1 through 4. For the SOV, n 5 611 for males and 348 for females; for the Strong-Campbell inventory, n 5 474 for males and 211 for females.
328 Volume 1—Number 4
Antecedents of Math-Science Expertise

modeling their development theoretically in the context of TWA.
It should be noted, however, that the participants in the math-
science group were more readily distinguishable from the two
other groups than those two groups were from each other:
Function 1 accounted for 75% of the predictable variance, and
Function 2 accounted for the remaining 25%.
Figure 6 shows the three groups’ bivariate means on these two
functions. Lines connecting these three bivariate means form
the unshaded triangle, and lines from each point running
through the midpoint of the other two parse the two-dimensional
space formed by these functions into three exhaustive regions,
where participants earning degrees in the humanities (top left),
science (right), and other disciplines (bottom left) would be
expected to fall (see Achter et al., 1999, for further details).
Subsequently, the generalizability of these regions for later
stages of development was examined.
In a study conducted a decade later (Wai et al., 2005), these
ability-preference findings (Achter et al., 1999) predicting
educational outcomes were evaluated for their generalizability
to occupational outcomes. Specifically, we were interested in
ascertaining whether the functions were robust enough to
maintain their validity over another decade by predicting oc-
cupational-group membership at age 33. If age-33 occupational
data could be shown to occupy regions drawn with discriminant
functions based on age-13 assessments and calibrated on age-23
educational criteria, the psychological significance of these
functions would accrue additional validity. Across Cohorts 1, 2,
and 3, there were 323 men and 188 women who had taken both
the SATand the SOVat age 13 and who had 20-year longitudinal
data listing an occupation. These participants’ occupations were
classified as in the humanities, math or science, or another area,
and their discriminant function scores were plotted in the space
derived in the previous study (Achter et al., 1999). Figure 6
shows the three occupational groups’ bivariate means on the two
discriminant functions. Lines connecting these three bivariate
means form the shaded triangle. (Bivariate means for some in-
dividual occupational groups are also plotted.) For each of the
three major categories, the percentage of hits (participants
predicted to be in the category and actually in the category) and
misses (participants predicted to be in the category but in one
of the other two categories) is provided in each region. Clearly,
the preponderance of each group is classified correctly, which
suggests that teaming abilities and preferences is useful for
predicting qualitative differences in occupational choice. In-
deed, a salient people-versus-things dimension (or, as we prefer,
an organic-inorganic dimension), not illustrated in the figure,
runs between nurses and homemakers along the dashed-line
boundary between the ‘‘Humanities’’ and ‘‘Other’’ regions and
extends through the bivariate point for math-science occupa-
tions, continuing on under the positive x-axis between engineers
and computer scientists.
Function 1, the math-science function, accounted for the
majority of variance among the three groups, inasmuch as in
both studies, the math-science group was more readily distin-
guished from the other two groups than those two groups were
from each other. Nevertheless, both functions provide powerful
analytic tools for conceptualizing educational and career
choices. Moreover, these findings also suggest how learning and
work environments can be adjusted to match the differential
proclivities of students and professionals who differ markedly on
these functions, although a discussion of such implications is
beyond the scope of this article. These functions afford insight
into how members of different professions (manifesting signifi-
cant group differences on these two functions) approach intel-
lectual problems and create contrasting but dispositionally
congruent organizational climates (Bouchard, 1997; Lubinski,
1996, 2000). In essence, these functions tell an important story
about the intellectual character of intellectually talented
populations and the environments they are motivated to seek
out, avoid, and even create (Bouchard, 1997; Scarr, 1996). They
are also helpful in conceptualizing sex differences: In the oc-
cupational study (Wai et al., 2005), for example, the differences
between males and females (males minus females) on Function 1
and Function 2, measured in standard deviation units, were 1.54
and �1.05, respectively.
Modeling Talent Development More Comprehensively
One important dimension missing in the aforementioned studies
is spatial ability. The model depicted in Figure 1 has three
cognitive abilities, and many investigators have made a com-
pelling case for assessing all three in educational practice and
research (Gohm, Humphreys, & Yao, 1998; Gottfredson, 2003;
Humphreys et al., 1993; Snow, 1994, 1999). But the studies that
we have summarized involved only mathematical and verbal
reasoning measures. Recently, we conducted a 5-year study in
which we examined mathematical, verbal, and spatial abilities,
along with two broad preference inventories, the SOV and the
Strong Interest Inventory (RIASEC dimensions), as predictors
TABLE 6
Discriminant Function Structure Matrix Containing Two
Functions for Predicting College Degree (Humanities, Math-
Science, or Other)
Variable Function 1 Function 2
SAT verbal score .09 .56
SAT math score .59 �.12
Study of Values
Theoretical .87 �.03
Aesthetic �.13 .81
Social �.60 �.01
Religious �.56 .03
Economic .47 �.29
Note. The bivariate group means (Function 1 followed by Function 2) were�.29 and .60 for humanities degrees, .43 and �.05 for math-science degrees,and �.57 and �.21 for other degrees. From Achter, Lubinski, Benbow, andEftekhari-Sanjani (1999).
Volume 1—Number 4 329
David Lubinski and Camilla Persson Benbow

of educational outcomes and occupational intentions (Webb,
Lubinski, & Benbow, in press). This study constitutes the most
comprehensive mapping of our talent-development model to
date.
Our outcome variables were based on information collected
from SMPY’s Cohort 4 at their age-18 follow-up (i.e., after high
school). The five criterion variables were favorite high school
course, least-favorite high school course, preferred leisure
Fig. 6. Location of college-degree and occupational categories (humanities, math-science, or other) in a two-dimensional space defined bythe discriminant functions in Table 6 (x 5 Function 1, y 5 Function 2). Lines connecting the bivariate means of these two functions for collegemajors form the unshaded triangle, whereas lines connecting the bivariate means for occupations form the shaded triangle. A number ofspecific occupations are plotted within this two-dimensional space (with sample sizes in parentheses). (Two occupations, physician andlawyer, were not classified in one of the three criterion groups, but their bivariate points are plotted to show where they fall in this space.)This space was partitioned into three exhaustive regions by drawing a line from each college major’s bivariate mean through the midpoint ofthe other two college majors’ bivariate means (see the dashed lines). Then, the percentage of participants with occupations corresponding tothe area that their bivariate points fell in was calculated. The boldface entry in the box in each region indicates the percentage of participantspredicted to be in that category who were in fact in that category (i.e., hits); the remaining percentages indicate the percentage of peoplepredicted to be in the category who were in each of the other categories (i.e., misses). From Wai, Lubinski, and Benbow (2005).
330 Volume 1—Number 4
Antecedents of Math-Science Expertise

activity, college major, and planned occupation. Two sets of
discriminant function analyses were performed—one for each
preference inventory. For all five criterion variables, the incre-
mental validity of spatial ability was evaluated, following the
entry of the SAT and either the SOV or RIASEC themes. These
analyses are too extensive to be reviewed thoroughly here, but,
on average, spatial ability added 2.4% incremental validity to
the prediction of these criteria. As before, the first discriminant
function to emerge in these analyses was a math-science func-
tion, and Table 7 presents the results for this function, averaged
across all five criterion variables, for each preference inventory.
For both the SOV and the RIASEC themes, a salient math-sci-
ence ability pattern emerges in Function 1. For example, salient
positive math and space loadings and negative verbal loadings
are found in this structure matrix, coupled with positive theo-
retical and negative social, aesthetic, and religious preferences.
In interpreting these functions and those from the discriminant
function studies discussed in the previous section (Achter et al.,
1999; Wai et al., 2005), however, one should not surmise that the
negative weights for verbal ability mean that development of
math-science expertise does not involve verbal ability. Rather, it
would be more precise to say that individuals with extraordinary
verbal ability, especially when it is accompanied by somewhat
lower math and space abilities, are more inclined to pursue other
areas (as discussed earlier).
Naturally, the findings involving spatial ability must be in-
terpreted with caution, because they reflect only 5-year longi-
tudinal data and intentions as opposed to actual outcomes for
4-year college degrees and occupations. Nevertheless, other
researchers have observed the same pattern in more mature
samples (Austin & Hanisch, 1990; Gohm et al., 1998; Hum-
phreys & Lubinski, 1996; Humphreys et al., 1993; Smith, 1964).
Moreover, given that the psychometric properties of the SAT,
RIASEC dimensions, and SOV, when applied to intellectually
precocious young adolescents who are then followed for 20
years, have consistently mirrored findings on more mature
populations, these results hold promise. At the very least, all of
these findings combine to suggest that modern talent searches
should be augmented to include measures of spatial visualiza-
tion in the selection process, and doing so is likely to uncover
some STEM talent currently being lost. Indeed, it is estimated
that contemporary talent searches miss approximately half of the
top 1% in spatial ability (Shea et al., 2001; Webb et al., in press),
by exclusively restricting talent identification to mathematical
and verbal abilities.
Finally, although exploring sex differences is not a primary
thrust of our work, they are hard to ignore. Sex differences on the
two functions in Table 8 are especially revealing. The average
effect size for sex (males minus females) across the series of five
discriminant functions based on the SOV was 1.04, and the
average effect size across the series of five discriminant func-
tions based on the RIASEC dimensions was 1.04 as well. Thus,
rather large differences between the sexes are uncovered when
models aggregate different classes of relevant variables (abili-
ties and preferences), and these variables all display sex
differences in the same direction when calibrated for STEM
pursuits. The perplexities encountered when focusing on one
class of relevant variables are, to a certain extent, resolved
when more complete models are considered. Moreover, personal
attributes beyond abilities and preferences are germane to
STEM pursuits; these attributes manifest large individual dif-
ferences as well and are helpful in further clarifying individual
and group differences in occupational outcomes (especially in
STEM areas).
Conative Factors
It takes more than the right mix of specific abilities, interests,
values, and opportunities to be attracted to and excel in STEM
areas (Lubinski & Benbow, 2000; Lubinski, Benbow, et al.,
2001; Tyler, 1974; Williamson, 1965). Conative variables are
highly important for mastering these intellectually demanding
and time-intensive disciplines, and they are underappreciated
relative to abilities and interests. Regardless of the domain of
distinction (securing tenure at a top university, making partner
at a prestigious law firm, or becoming chief executive officer
of a major organization), notable accomplishments are rarely
achieved by people who work 40 hr per week or less (Campbell,
TABLE 7
Loadings for Two Sets of First Discriminant Functions Predicting
Three Criterion Groups in Cohort 4: Math-Science, Humanities,
and Other
Analysis
Study of Values RIASEC dimensions
Variable Loading Variable Loading
Realistic .11
Theoretical .57 Investigative �.04
Aesthetic �.42 Artistic �.69
Social �.36 Social �.51
Economic .47 Enterprising �.42
Religious �.17 Conventional .02
SAT-V �.19 SAT-V �.24
SAT-M .39 SAT-M .30
Spatial ability .70 Spatial ability .64
Note. Interest and value themes designed to measure conceptually similarconstructs have been aligned as much as possible. Each loading in the struc-ture matrix is the mean correlation taken over five criterion variables forFunction 1: favorite high school course, least favorite high school course(reverse-scored), preferred leisure activity, undergraduate major, and ex-pected occupation. Two sets of five discriminant functions were run. Bothincluded three abilities: SAT verbal score (SAT-V), SAT math score (SAT-M),and a spatial-ability composite of two Differential Aptitude Tests (MechanicalReasoning and Space Relations). One of the functions utilized the scales fromthe Study of Values (SOV), and the other utilized the RIASEC interests. Be-cause the SOV is an ipsative measure (all profiles sum to 240), all the infor-mation is contained in any five scales, and the sixth is completely redundant;the Political scale was arbitrarily omitted from our analyses. Adapted fromWebb, Lubinski, and Benbow (in press).
Volume 1—Number 4 331
David Lubinski and Camilla Persson Benbow

1977; Ericsson, 1996; Eysenck, 1995; Gardner, 1993; Jackson
& Rushton, 1985; Simonton, 1988; Zuckerman, 1977). World-
class performers work on average 60 to 80 hr per week with
commitment and passion. Galton’s (1869) observations about the
capacity for work, will, and zeal exhibited by extraordinary
performers are as true today as when he made them.
Consider the following remarks by a leading authority on the
development of eminence and a distinguished biologist:
Making it big [becoming a star] is a career. People who wish to do
so must organize their whole lives around a single enterprise. They
must be monomaniacs, even megalomaniacs, about their pursuits.
They must start early, labor continuously, and never give up the
cause. Success is not for the lazy, procrastinating, or mercurial.
(Simonton, 1994, p. 181)
I have been presumptuous enough to counsel new Ph.D.’s in bi-
ology as follows: If you choose an academic career you will need
forty hours a week to perform teaching and administrative duties,
another twenty hours on top of that to conduct respectable re-
search, and still another twenty hours to accomplish really impor-
tant research. This formula is not boot-camp rhetoric. (Wilson,
1998, pp. 55–56)
In all of our age-33 follow-ups, we have examined how much
time our participants devote to their careers and how much time
they are willing to devote to their careers. Figure 7 summarizes
responses to two questions from SMPY’s 20-year follow-up of
Cohorts 1 and 2 (Benbow et al., 2000; Lubinski & Benbow,
2000). At age 33, participants were asked how much they would
be willing to work in their ‘‘ideal job’’ and how much they ac-
tually did work. Figure 8 summarizes answers to the same two
questions from SMPY’s Cohorts 3 and 5 (the top-1-in-10,000
group and the top math-science graduate students, respective-
ly), when both samples were in their mid-30s (Lubinski et al.,
2006). These data, taken from four extraordinarily able cohorts
TABLE 8
Rank Order of Preferences for Cohort 5
Interest/Value theme
Rankorder
Investigative/Theoretical
Artistic/Aesthetic
Enterprising/Economic Social/Social
Realistic/Political
Conventional/Religious
M F M F M F M F M F M F
1 64/43 52/44 16/21 23/20 2/9 2/12 10/14 9/13 11/7 13/6 3/12 5/10
2 25/30 33/26 24/21 23/19 1/14 2/20 12/16 12/12 29/10 21/12 7/9 10/10
3 7/14 11/13 25/16 19/25 4/16 5/17 20/23 19/21 26/20 27/21 17/8 17/5
4 3/8 2/9 12/20 13/15 12/16 15/18 32/20 28/21 18/26 23/23 21/9 19/10
5 0/4 1/7 11/14 12/12 28/25 28/20 15/20 17/24 10/23 8/22 36/13 32/13
6 1/1 1/2 11/8 10/8 53/19 47/14 11/8 15/8 6/15 8/15 16/48 16/52
Note. The table presents the percentage of male (M) and female (F) participants for whom each preference had the indicated rank. Themesdesigned to measure conceptually similar constructs were aligned as much as possible. In each cell, results for the Strong-Campbell InterestInventory (RIASEC dimensions) are given first, followed by results from the aligned dimension from the Study of Values (SOV). For the SOV, n 5
362 for males and 342 for females; for the Strong-Campbell inventory, n 5 362 for males and 340 for females.
Fig. 7. Number of hours participants in Cohorts 1 and 2 worked perweek and were willing to work per week in the ideal job, by sex. Par-ticipants were surveyed when they were in their mid 30s; they were askedhow many hours per week they typically worked (top panel; homemakerswere excluded from this question) and how many hours per week theywere willing to work, given their job of first choice (bottom panel).Adapted from Lubinski and Benbow (2000).
332 Volume 1—Number 4
Antecedents of Math-Science Expertise

and assimilated over multiple time points, reveal considerable
variation in the noncognitive factor of willingness to work long
hours. To understand the possible impact of this factor, one need
only imagine the differences in research productivity likely to
accrue over a 5- to 10-year interval between faculty members,
research scientists, or lawyers who work 45-hr weeks and those
who work 65-hr weeks (other things being equal). The same
pattern would emerge for advancing knowledge or achieving
distinction in other occupational pursuits (see especially
Campbell, 1977, p. 58).
These figures also reveal another interesting sex difference
that is difficult to ignore: The percentage of individuals who were
working and preferred to work less than 40 hr per week was
appreciably greater among the women than the men. These data
Fig. 8. Number of hours graduate-student (GS) and talent-search (TS; Cohort 3—top 1 in 10,000) participantsworked per week and were willing to work per week in the ideal job, by sex (cf. Fig. 7). Participants were surveyedwhen they were in their mid-30s. The data for hours worked are based on ns of 276 and 264 for male and female GSparticipants, respectively, and 217 and 54 for male and female TS participants, respectively. The data for hoursparticipants were willing to work are based on ns of 269 and 263 for male and female GS participants, respectively,and 206 and 57 for male and female TS participants, respectively. From Lubinski, Benbow, Webb, and Bleske-Rechek (2006).
Volume 1—Number 4 333
David Lubinski and Camilla Persson Benbow

fit with a number of reports in the popular press indicating that
many women graduating from elite colleges are opting out of
career tracks, preferring to become stay-at-home mothers (cf.
Story, 2005), as well as with reports on middle-aged women
voluntarily leaving highly successful careers to pursue other
interests (cf. Kuczynski, 2002). These findings align with gender
differences uncovered in other studies of occupational aspir-
ations and time devoted to work (Bhargava, 1986; Browne, 2002;
V.R. Fuchs, 1988; Hoffman & Reed, 1982; Shye, 1991; Wood,
Corcoran, & Courant, 1993). That these findings are observed in
highly talented men and women who are similarly able, similarly
aware of their abilities, and similarly satisfied with their current
careers and life in general at age 33 (Benbow et al., 2000; Lu-
binski et al., 2006) indicates that sex differences in occupa-
tional outcomes cannot be fully understood by examining only
levels and patterns of abilities, interests, values, and oppor-
tunity. Conative factors also need to be incorporated when
modeling sex differences in outcomes.
If sex differences in time devoted to work persist, large sex
differences in creativity, occupational accomplishments, and
work-related outcomes will remain over time. Indeed, we
(Benbow et al., 2000) found that controlling for number of hours
worked eliminated the commonly observed statistically signifi-
cant sex differences in income. How much time individuals are
willing to devote to their careers also engenders different pro-
fessional opportunities, particularly in STEM areas. Staying up
to date in these areas requires assimilating a continuous stream
of not only substantive but also technical knowledge: One way in
which STEM careers are more challenging than careers in other
disciplines is the extent to which they are technologically rich
and ever-changing (almost continuous technical updating is
required). Many disciplines are, of course, experiencing great
technological changes, but they are undoubtedly more intense in
STEM areas. In these disciplines, taking a leave of absence or
working part time for a number of years is possible, but doing so
reduces significantly the likelihood of reentering where one left
off or of keeping up to date and subsequently achieving a high-
impact leadership role. Albert Einstein noted that one of the
more powerful forces of nature is the compounding of interest.
The same holds for productivity. It too compounds, and thus, it is
hard to catch up if earlier contributions are missing or unim-
pressive. Perhaps this is why it is often found that eminent in-
dividuals began to develop their talent early. The sooner a
person manifests exceptional performances, the sooner he or she
is likely to be recognized by others and to stimulate the provision
of opportunities for further development, which if seized upon
will make that person stand out even more and increase, in turn,
the likelihood of even more opportunity, and so on—this is the
multiplicative effect of taking advantage of opportunity (Zuck-
erman, 1977), or simply compounding.
For many individuals, however, balancing work and family
becomes a true challenge when pursuing a highly competitive
career (Browne, 2002; Rhoads, 2004), and it is not clear how to
best meet this challenge. What is clear is that individual dif-
ferences will likely factor into ultimate life choices (Tyler,
1974); people vary in how they choose to allocate their time,
because what some may consider a minor inconvenience, others
may view as totally unacceptable (cf. Lubinski & Benbow,
2001). What SMPY findings suggest, however, and what decades
of individual differences research have revealed for all of the
personal attributes examined here (Lubinski, 2000; Tyler,
1965), is that there is much more variation within groups than
between groups. Therefore, for a long time, the best science has
suggested that opportunities should be open and readily avail-
able to members of all groups on the basis of their individual
characteristics (Dawis, 1992; Tyler, 1974, 1992; Williamson,
1965).
Educational Factors
The talent-development process in science, as in other areas
(e.g., athletics, arts), typically begins early (e.g., in special math
or science programs), as early as fifth grade, and is then sustained
(Lubinski, Benbow, et al., 2001). We (Lubinski, Benbow, et al.,
2001) have concluded that developing exceptional scientific
expertise requires both special educational opportunities and
particular personal characteristics and that this attribute-plus-
opportunity tandem operates similarly for males and females.
Bloom (1985) also found that early intervention and stimulation
clearly stood out in the lives of talented and excelling adults.
From the start, SMPY has emphasized both talent identifi-
cation and development. Its approach has been to tailor edu-
cational opportunities to be responsive to students’ individuality
and to build on their strengths (Benbow & Stanley, 1996; Lu-
binski & Benbow, 2000). Literally hundreds of studies have
shown that advancing talented students in their studies so that
they are working with curricula designed for older students (i.e.,
acceleration) is effective in enhancing achievement (Benbow,
1991; Benbow & Stanley, 1996; Colangelo et al., 2004; Swiatek
& Benbow, 1991a); positive effects are detectable up to 50 years
later (Cronbach, 1996). Because of SMPY’s initial and short-
term success with acceleration, and because the educational
efficacy of acceleration has been documented repeatedly by
other investigators (Colangelo et al., 2004), we focus here on the
long-term evidence emerging from SMPY.
Swiatek and Benbow (1991b) conducted a 10-year follow-up
of 13-year-old participants in SMPY’s fast-paced mathematics
classes, which began with the expressed intent of challenging
students in mathematics and sparking or maintaining their
interest in math and sciences until they reached college. Indeed,
relative to equally able comparison groups, SMPY participants
were twice as likely to be in math-science career tracks in their
mid-20s and in their mid-30s (Benbow, 2006). Other math-
science interventions conducted by SMPY revealed the same
trend (Benbow & Lubinski, 1996). Thus, being challenged by
intellectually rigorous math-science educational opportunities
334 Volume 1—Number 4
Antecedents of Math-Science Expertise

that are responsive to one’s learning needs increases the like-
lihood of being in a STEM career 20 years later.
The Advanced Placement (AP) program is becoming extreme-
ly popular in today’s schools as a means for challenging the
most capable students in high school. When asked to look back,
gifted students often cite AP courses as their favorite courses
(Bleske-Rechek, Lubinski, & Benbow, 2004). At age 33, more-
over, 70% of participants in Cohorts 1 and 2 who had taken one
or more AP courses or exams had obtained an advanced degree
(master’s or beyond), compared with 43% of those who had not
taken an AP course or exam. Participation in an AP course
accounted for between 5 and 7% of additional variance in ad-
vanced-degree attainment after SAT-M scores were controlled.
Thus, through self-selection or something intrinsic to the AP
program itself, AP involvement is a positive predictor of edu-
cational success and satisfaction for intellectually talented
youth (Bleske-Rechek et al., 2004).
Top STEM Graduate Students: A Generalization Probe
As noted earlier, SMPY’s Cohort 5 was selected to conduct a
generalization probe to ascertain the fidelity of the TS model for
identifying math-science talent. In 1992, first- and second-year
graduate students attending the top 15 math-science training
programs in the United States were surveyed (Lubinski, Benbow,
et al., 2001). This cohort consisted of 368 male and 346 female
participants (the universities and disciplines included are listed
in Lubinski, Benbow, et al., 2001). To our knowledge, a large
group of approximately equal numbers of male and female
nascent scientists of this caliber has never been psychologically
profiled so comprehensively. Some of the information secured
included SAT scores for those who participated in talent
searches, high school SAT scores, Graduate Record Examina-
tion (GRE) scores, and scores on the Strong Interest Inventory,
the SOV, and the Adjective Check List (Gough & Heilburn,
1983). In addition, much background information was collected.
One question in the initial survey, for example, asked the stu-
dents if they felt they would have qualified for a talent search
when they were in seventh grade (and they were provided with an
extensive description of the qualification criteria): Only 8% felt
that they would not have qualified.
Overall, this study confirmed that the salient attributes un-
covered by SMPY’s longitudinal research were also prominent
psychological features among these graduate students, regard-
less of their sex. Talent searches were not as well known back
when these students were in seventh grade, but 13 to 15% had
age-13 SAT scores. These assessments placed them just above
the top 1 in 200 in quantitative reasoning ability. The high
school SAT scores of Cohort 5 were analyzed for ability tilt (viz.,
SAT-M minus SAT-V), and the mean difference was 92 (Mdn 5
90) for males and 79 (Mdn 5 70) for females (Lubinski, Benbow,
et al., 2001). Throughout the 1980s, the maximum mean dif-
ference between math and verbal SAT scores was 66 points for
males and 33 points for females (College Entrance Examination
Board, 1992). Thus, these math-science graduate students did
appear to display marked tilts. To evaluate the psychological
significance of these tilts more concretely, we calculated the
percentages of math-science degrees among SMPY Cohort 2
participants, comparing those who did and did not have tilts
equivalent to the tilts found among the graduate students (i.e.,
tilts� 70 vs.< 70 for female participants and tilts� 90 vs.< 90
for male participants (Lubinski, Benbow, et al., 2001). This
analysis showed that 75% of TS males and 51% of TS females
with SAT difference scores at or beyond the median of their
gender-equivalent graduate-student counterparts secured un-
dergraduate math-science degrees. For TS participants with dif-
ference scores below these medians, the percentages receiving
such degrees dropped significantly to 57% for males and 28%
for females.
The male and female graduate students in Cohort 5 displayed
the preference pattern (high investigative-theoretical prefer-
ence and lower social and religious preferences) typically found
for scientists, and were remarkably similar in other personal
attributes, especially when the sex differences uncovered among
the TS participants are considered. For example, males and
females in Cohort 5 displayed congruent rank orderings in in-
terests and values (Table 8); the lack of sex differences in these
profiles is striking, and hard to ignore given the conspicuous sex
differences in rank orderings for these dimensions among
SMPY’s TS participants (see Table 5). For each instrument,
summing the percentages of graduate students who ranked each
theme first or second reveals sex differences of only a few per-
centage points. For example, 73% of males and 70% of females
ranked Theoretical as one of their top two SOV themes, as would
be expected of individuals pursuing scientific career tracks. The
male-female similarity in Cohort 5 was further supported by
more general personological assessments. The first- and last-
ranked scales among the 36 standard Adjective Check List
scales were the same for the two sexes: creative personality and
succorance, respectively. This pattern is indicative of inde-
pendently minded creative innovators and illustrates another
way in which male and female top math-science graduate stu-
dents are psychologically similar.
Tables 9 and 10 reveal additional similarities between top
male and female math-science graduate students, not only in
their educational experiences and accomplishments (e.g.,
seeking out advanced learning opportunities and special pro-
grams in math-science and excelling in them), but also in their
commitment to studying and doing research. In addition, a
majority of the graduate students reported math or science as
their favorite high school class, and graduate students of both
sexes reported early participation in special programs and
contests for the gifted, such as math and science competitions
(Table 9). (Sex differences had emerged on these items for TS
participants.) These findings reflect an early commitment to
math-science endeavors among the graduate students of both
Volume 1—Number 4 335
David Lubinski and Camilla Persson Benbow

sexes. As graduate students, they devoted much of their time to
their educational-vocational development, spending a median
of 50 hr per week on studying and research (Table 10). Overall,
the psychological profile and educational experiences and ac-
complishments of the graduate students, both in and outside of
school, paralleled those of TS participants who went on to secure
STEM degrees (Lubinski, Benbow, et al., 2001; Wai et al., 2005;
Webb, Lubinski, & Benbow, 2002). The findings converged.
Collectively, these data indicate that regardless of sex, an in-
dividual’s abilities, preferences, and commitment to work
combine to promote the active pursuit of scientific excellence in
the scientific community as now constructed.
Entering and Exiting STEM Areas
Although it is well known that men are more frequently involved
in math-science domains than women are, analyses of individual
differences attributes among people who choose to pursue ad-
vanced training in math-science domains reveal that these at-
tributes are more important than group membership (e.g., sex)
for understanding this educational choice. Findings from Webb
et al. (2002) support this idea.
We tracked 1,110 Cohort 1 and 2 participants who reported
plans to major in math or science at the onset of their under-
graduate studies and then compared those who eventually
completed a degree in math or science with those who completed
a degree outside these areas. More women than men eventually
chose to pursue degrees in areas outside of math and science, a
finding that was not surprising given current statistics. This
pattern is often interpreted as negative because of a focus on
demographic parity. But in-depth analyses of the participants’
educational, vocational, and life outcomes affords a different
and more positive interpretation.
First, individual differences in ability pattern and interests,
not biological sex, surfaced as the central predictors of who
actually completed a degree in math or science and who com-
pleted a degree outside these areas. Thus, it appears that group
status is a frail proxy variable for specific individual differences
attributes (Lubinski & Humphreys, 1997), such as ability and
preference patterns. The latter more centrally guide educa-
tional-vocational choices.
Second, students who completed degrees in math or science
and those who completed degrees outside these areas showed
similar levels of success, career satisfaction, and life satisfac-
tion. For example, participants who completed their under-
graduate degrees outside of math and science, regardless of sex,
were as likely to earn graduate degrees as participants who
majored in math or science; they merely secured their graduate
degrees in different areas. This finding mirrors other research
demonstrating that SMPY women earn baccalaureate and
TABLE 9
Percentage of Participants With Various Educational Experiences
Experience
Graduatestudents TS participants
M F M F
Interest in math-science stimulated by a special person 61 69 68 73
Math-science contest or special program before college 58 54 54 37Accelerated primary or secondary education . . .
via advanced subject-matter placement 58 62 68 60
via Advance Placement or other exams for college credit 66 67 92 88
via college courses during high school 33 33 37 29
via grade skipping 11 13 23 28
by any means 88 91 92 92
Reported influence of acceleration experience
Positive 78 80 70 70
Negative 2 1 10 8
Took biology, chemistry, physics, and calculus during high school 68 66 65 60
Favorite high school class was in math or science 79 74 64 39Selected for the National Honor Society 70 79 63 70
Was National Merit finalist 23 21 42 38
Awarded National Merit scholarship 15 17 23 21
Was Presidential Scholar 13 13 3 5
Experienced mentoring relationship before college 28 28 33 34
Positive influence on educational-career plans 96 97 95 89
Negative influence on educational-career plans 3 0 2 2
Math-science contest or special program during college 20 21 25 11
Note. Items with important differences between groups are displayed in boldface. Group ns vary by item. Graduate students arethe participants in Cohort 5. TS participants are talent-search participants in Cohort 2. M 5 males; F 5 females. From Lubinski,Benbow, Shea, Eftekhari-Sanjani, and Halvorson (2001).
336 Volume 1—Number 4
Antecedents of Math-Science Expertise

postbaccalaureate degrees at the same rates as SMPY men, but
that the women are more likely than the men to pursue their
credentials in organic fields, such as the social sciences, biol-
ogy, and medicine, and the men are more likely than the women
to pursue their credentials in inorganic fields, such as engi-
neering and the physical sciences (Achter et al., 1999; Benbow
et al., 2000; Lubinski, Webb, et al., 2001). To achieve parity,
should society try to push women away from organic sciences
into inorganic disciplines? If so, how much social engineering
would be appropriate? What is the appropriate way to produce
greater parity in engineering? How much parity is acceptable,
and how much is ideal?
Third, many individuals who completed their degrees in non-
math-science areas ultimately chose math-science occupations,
and vice versa. Among mathematically talented populations, the
leaking pipeline is not an appropriate metaphor. Upon reflec-
tion, this fluidity is not surprising for mathematically precocious
females. In samples of males and females selected for mathe-
matical talent, females display higher levels of verbal ability
than males, and also more uniform levels of mathematical and
verbal ability (Lubinski, Benbow, et al., 2001). Thus, math-
ematically precocious females more often than mathematically
talented males are endowed with talents that enable them to
excel with distinction in domains that require highly developed
verbal-linguistic skills (these skills and the flexibility they lend
could perhaps propel these individuals in varied directions,
in part because verbal-linguistic skills tend to co-occur with
social, or organic, interests and values—Ackerman, 1996;
Schmidt et al., 1998). This versatility is useful in navigating
today’s multidimensional work environments, which are be-
coming increasingly scientific and technical. Scientific and
quantitative reasoning skills, for example, are essential not only
in physics, but also in environmental law or scientific journal-
ism. Given the ever-changing nature of the modern world of
work, it is not surprising that talented women are attracted to
environments that capitalize on both their quantitative and their
verbal reasoning abilities (as well as their personal preferences)
and that they may move in and out of careers formally labeled as
TABLE 10
Educational Experiences of the Graduate Students in Cohort 5
Experience Males Females
Participated in a talent search during junior high school 15 13
Believe would have been eligible for a talent search 63 62
Believe would not have been eligible for a talent search 7 8
Would have enrolled in a talent search 65 72
Gifted programs were available at some point 74 78
Participated in gifted program (given program was available) 86 84
Average number of years participated in a gifted program (SD) 5.2 (2.9) 5.4 (2.9)
Participated in a summer program for the gifted 26 23
Positive experience from gifted programs 67 71
Negative experience from gifted programs 3 3
Worked on an independent research project during high school 25 23
Took honors course during high school in
Humanities 52 59
Social studies 42 45
Languages 30 38
Science 66 68
Changed undergraduate major 29 35
Changed from a program outside math-sciences 12 11
Age decided on undergraduate major (SD) 17.7 (2.1) 18.1 (1.8)
Participated in an undergraduate research program 83 83
Positive influence on educational-career plans 88 88
Negative influence on educational-career plans 5 4
Experienced mentoring relationship as undergraduate 57 61
Positive influence on educational-career plans 96 94
Negative influence on educational-career plans 1 3
Member of undergraduate honor society (e.g., Phi Beta Kappa) 71 76
Median number of hours per week spent on
Studying 20 20
Research 30 30
Note. No significant differences between the sexes were found (a 5 .01). Statistics represent percentages, exceptwhere specified otherwise. From Lubinski, Benbow, Shea, Eftekhari-Sanjani, and Halvorson (2001).
Volume 1—Number 4 337
David Lubinski and Camilla Persson Benbow

STEM careers more frequently than men do. They are working in
the interface areas that form connections with multiple disci-
plines and that they are particularly well suited for. Are such
career choices or shifts really a representation of a loss of talent?
Is saving a large segment of precious Alaskan land through
expertise in environmental law less of a contribution to society
than publishing a discovery about the physical universe in
Nature? What is the right balance?
CONCLUDING PERSPECTIVES ON PSYCHOLOGICALSCIENCE
Our model for talent development (TWA) emphasizes the im-
portance of tailoring educational opportunities in accordance
with each student’s individuality (Lubinski & Benbow, 2000).
It is predicated on the importance of accurately assessing
individual differences and anticipating future individuality.
Psychological knowledge about individual differences and the
effective use of above-level assessments do help in identifying
extraordinary human potential. Appropriate psychometric mea-
sures of specific abilities do have the potential to uncover a wide
range of talent among diverse groups and, along with information
on interests and values, can facilitate a more precise tailoring of
educational opportunities (Corno et al., 2002). Teaming as-
sessments of individual differences with differential opportu-
nities harnesses both components of the ‘‘two disciplines of
scientific psychology’’ (Cronbach, 1957): aptitude (or personal
readiness) and treatment (or environmental opportunity).
Moreover, to the extent that educators do not respond to the
individuality of intellectually precocious students and align
learning opportunities accordingly, academic underachieve-
ment becomes much more likely (Benbow & Stanley, 1996;
Bleske-Rechek et al., 2004; Colangelo et al., 2004; Lubinski &
Humphreys, 1997; Stanley, 2000).
Fifty years ago, Donald G. Paterson (1957), a dominant force
in the applied psychological sciences, anticipated the impor-
tance the Association for Psychological Science is currently
placing on the scientific study of human capital. Paterson’s fa-
mous Bingham lecture, delivered at Ohio State University in
1956 and published in the American Psychologist the following
year, is full of wisdom and is still important reading. TWA was
developed by two of his students (Dawis & Lofquist, 1984; Lof-
quist & Dawis, 1969, 1991), and we conclude with contributions
from two others to underscore its contemporary relevance in the
context of findings from SMPY. The first quotation is from James
J. Jenkins. Jenkins was selected by Paterson to carry on his
applied psychological studies (Jenkins & Lykken, 1957; Jenkins
& Paterson, 1961), but Jenkins’s (1981) passion and readiness
for psycholinguistics eventually propelled him toward other
pursuits. The second quotation is from Leona E. Tyler, arguably
the most distinguished counseling psychologist of the 20th
century.
If you are concerned with improving the output of some complex
system, you must study the component that produces the largest
variance first. Adjusting or correcting smaller sources of variance
has no appreciable effect on the output of the system as long as the
major source of variance is uncontrolled. (Jenkins, 1981, p. 224)
In our haste to abolish the unjust and the obsolete, we cannot
afford to ignore the psychological realities that generated such
systems in the first place. There are highly significant psycho-
logical differences among individuals, and the soundness of our
social institutions depends upon how successfully we take them
into account. . . . A complex society cannot regard its members as
identical interchangeable parts of a social machine. Its complex
functioning depends upon the contributions of individuals spe-
cializing along different lines, equipped for carrying out different
specialized tasks.
For this reason we must not be content with any system of universal
education that provides identical treatment for all pupils. We must
look for ways of diversifying education to make it fit the diverse
individuals whose talents should be developed and utilized. (Tyler,
1974, pp. 6–7)
Psychology cannot afford to neglect the individuality found
within intellectually talented populations—nor can the study
and development of human capital initiatives.
Acknowledgments—An earlier version of this manuscript
profited from comments by David P. Campbell, Rene V. Dawis,
Kimberley Ferriman, Gregory Park, Jonathan Wai, and Rose
Mary Webb. Support for this article was provided by a Research
and Training Grant from the Templeton Foundation, by National
Institute of Child Health and Human Development Grant P30
HD 15052 to the Vanderbilt Kennedy Center for Research on
Human Development, and by the Strong Research Board.
REFERENCES
Achter, J.A., & Lubinski, D. (2003). Fostering exceptional develop-
ment in intellectually talented populations. In W.B. Walsh (Ed.),
Counseling psychology and optimal human functioning (pp. 25–
54). Mahwah, NJ: Erlbaum.
Achter, J.A., & Lubinski, D. (2005). Blending promise with passion:
Best practices for counseling intellectually talented youth. In
S.D. Brown & R.W. Lent (Eds.), Career development and coun-
seling: Putting theory and research to work (pp. 600–624).
Hoboken, NJ: John Wiley & Sons.
Achter, J.A., Lubinski, D., & Benbow, C.P. (1996). Multipotentiality
among the intellectually gifted: ‘‘It was never there and already
it’s vanishing.’’ Journal of Counseling Psychology, 43, 65–76.
Achter, J.A., Lubinski, D., Benbow, C.P., & Eftekhari-Sanjani, H.
(1999). Assessing vocational preferences among gifted adoles-
cents adds incremental validity to abilities: A discriminant
analysis of educational outcomes over a 10-year interval. Journal
of Educational Psychology, 91, 777–786.
338 Volume 1—Number 4
Antecedents of Math-Science Expertise

Ackerman, P.L. (1996). A theory of adult intellectual development:
Process, personality, interests, and knowledge. Intelligence, 22,
227–257.
Ackerman, P.L., & Heggestad, E.D. (1997). Intelligence, personality,
and interests: Evidence for overlapping traits. Psychological
Bulletin, 121, 218–245.
Allport, G.W., Vernon, P.E., & Lindzey, G. (1970). Manual: Study of
values. Boston: Houghton Mifflin.
American Competitiveness Initiative. (2006). American Competitive-
ness Initiative: Leading the world in innovation. Washington, DC:
Domestic Policy Council Office of Science and Technology.
America’s best colleges 2004. (2003, September 1). U.S. News & World
Report, 135, 88–89.
Arden, R., & Plomin, P. (2006). Sex differences in variance of intel-
ligence across childhood. Personality and Individual Differences,
41, 39–48.
Austin, J.T., & Hanisch, K.A. (1990). Occupational attainment as a
function of abilities and interests: A longitudinal analysis using
Project Talent data. Journal of Applied Psychology, 75, 77–86.
Benbow, C.P. (1983). Adolescence of the mathematically precocious: A
five year longitudinal study. In C.P. Benbow & J.C. Stanley (Eds.),
Academic precocity: Aspects of its development (pp. 9–37). Balti-
more: Johns Hopkins University Press.
Benbow, C.P. (1988). Sex differences in mathematical reasoning ability
among the intellectually talented: Their characterization, con-
sequences, and possible causes. Behavioral and Brain Sciences,
11, 169–232.
Benbow, C.P. (1991). Meeting the needs of gifted students through use
of acceleration: A neglected resource. In M.C. Wang, M.C.
Reynolds, & H.J. Walberg (Eds.), Handbook of special education
(Vol. 4, pp. 23–36). Elmsford, NY: Pergamon Press.
Benbow, C.P. (1992). Academic achievement in mathematics and
science between ages 13 and 23: Are there differences among
students in the top one percent of mathematical ability? Journal
of Educational Psychology, 84, 51–61.
Benbow, C.P. (2006, May). Julian C. Stanley keynote address. Paper
presented at the Wallace Biennial Symposium on Talent Devel-
opment, University of Iowa, Iowa City.
Benbow, C.P., & Lubinski, D. (Eds.). (1996). Intellectual talent: Psycho-
metric and social issues. Baltimore: Johns Hopkins University Press.
Benbow, C.P., & Lubinski, D. (2006). Julian C. Stanley, Jr. (1918–
2005). American Psychologist, 61, 251–252.
Benbow, C.P., Lubinski, D., Shea, D.L., & Eftekhari-Sanjani, H.
(2000). Sex differences in mathematical reasoning ability: Their
status 20 years later. Psychological Science, 11, 474–480.
Benbow, C.P., Lubinski, D., & Suchy, B. (1996). The impact of SMPY’s
educational programs from the perspective of the participant. In
C.P. Benbow & D. Lubinski (Eds.), Intellectual talent: Psycho-
metric and social issues (pp. 266–300). Baltimore: Johns Hopkins
University Press.
Benbow, C.P., & Stanley, J.C. (Eds.). (1983). Academic precocity: As-
pects of its development. Baltimore: Johns Hopkins University
Press.
Benbow, C.P., & Stanley, J.C. (1996). Inequity in equity: How ‘‘equity’’
can lead to inequity for high-potential students. Psychology,
Public Policy, and Law, 2, 249–292.
Bennett, G.K., Seashore, H.L., & Wesman, A.G. (1982). Differential
Aptitude Tests: Administrator’s handbook. New York: Psychologi-
cal Corp.
Bhargava, G. (1986). Professional identification: A study of female
students at a medical college in India. Social Science and
Medicine, 20, 1169–1175.
Bleske-Rechek, A., Lubinski, D., & Benbow, C.P. (2004). Meeting the
educational needs of special populations: Advanced Placement’s
role in developing exceptional human capital. Psychological
Science, 15, 217–224.
Bloom, B.S. (1985). Developing talent in young people. New York:
Ballantine.
Bouchard, T.J., Jr. (1997). Genetic influence on mental abilities, per-
sonality, vocational interests, and work attitudes. International
Review of Industrial and Organizational Psychology, 12, 373–
395.
Brody, L.E., & Benbow, C.P. (1990). Effects of high school course-work
and time on SAT scores. Journal of Educational Psychology, 82,
866–875.
Browne, K.R. (2002). Biology at work: Rethinking sexual equality. New
Brunswick, NJ: Rutgers University Press.
Campbell, D.P. (1971). Handbook for the Strong Vocational Interest
Blank. Stanford, CA: Stanford University Press.
Campbell, D.P. (1977). Take the road to creativity and get off your dead
end. Allen, TX: Argus Communications.
Carroll, J.B. (1993). Human cognitive abilities: A survey of factor-
analytic studies. Cambridge, England: Cambridge University
Press.
Ceci, S.J., & Papierno, P.B. (2005). The rhetoric and reality of gap
closing: When the ‘‘have nots’’ gain but the ‘‘haves’’ gain even
more. American Psychologist, 60, 149–160.
Colangelo, N., Assouline, S.G., & Gross, M.U.M. (Eds.). (2004). A
nation deceived: How schools hold back America’s brightest stu-
dents. Iowa City: University of Iowa.
College Entrance Examination Board. (1992). College bound seniors:
1992 profile of the SAT and achievement test takers. Princeton, NJ:
Author.
Corno, L., Cronbach, L.J., Kupermintz, H., Lohman, D.F., Mandinach,
E.B., Porteus, A.W., & Talbert, J.E. (Eds.). (2002). Remaking the
concept of aptitude: Extending the legacy of Richard E. Snow.
Mahwah, NJ: Erlbaum.
Cronbach, L.J. (1957). The two disciplines of scientific psychology.
American Psychologist, 12, 671–684.
Cronbach, L.J. (1996). Acceleration among the Terman males: Cor-
relates in midlife and after. In C.P. Benbow & D. Lubinski (Eds.),
Intellectual talent: Psychometric and social issues (pp. 179–191).
Baltimore: Johns Hopkins University Press.
Dawis, R.V. (1991). Vocational interests, values, and preferences. In
M.D. Dunnette & L.M. Hough (Eds.), Handbook of industrial/
organizational psychology (2nd ed., Vol. 2, pp. 833–871). Palo
Alto, CA: Consulting Psychologists Press.
Dawis, R.V. (1992). The individual differences tradition in counseling
psychology. Journal of Counseling Psychology, 39, 7–19.
Dawis, R.V. (2001). Toward a psychology of values. The Counseling
Psychologist, 29, 458–465.
Dawis, R.V. (2005). The Minnesota Theory of Work Adjustment. In
S.D. Brown & R.W. Lent (Eds.), Career development and coun-
seling: Putting theory and research to work (pp. 3–23). Hoboken,
NJ: John Wiley & Sons.
Dawis, R.V., & Lofquist, L.H. (1984). A psychological theory of work
adjustment. Minneapolis: University of Minnesota Press.
Volume 1—Number 4 339
David Lubinski and Camilla Persson Benbow

Day, S.X., & Rounds, J. (1998). The universality of vocational interest
structure among racial and ethnic minorities. American Psy-
chologist, 53, 728–736.
Deary, I.J., Thorpe, G., Wilson, V., Starr, J.M., & Whalley, L.J. (2003).
Population sex differences in IQ at age 11: The Scottish mental
survey 1932. Intelligence, 31, 533–542.
Donlon, T.F. (1984). The College Board technical handbook for the
Scholastic Aptitude Test and Achievement Tests. New York: College
Entrance Examination Board.
Eisner, E.W. (1999). The uses and limits of performance assessment.
Phi Delta Kappan, 80, 658–660.
Ericsson, K.A. (1996). The road to excellence. Mahwah, NJ: Erlbaum.
Eysenck, H.J. (1995). Genius: The natural history of creativity. Cam-
bridge, England: Cambridge University Press.
Feingold, A. (1995). The additive effects of differences in central
tendency and variability are important in comparisons between
groups. American Psychologist, 50, 5–13.
Fox, L.H., Brody, L., & Tobin, D. (Eds.). (1980). Women and the
mathematics mystique. Baltimore: Johns Hopkins University
Press.
Friedman, T.L. (2005). The world is flat. New York: Farrar, Straus, &
Giroux.
Fuchs, D., Fuchs, L.S., Thompson, A., Al Otaiba, S., Yen, L., Yang, N.,
Braun, M., & O’Connor, R.E. (2001). Is reading important in
reading-readiness programs? A randomized field trial with
teachers as program implementers. Journal of Educational Psy-
chology, 93, 251–267.
Fuchs, L.S., Fuchs, D., Karns, K., Hamlett, C.L., & Katzaroff, M.
(1999). Mathematics performance assessment in the classroom:
Effects on teacher planning and student learning. American
Educational Research Journal, 36, 609–646.
Fuchs, V.R. (1988). Women’s quest for economic equality. Cambridge,
MA: Harvard University Press.
Gagne, F. (2005). From noncompetence to exceptional talent: Ex-
ploring the range of academic achievement within and between
grade levels. Gifted Child Quarterly, 49, 139–153.
Galton, F. (1869). Hereditary genius: An inquiry into its laws and
consequences. New York: Appleton.
Gardner, H. (1993). Creating minds. New York: Basic Books.
Geary, D.C. (1998). Male, female: The evolution of human sex differ-
ences. Washington, DC: American Psychological Association.
George, W.C., Cohn, S.J., & Stanley, J.C. (Eds.). (1979). Educating the
gifted: Acceleration and enrichment. Baltimore: Johns Hopkins
University Press.
Getzels, J.W., & Jackson, P.W. (1962). Creativity and intelligence:
Explorations with gifted students. New York: Wiley.
Gohm, C.L., Humphreys, L.G., & Yao, G. (1998). Underachievement
among spatially gifted students. American Educational Research
Journal, 35, 515–531.
Gottfredson, L.S. (2003). The challenge and promise of cognitive
career assessment. Journal of Career Assessment, 11, 115–135.
Gough, H.G., & Heilburn, A.B. (1983). The Adjective Check List
manual. Palo Alto, CA: Consulting Psychologists Press.
Halpern, D.F. (2000). Sex differences in cognitive abilities (3rd ed.).
Mahwah, NJ: Erlbaum.
Harmon, L.W., Hansen, J.C., Borgen, F.H., & Hammer, A.L. (1994).
Applications and technical guide for the Strong Interest Inventory.
Palo Alto, CA: Consulting Psychologists Press.
Hedges, L.V., & Nowell, A. (1995). Sex differences in mental test
scores, variability, and numbers of high scoring individuals.
Science, 269, 41–45.
Hoffman, C., & Reed, J. (1982). When is imbalance not discrimi-
nation? In W. Block & M. Walker (Eds.), Discrimination, af-
firmative action, and equal opportunity (pp. 187–216). Vancouver,
British Columbia, Canada: Frasier Institute.
Holland, J.L. (1996). Exploring careers with a typology: What we have
learned and some new directions. American Psychologist, 51,
397–406.
Howe, M.J.A. (2001). IQ in question: The truth about intelligence.
London: Sage Publications.
Huber, J.C. (1998). Invention and inventivity as a special kind of
creativity, with implications for general creativity. Journal of
Creative Behavior, 32, 58–72.
Huber, J.C. (1999). Inventive productivity and the statistics of ex-
ceedances. Scientometrics, 45, 33–53.
Humphreys, L.G., & Lubinski, D. (1996). Brief history and psycho-
logical significance of assessing spatial visualization. In C.P.
Benbow & D. Lubinski (Eds.), Intellectual talent: Psychometric
and social issues (pp. 116–140). Baltimore: Johns Hopkins Uni-
versity Press.
Humphreys, L.G., Lubinski, D., & Yao, G. (1993). Utility of predicting
group membership and the role of spatial visualization in be-
coming an engineer, physical scientist, or artist. Journal of Ap-
plied Psychology, 78, 250–261.
In appreciation: Julian Stanley (1918–2005). (2005, October). APS
Observer, 18, 27–31.
Jackson, D.N., & Rushton, J.P. (1985). Scientific excellence: Origins
and assessment. Newbury Park, CA: Sage.
Jenkins, J.J. (1981). Can we have a fruitful cognitive psychology? In
H.E. Howe, Jr., & J.H. Flowers (Eds.), Cognitive processes: Ne-
braska symposium on motivation 1980 (pp. 211–238). Lincoln:
University of Nebraska Press.
Jenkins, J.J., & Lykken, D.T. (1957). Individual differences. Annual
Review of Psychology, 8, 79–112.
Jenkins, J.J., & Paterson, D.G. (1961). Studies in individual differences:
The search for intelligence. New York: Appleton-Century-Crofts.
Jensen, A.R. (1991). Spearman’s g and the problem of educational
equality. Oxford Review of Education, 17, 169–187.
Jensen, A.R. (1998). The g factor. Westport, CT: Praeger.
Katzell, R.A. (1994). Contemporary meta-trends in industrial and or-
ganizational psychology. In H.C. Triandis, M.D. Dunnette, & L.M.
Hough (Eds.), Handbook of industrial/organizational psychology
(2nd ed., Vol. 4, pp. 1–89). Palo Alto, CA: Consulting Psy-
chologists Press.
Keating, D.P. (Ed.). (1976). Intellectual talent: Research and develop-
ment. Baltimore: Johns Hopkins University Press.
Keating, D.P., & Stanley, I.C. (1972). Extreme measures for the ex-
ceptionally gifted in mathematics and science. Educational Re-
searcher, 1, 3–7.
Kenny, D.A. (1975). A quasi-experimental approach to assessing
treatment effects in the nonequivalent control group design.
Psychological Bulletin, 82, 345–362.
Kimura, D. (1999). Sex and cognition. Cambridge, MA: MIT Press.
Kuczynski, A. (2002, March 24). They conquered, they left. New York
Times, Section 9, p. 1.
Lippa, R. (1998). Gender-related individual differences and the
structure of vocational interests: The importance of the people-
340 Volume 1—Number 4
Antecedents of Math-Science Expertise

things dimension. Journal of Personality and Social Psychology,
74, 996–1009.
Lippa, R. (2006). The gender reality hypothesis. American Psycholo-
gist, 61, 639–640.
Lofquist, L.H., & Dawis, R.V. (1969). Adjustment to work. New York:
Appleton-Century-Crofts.
Lofquist, L.H., & Dawis, R.V. (1991). Essentials of person-environment-
correspondence counseling. Minneapolis: University of Minnesota
Press.
Lubinski, D. (1996). Applied individual difference research and its
quantitative methods. Psychology, Public Policy, and Law, 2,
187–203.
Lubinski, D. (2000). Scientific and social significance of assessing
individual differences: ‘‘Sinking shafts at a few critical points.’’
Annual Review of Psychology, 51, 405–444.
Lubinski, D. (2001). Interests: A critical domain of psychological di-
versity: Review of M.L. Savickas & A.R. Spokane (Eds.), Voca-
tional interests: Meaning, measurement, and counseling use.
Contemporary Psychology, 46, 82–86.
Lubinski, D. (2004). Introduction to the special section on cognitive
abilities: 100 years after Spearman’s (1904) ‘‘ ‘General intelli-
gence,’ objectively determined and measured.’’ Journal of Per-
sonality and Social Psychology, 86, 96–111.
Lubinski, D., & Benbow, C.P. (1992). Gender differences in abilities
and preferences among the gifted. Current Directions in Psycho-
logical Science, 1, 61–66.
Lubinski, D., & Benbow, C.P. (2000). States of excellence. American
Psychologist, 55, 137–150.
Lubinski, D., & Benbow, C.P. (2001). Choosing excellence. American
Psychologist, 56, 76–77.
Lubinski, D., Benbow, C.P., & Ryan, J. (1995). Stability of vocational
interests among the intellectually gifted from adolescence to
adulthood: A 15-year longitudinal study. Journal of Applied
Psychology, 80, 196–200.
Lubinski, D., Benbow, C.P., Shea, D.L., Eftekhari-Sanjani, H., &
Halvorson, M.B.J. (2001). Men and women at promise for sci-
entific excellence: Similarity not dissimilarity. Psychological
Science, 12, 309–317.
Lubinski, D., Benbow, C.P., Webb, R.M., & Bleske-Rechek, A. (2006).
Tracking exceptional human capital over two decades. Psycho-
logical Science, 17, 194–199.
Lubinski, D., & Dawis, R.V. (1992). Aptitudes, skills, and pro-
ficiencies. In M.D. Dunnette & L.M. Hough (Eds.), Handbook of
industrial/organizational psychology (2nd ed., Vol. 3, pp. 1–59).
Palo Alto, CA: Consulting Psychologists Press.
Lubinski, D., & Humphreys, L.G. (1990a). Assessing spurious
‘‘moderator effects’’: Illustrated substantively with the hypoth-
esized (‘‘synergistic’’) relation between spatial visualization and
mathematical ability. Psychological Bulletin, 107, 385–393.
Lubinski, D., & Humphreys, L.G. (1990b). A broadly based analysis of
mathematical giftedness. Intelligence, 14, 327–355.
Lubinski, D., & Humphreys, L.G. (1997). Incorporating general in-
telligence into epidemiology and the social sciences. Intelligence,
24, 159–201.
Lubinski, D., Schmidt, D.B., & Benbow, C.P. (1996). A 20-year sta-
bility analysis of the Study of Values for intellectually gifted in-
dividuals from adolescence to adulthood. Journal of Applied
Psychology, 81, 443–451.
Lubinski, D., Webb, R.M., Morelock, M.J., & Benbow, C.P. (2001). Top
1 in 10,000: A 10-year follow-up of the profoundly gifted. Journal
of Applied Psychology, 86, 718–729.
Minor, L.L., & Benbow, C.P. (1996). Construct validity of the SAT-M: A
comparative study of high school students and gifted seventh
graders. In C.P. Benbow & D. Lubinski (Eds.), Intellectual talent:
Psychometric and social issues (pp. 347–361). Baltimore: Johns
Hopkins University Press.
Muller, C.B., Ride, S.M., Fouke, J., Whitney, T., Denton, D.D., Cantor,
N., et al. (2005). Gender differences and performance in science.
Science, 307, 1043.
Muratori, M.C., Stanley, J.C., Gross, M.U.M., Ng, L., Tao, T., Ng,
J., & Tao, B. (2006). Insights from SMPY’s greatest former
prodigies: Drs. Terence (‘‘Terry’’) Tao and Lenhard (‘‘Lenny’’) Ng
reflect on their talent development. Gifted Child Quarterly, 50,
307–324.
Murray, C. (1998). Income, inequality, and IQ. Washington, DC:
American Enterprise Institute.
National Academy of Sciences. (2005). Rising above the gathering
storm. Washington, DC: National Academy Press.
Paterson, D.G. (1957). The conservation of human talent. American
Psychologist, 12, 134–144.
Prediger, D.J. (1982). Dimensions underlying Holland’s hexagon:
Missing link between interests and occupations? Journal of Vo-
cational Behavior, 21, 259–287.
Pressey, S.L. (1946). Acceleration: Disgrace or challenge? Science,
104, 215–219.
Pressey, S.L. (1955). Concerning the nature and nurture of genius.
Scientific Monthly, 81, 123–129.
Renzulli, J.S. (1986). The three-ring conception of giftedness: A de-
velopmental model for creative productivity. In R.J. Sternberg &
J.E. Davidson (Eds.), Conceptions of giftedness (pp. 53–92).
Cambridge, England: Cambridge University Press.
Rhoads, S.E. (2004). Taking sex differences seriously. San Francisco:
Encounter Books.
Rivera-Batiz, F.F. (1992). Quantitative literacy and the likelihood of
employment among young adults in the United States. Journal of
Human Resources, 27, 313–328.
Robinson, N.M., Abbott, R.D., Berninger, V.W., & Busse, J. (1996).
The structure of abilities in mathematically precocious young
children: Gender similarities and differences. Journal of Edu-
cational Psychology, 88, 341–352.
Robinson, N.M., Abbott, R.D., Berninger, V.W., Busse, J., &
Mukhopadhyah, S. (1997). Developmental changes in math-
ematically precocious young children. Gifted Child Quarterly, 41,
145–158.
Roe, A. (1956). The psychology of occupations. New York: Wiley.
Rowe, D.C. (1994). The limits of family influence: Genes, experience,
and behavior. New York: Guilford Press.
Savickas, M.L., & Spokane, A.R. (1999). Vocational interests: Mean-
ing, measurement, and counseling use. Palo Alto, CA: Davies-
Black/Counseling Psychologists Press.
Scarr, S. (1996). How people make their own environments: Implica-
tions for parents and policy makers. Psychology, Public Policy,
and Law, 2, 204–228.
Scarr, S., & McCartney, K. (1983). How people make their own envi-
ronments: A theory of genotype ! environment effects. Child
Development, 54, 424–435.
Volume 1—Number 4 341
David Lubinski and Camilla Persson Benbow

Schmidt, D.B., Lubinski, D., & Benbow, C.P. (1998). Validity of as-
sessing educational-vocational preference dimensions among
intellectually talented 13-year-olds. Journal of Counseling Psy-
chology, 45, 436–453.
Seashore, C.E. (1922). The gifted student and research. Science, 56,
641–648.
Shea, D.L., Lubinski, D., & Benbow, C.P. (2001). Importance of as-
sessing spatial ability in intellectually talented young adoles-
cents: A 20-year longitudinal study. Journal of Educational
Psychology, 93, 604–614.
Shurkin, J.N. (1992). Terman’s kids: The groundbreaking study of how
the gifted grow up. Boston: Little Brown.
Shye, D. (1991). Gender differences in Israeli physicians’ career
patterns, productivity, and family structure. Social Science and
Medicine, 32, 1169–1181.
Simonton, D.K. (1988). Scientific genius. Cambridge, England: Cam-
bridge University Press.
Simonton, D.K. (1994). Greatness: Who makes history and why. New
York: Guilford Press.
Smith, I.M. (1964). Spatial ability: Its educational and social signifi-
cance. London: University of London Press.
Snow, R.E. (1994). A person-situation interaction theory of intelli-
gence in outline. In A. Demetriou & A. Efklides (Eds.), Intelli-
gence, mind, and reasoning: Structure and development (pp. 11–
28). Amsterdam: Elsevier.
Snow, R.E. (1999). Commentary: Expanding the breadth and depth of
admissions testing. In S. Messick (Ed.), Assessment in higher
education: Issues of access, quality, student development, and
public policy (pp. 133–140). Hillsdale, NJ: Erlbaum.
Snow, R.E., & Lohman, D.F. (1989). Implications of cognitive psy-
chology for educational measurement. In R.L. Linn (Ed.), Edu-
cational measurement (3rd ed., pp. 263–331). New York: Collier.
Stanley, J.C. (1996). SMPY in the beginning. In C.P. Benbow & D.
Lubinski (Eds.), Intellectual talent: Psychometric and social issues
(pp. 225–235). Baltimore: Johns Hopkins University Press.
Stanley, J.C. (2000). Helping students learn only what they don’t
already know. Psychology, Public Policy, and Law, 6, 216–
222.
Stanley, J.C., & Benbow, C.P. (1986). Youths who reason exceptionally
well mathematically. In R.J. Sternberg & J. Davidson (Eds.),
Conceptions of giftedness (pp. 361–387). New York: Cambridge
University Press.
Stanley, J.C., Benbow, C.P., Brody, L.E., Dauber, S., & Lupkowski, A.
(1992). Gender differences on eighty-six nationally standardized
achievement and aptitude tests. In N. Colangelo, S.G. Assouline,
& D.L. Ambroson (Eds.), Talent development (pp. 42–65). New
York: Trillium Press.
Stanley, J.C., George, W.C., & Solano, C.H. (Eds.). (1977). The gifted
and the creative: A fifty year perspective. Baltimore: Johns Hopkins
University Press.
Stanley, J.C., Keating, D.P., & Fox, L.H. (Eds.). (1974). Mathematical
talent: Discovery, description, and development. Baltimore: Johns
Hopkins University Press.
Story, L. (2005, September 20). Many women at elite colleges set
career path to motherhood. New York Times, p. A1.
Strand, S., Deary, I.J., & Smith, P. (2006). Sex differences in cognitive
abilities test scores: A UK national picture. British Journal of
Educational Psychology, 76, 463–480.
Strong, E.K., Jr. (1943). Vocational interests for men and women.
Stanford, CA: Stanford University Press.
Swiatek, M.A., & Benbow, C.P. (1991a). A ten-year longitudinal fol-
low-up of ability matched accelerated and unaccelerated gifted
students. Journal of Educational Psychology, 83, 528–538.
Swiatek, M.A., & Benbow, C.P. (1991b). A 10-year longitudinal follow-
up of participation in a fast-paced mathematics course. Journal
for Research in Mathematics Education, 22, 138–150.
Terman, L.M. (1925). Genetic studies of genius (Vol. 1). Stanford, CA:
Stanford University Press.
Terman, L.M. (1954). The discovery and encouragement of exceptional
talent. American Psychologist, 9, 221–230.
Thorndike, E.L. (1911). Individuality. New York: Houghton & Mifflin,
Co.
Thurstone, L.L. (1948). Psychological implications of factor analysis.
American Psychologist, 3, 402–408.
Tyler, L.E. (1965). The psychology of human differences (3rd ed.). New
York: Appleton-Century-Crofts.
Tyler, L.E. (1974). Individual differences. Englewood Cliffs, NJ:
Prentice-Hall.
Tyler, L.E. (1992). Counseling psychology—why? Professional Psy-
chology: Research and Practice, 23, 342–344.
Underwood, B. (1975). Individual differences as a crucible in theory
construction. American Psychologist, 30, 128–134.
Vale, J.R., & Vale, C.A. (1969). Individual differences and general
laws in psychology. American Psychologist, 24, 1093–1108.
Vasquez, M.J.T., & Jones, J.M. (2006). Increasing the number of
psychologists of color: Public policy issues for affirmative di-
versity. American Psychologist, 61, 132–142.
Wai, J., Lubinski, D., & Benbow, C.P. (2005). Creativity and occupa-
tional accomplishments among intellectually precocious youth:
An age 13 to age 33 longitudinal study. Journal of Educational
Psychology, 97, 484–492.
Webb, R.M., Lubinski, D., & Benbow, C.P. (2002). Mathematically
facile adolescents with math-science aspirations: New perspec-
tives on their educational and vocational development. Journal of
Educational Psychology, 94, 785–794.
Webb, R.M., Lubinski, D., & Benbow, C.P. (in press). Spatial ability: A
neglected dimension in talent searches for intellectually preco-
cious youth. Journal of Educational Psychology.
Williamson, E.G. (1965). Vocational counseling. New York: McGraw-
Hill.
Wilson, E.O. (1998). Consilience: The unity of knowledge. New York:
Knopf.
Wood, R.G., Corcoran, M.E., & Courant, P.N. (1993). Pay differences
among the highly paid: The male-female earnings gap in lawyers’
salaries. Journal of Labor Economics, 11, 417–441.
Zuckerman, H. (1977). Scientific elite. New York: Free Press.
APPENDIX: SEX DIFFERENCES IN GENERAL AND INSPECIFIC ABILITIES
Sex differences are routinely observed among intellectually
talented young adolescents, and it is useful to have some
benchmarks of the normative distributions that give rise to them.
Although most investigators find essentially no sex differences
in overall level of general intellectual ability (Jensen, 1998), sex
342 Volume 1—Number 4
Antecedents of Math-Science Expertise

Fig. A1. Distribution of IQs among Scottish boys and girls who were born in 1921and tested at age 11 in the 1932 Scottish Mental Survey. The graph shows the per-centage of each sex in each 5-point band of IQ scores. The numbers beside theplotted points indicate the absolute number of boys and girls in each 5-point band.From Deary, Thorpe, Wilson, Starr, and Whalley (2003).
Fig. A2. Scores on four subtests of the Cognitive Abilities Test among a large and representative sample of pupils in the United Kingdom(Strand, Deary, & Smith, 2006). The sample constituted more than 320,000 students, ages 11 and 12 years (between September 2001 andAugust 2003). Results are shown for the nationally standardized tests of verbal reasoning, quantitative reasoning, and nonverbal rea-soning, as well as for a composite of these three measures.
Volume 1—Number 4 343
David Lubinski and Camilla Persson Benbow

differences in variability of general intellectual ability are
routinely observed, as are sex differences in both level and
variability of specific abilities. For example, Deary, Thorpe,
Wilson, Starr, and Whalley (2003) recently illustrated the group
differences in ability dispersion using a Scottish sample of more
than 80,000 children who were born in 1921 and assessed at age
11 in the 1932 Scottish Mental Survey (see Fig. A1).
More recently, Strand, Deary, and Smith (2006) analyzed a
representative sample of 320,000 students in the United King-
dom. The students were assessed at ages 11 and 12, between
September 2001 and August 2003. The distributions in this
sample, shown in Figure A2, highlight male-female differences
among extreme scorers on measures of verbal reasoning,
quantitative reasoning, and nonverbal reasoning. The fourth
panel is a composite measure of these three measures that, like
the earlier study of Deary et al. (2003), illustrates an inordinate
number of males relative to females at both extremes in general
ability. The effect-size difference favoring the females over the
males on the verbal test was 0.15, whereas the effect-size dif-
ference favoring the males on the other two tests was less than
this value. However, for all three tests, there were substantial sex
differences in the standard deviation of scores, with greater
variance among boys. Boys were overrepresented relative to
girls at both the top and the bottom extremes for all tests, with the
exception of the top extreme in verbal reasoning. On some verbal
tests, more girls than boys were found at the extremes (as Strand
et al., and other investigators, have found); but other findings on
variability were mixed for this specific ability (cf. Lubinski &
Dawis, 1992, p. 47, Table 7).
Finally, Stanley, Benbow, Brody, Dauber, and Lupkowski
(1992) published an extensive analysis of the sex differences
(males minus females in standard deviation or effect size units)
Fig. A3. Sex differences (males minus females, in standard deviation or effect-size units) for eight Differential Aptitude Tests (DAT), whichwere developed to provide a standardized procedure for measuring abilities in grades 8 through 12 (Bennett, Seashore, & Wesman, 1982).These norms for the DAT were based on a representative sample of more than 61,000 students in grades 8 through 12 (approximately 6,000students per grade per sex). For each test, the effect size for each grade is shown separately. From Stanley, Benbow, Brody, Dauber, andLupkowski (1992).
344 Volume 1—Number 4
Antecedents of Math-Science Expertise

on a variety of aptitude tests (see Fig. A3). These benchmarks
are useful to keep in mind when analyzing group differences at
the extreme tails of ability distributions (Arden & Plomin, 2006;
Feingold, 1995). For further reading on this topic, see Hedges
and Nowell (1995), as well as Geary (1998), Halpern (2000),
Kimura (1999), and Lubinski and Humphreys (1990a).
Volume 1—Number 4 345
David Lubinski and Camilla Persson Benbow