study of inclusive d production in b decays and
TRANSCRIPT
SLAC-PUB-8535
Study of Inclusive Ds(*)± Production in B Decays and Measurement of
B0 --> D*-Ds(*)+ Decays Using a Partial Reconstruction Technique
Work supported by Department of Energy contract DE–AC03–76SF00515.
August 2000
Presented at the 30th International Conference On High-Energy Physics(ICHEP2000), 7/27/2000—8/2/2000, Osaka, Japan
The BaBar Collaboration
Stanford Linear Accelerator Center, Stanford University, Stanford, CA 94309
BaBar-CONF-00/13hep-ex/0008056

arX
iv:h
ep-e
x/00
0805
6 2
3 A
ug 2
000
BABAR-CONF-00/13
SLAC-PUB-8535
Study of inclusive D(�)�s
production in B decays and measurement
of B0! D��D(�)+
s decays using a partial reconstruction technique
The BABAR Collaboration
July 25, 2000
Abstract
Electron-positron annihilation data collected by the BABAR detector near the �(4S) resonance
are used to study the inclusive decay of B mesons to D�s and D��s mesons, where the D�s is
reconstructed using the decay D�s ! ���. The production fraction of inclusive D(�)�s and the
corresponding momentum spectra have been determined. The exclusive decays B0 ! D��D(�)+s
are observed with a partial reconstruction technique which uses the soft pion from the D�� decay
in association with the reconstructed D(�)�s . The beam energy constraint is used to determine the
missing mass recoiling against the D�s system, showing a clear signal for this process. From the
observed rates, preliminary results for the corresponding branching fractions have been obtained.
Submitted to the XXXth International Conference on High Energy Physics, Osaka, Japan.

The BABAR Collaboration
B. Aubert, A. Boucham, D. Boutigny, I. De Bonis, J. Favier, J.-M. Gaillard, F. Galeazzi, A. Jeremie,Y. Karyotakis, J. P. Lees, P. Robbe, V. Tisserand, K. Zachariadou
Lab de Phys. des Particules, F-74941 Annecy-le-Vieux, CEDEX, France
A. Palano
Universit�a di Bari, Dipartimento di Fisica and INFN, I-70126 Bari, Italy
G. P. Chen, J. C. Chen, N. D. Qi, G. Rong, P. Wang, Y. S. Zhu
Institute of High Energy Physics, Beijing 100039, China
G. Eigen, P. L. Reinertsen, B. Stugu
University of Bergen, Inst. of Physics, N-5007 Bergen, Norway
B. Abbott, G. S. Abrams, A. W. Borgland, A. B. Breon, D. N. Brown, J. Button-Shafer, R. N. Cahn,A. R. Clark, Q. Fan, M. S. Gill, S. J. Gowdy, Y. Groysman, R. G. Jacobsen, R. W. Kadel, J. Kadyk,
L. T. Kerth, S. Kluth, J. F. Kral, C. Leclerc, M. E. Levi, T. Liu, G. Lynch, A. B. Meyer, M. Momayezi,P. J. Oddone, A. Perazzo, M. Pripstein, N. A. Roe, A. Romosan, M. T. Ronan, V. G. Shelkov, P. Strother,
A. V. Telnov, W. A. Wenzel
Lawrence Berkeley National Lab, Berkeley, CA 94720, USA
P. G. Bright-Thomas, T. J. Champion, C. M. Hawkes, A. Kirk, S. W. O'Neale, A. T. Watson, N. K. Watson
University of Birmingham, Birmingham, B15 2TT, UK
T. Deppermann, H. Koch, J. Krug, M. Kunze, B. Lewandowski, K. Peters, H. Schmuecker, M. Steinke
Ruhr Universit�at Bochum, Inst. f. Experimentalphysik 1, D-44780 Bochum, Germany
J. C. Andress, N. Chevalier, P. J. Clark, N. Cottingham, N. De Groot, N. Dyce, B. Foster, A. Mass,J. D. McFall, D. Wallom, F. F. Wilson
University of Bristol, Bristol BS8 lTL, UK
K. Abe, C. Hearty, T. S. Mattison, J. A. McKenna, D. Thiessen
University of British Columbia, Vancouver, BC, Canada V6T 1Z1
B. Camanzi, A. K. McKemey, J. Tinslay
Brunel University, Uxbridge, Middlesex UB8 3PH, UK
V. E. Blinov, A. D. Bukin, D. A. Bukin, A. R. Buzykaev, M. S. Dubrovin, V. B. Golubev,V. N. Ivanchenko, A. A. Korol, E. A. Kravchenko, A. P. Onuchin, A. A. Salnikov, S. I. Serednyakov,
Yu. I. Skovpen, A. N. Yushkov
Budker Institute of Nuclear Physics, Siberian Branch of Russian Academy of Science, Novosibirsk 630090,
Russia
A. J. Lankford, M. Mandelkern, D. P. Stoker
University of California at Irvine, Irvine, CA 92697, USA
A. Ahsan, K. Arisaka, C. Buchanan, S. Chun
University of California at Los Angeles, Los Angeles, CA 90024, USA
2

J. G. Branson, R. Faccini,� D. B. MacFarlane, Sh. Rahatlou, G. Raven, V. Sharma
University of California at San Diego, La Jolla, CA 92093, USA
C. Campagnari, B. Dahmes, P. A. Hart, N. Kuznetsova, S. L. Levy, O. Long, A. Lu, J. D. Richman,W. Verkerke, M. Witherell, S. Yellin
University of California at Santa Barbara, Santa Barbara, CA 93106, USA
J. Beringer, D. E. Dorfan, A. Eisner, A. Frey, A. A. Grillo, M. Grothe, C. A. Heusch, R. P. Johnson,W. Kroeger, W. S. Lockman, T. Pulliam, H. Sadrozinski, T. Schalk, R. E. Schmitz, B. A. Schumm,
A. Seiden, M. Turri, D. C. Williams
University of California at Santa Cruz, Institute for Particle Physics, Santa Cruz, CA 95064, USA
E. Chen, G. P. Dubois-Felsmann, A. Dvoretskii, D. G. Hitlin, Yu. G. Kolomensky, S. Metzler, J. Oyang,F. C. Porter, A. Ryd, A. Samuel, M. Weaver, S. Yang, R. Y. Zhu
California Institute of Technology, Pasadena, CA 91125, USA
R. Aleksan, G. De Domenico, A. de Lesquen, S. Emery, A. Gaidot, S. F. Ganzhur, G. Hamel deMonchenault, W. Kozanecki, M. Langer, G. W. London, B. Mayer, B. Serfass, G. Vasseur, C. Yeche,
M. Zito
Centre d'Etudes Nucl�eaires, Saclay, F-91191 Gif-sur-Yvette, France
S. Devmal, T. L. Geld, S. Jayatilleke, S. M. Jayatilleke, G. Mancinelli, B. T. Meadows, M. D. Sokolo�
University of Cincinnati, Cincinnati, OH 45221, USA
J. Blouw, J. L. Harton, M. Krishnamurthy, A. So�er, W. H. Toki, R. J. Wilson, J. Zhang
Colorado State University, Fort Collins, CO 80523, USA
S. Fahey, W. T. Ford, F. Gaede, D. R. Johnson, A. K. Michael, U. Nauenberg, A. Olivas, H. Park,P. Rankin, J. Roy, S. Sen, J. G. Smith, D. L. Wagner
University of Colorado, Boulder, CO 80309, USA
T. Brandt, J. Brose, G. Dahlinger, M. Dickopp, R. S. Dubitzky, M. L. Kocian, R. M�uller-Pfe�erkorn,K. R. Schubert, R. Schwierz, B. Spaan, L. Wilden
Technische Universit�at Dresden, Inst. f. Kern- u. Teilchenphysik, D-01062 Dresden, Germany
L. Behr, D. Bernard, G. R. Bonneaud, F. Brochard, J. Cohen-Tanugi, S. Ferrag, E. Roussot, C. Thiebaux,G. Vasileiadis, M. Verderi
Ecole Polytechnique, Lab de Physique Nucl�eaire H. E., F-91128 Palaiseau, France
A. Anjomshoaa, R. Bernet, F. Di Lodovico, F. Muheim, S. Playfer, J. E. Swain
University of Edinburgh, Edinburgh EH9 3JZ, UK
C. Bozzi, S. Dittongo, M. Folegani, L. Piemontese
Universit�a di Ferrara, Dipartimento di Fisica and INFN, I-44100 Ferrara, Italy
E. Treadwell
Florida A&M University, Tallahassee, FL 32307, USA
� Jointly appointed with Universit�a di Roma La Sapienza, Dipartimento di Fisica and INFN, I-00185 Roma, Italy
3

R. Baldini-Ferroli, A. Calcaterra, R. de Sangro, D. Falciai, G. Finocchiaro, P. Patteri, I. M. Peruzzi,y
M. Piccolo, A. Zallo
Laboratori Nazionali di Frascati dell'INFN, I-00044 Frascati, Italy
S. Bagnasco, A. Buzzo, R. Contri, G. Crosetti, P. Fabbricatore, S. Farinon, M. Lo Vetere, M. Macri,M. R. Monge, R. Musenich, R. Parodi, S. Passaggio, F. C. Pastore, C. Patrignani, M. G. Pia, C. Priano,
E. Robutti, A. Santroni
Universit�a di Genova, Dipartimento di Fisica and INFN, I-16146 Genova, Italy
J. Cochran, H. B. Crawley, P.-A. Fischer, J. Lamsa, W. T. Meyer, E. I. Rosenberg
Iowa State University, Ames, IA 50011-3160, USA
R. Bartoldus, T. Dignan, R. Hamilton, U. Mallik
University of Iowa, Iowa City, IA 52242, USA
C. Angelini, G. Batignani, S. Bettarini, M. Bondioli, M. Carpinelli, F. Forti, M. A. Giorgi, A. Lusiani,M. Morganti, E. Paoloni, M. Rama, G. Rizzo, F. Sandrelli, G. Simi, G. Triggiani
Universit�a di Pisa, Scuola Normale Superiore, and INFN, I-56010 Pisa, Italy
M. Benkebil, G. Grosdidier, C. Hast, A. Hoecker, V. LePeltier, A. M. Lutz, S. Plaszczynski, M. H. Schune,S. Trincaz-Duvoid, A. Valassi, G. Wormser
LAL, F-91898 ORSAY Cedex, France
R. M. Bionta, V. Brigljevi�c, O. Fackler, D. Fujino, D. J. Lange, M. Mugge, X. Shi, T. J. Wenaus,D. M. Wright, C. R. Wuest
Lawrence Livermore National Laboratory, Livermore, CA 94550, USA
M. Carroll, J. R. Fry, E. Gabathuler, R. Gamet, M. George, M. Kay, S. McMahon, T. R. McMahon,D. J. Payne, C. Touramanis
University of Liverpool, Liverpool L69 3BX, UK
M. L. Aspinwall, P. D. Dauncey, I. Eschrich, N. J. W. Gunawardane, R. Martin, J. A. Nash, P. Sanders,D. Smith
University of London, Imperial College, London, SW7 2BW, UK
D. E. Azzopardi, J. J. Back, P. Dixon, P. F. Harrison, P. B. Vidal, M. I. Williams
University of London, Queen Mary and West�eld College, London, E1 4NS, UK
G. Cowan, M. G. Green, A. Kurup, P. McGrath, I. Scott
University of London, Royal Holloway and Bedford New College, Egham, Surrey TW20 0EX, UK
D. Brown, C. L. Davis, Y. Li, J. Pavlovich, A. Trunov
University of Louisville, Louisville, KY 40292, USA
J. Allison, R. J. Barlow, J. T. Boyd, J. Fullwood, A. Khan, G. D. La�erty, N. Savvas, E. T. Simopoulos,R. J. Thompson, J. H. Weatherall
University of Manchester, Manchester M13 9PL, UK
y Jointly appointed with Univ. di Perugia, I-06100 Perugia, Italy
4

C. Dallapiccola, A. Farbin, A. Jawahery, V. Lillard, J. Olsen, D. A. Roberts
University of Maryland, College Park, MD 20742, USA
B. Brau, R. Cowan, F. Taylor, R. K. Yamamoto
Massachusetts Institute of Technology, Lab for Nuclear Science, Cambridge, MA 02139, USA
G. Blaylock, K. T. Flood, S. S. Hertzbach, R. Ko er, C. S. Lin, S. Willocq, J. Wittlin
University of Massachusetts, Amherst, MA 01003, USA
P. Bloom, D. I. Britton, M. Milek, P. M. Patel, J. Trischuk
McGill University, Montreal, PQ, Canada H3A 2T8
F. Lanni, F. Palombo
Universit�a di Milano, Dipartimento di Fisica and INFN, I-20133 Milano, Italy
J. M. Bauer, M. Booke, L. Cremaldi, R. Kroeger, J. Reidy, D. Sanders, D. J. Summers
University of Mississippi, University, MS 38677, USA
J. F. Arguin, J. P. Martin, J. Y. Nief, R. Seitz, P. Taras, A. Woch, V. Zacek
Universit�e de Montreal, Lab. Rene J. A. Levesque, Montreal, QC, Canada, H3C 3J7
H. Nicholson, C. S. Sutton
Mount Holyoke College, South Hadley, MA 01075, USA
N. Cavallo, G. De Nardo, F. Fabozzi, C. Gatto, L. Lista, D. Piccolo, C. Sciacca
Universit�a di Napoli Federico II, Dipartimento di Scienze Fisiche and INFN, I-80126 Napoli, Italy
M. Falbo
Northern Kentucky University, Highland Heights, KY 41076, USA
J. M. LoSecco
University of Notre Dame, Notre Dame, IN 46556, USA
J. R. G. Alsmiller, T. A. Gabriel, T. Handler
Oak Ridge National Laboratory, Oak Ridge, TN 37831, USA
F. Colecchia, F. Dal Corso, G. Michelon, M. Morandin, M. Posocco, R. Stroili, E. Torassa, C. Voci
Universit�a di Padova, Dipartimento di Fisica and INFN, I-35131 Padova, Italy
M. Benayoun, H. Briand, J. Chauveau, P. David, C. De la Vaissi�ere, L. Del Buono, O. Hamon, F. LeDiberder, Ph. Leruste, J. Lory, F. Martinez-Vidal, L. Roos, J. Stark, S. Versill�e
Universit�es Paris VI et VII, Lab de Physique Nucl�eaire H. E., F-75252 Paris, Cedex 05, France
P. F. Manfredi, V. Re, V. Speziali
Universit�a di Pavia, Dipartimento di Elettronica and INFN, I-27100 Pavia, Italy
E. D. Frank, L. Gladney, Q. H. Guo, J. H. Panetta
University of Pennsylvania, Philadelphia, PA 19104, USA
M. Haire, D. Judd, K. Paick, L. Turnbull, D. E. Wagoner
Prairie View A&M University, Prairie View, TX 77446, USA
5
J. Albert, C. Bula, M. H. Kelsey, C. Lu, K. T. McDonald, V. Miftakov, S. F. Scha�ner, A. J. S. Smith,A. Tumanov, E. W. Varnes
Princeton University, Princeton, NJ 08544, USA
G. Cavoto, F. Ferrarotto, F. Ferroni, K. Fratini, E. Lamanna, E. Leonardi, M. A. Mazzoni, S. Morganti,G. Piredda, F. Safai Tehrani, M. Serra
Universit�a di Roma La Sapienza, Dipartimento di Fisica and INFN, I-00185 Roma, Italy
R. Waldi
Universit�at Rostock, D-18051 Rostock, Germany
P. F. Jacques, M. Kalelkar, R. J. Plano
Rutgers University, New Brunswick, NJ 08903, USA
T. Adye, U. Egede, B. Franek, N. I. Geddes, G. P. Gopal
Rutherford Appleton Laboratory, Chilton, Didcot, Oxon., OX11 0QX, UK
N. Copty, M. V. Purohit, F. X. Yumiceva
University of South Carolina, Columbia, SC 29208, USA
I. Adam, P. L. Anthony, F. Anulli, D. Aston, K. Baird, E. Bloom, A. M. Boyarski, F. Bulos, G. Calderini,M. R. Convery, D. P. Coupal, D. H. Coward, J. Dorfan, M. Doser, W. Dunwoodie, T. Glanzman,G. L. Godfrey, P. Grosso, J. L. Hewett, T. Himel, M. E. Hu�er, W. R. Innes, C. P. Jessop, P. Kim,
U. Langenegger, D. W. G. S. Leith, S. Luitz, V. Luth, H. L. Lynch, G. Manzin, H. Marsiske, S. Menke,R. Messner, K. C. Mo�eit, M. Morii, R. Mount, D. R. Muller, C. P. O'Grady, P. Paolucci, S. Petrak,
H. Quinn, B. N. Ratcli�, S. H. Robertson, L. S. Rochester, A. Roodman, T. Schietinger, R. H. Schindler,J. Schwiening, G. Sciolla, V. V. Serbo, A. Snyder, A. Soha, S. M. Spanier, A. Stahl, D. Su, M. K. Sullivan,
M. Talby, H. A. Tanaka, J. Va'vra, S. R. Wagner, A. J. R. Weinstein, W. J. Wisniewski, C. C. Young
Stanford Linear Accelerator Center, Stanford, CA 94309, USA
P. R. Burchat, C. H. Cheng, D. Kirkby, T. I. Meyer, C. Roat
Stanford University, Stanford, CA 94305-4060, USA
A. De Silva, R. Henderson
TRIUMF, Vancouver, BC, Canada V6T 2A3
W. Bugg, H. Cohn, E. Hart, A. W. Weidemann
University of Tennessee, Knoxville, TN 37996, USA
T. Benninger, J. M. Izen, I. Kitayama, X. C. Lou, M. Turcotte
University of Texas at Dallas, Richardson, TX 75083, USA
F. Bianchi, M. Bona, B. Di Girolamo, D. Gamba, A. Smol, D. Zanin
Universit�a di Torino, Dipartimento di Fisica Sperimentale and INFN, I-10125 Torino, Italy
L. Bosisio, G. Della Ricca, L. Lanceri, A. Pompili, P. Poropat, M. Prest, E. Vallazza, G. Vuagnin
Universit�a di Trieste, Dipartimento di Fisica and INFN, I-34127 Trieste, Italy
R. S. Panvini
Vanderbilt University, Nashville, TN 37235, USA
6

C. M. Brown, P. D. Jackson, R. Kowalewski, J. M. Roney
University of Victoria, Victoria, BC, Canada V8W 3P6
H. R. Band, E. Charles, S. Dasu, P. Elmer, J. R. Johnson, J. Nielsen, W. Orejudos, Y. Pan, R. Prepost,I. J. Scott, J. Walsh, S. L. Wu, Z. Yu, H. Zobernig
University of Wisconsin, Madison, WI 53706, USA
7

1 Introduction
The production of the D(�)�s meson in B decays allows one to study the mechanisms leading to the
creation of a c�s quark pair. The main diagram contributing to this decay is shown in Fig. 1. Other
B decay diagrams also contribute, although at a lower level, but no attempt is made to quantify
their rate in this paper. As has been pointed out in Ref. [1], the b! ccs decay rate may be large
and could help to explain the theoretical di�culties [2] in accounting simultaneously for the total
inclusive B decay rate and the semileptonic branching fraction of the B meson. As a longer term
goal, the measurement of the rate and momentum spectrum of D�s meson produced in B decays
beyond the kinematic limit for the process B ! D�+s Xc could be used to study b! u transitions.
Despite the fact that purely hadronic �nal states are more di�cult to understand theoretically,
one may use the particular decay described in this paper to extract Vub=Vcb [3]. This document
reports measurements made with the BABAR detector of both the inclusive D(�)�s production rates
and momentum spectra in B decays and the branching fractions of two speci�c two-body B decay
modes involving a D(�)�s meson. The latter measurements are made using a partial reconstruction
technique.
b
(*)+
s
c
DS
q
Figure 1: The main spectator
diagram leading to the produc-
tion of D(�)�s mesons in B decays.
2 The detector and the data sample
A description of the BABAR detector and the de�nition of many general analysis procedures can
be found in an accompanying paper [4]. Here only the components of the detector most crucial to
this analysis are brie y summarized.
Charged particles are detected and their momenta measured by a combination of a central
drift chamber (DCH) with a helium-based gas and a �ve-layer (double-sided) silicon vertex tracker
(SVT), embedded in a 1.5 T solenoidal �eld produced by a superconducting magnet. The charged
particle momentum resolution is approximately (�pT=pT )2 = (0:0015 pT)
2+(0:005)2, where pT is in
GeV=c. The SVT, with typically 10�m single-hit resolution, provides vertex information in both
the transverse plane and in z.
Particles are identi�ed using a combination of measurements from all the BABAR components.
Charged particle identi�cation exploits ionization energy loss measured in the DCH and SVT as
well as Cherenkov radiation measured in a ring imaging detector (DIRC). Electrons and photons
are identi�ed by the CsI electromagnetic calorimeter.
Multihadronic events produced in e+e� annihilation at the PEP-II collider (SLAC) and collected
with the BABAR detector have been used in this analysis. These data were taken at the �(4S)
resonance center of mass energy and at an energy about 40MeV below the BB threshold. The
integrated luminosity for on resonance data is 7.73 fb�1 and 1.17 fb�1 for o� resonance.
8
3 Inclusive D�
sproduction
3.1 D�
sreconstruction
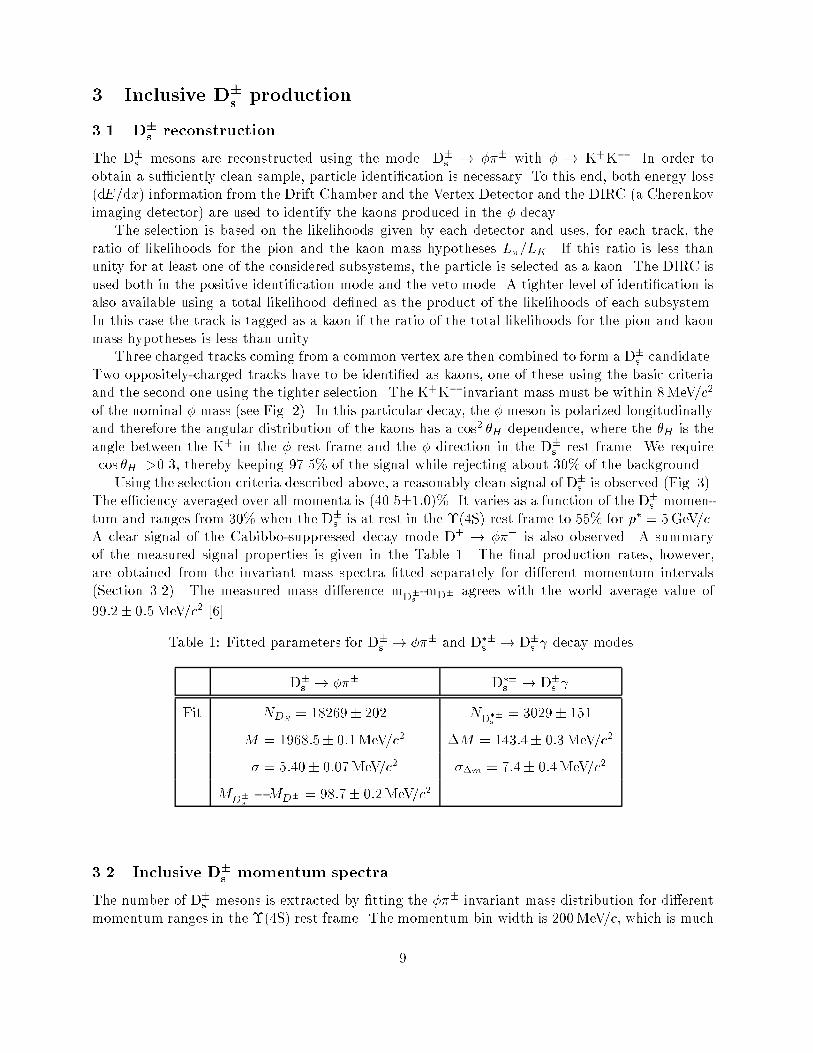
The D�s mesons are reconstructed using the mode D�s ! ��� with � ! K+K�. In order to
obtain a su�ciently clean sample, particle identi�cation is necessary. To this end, both energy loss
(dE=dx) information from the Drift Chamber and the Vertex Detector and the DIRC (a Cherenkov
imaging detector) are used to identify the kaons produced in the � decay.
The selection is based on the likelihoods given by each detector and uses, for each track, the
ratio of likelihoods for the pion and the kaon mass hypotheses L�=LK . If this ratio is less than
unity for at least one of the considered subsystems, the particle is selected as a kaon. The DIRC is
used both in the positive identi�cation mode and the veto mode. A tighter level of identi�cation is
also available using a total likelihood de�ned as the product of the likelihoods of each subsystem.
In this case the track is tagged as a kaon if the ratio of the total likelihoods for the pion and kaon
mass hypotheses is less than unity.
Three charged tracks coming from a common vertex are then combined to form a D�s candidate.
Two oppositely-charged tracks have to be identi�ed as kaons, one of these using the basic criteria
and the second one using the tighter selection. The K+K� invariant mass must be within 8MeV=c2
of the nominal � mass (see Fig. 2). In this particular decay, the � meson is polarized longitudinally
and therefore the angular distribution of the kaons has a cos2 �H dependence, where the �H is the
angle between the K+ in the � rest frame and the � direction in the D�s rest frame. We require
j cos �H j >0.3, thereby keeping 97.5% of the signal while rejecting about 30% of the background.
Using the selection criteria described above, a reasonably clean signal of D�s is observed (Fig. 3).
The e�ciency averaged over all momenta is (40.5�1:0)%. It varies as a function of the D�s momen-
tum and ranges from 30% when the D�s is at rest in the �(4S) rest frame to 55% for p� = 5GeV=c.
A clear signal of the Cabibbo-suppressed decay mode D� ! ��� is also observed. A summary
of the measured signal properties is given in the Table 1. The �nal production rates, however,
are obtained from the invariant mass spectra �tted separately for di�erent momentum intervals
(Section 3.2). The measured mass di�erence mD�s-mD� agrees with the world average value of
99:2� 0:5MeV=c2 [6].
Table 1: Fitted parameters for D�s ! ��� and D��s ! D�s decay modes.
D�s ! ��� D��s ! D�s
Fit NDS= 18269� 202 ND��s
= 3029� 151
M = 1968:5� 0:1MeV=c2 �M = 143:4� 0:3MeV=c2
� = 5:40� 0:07MeV=c2 ��m = 7:4� 0:4MeV=c2
MD�s�MD� = 98:7� 0:2MeV=c2
3.2 Inclusive D�
smomentum spectra
The number of D�s mesons is extracted by �tting the ��� invariant mass distribution for di�erent
momentum ranges in the �(4S) rest frame. The momentum bin width is 200MeV=c, which is much
9

K-K Mass, GeV/c2
Eve
nts
BABAR
0
1000
2000
3000
4000
1 1.01 1.02 1.03 1.04
Figure 2: The K+K� invariant mass spectrumfor an integrated luminosity of 1.53 fb�1. Thesolid line represents a �t using a Breit-Wignerfunction and a 1st order polynomial.
BABAR
φ-π Mass, GeV/c2
Eve
nts
0
2000
4000
6000
1.8 1.85 1.9 1.95 2 2.05
Figure 3: The �� invariant mass spectrum foran integrated luminosity of 7.73 fb�1.
larger than the momentum resolution. The D�s momentum resolution averaged over all momenta
obtained from the Monte Carlo is 5:6�0:3MeV=c. The �t function is a single Gaussian distribution,
both for the D�s and the D�. The width of the Gaussians are constrained to be the same and the
combinatorial background is accounted for by an exponential distribution. The number of D�s in
the o�-resonance data is extracted using the same �t function but with �xed values for MD�, MD�sand � obtained from the �t to the on-resonance data.
The number of reconstructed D�s as a function of their momentum in the �(4S) rest frame is
shown in Fig. 4 for on- and o�-resonance data. The e�ciency-corrected momentum spectrum is
shown in Fig. 5.
Table 2: Analytical expressions for the fragmentation functions.
Name of function Analytical expression
Peterson et al.: f(xp) =Nxp
�1� 1
xp� �
1�xp
��2Collins and Spiller: f(xp) = N
�1�xpxp
+2�xp1�xp
��(1 + x2p)
�1� 1
xp� �
1�xp
��2Kartvelishvili et al.: f(xp) = Nx�p (1� xp)
In order to determine the D�s momentum spectrum from the continuum, on-resonance data
with momentum higher than 2.45GeV=c and o�-resonance data scaled according to the luminosity
ratio have been �tted after e�ciency correction using 3 di�erent fragmentation functions (see
Table 2). The product of branching fraction, B(D�s ! ���), times cross-section for D�s production
from continuum, �(e+e� ! D�s X), is obtained by integrating the function obtained from the �t
(Fig. 5). The extracted values and �2/dof from the �ts are shown in Table 3.
10

P*, GeV/c
N(D
S)
BABAR
0
1000
2000
3000
0 1 2 3 4 5
Figure 4: The D�s momentum spectrum for on-resonance data (solid circles) and for scaled o�-resonance data (open circles) before e�ciency cor-rection.
BABAR
P*, GeV/c
N(D
S)/N
ε
0
0.1
0.2
0.3
0.4
0.5
0 1 2 3 4 5
Figure 5: The on-resonance (solid circles) andscaled o�-resonance (open circles) DS momentumspectrum e�ciency-corrected. The solid line is theresult of the �t using Peterson fragmentation func-tion described in text.
Table 4 shows the contribution of the di�erent sources to the total systematic error for �(e+e� !
D�s X) � B(D�s ! ���). Using the best �t, which is obtained with the Peterson function, we �nd
�(e+e� ! D�s X) �B(D�s ! ���) = 8.29�0.41�0.69 pb. From a comparison of the results obtained
using the other two parameterizations, we assign a conservative systematic error of 2% due to the
assumed functional form.
The measured values are in good agreement with previously published results [7]. The momen-
tum spectrum of the Ds produced in B decays is obtained by subtracting bin-by-bin the value of
the �t function to the on-resonance data after e�ciency correction (Fig. 6).
Table 3: The parameters for the di�erent fragmentation functions obtained from the �t and the
measured cross section �(e+e� ! D�s X) � B(D�s ! ���), and the �2/dof of the �t. Only the
statistical errors are given.
Name of function Shape parameter �(e+e� ! D�s X) � B(D�s ! ���), pb �2/dof
Peterson et al.: �=(12.5�0.6) � 10�2 8.29�0.41 1.286
Collins and Spiller: �=(37.6�2.8) � 10�2 8.69�0.46 3.559
Kartvelishvili et al.: �=1.91�0.07 8.63�0.33 5.338
11

Table 4: The systematic errors for �(e+e� ! D�s X) � B(D�s ! ���).
Source Error (%)
B(�! K+K�) 1.6
Particle id e�ciency 0.8
Tracking e�ciency 7.5
Luminosity 3.0
Total systematic error 8.3
3.3 Inclusive D�
sbranching fraction in B decays
By integrating the e�ciency corrected momentum distribution, a total Ds yield from B meson
decays of 37050� 950 events is found. This corresponds to the inclusive branching fraction of
B(B ! D�s X) =
"(11:90� 0:30� 1:07)�
3:6� 0:9%
B(D�s ! ���)
#%; (1)
where the �rst error is statistical, the second is systematic and the third is the contribution of the
D�s ! ��� branching fraction uncertainty [6]. Recognizing that this last uncertainty is common
to all measurements, our result is slightly higher than the world average (10.0�0:6 [6]) and in good
agreement with the most precise measurement performed by CLEO [8]. The di�erent sources of
systematic errors are given in detail in Table 5. The dominant uncertainty comes from knowledge
of the tracking e�ciency, which is still the subject of detailed study [4].
As a cross check of the continuum subtraction procedure, we also subtracted directly the o�-
resonance data scaled by the luminosity ratio for on- and o�-resonance. By this means, one obtains
an inclusive branching fraction B(B ! D�s X) = 12:0 � 0:5 � 1:1%, in agreement with the value
reported above.
4 Inclusive D��
sproduction
4.1 D��
sreconstruction
D��s mesons are reconstructed using the decay D��s ! D�s with the subsequent decay D�s ! ��.
D�s candidates are selected by requiring the �� invariant mass to be within 2.5 standard deviations
(�) of the peak value. These are then combined with \single photons" from the event. The later
are de�ned by the following criteria:
� E > 50MeV where E is the photon energy in the laboratory frame
� E� > 110MeV where E�
is the photon energy in the �(4S) frame
12

Table 5: Systematic errors for B(B ! D�s X).
Source Error (%)
Signal shape 0.9
Background shape 0.4
Continuum subtraction 1.8
Monte Carlo statistics 2.0
Bin width 0.7
Total for DS yield 2.9
NBB
3.6
B(�! K+K�) 1.6
Particle id e�ciency 0.8
Tracking e�ciency 7.5
Total systematic error 9.0
Table 6: Systematic errors for B(B ! D��s X).
Source Error (%)
Signal shape 5.0
Continuum subtraction 1.2
Monte Carlo statistics 4.8
Bin width 3.0
Total for DS yield 7.7
NBB
3.6
B(D�+S ! DS ) 2.7
Photon e�ciency 2.5
B(�! K+K�) 1.6
Particle id e�ciency 0.8
Tracking e�ciency 7.5
Total systematic error 12.0
� In order to reduce the combinatoric background, the candidate photon should not form a
�0 with E� > 200MeV when combined with any other photon in the event. The �0 mass
window is 115 < M < 155MeV=c2.
The distribution of the mass di�erence �M = MD�s � MD�s
is shown in the Fig. 7. A clear
peak with 3030� 150 events is observed. The parameters obtained from the �t are summarized in
Table 1.
4.2 Inclusive D��
smomentum spectra
The decay D��s ! D�s , D�s ! ��� is used for the measurement of the D��s inclusive branching
fraction and the momentum spectrum. The number of D��s mesons is extracted by �tting the
�M = MDs �MDs invariant mass distribution for the di�erent momentum ranges in the �(4S)
rest frame. A momentum bin width of 400MeV=c was chosen.
The e�ciency corrected momentum spectrum is shown in Fig. 8. Both on- and o�-resonance
points corresponding to D��s mesons produced from the continuum have been �t using di�erent
fragmentation functions (Table 2). The cross section for D��s produced from continuum and the
values of the �t parameters are shown in Table 7.
Fig. 9 shows the momentum spectrum of D��s produced in B decays where the Peterson frag-
mentation function is used for continuum extrapolation. Using this distribution, we �nd for the
continuum cross section �(e+e� ! D��s X) � B(D�s ! ���) = 3.48�0.39�0.38 pb.
13

Preliminary
BABAR
P*, GeV/c
N(D
S)/N
ε
0
0.2
0.4
0.6
0 0.5 1 1.5 2 2.5
Figure 6: The Ds momentum spectrum e�ciency-corrected after subtraction of the value of the �t-ted curve. The Peterson fragmentation function wasused for the �t of the continuum.
M(DSγ)-M(DS), GeV/c2
Eve
nts
BABAR
0
250
500
750
1000
0 0.05 0.1 0.15 0.2 0.25
Figure 7: �M =MDs �MDsmass spectrum for an
integrated luminosity of 7.73 fb�1. The �t functionis a single Gaussian for the signal and a third-orderpolynomial for the background.
4.3 Inclusive D��
sbranching fraction in B decays
In the same way as for the D�s result, we integrate the e�ciency corrected D��s distribution and
obtain a total yield from B meson decays of 19300� 1900 events. From this we �nd the inclusive
branching fraction to be
B(B ! D��s X) =
"(6:8� 0:7� 0:8)�
3:6� 0:9%
B(D�s ! ���)
#%; (2)
where the systematic errors are given in detail in Table 6.
Table 7: The parameters for the di�erent fragmentation functions, the measured cross section
�(e+e� ! D��s X) �B(D�s ! ���), and the �2/dof obtained from the �t. Only the statistical errors
are given.
Name of function Parameter �(e+e� ! D��s X) � B(D+
S ! ��+), pb �2/dof
Peterson et al.: �=(7.9�0.8)� 10�2 3.48�0.39 1.260
Collins and Spiller: �=(19.3�2.3)� 10�2 3.75�0.42 1.288
Kartvelishvili et al.: �=2.6�0.2 3.61�0.29 1.725
14

P*, GeV/c
N(D
S* )/N
ε
BABAR
0
0.5
1
1.5
2
2.5
0 1 2 3 4 5
Figure 8: The on-resonance (solid circles) andscaled o�-resonance (open circles) D��s momentumspectrum after e�ciency correction. The solid lineshows the �t using the Peterson fragmentation.
Preliminary
P*, GeV/c
N(D
S* )/N
ε
BABAR
0
1
2
0 1 2 3 4 5
Figure 9: The D��s spectrum after e�ciency cor-rection and continuum subtraction using the resultof the �t. The Peterson fragmentation function isused for the �t of the continuum.
5 Branching fraction for B0! D��D(�)+
sdecays
In addition to the measurements of inclusive production rates for D�s and D��s , we have extracted the
branching ratios for the decays B0 ! D��D+s and B0 ! D��D�+s based on a partial reconstruction
method.
5.1 The partial reconstruction method
As discussed in the introduction, no attempt is made to reconstruct the D0 decays. One combines
a pion with the reconstructed D(�)�s where the total D
(�)�s � � charge is zero and, assuming that
their origin is a B0 meson, we calculate the missing invariant mass. This should be the D0 mass
if the hypothesis is correct�. Without the constraint of the D0 mass, the direction of the B meson
is unknown. Although its angle with respect to D�s direction can be deduced, the angle � around
this direction is undetermined. Using the beam energy constraint, the missing mass, which still
depending on the unknown angle � of the B0 momentum vector, is computed from:
mmiss =q(Ebeam� ED�s
� E�)2 � (~pB � ~pD�s � ~p�)2: (3)
In this analysis the missing mass is de�ned using an arbitrary choice for the angle �. We use the
convention that the direction of the B0 meson lies in the plane f~p�; ~pD(�)�s
g.
�All calculations in this section are performed in the �(4S) rest frame.
15

5.2 Signal extraction
Fully reconstructed D�s and D��s are selected by requiring the measured ��� mass or �m =
m��� �m��� to be within 2.5 � of the �tted mean value. Because of high combinatorial background
in the mode with a D��s , one may �nd several D��s candidates in an event. Therefore, we form a
�2 for each candidate de�ned by:
�2 =
�M rec
� �Mmean�
��
�2+
�M rec
Ds�Mmean
Ds
�Ds
�2+
�M rec
�m �Mmean�m
��m
�2; (4)
and take the candidate with the lowest value. The D(�)�s � � pairs satisfying the kinematic con-
straints for the decay B0 ! D��D(�)+s are �tted to a common vertex. To reduce further the
continuum background, we use the event shape variable R2, de�ned as the ratio of the second to
zeroth order Fox-Wolfram moment, and require R2 < 0:35.
The missing mass distributions for the D�s � � and D��s � � are shown in Fig. 10 and 11
respectively. A clear signal is observed for both decays. The missing mass distribution is �tted
with the sum of a Gaussian distribution for the signal and a background function given by
fB(x) =
C1
�x0 � x
�C2
C3 +
�x0 � x
�C2; (5)
where x is the calculated missing mass, Ci are the parameters of the �t and x0 is the end point,
mD� �m� = 1:871GeV=c2. The results of the �ts for both decay modes are summarized in Table 8.
0
50
100
150
200
1.8 1.825 1.85 1.875
Mrecoil, GeV/c2
Eve
nts
BABAR
Figure 10: The missing mass distribution for theD�s -� system. The solid line shows the result of the�t using the function described in the text.
Mrecoil, GeV/c2
Eve
nts
0
20
40
1.8 1.825 1.85 1.875
BABAR
Figure 11: The missing mass distribution for theD��s -� system. The solid line shows the result ofthe �t using the function described in the text.
16
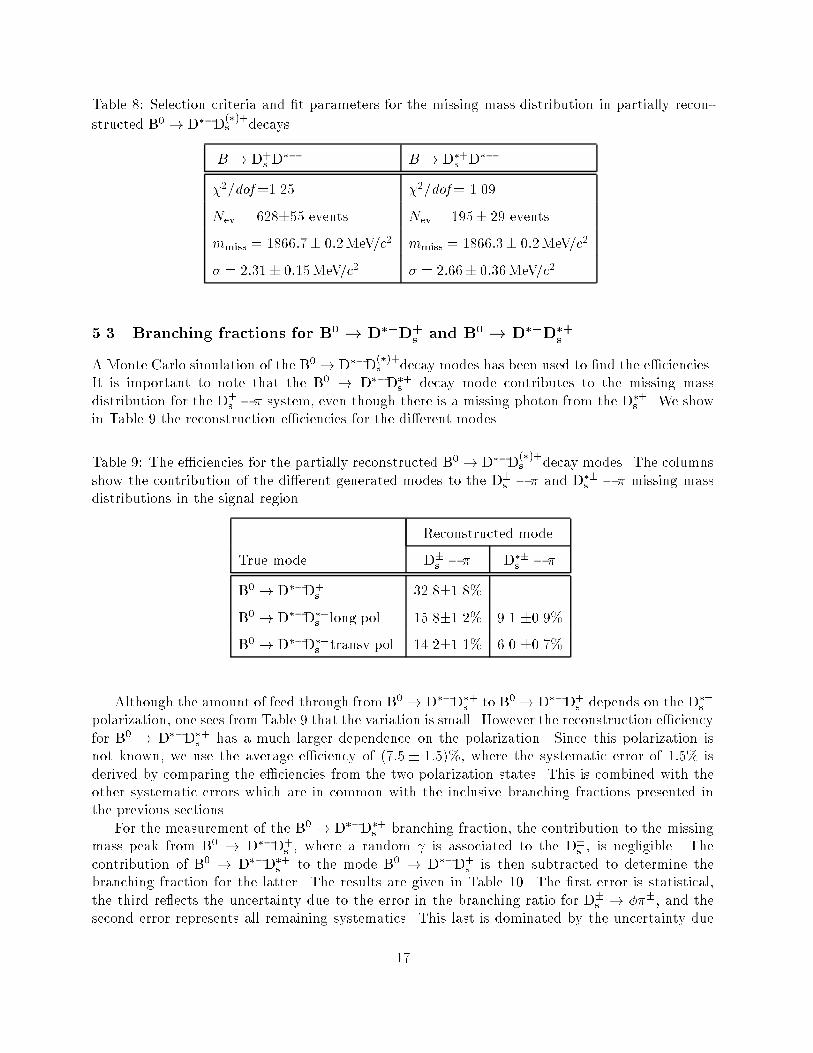
Table 8: Selection criteria and �t parameters for the missing mass distribution in partially recon-
structed B0 ! D��D(�)+s decays.
B ! D+s D
�� B ! D�+s D��
�2=dof=1.25 �2=dof= 1.09
Nev = 628�55 events Nev = 195� 29 events
mmiss = 1866:7� 0:2MeV=c2 mmiss = 1866:3� 0:2MeV=c2
� = 2:31� 0:15MeV=c2 � = 2:66� 0:36MeV=c2
5.3 Branching fractions for B0! D��D+
sand B0
! D��D�+s
A Monte Carlo simulation of the B0 ! D��D(�)+s decay modes has been used to �nd the e�ciencies.
It is important to note that the B0 ! D��D�+s decay mode contributes to the missing mass
distribution for the D�s � � system, even though there is a missing photon from the D��s . We show
in Table 9 the reconstruction e�ciencies for the di�erent modes.
Table 9: The e�ciencies for the partially reconstructed B0 ! D��D(�)+s decay modes. The columns
show the contribution of the di�erent generated modes to the D�s � � and D��s � � missing mass
distributions in the signal region.
Reconstructed mode
True mode D�s � � D��s � �
B0 ! D��D+s 32.8�1.8%
B0 ! D��D�+s long.pol. 15.8�1.2% 9.1 �0.9%
B0 ! D��D�+s transv.pol. 14.2�1.1% 6.0 �0.7%
Although the amount of feed through from B0 ! D��D�+s to B0 ! D��D+s depends on the D��s
polarization, one sees from Table 9 that the variation is small. However the reconstruction e�ciency
for B0 ! D��D�+s has a much larger dependence on the polarization. Since this polarization is
not known, we use the average e�ciency of (7:5 � 1:5)%, where the systematic error of 1:5% is
derived by comparing the e�ciencies from the two polarization states. This is combined with the
other systematic errors which are in common with the inclusive branching fractions presented in
the previous sections.
For the measurement of the B0 ! D��D�+s branching fraction, the contribution to the missing
mass peak from B0 ! D��D+s , where a random is associated to the D�s , is negligible. The
contribution of B0 ! D��D�+s to the mode B0 ! D��D+s is then subtracted to determine the
branching fraction for the latter. The results are given in Table 10. The �rst error is statistical,
the third re ects the uncertainty due to the error in the branching ratio for D�s ! ���, and the
second error represents all remaining systematics. This last is dominated by the uncertainty due
17
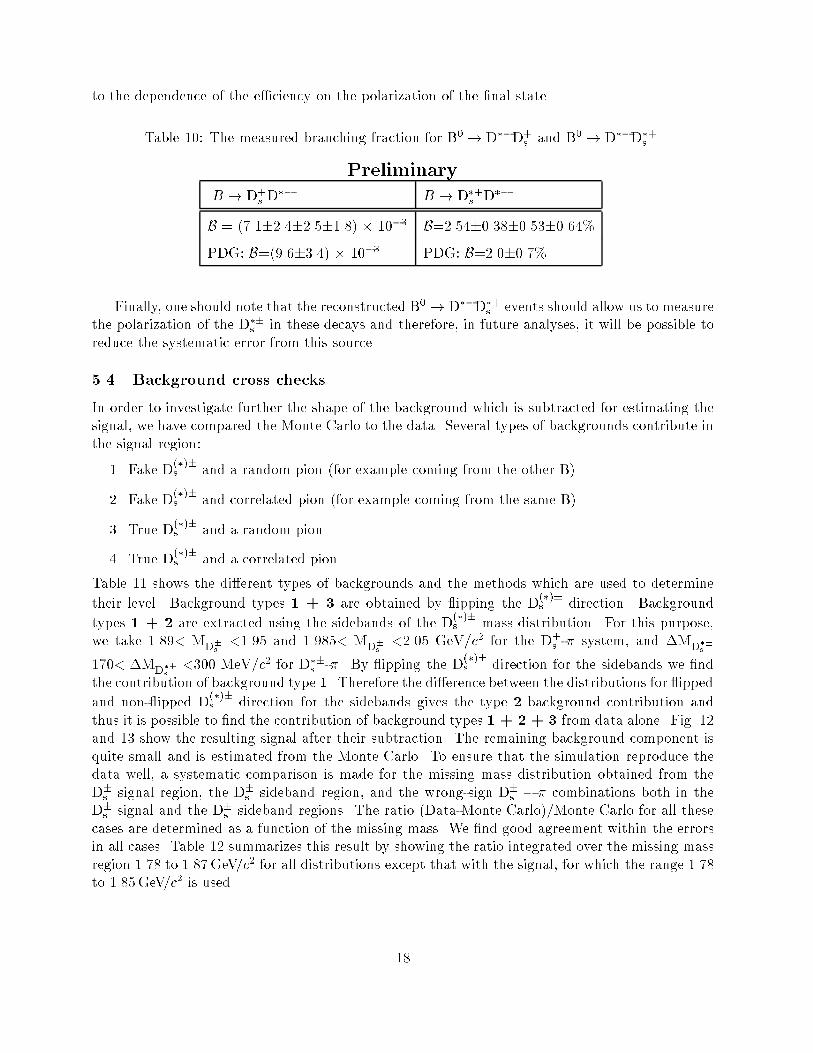
to the dependence of the e�ciency on the polarization of the �nal state.
Table 10: The measured branching fraction for B0 ! D��D+s and B0 ! D��D�+s .
Preliminary
B ! D+s D
�� B ! D�+s D��
B = (7.1�2.4�2.5�1.8) � 10�3 B=2.54�0.38�0.53�0.64%
PDG: B=(9.6�3.4) � 10�3 PDG: B=2.0�0.7%
Finally, one should note that the reconstructed B0 ! D��D�+s events should allow us to measure
the polarization of the D��s in these decays and therefore, in future analyses, it will be possible to
reduce the systematic error from this source.
5.4 Background cross checks
In order to investigate further the shape of the background which is subtracted for estimating the
signal, we have compared the Monte Carlo to the data. Several types of backgrounds contribute in
the signal region:
1. Fake D(�)�s and a random pion (for example coming from the other B).
2. Fake D(�)�s and correlated pion (for example coming from the same B).
3. True D(�)�s and a random pion.
4. True D(�)�s and a correlated pion.
Table 11 shows the di�erent types of backgrounds and the methods which are used to determine
their level. Background types 1 + 3 are obtained by ipping the D(�)�s direction. Background
types 1 + 2 are extracted using the sidebands of the D(�)�s mass distribution. For this purpose,
we take 1.89< MD�s<1.95 and 1.985< MD�s
<2.05 GeV=c2 for the D�s -� system, and �MD��s
170< �MD��s<300 MeV=c2 for D��s -�. By ipping the D
(�)�s direction for the sidebands we �nd
the contribution of background type 1. Therefore the di�erence between the distributions for ipped
and non- ipped D(�)�s direction for the sidebands gives the type 2 background contribution and
thus it is possible to �nd the contribution of background types 1 + 2 + 3 from data alone. Fig. 12
and 13 show the resulting signal after their subtraction. The remaining background component is
quite small and is estimated from the Monte Carlo. To ensure that the simulation reproduce the
data well, a systematic comparison is made for the missing mass distribution obtained from the
D�s signal region, the D�s sideband region, and the wrong-sign D�s � � combinations both in the
D�s signal and the D�s sideband regions. The ratio (Data-Monte Carlo)/Monte Carlo for all these
cases are determined as a function of the missing mass. We �nd good agreement within the errors
in all cases. Table 12 summarizes this result by showing the ratio integrated over the missing mass
region 1.78 to 1.87GeV=c2 for all distributions except that with the signal, for which the range 1.78
to 1.85GeV=c2 is used.
18

Table 11: The di�erent data samples which can be used to determine the background in the D0
signal region.
Background Flip D(�)�s D
(�)�s Side-bands Side-bands ip D
(�)�s
1. Fake D(�)�s + random � x x x
2. Fake D(�)�s + correlated � x
3. True D(�)�s + random � x
4. True D(�)�s + correlated �
Table 12: The comparison of the di�erent data samples with Monte Carlo.
B0 ! D��D+s B0 ! D��D�+s
Sample type (Ndata�NMC)=NMC �2/dof (Ndata�NMC)=NMC �2/dof
D�s Signal 0.051�0.025 1.008 0.103�0.057 1.058
Flip D�s -0.043�0.031 0.841 -0.041�0.064 0.832
D�s Sideband 0.006�0.018 1.391 -0.031�0.053 1.194
Flip D�s Sideband 0.015�0.021 1.627 0.084�0.069 1.690
Wrong Sign -0.031�0.029 0.987 0.010�0.063 1.088
WS, D�s Sideband 0.030�0.020 1.311 0.034�0.065 1.487
6 Conclusion
The production of D(�)�s at the �(4S) energy (and 40MeV below) has been studied with the BABAR
detector. Preliminary measurements of branching fractions for t`inclusive production and for the
exclusive decays B0 ! D��D�+s have been performed. The following cross sections have been found
for production in the continuum:
�(e+e� ! D�s X) � B(D�s ! ���) = 8:29� 0:41� 0:69 pb ;
�(e+e� ! D��s X) � B(D�s ! ���) = 3:48� 0:39� 0:38 pb :
Using the on-resonance data, the inclusive branching fraction for the B meson decays
B(B ! D�s X) =
"(11:90� 0:30� 1:07)�
3:6� 0:9%
B(D�s ! ���)
#%
B(B ! D��s X) =
"(6:8� 0:7� 0:8)�
3:6� 0:9%
B(D�s ! ���)
#%
19

BABAR
Mrecoil, GeV/c2
Eve
nts
0
100
200
1.8 1.825 1.85 1.875
Figure 12: The missing mass distribution for theD�s -� system from data (points) and Monte Carlo(histogram) after background subtraction (see text).
BABAR
Mrecoil, GeV/c2
Eve
nts
-25
0
25
50
75
1.8 1.825 1.85 1.875
Figure 13: The missing mass distribution for D��s -� system from data (points) and Monte Carlo (his-togram) after background subtraction (see text).
have been measured. Finally the decays B0 ! D��D+s and B0 ! D��D
(�)+s have been observed
using a partial reconstruction technique and the following branching fractions have been determined:
B(B! D+s D
��) = (7:1� 2:4� 2:5� 1:8)� 10�3 ;
B(B! D�+s D��) = (2:54� 0:38� 0:53� 0:64)% :
The results obtained are in a good agreement with previous measurements by other experiments.
The measurement of inclusive branching fraction of D��s from B decay has been obtained for the
�rst time.
7 Acknowledgements
We are grateful for the contributions of our PEP-II colleagues in achieving the excellent luminosity
and machine conditions that have made this work possible. We acknowledge support from the
Natural Sciences and Engineering Research Council (Canada), Institute of High Energy Physics
(China), Commissariat �a l'Energie Atomique and Institut National de Physique Nucl�eaire et de
Physique des Particules (France), Bundesministerium f�ur Bildung und Forschung (Germany), Isti-
tuto Nazionale di Fisica Nucleare (Italy), The Research Council of Norway, Ministry of Science and
Technology of the Russian Federation, Particle Physics and Astronomy Research Council (United
Kingdom), the Department of Energy (US), and the National Science Foundation (US). In addi-
tion, individual support has been received from the Swiss National Foundation, the A. P. Sloan
Foundation, the Research Corporation, and the Alexander von Humboldt Foundation. The visiting
groups wish to thank SLAC for the support and kind hospitality extended to them.
20

References
[1] A. F. Falk, M. B. Wise and I. Dunietz, Phys. Rev. D 51 (1995) 1183.
[2] I. Bigi et al., Phys. Lett. B 323 (1994) 408.
[3] R. Aleksan, M. Zito, A. Le Yaouanc, L. Oliver, O. P�ene and J.-C. Raynal, Preprint hep-
ph/9906504; also LPT-ORSAY-99-35 and DAPNIA-SPP-99-18, May 1999.
[4] BABAR Collaboration, B. Aubert et al., \The �rst year of the BABAR experiment at PEP-
II", BABAR-CONF-00/17, submitted to the XXXth International Conference on High Energy
Physics, Osaka, Japan.
[5] P. F. Harrison and H. R. Quinn, eds., \The BABAR physics book", SLAC-R-405 (1998).
[6] Particle Data Group, Review of Particle Properties, Phys. Rev. D 54 (1996) 1.
[7] ARGUS Collaboration, H. Albrecht et al., Z. Phys. C 54 (1992) 1.
[8] CLEO Collaboration, D. Gibaut et al., Phys. Rev. D 53 (1996) 4734.
21