study of groundwater quality using open source gis … · study of groundwater quality using open...
TRANSCRIPT
Study of Groundwater Quality Using Open Source GIS and WQI in Rudrapur City,
Uttarakhand
Mr. Ropesh Goyal
B.Tech, Civil Engg. Dept.,
College of Technology, Pantnagar (UK), India
Dr. Sandeep Gupta
Assisstant Professor, Civil Engg Dept.,
College of Technology, Pantnagar (UK), India
Abstract- In this study, the area in Udham Singh Nagar district, Uttarakhand is selected to analyse the quality of groundwater. The sources of contamination were assessed by creating an information system using open source Geographic Information System (GIS) and also by analysing the groundwater quality using water quality index (WQI). Groundwater samples were collected in three different seasons i.e. pre-monsoon, monsoon and post-monsoon from 15 different water sources and were analysed for 13 various physico-chemical and biological parameters. Acomparison, between analysed results and desirable limits as mentioned in IS: 10500:1991 was done. Information system comprises the results generated by spatial mapping of different parameters in the area. For the assessment using WQI, the mean values were taken into consideration as the characteristic values to observe and analyse the variations during three different seasons, also the probable reasons of the increase in or decrease in values of water quality parameters are discussed.
Keywords: Groundwater, GIS, pre-monsoon, monsoon, post-monsoon, water quality parameters, physico-chemical, biological, spatial mapping, WQI, assessment.
International Journal of Latest Trends in Engineering and Technology (IJLTET) ISSN: 2278-621X
786 Vol 7 issue 1 May 2016http://dx.doi.org/10.21172/1.71.113
1. INTRODUCTION
Groundwater is the one of the most important resource for providing water supply and is intensively exploited for industrial and domestic use. In India, groundwater is a critical resource of water which accounts for almost 85% of drinking water supplies [1]. The quality and quantity of groundwater is being degraded at a high rate mainly due to increase in population, urbanization, excessive exploitation and inadequate pollution control measures.
In 2006 between the domestic, agricultural and industrial sectors, India used approximately 829 billion cubic meters of water every year, which is approximately the size of Lake Erie. By 2050 demand is expected to double and consequently exceed the 1.4 trillion cubic meters of supply [2]. In the industrial areas the industries dispose of the waste water directly into local rivers as in Rudrapur city, industries in SIIDCUL disposes off in the Kalyani river flowing across the Rudrapur city, making it highly polluted [3]. Because the rivers are too polluted for drinking water supply and the government is unable to deliver freshwater to the cities, the only easy option left for urban dwellers is turning to groundwater, which greatly contributes to the depletion and pollution of underground aquifers.
In India, there are over 20 million private wells, in addition to the government tube wells [4]. Attention on water contamination and its management has become a need of the hour because of far reaching impact on human health. Water pollution not only affects water quality but also threat human health, economic development and social prosperity [5]. Good quality of water will ensure the sustainability of socio-economic development as the government priority is shifted to other sectors of the economy, than channelling the resources towards combating out breaks of water borne diseases due to consumption of contaminated groundwater [6].
Water is the basis of life on this planet. The immense population along with rapid urbanization and industrialization is depleting the drinking water resources at a very fast rate. More than 3.4 million people die each year from contaminated water related causes. Nearly all deaths, 99 percent, occur in the developing world- World Health Organization (WHO) (2014). It is not a secret that the current problem of the water pollution is a serious threat to the health of the entire nation since if the existing standards were lower the national health would be under a threat [7]. Unreliable supplies from surface water due to vagaries of monsoon, increase in demand for domestic, agriculture and industrial purposes has increased the dependability on ground water, and has reached an all-time high in recent decades, thus resulting in over exploitation of the resources [8]. This has caused a rapid depletion in the groundwater quality, thus frequent sampling and testing of the water has become a necessity to keep a regular check on groundwater quality. Bureau of Indian Standards has prescribed the desirable and permissible limits for various water quality parameters to determine the potability of water from a specified source in BIS: 10500-1991.
Geographic Information System (GIS) is being used world widely almost every field. GIS has been widely used in developing countries to manage water resources [9]. Around 2000, the Open GIS Consortium (OGC, http://www.opengeospatial.org/) was formed under W3C [10]. Research has flourished over the decades from vendor dependent software to open source software where researchers are paying increasing attention to maximize the value of their data so that resources can be utilized more efficiently [11]. The study is carried out with open source software QGIS, which provides all the basic and necessary tools required, to create database and information system.
Rudrapur is an emerging and rapidly developing city of Uttarakhand having many industries running in State Infrastructure and Industrial Development Corporation of Uttarakhand limited (SIIDCUL). The city has nine overhead tanks in which water is supplied for distribution directly by groundwater pumping, and the rural area of the city named Khera, consists of government hand pumps out of which many are out of work. The city as a whole depends on groundwater for water supply, thus groundwater quality assessment is needed for the city to monitor the quality of water and to develop pollution control strategies. In this study an approach has been made
International Journal of Latest Trends in Engineering and Technology (IJLTET) ISSN: 2278-621X
787 Vol 7 issue 1 May 2016http://dx.doi.org/10.21172/1.71.113
for assessing water quality and determining the sources unfit or requiring some measures to avoid further deterioration for Rudrapur, a rapidly developing city in Udham Singh Nagar district, Uttarakhand.
2. STUDY AREA
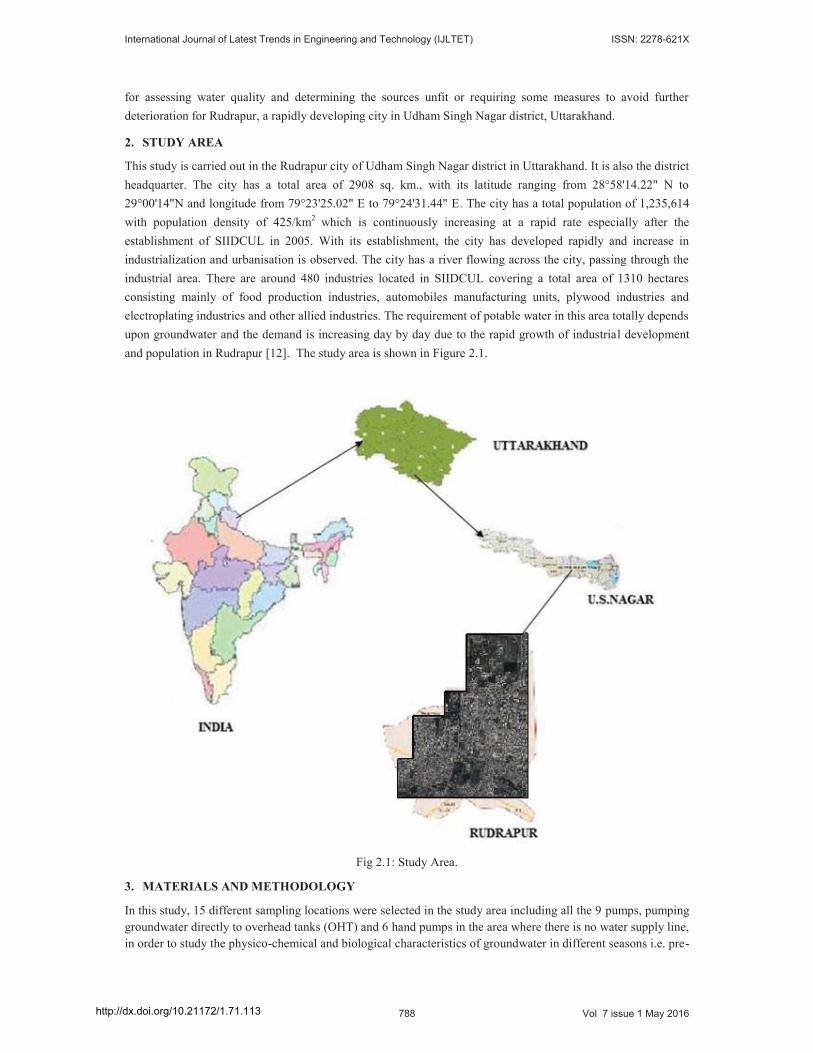
This study is carried out in the Rudrapur city of Udham Singh Nagar district in Uttarakhand. It is also the district headquarter. The city has a total area of 2908 sq. km., with its latitude ranging from 28°58'14.22" N to 29°00'14"N and longitude from 79°23'25.02" E to 79°24'31.44" E. The city has a total population of 1,235,614 with population density of 425/km2 which is continuously increasing at a rapid rate especially after the establishment of SIIDCUL in 2005. With its establishment, the city has developed rapidly and increase in industrialization and urbanisation is observed. The city has a river flowing across the city, passing through the industrial area. There are around 480 industries located in SIIDCUL covering a total area of 1310 hectares consisting mainly of food production industries, automobiles manufacturing units, plywood industries and electroplating industries and other allied industries. The requirement of potable water in this area totally depends upon groundwater and the demand is increasing day by day due to the rapid growth of industrial development and population in Rudrapur [12]. The study area is shown in Figure 2.1.
Fig 2.1: Study Area.
3. MATERIALS AND METHODOLOGY
In this study, 15 different sampling locations were selected in the study area including all the 9 pumps, pumping groundwater directly to overhead tanks (OHT) and 6 hand pumps in the area where there is no water supply line, in order to study the physico-chemical and biological characteristics of groundwater in different seasons i.e. pre-
International Journal of Latest Trends in Engineering and Technology (IJLTET) ISSN: 2278-621X
788 Vol 7 issue 1 May 2016http://dx.doi.org/10.21172/1.71.113
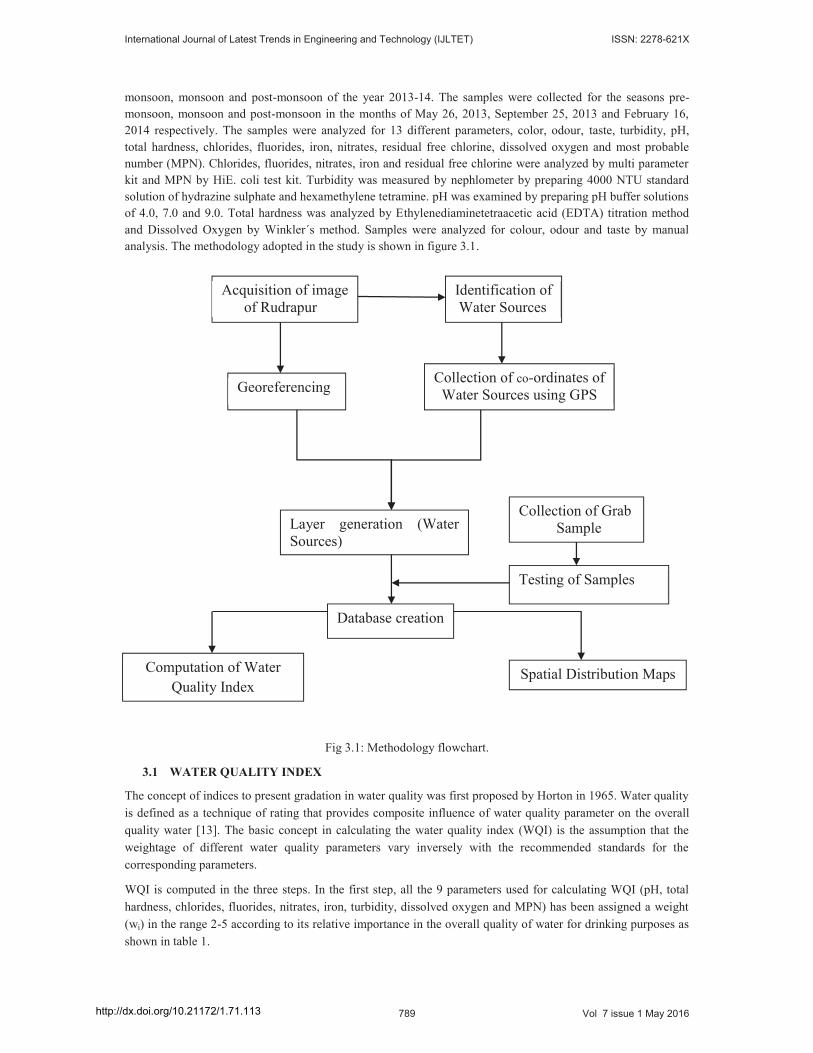
monsoon, monsoon and post-monsoon of the year 2013-14. The samples were collected for the seasons pre-monsoon, monsoon and post-monsoon in the months of May 26, 2013, September 25, 2013 and February 16, 2014 respectively. The samples were analyzed for 13 different parameters, color, odour, taste, turbidity, pH, total hardness, chlorides, fluorides, iron, nitrates, residual free chlorine, dissolved oxygen and most probable number (MPN). Chlorides, fluorides, nitrates, iron and residual free chlorine were analyzed by multi parameter kit and MPN by HiE. coli test kit. Turbidity was measured by nephlometer by preparing 4000 NTU standard solution of hydrazine sulphate and hexamethylene tetramine. pH was examined by preparing pH buffer solutions of 4.0, 7.0 and 9.0. Total hardness was analyzed by Ethylenediaminetetraacetic acid (EDTA) titration method and Dissolved Oxygen by Winkler´s method. Samples were analyzed for colour, odour and taste by manual analysis. The methodology adopted in the study is shown in figure 3.1.
Fig 3.1: Methodology flowchart.
3.1 WATER QUALITY INDEX
The concept of indices to present gradation in water quality was first proposed by Horton in 1965. Water quality is defined as a technique of rating that provides composite influence of water quality parameter on the overall quality water [13]. The basic concept in calculating the water quality index (WQI) is the assumption that the weightage of different water quality parameters vary inversely with the recommended standards for the corresponding parameters.
WQI is computed in the three steps. In the first step, all the 9 parameters used for calculating WQI (pH, total hardness, chlorides, fluorides, nitrates, iron, turbidity, dissolved oxygen and MPN) has been assigned a weight (wi) in the range 2-5 according to its relative importance in the overall quality of water for drinking purposes as shown in table 1.
Acquisition of imageof Rudrapur
Identification of Water Sources
Georeferencing Collection of co-ordinates of Water Sources using GPS
Layer generation (Water Sources)
Database creation
Collection of GrabSample
Testing of Samples
Spatial Distribution MapsComputation of Water Quality Index
International Journal of Latest Trends in Engineering and Technology (IJLTET) ISSN: 2278-621X
789 Vol 7 issue 1 May 2016http://dx.doi.org/10.21172/1.71.113
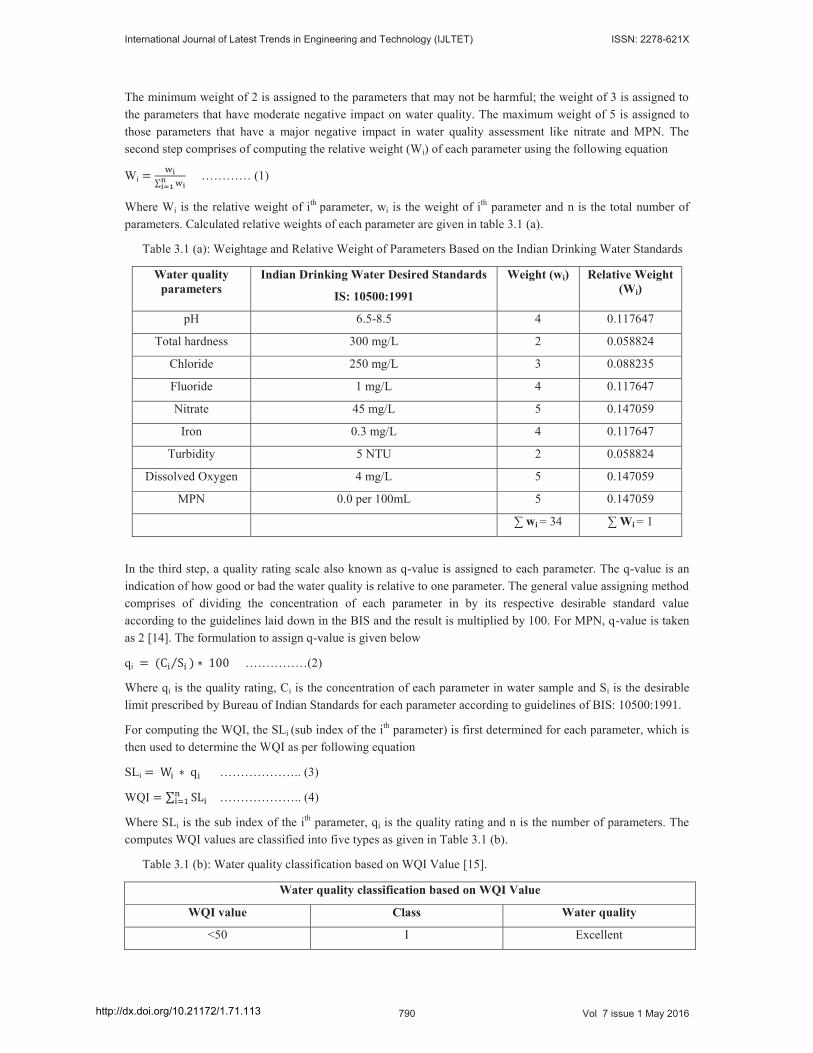
The minimum weight of 2 is assigned to the parameters that may not be harmful; the weight of 3 is assigned to the parameters that have moderate negative impact on water quality. The maximum weight of 5 is assigned to those parameters that have a major negative impact in water quality assessment like nitrate and MPN. The second step comprises of computing the relative weight (Wi) of each parameter using the following equation
Wi ………… (1)
Where Wi is the relative weight of ith parameter, wi is the weight of ith parameter and n is the total number of parameters. Calculated relative weights of each parameter are given in table 3.1 (a).
Table 3.1 (a): Weightage and Relative Weight of Parameters Based on the Indian Drinking Water Standards
Water quality parameters
Indian Drinking Water Desired Standards
IS: 10500:1991
Weight (wi) Relative Weight (Wi)
pH 6.5-8.5 4 0.117647
Total hardness 300 mg/L 2 0.058824
Chloride 250 mg/L 3 0.088235
Fluoride 1 mg/L 4 0.117647
Nitrate 45 mg/L 5 0.147059
Iron 0.3 mg/L 4 0.117647
Turbidity 5 NTU 2 0.058824
Dissolved Oxygen 4 mg/L 5 0.147059
MPN 0.0 per 100mL 5 0.147059
∑ wi = 34 ∑ Wi = 1
In the third step, a quality rating scale also known as q-value is assigned to each parameter. The q-value is an indication of how good or bad the water quality is relative to one parameter. The general value assigning method comprises of dividing the concentration of each parameter in by its respective desirable standard value according to the guidelines laid down in the BIS and the result is multiplied by 100. For MPN, q-value is taken as 2 [14]. The formulation to assign q-value is given below
qi ……………(2)
Where qi is the quality rating, Ci is the concentration of each parameter in water sample and Si is the desirable limit prescribed by Bureau of Indian Standards for each parameter according to guidelines of BIS: 10500:1991.
For computing the WQI, the SLi (sub index of the ith parameter) is first determined for each parameter, which is then used to determine the WQI as per following equation
SLi ……………….. (3)
WQI ……………….. (4)
Where SLi is the sub index of the ith parameter, qi is the quality rating and n is the number of parameters. The computes WQI values are classified into five types as given in Table 3.1 (b).
Table 3.1 (b): Water quality classification based on WQI Value [15].
Water quality classification based on WQI Value
WQI value Class Water quality
<50 I Excellent
International Journal of Latest Trends in Engineering and Technology (IJLTET) ISSN: 2278-621X
790 Vol 7 issue 1 May 2016http://dx.doi.org/10.21172/1.71.113
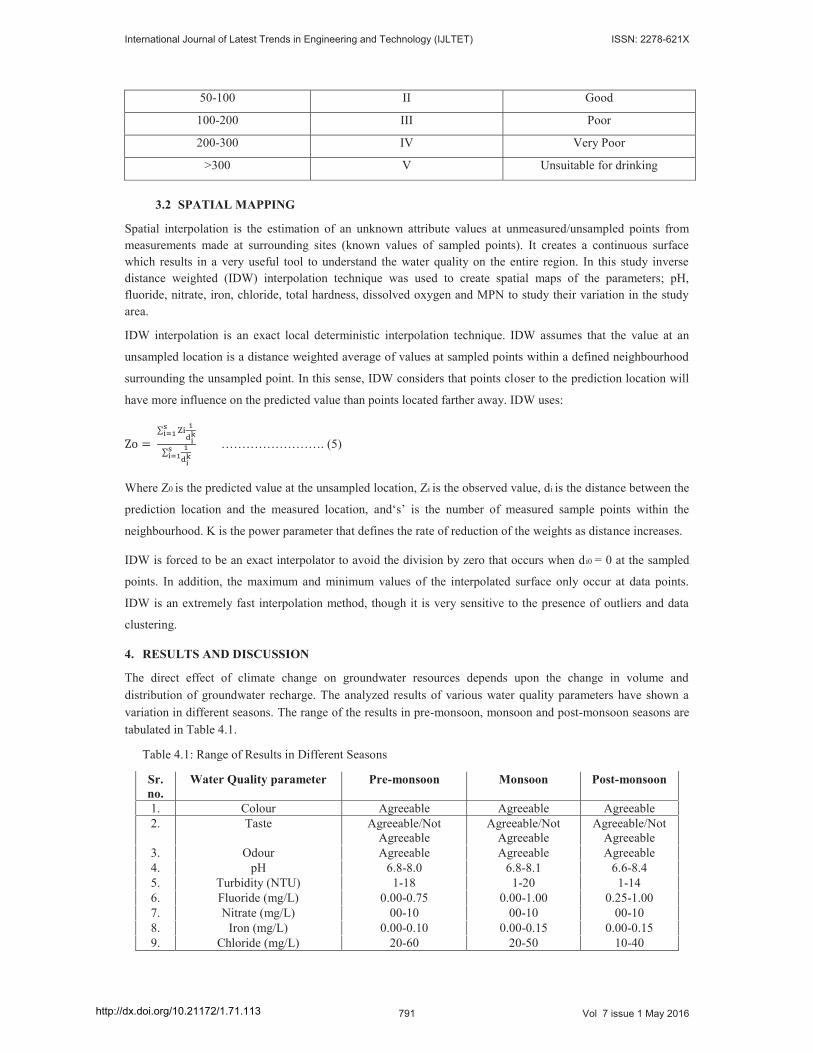
50-100 II Good
100-200 III Poor
200-300 IV Very Poor
>300 V Unsuitable for drinking
3.2 SPATIAL MAPPING
Spatial interpolation is the estimation of an unknown attribute values at unmeasured/unsampled points from measurements made at surrounding sites (known values of sampled points). It creates a continuous surface which results in a very useful tool to understand the water quality on the entire region. In this study inverse distance weighted (IDW) interpolation technique was used to create spatial maps of the parameters; pH, fluoride, nitrate, iron, chloride, total hardness, dissolved oxygen and MPN to study their variation in the study area.
IDW interpolation is an exact local deterministic interpolation technique. IDW assumes that the value at an
unsampled location is a distance weighted average of values at sampled points within a defined neighbourhood
surrounding the unsampled point. In this sense, IDW considers that points closer to the prediction location will
have more influence on the predicted value than points located farther away. IDW uses:
……………………. (5)
Where Z0 is the predicted value at the unsampled location, Zi is the observed value, di is the distance between the
prediction location and the measured location, and‘s’ is the number of measured sample points within the
neighbourhood. K is the power parameter that defines the rate of reduction of the weights as distance increases.
IDW is forced to be an exact interpolator to avoid the division by zero that occurs when di0 = 0 at the sampled
points. In addition, the maximum and minimum values of the interpolated surface only occur at data points.
IDW is an extremely fast interpolation method, though it is very sensitive to the presence of outliers and data
clustering.
4. RESULTS AND DISCUSSION
The direct effect of climate change on groundwater resources depends upon the change in volume and distribution of groundwater recharge. The analyzed results of various water quality parameters have shown a variation in different seasons. The range of the results in pre-monsoon, monsoon and post-monsoon seasons are tabulated in Table 4.1.
Table 4.1: Range of Results in Different Seasons
Sr. no.
Water Quality parameter Pre-monsoon Monsoon Post-monsoon
1. Colour Agreeable Agreeable Agreeable2. Taste Agreeable/Not
AgreeableAgreeable/Not
AgreeableAgreeable/Not
Agreeable3. Odour Agreeable Agreeable Agreeable4. pH 6.8-8.0 6.8-8.1 6.6-8.45. Turbidity (NTU) 1-18 1-20 1-146. Fluoride (mg/L) 0.00-0.75 0.00-1.00 0.25-1.007. Nitrate (mg/L) 00-10 00-10 00-108. Iron (mg/L) 0.00-0.10 0.00-0.15 0.00-0.159. Chloride (mg/L) 20-60 20-50 10-40
International Journal of Latest Trends in Engineering and Technology (IJLTET) ISSN: 2278-621X
791 Vol 7 issue 1 May 2016http://dx.doi.org/10.21172/1.71.113
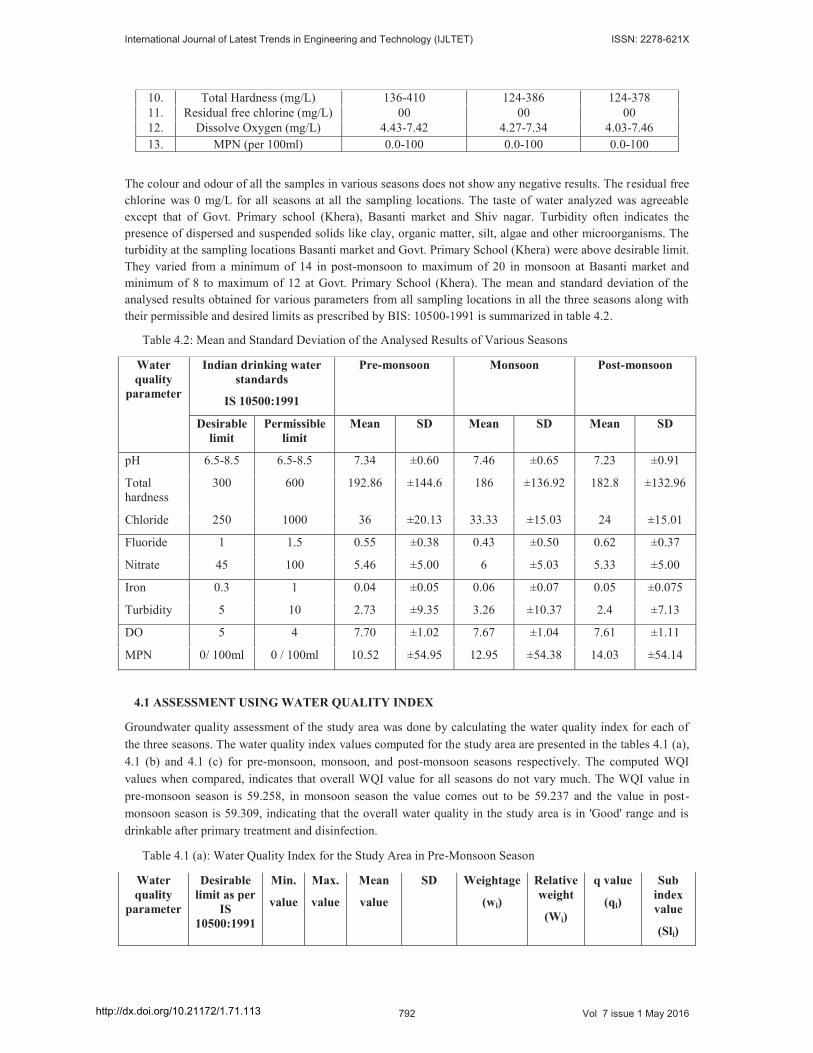
10. Total Hardness (mg/L) 136-410 124-386 124-37811. Residual free chlorine (mg/L) 00 00 0012. Dissolve Oxygen (mg/L) 4.43-7.42 4.27-7.34 4.03-7.4613. MPN (per 100ml) 0.0-100 0.0-100 0.0-100
The colour and odour of all the samples in various seasons does not show any negative results. The residual free chlorine was 0 mg/L for all seasons at all the sampling locations. The taste of water analyzed was agreeable except that of Govt. Primary school (Khera), Basanti market and Shiv nagar. Turbidity often indicates the presence of dispersed and suspended solids like clay, organic matter, silt, algae and other microorganisms. The turbidity at the sampling locations Basanti market and Govt. Primary School (Khera) were above desirable limit. They varied from a minimum of 14 in post-monsoon to maximum of 20 in monsoon at Basanti market and minimum of 8 to maximum of 12 at Govt. Primary School (Khera). The mean and standard deviation of the analysed results obtained for various parameters from all sampling locations in all the three seasons along with their permissible and desired limits as prescribed by BIS: 10500-1991 is summarized in table 4.2.
Table 4.2: Mean and Standard Deviation of the Analysed Results of Various Seasons
Water quality
parameter
Indian drinking water standards
IS 10500:1991
Pre-monsoon Monsoon Post-monsoon
Desirable limit
Permissible limit
Mean SD Mean SD Mean SD
pH 6.5-8.5 6.5-8.5 7.34 ±0.60 7.46 ±0.65 7.23 ±0.91
Total hardness
300 600 192.86 ±144.6 186 ±136.92 182.8 ±132.96
Chloride 250 1000 36 ±20.13 33.33 ±15.03 24 ±15.01
Fluoride 1 1.5 0.55 ±0.38 0.43 ±0.50 0.62 ±0.37
Nitrate 45 100 5.46 ±5.00 6 ±5.03 5.33 ±5.00
Iron 0.3 1 0.04 ±0.05 0.06 ±0.07 0.05 ±0.075
Turbidity 5 10 2.73 ±9.35 3.26 ±10.37 2.4 ±7.13
DO 5 4 7.70 ±1.02 7.67 ±1.04 7.61 ±1.11
MPN 0/ 100ml 0 / 100ml 10.52 ±54.95 12.95 ±54.38 14.03 ±54.14
4.1 ASSESSMENT USING WATER QUALITY INDEX
Groundwater quality assessment of the study area was done by calculating the water quality index for each of the three seasons. The water quality index values computed for the study area are presented in the tables 4.1 (a),4.1 (b) and 4.1 (c) for pre-monsoon, monsoon, and post-monsoon seasons respectively. The computed WQI values when compared, indicates that overall WQI value for all seasons do not vary much. The WQI value inpre-monsoon season is 59.258, in monsoon season the value comes out to be 59.237 and the value in post-monsoon season is 59.309, indicating that the overall water quality in the study area is in 'Good' range and is drinkable after primary treatment and disinfection.
Table 4.1 (a): Water Quality Index for the Study Area in Pre-Monsoon Season
Water quality
parameter
Desirable limit as per
IS 10500:1991
Min.
value
Max.
value
Mean
value
SD Weightage
(wi)
Relative weight
(Wi)
q value
(qi)
Subindex value
(Sli)
International Journal of Latest Trends in Engineering and Technology (IJLTET) ISSN: 2278-621X
792 Vol 7 issue 1 May 2016http://dx.doi.org/10.21172/1.71.113
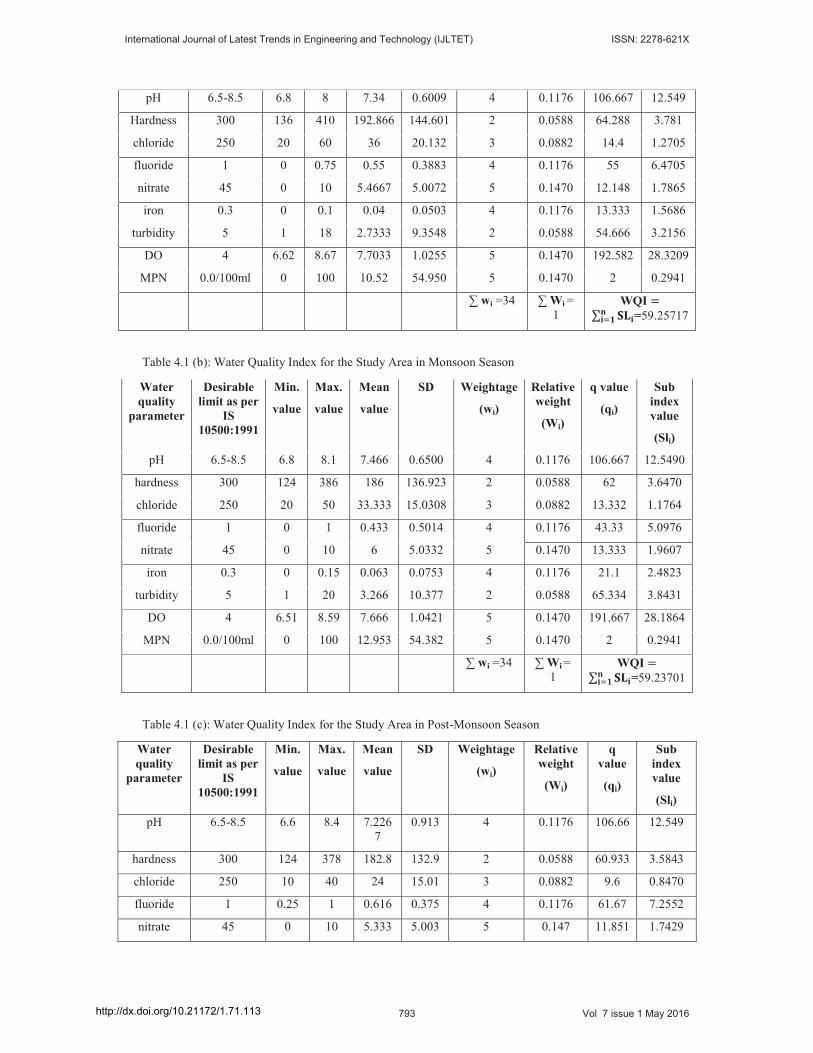
pH 6.5-8.5 6.8 8 7.34 0.6009 4 0.1176 106.667 12.549
Hardness 300 136 410 192.866 144.601 2 0.0588 64.288 3.781
chloride 250 20 60 36 20.132 3 0.0882 14.4 1.2705
fluoride 1 0 0.75 0.55 0.3883 4 0.1176 55 6.4705
nitrate 45 0 10 5.4667 5.0072 5 0.1470 12.148 1.7865
iron 0.3 0 0.1 0.04 0.0503 4 0.1176 13.333 1.5686
turbidity 5 1 18 2.7333 9.3548 2 0.0588 54.666 3.2156
DO 4 6.62 8.67 7.7033 1.0255 5 0.1470 192.582 28.3209
MPN 0.0/100ml 0 100 10.52 54.950 5 0.1470 2 0.2941
∑ wi =34 ∑ Wi =1
WQI =59.25717
Table 4.1 (b): Water Quality Index for the Study Area in Monsoon Season
Water quality
parameter
Desirable limit as per
IS 10500:1991
Min.
value
Max.
value
Mean
value
SD Weightage
(wi)
Relative weight
(Wi)
q value
(qi)
Subindex value
(Sli)
pH 6.5-8.5 6.8 8.1 7.466 0.6500 4 0.1176 106.667 12.5490
hardness 300 124 386 186 136.923 2 0.0588 62 3.6470
chloride 250 20 50 33.333 15.0308 3 0.0882 13.332 1.1764
fluoride 1 0 1 0.433 0.5014 4 0.1176 43.33 5.0976
nitrate 45 0 10 6 5.0332 5 0.1470 13.333 1.9607
iron 0.3 0 0.15 0.063 0.0753 4 0.1176 21.1 2.4823
turbidity 5 1 20 3.266 10.377 2 0.0588 65.334 3.8431
DO 4 6.51 8.59 7.666 1.0421 5 0.1470 191.667 28.1864
MPN 0.0/100ml 0 100 12.953 54.382 5 0.1470 2 0.2941
∑ wi =34 ∑ Wi =1
WQI =59.23701
Table 4.1 (c): Water Quality Index for the Study Area in Post-Monsoon Season
Water quality
parameter
Desirable limit as per
IS 10500:1991
Min.
value
Max.
value
Mean
value
SD Weightage
(wi)
Relative weight
(Wi)
qvalue
(qi)
Subindex value
(Sli)
pH 6.5-8.5 6.6 8.4 7.2267
0.913 4 0.1176 106.66 12.549
hardness 300 124 378 182.8 132.9 2 0.0588 60.933 3.5843
chloride 250 10 40 24 15.01 3 0.0882 9.6 0.8470
fluoride 1 0.25 1 0.616 0.375 4 0.1176 61.67 7.2552
nitrate 45 0 10 5.333 5.003 5 0.147 11.851 1.7429
International Journal of Latest Trends in Engineering and Technology (IJLTET) ISSN: 2278-621X
793 Vol 7 issue 1 May 2016http://dx.doi.org/10.21172/1.71.113
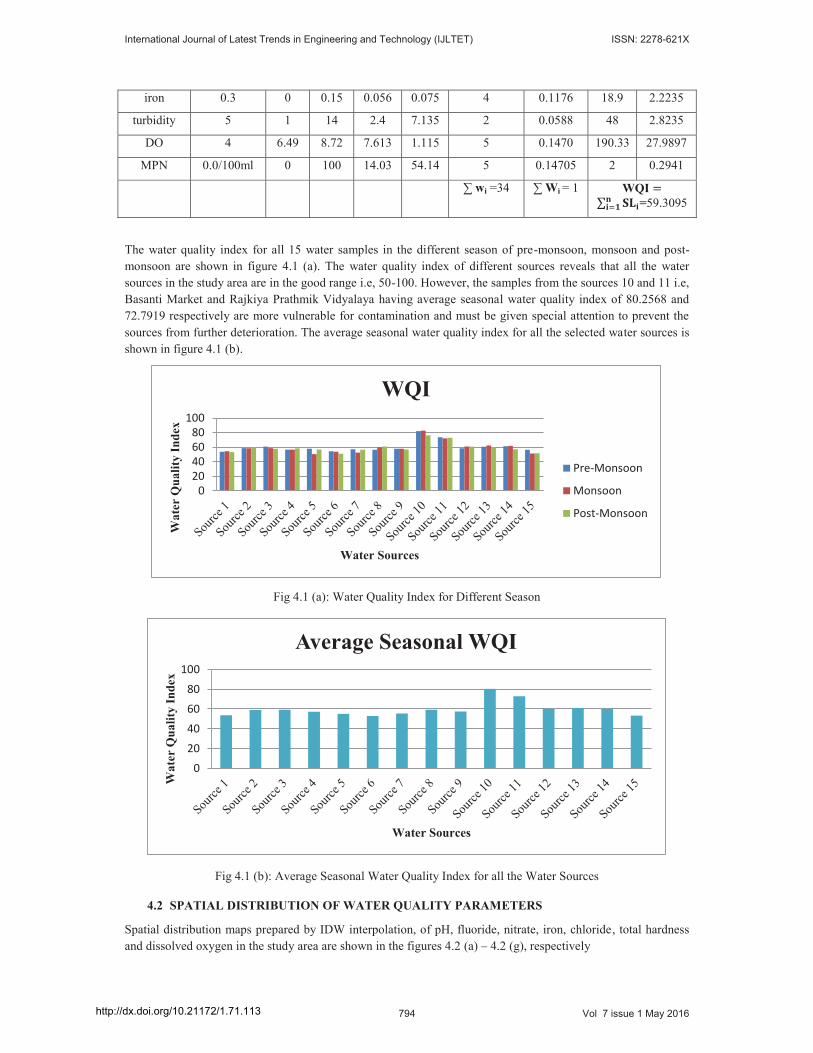
iron 0.3 0 0.15 0.056 0.075 4 0.1176 18.9 2.2235
turbidity 5 1 14 2.4 7.135 2 0.0588 48 2.8235
DO 4 6.49 8.72 7.613 1.115 5 0.1470 190.33 27.9897
MPN 0.0/100ml 0 100 14.03 54.14 5 0.14705 2 0.2941
∑ wi =34 ∑ Wi = 1 WQI =59.3095
The water quality index for all 15 water samples in the different season of pre-monsoon, monsoon and post-monsoon are shown in figure 4.1 (a). The water quality index of different sources reveals that all the water sources in the study area are in the good range i.e, 50-100. However, the samples from the sources 10 and 11 i.e, Basanti Market and Rajkiya Prathmik Vidyalaya having average seasonal water quality index of 80.2568 and 72.7919 respectively are more vulnerable for contamination and must be given special attention to prevent the sources from further deterioration. The average seasonal water quality index for all the selected water sources is shown in figure 4.1 (b).
Fig 4.1 (a): Water Quality Index for Different Season
Fig 4.1 (b): Average Seasonal Water Quality Index for all the Water Sources
4.2 SPATIAL DISTRIBUTION OF WATER QUALITY PARAMETERS
Spatial distribution maps prepared by IDW interpolation, of pH, fluoride, nitrate, iron, chloride, total hardness and dissolved oxygen in the study area are shown in the figures 4.2 (a) – 4.2 (g), respectively
020406080
100
Wat
er Q
ualit
y In
dex
Water Sources
WQI
Pre-Monsoon
Monsoon
Post-Monsoon
020406080
100
Wat
er Q
ualit
y In
dex
Water Sources
Average Seasonal WQI
International Journal of Latest Trends in Engineering and Technology (IJLTET) ISSN: 2278-621X
794 Vol 7 issue 1 May 2016http://dx.doi.org/10.21172/1.71.113
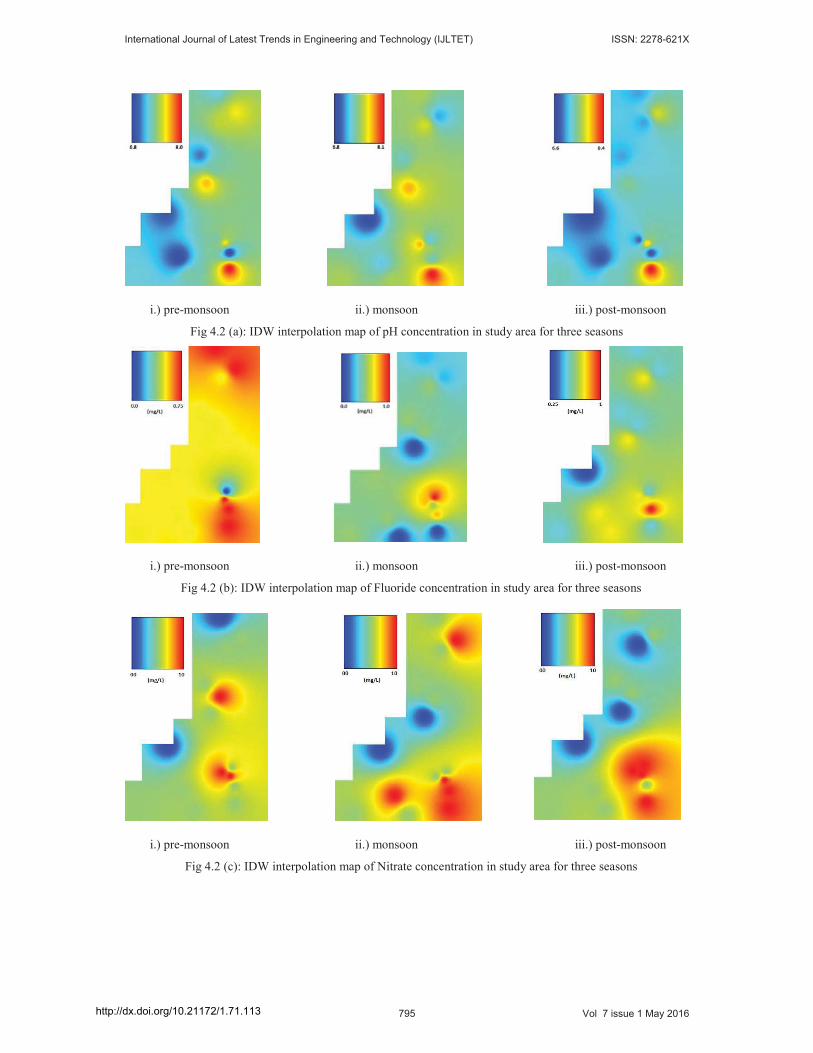
i.) pre-monsoon ii.) monsoon iii.) post-monsoon
Fig 4.2 (a): IDW interpolation map of pH concentration in study area for three seasons
i.) pre-monsoon ii.) monsoon iii.) post-monsoon
Fig 4.2 (b): IDW interpolation map of Fluoride concentration in study area for three seasons
i.) pre-monsoon ii.) monsoon iii.) post-monsoon
Fig 4.2 (c): IDW interpolation map of Nitrate concentration in study area for three seasons
International Journal of Latest Trends in Engineering and Technology (IJLTET) ISSN: 2278-621X
795 Vol 7 issue 1 May 2016http://dx.doi.org/10.21172/1.71.113
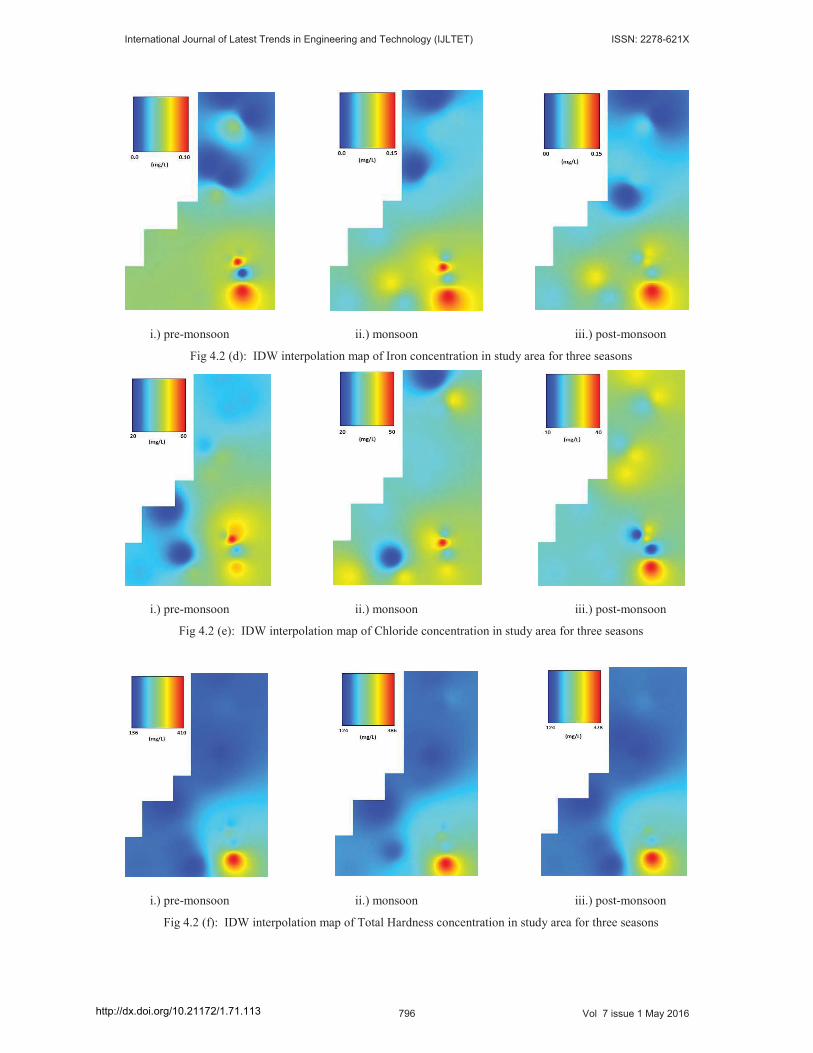
i.) pre-monsoon ii.) monsoon iii.) post-monsoon
Fig 4.2 (d): IDW interpolation map of Iron concentration in study area for three seasons
i.) pre-monsoon ii.) monsoon iii.) post-monsoon
Fig 4.2 (e): IDW interpolation map of Chloride concentration in study area for three seasons
i.) pre-monsoon ii.) monsoon iii.) post-monsoon
Fig 4.2 (f): IDW interpolation map of Total Hardness concentration in study area for three seasons
International Journal of Latest Trends in Engineering and Technology (IJLTET) ISSN: 2278-621X
796 Vol 7 issue 1 May 2016http://dx.doi.org/10.21172/1.71.113
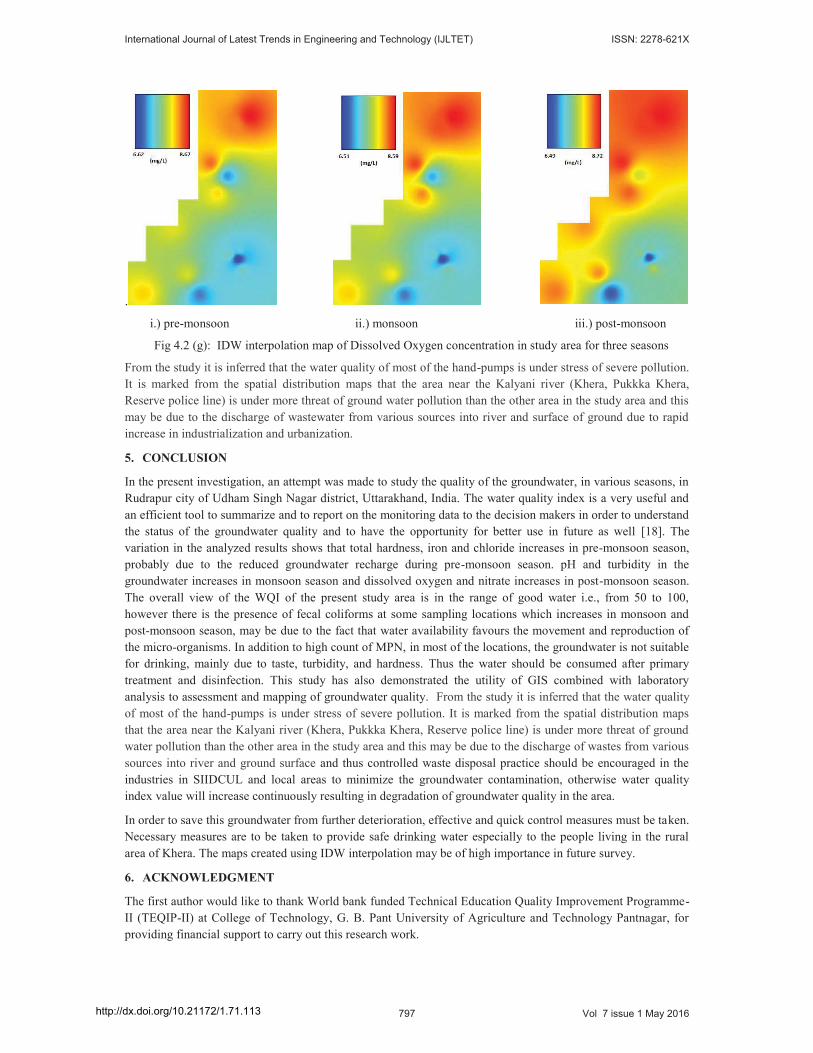
. i.) pre-monsoon ii.) monsoon iii.) post-monsoon
Fig 4.2 (g): IDW interpolation map of Dissolved Oxygen concentration in study area for three seasons
From the study it is inferred that the water quality of most of the hand-pumps is under stress of severe pollution. It is marked from the spatial distribution maps that the area near the Kalyani river (Khera, Pukkka Khera, Reserve police line) is under more threat of ground water pollution than the other area in the study area and this may be due to the discharge of wastewater from various sources into river and surface of ground due to rapid increase in industrialization and urbanization.
5. CONCLUSION
In the present investigation, an attempt was made to study the quality of the groundwater, in various seasons, in Rudrapur city of Udham Singh Nagar district, Uttarakhand, India. The water quality index is a very useful and an efficient tool to summarize and to report on the monitoring data to the decision makers in order to understand the status of the groundwater quality and to have the opportunity for better use in future as well [18]. The variation in the analyzed results shows that total hardness, iron and chloride increases in pre-monsoon season, probably due to the reduced groundwater recharge during pre-monsoon season. pH and turbidity in the groundwater increases in monsoon season and dissolved oxygen and nitrate increases in post-monsoon season. The overall view of the WQI of the present study area is in the range of good water i.e., from 50 to 100, however there is the presence of fecal coliforms at some sampling locations which increases in monsoon and post-monsoon season, may be due to the fact that water availability favours the movement and reproduction of the micro-organisms. In addition to high count of MPN, in most of the locations, the groundwater is not suitable for drinking, mainly due to taste, turbidity, and hardness. Thus the water should be consumed after primary treatment and disinfection. This study has also demonstrated the utility of GIS combined with laboratory analysis to assessment and mapping of groundwater quality. From the study it is inferred that the water quality of most of the hand-pumps is under stress of severe pollution. It is marked from the spatial distribution maps that the area near the Kalyani river (Khera, Pukkka Khera, Reserve police line) is under more threat of ground water pollution than the other area in the study area and this may be due to the discharge of wastes from various sources into river and ground surface and thus controlled waste disposal practice should be encouraged in the industries in SIIDCUL and local areas to minimize the groundwater contamination, otherwise water quality index value will increase continuously resulting in degradation of groundwater quality in the area.
In order to save this groundwater from further deterioration, effective and quick control measures must be taken. Necessary measures are to be taken to provide safe drinking water especially to the people living in the rural area of Khera. The maps created using IDW interpolation may be of high importance in future survey.
6. ACKNOWLEDGMENT
The first author would like to thank World bank funded Technical Education Quality Improvement Programme-II (TEQIP-II) at College of Technology, G. B. Pant University of Agriculture and Technology Pantnagar, for providing financial support to carry out this research work.
International Journal of Latest Trends in Engineering and Technology (IJLTET) ISSN: 2278-621X
797 Vol 7 issue 1 May 2016http://dx.doi.org/10.21172/1.71.113
REFERENCES
1. Paul Wyrwoll, (2012), India’s Groundwater Crisis, globalwaterforum.org, July 30, 2012. (last accessed on Mar.25, 2015)
2. Somini Sengupta (2006), In Teeming India, Water Crisis Means Dry Pipes and Foul Sludge, New York Times, September 29, 2006.
3. P.S. Datta (2005), Groundwater ethics for its sustainability, Current Science, 89 (2005), 812-817.4. Benerjee.T, and Srivastava R.K., (2010), Evaluation of environmental impacts of integrated
industrial estate-Pantnagar through application of air and water quality indices, Environmental monitoring and assessment, (DOI: 10.1007/s10661-010-1353-3).
5. Milovanovic. M., (2007), Water quality assessment and determination of pollution sources along the Axios/Vardar River Southeastern Europe. Desalination, 213, 159-173.
6. Ishaku J.M., (2011), Assessment of groundwater quality index for Jimeta-Yola area, Northeastern Nigeria, Journal of geology and mining research.3 (9), 219-231.
7. Essay on Water Quality and Environmental Health, http://samples.professay.com/essay-on-water-quality-and-environmental-health/ (last accessed on Mar.20, 2015)
8. T.Subramani, S.Krishnan and P.K. Kumaresan, (June 2010), Study of Groundwater Quality with GIS Application for Coonoor Taluk in Nilgiri District, International Journal of Modern Engineering Research, Vol.2, Issue.3, pp-586-592.
9. Luijten, J.C., Knapp, E.B., Sanz, S.I., Jones, J.W., (2003), A role for GIS-based simulation for empowering local stakeholders in water resources negotiations in developing countries: case studies for two rural hillside watersheds in Honduras and Colombia. Water Policy 5, 213-236.
10. Daoyi Chen et al., (2010), Assessment of open source GIS software for water resourcesmanagement in developing countries, Journal of Hydro-environment Research 4 (2010), 253-264.
11. Shekhar S., et al., (2001), WMS and GML based interoperable web mapping system, Proceedingsof the ninth ACM international symposium on Advances in geographic information systems,Atlanta, Georgia, USA, 2001, 106-111.
12. Suman Panwar and Srivastava R.K., (2012), Assessment of groundwater quality in contiguous ofintegrated industrial estate- Pantnagar, Uttarakhand, International Journal of EnvironmentalSciences, Vol.3, no.3,1130-1140.
13. Tiwari J.N. and Manzoor A.,(1988), Water quality index for Indian rivers, In: Ecology andpollution of Indian rivers,(R.K. Trivedy, Ed.), Aashish Publishing House, New Delhi, pp271-286.
14. Garima Srivastava and Dr. Pradeep Kumar, (2013), Water quality index with missing parameters,International Journal of Research in Engineering and Technology, vol. 2, issue 4, 609-614.
15. C.R. Ramakrishnaiah et al.,(2009), Assessment of water quality index for the groundwater inTumkur Taluk, Karnataka State, India, E-Journal of Chemistry, ISSN: 0973-4945, 6(2), 523-530.
16. Worboys and Duckham, (2004), GIS: A Computing Perspective, CRC Press, Second Edition.17. Robin Armit, Tom Carmichael,Quantum GIS (QGIS), School of Geosciences, Monash University18. S.M. Mazhar Nazeeb Khan and A. Ravi Kumar, (2013), Geogenic assessment of water quality
index for the groundwater in Tiruchengode taluk, Namkkal district, Tamil Nadu, India, ChemicalScience Transactions, 2(3), 1021-1027, (DOI:10.7598/cst2013.482).
International Journal of Latest Trends in Engineering and Technology (IJLTET) ISSN: 2278-621X
798 Vol 7 issue 1 May 2016http://dx.doi.org/10.21172/1.71.113