study of co-deposition photoelectrode of perylene
TRANSCRIPT
Article Electrochemistry, 86(5), 235–242 (2018)
Study of Co-deposition Photoelectrode of Perylene Derivativeand Phthalocyanine in Comparison with Its Bilayer Focusingon Charge Transfer Complex and Kinetic AnalysisMohd Fairus AHMAD,a,b Toshiyuki ABE,c Christopher S. A.MUSGRAVE,a andKeiji NAGAIa,*a Laboratory for Chemistry and Life Science, Institute of Innovative Research, Tokyo Institute of Technology,R1-26, Suzukake-dai, Midori-ku, Yokohama 226-8503, Kanagawa, Japan
b School of Microelectronic Engineering, Kampus Pauh, Universiti Malaysia Perlis, 02600, Arau, Perlis, Malaysiac Department of Frontier Materials Chemistry, Graduate School of Science and Technology, Hirosaki University,3 Bunkyo-cho, Hirosaki 036-8561, Japan
*Corresponding author: [email protected]
ABSTRACTThe characteristics for 3,4,9,10-perylenetetracarboxylic-bisbenzimidazole (PTCBI, an n-type semiconductor) and29H,31H-phthalocyanine (H2Pc, a p-type semiconductor) as organic p/n bilayer and bulk heterojunction (BHJ)photoelectrodes were studied for the photooxidation of thiol. Based on the analysis in their absorption spectra, anew absorption band in the longer wavelength (λ > 800nm) for both bilayer and co-deposited photoelectrodesuggested a formation of charge transfer complex. A photoanodic current was observed at λ ~ 880nm for the bothbilayer and co-deposited electrodes, while no absorption and photocurrent for single layers of PTCBI and H2Pc.By assuming the Langmuir adsorption equilibrium at the solid/water interface, the kinetic parameters for thephotoanodic current of thiol was analyzed for the longer wavelength of irradiation (λ ~ 900nm), and it wasindicated that the rate of oxidation in the co-deposited was higher than that of the bilayer due efficient chargeseparation in the charge transfer complex.
© The Electrochemical Society of Japan, All rights reserved.
Keywords : Organic Semiconductor, Heterojunction, Visible and Near Infrared Photocatalyst, Charge TransferComplex
1. Introduction
High efficiency is required for the solar energy conversiondevices to utilize full spectrum of solar light and quantum yield.Organic semiconductor (OSM) has interesting features such as widespectrum of light absorption, low cost, simple fabrication process,and light weight. Stable organic semiconductor composed of p/njunction responsive to whole visible light was operated and utilizednot only for photovoltaic (OPV),1–10 but also photocatalyst.11–20
For the design of efficient OSM photocatalyst, material selectionfor p-type and n-type is different from photovoltaic devices. In thecase of photocatalyst, p-type is oxidation part and phthalocyanine(Pc) exhibited as a co-catalyst site. It means conventional organicp-type semiconductor in photovoltaics typically has a role of lightabsorber such as P3HT which does not work as photocatalyst.11
Then, n-type also required light absorption with much widerspectrum in OSM photocatalyst. In the sense, fullerene and PCBMare not good choice because of absorption only in the shorterwavelength region. Then, to construct an efficient photocatalyst,phthalocyanine and 3,4,9,10-perylenetetracarboxylic bisbenzimida-zole (PTCBI) would be good candidate.
The combination was the first example of p/n junction organicphotovoltaics1 and has studied in terms of derivative change,6–8
mechanism study,8,9 bulk heterojunction study21,22 etc. The bulkheterojunction is effective for the combination also.22 For the case ofthe combination of phthalocyanine and PTCBI, bulk heterojunction(BHJ) structure was synthesized by co-deposition technique andexhibited an efficient charge separation due to the large area ofdonor-acceptor interface especially with the small light intensity.21–23
Unless the photovoltaics, in the past studies of p/n OSMphotocatalyst, photoinduced charge separation was the rate deter-
mining step for only a high concentration of the substance of thereaction, while the electron transfer at solid/water interface was thatfor the low concentration.24–27 Then the charge transfer complexformation is interesting not only for light absorption spectrum, butalso kinetics of charge separation-recombination balance to correctredox process in photocatalyst. This paper focusses two aspects oflight absorption and kinetics from the viewpoint of p/n interface incomparison of co-deposited sample and bilayer sample. Further-more, donor/acceptor OSM interface can imply charge transfercomplex of which interesting interaction happens between donorand acceptor28,29 and can enhance the absorption of the systemespecially in the longer wavelength reaching to near infrared.30–32
It will be great merits to utilize natural sun light efficiently. Since thebulk heterojunction photocatalyst is less studied than the bilayer p/njunction photocatalyst, then, it would be important to compare theircontribution of charge transfer complex towards the photocurrentgeneration and to compare their kinetic parameters of photocatalysisat solid/water interface.
In this paper, we investigate the absorption and photocurrent forthe photoelectrochemical thiol oxidation for the bilayer and co-deposited layer electrodes composed of metal-free Pc (H2Pc) andPTCBI having electrode-electrolyte interface. From the absorptionand photocurrent, the charge transfer complex and the kinetics ofthe photooxidation of thiol were discussed for both systems.
2. Experimental Condition
2.1 MaterialsITO glasses (sheet resistance = 10³/cm2; transmittance > 85%;
ITO thickness = 174 nm; Asahi Glass Co., Ltd.) were cut into2 cm © 1 cm size and cleaned using ultrasonication with acetone and
Electrochemistry Received: December 28, 2017Accepted: April 24, 2018
Published online: June 1, 2018
The Electrochemical Society of Japan https://doi.org/10.5796/electrochemistry.18-00001
235

ethanol subsequently. PTCBI was synthesized33 and purified bysublimation process. H2Pc (Tokyo Chemical Industry Co., Ltd.)is commercially available and purified by sublimation prior to use.The sublimation of each PTCBI and H2Pc was done in the tubularfurnace (ATF350-AST3), custom made by Alpha Giken Co. 2-mercaptoethanol (Tokyo Chemical Industry Co., Ltd.) is commer-cially available and used as received.
2.2 Preparation of bilayer PTCBI/H2Pc film (ITO/PTCBI/H2Pc)The photoelectrode device of ITO/PTCBI/H2Pc was prepared
by vapor deposition based on the method in previous literature.34
PTCBI of 28 nm thickness was first coated (deposition speed,0.12 nm s¹1) on ITO. Subsequently, H2Pc of 41 nm thickness wascoated (deposition speed, 0.06 nm s¹1) on top of the PTCBI.
2.3 Preparation of bulk heterojunction PTCBI:H2Pc film (ITO/PTCBI:H2Pc-A)
The BHJ was prepared by vapor deposition system equipped withmulti heater, then the simultaneous coating of two materials waspossible. Firstly, the ITO substrate was block during pre-depositionin the vacuum chamber, while the vapor deposition rates for PTCBI(0.13 nm s¹1) and H2Pc (0.05 nm s¹1) were controlled one by one.After that, the ITO substrate was unblocked, so that the BHJ filmwas fabricated for about 409 s of deposition time.
2.4 Characterization by AFM and FESEMThe topography was measured in ambient condition with an
Asylum Cypher S atomic force microscopy (AFM). The non-contactmode cantilevers (OCML-AC240TM, Olympus) were used withtypical resonant frequency and spring constant about 70 kHz and2N/m respectively. For FE-SEM observation of ITO/PTCBI:H2Pc-A sample on cross section, the sample was cleaved, and the crosssection was coated by sputtering Pt for 10mA, 30 s by ion sputtercoater (MC 1000, Hitachi). The cross-sectional image was obtainedby high resolution scanning electron microscope (S-5500, Hitachi).
2.5 Electrochemistry measurementThe electrochemistry measurement was conducted in the cell that
composed of the deposited electrode as working electrode. Theworking electrode was contacted with wire and DOTITE to ITOarea and fastened by epoxy resin. The counter electrode and thereference electrode was Pt and Ag/AgCl respectively. The electro-lyte was 2-mercaptoethanol (in KOH, pH 11) was stirred during themeasurement. Halogen light source (Megalight 100, SCHOTT) wasused to irradiate white light, at intensity of 70mW/cm2. Its spectrumis shown elsewhere.14 Monochromator (SM-GTD, BUNKOUKEIKICo., Ltd.) was used for the action spectrum photocurrent measure-ment, with controlled photon number = 1 © 1016 photons cm¹2 s¹1.
3. Results and Discussion
3.1 Characterization by AFM and FESEMAtomic force microscopy (AFM) was used to measure the
surface’s topography of monolayer PTCBI and H2Pc, the bilayerITO/PTCBI/H2Pc and the co-deposited ITO/PTCBI:H2Pc-A. Asshown in Figs. 1a and b, the surface roughness of monolayer PTCBIwas about 10 nm, while it was 20 nm for monolayer H2Pc. Thecrystal size for each of them was about 200 nm. For the bilayer ITO/PTCBI/H2Pc (Fig. 1c), the high-resolution scan (4 nm resolutionscan) showed that the surface roughness and the crystal size wereabout 8 nm and 50 nm for lateral direction, respectively. For the co-deposited ITO/PTCBI:H2Pc-A (Fig. 1d), by estimating from a 4 nmresolution scan, the particles size was not clearly observed and theroughness was <8 nm level. It was much smaller than that the casesof monolayer and the phase separation between the PTCBI and H2Pcwas not clearly observed in the image. The tendency is similar to the
previous case of PTCBI and copper phthalocyanine (CuPc),22 and itwas simulated as single nanometer phase separation. The smooth-ness in the co-deposited ITO/PTCBI:H2Pc-A suggest the formationof bulk heterojunction structure.
To characterize more about the morphology of co-depositedITO/PTCBI:H2Pc-A sample, the sample was cleaved, and the crosssection was observed by FE-SEM (Fig. 1e). The thickness oforganic layer was ca. 80 nm on the 150 nm thickness of ITO layer.The surface roughness was ca. 5 nm, which is almost similar to thatof the AFM topography measurement (Fig. 1d). The crystal size was<20 nm, suggesting the phase separation between PTCBI and H2Pcoccurred within the co-deposited layer. The phase separation wasnot clearly observed in the case of topography image (Fig. 1d),suggesting that the large particles (20 nm) are covered with the smallparticles (<20 nm) and thus correspond to the smoothness of thesurface.
3.2 Visible light absorption3.2.1 Comparison between monolayer and bilayer
Figure 2(a) shows the absorption spectrum for monolayers ofPTCBI (AbsPTCBI), H2Pc (AbsH2Pc), and bilayer of PTCBI/H2Pc(Absbilayer). The monolayer PTCBI (purple solid line) showed broadin the visible region and has a peak at K = 540 nm, and a shoulderreaching to infra-red region is lying at K µ 800 nm. The monolayerH2Pc (blue solid line) has a peak in the visible region at K µ 620 nm.Both of them are identical to the previous reports35 and using theirabsorbance-thickness coefficient value (PTCBI: 3.2 © 10¹3 nm¹1 at
a
b
c
d
ei: Organic layer (~80 nm)
ii: ITO (~150 nm)iii: Glass
i
ii
iii
Figure 1. Topography images for monolayer PTCBI (a), mono-layer H2Pc (b), bilayer ITO/PTCBI/H2Pc (c) and co-deposited ITO/PTCBI:H2Pc-A (d). The space resolution of the scan is 19 nm for(a), 8 nm for (b) while 4 nm for (c, d). (e) FE-SEM image of crosssectional view of co-deposited electrode.
Electrochemistry, 86(5), 235–242 (2018)
236

K = 540 nm, H2Pc: 11 © 10¹3 nm¹1 at K = 630 nm), the thicknessvalues were estimated to be 28 nm for PTCBI and 41 nm for H2Pcrespectively. The bilayer PTCBI/H2Pc (Fig. 2a, solid green line)looks like the sum of absorption of monolayers. By the least squarefitting as equation below,
Absfitting ¼ t1AbsPTCBI þ t2AbsH2Pc ð1Þ
the thickness of each monolayer was estimated to be 24 nm forPTCBI and 48 nm for H2Pc, respectively and the spectrum is shownas dashed black line of Fig. 2a. It is noticed that there is a differencein near infra-red region between the fitting spectrum and bilayerspectrum. The difference of spectrums (¦Abs) was estimated by thefollowing equation,
�Abs ¼ AbsBilayer or co-deposited � Absfitting ð2ÞThe ¦Abs spectrum is shown in the Fig. 2a by the green shadedarea. The threshold for longer wavelength region was at K µ 700 nmand continues to near infra-red. This broad absorption could beindication for charge transfer complex formation.
There have been defined that charge transfer complex has aninteraction between donor and acceptor molecules when a partialof electronic charge is transferred from the donor to the acceptormoiety.29 Generally, charge transfer complex has binding energycorrelated with the energy difference between highest occupiedmolecular orbital (HOMO) of the donor and the lowest unoccupiedmolecular orbital (LUMO) of the acceptor. The difference betweenthe HOMO of H2Pc (donor) and LUMO of PTCBI (acceptor) is>0.6 eV, which resembles K < 2060 nm.3.2.2 Comparison between monolayer and bulk heterojunction
Figure 2b shows the absorption spectrum for co-depositedPTCBI:H2Pc-A (Absco-deposited). Here again, we tried least squarefitting again by using Eq. (1) for the co-deposited layer as shown ondashed black line in Fig. 2b. The difference between the fitted valueand original data was estimated by the Eq. (2), and shown as greenshaded area in Fig. 2b. It has broad absorption at K > 760 nm andsuggesting charge transfer complex formation due to the samereason as described before. From the fitting, the thickness values forPTCBI and H2Pc were 82 nm and 20 nm, respectively and thesummation of them gives total thickness of 102 nm, which is >20%thicker than that observed by FE-SEM, 80 nm (Fig. 1e). One of thepossible reason is the co-deposited layer has high density of PTCBIand H2Pc molecules, but looks too high (>20%). Another possiblereason is related to molecular orientation, in which the co-depositedlayer might have random orientation (i.e. not planar orientation) andhence it had a high light absorbance.3.2.3 Comparison between bilayer and bulk heterojunction
Both bilayer PTCBI/H2Pc and co-deposited PTCBI:H2Pc-Aexhibited small absorption bands that are not shown in either ofmonolayer component. The ¦Abs spectra for both samples weresummarized into Fig. 2c (solid lines). As shown in the Fig. 2c (¦Abs,K > 800 nm), both bilayer PTCBI/H2Pc and co-deposited PTCBI:H2Pc-A had similar positive value of ¦Abs at the longer wavelength.
3.3 I-V measurement and rest potential measurementFigure 3 shows the cyclic voltammogram for the oxidation of
2-mercaptoethanol with ITO/PTCBI/H2Pc (Fig. 3a) and ITO/PTCBI:H2Pc-A (Fig. 3b) electrodes under the dark and halogenlight irradiation. At +0.2V vs. Ag/AgCl, the photoanodic currentdensity of ITO/PTCBI/H2Pc (Fig. 3a, red), and ITO/PTCBI:H2Pc-A (Fig. 3b, red) was 90 and 45 µA/cm2 respectively. Both electrodehas similar photoanodic threshold voltage at ¹0.15V vs. Ag/AgCl.
Table 1 shows the rest potential (open circuit potential) of thesingle layer electrodes, bilayer electrode and the co-depositedelectrode for the measurement under the dark (VR-dark) andillumination (VR-light) condition. The rest potential values wereidentical to those of the previous paper; i.e., Monolayer ITO/PTCBIand ITO/H2Pc have been exhibited typical p-type and n-typeSchottky junction with electrolyte; i.e. photocathode and photo-anode, respectively.14 The bilayer ITO/PTCBI/H2Pc had similarpolarity to ITO/PTCBI, and its tendency was the same as reportedearlier. The co-deposited ITO/PTCBI:H2Pc-A also had similarpolarity to ITO/PTCBI and implies possibility for the existence ofPTCBI/water interface.
b
a
c
Figure 2. (a, b) Absorption spectrum (green solid line) and ¦Abs(shaded green area) for (a) PTCBI/H2Pc and (b) PTCBI:H2Pc-A.Absorption spectrum of monolayers PTCBI and H2Pc are shown in(a) by the solid purple line and solid blue line, respectively. The leastsquare fitting is shown in by the black dashed line. The thicknessvalues for fiting the bilayer PTCBI/H2Pc gives PTCBI = 24 nm,H2Pc = 48 nm, while for fitting the co-deposited PTCBI:H2Pc-Agives PTCBI = 82 nm, H2Pc = 19 nm. The summary of absorbancespectrum (green solid line) and ¦Abs (shaded green area) for bothelectrodes in (a) and (b) is shown in (c).
Electrochemistry, 86(5), 235–242 (2018)
237

3.4 Action spectrum photocurrent in for constant thiolconcentration
To investigate the origin of the photocurrent, its action spectrumwas obtained with the thiol concentration = 10mmol dm¹3.Figure 4(a) are for the bilayer ITO/PTCBI/H2Pc for the irradiationfrom the ITO side. For the irradiation from the ITO side, thephotocurrent density was corresponded to the absorption spectrum,
and it peaked at the irradiation of K = 540 nm. It shows thatphotocurrent for the fabricated bilayer was efficient at the highabsorbance in PTCBI. By comparing data in Figs. S1a and b of theSupporting Information (SI), the photocurrent density was almostcorresponded to the absorption spectrum, where the photocurrentdensity was highest at the irradiation of K = 540 nm instead of atK = 590 nm.
The difference above is a typical phenomenon, ascribed as filtereffect by H2Pc layer in the ITO/PTCBI/H2Pc electrode, previ-ously.27,36,37 In those studies, the filter effect was occurred at theirradiation from the H2Pc side, where the action spectrum was goodagreement with the transmittance spectrum of H2Pc. The interpre-tation was that the exciton in H2Pc was quenched by electrolyte,while photovoltaic system of the bilayer exhibited the contributionof H2Pc absorption due to the absence of electrolyte.
Figure 4(b) show the photocurrent density of the ITO/PTCBI:H2Pc-A. As shown in Figs. S1c and d, the trend of theaction spectrum for both irradiation sides was corresponded to theabsorption spectrum of ITO/PTCBI:H2Pc-A. The similarity not todepend on the illumination side suggests small exposure of H2Pc toelectrolyte due to BHJ structure.
The internal quantum efficiency (IQE) was calculated by thefollowing equation (Eq. (3)) below
IQE ð%Þ ¼ f½J=e�=½photon flux ð1� 10�AbsÞ�g � 100 ð3Þwhere J (A/cm2) is the photocurrent density, and e (C) is theelementary charge. The peak shift from the current density forbilayer is due to the filter effect as described before, while the shiftdid not happen for co-deposited electrode. The IQE (%) values forthe co-deposited electrode in entire wavelength were smaller thanthat of the case of bilayer ITO/PTCBI/H2Pc, suggesting a relationto higher recombination event than that of the bilayer PTCBI/H2Pc,maybe due to high charge separation efficiency of BHJ. The possibleprocesses are summarized in Table 2 and the recombination processwhose rate is as below (Eq. (4))
R ¼ qð®e þ ®hÞ¾
ðnpÞ ð4Þ
where n, p are the density of photogenerated electron (in conductionband) and hole (in valence band), ®e, ®h are the electron and holemobilities, and ¾ is dielectric permittivity. Because there are morep/n junctions area in the BHJ than that for bilayer, then more chargeseparation and non-geminate recombination is expected. Moreover,the geminate recombination for exciton could also occur due to thelarger particle size (Fig. 1e, ³12–20 nm) than the exciton diffusionlength for PTCBI (3–5 nm) and H2Pc (7–12 nm).38
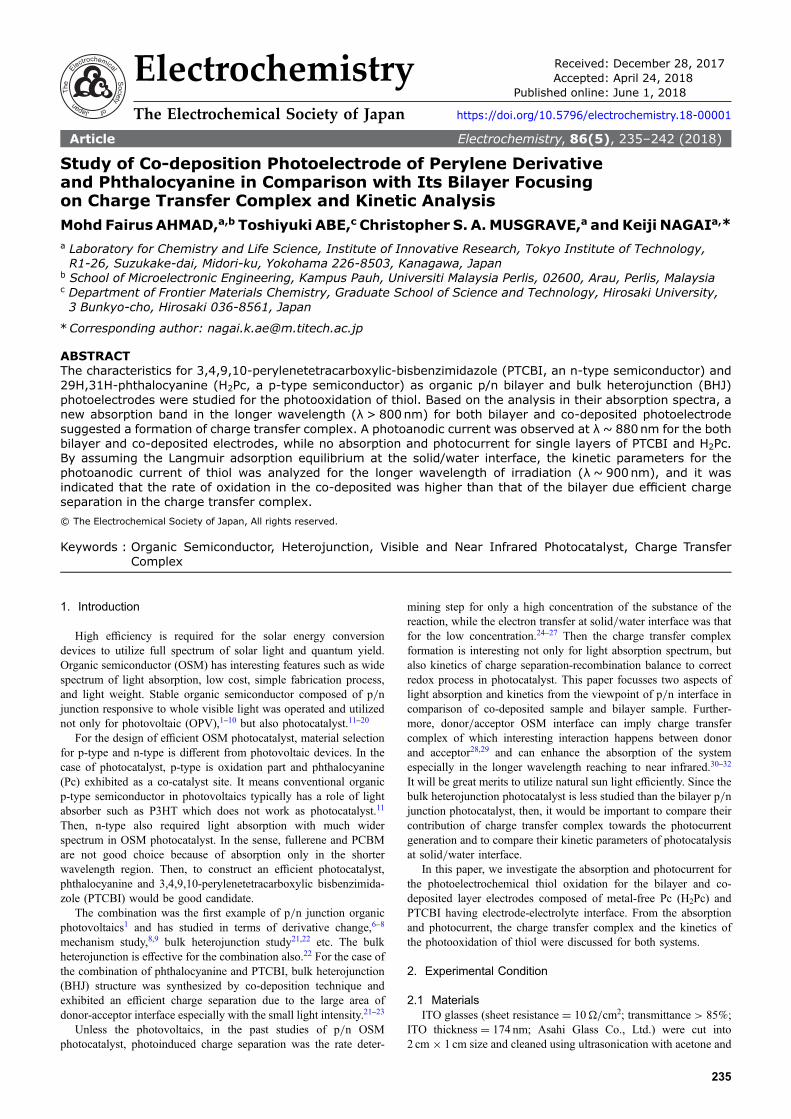
The contribution of charge transfer complex towards thegeneration of photocurrent can be investigated in the actionspectrum data at the longer wavelength, K > 800 nm by comparingthe action spectrum for monolayer electrode with that of the bilayerand co-deposited electrodes. The experiment for action spectrum ofphotocurrent density in monolayer electrode ITO/PTCBI (50 nm)and ITO/H2Pc (50 nm) was conducted, as shown in Fig. 5a. Thephotocurrent value for monolayer electrode ITO/PTCBI (50 nm)was <0.4 µA/cm2 and showed threshold for photocurrent atK µ 860 nm, while almost no photocurrent for ITO/H2Pc (50 nm)for K > 800 nm.
As shown in Fig. 5(b) the photocurrent was exhibited in ITO/PTCBI/H2Pc at K > 800 nm and was in agreement with their ¦Absspectrum. The photocurrent generation was exhibited at K > 860 nm,demonstrated that much longer wavelength can generate photo-current than that of the monolayer electrodes even though thePTCBI thickness in the bilayer was about half than that in the caseof monolayer ITO/PTCBI electrode. This shows that the generationof photocurrent at K > 860 nm for the bilayer did not depend on thePTCBI thickness. As shown in Fig. 5(c), photocurrent density was
a
b
Figure 3. CV for the ITO/PTCBI/H2Pc (a) and ITO/PTCBI:H2Pc-A (b) electrodes under the dark (black) and illumination (red)conditions. The electrochemical cell was consisted of referenceelectrode: Ag/AgCl, counter electrode: Pt and electrolyte:10mmol dm¹3 of 2-mercaptoethanol in KOH (pH 11). Theirradiation condition: halogen light, 70mW/cm2; irradiation side,ITO. Scan rate: 20mV/cm2.
Table 1. Rest potential (VR) for bilayer and co-deposited electro-des under dark (VR-dark) and under illumination (VR-light).
ITO/(layer)VR-dark
(V)VR-light
(V)VR-light ¹ VR-dark
(V)
PTCBI (50 nm) ¹0.14 ¹0.22 ¹0.08
H2Pc (50 nm) ¹0.17 +0.23 +0.40
PTCBI (28 nm)/H2Pc (41 nm) ¹0.19 ¹0.22 ¹0.03
PTCBI:H2Pc-A (72 nm) ¹0.16 ¹0.19 ¹0.04
Electrochemical cell was consisted of reference electrode: Ag/AgCl, counter electrode: Pt and electrolyte: 10mmol dm¹3 of2-mercaptoethanol in KOH (pH 11). The irradiation condition:halogen light, 70mW/cm2; irradiation side, ITO. Error in thevoltage fluctuation: «0.001V.
Electrochemistry, 86(5), 235–242 (2018)
238

also exhibited in ITO/PTCBI:H2Pc-A at K > 860 nm. The thresholdfor the photocurrent generation in the co-deposited electrode was atK = 980 nm, while in the bilayer was at K = 940 nm. The generationof photocurrent in ITO/PTCBI/H2Pc and ITO/PTCBI:H2Pc-Awould be originated from the light absorption by the charge transfercomplex at K > 800 nm region. The more photocurrent at K >940 nm for the co-deposited one than that for bilayer also agreeswith charge transfer complex contribution because co-depositedelectrode has more H2Pc/PTCBI interface.
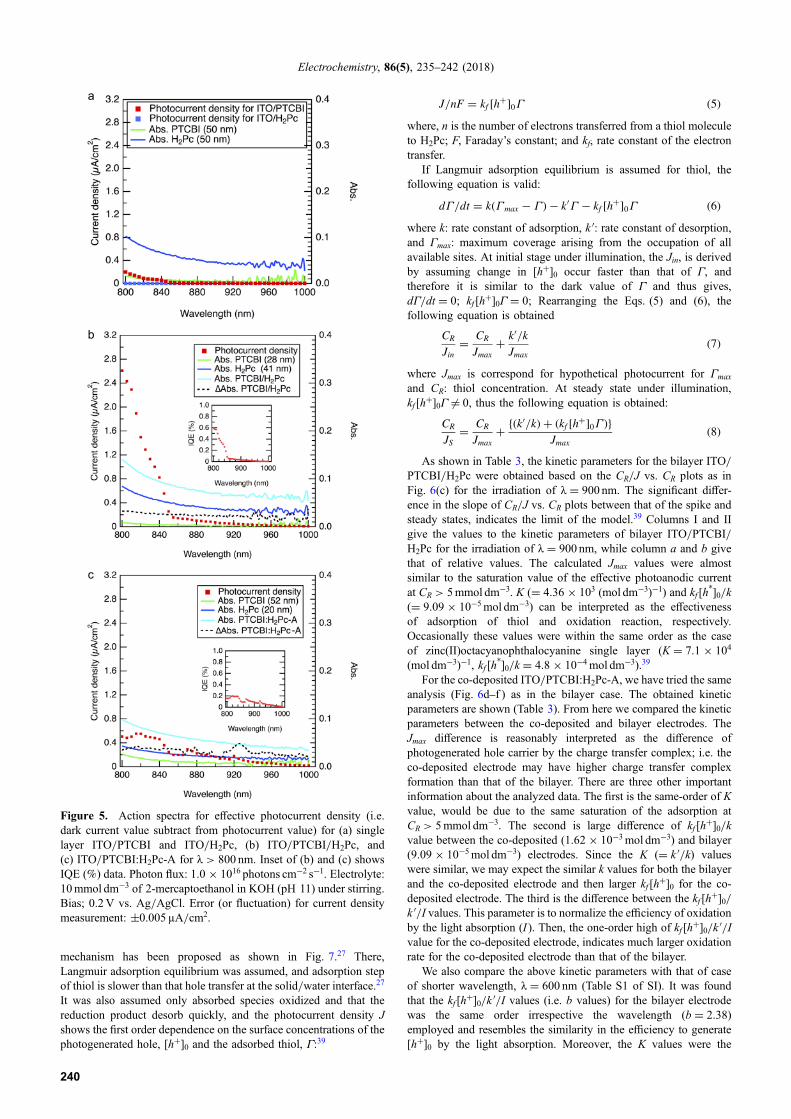
3.5 Photoanodic current and its analysisWe conducted thiol concentration dependent current measure-
ment. For the light on-off experiment, under illumination, initially aspiky photocurrent (Jin) was observed, and it then attains a steady-state photocurrent (Js) as shown in Fig. S2 of SI. Figure 6(a, opencircles) shows the spiky and steady state photocurrents density forbilayer ITO/PTCBI/H2Pc. The effective photocurrent density wassaturated at the increasing thiol concentration at 5mmol dm¹3 whichis similar to the case of the dark current. For such on-off current, a
c d
a b
Figure 4. (a, b) Action spectra and (c, d) IQE (%) for photocurrent density for ITO/PTCBI/H2Pc (a, c), and ITO/PTCBI:H2Pc-A (b, d)with 5 nm resolution of scan. Photon flux: 1.0 © 1016 photons cm¹2 s¹1. Electrolyte: 10mmol dm¹3 of 2-mercaptoethanol in KOH (pH 11)under stirring. Bias; 0.2V vs. Ag/AgCl.
Table 2. Element processes for the photoanodic current generation and recombination.
Process Reaction Product
Light absorption PTCBI + hM ¼ PTCBI*
Light absorption H2Pc + hM ¼ H2Pc*
Exciton diffusion (PTCBI* + PTCBI) ¼ PTCBI + PTCBI*
Exciton diffusion (H2Pc* + H2Pc) ¼ H2Pc + H2Pc*
Exciton diffusion to the p/n junction PTCBI* + (PTCBI-H2Pc) ¼ PTCBI + (PTCBI-H2Pc)*
Exciton diffusion to the p/n junction H2Pc* + (PTCBI-H2Pc) ¼ H2Pc + (PTCBI-H2Pc)*
Charge separation (PTCBI-H2Pc)* ¼ (PTCBI¹-H2Pc+)
Conduction H2Pc+(bulk) + H2Pc(surface) ¼ H2Pc(bulk) + H2Pc+(surface)
Non-geminate recombination PTCBI¹(interface) + H2Pc+(interface) ¼ PTCBI + H2Pc
Geminate recombination PTCBI* ¼ PTCBI
Geminate recombination H2Pc* ¼ H2Pc
[H2Pc+(surface)] = [h+]0.
Electrochemistry, 86(5), 235–242 (2018)
239
mechanism has been proposed as shown in Fig. 7.27 There,Langmuir adsorption equilibrium was assumed, and adsorption stepof thiol is slower than that hole transfer at the solid/water interface.27
It was also assumed only absorbed species oxidized and that thereduction product desorb quickly, and the photocurrent density Jshows the first order dependence on the surface concentrations of thephotogenerated hole, [h+]0 and the adsorbed thiol, !:39
J=nF ¼ kf ½hþ�0� ð5Þwhere, n is the number of electrons transferred from a thiol moleculeto H2Pc; F, Faraday’s constant; and kf, rate constant of the electrontransfer.
If Langmuir adsorption equilibrium is assumed for thiol, thefollowing equation is valid:
d�=dt ¼ kð�max � � Þ � k0� � kf ½hþ�0� ð6Þwhere k: rate constant of adsorption, kB: rate constant of desorption,and !max: maximum coverage arising from the occupation of allavailable sites. At initial stage under illumination, the Jin, is derivedby assuming change in [h+]0 occur faster than that of !, andtherefore it is similar to the dark value of ! and thus gives,d!/dt = 0; kf [h+]0! = 0; Rearranging the Eqs. (5) and (6), thefollowing equation is obtained
CR
Jin¼ CR
Jmaxþ k0=k
Jmaxð7Þ
where Jmax is correspond for hypothetical photocurrent for !max
and CR: thiol concentration. At steady state under illumination,kf [h+]0! º 0, thus the following equation is obtained:
CR
JS¼ CR
Jmaxþ fðk0=kÞ þ ðkf ½hþ�0� Þg
Jmaxð8Þ
As shown in Table 3, the kinetic parameters for the bilayer ITO/PTCBI/H2Pc were obtained based on the CR/J vs. CR plots as inFig. 6(c) for the irradiation of K = 900 nm. The significant differ-ence in the slope of CR/J vs. CR plots between that of the spike andsteady states, indicates the limit of the model.39 Columns I and IIgive the values to the kinetic parameters of bilayer ITO/PTCBI/H2Pc for the irradiation of K = 900 nm, while column a and b givethat of relative values. The calculated Jmax values were almostsimilar to the saturation value of the effective photoanodic currentat CR > 5mmol dm¹3. K (= 4.36 © 103 (mol dm¹3)¹1) and kf [h*]0/k(= 9.09 © 10¹5mol dm¹3) can be interpreted as the effectivenessof adsorption of thiol and oxidation reaction, respectively.Occasionally these values were within the same order as the caseof zinc(II)octacyanophthalocyanine single layer (K = 7.1 © 104
(mol dm¹3)¹1, kf [h*]0/k = 4.8 © 10¹4mol dm¹3).39
For the co-deposited ITO/PTCBI:H2Pc-A, we have tried the sameanalysis (Fig. 6d–f ) as in the bilayer case. The obtained kineticparameters are shown (Table 3). From here we compared the kineticparameters between the co-deposited and bilayer electrodes. TheJmax difference is reasonably interpreted as the difference ofphotogenerated hole carrier by the charge transfer complex; i.e. theco-deposited electrode may have higher charge transfer complexformation than that of the bilayer. There are three other importantinformation about the analyzed data. The first is the same-order of Kvalue, would be due to the same saturation of the adsorption atCR > 5mmol dm¹3. The second is large difference of kf [h+]0/kvalue between the co-deposited (1.62 © 10¹3mol dm¹3) and bilayer(9.09 © 10¹5mol dm¹3) electrodes. Since the K (= kB/k) valueswere similar, we may expect the similar k values for both the bilayerand the co-deposited electrode and then larger kf [h+]0 for the co-deposited electrode. The third is the difference between the kf [h+]0/kB/I values. This parameter is to normalize the efficiency of oxidationby the light absorption (I ). Then, the one-order high of kf [h+]0/kB/Ivalue for the co-deposited electrode, indicates much larger oxidationrate for the co-deposited electrode than that of the bilayer.
We also compare the above kinetic parameters with that of caseof shorter wavelength, K = 600 nm (Table S1 of SI). It was foundthat the kf [h+]0/kB/I values (i.e. b values) for the bilayer electrodewas the same order irrespective the wavelength (b = 2.38)employed and resembles the similarity in the efficiency to generate[h+]0 by the light absorption. Moreover, the K values were the
b
c
a
Figure 5. Action spectra for effective photocurrent density (i.e.dark current value subtract from photocurrent value) for (a) singlelayer ITO/PTCBI and ITO/H2Pc, (b) ITO/PTCBI/H2Pc, and(c) ITO/PTCBI:H2Pc-A for K > 800 nm. Inset of (b) and (c) showsIQE (%) data. Photon flux: 1.0 © 1016 photons cm¹2 s¹1. Electrolyte:10mmol dm¹3 of 2-mercaptoethanol in KOH (pH 11) under stirring.Bias; 0.2V vs. Ag/AgCl. Error (or fluctuation) for current densitymeasurement: «0.005 µA/cm2.
Electrochemistry, 86(5), 235–242 (2018)
240

same order (i.e. a = 1.0–2.5) for both electrodes irrespective to thewavelength employed except for the case of K = 600 nm, the co-deposited electrode has two-order lower (i.e. a = 0.03). Obviously,the electrolyte solution/H2Pc interface area is small for the co-deposited film and orientation would affect the binding constant (K).Therefore, the low K (i.e. a) value of the co-deposited electrode inthe case of K = 600 nm might be related to direct photooxidation ofadsorbed thiol on PTCBI site through exciton, while in the case ofK = 900 nm, the thiol might not be photooxidized on PTCBI sitebut on the PTCBI/H2Pc junction site through the charge transfercomplex, and thus the binding constant K might be different for bothsites. On the other hand, the efficiency of photooxidation based onthe kf [h+]0/kB/I values (i.e. b values) for the co-deposited electrodewas one order lower (b = 0.15) than that of the bilayer (b = 2.38).It might be related to the exciton generated in the PTCBI is notefficiently quenched by the H2Pc to generate holes. The overall
fc
a d
eb
Figure 6. (a, d) Current density for the dark (filled black circle) and under illumination for spike (unfilled red circle) and steady (unfilledblack circle) photocurrent density for (a) ITO/PTCBI/H2Pc and (d) ITO/PTCBI:H2Pc-A. (b, e) Effective photocurrent density (i.e. after thedark current density) was subtracted from the photocurrent density for ITO/PTCBI/H2Pc (b) and ITO/PTCBI:H2Pc-A (e). (c, f ) CR/J vs. CR
plots for ITO/PTCBI/H2Pc (c) and ITO/PTCBI:H2Pc-A (f ). Electrolyte: 2-mercaptoethanol in KOH (pH 11). Applied bias: +0.2 vs. Ag/AgCl. Irradiation condition: K = 900 nm, photon flux = 1.0 © 1016 photons cm¹2 s¹1 (Light intensity = 2.2mW/cm2) and the side ofirradiation was from the ITO side. AbsBilayer = 0.069, Absco-deposited = 0.052. From Lambert Beer law, Absorption (I ) = (1 ¹ 10¹Abs/1) © 100,then I for bilayer = 14.7%, while for co-deposited layer = 11.2%.
Figure 7. Mechanism of thiol photooxidized at H2Pc/waterinterface for the ITO/PTCBI/H2Pc. RS¹ = thiol anion. k: rateconstant of adsorption, kB: rate constant of desorption, kf, rateconstant of the electron transfer. Modified from Ref. 27.
Electrochemistry, 86(5), 235–242 (2018)
241

kinetics study shows that the co-deposited electrode is more efficientthan that of the bilayer electrode for utilizing light in the longerwavelength, where the efficiency of photooxidation rate indicatesthe efficiency of charge separation in the charge transfer complex inthe bulk heterojunction structure.
4. Conclusion
For both of bilayer and co-deposited electrode, light absorption atK > 800 nm was observed as difference from the sum of monolayers,and photoanodic current also observed for both bilayer and co-deposited electrode for K > 800 nm. Such longer wavelengthabsorption and photocurrent would be attributed to charge transfercomplex at PTCBI/H2Pc interface.
On the kinetic aspects of photoanodic current for thiol oxidation,the high efficiency for thiol oxidation in ITO/PTCBI:H2Pc-A thanthat of in ITO/PTCBI/H2Pc was observed under irradiation oflonger wavelength and would be due to the efficient chargeseparation in the charge transfer complex in the bulk heterojunctionstructure.
Supporting Information
The Supporting Information is available on the website at DOI:https://doi.org/10.5796/electrochemistry.18-00001.
References
1. C. W. Tang, Appl. Phys. Lett., 48, 183 (1986).2. S. M. Menke and R. J. Holmes, Energy Environ. Sci., 7, 499 (2014).3. C. J. Brabec, M. Heeney, I. McCulloch, and J. Nelson, Chem. Soc. Rev., 40, 1185
(2011).4. A. Facchetti, Chem. Mater., 23, 733 (2011).5. A. W. Hains, Z. Liang, M. A. Woodhouse, and B. A. Gregg, Chem. Rev., 110,
6689 (2010).6. D. Wöhrle, L. Kreienhoop, G. Schnurpfeil, J. Elbe, B. Tennigkeit, S. Hiller, and D.
Schlettwein, J. Mater. Chem., 5, 1819 (1995).7. I. Hiromitsu, M. Kitano, R. Shinto, and T. Ito, Solid State Commun., 113, 165
(2000).8. K. Murata, S. Ito, K. Takahashi, and B. M. Hoffman, Appl. Phys. Lett., 68, 427
(1996).9. T. Osasa, Y. Matsui, T. Matsumura, and M. Matsumura, Sol. Energy Mater. Sol.
Cells, 90, 3136 (2006).10. D. Schlettwein and N. R. Armstrong, J. Phys. Chem., 98, 11771 (1994).11. T. Abe, M. Ichikawa, T. Hikage, S. Kakuta, and K. Nagai, Chem. Phys. Lett., 549,
77 (2012).12. P. Arunachalam, S. Zhang, T. Abe, M. Komura, T. Iyoda, and K. Nagai, Appl.
Catal., B, (2016).13. S. Zhang, R. Sakai, T. Abe, T. Iyoda, and K. Nagai, ACS Appl. Mater. Interfaces,
3, 1902 (2011).14. K. Nagai, T. Abe, Y. Kaneyasu, Y. Yasuda, I. Kimishima, T. Iyoda, and H. Imaya,
ChemSusChem, 4, 727 (2011).15. K. Nagai, Y. Yasuda, T. Iyoda, and T. Abe, ACS Sustain. Chem. & Eng., 1, 1033
(2013).16. K. Nagai and T. Abe, Kobunshi Ronbunshu, 70, 459 (2013).17. T. Abe, K. Nagai, M. Kaneko, T. Okubo, K. Sekimoto, A. Tajiri, and T. Norimatsu,
ChemPhysChem, 5, 716 (2004).18. S. Zhang, P. Arunachalam, T. Abe, T. Iyoda, and K. Nagai, J. Photochem.
Photobiol., A, 244, 18 (2012).19. L. Steier, S. Bellani, H. C. Rojas, L. Pan, M. Laitinen, T. Sajavaara, F. Di Fonzo,
M. Grätzel, M. R. Antognazza, and M. T. Mayer, Sustainable Energy Fuels, 1,1915 (2017).
20. T. Bourgeteau, D. Tondelier, B. Geffroy, R. Brisse, R. Cornut, V. Artero, and B.Jousselme, ACS Appl. Mater. Interfaces, 7, 16395 (2015).
21. M. Hiramoto, H. Fujiwara, and M. Yokoyama, Appl. Phys. Lett., 58, 1062 (1991).22. P. Peumans, S. Uchida, and S. R. Forrest, Nature, 425, 158 (2003).23. T. Kuwabara, H. Sugiyama, T. Yamaguchi, and K. Takahashi, Thin Solid Films,
517, 3766 (2009).24. T. Abe, K. Nagai, H. Ichinohe, T. Shibata, A. Tajiri, and T. Norimatsu, J.
Electroanal. Chem., 599, 65 (2007).25. T. Abe, H. Ichinohe, S. Kakuta, and K. Nagai, Jpn. J. Appl. Phys., 49, 015101
(2010).26. T. Abe, S. Tobinai, and K. Nagai, Jpn. J. Appl. Phys., 48, 021503 (2009).27. T. Abe, S. Miyakushi, K. Nagai, and T. Norimatsu, Phys. Chem. Chem. Phys., 10,
1562 (2008).28. K. Nagai, T. Iyoda, A. Fujishima, and K. Hashimoto, Solid State Commun., 102,
809 (1997).29. N. J. Turro, V. Ramamurthy, and J. C. Scaiano, Principles of Molecular
Photochemistry: An Introduction, University Science Books, Sausalito, California,p. 248 (2010).
30. F. Piersimoni, D. Cheyns, K. Vandewal, J. V. Manca, and B. P. Rand, J. Phys.Chem. Lett., 3, 2064 (2012).
31. A. Guerrero, H. Heidari, T. S. Ripolles, A. Kovalenko, M. Pfannmöller, S. Bals,L. D. Kauffmann, J. Bisquert, and G. Garcia-Belmonte, Adv. Energy Mater., 5,1401997 (2015).
32. K. Akaike, K. Kanai, Y. Ouchi, and K. Seki, Adv. Funct. Mater., 20, 715 (2010).33. T. Maki and H. Hashimoto, Bull. Chem. Soc. Jpn., 25, 411 (1952).34. K. Nagai, Y. Fujimoto, H. Shiroishi, M. Kaneko, T. Norimatsu, and T. Yamanaka,
Chem. Lett., 30, 354 (2001).35. T. Morikawa, C. Adachi, T. Testuo, and S. Saito, Nippon Kagaku Kaishi, 1990,
962 (1990).36. T. Abe, S. Ogasawara, K. Nagai, and T. Norimatsu, Dyes Pigm., 77, 437 (2008).37. T. Abe and K. Nagai, Org. Electron., 8, 262 (2007).38. O. V. Mikhnenko, P. W. M. Blom, and T. Q. Nguyen, Energy Environ. Sci., 8,
1867 (2015).39. E. Karmann, D. Schlettwein, and N. I. Jaeger, J. Electroanal. Chem., 405, 149
(1996).
Table 3. Resulting kinetic parameter in ITO/PTCBI/H2Pc and ITO/PTCBI:H2Pc-A and the relative kinetic parameter in ITO/PTCBI:H2Pc-A to ITO/PTCBI/H2Pc for irradiation condition: K = 900 nm.
Jmaxfrom Jin
(µA·cm¹2)
Jmaxfrom Js
(µA·cm¹2)kB/k
K(I)
relativerate with K,
(a)
kf [h+]0/k(II)
kf [h+]0/kB(I © II)
(kf [h+]0/kB)/I
relative ratewith
(kf [h+]0/kB)/I,(b)
(mol dm¹3) (mol dm¹3)¹1 (mol dm¹3)
ITO/PTCBI/H2Pc
0.10 0.06 2.29 © 10¹4 4.36 © 103 1.00 9.09 © 10¹5 4.00 © 10¹1 3.00 © 10¹2 1.00
ITO/PTCBI:H2Pc-A
0.42 0.21 2.17 © 10¹4 4.60 © 103 1.05 1.62 © 10¹3 7.45 © 100 6.70 © 10¹1 22.33
The kinetic parameter in ITO/PTCBI/H2Pc and ITO/PTCBI:H2Pc-A was obtained from the data of Fig. 6(c and e) by using Eq. (7) and(8). Irradiation condition: K = 900 nm, photon flux = 1.0 © 1016 photons cm¹2 s¹1 (Light intensity = 2.2mW/cm2) and the side ofirradiation was from the ITO side. The inverse of kB/k (= k/kB = K) represents the equilibrium constant for thiol adsorption.AbsBilayer = 0.069, Absco-deposited = 0.052. From Lambert Beer law, Absorption (I) = (1 ¹ 10¹Abs/1) © 100, then I for bilayer = 14.7%,while for co-deposited layer = 11.2%. a and b are respectively the relative K value and kf [h+]0/kB/I value in each system and the value forITO/PTCBI/H2Pc is unity.
Electrochemistry, 86(5), 235–242 (2018)
242