study of bat flight behavior by combining thermal image ...people.bu.edu/nwfuller/pdfs/yang et al...
TRANSCRIPT

Study of bat flight behavior by combining thermalimage analysis with a LiDAR forest
reconstruction
Xiaoyuan Yang, Crystal Schaaf, Alan Strahler, Thomas Kunz, Nathan Fuller, Margrit Betke,Zheng Wu, Zhuosen Wang, Diane Theriault, Darius Culvenor, David Jupp,
Glenn Newnham, and Jenny Lovell
Abstract. The nature of forest structure plays an important role in the study of foraging behaviors of bats. In this study, we
demonstrate a new combined methodology that uses both thermal imaging technology and a ground-based LiDAR
system to record and reconstruct Eptesicus fuscus (big brown bats) flight trajectories in three-dimensional (3-D) space.
The combination of the two 3-D datasets provided a fine-scale reconstruction of the flight characteristics adjacent to and
within the forests. A 3-D forest reconstruction, assembled from nine Echidna Validation Instrument LiDAR scans over
the 1 ha site area, provided the essential environmental variables for the study of bat foraging behaviors, such as the
canopy height, terrain, location of the obstacles, and canopy openness at a bat roosting and maternity site in Petersham,
Massachusetts. Flight trajectories of 24 bats were recorded over the 25 m � 37.5 m region within the LiDAR forest
reconstruction area. The trajectories were reconstructed using imaging data from multiple FLIR ThermoVision SC8000
cameras and were co-registered to the 3-D forest reconstruction. Twenty-four of these flight trajectories were categorized
into four different behavior groups according to velocity and altitude analysis of the flight trajectories. Initial results
showed that although all bats were guided by echolocation and avoided hitting a tree that was in all of their flight paths,
different bats chose different flight routes. This study is an initial demonstration of the power of coupling thermal image
analysis and LiDAR forest reconstructions. Our goal was to break ground for future ecological studies, where more
extensive flight trajectories of bats can be coupled with the canopy reconstructions to better establish responses of bats to
different habitat characteristics and clutter, which includes both static (trees) and dynamic (other bats) obstacles.
Resume. La nature de la structure forestiere joue un role important dans l’etude des comportements d’approvisionnement
en nourriture des chauves-souris. Dans cette etude, on demontre une nouvelle methodologie combinee qui utilise a la fois
la technologie des images thermiques et un systeme LIDAR au sol pour enregistrer et reconstruire les trajectoires de vol
des Eptesicus fuscus (grandes chauves-souris brunes) dans l’espace tridimensionnel. La combinaison des deux ensembles
de donnees 3D a fourni une reconstruction a echelle fine des caracteristiques de vol adjacents et a l’interieur des forets.
Une reconstruction forestiere en 3D, assemblee a partir de neuf balayages LIDAR du capteur « Echidna Validation
Instrument » au-dessus du site d’etude de un hectare, a fourni les variables environnementales essentielles pour l’etude des
comportements d‘approvisionnement en nourriture des chauves-souris comme la hauteur du couvert, le terrain, la
localisation des obstacles et l’ouverture du couvert sur un site de nidification et de maternite de chauves-souris a
Petersham, au Massachusetts. Les trajectoires de vol de 24 chauves-souris ont ete enregistrees au-dessus de la region de
25 m � 37,5 m a l’interieur de la zone de reconstruction LIDAR de la foret. Les trajectoires ont ete reconstruites a l’aide
des donnees images de cameras FLIR ThermoVision SC8000 multiples et superposees sur la reconstruction
tridimensionnelle. Vingt-quatre de ces trajectoires de vol ont ete classifiees en quatre groupes differents de comportements
Received 9 January 2012. Accepted 21 July 2013. Published on the Web at http://pubs.casi.ca/journal/cjrs on 2 October 2013.
Xiaoyuan Yang1, Crystal Schaaf, and Zhuosen Wang. School for the Environment, College of Science and Mathematics, University ofMassachusetts Boston, Boston, MA, USA, 02125.
Alan Strahler. Department of Earth and Environment, Boston University, Boston, MA, USA, 02215.
Thomas Kunz and Nathan Fuller. Department of Biology, Boston University, Boston, MA, USA, 02215.
Margrit Betke, Zheng Wu, and Diane Theriault. Department of Computer Science, Boston University, Boston, MA, USA, 02215.
Darius Culvenor. Environmental Sensing Systems, Melbourne, Victoria 3000, Australia.
David Jupp. CSIRO Marine and Atmospheric Research, Canberra, ACT 2601, Australia.
Glenn Newnham. CSIRO Land and Water, Clayton South, Victoria 3169, Australia.
Jenny Lovell. CSIRO Marine and Atmospheric Research, Hobart, Tasmania 7000, Australia.
1Corresponding author (e-mail: [email protected]).
Can. J. Remote Sensing, Vol. 39, No. S1, pp. S112�S125, 2013
S112 # 2013 CASI
Can
adia
n Jo
urna
l of
Rem
ote
Sens
ing
Dow
nloa
ded
from
pub
s.ca
si.c
a by
MU
GA
R M
EM
OR
IAL
LIB
RA
RY
on
01/1
1/14
For
pers
onal
use
onl
y.

selon une analyse de la vitesse et de l’altitude des trajectoires de vol. Les resultats initiaux ont montre que, bien que toutes
les chauves-souris etaient guidees par echolocation et evitaient de frapper un arbre qui etait dans toutes leurs trajectoires
de vol, differentes chauves-souris choisissaient differentes trajectoires de vol. Cette etude constitue une demonstration
initiale du potentiel du couplage de l’analyse d’images thermiques et des reconstructions forestieres LIDAR. Notre
objectif etait de montrer la voie aux etudes ecologiques futures, ou des trajectoires de vol a plus grande echelle de chauves-
souris peuvent etre couplees avec les reconstructions du couvert pour mieux etablir les reponses des chauves-souris face
aux differentes caracteristiques des habitats et au fouillis d’echos, incluant a la fois les obstacles statiques (arbres) et
dynamiques (autres chauves-souris).
[Traduit par la Redaction.]
Introduction
The nature of forest structure (e.g., canopy cover,
distribution of overstory and understory, foliage density,
forest gaps, stand-scale variability, forest fragmentation,
availability of standing deadwood, and forestry practices)
are all important contributors to the maintenance of
successful bat populations (Lacki et al., 2007; Kunz et al.,
2008). Bat species have different foraging strategies: some
capture insects on the wing (aerial), whereas others collect
prey from surfaces (gleaning) (Fenton, 1990; Schnitzler and
Kalko, 1998). Previous research suggests that the vertical
stratification of a forest may also play an important role in
the foraging behavior of bats (Bonaccorso, 1979; Bernard,
2001; Kalko and Handley, 2001; Weinbeer and Kalko, 2004).
Forest attributes such as clumped leaf area with stand height
and patterns of disturbance and gap formation have been
shown to play an important role in determining optimum
bat habitat use (Parker and Brown, 2000). Jung et al. (2012)
found a positive association between European bat activities
and forest structure parameters, as well as associations
between similar adaptations in wing morphology and
foraging strategy with similar forest structural parameters.
Studies by Krusic et al. (1996) and Zimmerman and Glanz
(2000) showed that a mix of forest types, including clear-cuts
and regenerated areas and over-mature hardwoods, in
combination with water and trails, provide the optimum
summer habitat for the bat species of New England. For big
brown bats (Eptesicus fuscus) in New England, which were
targeted specifically in this study, the most common roosting
places are in hollow trees, beneath loose tree bark, in the
crevices of rocks, or in man-made structures such as attics,
barns, old buildings, eaves, and window shutters. These
roosting places vary from obstacle-rich space in a forest
interior to the less cluttered space near forest edges and in
forest gaps (Kurta and Baker, 1990). It remains unclear,
however, to what extent that this species uses open spaces
away from clutter, such as the space above the canopy and
the gaps within a canopy.
To detect, quantify, and understand bat activities inside a
forest is a challenging task. It requires appropriate integra-
tion of diverse tools, technologies, and multiple databases
(Kunz et al., 2008). Scientists have been exploring the way
bats fly at the edge of forests or above forest canopies using
radar (Kunz, 2004; Cleveland et al., 2006; Cryan et al.,
2008), radio-telemetry technologies (Hodgkison et al., 2003;
Thies and Kalko, 2004; Thies et al., 2006), ultrasonic sensors
(Holderied et al., 2005; Gillam et al., 2009; Holderied and
Jones, 2009; Parsons and Szewczak, 2009), and high-
resolution infrared cameras (Simmons, 2005; Betke et al.,
2007; Fleck et al., 2007; Betke et al., 2008; Hristov
et al., 2008; Wu et al., 2009a; Hristov et al., 2010; Theriault
et al., 2010). Without a way to describe the structure of the
forest quantitatively, using these methodologies alone can
only provide a limited assessment of foraging behavior.
Recent advances in remote sensing of the three-
dimensional (3-D) structure of forests have been made
with under-canopy Light Detection and Ranging (LiDAR)
systems (Strahler et al., 2008; Jupp et al., 2009b; Yang et al.,
2013), airborne sensors (Blair et al., 1999; Anderson
et al., 2006; 2008), and multi-angular passive data (Kimes
et al., 2006; Schull et al., 2007). The under-canopy LiDAR,
the Echidna Validation Instrument (EVI), is a near-infrared,
pulsed-laser, mirror scanning LiDAR with full-waveform
digitizing. The full-waveform recording enables character-
ization of the canopy structure of fully forested regions and
captures details about partially obscured objects that are not
possible with discrete return systems. Culvenor et al. (2005)
and Jupp et al. (2009b) described the theory and mechanical
details for the retrieval of Leaf Area Index (LAI) and the
foliage profile from EVI and demonstrated its application.
Strahler et al. (2007; 2008; 2009), Zhao et al. (2011), and
Yao et al. (2011) further validated retrieval of EVI-derived
forest structural parameter. Assembled from multiple EVI
scans, digital reconstructions can be built in 3-D space for
forests with varying density and species composition (Yang
et al., 2013). Three-dimensional forest reconstruction per-
mits direct characterization of the forest structure that
provided essential environmental variables for the detection
and analysis of bat foraging behaviors. The integration of
ground-based LiDAR data and high-resolution thermal
infrared cameras provided the opportunity to explore and
characterize the responses of bats to forest structure. This
integration may eventually help describe ecosystems on a
coarser scale and establish optimum landscape models for
bat assemblages in both temperate and tropical ecosystems
(Meyer et al., 2009; Bass et al., 2010).
In this study, the emergence patterns of a small colony of
big brown bats roosting in a barn located adjacent to the
edge of a deciduous forest (a 25 m � 37.5 m region of
interest) in Petersham, Mass., was investigated using
coupled thermal infrared imaging technology and forest
reconstruction using LiDAR. Our study focused on the big
brown bats, but similar studies may be very illuminating, for
Canadian Journal of Remote Sensing / Journal canadien de teledetection
# 2013 CASI S113
Can
adia
n Jo
urna
l of
Rem
ote
Sens
ing
Dow
nloa
ded
from
pub
s.ca
si.c
a by
MU
GA
R M
EM
OR
IAL
LIB
RA
RY
on
01/1
1/14
For
pers
onal
use
onl
y.
example in tropical forests where different bat species use
different parts of a forest (Heithaus et al., 1975; Bonaccorso,
1979; Bernard, 2001; Kalko and Handley, 2001).
Methods
FLIR ThermalVision SC8000
Thermal infrared cameras detect the characteristic infra-
red radiation (IR) of objects in the form of photons. The
higher the temperature of an object of interest, the greater
the intensity of emitted radiation, and thus the brighter theresulting thermal image (Kastberger and Stachl, 2003).
Therefore, thermal infrared imaging has the ability to record
the behavior of free-ranging organisms in the dark and has
been proven to be a valuable paradigm for investigating bat
flight behavior (Betke et al., 2007; 2008; Hristov et al., 2008;
Wu et al., 2009a; 2009b; Hristov et al., 2010). In this study,
two FLIR ThermoVision SC8000 cameras were deployed
and positioned to reconstruct 3-D images of foraging bats asthey emerged from their daytime roost. The SC8000 camera
is a high-resolution and high-speed thermal imaging instru-
ment. It has a spatial resolution of 1024 � 1024 pixels and a
frame rate of Rf � 131.5 frames per second. For a given
viewing distance, the field of view (FOV) of the camera
determines the dimensions of the total surface area detected
by the instrument, which depends on the camera lens and
focal plane dimensions and is expressed in two angles(FLIR, 2005). In our experiments, we used a 25 mm lens
with each camera, which produced an approximate 408 �408 FOV. The camera relies on a sealed cryogenic chamber
that lowers the operating temperature of the detector array
to a temperature that is much lower than ambient (typically
70�80 K). Because most objects of interest are at higher
temperature, such cooled imaging devices have high thermal
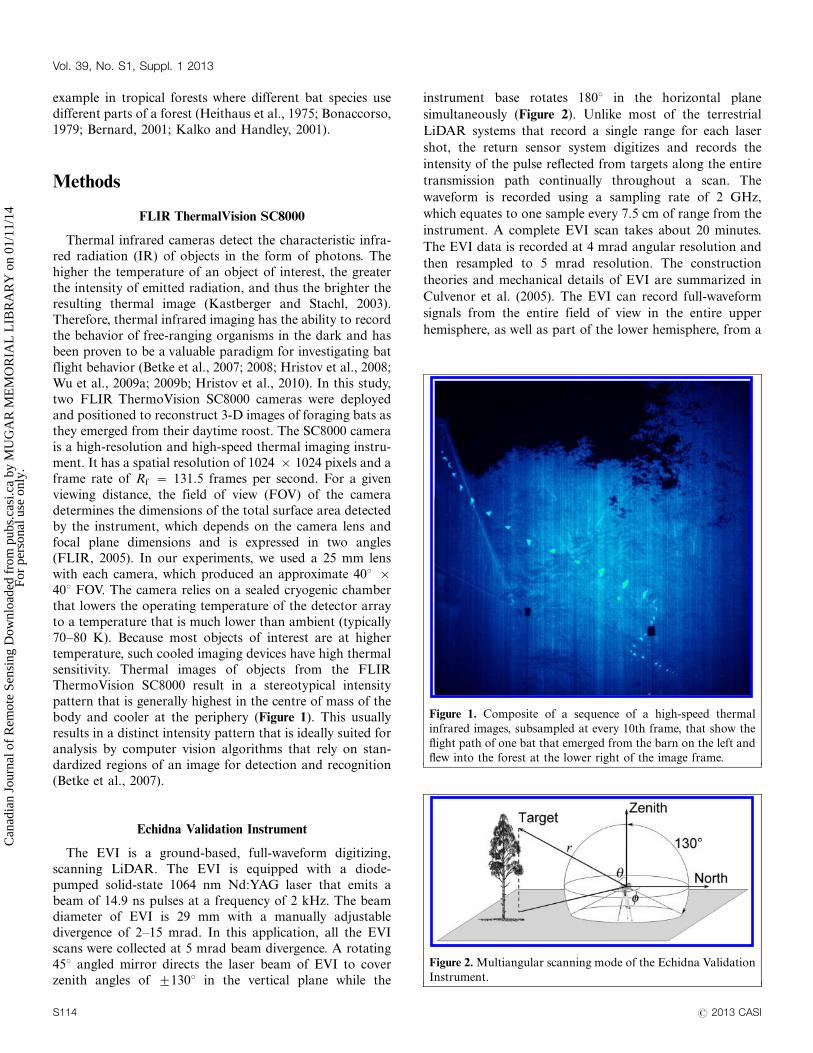
sensitivity. Thermal images of objects from the FLIRThermoVision SC8000 result in a stereotypical intensity
pattern that is generally highest in the centre of mass of the
body and cooler at the periphery (Figure 1). This usually
results in a distinct intensity pattern that is ideally suited for
analysis by computer vision algorithms that rely on stan-
dardized regions of an image for detection and recognition
(Betke et al., 2007).
Echidna Validation Instrument
The EVI is a ground-based, full-waveform digitizing,
scanning LiDAR. The EVI is equipped with a diode-
pumped solid-state 1064 nm Nd:YAG laser that emits a
beam of 14.9 ns pulses at a frequency of 2 kHz. The beamdiameter of EVI is 29 mm with a manually adjustable
divergence of 2�15 mrad. In this application, all the EVI
scans were collected at 5 mrad beam divergence. A rotating
458 angled mirror directs the laser beam of EVI to cover
zenith angles of 91308 in the vertical plane while the
instrument base rotates 1808 in the horizontal plane
simultaneously (Figure 2). Unlike most of the terrestrial
LiDAR systems that record a single range for each laser
shot, the return sensor system digitizes and records the
intensity of the pulse reflected from targets along the entire
transmission path continually throughout a scan. The
waveform is recorded using a sampling rate of 2 GHz,
which equates to one sample every 7.5 cm of range from the
instrument. A complete EVI scan takes about 20 minutes.
The EVI data is recorded at 4 mrad angular resolution and
then resampled to 5 mrad resolution. The construction
theories and mechanical details of EVI are summarized in
Culvenor et al. (2005). The EVI can record full-waveform
signals from the entire field of view in the entire upper
hemisphere, as well as part of the lower hemisphere, from a
Figure 2. Multiangular scanning mode of the Echidna Validation
Instrument.
Figure 1. Composite of a sequence of a high-speed thermal
infrared images, subsampled at every 10th frame, that show the
flight path of one bat that emerged from the barn on the left and
flew into the forest at the lower right of the image frame.
Vol. 39, No. S1, Suppl. 1 2013
S114 # 2013 CASI
Can
adia
n Jo
urna
l of
Rem
ote
Sens
ing
Dow
nloa
ded
from
pub
s.ca
si.c
a by
MU
GA
R M
EM
OR
IAL
LIB
RA
RY
on
01/1
1/14
For
pers
onal
use
onl
y.

distance of up to 100 m or more in medium density forests.
The EVI scan geometry is shown in Figure 2.
Plot layout
Big brown bats (Eptesicus fuscus), belonging to a roosting
colony in Petersham, Mass., were recorded as they emerged
from a crevice near the peak of the barn and flew into and
above the adjacent forest after dusk on 2 June 2010. We
deployed two FLIR ThermoVision SC8000 cameras with a
3 m baseline and pointed them towards the barn with an
overlapping FOV to record thermal video of bats as they left
the barn and commuted through the forest. Three fixed
calibration targets, one with a hot pack and two with cold
packs taped to the end of poles, were positioned so that they
would appear in the FOV of both cameras (A and B in
Figure 3). Owing to the temperature difference of the
calibration targets with the surrounding environment, the
hot target appeared as a patch of bright pixels and the cold
targets as dark pixels in the image data collected with the
thermal camera.
Nine EVI scans were acquired in a 25 m grid pattern over
the forest area near the barn (Figure 3). The site area
consists of a barn on the left, a dense broadleaf forest near
the barn, and several adjacent areas of an open field and
nearby paths without vegetation. Following the methodol-
ogy described in Yang et al. (2013), EVI scans can be
combined by adjusting translation and rotation matrices to
reconstruct a 100 m � 100 m 3-D structure of the forest on
the site. Because the flight activities of bats captured by
thermal cameras were limited to areas close to the barn and
did not extend far into the forest, a 25 m � 37.5 m region of
interest (x � [�50, �25] and y � [�12.5, 25]), was cropped
from the original hectare. The center of the barn is located at
(� 45, � 5) over the (x, y) plane.
The locations of the thermal cameras, as well as the
locations of thermal calibration targets were surveyed using
a Nikon AX-2S instrument and were then co-registered into
the 3-D coordinate system of the forest reconstruction.
Reconstruction of bat flight trajectories
Calibration of thermal camera
The thermal cameras were calibrated both in space and
time to reconstruct the flight trajectories of bats. To
synchronize datasets collected by multiple cameras in time,
a function generator was connected to the cameras, which
triggered them to start at the same time. Spatial calibration
was used to acquire the relative orientation between the two
cameras. That is, the calibration matrix P registered
the image coordinates (u, v) for the two cameras into one
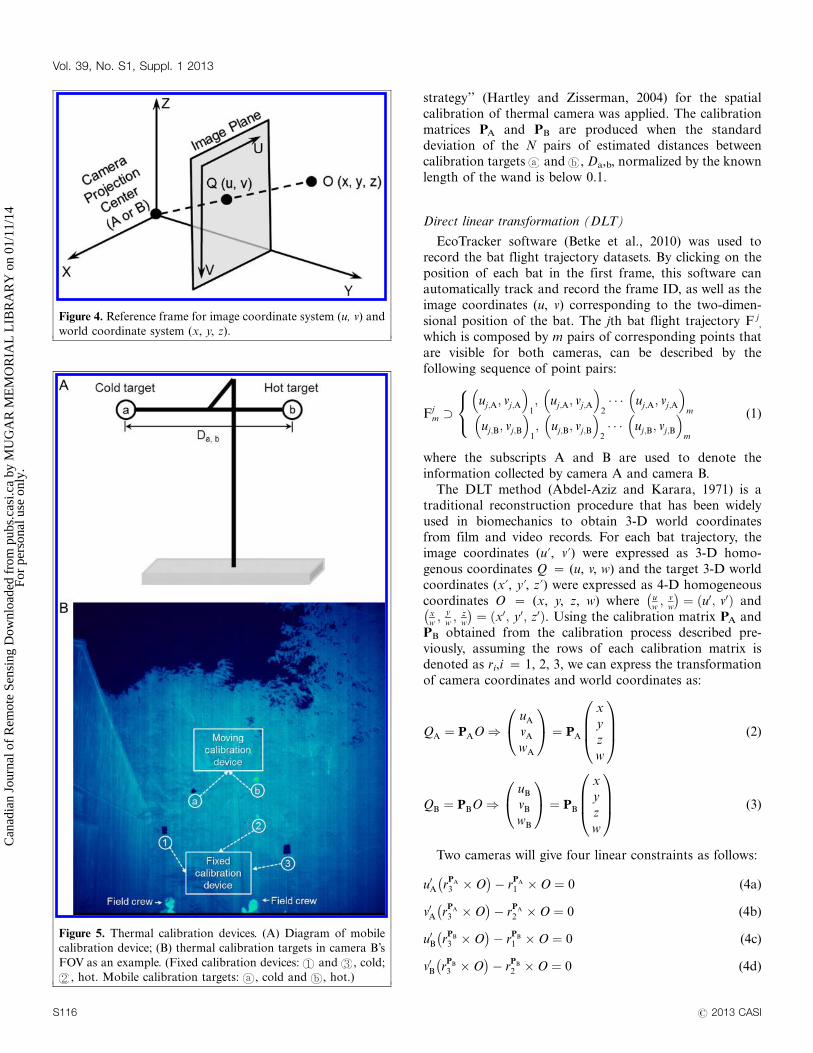
(x, y, z) world coordinate system (Figure 4). In the field, a
calibration video was recorded prior to acquiring the actual
video emergences of bats. A mobile calibration device was
fabricated from PVC and aluminum tubing (Figure 5A).
A field crew member rotated and waved the calibration
device over the area detected by both cameras. N pairs of
image coordinates (u, v) of targets and were recorded
and extracted from the calibration video (Figure 5B). From
the N pairs of (u, v), a ‘‘wand-based self-calibration
Figure 3. Plot layout over the Petersham site.
Canadian Journal of Remote Sensing / Journal canadien de teledetection
# 2013 CASI S115
Can
adia
n Jo
urna
l of
Rem
ote
Sens
ing
Dow
nloa
ded
from
pub
s.ca
si.c
a by
MU
GA
R M
EM
OR
IAL
LIB
RA
RY
on
01/1
1/14
For
pers
onal
use
onl
y.
strategy’’ (Hartley and Zisserman, 2004) for the spatial
calibration of thermal camera was applied. The calibration
matrices PA and PB are produced when the standard
deviation of the N pairs of estimated distances betweencalibration targets and , Da,b, normalized by the known
length of the wand is below 0.1.
Direct linear transformation (DLT)
EcoTracker software (Betke et al., 2010) was used torecord the bat flight trajectory datasets. By clicking on the
position of each bat in the first frame, this software can
automatically track and record the frame ID, as well as the
image coordinates (u, v) corresponding to the two-dimen-
sional position of the bat. The jth bat flight trajectory F j,
which is composed by m pairs of corresponding points that
are visible for both cameras, can be described by the
following sequence of point pairs:
Fjm �
uj;A; vj;A
� �1; uj;A; vj;A
� �2� � � uj;A; vj;A
� �m
uj;B; vj;B
� �1; uj;B; vj;B
� �2� � � uj;B; vj;B
� �m
8<: (1)
where the subscripts A and B are used to denote the
information collected by camera A and camera B.
The DLT method (Abdel-Aziz and Karara, 1971) is a
traditional reconstruction procedure that has been widely
used in biomechanics to obtain 3-D world coordinatesfrom film and video records. For each bat trajectory, the
image coordinates (u?, v?) were expressed as 3-D homo-
genous coordinates Q � (u, v, w) and the target 3-D world
coordinates (x?, y?, z?) were expressed as 4-D homogeneous
coordinates O � (x, y, z, w) where uw; v
w
� �¼ u0; v0ð Þ and
xw; y
w; z
w
� �¼ x0; y0; z0ð Þ. Using the calibration matrix PA and
PB obtained from the calibration process described pre-
viously, assuming the rows of each calibration matrix isdenoted as ri,i � 1, 2, 3, we can express the transformation
of camera coordinates and world coordinates as:
QA ¼ PAO)uA
vA
wA
0@
1A ¼ PA
x
y
z
w
0BB@
1CCA (2)
QB ¼ PBO)uB
vB
wB
0@
1A ¼ PB
x
y
z
w
0BB@
1CCA (3)
Two cameras will give four linear constraints as follows:
u0A rPA
3 �O� �
� rPA
1 �O ¼ 0 (4a)
v0A rPA
3 �O� �
� rPA
2 �O ¼ 0 (4b)
u0B rPB
3 �O� �
� rPB
1 �O ¼ 0 (4c)
v0B rPB
3 �O� �
� rPB
2 �O ¼ 0 (4d)
Figure 4. Reference frame for image coordinate system (u, v) and
world coordinate system (x, y, z).
Figure 5. Thermal calibration devices. (A) Diagram of mobile
calibration device; (B) thermal calibration targets in camera B’s
FOV as an example. (Fixed calibration devices: and , cold;
, hot. Mobile calibration targets: , cold and , hot.)
Vol. 39, No. S1, Suppl. 1 2013
S116 # 2013 CASI
Can
adia
n Jo
urna
l of
Rem
ote
Sens
ing
Dow
nloa
ded
from
pub
s.ca
si.c
a by
MU
GA
R M
EM
OR
IAL
LIB
RA
RY
on
01/1
1/14
For
pers
onal
use
onl
y.

Here O is unknown and can be solved based on Equations
(4a) to (4d). Therefore, the flight trajectories of bats Fjm in
Equation (1) can be represented by a 3-D point group after
the reconstruction of the 3-D world coordinate system fromthe two thermal cameras using the DLT method
Fjm � x01; y01; z01ð Þj; x02; y02; z02ð Þj; � � � x0m; y0m; z0mð Þ
j; (5)
The EcoTracker (Betke et al., 2010) software uses the
DLT method to compute the 3-D trajectory in Equation (5)
based on the 2-D trajectories as in Equation (1) and the
calibration matrices.
Three-dimensional forest reconstruction
In any EVI scan, returned pulses within each laser shot
can be located unambiguously in space relative to the
instrument by three geometric dimensions: zenith angle
(u), azimuth angle (8), and the effective range (r) (Figure 2).
The intensity peaks within each EVI waveform are detectedand their intensity aj are directly displayed as 3-D point
clouds by converting the original polar coordinates of u, 8,
and r to Cartesian coordinates of x, y, and z. The full width
at half maximum (FWHM) that describes the pulse shape,
the time sequence along the laser shot (1st, 2nd, 3rd, 4th . . .),and the polar coordinates of the peak value are also
recorded as auxiliary information. Thus, the 3-D point
clouds rearrange the laser signals in a more convenient wayfor visualization while leaving the original information
unchanged. Following the methodology described in Yang
et al. (2013), a 3-D forest reconstruction was built from nine
EVI scans utilizing surveyed scan geolocations. Based on the
recorded pulse shape information, the merged point cloud of
forest reconstruction was further classified into ground,
foliage, and trunk. A Digital Elevation Model (DEM) and a
Canopy Height Model (CHM) were interpolated andmapped based on these categories of points to characterize
the terrain and basic forest structure over the site.
Registration of forest reconstruction and bat flight trajectory
After the 3-D thermal camera system is reconstructed
using the DLT method, the coordinates of the thermal
calibration targets , , and can be extracted as
x01ð Þ; y01ð Þ; z01ð Þ
� �; x02ð Þ; y02ð Þ; z02ð Þ
� �; and x03ð Þ; y03ð Þ; z03ð Þ
� �. The
thermal calibration targets, surveyed in the field, were co-
registered into the 3-D forest reconstruction with coordi-
nates x001ð Þ; y001ð Þ; z001ð Þ
� �; x002ð Þ; y002ð Þ; z002ð Þ
� �; and x003ð Þ; y003ð Þ; z003ð Þ
� �.
Rotation (R?) and the translation matrix (T?) that can
transfer the 3-D world coordinate system of the thermal
infrared camera into the 3-D forest reconstruction were
calculated using the coordinates of the fixed calibration
targets. Thus, the flight trajectories of bats, Fjm, were
registered to the 3-D forest reconstruction coordinate system
Fj0
m ¼ FjmR0 þ T 0 (6)
Fjm � x001; y001; z001ð Þj; x002; y002; z002ð Þj; � � � x00m; y00m; z00mð Þj; (7)
Properties of bat flight
For the jth bat, the magnitude of its instantaneous
velocity during flight Vj at ith location, can be calculated
from the registered 3-D coordinates of its 3-D flight
trajectory Fjm, the associated frame ID I, and the frame
rate Rf
Vji ¼
Di�1;i
Ii � Ii�1ð Þ=Rf
(8)
where Di�1, i is the distance between the ith location and the
(i�1)th location:
Di�1;i ¼ffiffiffiffiffiffiffiffiffiffiffiffiffiffiffiffiffiffiffiffiffiffiffiffiffiffiffiffiffiffiffiffiffiffiffiffiffiffiffiffiffiffiffiffiffiffiffiffiffiffiffiffiffiffiffiffiffiffiffiffiffiffiffiffiffiffiffiffiffiffiffiffiffiffiffiffiffix00i � x00i�1ð Þ2þ y00i � y00i�1ð Þ2þ z00i � z00i�1ð Þ2
q(9)
The flying altitude Hji can be calculated from the
registered 3-D coordinates of bat flight trajectory Fj0
m and
the DEM datasets generated from 3-D forest reconstruction
Hji ¼ z00i � Gi (10)
where Gi is the ground height at the ith location.
Results
Registration of 3-D flight trajectories of bats and 3-D forest
reconstruction
The registration of flight trajectories of bats and the 3-D
forest reconstruction provided a fine-scale reconstruction of
each flight path within and along the forest edge and
canopy. During the 15 minute recording periods, 26 bats
(j � 1�26) were recorded and are numbered in the order of
appearance. Among the 26 bats, 24 of them emerged from a
crevice at the peak of the barn and flew into the forest,
whereas bat 1 and bat 13 flew into the FOV of the camerasfrom behind the cameras. Therefore, bat 1 and bat 13 were
not included in the following flight velocity and altitude
analysis of the trajectories immediately following emergence.
The 24 flight trajectories of the bats emerging from the
crevice at the peak of the barn are shown in Figure 6, each
with a unique color. The barn can be seen on the upper left
corner of Figure 6A and front region of Figure 6B. The
registration of flight trajectories of the bats and the 3-Dforest reconstruction provides a fine-scale reconstruction of
each flight path within and along the forest edge and canopy.
DEM and CHM for the Petersham bat site
A DEM and a CHM helped in defining the 3-D forest
space where the bats foraged. They were derived from
the 3-D forest reconstruction following the methodology
described in Yang et al. (2013). This height information was
Canadian Journal of Remote Sensing / Journal canadien de teledetection
# 2013 CASI S117
Can
adia
n Jo
urna
l of
Rem
ote
Sens
ing
Dow
nloa
ded
from
pub
s.ca
si.c
a by
MU
GA
R M
EM
OR
IAL
LIB
RA
RY
on
01/1
1/14
For
pers
onal
use
onl
y.

used to characterize flight characteristics such as altitude
and flight velocity of the emerging bats and their correlation
with primary forest structure.
This site is relatively flat over most of the area; however, it
contains some obvious terrain variation over our selected
region of interest where the bats were observed (Figure 7A).
Considering the location of the barn, there is a stable
downward slope on the ground along the path that bats
emerged and flew into the forest. The canopy over the
hectare is less than 15 min height and is composed of
deciduous trees (from field observations) (Figure 7B). The
canopy over the selected region of interest where the bat
trajectories were detected is comparatively sparser and
shorter than the rest of the forested area, with canopy
heights of around 5�8 m.
Flight velocity and altitude
To analyze flight velocity and altitude second by second, we
labeled the 5 seconds after emergence as T1, T2, T3, T4, and T5.Twenty-four bat flight velocity curves, (excluding bat 1 and bat
13 of the total 26 trajectories) were imaged emerging from the
crevice at the peak of the barn (Figure 8A). After the bats
emerged, they accelerated to approximately 6 m/s to 8 m/s
Figure 6. 3-D trajectories of emerging bats reconstructed from videos recorded with two
thermal infrared cameras and a 3-D forest reconstruction using EVI. (A) Top view (the front
and two sides of the barn can be seen as three green lines in the left centre of the LiDAR
image); and (B) side view (a profile of the front and one side of the barn can be seen in the
LiDAR image in the lower centre of the image).
Vol. 39, No. S1, Suppl. 1 2013
S118 # 2013 CASI
Can
adia
n Jo
urna
l of
Rem
ote
Sens
ing
Dow
nloa
ded
from
pub
s.ca
si.c
a by
MU
GA
R M
EM
OR
IAL
LIB
RA
RY
on
01/1
1/14
For
pers
onal
use
onl
y.

within T1. They then reduced their velocity for a brief period
before entering into a more or less random velocity variation.
The maximum velocity recorded was approximately 12 m/s
and the minimum velocity was approximately 2.5 m/s, exclud-
ing the acceleration period T1.
As shown in Figure 8B, bats emerged from the barn,
which is about 8 m above ground level (AGL) and descended
1�2 m during T1 of the emergence. Then, during T1 and T2,
some bats started to climb to 8 m while others continued to
descend. The maximum flight altitude of these bats after
emergence was also about 8 m AGL and the minimum flight
altitude was about 2 m AGL.
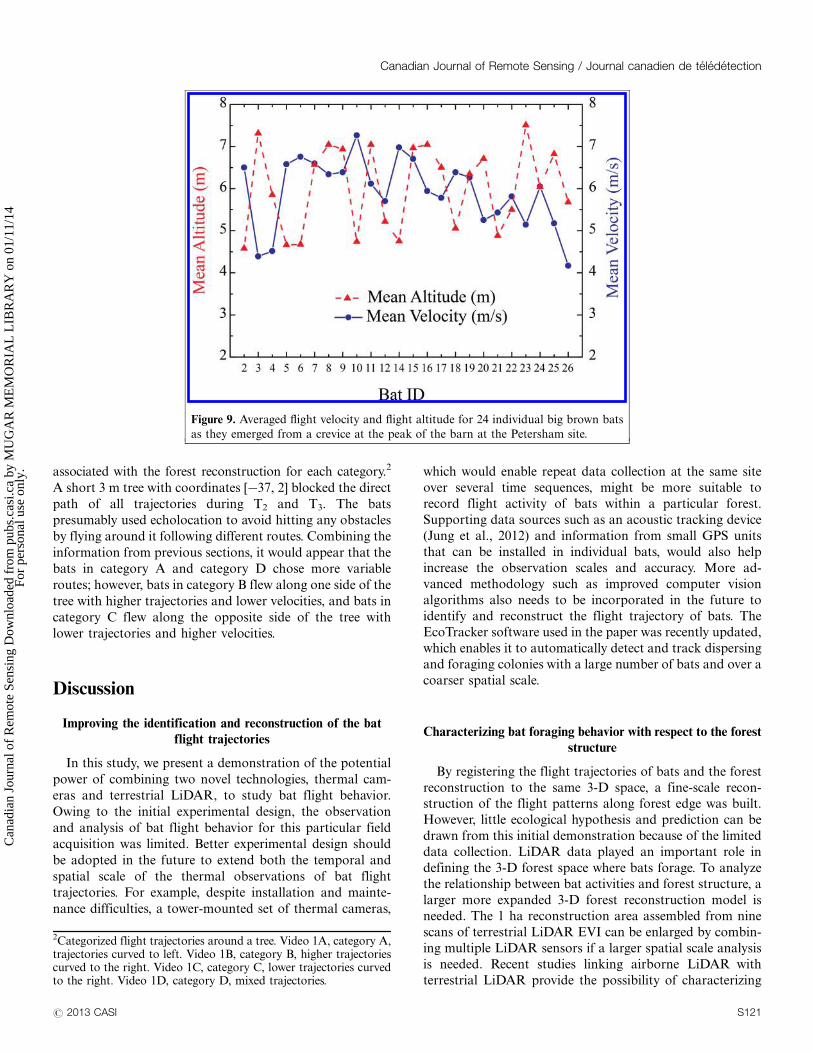
The average velocity after T1 of emergence for the whole
bat group is 5.9 m/s and the average flight altitude for the
whole bat group is 6 m, which corresponds to the average
height of the forest canopy (6.5 m). T1 of the emergence was
excluded from the calculation to emphasize the difference
between individual bats (Figure 9).
Categorized bat flight patterns
The 24 flight trajectories can be grouped into four
categories with different flight patterns based on the 3-D
bat trajectory-forest registration shown in Figure 6: (A)
trajectories that curved to left of the flight direction (bats 4,
12, 22, 16); (B) high trajectories that curved to the right of
the flight direction (bats 7, 8. 9, 15, 16, 17, 20, 23, 24, 25);
(C) low trajectories that curved to the right of the flightdirection (bats 2, 5, 6, 10, 14, 19, 21); and (D) mixed
trajectories (bats 3, 11, and 18).
The flight altitude showed a systematic behavior between
different categories (Figure 10). Category A and category C
Figure 7. (A) Digital Elevation Model and (B) Canopy Height Model over the Petersham bat
site (units in metres). (Orange box is the selected region of interest.)
Canadian Journal of Remote Sensing / Journal canadien de teledetection
# 2013 CASI S119
Can
adia
n Jo
urna
l of
Rem
ote
Sens
ing
Dow
nloa
ded
from
pub
s.ca
si.c
a by
MU
GA
R M
EM
OR
IAL
LIB
RA
RY
on
01/1
1/14
For
pers
onal
use
onl
y.

trajectories dropped in altitude after T1 following emer-
gence. Category C trajectories increased in altitude during
T2, and then started to drop in altitude. Category D
trajectories were more unstable and displayed mixed beha-
viors. The velocity showed a less systematic behavior
between different categories: the velocity of category A
and category D trajectories became more variable after the
T1, whereas the variation of category B and category C
trajectories contained similar trends within the category.
Bats in category B slowed down during T2 and then speeded
up during T3. The category C bats generally slowed down
during T2 and T3. Both the flight altitude and the velocity
became unpredictable after T3.
The behaviorof the bats during the first five seconds after their
appearance can be generalized based on the above information
as: T1, sped up and dropped height; T2, slowed and adjusted
flight direction; T3, slowed further down or sped up while
continuing to drop in height; and T4 and T5, spread to forest.
Flight pattern to avoid obstacles
The registration of bat flight trajectories and 3-D forest
reconstruction enabled us to examine the initial bat flight
trajectories in fine detail. Videos available at ftp://crsos.bu.
edu/geog-grad/xiaoyuan/bat_movies/ show the bat trajectories
Figure 8. Properties of flight paths of 24 big brown bats that emerged from a small
crevice located at the peak of the barn. (A) Flight velocity vs. time; (B) flight
altitude vs. time.
Vol. 39, No. S1, Suppl. 1 2013
S120 # 2013 CASI
Can
adia
n Jo
urna
l of
Rem
ote
Sens
ing
Dow
nloa
ded
from
pub
s.ca
si.c
a by
MU
GA
R M
EM
OR
IAL
LIB
RA
RY
on
01/1
1/14
For
pers
onal
use
onl
y.
associated with the forest reconstruction for each category.2
A short 3 m tree with coordinates [�37, 2] blocked the direct
path of all trajectories during T2 and T3. The bats
presumably used echolocation to avoid hitting any obstacles
by flying around it following different routes. Combining the
information from previous sections, it would appear that the
bats in category A and category D chose more variable
routes; however, bats in category B flew along one side of the
tree with higher trajectories and lower velocities, and bats in
category C flew along the opposite side of the tree with
lower trajectories and higher velocities.
Discussion
Improving the identification and reconstruction of the bat
flight trajectories
In this study, we present a demonstration of the potential
power of combining two novel technologies, thermal cam-
eras and terrestrial LiDAR, to study bat flight behavior.
Owing to the initial experimental design, the observation
and analysis of bat flight behavior for this particular field
acquisition was limited. Better experimental design should
be adopted in the future to extend both the temporal and
spatial scale of the thermal observations of bat flight
trajectories. For example, despite installation and mainte-
nance difficulties, a tower-mounted set of thermal cameras,
which would enable repeat data collection at the same site
over several time sequences, might be more suitable to
record flight activity of bats within a particular forest.
Supporting data sources such as an acoustic tracking device
(Jung et al., 2012) and information from small GPS units
that can be installed in individual bats, would also help
increase the observation scales and accuracy. More ad-
vanced methodology such as improved computer vision
algorithms also needs to be incorporated in the future to
identify and reconstruct the flight trajectory of bats. The
EcoTracker software used in the paper was recently updated,
which enables it to automatically detect and track dispersing
and foraging colonies with a large number of bats and over a
coarser spatial scale.
Characterizing bat foraging behavior with respect to the forest
structure
By registering the flight trajectories of bats and the forest
reconstruction to the same 3-D space, a fine-scale recon-
struction of the flight patterns along forest edge was built.
However, little ecological hypothesis and prediction can be
drawn from this initial demonstration because of the limited
data collection. LiDAR data played an important role in
defining the 3-D forest space where bats forage. To analyze
the relationship between bat activities and forest structure, a
larger more expanded 3-D forest reconstruction model is
needed. The 1 ha reconstruction area assembled from nine
scans of terrestrial LiDAR EVI can be enlarged by combin-
ing multiple LiDAR sensors if a larger spatial scale analysis
is needed. Recent studies linking airborne LiDAR with
terrestrial LiDAR provide the possibility of characterizing
Figure 9. Averaged flight velocity and flight altitude for 24 individual big brown bats
as they emerged from a crevice at the peak of the barn at the Petersham site.
2Categorized flight trajectories around a tree. Video 1A, category A,trajectories curved to left. Video 1B, category B, higher trajectoriescurved to the right. Video 1C, category C, lower trajectories curvedto the right. Video 1D, category D, mixed trajectories.
Canadian Journal of Remote Sensing / Journal canadien de teledetection
# 2013 CASI S121
Can
adia
n Jo
urna
l of
Rem
ote
Sens
ing
Dow
nloa
ded
from
pub
s.ca
si.c
a by
MU
GA
R M
EM
OR
IAL
LIB
RA
RY
on
01/1
1/14
For
pers
onal
use
onl
y.
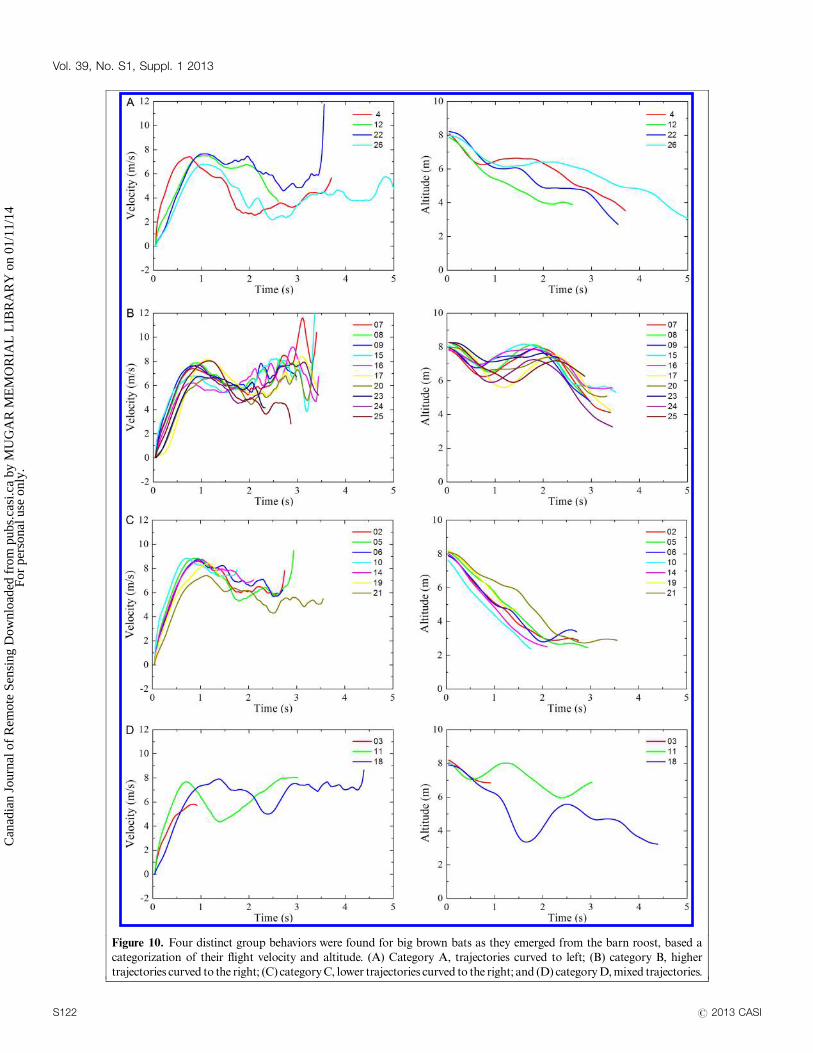
Figure 10. Four distinct group behaviors were found for big brown bats as they emerged from the barn roost, based a
categorization of their flight velocity and altitude. (A) Category A, trajectories curved to left; (B) category B, higher
trajectories curved to the right; (C) category C, lower trajectories curved to the right; and (D) category D, mixed trajectories.
Vol. 39, No. S1, Suppl. 1 2013
S122 # 2013 CASI
Can
adia
n Jo
urna
l of
Rem
ote
Sens
ing
Dow
nloa
ded
from
pub
s.ca
si.c
a by
MU
GA
R M
EM
OR
IAL
LIB
RA
RY
on
01/1
1/14
For
pers
onal
use
onl
y.
3-D forest structure over several square kilometres. For exam-
ple, Zhao et al. (2012) showed a general agreement between
foliage profiles retrieved from EVI 3-D reconstructions and
airborne Laser Vegetation Imaging Sensor foliage profiles.
Moreover, a simplified yet representative 3-D digital forest
model that can accurately characterize the distribution and
size of 3-D gaps is needed for the future. Researchers are
beginning to build similar models in the field of architecture
through surface reconstruction algorithms, e.g., Bolle and
Vemuri (1991); however, these applications are limited in
forest scenarios because of their more complex 3-D struc-
tures. Several commercial LiDAR scanners such as Riegl,
FARO, and Leica have been successfully used to scan forest
structures and natural landscapes with first returns (Bienert
et al., 2006; 2007; Fleck et al., 2007; Omasa et al., 2008;
Calders et al., 2011; Forbriger et al., 2012; Vaccari et al.,
2013). However, the application of these instruments is
limited over larger spatial areas (e.g., 1 ha) or for providing
complex foliage clumping and understory characteristics of a
densely vegetated multistory canopy. The full waveform
property of EVI, on the other hand, helps to identify and
characterize multiple scattering events along the entire path
of a laser pulse return; therefore, the EVI scans contain 3-D
gap information that can be used to derive important
structural parameters such as LAI, foliage profile, and
clumping (Strahler et al., 2008; Jupp et al., 2009a; Zhao
et al., 2011; 2012). Three-dimensional gap information is
essential for characterizing bat flight trajectories within the
canopy that allows more detailed study over bat foraging
behaviors. The comparison between field collected tree
densities and EVI retrieved tree densities in a New England
forest (Yao et al., 2011) also showed a high R2 value around
0.9. Thus, this technique of merging point clouds from
multiple LiDAR scans to reconstruct both individual trees
and entire stand segments provides more complete forest
structural information. In addition, 3-D forest reconstruc-
tion provides a more efficient way to acquire many types of
forest structural information with less effort and at a
potentially lower cost than standard inventory and measure-
ment methods (Yang et al., 2013). Therefore, a closer
examination of the structural information in 3-D forest
reconstructions, such as horizontal and vertical gaps, can
provide an improved representation of actual forest structure
for further bat foraging behavior studies.
Conclusion
In this paper, we explored an integrated methodology to
study how New England big brown bats (Eptesicus fuscus)
responded to forest clutter by combining two 3-D datasets: the
flight trajectories of bats recorded and reconstructed using
two FLIR ThermoVision SC8000 cameras and forest recon-
structions generated by full-waveform terrestrial LiDAR EVI.
The combination of the two 3-D datasets provided a fine-scale
reconstruction of the flight characteristics adjacent to and
within the forests. In future research, with improved
recording protocol with thermal cameras, additional and
longer bat flight trajectories can be obtained and studied
using this technology. Forest structure variables such as
height, canopy openness, gap length, understory, and
overstory foliage extracted from the digital forest model
represent future possibilities to study the larger scale
correlations between bat foraging behavior and forest
structure in species specific projects.
Acknowledgements
This research was supported by NASA grant NNG-
0GG192G, NSF grant DBI-0923389 and NSF grant IIS
0910908. The support is gratefully acknowledged. The
authors acknowledge Mr. James Baird of Petersham,
Mass., for making the site available for study and scanning
and thank the anonymous reviewers for critical comments.
ReferencesAbdel-Aziz, Y.I., and Karara, H.M. 1971. Direct linear transformation
from comparator coordinates into object space coordinates in close-
range photogrammetry. In American Society of Photogrammetry, Falls
Church, VA, USA. pp. 18.
Anderson, J., Martin, M.E., Smith, M.L., Dubayah, R.O., Hofton, M.A.,
Hyde, P., Peterson, B.E., Blair, J.B., and Knox, R.G. 2006. The use of
waveform LiDAR to measure northern temperate mixed conifer and
deciduous forest structure in New Hampshire. Remote Sensing of
Environment, Vol. 105, No. 3, pp. 248�261. doi: 10.1016/j.rse.2006.
07.001.
Anderson, J.E., Plourde, L.C., Martin, M.E., Braswell, B.H., Smith, M.L.,
Dubayah, R.O., Hofton, M.A., and Blair, J.B. 2008. Integrating wave-
form LiDAR with hyperspectral imagery for inventory of a northern
temperate forest. Remote Sensing of Environment, Vol. 112, No. 4, pp.
1856�1870. doi: 10.1016/j.rse.2007.09.009.
Bass, M.S., Finer, M., Jenkins, C.N., Kreft, H., Cisneros-Heredia, D.F.,
McCracken, S.F., Pitman, N.C.A., English, P.H., Swing, K., and Villa,
G. 2010. Global conservation significance of Ecuador’s Yasunı National
Park. PloS one, Vol. 5, No. 1, pp. e8767. doi: 10.1371/journal.pone.
0008767.
Bernard, E. 2001. Vertical stratification of bat communities in primary
forests of Central Amazon, Brazil. Journal of Tropical Ecology, Vol. 17,
No. 01, pp. 115�126. doi: 10.1017/S0266467401001079.
Betke, M., Hirsh, D.E., Bagchi, A., Hristov, N.I., Makris, N.C., and Kunz,
T.H. 2007. Tracking large variable numbers of objects in clutter. In IEEE
Computer Society Conference on Computer Vision and Pattern Recogni-
tion (CVPR), June, Minneapolis, MN, USA. pp. 8.
Betke, M., Hirsh, D.E., Makris, N.C., McCracken, G.F., Procopio, M.,
Hristov, N.I., Tang, S., Bagchi, A., Reichard, J.D., and Horn, J.W. 2008.
Thermal imaging reveals significantly smaller Brazilian free-tailed bat
colonies than previously estimated. Journal of Mammalogy, Vol. 89,
No. 1, pp. 18�24. doi: 10.1644/07-MAMM-A-011.1.
Betke, M., Wu, Z., Immermann, E., Theriault, D.H., and Permerlani, L.
2010. EcoTracker: Software to annotate thermal videos of bats by visual
Canadian Journal of Remote Sensing / Journal canadien de teledetection
# 2013 CASI S123
Can
adia
n Jo
urna
l of
Rem
ote
Sens
ing
Dow
nloa
ded
from
pub
s.ca
si.c
a by
MU
GA
R M
EM
OR
IAL
LIB
RA
RY
on
01/1
1/14
For
pers
onal
use
onl
y.

inspection, detect and track bats automatically, and reconstruct their
three-dimensional flight paths.
Bienert, A., Scheller, S., Keane, E., Mohan, F., and Nugent, C. 2007. Tree
detection and diameter estimations by analysis of forest terrestrial
laserscanner point clouds. In ISPRS WG III/3 III/4 V/3 VIII/11
Workshop on ‘‘Laser Scanning 2007 and SilviLaser 2007’’, 12�14 Sep,
2007, Espoo, Finland. pp. 50�55.
Bienert, A., Scheller, S., Keane, E., Mullooly, G., and Mohan, F. 2006.
Application of terrestrial laser scanners for the determination of forest
inventory parameters. In ISPRS Commission V Symposium on ‘‘Image
Engineering and Vision Metrology’’, 25�27 Sep, 2006, Dresden,
Germany. pp. Part 5.
Blair, J.B., Rabine, D.L., and Hofton, M.A. 1999. The laser vegetation
imaging sensor: a medium-altitude, digitisation-only, airborne laser
altimeter for mapping vegetation and topography. ISPRS Journal of
Photogrammetry and Remote Sensing, Vol. 54, No. 2, pp. 115�122. doi:
10.1016/S0924-2716(99)00002-7.
Bolle, R.M., and Vemuri, B.C. 1991. On three-dimensional surface
reconstruction methods. IEEE Transactions on Pattern Analysis and
Machine Intelligence, Vol. 13, No. 1, pp. 1�13. doi: 10.1109/34.67626.
Bonaccorso, F.J. 1979. Foraging and reproductive ecology in a Panamanian
bat community. Bulletin of the Florida State Museum, Vol. 24, No. 4, pp.
359�408.
Calders, K., Verbesselt, J., Bartholomeus, H.M., and Herold, M. 2011.
Applying terrestrial LiDAR to derive gap fraction distribution time
series during bud break. In Proceedings SilviLaser 2011, 11th interna-
tional LiDAR forest applications conference, 16�20 Oct. 2011, Tasmania,
Hobart, Tasmania
Cleveland, C.J., Betke, M., Federico, P., Frank, J.D., Hallam, T.G., Horn, J.,
Lopez Jr, J.D., McCracken, G.F., Medellın, R.A., and Moreno-Valdez,
A. 2006. Economic value of the pest control service provided by
Brazilian free-tailed bats in south-central Texas. Frontiers in Ecology
and the Environment, Vol. 4, No. 5, pp. 238�243. doi: 10.1890/1540-
9295(2006)004[0238:EVOTPC]2.0.CO;2.
Cryan, P., Diehl, R., Kunz, T.H., and Parsons, S. 2008. Analyzing bat
migration. In Ecological and behavioral methods for the study of bats.
Edited by T.H. Kunz, and S. Parsons. Johns Hopkins University Press,
Baltimore, Maryland, USA.
Culvenor, D.S., Jupp, D.L.B., Lovell, J.L., and Newnham, G.J. 2005.
Evaluation and validation of canopy laser radar systems for native and
plantation forest inventory � Summary Report (FWPRDC: PN 02.3902).
Forest & Wood Products Research & Development Corporation,
Melbourne.
Fenton, M.B. 1990. The foraging behavior and ecology of animal-eating
bats. Canadian Journal of Zoology, Vol. 68, No. 3, pp. 411�422. doi:
10.1139/z90-061.
Fleck, S., Obertreiber, N., Schmidt, I., Braunsa, M., Jungkunst, H.F., and
Leuschner, C. 2007. Terrestrial LiDAR measurements for analysing
canopy structure in an old-growth forest. In ISPRS WG III/3 III/4 V/3
VIII/11 Workshop on ‘‘Laser Scanning 2007 and SilviLaser 2007’’, 12�14
Sep, 2007, Espoo, Finland pp. 125�129.
FLIR 2005. The Ultimate Infrared Handbook for R&D Professionals. In
The Ultimate Resource Guide for Using Infrared in the Research and
Development Industry.
Forbriger, M., Hofle, B., Siart, C., Schittek, K., and Bubenzer, O. 2012.
High-resolution terrestrial laser scanning (TLS) on cushion peatlands-a
case study from the Peruvian Andes. In EGU General Assembly
Conference Abstracts. pp. 11485.
Gillam, E.H., McCracken, G.F., Westbrook, J.K., Lee, Y.F., Jensen, M.L.,
and Balsley, B.B. 2009. Bats aloft: variability in echolocation call
structure at high altitudes. Behavioral Ecology and Sociobiology,
Vol. 64, No. 1, pp. 69�79. doi: 10.1007/s00265-009-0819-1.
Hartley, R., and Zisserman, A. 2004. Multiple view geometry in computer
vision. 2nd edition. University Press, Cambridge.
Heithaus, E.R., Fleming, T.H., and Opler, P.A. 1975. Foraging patterns and
resource utilization in seven species of bats in a seasonal tropical forest.
Ecology, Vol. 56, No. 4, pp. 841�854. doi: 10.2307/1936295.
Hodgkison, R., Balding, S.T., Zubaid, A., and Kunz, T.H. 2003. Fruit bats
(Chiroptera: Pteropodidae) as seed dispersers and pollinators in a
lowland malaysian rain forest. Biotropica, Vol. 35, No. 4, pp. 491�502.
Holderied, M.W., and Jones, G. 2009. Flight dynamics. Ecological and
behavioral methods for the study of bats. Johns Hopkins University Press,
Baltimore, MD, USA, pp. 459�475.
Holderied, M.W., Korine, C., Fenton, M.B., Parsons, S., Robson, S., and
Jones, G. 2005. Echolocation call intensity in the aerial hawking bat
Eptesicus bottae (Vespertilionidae) studied using stereo videogrammetry.
Journal of Experimental Biology, Vol. 208, pp. 1321�1327. doi: 10.1242/
jeb.01528.
Hristov, N.I., Betke, M., and Kunz, T.H. 2008. Applications of thermal
infrared imaging for research in aeroecology. Integrative and Compara-
tive Biology, Vol. 48, No. 1, pp. 50. doi: 10.1093/icb/icn053.
Hristov, N.I., Betke, M., Theriault, D.E.H., Bagchi, A., and Kunz, T.H.
2010. Seasonal variation in colony size of Brazilian free-tailed bats at
Carlsbad Cavern based on thermal imaging. Journal of Mammalogy, Vol.
91, No. 1, pp. 183�192. doi: 10.1644/08-MAMM-A-391R.1.
Jung, K., Kaiser, S., Bohm, S., Nieschulze, J., and Kalko, E.K. 2012.
Moving in three dimensions: effects of structural complexity on
occurrence and activity of insectivorous bats in managed forest stands.
Journal of Applied Ecology, Vol. 49, No. 2, pp. 523�531. doi: 10.1111/
j.1365-2664.2012.02116.x.
Jupp, D.L.B., Culvenor, D.S., Lovell, J.L., Newnham, G.J., Strahler, A.H.,
and Woodcock, C.E. 2009a. Estimating forest LAI profiles and structural
parameters using a ground-based laser called ‘Echidna†
’. Tree Pysiology,
Vol. 29, No. 2, pp. 171�181. doi: 10.1093/treephys/tpn022.
Jupp, D.L.B., Culvenor, D.S., Lovell, J.L., Newnham, G.J., Strahler, A.H.,
and Woodcock, C.E. 2009b. Estimating forest LAI profiles and
structural parameters using a ground-based laser called ‘Echidna†’.
Tree physiology, Vol. 29, No. 2, pp. 171. doi: 10.1093/treephys/tpn022.
Kalko, E.K.V., and Handley, C.O. 2001. Neotropical bats in the canopy:
diversity, community structure, and implications for conservation. Plant
Ecology, Vol. 153, No. 1, pp. 319�333. doi: 10.1023/A:1017590007861.
Kastberger, G., and Stachl, R. 2003. Infrared imaging technology and
biological applications. Behavior Research Methods, Vol. 35, No. 3, pp.
429�439. doi: 10.3758/BF03195520.
Kimes, D.S., Ranson, K.J., Sun, G., and Blair, J.B. 2006. Predicting LiDAR
measured forest vertical structure from multi-angle spectral data.
Remote Sensing of Environment, Vol. 100, No. 4, pp. 503�511.
doi: 10.1016/j.rse.2005.11.004.
Krusic, R.A., Yamasaki, M., Neefus, C.D., and Pekins, P.J. 1996. Bat
habitat use in white mountain national forest. The Journal of Wildlife
Management, Vol. 60, No. 3, pp. 625�631. doi: 10.2307/3802081.
Vol. 39, No. S1, Suppl. 1 2013
S124 # 2013 CASI
Can
adia
n Jo
urna
l of
Rem
ote
Sens
ing
Dow
nloa
ded
from
pub
s.ca
si.c
a by
MU
GA
R M
EM
OR
IAL
LIB
RA
RY
on
01/1
1/14
For
pers
onal
use
onl
y.

Kunz, T.H. 2004. Foraging habits of North American insectivorous bats.
Bat Echolocation Research: Tools, Techniques, and Analysis. Edited by
R.M. Brigham, E.K.V. Kalko, G. Jones, S. Parsons, and H.J.G.A.
Limpens. Bat Conservation International, Austin, TX. pp. 13�25.
Kunz, T.H., Gauthreaux, S.A., Hristov, N.I., Horn, J.W., Jones, G., Kalko,
E.K.V., Larkin, R.P., McCracken, G.F., Swartz, S.M., and Srygley, R.B.
2008. Aeroecology: probing and modeling the aerosphere. Integrative
and Comparative Biology, Vol. 48, No. 1, pp. 1. doi: 10.1093/icb/icn037.
Kurta, A., and Baker, R.H. 1990. Eptesicus fuscus. Mammalian Species,
No. 356, pp. 1�10. doi: 10.2307/3504258.
Lacki, M.J., Hayes, J.P., and Kurta, A. 2007. Bats in forests: conservation
and management. Johns Hopkins University Press, Baltimore.
Meyer, C.F.J., Kalko, E.K.V., and Kerth, G. 2009. Small scale fragmenta-
tion effects on local genetic diversity in two phyllostomid bats with
different dispersal abilities in Panama. Biotropica, Vol. 41, No. 1, pp. 95�102. doi: 10.1111/j.1744-7429.2008.00443.x.
Omasa, K., Hosoi, F., Uenishi, T.M., Shimizu, Y., and Akiyama, Y. 2008.
Three-dimensional modeling of an urban park and trees by combined
airborne and portable on-ground scanning LiDAR remote sensing.
Environmental Modeling and Assessment, Vol. 13, No. 4, pp. 473�481.
doi: 10.1007/s10666-007-9115-5.
Parker, G.G., and Brown, M.J. 2000. Forest canopy stratification*is it
useful? American Naturalist, Vol. 155, No. 4, pp. 473�484. doi: 10.1086/
303340.
Parsons, S., and Szewczak, J.M. 2009. Detecting, recording, and analyzing
the vocalizations of bats. In Ecological and Behavioral Methods for the
Study of Bats. 2nd edition. Edited by T.H. Kunz, and S. Parsons. Johns
Hopkins University Press, Baltimore.
Schnitzler, H.U., and Kalko, E.K.V. 1998. How echolocating bats search
and find food. Bat biology and conservation. Edited by T.H. Kunz and
P.A. Racey. Smithsonian Institution Press, Washington, DC. pp. 183�196.
Schull, M.A., Ganguly, S., Samanta, A., Huang, D., Shabanov, N.V.,
Jenkins, J.P., Chiu, J.C., Marshak, A., Blair, J.B., and Myneni, R.B. 2007.
Physical interpretation of the correlation between multi-angle spectral
data and canopy height. Geophysical Research Letters, Vol. 34, No. 18,
pp. L18405. doi: 10.1029/2007GL031143.
Simmons, J.A. 2005. Big brown bats and June beetles: multiple pursuit
strategies in a seasonal acoustic predator�prey system. Acoustics
Research Letters Online, Vol. 6, pp. 238. doi: 10.1121/1.1985957.
Strahler, A.H., Jupp, D.L.B., Woodcock, C.E., Schaaf, C.B., Yao, T., Zhao,
F., Yang, X., Lovell, J.L., Culvenor, D.S., Newnham, G.J., Ni-miester,
W., and Boykin-morris, W. 2008. Retrieval of forest structural para-
meters using a ground-based LiDAR instrument (Echidna†
). Canadian
Journal of Remote Sensing, Vol. 34, pp. 5426�5440. doi: 10.5589/m08-
046.
Strahler, A.H., Woodcock, C.E., Schaaf, C.B., Myneni, R.B., Ni-Meister,
W., Liu, J., Newnham, G.J., Culvenor, D.S., Jupp, D.L.B., and Lovell,
J.L. 2007. Rapid retrieval of forest structure using an under-canopy,
upward-scanning LiDAR (Echina†). Eos, Transactions. American
Geophysical Union Fall Meeting, Vol. 88, p. 52.
Strahler, A.H., Yao, T., Zhao, F., and Yang, X. 2009. Vegetation structure
and 3-D reconstruction of forests using ground-based Echidna†
LiDAR. Eos, Transactions. American Geophysical Union Fall Meeting,
Vol. 90, p. 52.
Theriault, D.H., Wu, Z., Hristov, N.I., Swartz, S.M., Breuer, K.S., Kunz,
T.H., and Betke, M. 2010. Reconstruction and analysis of 3D
trajectories of Brazilian free-tailed bats in flight. In Computer Science
Technique Report BUCS-TR-2010-027 (pp. 1�7): Boston Univeristy,
Boston, Mass.
Thies, W., and Kalko, E.K.V. 2004. Phenology of neotropical pepper plants
(Piperaceae) and their association with their main dispersers, two short-
tailed fruit bats, Carollia perspicillata and C. castanea (Phyllostomidae).
Oikos, Vol. 104, No. 2, pp. 362�376. doi: 10.1111/j.0030-1299.2004.
12747.x.
Thies, W., Kalko, E.K.V., and Schnitzler, H.U. 2006. Influence of
environment and resource availability on activity patterns of Carollia
castanea (Phyllostomidae) in Panama. Journal of Mammalogy, Vol. 87,
No. 2, pp. 331�338. doi: 10.1644/05-MAMM-A-161R1.1.
Vaccari, S., van Leeuwen, M., Calders, K., Coops, N.C., and Herold, M.
2013. Bias in LiDAR-based canopy gap fraction estimates. Remote
Sensing Letters, Vol. 4, No. 4, pp. 391�399. doi: 10.1080/2150704X.
2012.742211.
Weinbeer, M., and Kalko, E.K.V. 2004. Morphological characteristics
predict alternate foraging strategy and microhabitat selection in the
orange bellied bat, Lampronycteris brachyotis. Journal of Mammalogy,
Vol. 85, No. 6, pp. 1116�1123. doi: 10.1644/BWG-206.1.
Wu, Z., Hristov, N.I., Hedrick, T.L., Kunz, T.H., and Betke, M. 2009a.
Tracking a large number of objects from multiple views. In IEEE 12th
International Conference on Computer Vision (ICCV), September/
October, Kyoto Japan. pp. 8.
Wu, Z., Hristov, N.I., Kunz, T.H., and Betke, M. 2009b. Tracking-
reconstruction or reconstruction-tracking? Comparison of two multiple
hypothesis tracking approaches to interpret 3D object motion from
several camera views. In Proceedings of the IEEE Workshop on Motion
and Video Computing (WMVC) Snowbird, December, Utah. pp. 8.
Yang, X., Strahler, A.H., Schaaf, C.B., Jupp, D.L.B., Yao, T., Zhao, F.,
Wang, Z., Culvenor, D.S., Newnham, G.J., Lovell, J.L., Dubayah, R.O.,
woodcock, C.E., and Ni-Meister, W. 2013. Three-dimensional forest
reconstruction and structural parameter retrievals using a terrestrial full-
waveform LiDAR instrument (Echidna†). Remote Sensing of
Environment, Vol. 135, pp. 36�51. doi: 10.1016/j.rse.2013.03.020.
Yao, T., Yang, X., Zhao, F., Wang, Z., Zhang, Q., Jupp, D.L.B., Culvenor,
D.S., Newnham, G.J., Ni-Meister, W., Schaaf, C.B., Woodcock, C.E.,
and Strahler, A.H. 2011. Measuring forest structure and biomass in New
England forest stands using Echidna† ground-based LiDAR. Remote
Sensing of Environment, Vol. 115, No. 11, pp. 2965�2974. doi: 10.1016/
j.rse.2010.03.019.
Zhao, F., Strahler, A.H., Schaaf, C.L., Yao, T., Yang, X., Wang, Z., Schull,
M.A., Roman, M.O., Woodcock, C.E., and Olofsson, P. 2012. Measur-
ing gap fraction, element clumping index and LAI in Sierra Forest
stands using a full-waveform ground-based LiDAR. Remote Sensing of
Environment, Vol. 125, pp. 73�79. doi: 10.1016/j.rse.2012.07.007.
Zhao, F., Yang, X., Schull, M.A., Roman, M., Yao, T., Wang, Z., Zhang, Q.,
Jupp, D.L.B., Culvenor, D.S., Newnham, G.J., Ni-Meister, W., Schaaf,
C.B., Woodcock, C.E., Strahler, A.H., and Richardson, A. 2011.
Measuring effective leaf area index, foliage profile, and stand height in
New England forest stands using Echidna†
Validation Instrument (EVI)
ground-based LiDAR. Remote Sensing of Environment, Vol. 115, No. 11,
pp. 2954�2964. doi: 10.1016/j.rse.2010.08.030.
Zimmerman, G.S., and Glanz, W.E. 2000. Habitat use by bats in eastern
Maine. The Journal of Wildlife Management, Vol. 64, No. 4, pp. 1032�1040. doi: 10.2307/3803214.
Canadian Journal of Remote Sensing / Journal canadien de teledetection
# 2013 CASI S125
Can
adia
n Jo
urna
l of
Rem
ote
Sens
ing
Dow
nloa
ded
from
pub
s.ca
si.c
a by
MU
GA
R M
EM
OR
IAL
LIB
RA
RY
on
01/1
1/14
For
pers
onal
use
onl
y.