study and reports on the vat gap in the eu-28 member states: … · cpc 42 customs procedure code...
TRANSCRIPT
Study and Reports on the VAT Gap in the EU-28 Member States:
2018 Final Report
TAXUD/2015/CC/131
Client: Directorate General Taxation and Customs Union
CASE – Center for Social and Economic Research (Project leader)
Institute for Advanced Studies (Consortium leader)
In consortium with
CPB IFS
DIW IPP
DONDENA PWC
ETLA ISER
IEB
Warsaw, September 11, 2018

VAT Gap in the EU-28 Member States
page 2 of 82
IHS, Institute for Advanced Studies
Josefstädter Straße 39
1060 Vienna
Austria
Telephone: +43 599 91-0
Telefax: +43 599 91 555
Internet: www.ihs.ac.at
FWC No. TAXUD/2015/CC/131
Acknowledgements
This Report was written by a team of experts from CASE (Center for Social and Economic
Research, Warsaw) and IEB (University of Barcelona – Barcelona Institute of Economics),
directed by Grzegorz Poniatowski, and composed of Mikhail Bonch-Osmolovskiy, José María
Durán-Cabré, Alejandro Esteller-Moré, and Adam Śmietanka. The Project was coordinated by
Thomas Davoine (Institute for Advanced Studies, IHS).
We also acknowledge discussions with several officials of tax and statistical offices of the
Member States, who offered valuable comments and suggestions. All responsibility for the
estimates and the interpretation in this Report remains with the authors.
VAT Gap in the EU-28 Member States
page 3 of 82
Contents
List of Acronyms and Abbreviations ................................................................................................. 7
Executive Summary .......................................................................................................................... 8
Introduction ...................................................................................................................................... 9
I. Background: Economic and Policy Context in 2016 ............................................................... 10
a. Economic Conditions in the EU during 2016 ...................................................................... 10
b. VAT Regime Changes .......................................................................................................... 12
c. Sources of Change in VAT Revenue Components .............................................................. 14
II. The VAT Gap in 2016 .............................................................................................................. 15
III. Individual Country Results .................................................................................................. 20
IV. Policy Gap Measures .......................................................................................................... 51
V. Econometric Analysis of VAT Gap Determinants ................................................................... 54
a. Literature Review ............................................................................................................... 54
b. Econometric Model and Estimation Results ...................................................................... 55
Annex A. Methodological Considerations ...................................................................................... 67
I. Source of Revisions of VAT Gap Estimates ......................................................................... 67
II. Decomposition of VAT Revenue ......................................................................................... 67
III. Data Sources and Estimation Method ............................................................................ 67
IV. Derivation of the Policy Gap ........................................................................................... 70
Annex B. Statistical Appendix ......................................................................................................... 74
References ...................................................................................................................................... 81
VAT Gap in the EU-28 Member States
page 4 of 82
List of Figures
Figure 1.1. Change in VAT Revenue Components (2016 over 2015, %) ........................................ 15
Figure 2.1. VAT Gap as a percent of the VTTL in EU-28 Member States, 2016 and 2015 ............. 16
Figure 2.2. Percentage Point Change in VAT Gap (2016 over 2015).............................................. 17
Figure 2.3. VAT Gap in EU Member States, 2011-2016 ................................................................. 18
Figure 5.1. Impact of Administrative Scale of the Tax Administration on VAT Gap, Contingent on
IT expenditure ................................................................................................................................ 66
Figure 5.2. Impact of IT on VAT Gap, Contingent on Tax Administration Scale ............................. 66
Figure A1. Components of Ideal Revenue, VTTL, and VAT Collection ........................................... 73
VAT Gap in the EU-28 Member States
page 5 of 82
List of Tables
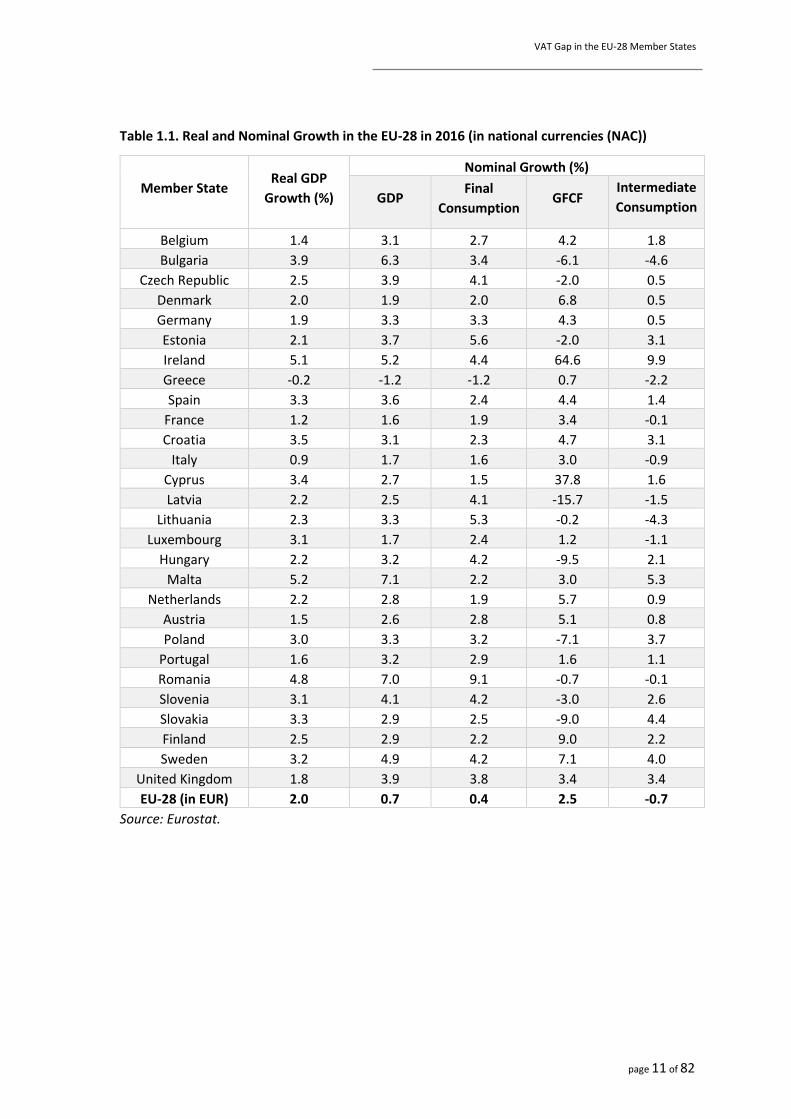
Table 1.1. Real and Nominal Growth in the EU-28 in 2016 (in national currencies (NAC)) ........... 11
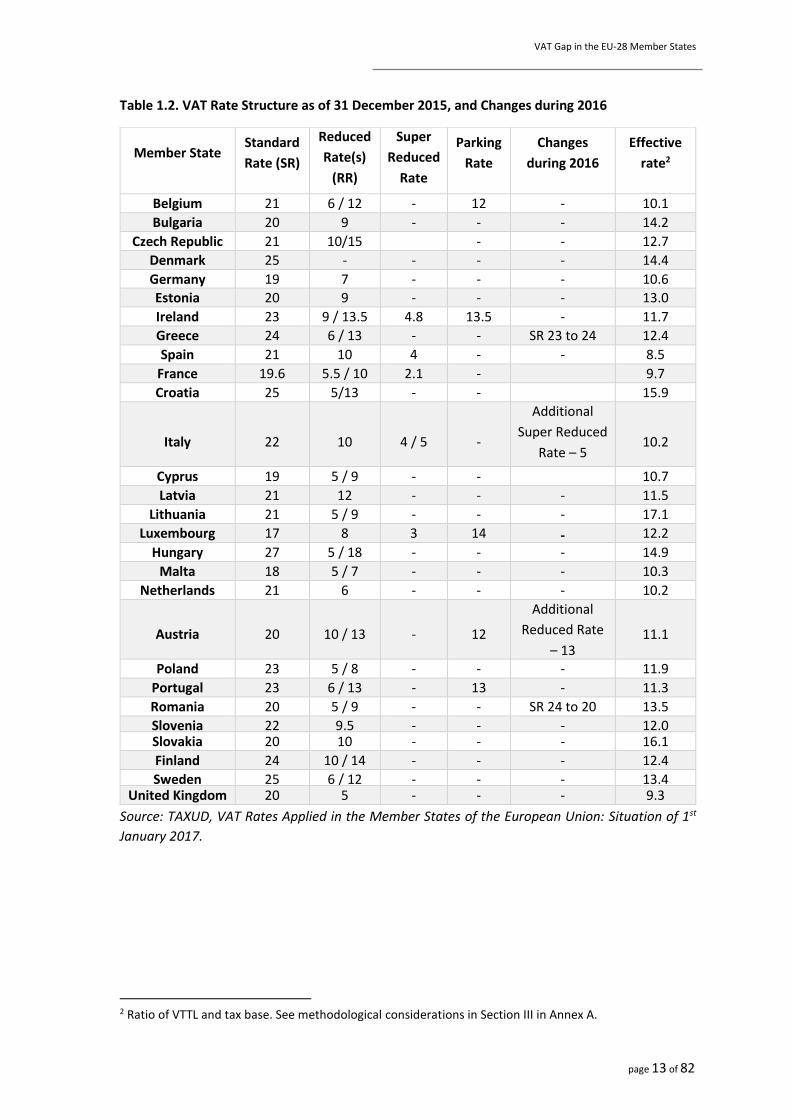
Table 1.2. VAT Rate Structure as of 31 December 2015, and Changes during 2016 ..................... 13
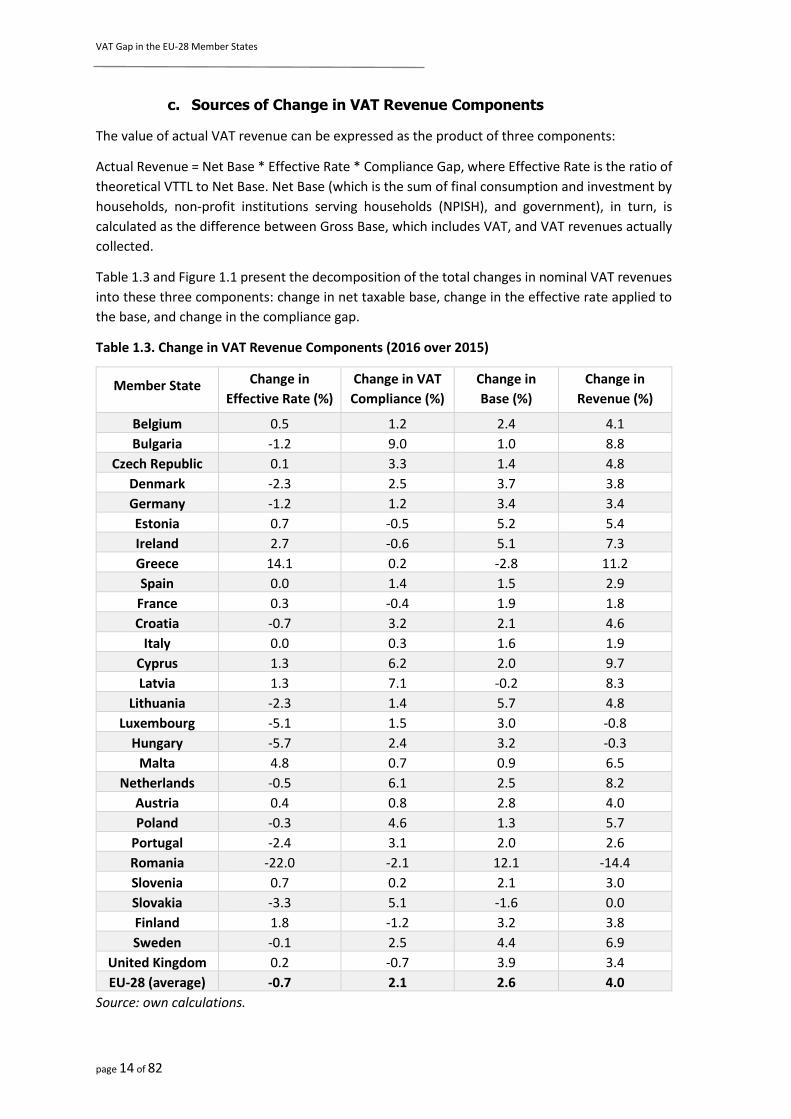
Table 1.3. Change in VAT Revenue Components (2016 over 2015) ............................................... 14
Table 3.1. Belgium: VAT Revenue, VTTL, Composition of VTTL, and VAT Gap, 2012-2016 (EUR
million) ............................................................................................................................................ 21
Table 3.2. Bulgaria: VAT Revenue, VTTL, Composition of VTTL, and VAT Gap, 2012-2016 (BGN
million) ............................................................................................................................................ 22
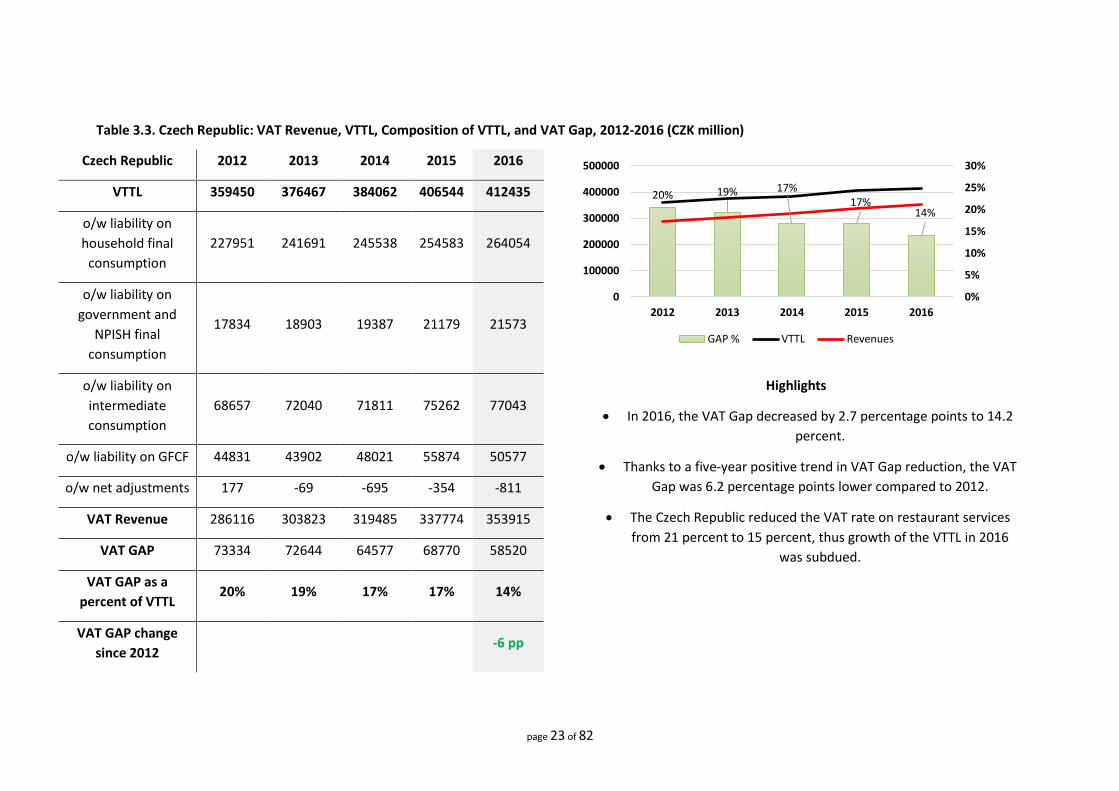
Table 3.3. Czech Republic: VAT Revenue, VTTL, Composition of VTTL, and VAT Gap, 2012-2016
(CZK million) ................................................................................................................................... 23
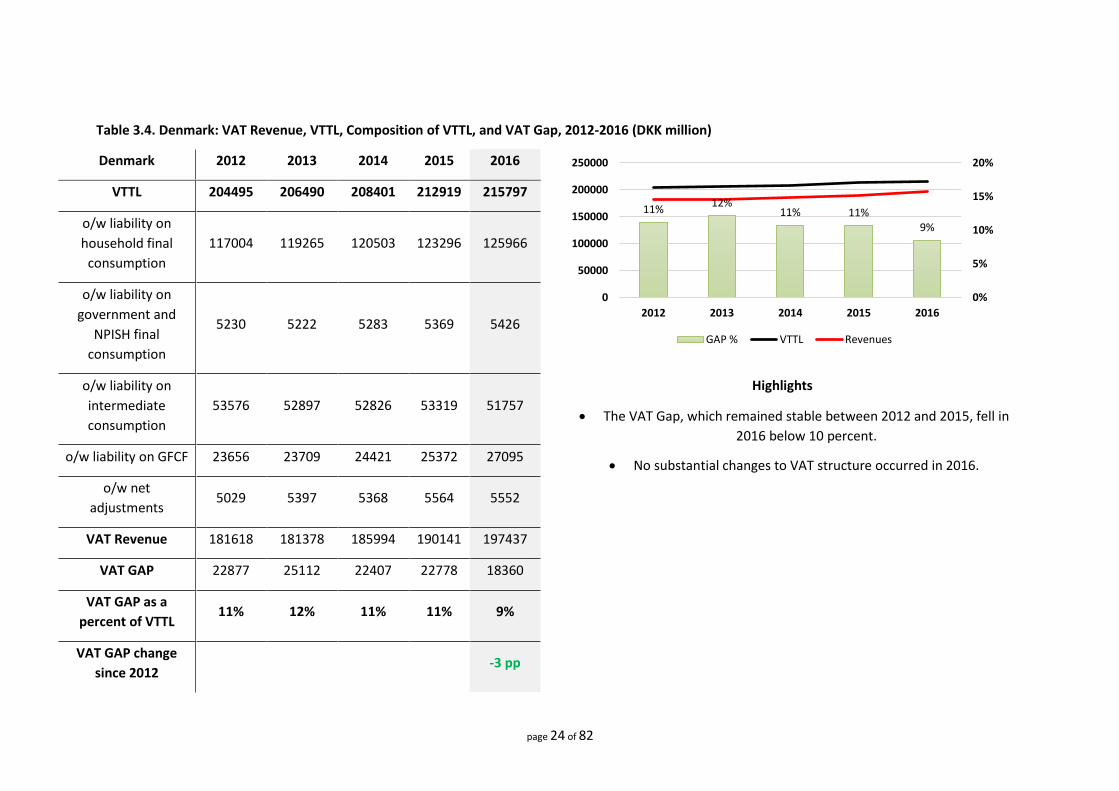
Table 3.4. Denmark: VAT Revenue, VTTL, Composition of VTTL, and VAT Gap, 2012-2016 (DKK
million) ............................................................................................................................................ 24
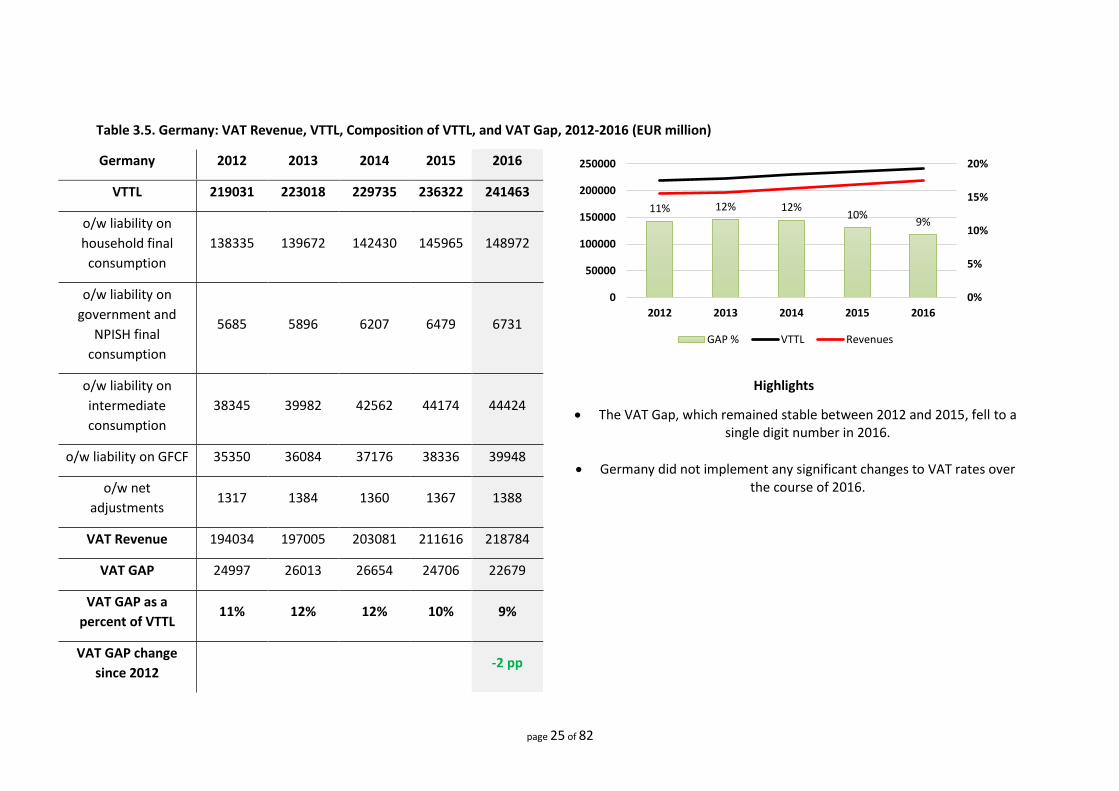
Table 3.5. Germany: VAT Revenue, VTTL, Composition of VTTL, and VAT Gap, 2012-2016 (EUR
million) ............................................................................................................................................ 25
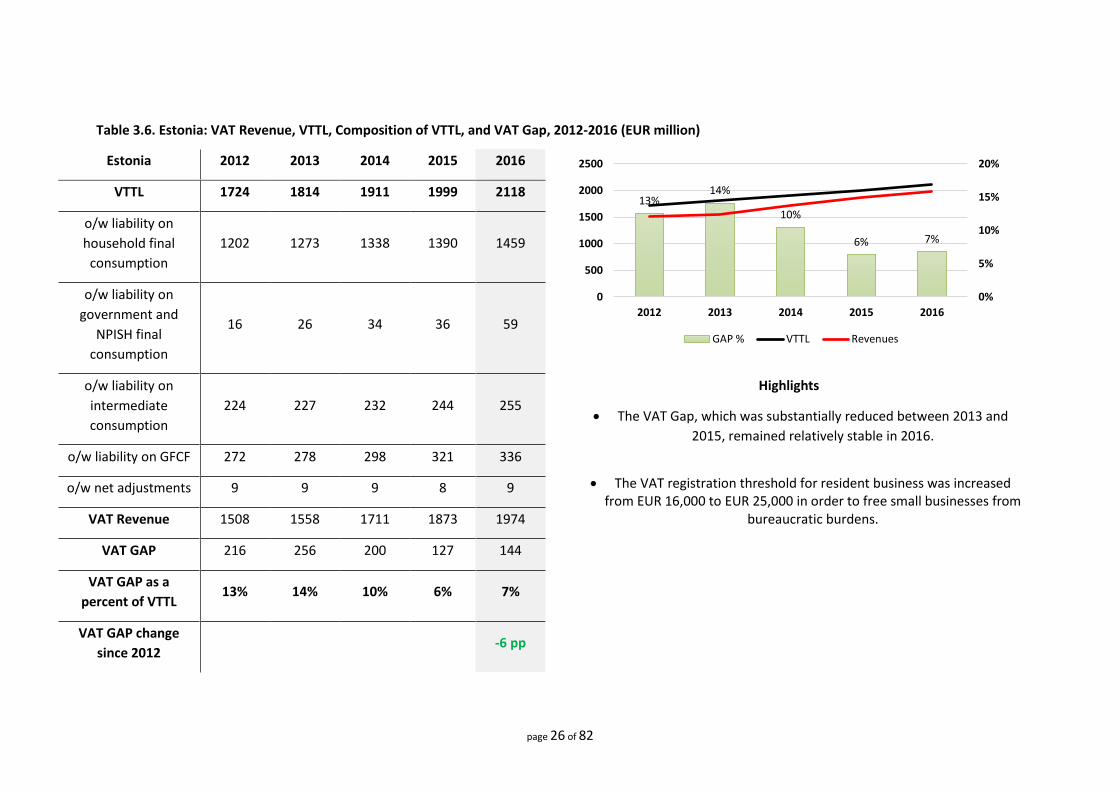
Table 3.6. Estonia: VAT Revenue, VTTL, Composition of VTTL, and VAT Gap, 2012-2016 (EUR
million) ............................................................................................................................................ 26
Table 3.7. Ireland: VAT Revenue, VTTL, Composition of VTTL, and VAT Gap, 2012-2016 (EUR
million) ............................................................................................................................................ 27
Table 3.8. Greece: VAT Revenue, VTTL, Composition of VTTL, and VAT Gap, 2012-2016 (EUR
million) ............................................................................................................................................ 28
Table 3.9a. Spain: VAT Revenue, VTTL, Composition of VTTL, and VAT Gap, 2012-2016 (EUR
million) ............................................................................................................................................ 29
Table 3.9b. Spain: Alternative Estimates ........................................................................................ 30
Table 3.10. France: VAT Revenue, VTTL, Composition of VTTL, and VAT Gap, 2012-2016 (EUR
million) ............................................................................................................................................ 31
Table 3.11. Croatia: VAT Revenue, VTTL, Composition of VTTL, and VAT Gap, 2014-2016 (HRK
million) ............................................................................................................................................ 32
Table 3.12a. Italy: VAT Revenue, VTTL, Composition of VTTL, and VAT Gap, 2012-2016 (EUR
million) ............................................................................................................................................ 33
Table 3.12b. Italy: Alternative Estimates ........................................................................................ 34
Table 3.13. Cyprus: VAT Revenue, VTTL, Composition of VTTL, and VAT Gap, 2015-2016 (EUR
million) ............................................................................................................................................ 35
Table 3.14. Latvia: VAT Revenue VTTL, Composition of VTTL, and VAT Gap, 2012-2016 (EUR
million) ............................................................................................................................................ 36
Table 3.15. Lithuania: VAT Revenue, VTTL, Composition of VTTL, and VAT Gap, 2012-2016 (EUR
million) ............................................................................................................................................ 37
Table 3.16. Luxembourg: VAT Revenue, VTTL, Composition of VTTL, and VAT Gap, 2012-2016
(EUR million) ................................................................................................................................... 38
Table 3.17. Hungary: VAT Revenue, VTTL, Composition of VTTL, and VAT Gap, 2012-2016 (HUF
million) ............................................................................................................................................ 39
Table 3.18. Malta: VAT Revenue, VTTL, Composition of VTTL, and VAT Gap, 2012-2016 (EUR
million) ............................................................................................................................................ 40
VAT Gap in the EU-28 Member States
page 6 of 82
Table 3.19. Netherlands: VAT Revenue, VTTL, Composition of VTTL, and VAT Gap, 2012-2016
(EUR million) .................................................................................................................................. 41
Table 3.20. Austria: VAT Revenue, VTTL, Composition of VTTL, and VAT Gap, 2012-2016 (EUR
million) ........................................................................................................................................... 42
Table 3.21. Poland: VAT Revenue VTTL, Composition of VTTL, and VAT Gap, 2012-2016 (PLN
million) ........................................................................................................................................... 43
Table 3.22. Portugal: VAT Revenue, VTTL, Composition of VTTL, and VAT Gap, 2012-2016 (EUR
million) ........................................................................................................................................... 44
Table 3.23. Romania: VAT Revenue, VTTL, Composition of VTTL, and VAT Gap, 2012-2016 (RON
million) ........................................................................................................................................... 45
Table 3.24. Slovenia: VAT Revenue, VTTL, Composition of VTTL, and VAT Gap, 2012-2016 (EUR
million) ........................................................................................................................................... 46
Table 3.25. Slovakia: VAT Revenue, VTTL, Composition of VTTL, and VAT Gap, 2012-2016 (EUR
million) ........................................................................................................................................... 47
Table 3.26. Finland: VAT Revenue, VTTL, Composition of VTTL, and VAT Gap, 2012-2016 (EUR
million) ........................................................................................................................................... 48
Table 3.27. Sweden: VAT Revenue, VTTL, Composition of VTTL, and VAT Gap, 2012-2016 (SEK
million) ........................................................................................................................................... 49
Table 3.28. United Kingdom: VAT Revenue, VTTL, Composition of VTTL, and VAT Gap, 2012-2016
(GBP million) .................................................................................................................................. 50
Table 4.1. Policy Gap, Rate Gap, Exemption Gap, and Actionable Gaps ....................................... 53
Table 5.1. Descriptive Statistics and Data Sources ........................................................................ 60
Table 5.2. Estimation of the Determinants of VAT GAP. Fixed Effects Specification..................... 64
Table A1. Data Sources .................................................................................................................. 69
Table B1. VTTL (EUR million) .......................................................................................................... 74
Table B2. Household VAT Liability (EUR million) ........................................................................... 75
Table B3. Intermediate Consumption and Government VAT Liability (EUR million) ..................... 76
Table B4. GFCF VAT Liability (EUR million) ..................................................................................... 77
Table B5. VAT Revenues (EUR million) ........................................................................................... 78
Table B6. VAT Gap (EUR million) .................................................................................................... 79
Table B7. VAT Gap (percent of VTTL) ............................................................................................. 80
VAT Gap in the EU-28 Member States
page 7 of 82
List of Acronyms and Abbreviations
CASE Center for Social and Economic Research (Warsaw)
COICOP Classification of Individual Consumption according to Purpose
CPA Statistical Classification of Products by Activity in accordance with Regulation (EC) No 451/2008 of the European Parliament and of the Council of 23 April 2008 establishing a new statistical classification of products by activity
CPC 42 Customs Procedure Code no. 42
EC European Commission
ECM European Common Market
EU European Union
EU-28 Current Member States of the European Union
GDP Gross Domestic Product
GFCF Gross Fixed Capital Formation
IC Intermediate Consumption
MTIC Missing Trader Intra Community
NAC National Currency
NPISH Non-Profit Institutions Serving Households
OECD Organisation for Economic Cooperation and Development
ORS Own Resource Submissions
o/w of which
RR Reduced Rate
SAF-T Standard Audit File for Tax
SR Standard Rate
SUT Supply and Use Tables
TAXUD Taxation and Customs Union Directorate-General of the European Commission
VAT Value Added Tax
VTTL VAT Total Tax Liability
VR VAT Revenue

VAT Gap in the EU-28 Member States
page 8 of 82
Executive Summary
This Study serves as the Final Report for the DG TAXUD TAXUD/2017/DE/329, “Study and Reports
on the VAT Gap in the EU-28 Member States”, which is a follow-up to the five reports published
between 2013 and 2017.
In this Report, the Authors present the new Value Added Tax (VAT) Gap estimates for 2016, as
well as updated estimates for 2012-2016. In addition to the analysis of the Compliance Gap, this
Report examines the Policy Gap in 2016 as well as the contribution that reduced rates and
exemptions made to the theoretical VAT revenue losses. Moreover, the Report contains an
econometric analysis of VAT Gap determinants, which is a novelty introduced from this year’s
Study.
In 2016, most European Union (EU) Member States (MS) saw positive tailwinds with a combined
real GDP growth of 2.0 percent. As a result of a growing base and increasing VAT compliance, VAT
revenue increased in all MS with three exceptions. Most pronounced is the case of Romania,
where VAT revenue decreased in response to reduction of the standard rate by four percentage
points. In nominal terms, in 2016, the VAT Gap in EU-28 MS fell below EUR 150 billion and
amounted to EUR 147.1 billion. In relative terms, the VAT Gap share of the VAT total tax liability
(VTTL) dropped to 12.3 percent from 13.2 percent in 2015, and is the lowest value in the analysed
period of 2012-2016. Denoted at the share of GDP, the VAT Gap in 2016 amounted to 0.99%
compared to 1.05% in 2015.
Of the EU-28, the VAT Gap share decreased in 22 countries and increased in six—namely,
Romania, Finland, the UK, Ireland, Estonia, and France. The biggest declines in the VAT Gap—of
over five percentage points—occurred in Bulgaria, Latvia, Cyprus, and the Netherlands. The
smallest Gaps were observed in Luxembourg (0.85 percent), Sweden (1.08 percent), and Croatia
(1.15 percent). The largest Gaps were registered in Romania (35.88 percent), Greece (29.22
percent), and Italy (25.90 percent). Overall, half of EU-28 MS recorded a Gap below 9.9 percent.
The Policy Gaps and its components remained stable. The average Policy Gap level was 44.8
percent, out of which 9.95 percentage points are due to the application of various reduced and
super-reduced rates (the Rate Gap). Countries with the most flat levels of rates in the EU,
according to the Rate Gap, are Denmark (0.93 percent) and Estonia (2.97 percent). The Exemption
Gap, or the average share of Ideal Revenue lost due to various exemptions, is, on average, 35
percent in the EU, whereas the Actionable Policy Gap—a combination of the Rate Gap and the
Actionable Exemption Gap—is, on average, 16.5 percent of the Notional Ideal Revenue.
The econometric analysis can be considered a successful first attempt at inferring the impact of
various determinants. Firstly, it can be observed that the productive structure of the economy
exerts an impact on the VAT Gap. The share of retailers has the strongest impact on the VAT Gap;
however, telecommunications, industry, and art also have a positive impact. Secondly, liquidity
constraints and the productive structure of the economy also play a role in determining VAT
compliance. The most interesting results have to do with the impact of the variables under the
direct control of the tax administration. We show that the impact of the size of the tax
administration and the VAT Gap is concave. On the contrary, in the case of IT expenditure, the
impact is convex, albeit small, until productivity vanishes when IT expenditure is about 9.8 percent
of the total expenditure of the tax administration.
VAT Gap in the EU-28 Member States
page 9 of 82
Introduction
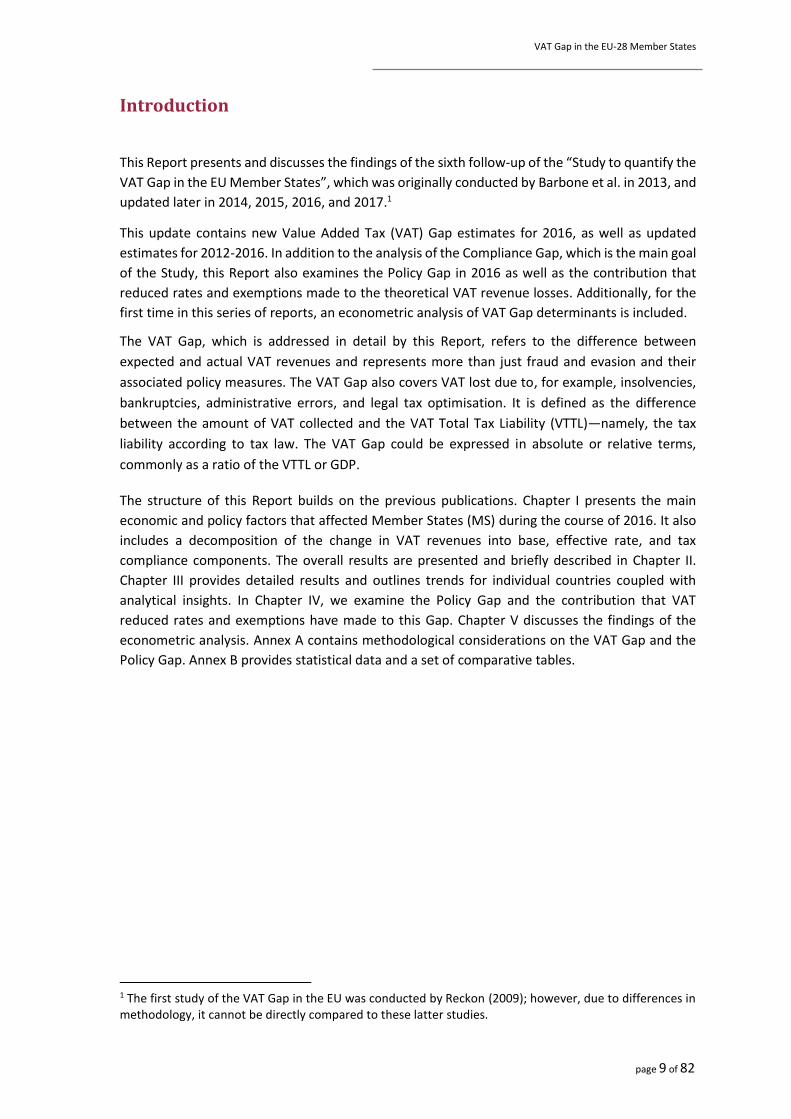
This Report presents and discusses the findings of the sixth follow-up of the “Study to quantify the
VAT Gap in the EU Member States”, which was originally conducted by Barbone et al. in 2013, and
updated later in 2014, 2015, 2016, and 2017.1
This update contains new Value Added Tax (VAT) Gap estimates for 2016, as well as updated
estimates for 2012-2016. In addition to the analysis of the Compliance Gap, which is the main goal
of the Study, this Report also examines the Policy Gap in 2016 as well as the contribution that
reduced rates and exemptions made to the theoretical VAT revenue losses. Additionally, for the
first time in this series of reports, an econometric analysis of VAT Gap determinants is included.
The VAT Gap, which is addressed in detail by this Report, refers to the difference between
expected and actual VAT revenues and represents more than just fraud and evasion and their
associated policy measures. The VAT Gap also covers VAT lost due to, for example, insolvencies,
bankruptcies, administrative errors, and legal tax optimisation. It is defined as the difference
between the amount of VAT collected and the VAT Total Tax Liability (VTTL)—namely, the tax
liability according to tax law. The VAT Gap could be expressed in absolute or relative terms,
commonly as a ratio of the VTTL or GDP.
The structure of this Report builds on the previous publications. Chapter I presents the main
economic and policy factors that affected Member States (MS) during the course of 2016. It also
includes a decomposition of the change in VAT revenues into base, effective rate, and tax
compliance components. The overall results are presented and briefly described in Chapter II.
Chapter III provides detailed results and outlines trends for individual countries coupled with
analytical insights. In Chapter IV, we examine the Policy Gap and the contribution that VAT
reduced rates and exemptions have made to this Gap. Chapter V discusses the findings of the
econometric analysis. Annex A contains methodological considerations on the VAT Gap and the
Policy Gap. Annex B provides statistical data and a set of comparative tables.
1 The first study of the VAT Gap in the EU was conducted by Reckon (2009); however, due to differences in methodology, it cannot be directly compared to these latter studies.
VAT Gap in the EU-28 Member States
page 10 of 82
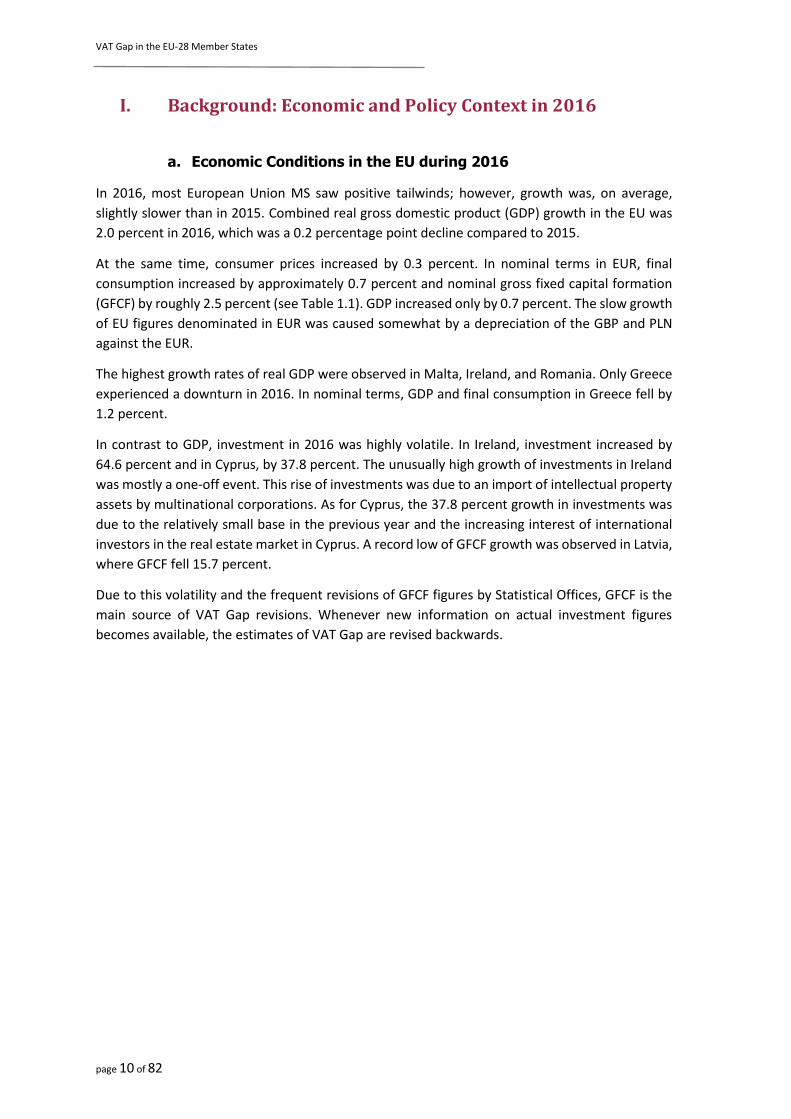
I. Background: Economic and Policy Context in 2016
a. Economic Conditions in the EU during 2016
In 2016, most European Union MS saw positive tailwinds; however, growth was, on average,
slightly slower than in 2015. Combined real gross domestic product (GDP) growth in the EU was
2.0 percent in 2016, which was a 0.2 percentage point decline compared to 2015.
At the same time, consumer prices increased by 0.3 percent. In nominal terms in EUR, final
consumption increased by approximately 0.7 percent and nominal gross fixed capital formation
(GFCF) by roughly 2.5 percent (see Table 1.1). GDP increased only by 0.7 percent. The slow growth
of EU figures denominated in EUR was caused somewhat by a depreciation of the GBP and PLN
against the EUR.
The highest growth rates of real GDP were observed in Malta, Ireland, and Romania. Only Greece
experienced a downturn in 2016. In nominal terms, GDP and final consumption in Greece fell by
1.2 percent.
In contrast to GDP, investment in 2016 was highly volatile. In Ireland, investment increased by
64.6 percent and in Cyprus, by 37.8 percent. The unusually high growth of investments in Ireland
was mostly a one-off event. This rise of investments was due to an import of intellectual property
assets by multinational corporations. As for Cyprus, the 37.8 percent growth in investments was
due to the relatively small base in the previous year and the increasing interest of international
investors in the real estate market in Cyprus. A record low of GFCF growth was observed in Latvia,
where GFCF fell 15.7 percent.
Due to this volatility and the frequent revisions of GFCF figures by Statistical Offices, GFCF is the
main source of VAT Gap revisions. Whenever new information on actual investment figures
becomes available, the estimates of VAT Gap are revised backwards.
VAT Gap in the EU-28 Member States
page 11 of 82
Table 1.1. Real and Nominal Growth in the EU-28 in 2016 (in national currencies (NAC))
Member State Real GDP
Growth (%)
Nominal Growth (%)
GDP Final
Consumption GFCF
Intermediate
Consumption
Consumption
Belgium 1.4 3.1 2.7 4.2 1.8
Bulgaria 3.9 6.3 3.4 -6.1 -4.6
Czech Republic 2.5 3.9 4.1 -2.0 0.5
Denmark 2.0 1.9 2.0 6.8 0.5
Germany 1.9 3.3 3.3 4.3 0.5
Estonia 2.1 3.7 5.6 -2.0 3.1
Ireland 5.1 5.2 4.4 64.6 9.9
Greece -0.2 -1.2 -1.2 0.7 -2.2
Spain 3.3 3.6 2.4 4.4 1.4
France 1.2 1.6 1.9 3.4 -0.1
Croatia 3.5 3.1 2.3 4.7 3.1
Italy 0.9 1.7 1.6 3.0 -0.9
Cyprus 3.4 2.7 1.5 37.8 1.6
Latvia 2.2 2.5 4.1 -15.7 -1.5
Lithuania 2.3 3.3 5.3 -0.2 -4.3
Luxembourg 3.1 1.7 2.4 1.2 -1.1
Hungary 2.2 3.2 4.2 -9.5 2.1
Malta 5.2 7.1 2.2 3.0 5.3
Netherlands 2.2 2.8 1.9 5.7 0.9
Austria 1.5 2.6 2.8 5.1 0.8
Poland 3.0 3.3 3.2 -7.1 3.7
Portugal 1.6 3.2 2.9 1.6 1.1
Romania 4.8 7.0 9.1 -0.7 -0.1
Slovenia 3.1 4.1 4.2 -3.0 2.6
Slovakia 3.3 2.9 2.5 -9.0 4.4
Finland 2.5 2.9 2.2 9.0 2.2
Sweden 3.2 4.9 4.2 7.1 4.0
United Kingdom 1.8 3.9 3.8 3.4 3.4
EU-28 (in EUR) 2.0 0.7 0.4 2.5 -0.7
Source: Eurostat.
VAT Gap in the EU-28 Member States
page 12 of 82
b. VAT Regime Changes
In 2016, no EU-wide changes in regulations affected the VTTL, as happened in 2015, when the new
rules for the taxation of electronic and digital services came into force.
Four MS implemented significant changes to the structure of their VAT rates. As of January 2016,
Romania reduced its standard rate from 24 to 20 percent. The change of the standard rate had a
substantial impact on the effective rate, which fell from 17.2 to 13.5 percent (see Table 1.2).
Greece raised the standard rate by one percentage point (from 23 to 24) as of July 2016. The
withdrawal of the 30 percent VAT rate discount from the last group of islands together with the
hike in the standard rate resulted in an approximately 1.5 percentage point increase in the
effective rate.
Moreover, two MS introduced new reduced rates. Italy introduced a reduced 5 percent VAT rate
for the provision of services carried out by social cooperatives. Austria implemented a new 13
percent VAT rate for select services—among others, domestic passenger air transport services,
admission fees for sport events, cinema shows, services of recreation and educational centres,
and the selling of wine directly from a farm.
VAT Gap in the EU-28 Member States
page 13 of 82
Table 1.2. VAT Rate Structure as of 31 December 2015, and Changes during 2016
Source: TAXUD, VAT Rates Applied in the Member States of the European Union: Situation of 1st
January 2017.
2 Ratio of VTTL and tax base. See methodological considerations in Section III in Annex A.
Member State Standard
Rate (SR)
Reduced
Rate(s)
(RR)
Super
Reduced
Rate
Parking
Rate
Changes
during 2016
Effective
rate2
Belgium 21 6 / 12 - 12 - 10.1
Bulgaria 20 9 - - - 14.2
Czech Republic 21 10/15 - - 12.7
Denmark 25 - - - - 14.4
Germany 19 7 - - - 10.6
Estonia 20 9 - - - 13.0
Ireland 23 9 / 13.5 4.8 13.5 - 11.7
Greece 24 6 / 13 - - SR 23 to 24 12.4
Spain 21 10 4 - - 8.5
France 19.6 5.5 / 10 2.1 - 9.7
Croatia 25 5/13 - - 15.9
Italy 22 10 4 / 5 -
Additional
Super Reduced
Rate – 5 10.2
Cyprus 19 5 / 9 - - 10.7
Latvia 21 12 - - - 11.5
Lithuania 21 5 / 9 - - - 17.1
Luxembourg 17 8 3 14 - 12.2
Hungary 27 5 / 18 - - - 14.9
Malta 18 5 / 7 - - - 10.3
Netherlands 21 6 - - - 10.2
Austria 20 10 / 13 - 12
Additional
Reduced Rate
– 13 11.1
Poland 23 5 / 8 - - - 11.9
Portugal 23 6 / 13 - 13 - 11.3
Romania 20 5 / 9 - - SR 24 to 20 13.5
Slovenia 22 9.5 - - - 12.0 Slovakia 20 10 - - - 16.1
Finland 24 10 / 14 - - - 12.4
Sweden 25 6 / 12 - - - 13.4 United Kingdom 20 5 - - - 9.3
VAT Gap in the EU-28 Member States
page 14 of 82
c. Sources of Change in VAT Revenue Components
The value of actual VAT revenue can be expressed as the product of three components:
Actual Revenue = Net Base * Effective Rate * Compliance Gap, where Effective Rate is the ratio of
theoretical VTTL to Net Base. Net Base (which is the sum of final consumption and investment by
households, non-profit institutions serving households (NPISH), and government), in turn, is
calculated as the difference between Gross Base, which includes VAT, and VAT revenues actually
collected.
Table 1.3 and Figure 1.1 present the decomposition of the total changes in nominal VAT revenues
into these three components: change in net taxable base, change in the effective rate applied to
the base, and change in the compliance gap.
Table 1.3. Change in VAT Revenue Components (2016 over 2015)
Member State Change in
Effective Rate (%)
Change in VAT
Compliance (%)
Change in
Base (%)
Change in
Revenue (%)
Belgium 0.5 1.2 2.4 4.1
Bulgaria -1.2 9.0 1.0 8.8
Czech Republic 0.1 3.3 1.4 4.8
Denmark -2.3 2.5 3.7 3.8
Germany -1.2 1.2 3.4 3.4
Estonia 0.7 -0.5 5.2 5.4
Ireland 2.7 -0.6 5.1 7.3
Greece 14.1 0.2 -2.8 11.2
Spain 0.0 1.4 1.5 2.9
France 0.3 -0.4 1.9 1.8
Croatia -0.7 3.2 2.1 4.6
Italy 0.0 0.3 1.6 1.9
Cyprus 1.3 6.2 2.0 9.7
Latvia 1.3 7.1 -0.2 8.3
Lithuania -2.3 1.4 5.7 4.8
Luxembourg -5.1 1.5 3.0 -0.8
Hungary -5.7 2.4 3.2 -0.3
Malta 4.8 0.7 0.9 6.5
Netherlands -0.5 6.1 2.5 8.2
Austria 0.4 0.8 2.8 4.0
Poland -0.3 4.6 1.3 5.7
Portugal -2.4 3.1 2.0 2.6
Romania -22.0 -2.1 12.1 -14.4
Slovenia 0.7 0.2 2.1 3.0
Slovakia -3.3 5.1 -1.6 0.0
Finland 1.8 -1.2 3.2 3.8
Sweden -0.1 2.5 4.4 6.9
United Kingdom 0.2 -0.7 3.9 3.4
EU-28 (average) -0.7 2.1 2.6 4.0
Source: own calculations.
VAT Gap in the EU-28 Member States
page 15 of 82
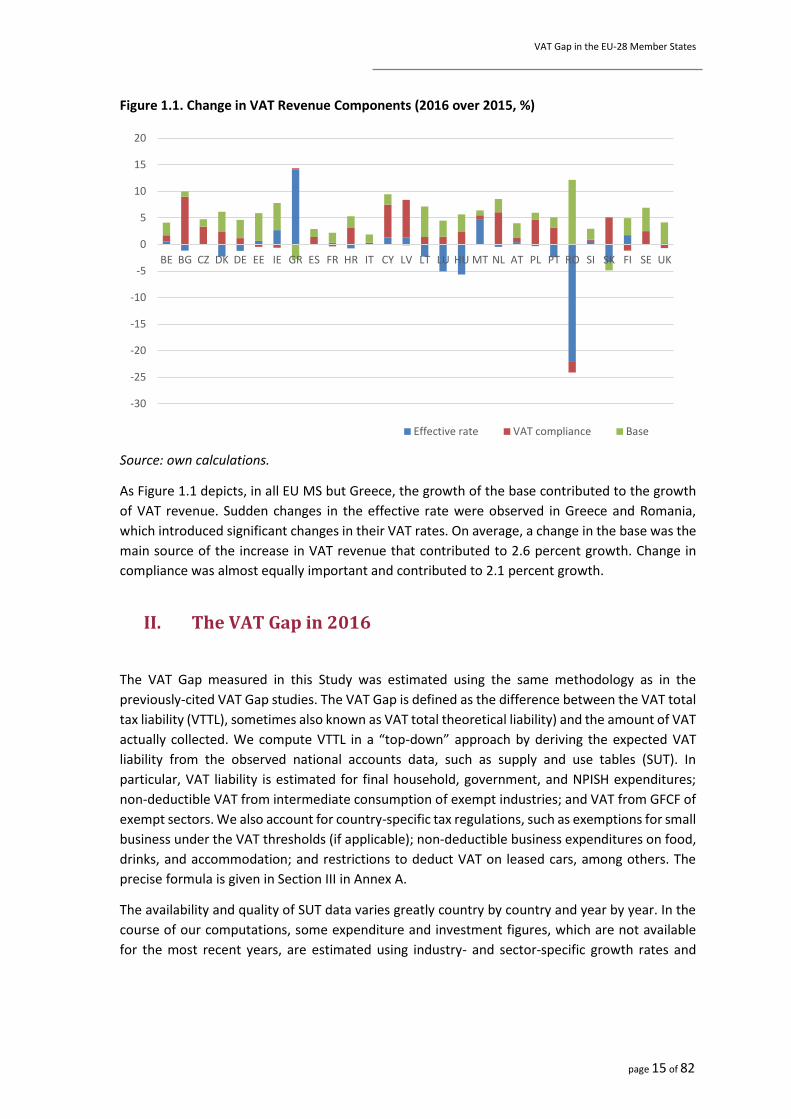
Figure 1.1. Change in VAT Revenue Components (2016 over 2015, %)
Source: own calculations.
As Figure 1.1 depicts, in all EU MS but Greece, the growth of the base contributed to the growth
of VAT revenue. Sudden changes in the effective rate were observed in Greece and Romania,
which introduced significant changes in their VAT rates. On average, a change in the base was the
main source of the increase in VAT revenue that contributed to 2.6 percent growth. Change in
compliance was almost equally important and contributed to 2.1 percent growth.
II. The VAT Gap in 2016
The VAT Gap measured in this Study was estimated using the same methodology as in the
previously-cited VAT Gap studies. The VAT Gap is defined as the difference between the VAT total
tax liability (VTTL), sometimes also known as VAT total theoretical liability) and the amount of VAT
actually collected. We compute VTTL in a “top-down” approach by deriving the expected VAT
liability from the observed national accounts data, such as supply and use tables (SUT). In
particular, VAT liability is estimated for final household, government, and NPISH expenditures;
non-deductible VAT from intermediate consumption of exempt industries; and VAT from GFCF of
exempt sectors. We also account for country-specific tax regulations, such as exemptions for small
business under the VAT thresholds (if applicable); non-deductible business expenditures on food,
drinks, and accommodation; and restrictions to deduct VAT on leased cars, among others. The
precise formula is given in Section III in Annex A.
The availability and quality of SUT data varies greatly country by country and year by year. In the
course of our computations, some expenditure and investment figures, which are not available
for the most recent years, are estimated using industry- and sector-specific growth rates and
-30
-25
-20
-15
-10
-5
0
5
10
15
20
BE BG CZ DK DE EE IE GR ES FR HR IT CY LV LT LU HU MT NL AT PL PT RO SI SK FI SE UK
Effective rate VAT compliance Base
VAT Gap in the EU-28 Member States
page 16 of 82
taxable shares. 3 This requires the frequent revision of previous estimates whenever actual
national accounts data is published or new information on taxable investment becomes available.
The exact sources of revisions of the estimates presented in the 2018 Report are described in
Section III in Annex A.
In nominal terms, in 2016, the VAT Gap in EU-28 MS fell below EUR 150 billion and amounted to
EUR 147.1 billion.4 The VTTL accounted for EUR 1,194.4 billion, whereas VAT revenue was EUR
1,047.3 billion. In relative terms, the VAT Gap share of the VTTL dropped to 12.3 percent, down
from 13.2 percent in 2015. It is the lowest value in the analysed period of 2012-2016.
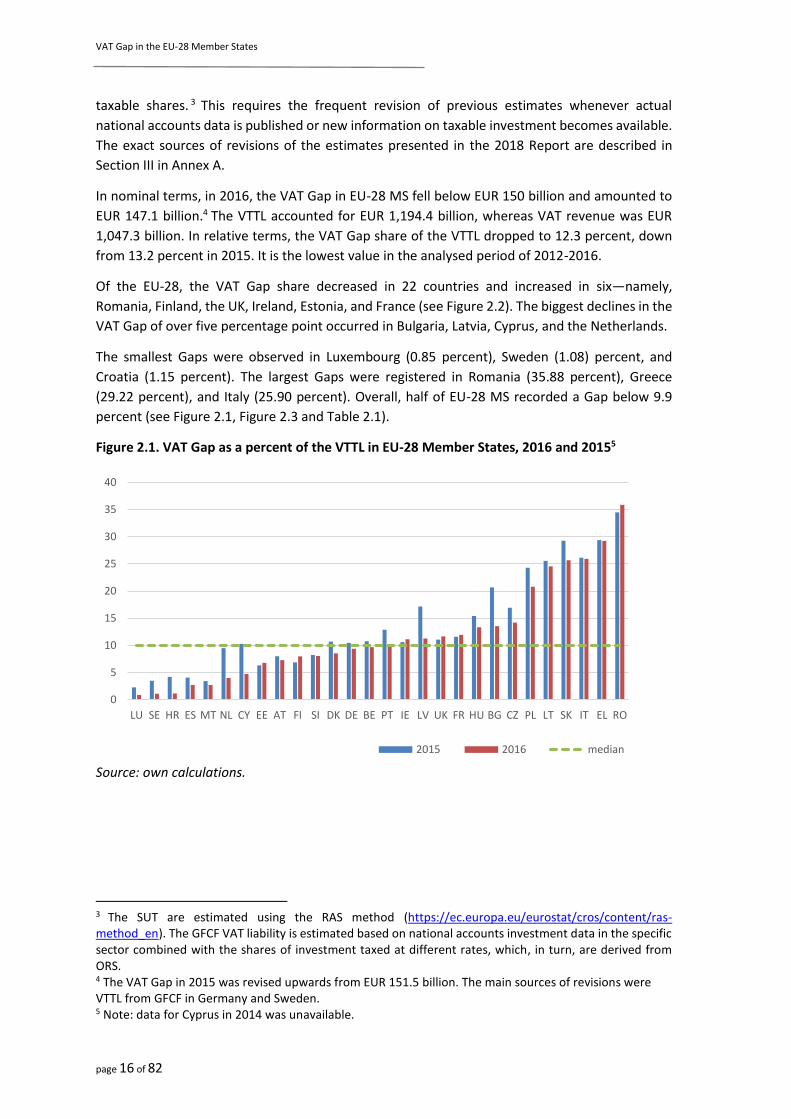
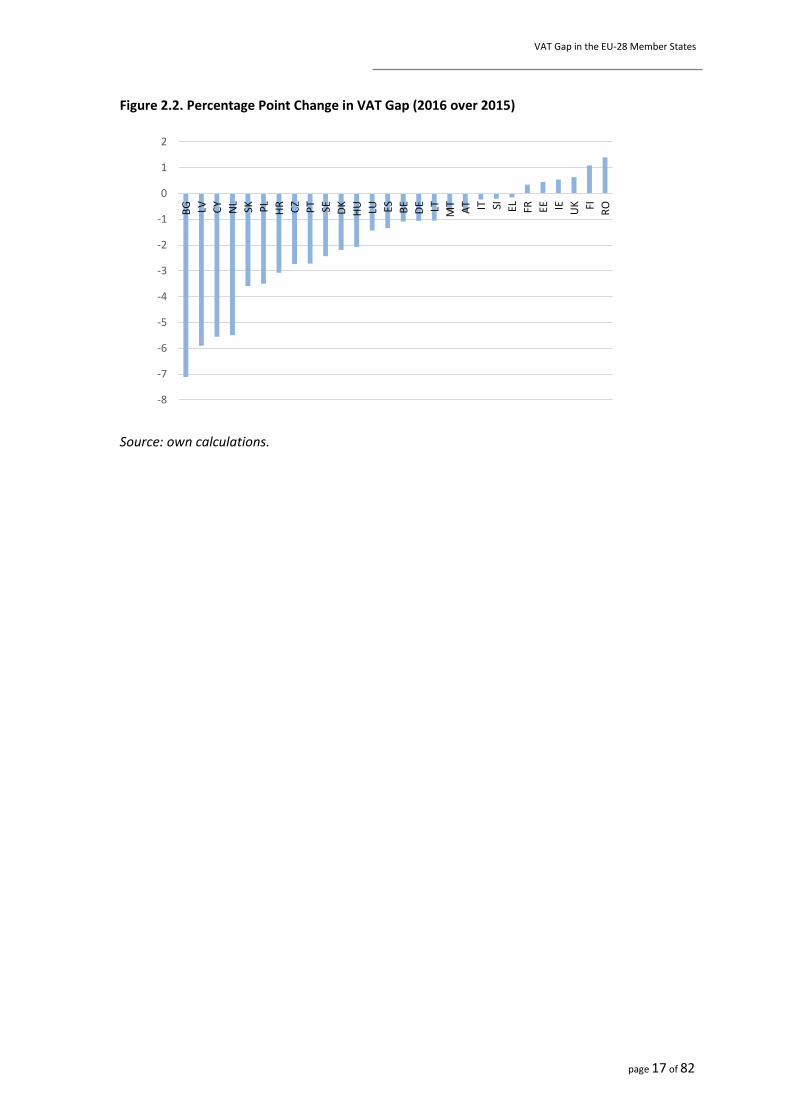
Of the EU-28, the VAT Gap share decreased in 22 countries and increased in six—namely,
Romania, Finland, the UK, Ireland, Estonia, and France (see Figure 2.2). The biggest declines in the
VAT Gap of over five percentage point occurred in Bulgaria, Latvia, Cyprus, and the Netherlands.
The smallest Gaps were observed in Luxembourg (0.85 percent), Sweden (1.08) percent, and
Croatia (1.15 percent). The largest Gaps were registered in Romania (35.88 percent), Greece
(29.22 percent), and Italy (25.90 percent). Overall, half of EU-28 MS recorded a Gap below 9.9
percent (see Figure 2.1, Figure 2.3 and Table 2.1).
Figure 2.1. VAT Gap as a percent of the VTTL in EU-28 Member States, 2016 and 20155
Source: own calculations.
3 The SUT are estimated using the RAS method (https://ec.europa.eu/eurostat/cros/content/ras-method_en). The GFCF VAT liability is estimated based on national accounts investment data in the specific sector combined with the shares of investment taxed at different rates, which, in turn, are derived from ORS. 4 The VAT Gap in 2015 was revised upwards from EUR 151.5 billion. The main sources of revisions were VTTL from GFCF in Germany and Sweden. 5 Note: data for Cyprus in 2014 was unavailable.
0
5
10
15
20
25
30
35
40
LU SE HR ES MT NL CY EE AT FI SI DK DE BE PT IE LV UK FR HU BG CZ PL LT SK IT EL RO
2015 2016 median
VAT Gap in the EU-28 Member States
page 17 of 82
Figure 2.2. Percentage Point Change in VAT Gap (2016 over 2015)
Source: own calculations.
-8
-7
-6
-5
-4
-3
-2
-1
0
1
2
BG LV CY
NL
SK PL
HR CZ
PT SE DK
HU LU ES BE
DE LT MT
AT IT SI EL FR EE IE UK FI RO
page 18 of 82
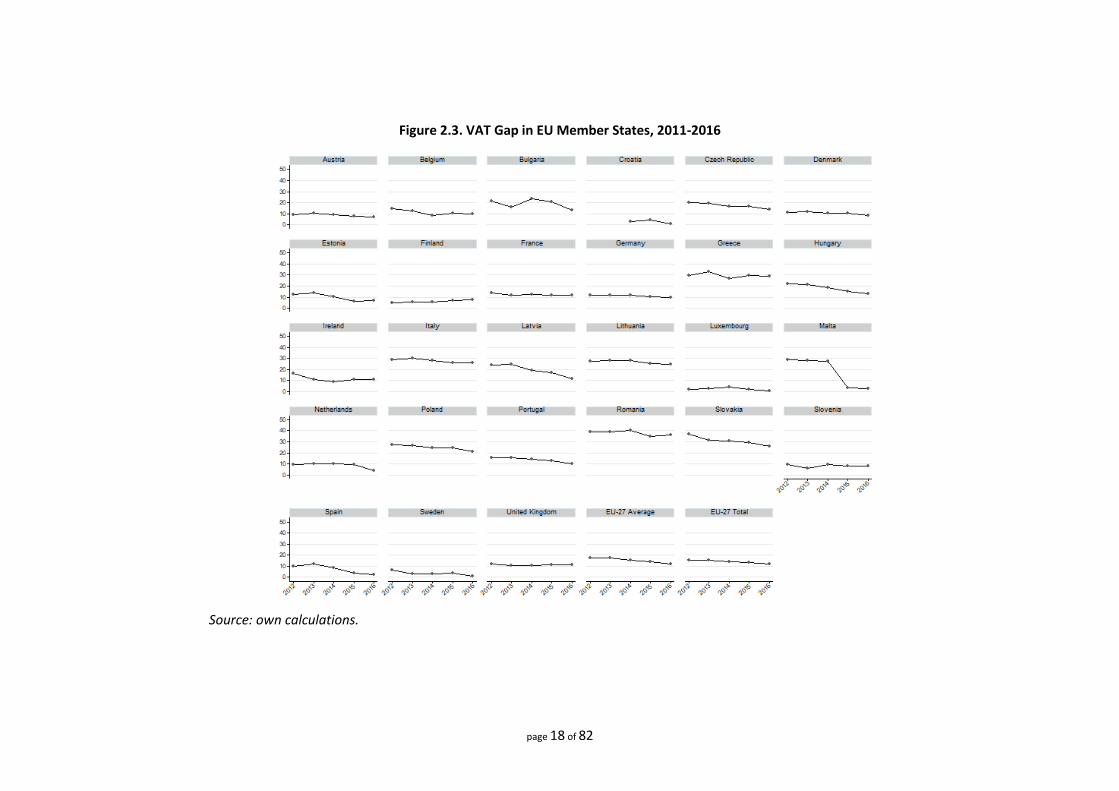
Figure 2.3. VAT Gap in EU Member States, 2011-2016
Source: own calculations.
page 19 of 82
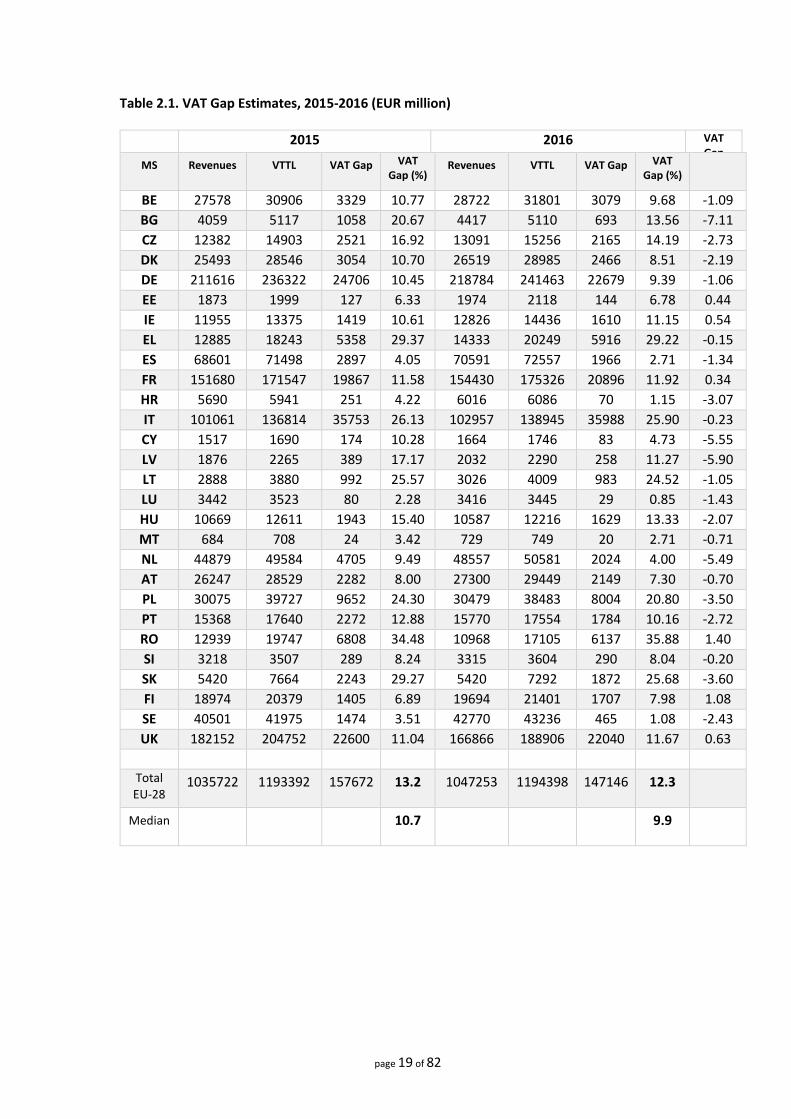
Table 2.1. VAT Gap Estimates, 2015-2016 (EUR million)
2015 2016 VAT Gap
Change (pp)
MS Revenues VTTL VAT Gap VAT Gap (%)
Revenues VTTL VAT Gap VAT Gap (%)
BE 27578 30906 3329 10.77 28722 31801 3079 9.68 -1.09
BG 4059 5117 1058 20.67 4417 5110 693 13.56 -7.11
CZ 12382 14903 2521 16.92 13091 15256 2165 14.19 -2.73
DK 25493 28546 3054 10.70 26519 28985 2466 8.51 -2.19
DE 211616 236322 24706 10.45 218784 241463 22679 9.39 -1.06
EE 1873 1999 127 6.33 1974 2118 144 6.78 0.44
IE 11955 13375 1419 10.61 12826 14436 1610 11.15 0.54
EL 12885 18243 5358 29.37 14333 20249 5916 29.22 -0.15
ES 68601 71498 2897 4.05 70591 72557 1966 2.71 -1.34
FR 151680 171547 19867 11.58 154430 175326 20896 11.92 0.34
HR 5690 5941 251 4.22 6016 6086 70 1.15 -3.07
IT 101061 136814 35753 26.13 102957 138945 35988 25.90 -0.23
CY 1517 1690 174 10.28 1664 1746 83 4.73 -5.55
LV 1876 2265 389 17.17 2032 2290 258 11.27 -5.90
LT 2888 3880 992 25.57 3026 4009 983 24.52 -1.05
LU 3442 3523 80 2.28 3416 3445 29 0.85 -1.43
HU 10669 12611 1943 15.40 10587 12216 1629 13.33 -2.07
MT 684 708 24 3.42 729 749 20 2.71 -0.71
NL 44879 49584 4705 9.49 48557 50581 2024 4.00 -5.49
AT 26247 28529 2282 8.00 27300 29449 2149 7.30 -0.70
PL 30075 39727 9652 24.30 30479 38483 8004 20.80 -3.50
PT 15368 17640 2272 12.88 15770 17554 1784 10.16 -2.72
RO 12939 19747 6808 34.48 10968 17105 6137 35.88 1.40
SI 3218 3507 289 8.24 3315 3604 290 8.04 -0.20
SK 5420 7664 2243 29.27 5420 7292 1872 25.68 -3.60
FI 18974 20379 1405 6.89 19694 21401 1707 7.98 1.08
SE 40501 41975 1474 3.51 42770 43236 465 1.08 -2.43
UK 182152 204752 22600 11.04 166866 188906 22040 11.67 0.63
Total EU-28
1035722 1193392 157672 13.2 1047253 1194398 147146 12.3
Median 10.7 9.9
page 20 of 82
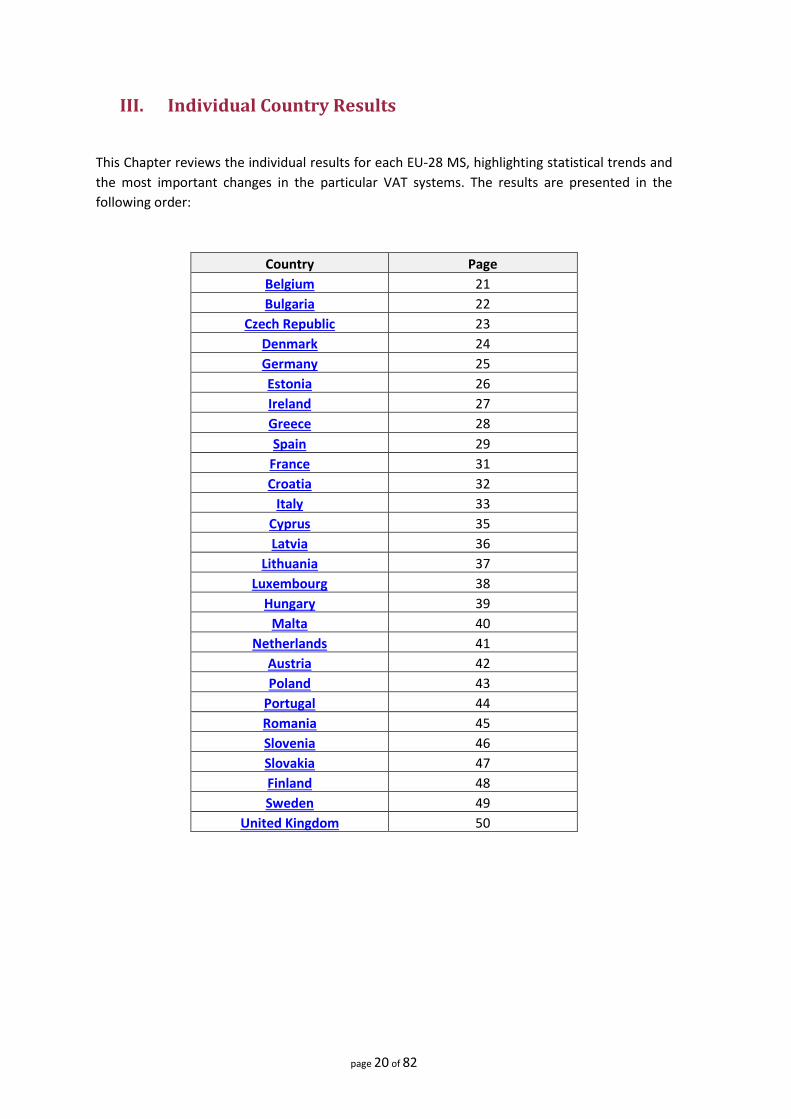
III. Individual Country Results
This Chapter reviews the individual results for each EU-28 MS, highlighting statistical trends and
the most important changes in the particular VAT systems. The results are presented in the
following order:
Country Page
Belgium 21
2 Bulgaria 22
Czech Republic 23
Denmark 24
Germany 25
Estonia 26
Ireland 27
Greece 28
Spain 29
France 31
Croatia 32
Italy 33
Cyprus 35
Latvia 36
Lithuania 37
Luxembourg 38
Hungary 39
Malta 40
Netherlands 41
Austria 42
Poland 43
Portugal 44
Romania 45
Slovenia 46
Slovakia 47
Finland 48
Sweden 49
United Kingdom 50
page 21 of 82
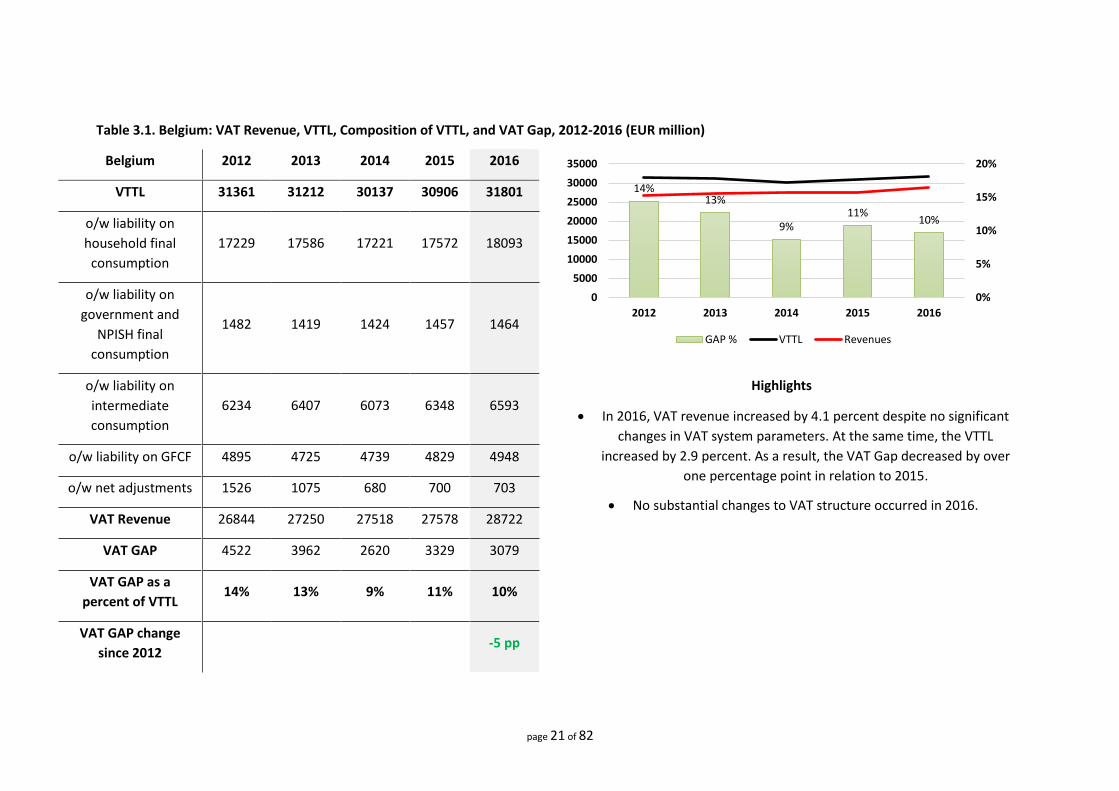
Table 3.1. Belgium: VAT Revenue, VTTL, Composition of VTTL, and VAT Gap, 2012-2016 (EUR million)
Belgium 2012 2013 2014 2015 2016
VTTL 31361 31212 30137 30906 31801
o/w liability on
household final
consumption
17229 17586 17221 17572 18093
o/w liability on
government and
NPISH final
consumption
1482 1419 1424 1457 1464
o/w liability on
intermediate
consumption
6234 6407 6073 6348 6593
Highlights
In 2016, VAT revenue increased by 4.1 percent despite no significant
changes in VAT system parameters. At the same time, the VTTL
increased by 2.9 percent. As a result, the VAT Gap decreased by over
one percentage point in relation to 2015.
No substantial changes to VAT structure occurred in 2016.
o/w liability on GFCF 4895 4725 4739 4829 4948
o/w net adjustments 1526 1075 680 700 703
VAT Revenue 26844 27250 27518 27578 28722
VAT GAP 4522 3962 2620 3329 3079
VAT GAP as a
percent of VTTL 14% 13% 9% 11% 10%
VAT GAP change
since 2012
-5 pp
14%13%
9%11%
10%
0%
5%
10%
15%
20%
0
5000
10000
15000
20000
25000
30000
35000
2012 2013 2014 2015 2016
GAP % VTTL Revenues
page 22 of 82
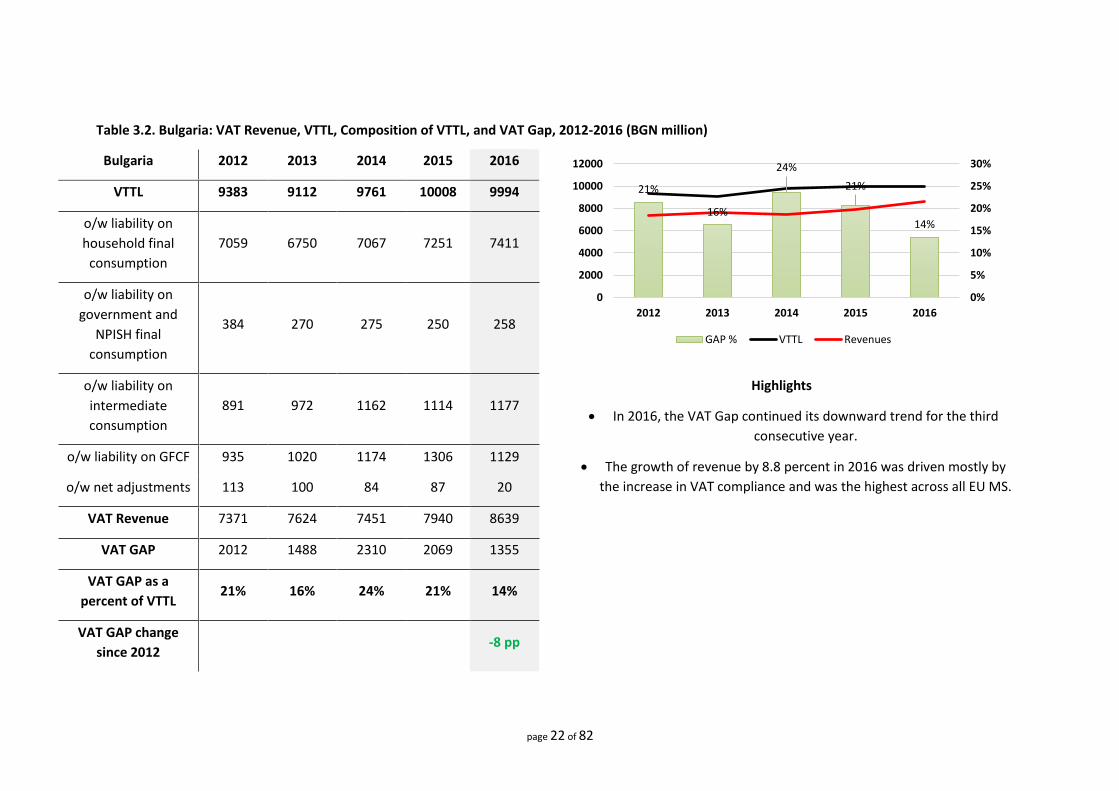
Table 3.2. Bulgaria: VAT Revenue, VTTL, Composition of VTTL, and VAT Gap, 2012-2016 (BGN million)
Bulgaria 2012 2013 2014 2015 2016
VTTL 9383 9112 9761 10008 9994
o/w liability on
household final
consumption
7059 6750 7067 7251 7411
o/w liability on
government and
NPISH final
consumption
384 270 275 250 258
o/w liability on
intermediate
consumption
891 972 1162 1114 1177
Highlights
In 2016, the VAT Gap continued its downward trend for the third
consecutive year.
The growth of revenue by 8.8 percent in 2016 was driven mostly by
the increase in VAT compliance and was the highest across all EU MS.
o/w liability on GFCF 935 1020 1174 1306 1129
o/w net adjustments 113 100 84 87 20
VAT Revenue 7371 7624 7451 7940 8639
VAT GAP 2012 1488 2310 2069 1355
VAT GAP as a
percent of VTTL 21% 16% 24% 21% 14%
VAT GAP change
since 2012
-8 pp
21%
16%
24%
21%
14%
0%
5%
10%
15%
20%
25%
30%
0
2000
4000
6000
8000
10000
12000
2012 2013 2014 2015 2016
GAP % VTTL Revenues
page 23 of 82
Table 3.3. Czech Republic: VAT Revenue, VTTL, Composition of VTTL, and VAT Gap, 2012-2016 (CZK million)
Czech Republic 2012 2013 2014 2015 2016
VTTL 359450 376467 384062 406544 412435
o/w liability on
household final
consumption
227951 241691 245538 254583 264054
o/w liability on
government and
NPISH final
consumption
17834 18903 19387 21179 21573
o/w liability on
intermediate
consumption
68657 72040 71811 75262 77043
Highlights
In 2016, the VAT Gap decreased by 2.7 percentage points to 14.2
percent.
Thanks to a five-year positive trend in VAT Gap reduction, the VAT
Gap was 6.2 percentage points lower compared to 2012.
The Czech Republic reduced the VAT rate on restaurant services
from 21 percent to 15 percent, thus growth of the VTTL in 2016
was subdued.
o/w liability on GFCF 44831 43902 48021 55874 50577
o/w net adjustments 177 -69 -695 -354 -811
VAT Revenue 286116 303823 319485 337774 353915
VAT GAP 73334 72644 64577 68770 58520
VAT GAP as a
percent of VTTL 20% 19% 17% 17% 14%
VAT GAP change
since 2012
-6 pp
20% 19% 17%17%
14%
0%
5%
10%
15%
20%
25%
30%
0
100000
200000
300000
400000
500000
2012 2013 2014 2015 2016
GAP % VTTL Revenues
page 24 of 82
Table 3.4. Denmark: VAT Revenue, VTTL, Composition of VTTL, and VAT Gap, 2012-2016 (DKK million)
Denmark 2012 2013 2014 2015 2016
VTTL 204495 206490 208401 212919 215797
o/w liability on
household final
consumption
117004 119265 120503 123296 125966
o/w liability on
government and
NPISH final
consumption
5230 5222 5283 5369 5426
o/w liability on
intermediate
consumption
53576 52897 52826 53319 51757
Highlights
The VAT Gap, which remained stable between 2012 and 2015, fell in
2016 below 10 percent.
No substantial changes to VAT structure occurred in 2016.
o/w liability on GFCF 23656 23709 24421 25372 27095
o/w net
adjustments 5029 5397 5368 5564 5552
VAT Revenue 181618 181378 185994 190141 197437
VAT GAP 22877 25112 22407 22778 18360
VAT GAP as a
percent of VTTL 11% 12% 11% 11% 9%
VAT GAP change
since 2012
-3 pp
11%12%
11% 11%9%
0%
5%
10%
15%
20%
0
50000
100000
150000
200000
250000
2012 2013 2014 2015 2016
GAP % VTTL Revenues
page 25 of 82
Table 3.5. Germany: VAT Revenue, VTTL, Composition of VTTL, and VAT Gap, 2012-2016 (EUR million)
Germany 2012 2013 2014 2015 2016
VTTL 219031 223018 229735 236322 241463
o/w liability on
household final
consumption
138335 139672 142430 145965 148972
o/w liability on
government and
NPISH final
consumption
5685 5896 6207 6479 6731
o/w liability on
intermediate
consumption
38345 39982 42562 44174 44424
Highlights
The VAT Gap, which remained stable between 2012 and 2015, fell to a single digit number in 2016.
Germany did not implement any significant changes to VAT rates over the course of 2016.
o/w liability on GFCF 35350 36084 37176 38336 39948
o/w net
adjustments 1317 1384 1360 1367 1388
VAT Revenue 194034 197005 203081 211616 218784
VAT GAP 24997 26013 26654 24706 22679
VAT GAP as a
percent of VTTL 11% 12% 12% 10% 9%
VAT GAP change
since 2012
-2 pp
11% 12% 12%10%
9%
0%
5%
10%
15%
20%
0
50000
100000
150000
200000
250000
2012 2013 2014 2015 2016
GAP % VTTL Revenues
page 26 of 82
Table 3.6. Estonia: VAT Revenue, VTTL, Composition of VTTL, and VAT Gap, 2012-2016 (EUR million)
Estonia 2012 2013 2014 2015 2016
VTTL 1724 1814 1911 1999 2118
o/w liability on
household final
consumption
1202 1273 1338 1390 1459
o/w liability on
government and
NPISH final
consumption
16 26 34 36 59
o/w liability on
intermediate
consumption
224 227 232 244 255
Highlights
The VAT Gap, which was substantially reduced between 2013 and
2015, remained relatively stable in 2016.
The VAT registration threshold for resident business was increased from EUR 16,000 to EUR 25,000 in order to free small businesses from
bureaucratic burdens.
o/w liability on GFCF 272 278 298 321 336
o/w net adjustments 9 9 9 8 9
VAT Revenue 1508 1558 1711 1873 1974
VAT GAP 216 256 200 127 144
VAT GAP as a
percent of VTTL 13% 14% 10% 6% 7%
VAT GAP change
since 2012
-6 pp
13%14%
10%
6% 7%
0%
5%
10%
15%
20%
0
500
1000
1500
2000
2500
2012 2013 2014 2015 2016
GAP % VTTL Revenues
page 27 of 82
Table 3.7. Ireland: VAT Revenue, VTTL, Composition of VTTL, and VAT Gap, 2012-2016 (EUR million)
Ireland 2012 2013 2014 2015 2016
VTTL 12187 11676 12675 13375 14436
o/w liability on
household final
consumption
7495 7255 7486 7857 8164
o/w liability on
government and
NPISH final
consumption
232 181 153 164 172
o/w liability on
intermediate
consumption
3226 3050 3435 3554 3815
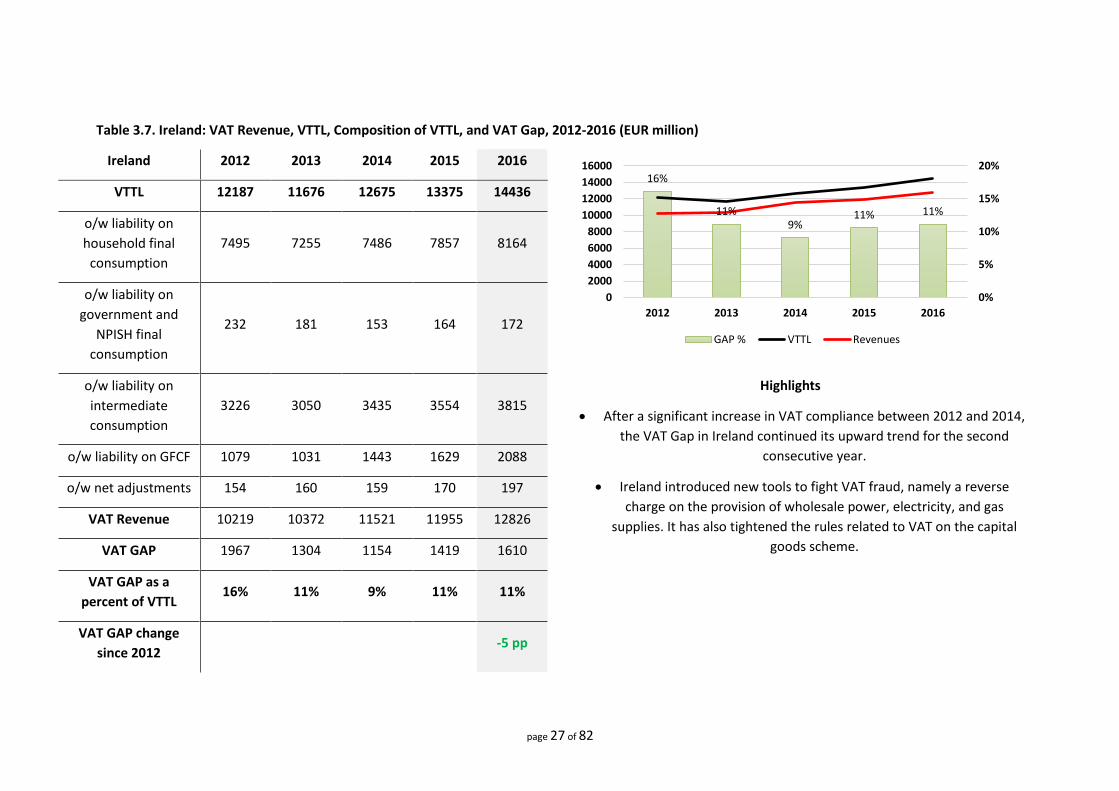
Highlights
After a significant increase in VAT compliance between 2012 and 2014,
the VAT Gap in Ireland continued its upward trend for the second
consecutive year.
Ireland introduced new tools to fight VAT fraud, namely a reverse
charge on the provision of wholesale power, electricity, and gas
supplies. It has also tightened the rules related to VAT on the capital
goods scheme.
o/w liability on GFCF 1079 1031 1443 1629 2088
o/w net adjustments 154 160 159 170 197
VAT Revenue 10219 10372 11521 11955 12826
VAT GAP 1967 1304 1154 1419 1610
VAT GAP as a
percent of VTTL 16% 11% 9% 11% 11%
VAT GAP change
since 2012
-5 pp
16%
11%9%
11% 11%
0%
5%
10%
15%
20%
0
2000
4000
6000
8000
10000
12000
14000
16000
2012 2013 2014 2015 2016
GAP % VTTL Revenues

page 28 of 82
Table 3.8. Greece: VAT Revenue, VTTL, Composition of VTTL, and VAT Gap, 2012-2016 (EUR million)
Greece 2012 2013 2014 2016 2016
VTTL 19478 18807 17289 18243 20249
o/w liability on
household final
consumption
13701 13498 12750 13508 15513
o/w liability on
government and
NPISH final
consumption
756 582 424 565 566
o/w liability on
intermediate
consumption
1913 1769 1761 1853 1937
Highlights
Greece raised the standard rate by one percentage point (from 23 to
24) as of July 2016. The withdrawal of the 30 percent VAT rate
discount from the last group of islands together with the hike in the
standard rate resulted in an approximate 1.5 percentage point
increase in the effective rate.
Despite the hike in the effective rate, VAT compliance remained stable
in 2016.
o/w liability on GFCF 2853 2691 2114 2066 1947
o/w net adjustments 254 267 239 250 285
VAT Revenue 13713 12593 12676 12885 14333
VAT GAP 5765 6214 4613 5358 5916
VAT GAP as a
percent of VTTL 30% 33% 27% 29% 29%
VAT GAP change
since 2012
0 pp
30%33%
27%29% 29%
0%
10%
20%
30%
40%
0
5000
10000
15000
20000
25000
2012 2013 2014 2015 2016
GAP % VTTL Revenues
page 29 of 82
Table 3.9a. Spain: VAT Revenue, VTTL, Composition of VTTL, and VAT Gap, 2012-2016 (EUR million)
Spain 2012 2013 2014 2015 2016
VTTL 62924 69100 69637 71498 72557
o/w liability on
household final
consumption
46291 50150 50920 52651 53713
o/w liability on
government and
NPISH final
consumption
2273 2387 2413 2490 2493
o/w liability on
intermediate
consumption
8419 8818 8619 8350 8669
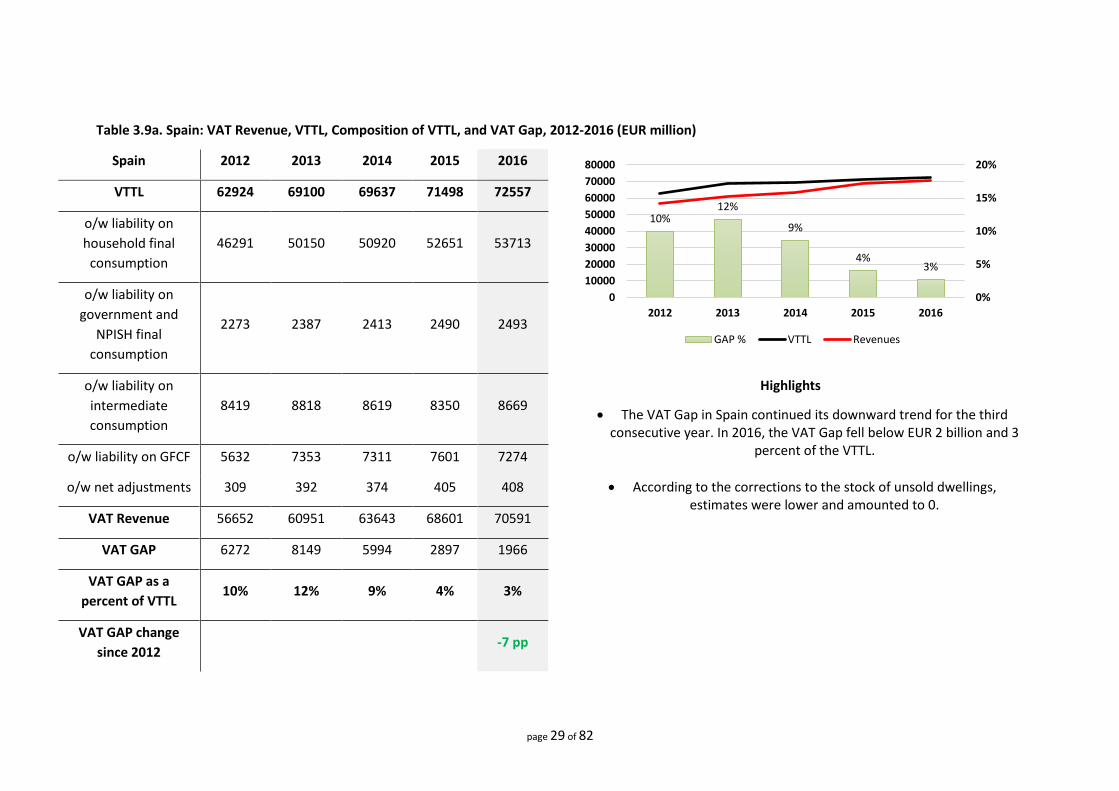
Highlights
The VAT Gap in Spain continued its downward trend for the third consecutive year. In 2016, the VAT Gap fell below EUR 2 billion and 3
percent of the VTTL.
According to the corrections to the stock of unsold dwellings, estimates were lower and amounted to 0.
o/w liability on GFCF 5632 7353 7311 7601 7274
o/w net adjustments 309 392 374 405 408
VAT Revenue 56652 60951 63643 68601 70591
VAT GAP 6272 8149 5994 2897 1966
VAT GAP as a
percent of VTTL 10% 12% 9% 4% 3%
VAT GAP change
since 2012
-7 pp
10%12%
9%
4%3%
0%
5%
10%
15%
20%
0
10000
20000
30000
40000
50000
60000
70000
80000
2012 2013 2014 2015 2016
GAP % VTTL Revenues

page 30 of 82
Table 3.9b. Spain: Alternative Estimates
Spain 2012 2013 2014 2015 2016
VAT Gap based on
alternative data 5223 4483 2849 -762 233
VAT Gap based on
alternative data, as a
percent of VTTL
8% 7% 4% -1% 0%
Note: Adjusting revenues for the continuing reduction in the stock of claims and adjusting the VTTL for the difference between national accounting and tax
conventions in the construction sector based on the data received from Spanish Tax Authorities led to a downward revision of the VAT Gap for the entire period
2012-2016. The accumulated liability of the stock of unsold real estate reached over EUR 12 billion.
page 31 of 82
Table 3.10. France: VAT Revenue, VTTL, Composition of VTTL, and VAT Gap, 2012-2016 (EUR million)
France 2012 2013 2014 2015 2016
VTTL 164919 164004 170035 171547 175326
o/w liability on
household final
consumption
96868 96883 100510 102187 105302
o/w liability on
government and
NPISH final
consumption
1379 1426 1606 1622 1640
o/w liability on
intermediate
consumption
28405 28953 29704 30273 30680
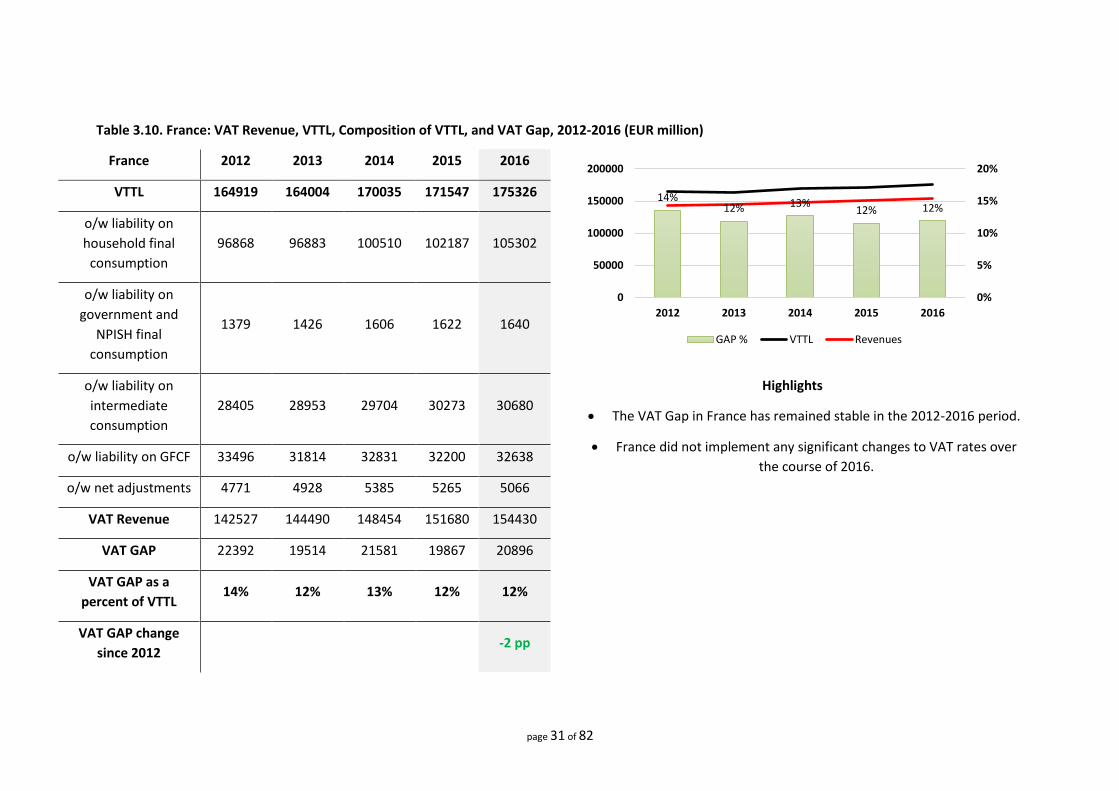
Highlights
The VAT Gap in France has remained stable in the 2012-2016 period.
France did not implement any significant changes to VAT rates over
the course of 2016.
o/w liability on GFCF 33496 31814 32831 32200 32638
o/w net adjustments 4771 4928 5385 5265 5066
VAT Revenue 142527 144490 148454 151680 154430
VAT GAP 22392 19514 21581 19867 20896
VAT GAP as a
percent of VTTL 14% 12% 13% 12% 12%
VAT GAP change
since 2012
-2 pp
14%12% 13%
12% 12%
0%
5%
10%
15%
20%
0
50000
100000
150000
200000
2012 2013 2014 2015 2016
GAP % VTTL Revenues
page 32 of 82
Table 3.11. Croatia: VAT Revenue, VTTL, Composition of VTTL, and VAT Gap, 2014-2016 (HRK million)
Croatia 2014 2015 2016
VTTL 42831 45231 45850
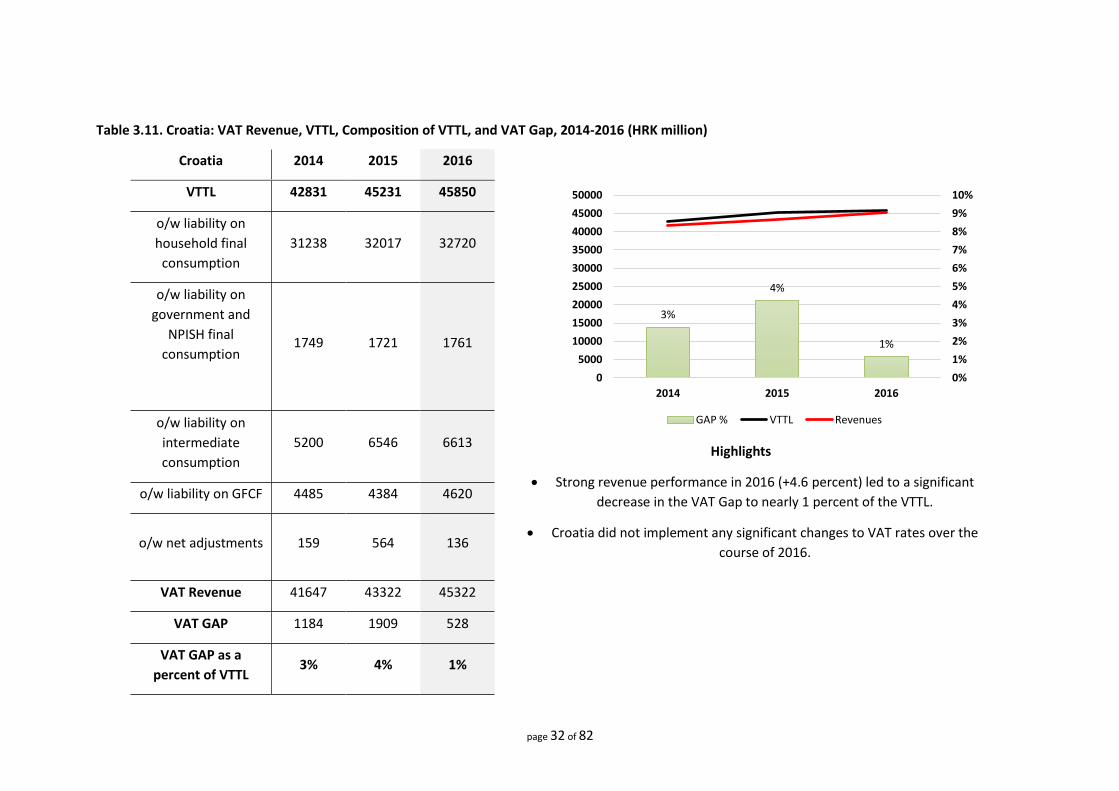
Highlights
Strong revenue performance in 2016 (+4.6 percent) led to a significant
decrease in the VAT Gap to nearly 1 percent of the VTTL.
Croatia did not implement any significant changes to VAT rates over the
course of 2016.
o/w liability on
household final
consumption
31238 32017 32720
o/w liability on
government and
NPISH final
consumption 1749 1721 1761
o/w liability on
intermediate
consumption
5200 6546 6613
o/w liability on GFCF 4485 4384 4620
o/w net adjustments 159 564 136
VAT Revenue 41647 43322 45322
VAT GAP 1184 1909 528
VAT GAP as a
percent of VTTL 3% 4% 1%
3%
4%
1%
0%
1%
2%
3%
4%
5%
6%
7%
8%
9%
10%
0
5000
10000
15000
20000
25000
30000
35000
40000
45000
50000
2014 2015 2016
GAP % VTTL Revenues
page 33 of 82
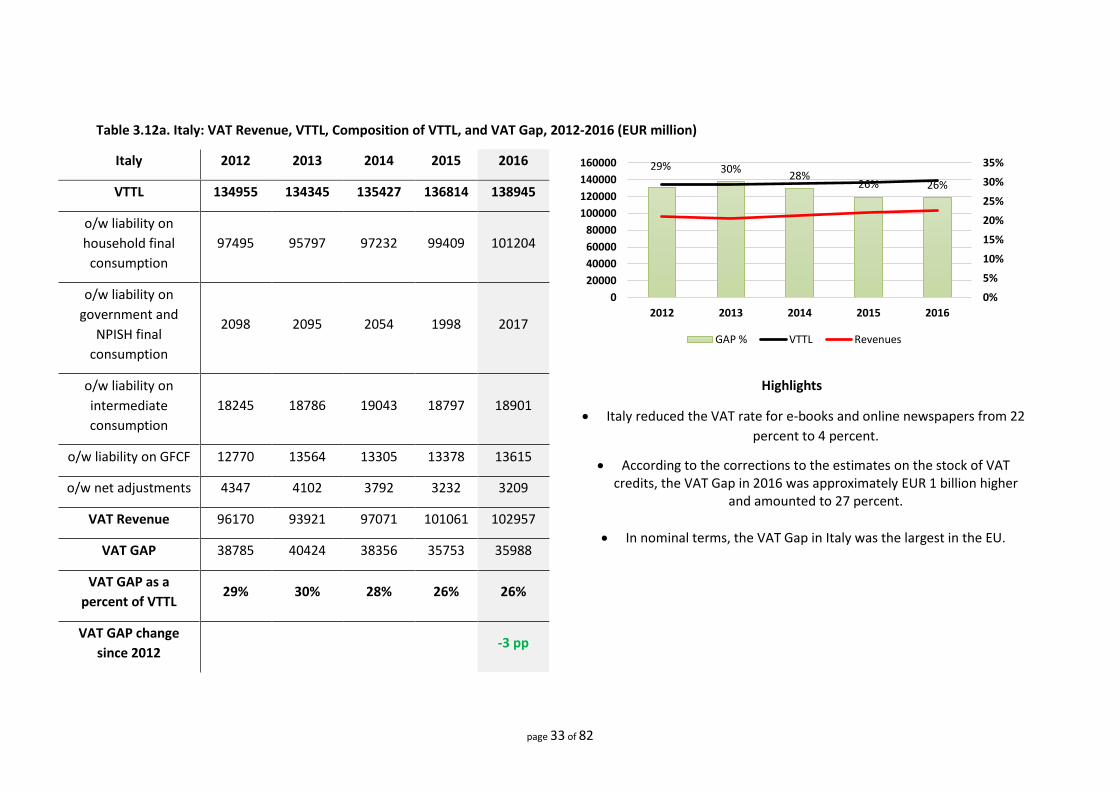
Table 3.12a. Italy: VAT Revenue, VTTL, Composition of VTTL, and VAT Gap, 2012-2016 (EUR million)
Italy 2012 2013 2014 2015 2016
VTTL 134955 134345 135427 136814 138945
o/w liability on
household final
consumption
97495 95797 97232 99409 101204
o/w liability on
government and
NPISH final
consumption
2098 2095 2054 1998 2017
o/w liability on
intermediate
consumption
18245 18786 19043 18797 18901
Highlights
Italy reduced the VAT rate for e-books and online newspapers from 22
percent to 4 percent.
According to the corrections to the estimates on the stock of VAT credits, the VAT Gap in 2016 was approximately EUR 1 billion higher
and amounted to 27 percent.
In nominal terms, the VAT Gap in Italy was the largest in the EU.
o/w liability on GFCF 12770 13564 13305 13378 13615
o/w net adjustments 4347 4102 3792 3232 3209
VAT Revenue 96170 93921 97071 101061 102957
VAT GAP 38785 40424 38356 35753 35988
VAT GAP as a
percent of VTTL 29% 30% 28% 26% 26%
VAT GAP change
since 2012
-3 pp
29% 30%28%
26% 26%
0%
5%
10%
15%
20%
25%
30%
35%
0
20000
40000
60000
80000
100000
120000
140000
160000
2012 2013 2014 2015 2016
GAP % VTTL Revenues

page 34 of 82
Table 3.12b. Italy: Alternative Estimates
Italy 2012 2013 2014 2015 2016
VAT Gap based on
alternative data 37205 37819 36914 36636 36894
VAT Gap based on
alternative data, as a
percent of VTTL
28% 28% 27% 27% 27%
Note: the estimates above are based on adjusted revenues for the changes in outstanding stocks of net reimbursement claims (to better approximate accrued
revenues) and Italy’s own estimates of illegal activities, namely illegal drugs and prostitution activities.

page 35 of 82
Table 3.13. Cyprus: VAT Revenue, VTTL, Composition of VTTL, and VAT Gap, 2015-2016 (EUR million)
Cyprus 2015 2016
VTTL 1690 1746
o/w liability on
household final
consumption
1043 1070
o/w liability on
government and
NPISH final
consumption
29 29
o/w liability on
intermediate
consumption
482 486
Highlights
Strong revenue performance in 2016 (+9.7 percent) led to the third
consecutive decline in the VAT Gap. Since 2014, the VAT Gap in Cyprus
has decreased by nearly 10 percentage points.
No substantial changes to VAT structure occurred in 2016.
o/w liability on GFCF 115 152
o/w net adjustments 21 9
VAT Revenue 1517 1664
VAT GAP 174 83
VAT GAP as a percent
of VTTL 10% 5%
VAT GAP change since
2015 -5 pp
10%
5%
0%
5%
10%
15%
1400
1500
1600
1700
1800
2015 2016
GAP % VTTL Revenues
page 36 of 82
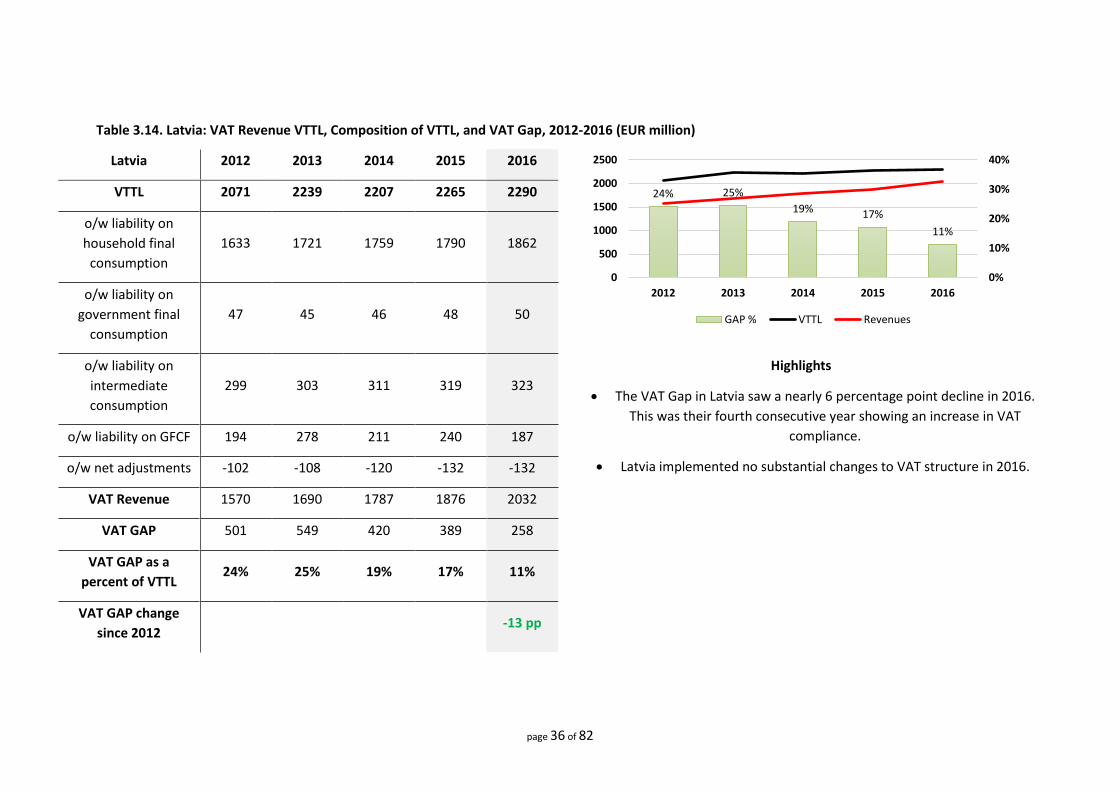
Table 3.14. Latvia: VAT Revenue VTTL, Composition of VTTL, and VAT Gap, 2012-2016 (EUR million)
Latvia 2012 2013 2014 2015 2016
VTTL 2071 2239 2207 2265 2290
o/w liability on
household final
consumption
1633 1721 1759 1790 1862
o/w liability on
government final
consumption
47 45 46 48 50
o/w liability on
intermediate
consumption
299 303 311 319 323
Highlights
The VAT Gap in Latvia saw a nearly 6 percentage point decline in 2016.
This was their fourth consecutive year showing an increase in VAT
compliance.
Latvia implemented no substantial changes to VAT structure in 2016.
o/w liability on GFCF 194 278 211 240 187
o/w net adjustments -102 -108 -120 -132 -132
VAT Revenue 1570 1690 1787 1876 2032
VAT GAP 501 549 420 389 258
VAT GAP as a
percent of VTTL 24% 25% 19% 17% 11%
VAT GAP change
since 2012
-13 pp
24% 25%
19% 17%
11%
0%
10%
20%
30%
40%
0
500
1000
1500
2000
2500
2012 2013 2014 2015 2016
GAP % VTTL Revenues
page 37 of 82
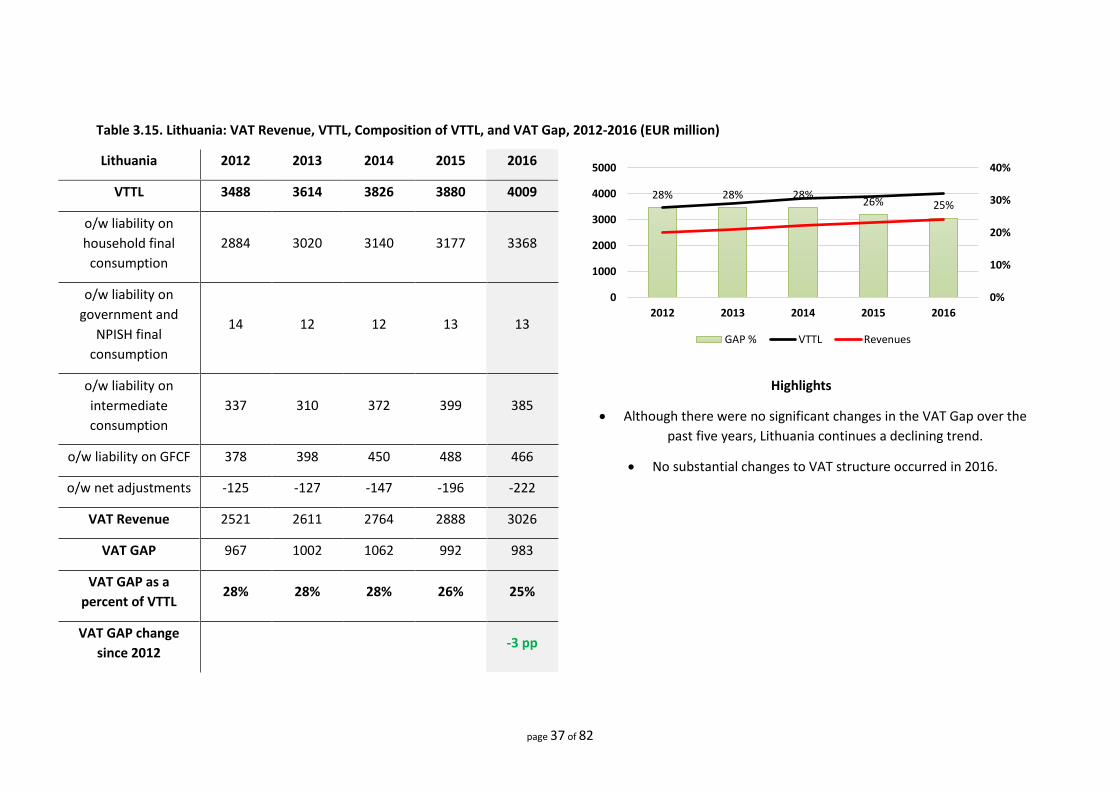
Table 3.15. Lithuania: VAT Revenue, VTTL, Composition of VTTL, and VAT Gap, 2012-2016 (EUR million)
Lithuania 2012 2013 2014 2015 2016
VTTL 3488 3614 3826 3880 4009
o/w liability on
household final
consumption
2884 3020 3140 3177 3368
o/w liability on
government and
NPISH final
consumption
14 12 12 13 13
o/w liability on
intermediate
consumption
337 310 372 399 385
Highlights
Although there were no significant changes in the VAT Gap over the
past five years, Lithuania continues a declining trend.
No substantial changes to VAT structure occurred in 2016.
o/w liability on GFCF 378 398 450 488 466
o/w net adjustments -125 -127 -147 -196 -222
VAT Revenue 2521 2611 2764 2888 3026
VAT GAP 967 1002 1062 992 983
VAT GAP as a
percent of VTTL 28% 28% 28% 26% 25%
VAT GAP change
since 2012
-3 pp
28% 28% 28%26% 25%
0%
10%
20%
30%
40%
0
1000
2000
3000
4000
5000
2012 2013 2014 2015 2016
GAP % VTTL Revenues
page 38 of 82
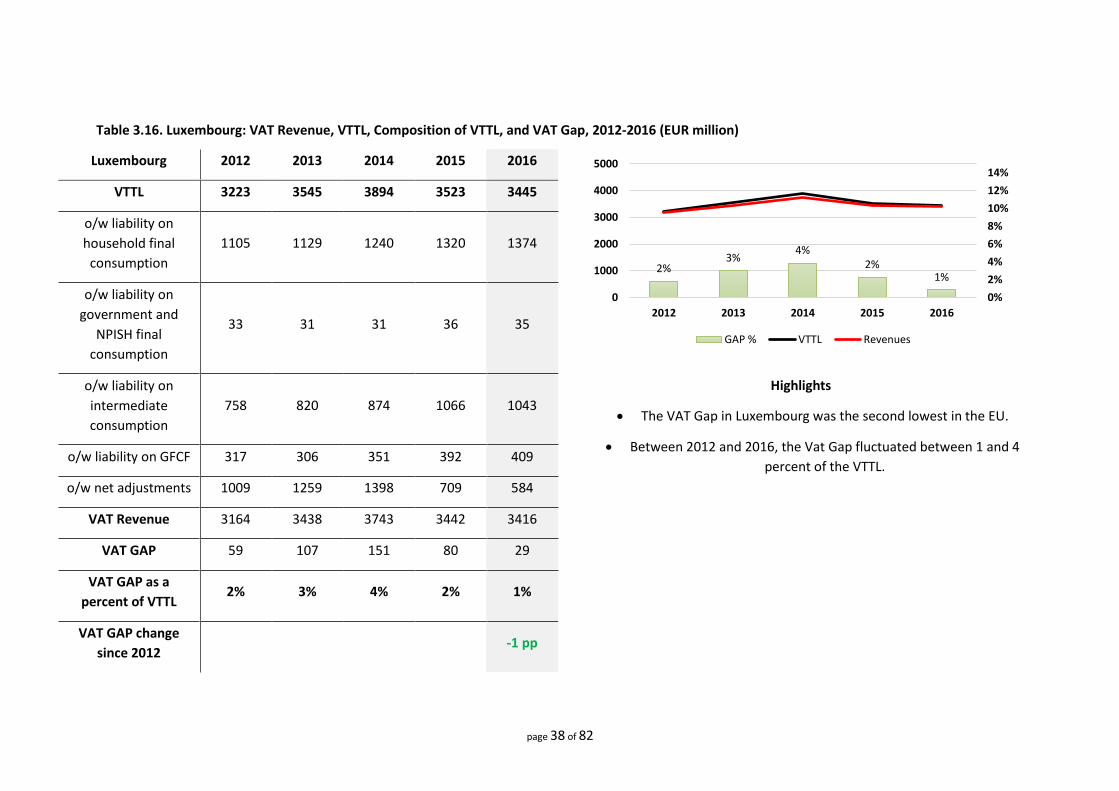
Table 3.16. Luxembourg: VAT Revenue, VTTL, Composition of VTTL, and VAT Gap, 2012-2016 (EUR million)
Luxembourg 2012 2013 2014 2015 2016
VTTL 3223 3545 3894 3523 3445
o/w liability on
household final
consumption
1105 1129 1240 1320 1374
o/w liability on
government and
NPISH final
consumption
33 31 31 36 35
o/w liability on
intermediate
consumption
758 820 874 1066 1043
Highlights
The VAT Gap in Luxembourg was the second lowest in the EU.
Between 2012 and 2016, the Vat Gap fluctuated between 1 and 4
percent of the VTTL.
o/w liability on GFCF 317 306 351 392 409
o/w net adjustments 1009 1259 1398 709 584
VAT Revenue 3164 3438 3743 3442 3416
VAT GAP 59 107 151 80 29
VAT GAP as a
percent of VTTL 2% 3% 4% 2% 1%
VAT GAP change
since 2012
-1 pp
2%3%
4%2%
1%
0%
2%
4%
6%
8%
10%
12%
14%
0
1000
2000
3000
4000
5000
2012 2013 2014 2015 2016
GAP % VTTL Revenues

page 39 of 82
Table 3.17. Hungary: VAT Revenue, VTTL, Composition of VTTL, and VAT Gap, 2012-2016 (HUF million)
Hungary 2012 2013 2014 2015 2016
VTTL 3370781 3430096 3690098 3909547 3804471
o/w liability on
household final
consumption
2383007 2440438 2561233 2654818 2758642
o/w liability on
government final
consumption
116969 122358 114833 120367 126525
o/w liability on
intermediate
consumption
458595 444751 490655 501821 507607
Highlights
In 2016, the VAT Gap in Hungary continued its downward trend.
Since 2012, the VAT Gap fell by roughly 9 percentage points.
No substantial changes to VAT structure occurred in 2016.
o/w liability on GFCF 338232 362648 464953 576606 363733
o/w net adjustments 73978 59901 58425 55934 47964
VAT Revenue 2627571 2693555 3011162 3307312 3297156
VAT GAP 743210 736541 678936 602235 507314
VAT GAP as a
percent of VTTL 22% 21% 18% 15% 13%
VAT GAP change
since 2012
-9 pp
22% 21%18%
15%13%
0%
5%
10%
15%
20%
25%
0
1000000
2000000
3000000
4000000
5000000
2012 2013 2014 2015 2016
GAP % VTTL Revenues
page 40 of 82
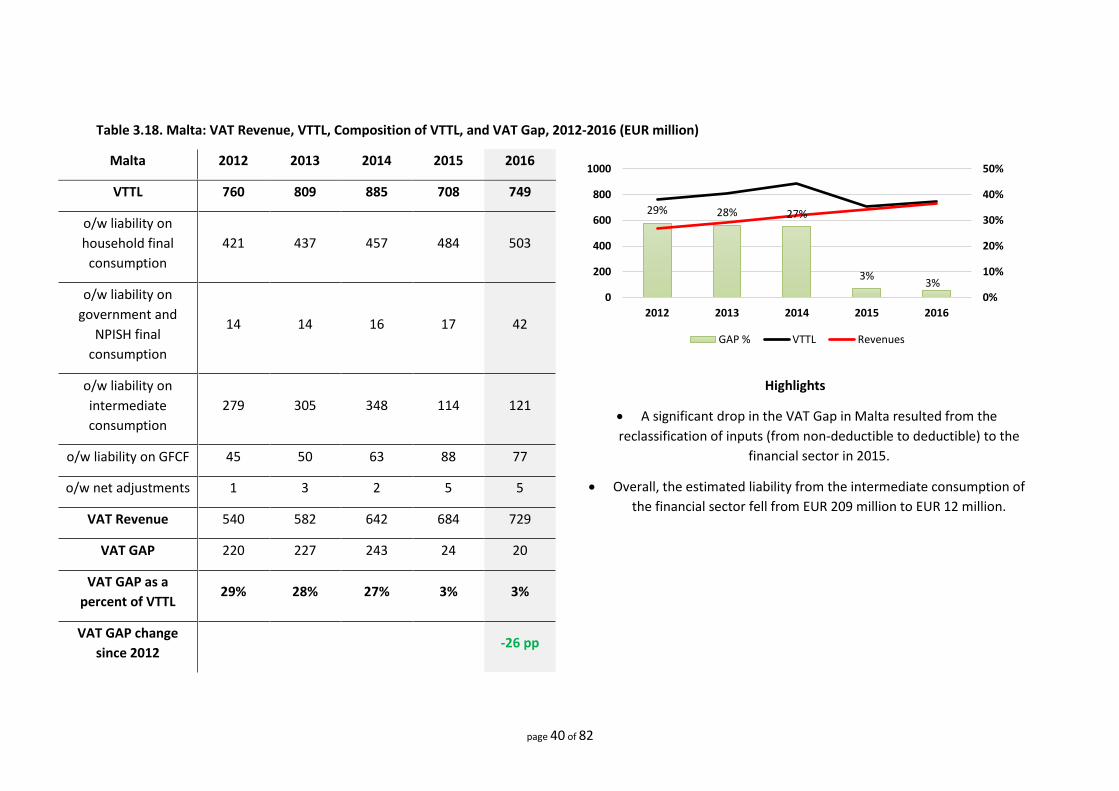
Table 3.18. Malta: VAT Revenue, VTTL, Composition of VTTL, and VAT Gap, 2012-2016 (EUR million)
Malta 2012 2013 2014 2015 2016
VTTL 760 809 885 708 749
o/w liability on
household final
consumption
421 437 457 484 503
o/w liability on
government and
NPISH final
consumption
14 14 16 17 42
o/w liability on
intermediate
consumption
279 305 348 114 121
Highlights
A significant drop in the VAT Gap in Malta resulted from the
reclassification of inputs (from non-deductible to deductible) to the
financial sector in 2015.
Overall, the estimated liability from the intermediate consumption of
the financial sector fell from EUR 209 million to EUR 12 million.
o/w liability on GFCF 45 50 63 88 77
o/w net adjustments 1 3 2 5 5
VAT Revenue 540 582 642 684 729
VAT GAP 220 227 243 24 20
VAT GAP as a
percent of VTTL 29% 28% 27% 3% 3%
VAT GAP change
since 2012
-26 pp
29% 28% 27%
3%3%
0%
10%
20%
30%
40%
50%
0
200
400
600
800
1000
2012 2013 2014 2015 2016
GAP % VTTL Revenues
page 41 of 82
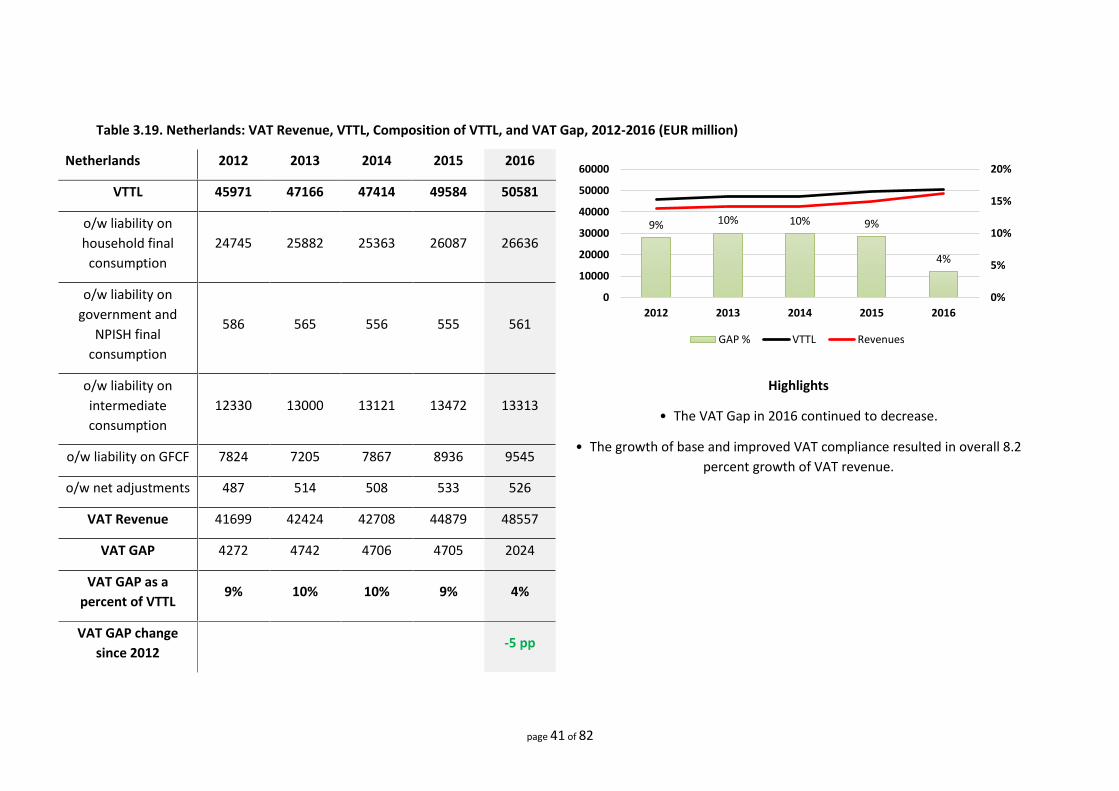
Table 3.19. Netherlands: VAT Revenue, VTTL, Composition of VTTL, and VAT Gap, 2012-2016 (EUR million)
Netherlands 2012 2013 2014 2015 2016
VTTL 45971 47166 47414 49584 50581
o/w liability on
household final
consumption
24745 25882 25363 26087 26636
o/w liability on
government and
NPISH final
consumption
586 565 556 555 561
o/w liability on
intermediate
consumption
12330 13000 13121 13472 13313
Highlights
• The VAT Gap in 2016 continued to decrease.
• The growth of base and improved VAT compliance resulted in overall 8.2
percent growth of VAT revenue. o/w liability on GFCF 7824 7205 7867 8936 9545
o/w net adjustments 487 514 508 533 526
VAT Revenue 41699 42424 42708 44879 48557
VAT GAP 4272 4742 4706 4705 2024
VAT GAP as a
percent of VTTL 9% 10% 10% 9% 4%
VAT GAP change
since 2012
-5 pp
9% 10% 10% 9%
4%
0%
5%
10%
15%
20%
0
10000
20000
30000
40000
50000
60000
2012 2013 2014 2015 2016
GAP % VTTL Revenues

page 42 of 82
Table 3.20. Austria: VAT Revenue, VTTL, Composition of VTTL, and VAT Gap, 2012-2016 (EUR million)
Austria 2012 2013 2014 2015 2016
VTTL 26916 27744 27958 28529 29449
o/w liability on
household final
consumption
18296 18984 18998 19224 19470
o/w liability on
government and
NPISH final
consumption
794 758 957 992 1024
o/w liability on
intermediate
consumption
3869 4021 4103 4222 4272
Highlights
The VAT Gap in Austria continued its downward trend for the fourth
consecutive year.
In 2016, the estimated VAT Gap accounted for approximately 7.3
percent of the VTTL, which was the lowest in 2012-2016.
o/w liability on GFCF 2480 2545 2585 2659 2795
o/w net adjustments 1476 1436 1315 1432 1474
VAT Revenue 24507 24895 25386 26247 27300
VAT GAP 2409 2849 2572 2282 2149
VAT GAP as a
percent of VTTL 9% 10% 9% 8% 7%
VAT GAP change
since 2012
-2 pp
9%10%
9%8% 7%
0%
5%
10%
15%
20%
0
5000
10000
15000
20000
25000
30000
35000
2012 2013 2014 2015 2016
GAP % VTTL Revenues

page 43 of 82
Table 3.21. Poland: VAT Revenue VTTL, Composition of VTTL, and VAT Gap, 2012-2016 (PLN million)
Poland 2012 2013 2014 2015 2016
VTTL 159399 158882 162359 166223 167908
o/w liability on
household final
consumption
108887 109749 112465 114399 118622
o/w liability on
government and
NPISH final
consumption
6505 6716 7113 7380 7524
o/w liability on
intermediate
consumption
23386 22919 22939 24649 25142
Highlights
VAT compliance showed a significant improvement in 2016 (a
decrease of 3.5 percentage points).
In 2016, Poland introduced SAF-T for large economic operators.
No significant changes regarding VAT system parameters were
introduced.
o/w liability on GFCF 16423 15306 16875 17444 14321
o/w net adjustments 4199 4191 2967 2351 2299
VAT Revenue 116265 116607 122671 125836 132987
VAT GAP 43134 42275 39689 40387 34921
VAT GAP as a
percent of VTTL 27% 27% 24% 24% 21%
VAT GAP change
since 2012
-6 pp
27% 27%24% 24%
21%
0%
5%
10%
15%
20%
25%
30%
0
50000
100000
150000
200000
2012 2013 2014 2015 2016
GAP % VTTL Revenues
page 44 of 82
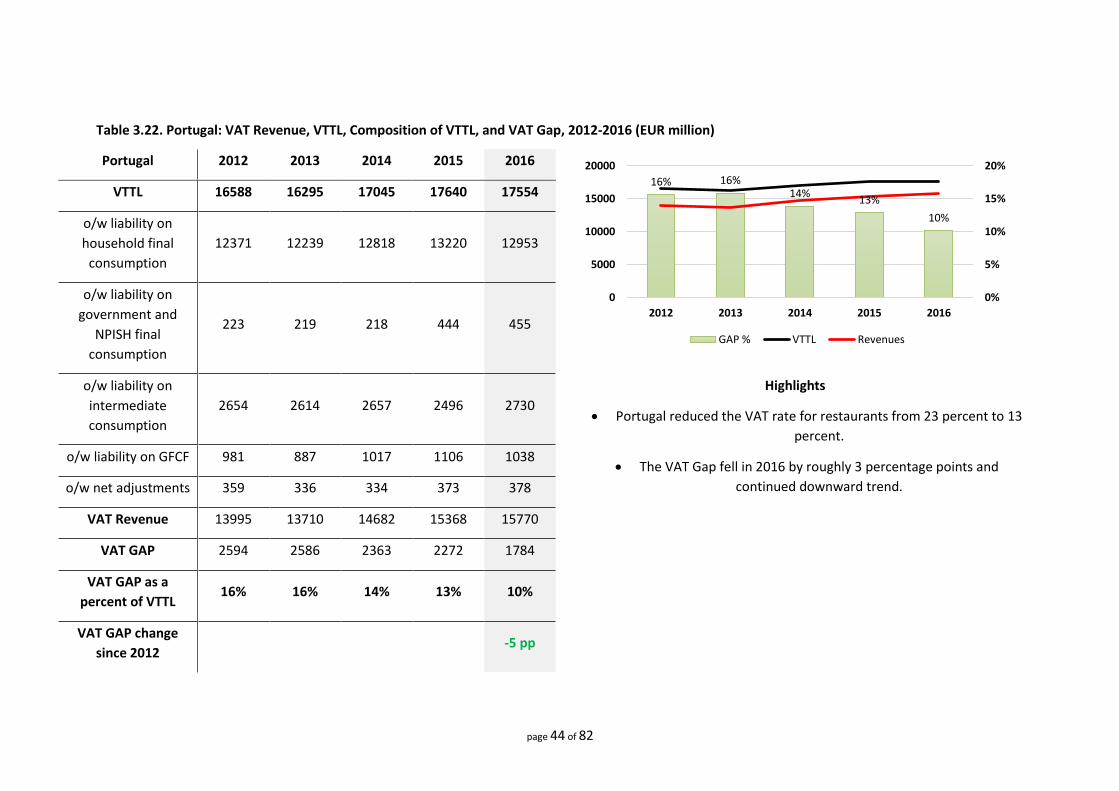
Table 3.22. Portugal: VAT Revenue, VTTL, Composition of VTTL, and VAT Gap, 2012-2016 (EUR million)
Portugal 2012 2013 2014 2015 2016
VTTL 16588 16295 17045 17640 17554
o/w liability on
household final
consumption
12371 12239 12818 13220 12953
o/w liability on
government and
NPISH final
consumption
223 219 218 444 455
o/w liability on
intermediate
consumption
2654 2614 2657 2496 2730
Highlights
Portugal reduced the VAT rate for restaurants from 23 percent to 13
percent.
The VAT Gap fell in 2016 by roughly 3 percentage points and
continued downward trend.
o/w liability on GFCF 981 887 1017 1106 1038
o/w net adjustments 359 336 334 373 378
VAT Revenue 13995 13710 14682 15368 15770
VAT GAP 2594 2586 2363 2272 1784
VAT GAP as a
percent of VTTL 16% 16% 14% 13% 10%
VAT GAP change
since 2012
-5 pp
16% 16%14%
13%
10%
0%
5%
10%
15%
20%
0
5000
10000
15000
20000
2012 2013 2014 2015 2016
GAP % VTTL Revenues
page 45 of 82
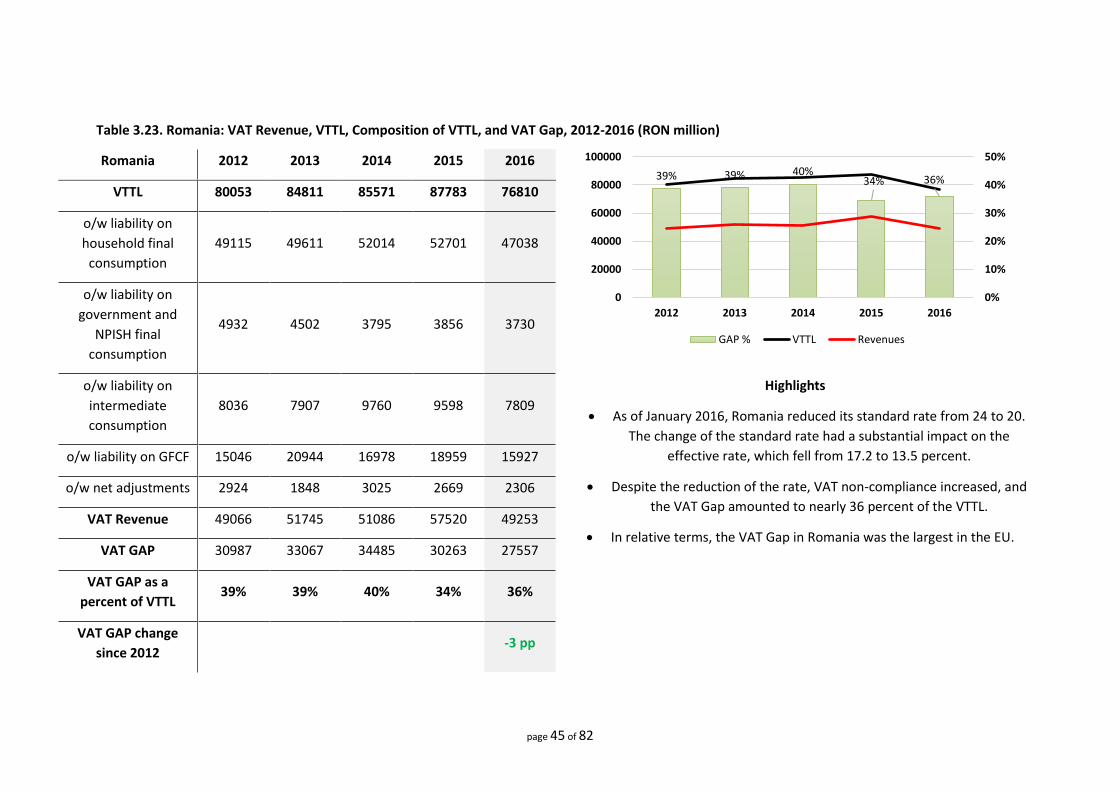
Table 3.23. Romania: VAT Revenue, VTTL, Composition of VTTL, and VAT Gap, 2012-2016 (RON million)
Romania 2012 2013 2014 2015 2016
VTTL 80053 84811 85571 87783 76810
o/w liability on
household final
consumption
49115 49611 52014 52701 47038
o/w liability on
government and
NPISH final
consumption
4932 4502 3795 3856 3730
o/w liability on
intermediate
consumption
8036 7907 9760 9598 7809
Highlights
As of January 2016, Romania reduced its standard rate from 24 to 20.
The change of the standard rate had a substantial impact on the
effective rate, which fell from 17.2 to 13.5 percent.
Despite the reduction of the rate, VAT non-compliance increased, and
the VAT Gap amounted to nearly 36 percent of the VTTL.
In relative terms, the VAT Gap in Romania was the largest in the EU.
o/w liability on GFCF 15046 20944 16978 18959 15927
o/w net adjustments 2924 1848 3025 2669 2306
VAT Revenue 49066 51745 51086 57520 49253
VAT GAP 30987 33067 34485 30263 27557
VAT GAP as a
percent of VTTL 39% 39% 40% 34% 36%
VAT GAP change
since 2012
-3 pp
39% 39% 40%34% 36%
0%
10%
20%
30%
40%
50%
0
20000
40000
60000
80000
100000
2012 2013 2014 2015 2016
GAP % VTTL Revenues
page 46 of 82
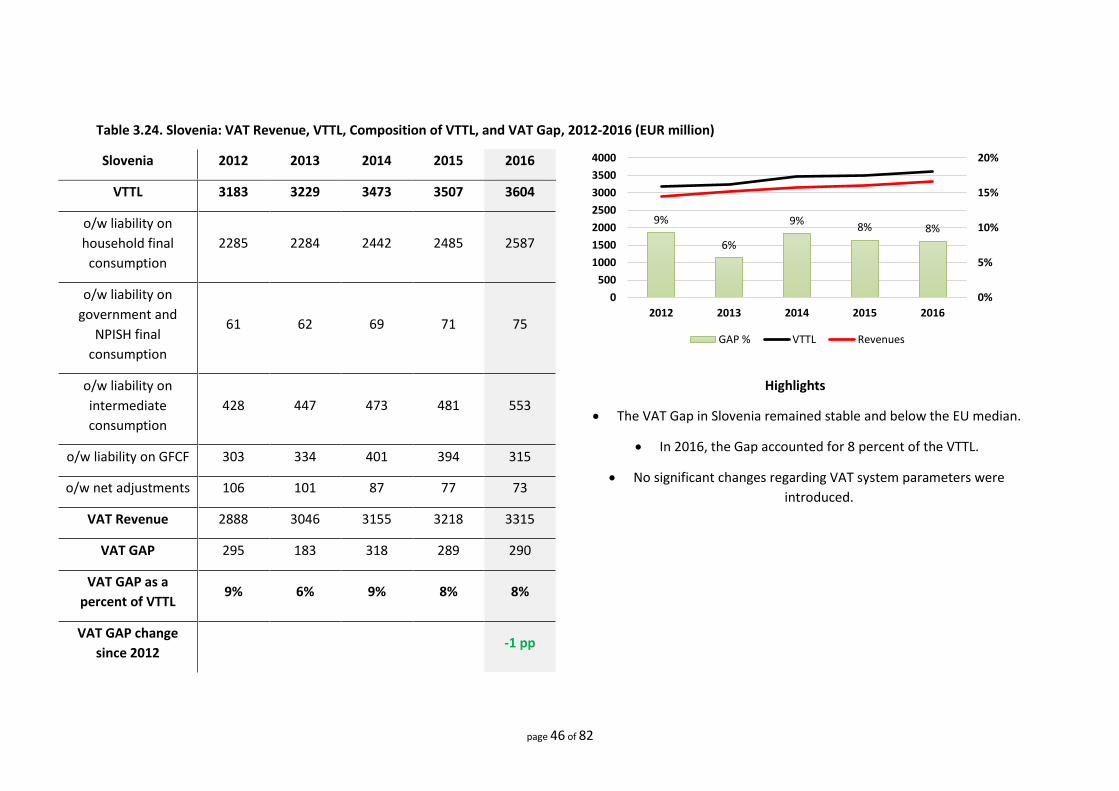
Table 3.24. Slovenia: VAT Revenue, VTTL, Composition of VTTL, and VAT Gap, 2012-2016 (EUR million)
Slovenia 2012 2013 2014 2015 2016
VTTL 3183 3229 3473 3507 3604
o/w liability on
household final
consumption
2285 2284 2442 2485 2587
o/w liability on
government and
NPISH final
consumption
61 62 69 71 75
o/w liability on
intermediate
consumption
428 447 473 481 553
Highlights
The VAT Gap in Slovenia remained stable and below the EU median.
In 2016, the Gap accounted for 8 percent of the VTTL.
No significant changes regarding VAT system parameters were
introduced.
o/w liability on GFCF 303 334 401 394 315
o/w net adjustments 106 101 87 77 73
VAT Revenue 2888 3046 3155 3218 3315
VAT GAP 295 183 318 289 290
VAT GAP as a
percent of VTTL 9% 6% 9% 8% 8%
VAT GAP change
since 2012
-1 pp
9%
6%
9%8% 8%
0%
5%
10%
15%
20%
0
500
1000
1500
2000
2500
3000
3500
4000
2012 2013 2014 2015 2016
GAP % VTTL Revenues
page 47 of 82
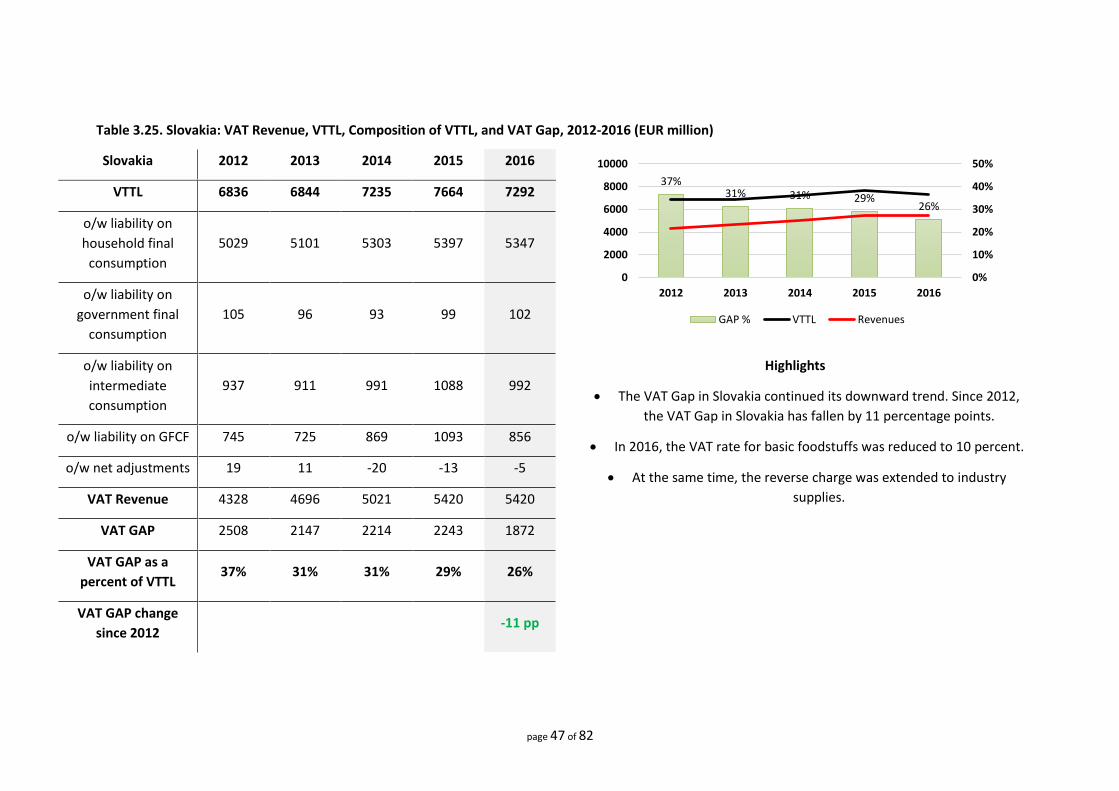
Table 3.25. Slovakia: VAT Revenue, VTTL, Composition of VTTL, and VAT Gap, 2012-2016 (EUR million)
Slovakia 2012 2013 2014 2015 2016
VTTL 6836 6844 7235 7664 7292
o/w liability on
household final
consumption
5029 5101 5303 5397 5347
o/w liability on
government final
consumption
105 96 93 99 102
o/w liability on
intermediate
consumption
937 911 991 1088 992
Highlights
The VAT Gap in Slovakia continued its downward trend. Since 2012,
the VAT Gap in Slovakia has fallen by 11 percentage points.
In 2016, the VAT rate for basic foodstuffs was reduced to 10 percent.
At the same time, the reverse charge was extended to industry
supplies.
o/w liability on GFCF 745 725 869 1093 856
o/w net adjustments 19 11 -20 -13 -5
VAT Revenue 4328 4696 5021 5420 5420
VAT GAP 2508 2147 2214 2243 1872
VAT GAP as a
percent of VTTL 37% 31% 31% 29% 26%
VAT GAP change
since 2012
-11 pp
37%31% 31% 29%
26%
0%
10%
20%
30%
40%
50%
0
2000
4000
6000
8000
10000
2012 2013 2014 2015 2016
GAP % VTTL Revenues
page 48 of 82
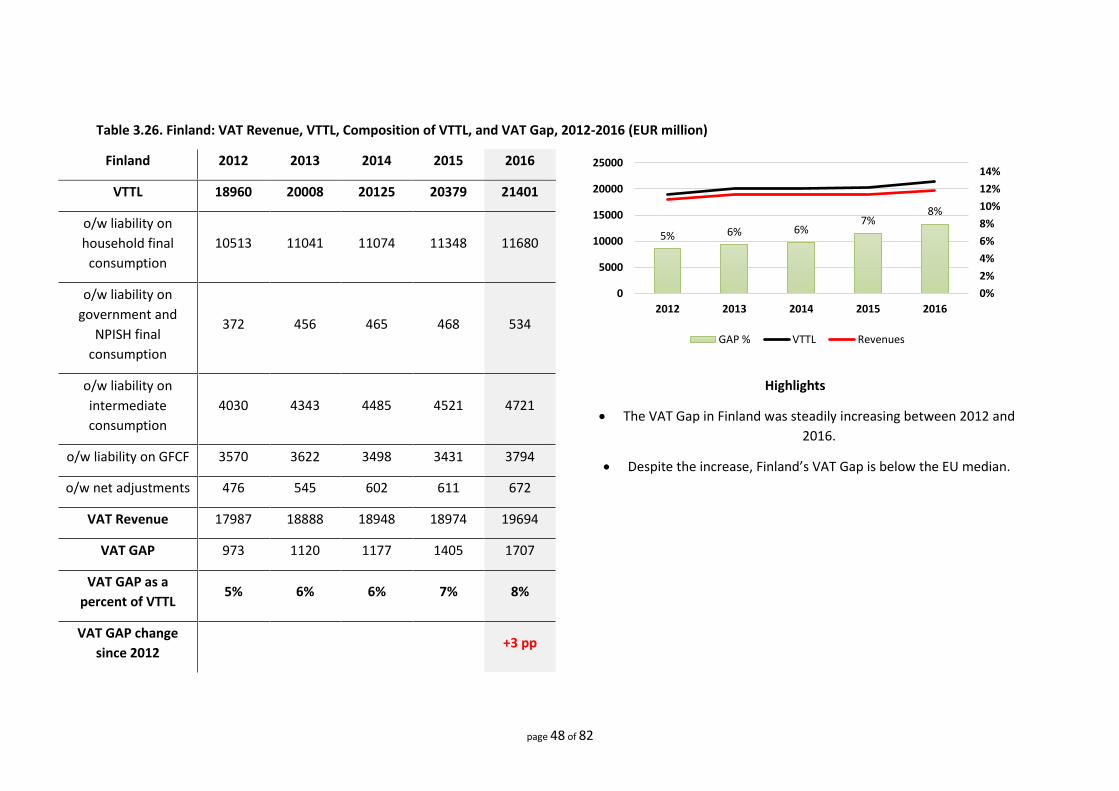
Table 3.26. Finland: VAT Revenue, VTTL, Composition of VTTL, and VAT Gap, 2012-2016 (EUR million)
Finland 2012 2013 2014 2015 2016
VTTL 18960 20008 20125 20379 21401
o/w liability on
household final
consumption
10513 11041 11074 11348 11680
o/w liability on
government and
NPISH final
consumption
372 456 465 468 534
o/w liability on
intermediate
consumption
4030 4343 4485 4521 4721
Highlights
The VAT Gap in Finland was steadily increasing between 2012 and
2016.
Despite the increase, Finland’s VAT Gap is below the EU median.
o/w liability on GFCF 3570 3622 3498 3431 3794
o/w net adjustments 476 545 602 611 672
VAT Revenue 17987 18888 18948 18974 19694
VAT GAP 973 1120 1177 1405 1707
VAT GAP as a
percent of VTTL 5% 6% 6% 7% 8%
VAT GAP change
since 2012 +3 pp
5% 6% 6%7%
8%
0%
2%
4%
6%
8%
10%
12%
14%
0
5000
10000
15000
20000
25000
2012 2013 2014 2015 2016
GAP % VTTL Revenues
page 49 of 82
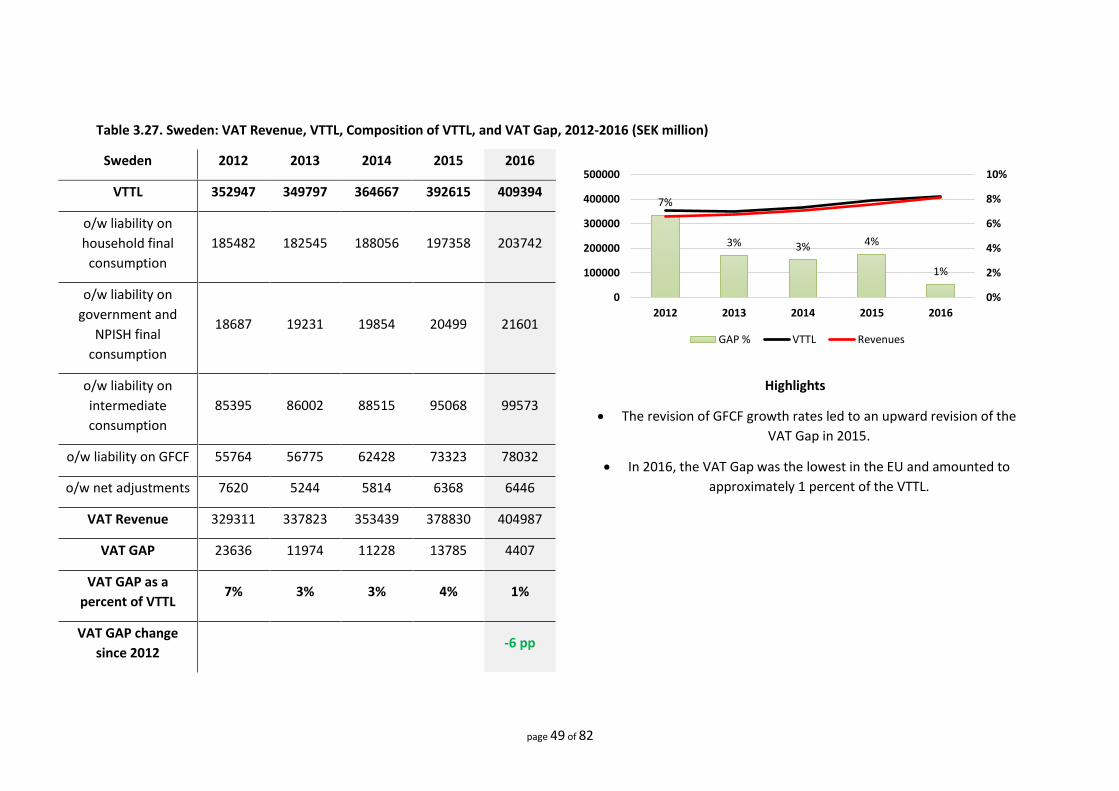
Table 3.27. Sweden: VAT Revenue, VTTL, Composition of VTTL, and VAT Gap, 2012-2016 (SEK million)
Sweden 2012 2013 2014 2015 2016
VTTL 352947 349797 364667 392615 409394
o/w liability on
household final
consumption
185482 182545 188056 197358 203742
o/w liability on
government and
NPISH final
consumption
18687 19231 19854 20499 21601
o/w liability on
intermediate
consumption
85395 86002 88515 95068 99573
Highlights
The revision of GFCF growth rates led to an upward revision of the
VAT Gap in 2015.
In 2016, the VAT Gap was the lowest in the EU and amounted to
approximately 1 percent of the VTTL.
o/w liability on GFCF 55764 56775 62428 73323 78032
o/w net adjustments 7620 5244 5814 6368 6446
VAT Revenue 329311 337823 353439 378830 404987
VAT GAP 23636 11974 11228 13785 4407
VAT GAP as a
percent of VTTL 7% 3% 3% 4% 1%
VAT GAP change
since 2012
-6 pp
7%
3% 3% 4%
1%
0%
2%
4%
6%
8%
10%
0
100000
200000
300000
400000
500000
2012 2013 2014 2015 2016
GAP % VTTL Revenues
page 50 of 82
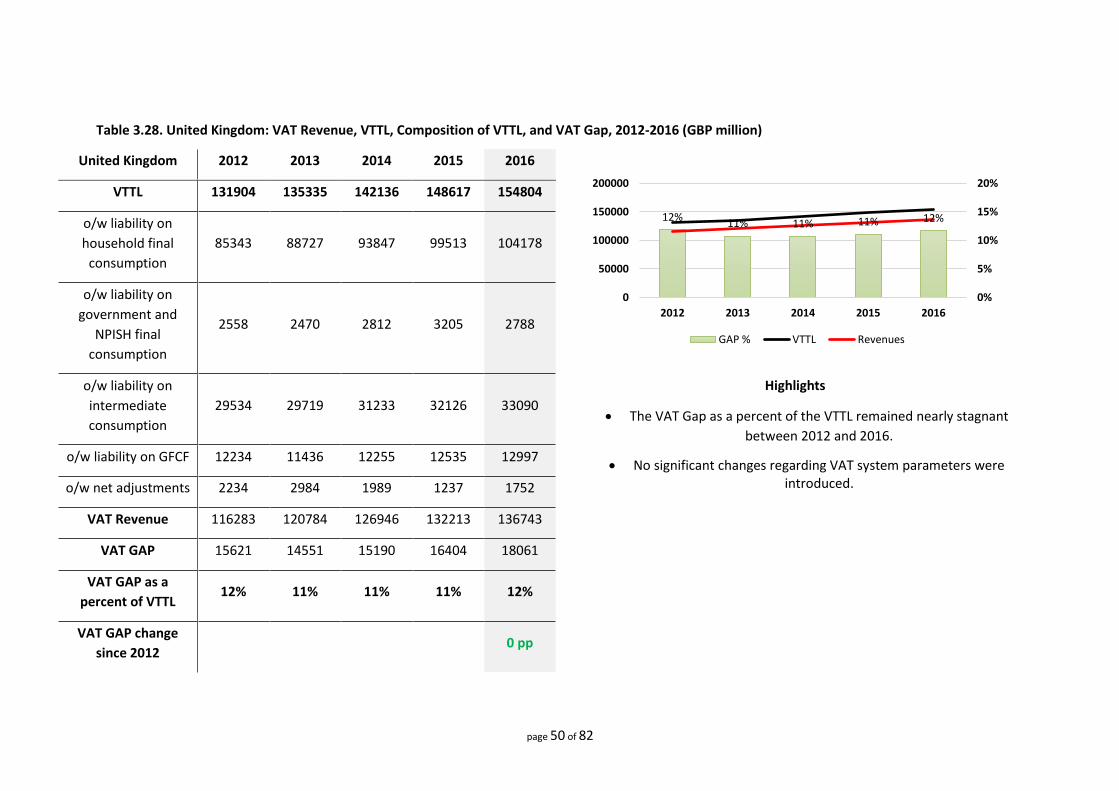
Table 3.28. United Kingdom: VAT Revenue, VTTL, Composition of VTTL, and VAT Gap, 2012-2016 (GBP million)
United Kingdom 2012 2013 2014 2015 2016
VTTL 131904 135335 142136 148617 154804
o/w liability on
household final
consumption
85343 88727 93847 99513 104178
o/w liability on
government and
NPISH final
consumption
2558 2470 2812 3205 2788
o/w liability on
intermediate
consumption
29534 29719 31233 32126 33090
Highlights
The VAT Gap as a percent of the VTTL remained nearly stagnant
between 2012 and 2016.
No significant changes regarding VAT system parameters were introduced.
o/w liability on GFCF 12234 11436 12255 12535 12997
o/w net adjustments 2234 2984 1989 1237 1752
VAT Revenue 116283 120784 126946 132213 136743
VAT GAP 15621 14551 15190 16404 18061
VAT GAP as a
percent of VTTL 12% 11% 11% 11% 12%
VAT GAP change
since 2012
0 pp
12%11% 11% 11% 12%
0%
5%
10%
15%
20%
0
50000
100000
150000
200000
2012 2013 2014 2015 2016
GAP % VTTL Revenues
VAT Gap in the EU-28 Member States
page 51 of 82
IV. Policy Gap Measures
In this Chapter, we present an update of the series of estimates of the Policy Gap and its
components for the EU-28.
As discussed in the 2016 Report, the Policy Gap captures the effects of applying multiple rates and
exemptions on the theoretical revenue that could be levied in a given VAT system. In other words,
the Policy Gap is an indicator of the additional VAT revenue that a MS could theoretically (i.e. in
the case of perfect tax compliance) generate if it applied a uniform VAT rate on all goods and
services. Due to the idealistic assumption of perfect tax compliance, the practical interpretation
of the Policy Gap draws criticism. Nonetheless, the assumption of perfect VAT collectability is
indispensable, as interdependencies between tax compliance and rate structure are not
straightforward.
The Policy Gap could be further decomposed into different components of revenue loss, as we
show in Section IV in Annex A. Such elements are, for instance, the Rate Gap and the Exemption
Gap, which capture the loss in VAT liability due to the application of reduced rates, and the loss in
liability due to the implementation of exemptions.
Moreover, following Barbone et al. (2013), the Policy Gap and its components could be further
adjusted to address the issue of the extent to which the loss of theoretical revenue depends on
the decisions of policymakers. Measures that exclude liability from the final consumption of
“imputed rents” (the notional value of home occupancy by homeowners), financial services, and
the provision of public goods and services, as charging them with VAT is impractical or beyond the
control of national authorities, are named the “Actionable Gaps”.
V. Policy Gap measures for 2016
The estimates of the Policy Gap, Rate Gap, Exemption Gap, Actionable Policy Gap, and Actionable
Exemption Gap for the EU-28 MS are presented in Table 4.1.
For the EU overall, the average Policy Gap level was 44.8 percent, roughly 0.9 percentage points
higher r than in 2015. More specifically, VAT from final consumption and investment, even in the
case of 100 percent compliance, generates just slightly more than half of what it could bring in if
taxed uniformly at the full rate. Of this 44.8 percent, 10 percentage points are due to the
application of various reduced and super reduced rates (the Rate Gap).
According to the Rate Gap estimates, reduced rates are least applied in Denmark (0.93 percent)
and Estonia (2.97 percent), and installing a uniform Standard Rate would generate less than 3
percent of notional additional revenue in these countries. On the other side of spectrum are
countries with the highest Rate Gaps: Cyprus’ revenue could increase by nearly 27 percent, and in
Ireland, Luxembourg, Malta, and Poland, by more than 15 percent if they applied only the
Standard Rate.
The Exemption Gap, or the average share of Ideal Revenue lost due to various exemptions, is 35
percent in the EU on average. MS with the highest Exemption Gap are Spain (46.71 percent) due
to the application of other than VAT indirect taxes in the Canary Islands, Ceuta, and Melilla, the
UK (44.47 percent), and Denmark (42.00 percent), whereas the lowest values of the Exemption
VAT Gap in the EU-28 Member States
page 52 of 82
Gap were observed in Cyprus (16.76 percent), Romania (24.88 percent), and Luxembourg (25.16
percent).
The largest part of the Exemption Gap is composed of exemptions on services that cannot be taxed
in principle, such as imputed rents, the provision of public goods by the government, or financial
services. The remaining level of the “Actionable” Exemption Gap is about 6.5 percent, on average.
The Actionable Policy Gap—a combination of the Rate Gap and the Actionable Exemption Gap—
is, on average, 16.48 percent. This figure shows the combined reduction of Ideal Revenue due to
reduced rates (9.95%) and exemptions (6.53%) which could possibly be removed. In other words,
VAT revenue would increase by roughly 16.5 percent if MS applied the Standard Rate of VAT on
the goods and services without exemptions that could be subject to such a rate.
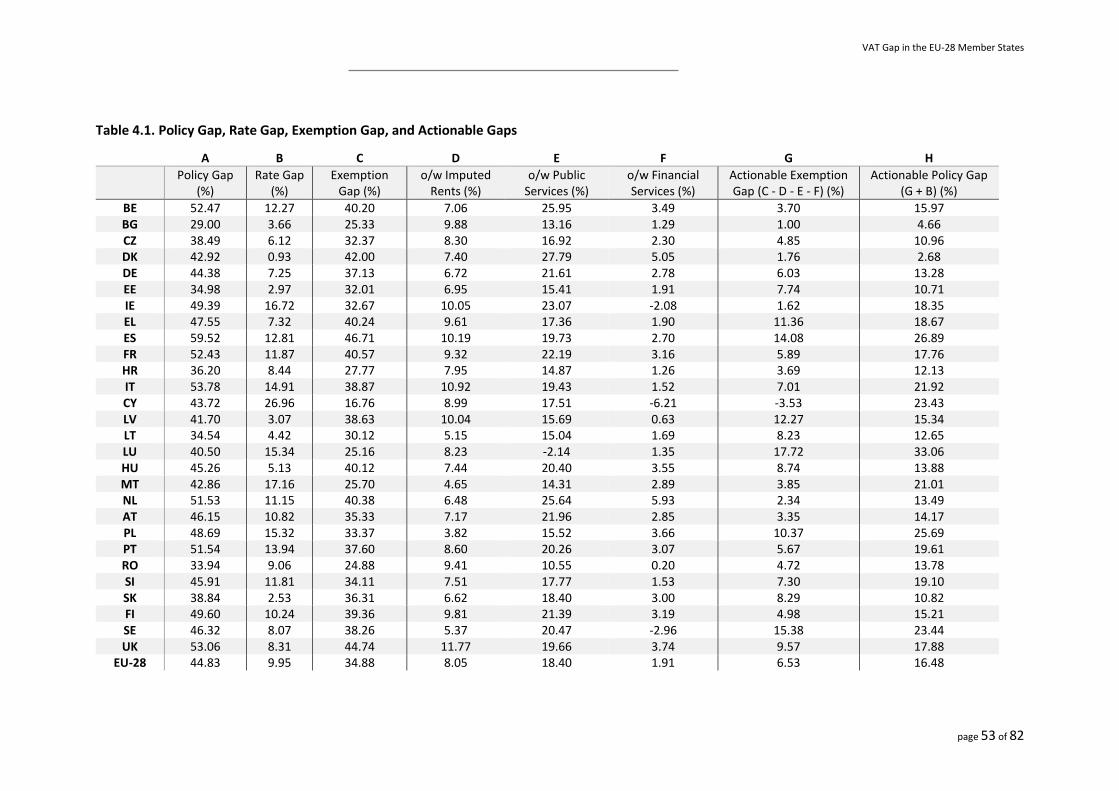
VAT Gap in the EU-28 Member States
page 53 of 82
Table 4.1. Policy Gap, Rate Gap, Exemption Gap, and Actionable Gaps
A B C D E F G H Policy Gap
(%) Rate Gap
(%) Exemption
Gap (%) o/w Imputed
Rents (%) o/w Public
Services (%) o/w Financial Services (%)
Actionable Exemption Gap (C - D - E - F) (%)
Actionable Policy Gap (G + B) (%)
BE 52.47 12.27 40.20 7.06 25.95 3.49 3.70 15.97 BG 29.00 3.66 25.33 9.88 13.16 1.29 1.00 4.66 CZ 38.49 6.12 32.37 8.30 16.92 2.30 4.85 10.96 DK 42.92 0.93 42.00 7.40 27.79 5.05 1.76 2.68 DE 44.38 7.25 37.13 6.72 21.61 2.78 6.03 13.28 EE 34.98 2.97 32.01 6.95 15.41 1.91 7.74 10.71 IE 49.39 16.72 32.67 10.05 23.07 -2.08 1.62 18.35 EL 47.55 7.32 40.24 9.61 17.36 1.90 11.36 18.67 ES 59.52 12.81 46.71 10.19 19.73 2.70 14.08 26.89 FR 52.43 11.87 40.57 9.32 22.19 3.16 5.89 17.76 HR 36.20 8.44 27.77 7.95 14.87 1.26 3.69 12.13 IT 53.78 14.91 38.87 10.92 19.43 1.52 7.01 21.92 CY 43.72 26.96 16.76 8.99 17.51 -6.21 -3.53 23.43 LV 41.70 3.07 38.63 10.04 15.69 0.63 12.27 15.34 LT 34.54 4.42 30.12 5.15 15.04 1.69 8.23 12.65 LU 40.50 15.34 25.16 8.23 -2.14 1.35 17.72 33.06 HU 45.26 5.13 40.12 7.44 20.40 3.55 8.74 13.88 MT 42.86 17.16 25.70 4.65 14.31 2.89 3.85 21.01 NL 51.53 11.15 40.38 6.48 25.64 5.93 2.34 13.49 AT 46.15 10.82 35.33 7.17 21.96 2.85 3.35 14.17 PL 48.69 15.32 33.37 3.82 15.52 3.66 10.37 25.69 PT 51.54 13.94 37.60 8.60 20.26 3.07 5.67 19.61 RO 33.94 9.06 24.88 9.41 10.55 0.20 4.72 13.78 SI 45.91 11.81 34.11 7.51 17.77 1.53 7.30 19.10 SK 38.84 2.53 36.31 6.62 18.40 3.00 8.29 10.82 FI 49.60 10.24 39.36 9.81 21.39 3.19 4.98 15.21 SE 46.32 8.07 38.26 5.37 20.47 -2.96 15.38 23.44 UK 53.06 8.31 44.74 11.77 19.66 3.74 9.57 17.88
EU-28 44.83 9.95 34.88 8.05 18.40 1.91 6.53 16.48
VAT Gap in the EU-28 Member States
page 54 of 82
V. Econometric Analysis of VAT Gap Determinants
a. Literature Review
The seminal work on tax evasion is Allingham and Sandmo (1972). This was applied to personal
income taxation. Within this theoretical framework, taxpayers decide the amount of tax evasion
just as they would choose the composition of a risky investment portfolio—that is, depending on
the expected return from evading taxes and given how they assess in terms of welfare the impact
of the risk (risk-averse versus risk-neutral individuals). This is the deterrence model. The higher
the penalty rate or the higher the tax audit probability, the lower the amount of tax evasion. An
increase in the tax rate points to lower levels of evasion as long as the penalty is calculated based
on the amount of evaded taxes rather than on the amount of evaded tax base (Yitzhaki, 1974).
While the results of the model in terms of the marginal impact of the tax parameters on the level
of evasion are sensible, its predictions—based on numerical simulations—regarding the level of
tax evasion are not credible. The estimated level of tax evasion is too low given reasonable levels
of the key tax parameters of the model—in particular, of the tax audit probability (see also the
review by Andreoni et al., 1998).
In Allingham and Sandmo’s (1972) model, the audit probability is fixed. This probably does not fit
well with reality. Some taxpayers are more likely to be audited than others. Hence, the whole
population cannot be condensed into a single model with a single tax audit probability. If so, as
we observe in reality, the level of tax evasion will differ across groups of taxpayers. For example,
employee taxpayers, whose income is subject to third-party reporting by means of withholding
taxes, face a tax audit probability of one as long as they underreport income, which is in contrast
with the self-employed. This causes noncompliance to differ across these two groups, with there
being full tax compliance for those under third-party reporting (see, e.g., Kleven et al., 2011).
Therefore, the diversity of tax audit probabilities, which can be as high as one due to third-party
reporting, reduces the discrepancy between the predicted levels of tax evasion by the deterrence
model and reality. However, there are other factors that contribute to the explanation of higher
levels of tax compliance with respect to those predicted by the deterrence model. One theoretical
approach lies with the sense of civic duty to comply with tax obligations, regardless of the financial
incentives taxpayers face. That is, individuals are intrinsically motivated to comply with the law, a
line of reasoning that has been developed by the literature on “tax morale” (see a recent survey
by Luttmer and Singhal, 2014). Evasion might also be determined by the attitude of taxpayers
towards tax authorities, such as if they view legal authorities as legitimate (Tyler, 2006) or if
taxpayers feel active in the decision making process (Alm et al., 1993). Hence, in the end, the level
of tax morale might also be contingent on the taxpayers’ institutional and social context.
Most of the literature on tax evasion has been applied to personal income taxation; or, we should
rather say, to situations where the potential evader is an individual. Nevertheless, as we will see
in the next section, in the case of VAT, it is crucial to distinguish between individuals (final
consumers and the self-employed) and corporations, as they both play a role in the decision to
evade VAT. In the case of corporations, whether the standard models of tax evasion apply or not
depends on whether the penalty for tax evasion applies to shareholders or to the tax director
VAT Gap in the EU-28 Member States
page 55 of 82
(Crocker and Slemrod, 2005). From now on, we will assume that the basic results of the literature
regarding the determinants of tax compliance also apply to corporations. In any case, next, we will
make clear what variables might explain the incentives to generate a tax gap taking into account
the peculiarities of the tax under study: the VAT.
b. Econometric Model and Estimation Results
It is key to recall that in the EU, VAT is based on an invoicing mechanism. In any transaction, the
seller issues an invoice and charges the output tax to the buyer. That amount of money minus the
amount of VAT paid by the seller (input tax) has to be transferred to the tax administration. This
is the basis of the self-enforcement mechanism, which a priori promotes voluntary tax
compliance;6 the seller has incentives to charge the tax in order to get back the money from input
taxes. An exception to this lies in the incentives of final consumers. As they will not be able to
deduct the input tax, they face some incentives to evade taxes. However, they require that the
retailer accedes not to charge the output tax. Hence, they both play a role in the decision to evade
taxes. This is a legal framework that departs from the theoretical models reviewed in Section V.a.
and has to be acknowledged when one attempts to identify the determinants of non-compliance
in VAT. As we will explain below, another situation that might generate a VAT Gap is when the
VAT chain (i.e. the duo output-input tax) is broken. Essentially, this relates to intracommunity and
international transactions and will be explained below.
Basic Framework: the Agents Involved
In accordance with our previous explanations, there are two private agents involved in our tax
setting: the seller and the buyer. There is also the tax administration. The peculiar incentives of
each agent are explained next.
(i) Private Agents
As we described in Section V.a., VAT is a tax where the incentives for self-enforcement might
mitigate the existence of fraud. This is why the literature defines VAT as a “money machine” (Keen
and Lockwood, 2006). As long as the chain of VAT is not broken, all involved agents—who have
previously paid the input tax and will claim this amount to the tax administration—have incentives
to charge the tax to the purchaser (output tax). That is, under a very simplified setting, the
producer charges the wholesaler, the latter charges the retailer, and, lastly, the retailer charges
the final consumer. VAT facilitates tax enforcement by generating paper trails on transactions
between firms (Pomeranz, 2015).
In the last stage, as the final consumer cannot deduct VAT, she does not have incentives to pay
the tax. Evasion at this final stage, though, requires the intervention of both the final consumer
and the retailer; in particular, as Fedeli and Forte (1999) argue, given both agents’ incentives, the
final outcome will be the result of a negotiation between both sides of the transaction. While the
incentive to evade on the consumer side is a necessary condition, this is not sufficient, as she
needs the involvement of the seller. All in all, in an econometric model, to estimate the
6 In fact, the theoretical literature has stressed this positive characteristic of the tax (i.e. self-enforcing mechanism) to justify its inclusion in the tax system despite the existence of a personal income tax (Boadway et al., 1994).
VAT Gap in the EU-28 Member States
page 56 of 82
determinants of VAT Gap, we need to include variables proxying the behaviour of both private
agents. Note that as long as the retailer faces a “demand” by the final consumer not to charge the
tax, the retailer might also try to negotiate with the wholesaler not to pay the input tax, and
analogously to previous phases of the productive chain. There might be a cascade tax evasion
effect upwards.
As is noted in the introduction to the Report, VAT Gap is not only a measure of tax evasion. It also
includes VAT lost due to, for example, insolvencies, bankruptcies, administrative errors and legal
tax optimisation, and criminal activities, namely tax fraud. The other components of the Gap are
also addressed by this analysis.
The two most popular schemes are distinguished as potential sources of tax fraud. First, we
distinguish a scheme where a fraudulent trader supplies goods to other businesses, collects the
VAT due on the supply from his customers, and disappears before remitting the VAT to the tax
authorities. This type of fraud exists in the zero-rated intra-Community supply of goods and is
called Missing Trader Intra-Community (MTIC). In recent years, MTIC became one of the main
sources of VAT non-compliance. MTIC fraud may take different forms and sizes, but the basic idea
behind it is essentially the same and relies on the fact that no VAT is chargeable on cross-border
transactions between two or more EU MS.
Secondly, we control for the possible non-payment of VAT on imports to the European Common
Market (ECM) under the Customs Procedure Code 42 (CPC42). This procedure is applied when
goods enter the EU in one MS and later, under duty-suspension, are transported to another MS.
In such cases, the VAT is only due in the latter—the country of destination. As the VAT chain is
broken, there is a risk of fraud, either if the imports remain in the MS of importation without
payment of VAT or if the imports are consumed in the country of destination without VAT being
collected there. Consequently, the effectiveness of this special regime—that is, that the chain of
VAT should be initiated in the country of destination—depends on the control of customs at the
entry country and on coordination with the destination tax administration.
In summary, we have two different scenarios as far as VAT fraud is concerned. In the first one,
generally a basic B2C domestic transaction, the VAT chain is not broken and both agents involved
in the corresponding transaction are located in the same MS. In this setting, our empirical
framework should take into account the incentives (or level of ease) of consumers and sellers to
evade. In the second one, the VAT chain is broken, and we should account for the importance of
CPC42 by country. We will explain later what variables might pick up both types of scenarios, with
a particular emphasis—due to data availability and research focus—on the first situation.
(ii) Tax Administration
Given the incentives of taxpayers to evade taxes, the role of the tax administration involves
diminishing its impact (see the recent review by Slemrod and Gillitzer, 2014). To do so, the tax
administration might promote tax compliance—that is, it might attempt to reduce the existence
of tax fraud in advance (ex-ante control). But given its existence, it might try to reduce it by means
of the efforts of tax inspectors in discovering it (ex-post control). Consequently, tax
administrations make ex-ante and ex-post efforts, although it is particularly desirable—aligned
with a collaborative tax administration (IMF, 2015; or OECD, 2017)—to promote voluntary tax
VAT Gap in the EU-28 Member States
page 57 of 82
compliance. Regarding the incentives to comply with the tax law, the deterrence model described
in Section V.a. fits well with ex-ante control incentives.
In our empirical framework, we estimate the impact of the ex-ante role of the tax administration.
This focus is due to the nature of our endogenous variable. According to the literature, we
estimated the gross tax gap—that is, the gap before the tax administration has carried out any
effort to close it by means of tax auditing. Therefore, we account for variables proxying the impact
of the administration on voluntary tax compliance.
Basic Framework: Variables to Explain Agents’ Incentives
In this Section, in accordance with the agents involved in VAT transactions (including the tax
administration), we identify the variables we employed to estimate their (positive or negative)
impact on the VAT Gap.
(i) Private Agent Variables
Private agents’ behaviour will be mediated by the incentives created by the tax administration—
that is, the deterrent effect as we explained in Section V.a. The variables picking up this effect will
be described in detail (definition, statistical descriptives, and data sources) in the section about
the tax administration’s variables. Independent of these variables (basically, efforts of the tax
administration to force tax compliance), there are other incentives that might also have an impact
on taxpayers’ incentives.
As we explained in the basic framework, individuals7 may have an intrinsic incentive to comply
with the tax law. That is, they might show a given level of tax morale. Tax morale is certainly an
intrinsic motivation, but there are also context factors that could affect it. In particular, Age
structure (Age), usually the literature assumes that older people are more aware of the benefits
of adopting a prosocial behaviour. Hence, we will include in the regression the percentage of
people over 50 years old as a proxy of tax morale.8
Age structure could be picking up other factors with an impact on the VAT Gap. This is why its
estimate should be taken with caution. As we will explain later, we estimate a fixed effects model,
and while the fixed effect itself cannot be economically interpreted, the fixed effects will capture
the intrinsic factors which explain tax morale.
Taxpayers might suffer from liquidity constraints. If so, tax evasion could be interpreted as a risky
loan where the expected penalty rate is part of the financial cost (Andreoni, 1992). In fact, this
constraint could affect both businesses (either incorporated or not) and final consumers. We will
7 As we explained in this section, by individuals we strictly refer to final consumers and the self-employed
(when they play the role of sellers of goods or services). However, for the sake of simplicity, we will assume incorporated firms also face the same incentives. In any case, what is also important to note here is that variables like age structure might also have an impact on sellers as long as those characteristics might create an incentive for them to engage in tax evasion activities. This is not crucial to our empirical analysis, as we only want to know what the determinants are rather than what is the role played by each agent. 8 This range of age might be too wide, but we wanted to include taxpayers who are still active; otherwise,
if we define it in a more restrictive way (for example, above 65 years old), we would be picking up retired people, for whom the nature of their most likely main source of income (pensions) is very peculiar.
VAT Gap in the EU-28 Member States
page 58 of 82
control for this potential impact through the unemployment rate (Unemp). The incentive to free
ride, and so to avoid paying taxes, can also be affected by the perception of how well public
revenues are spent or by the perception about the performance of the public sector, as we
explained earlier. In particular, as Godin and Hindriks indicate (2015, p. 47), the quality of the
government—that is, the degree of independence the tax administration from political pressures,
but also the quality of policy formulation and implementation—affects the effectiveness of the
tax system (Godin and Hindriks, 2015). We will account for this potential impact by means of a
country variable of government effectiveness (Gov’t Effect), which was constructed by the World
Bank.
Most of the previous variables have to do with an individual’s (including the self-employed)
incentives to comply with tax law. The exception is probably the variable picking up the existence
of liquidity constraints, although Andreoni’s (1992) theoretical analysis focuses on individuals.
As we suggested, the main origin of the VAT Gap lies in the incentives of final consumers not to
pay the tax. Hence, ceteris paribus, the productive structure of the economy could be important.
This is why in our regression models we include as explanatory variables the productive structure
of the country; in particular, we distinguish the following sectors: retail (Sellers), which could be
the key sector, along with other labour-intensive sectors; as well as real estate (Estate),
construction (Constr), industry (Ind), telecommunications (Teleco), and art (Art). The sum of all
shares amounts to 100 percent once we have excluded those sectors that are not subject to or
are exempted from VAT (such as health, education, or financial services). The success of our
empirical model lies in the fact that our explanatory variables are time variant; otherwise, the
influence would be captured as a fixed effect. Unfortunately for our purposes, VAT tax rates do
not change very often; hence, we will not be able to estimate their impact on the Gap.9 Instead,
we will control for the dispersion of tax rates (within a country) (Disp)—that is, the standard
deviation of tax rates given the potential existence of reduced and super-reduced tax rates, apart
from the standard tax rate. In this case, there is more within-variation over time. We include this
variable because of the potential effect that the dispersion of rates has on the VAT Gap, as the
wider the dispersion, the greater the benefits from a misapplication of reduced and super-reduced
rates.
Finally, as further controls in all regressions, we have included population (Pop) and GDP per capita
(GDPpc).
(ii) Tax Administration Variables
To infer the impact of the tax administration, principally in accordance with the deterrence model,
we will employ variables that promote voluntary tax compliance. In particular, we require
variables that pick up the expected efforts of the tax administration to close the tax gap ex-ante.
Hence, ceteris paribus, the greater the expected efforts of the administration, the greater the level
of voluntary tax compliance, and so the lower the gross tax gap. This is the hypothesis we want to
9 Ideally, we would have liked to control for firm size as well. A priori, one could argue small firms are more
likely (probably, due to relatively lower expected control from the tax administration) to accept the demand of final consumers not to charge the output tax. However, this variable does not show much within-variation over time. Thus, we have the same problem we found with VAT tax rates: we cannot identify its impact. This is left for future research.
VAT Gap in the EU-28 Member States
page 59 of 82
test with respect to the behaviours of the tax administration. Note that to account for
expectations, we will include these variables lagged one period.
In particular, we have used the following three variables:
- Scale of the Tax Administration (Scale), constructed as the ratio of total administrative costs divided by GDP;
- Information and Technology Expenditure (IT Exp), constructed as the share of information and technology expenditures over total administrative costs; and
- Public Deficit (Def), the tax administration might have greater incentives to close the tax gap and, in our case, to promote voluntary tax compliance when public finances are in a worse financial condition (Esteller-Moré, 2005).
The first variable is picking up the scale of the tax administration primarily through the number of
tax professionals in the administration, and the second one is picking up the nature of that
expenditure. In particular, we will test whether greater emphasis on information and technology
promotes voluntary tax compliance either as a deterrent to fraud or simply as a way to facilitate
the taxpayer to comply ex-ante with tax obligations.
Empirical Application
In this section, first, we provide an overview of the data we employ for the empirical analysis, and
next, we explain the empirical methodology of the analysis and show the results.
(i) Descriptive Statistics and Sources
Table 5.1 shows the descriptive statistics of the variables used in the econometric model. For every
variable, we have the number of observations, the unity of measure, the mean, the standard
deviation, and the minimum and maximum values. There are 420 observations of VAT Gap. The
average value of these observations is 16.45 percent, with a standard deviation of 10.51, a
minimum value of -1.42 percent (Sweden, 2015), and a maximum of 49.28 percent (Romania,
2009). The ratio of total administrative costs divided by GDP (Scale) is available 290 times, with a
mean value of 0.28 percent, a standard deviation of 0.46, a minimum value of 0.04 percent (Malta,
2004), and a maximum value of 5.75 percent (Slovakia, 2003). Finally, for example, the share of
information and technology expenditures over total administrative costs (IT Exp), with 201
observations, has a mean value of 10.16 percent, a standard deviation of 6.96, a minimum value
of 0.1 percent (Malta, 2012), and a maximum value of 27.8 percent (Finland, 2012).
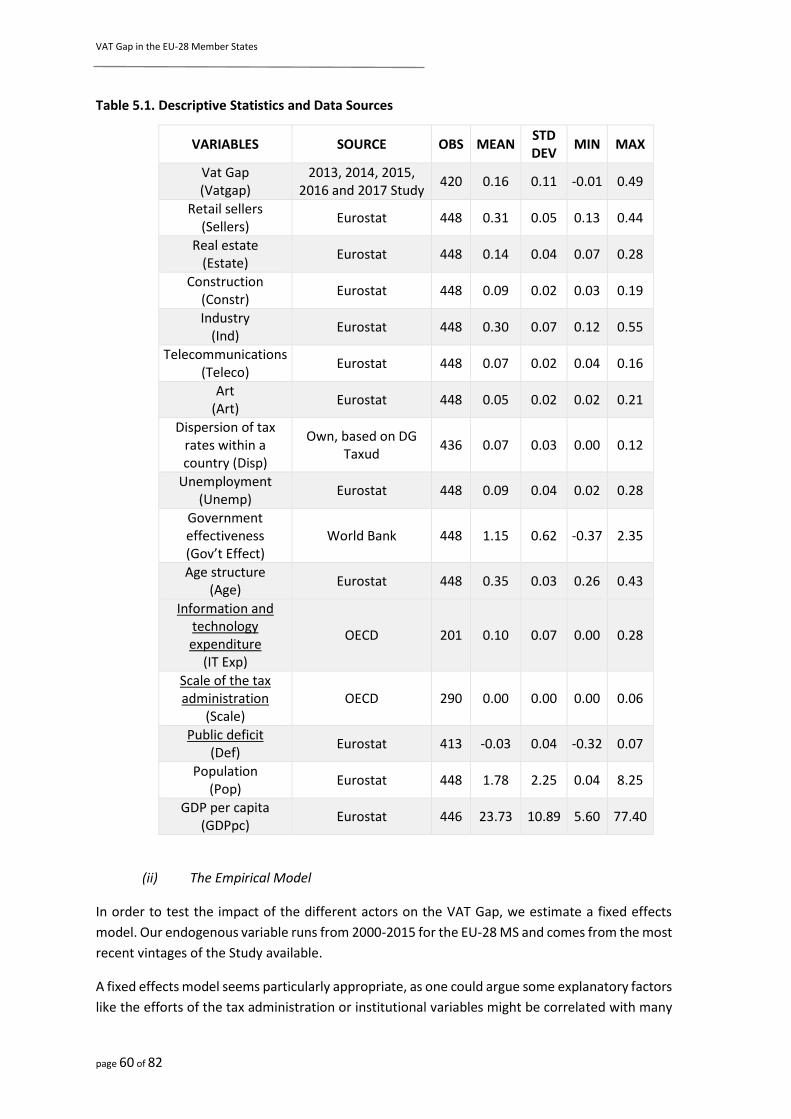
VAT Gap in the EU-28 Member States
page 60 of 82
Table 5.1. Descriptive Statistics and Data Sources
VARIABLES SOURCE OBS MEAN STD DEV
MIN MAX
Vat Gap (Vatgap)
2013, 2014, 2015, 2016 and 2017 Study
420 0.16 0.11 -0.01 0.49
Retail sellers (Sellers)
Eurostat 448 0.31 0.05 0.13 0.44
Real estate (Estate)
Eurostat 448 0.14 0.04 0.07 0.28
Construction (Constr)
Eurostat 448 0.09 0.02 0.03 0.19
Industry (Ind)
Eurostat 448 0.30 0.07 0.12 0.55
Telecommunications (Teleco)
Eurostat 448 0.07 0.02 0.04 0.16
Art (Art)
Eurostat 448 0.05 0.02 0.02 0.21
Dispersion of tax rates within a country (Disp)
Own, based on DG Taxud
436 0.07 0.03 0.00 0.12
Unemployment (Unemp)
Eurostat 448 0.09 0.04 0.02 0.28
Government effectiveness (Gov’t Effect)
World Bank 448 1.15 0.62 -0.37 2.35
Age structure (Age)
Eurostat 448 0.35 0.03 0.26 0.43
Information and technology expenditure
(IT Exp)
OECD 201 0.10 0.07 0.00 0.28
Scale of the tax administration
(Scale) OECD 290 0.00 0.00 0.00 0.06
Public deficit (Def)
Eurostat 413 -0.03 0.04 -0.32 0.07
Population (Pop)
Eurostat 448 1.78 2.25 0.04 8.25
GDP per capita (GDPpc)
Eurostat 446 23.73 10.89 5.60 77.40
(ii) The Empirical Model
In order to test the impact of the different actors on the VAT Gap, we estimate a fixed effects
model. Our endogenous variable runs from 2000-2015 for the EU-28 MS and comes from the most
recent vintages of the Study available.
A fixed effects model seems particularly appropriate, as one could argue some explanatory factors
like the efforts of the tax administration or institutional variables might be correlated with many
VAT Gap in the EU-28 Member States
page 61 of 82
other factors that are not included in the regressions. As we suggested before, though, the
drawback is that we will not be able to interpret the estimates of the fixed effects, nor will we be
able to estimate the impact of the variables that show little within-country variation, as for
example, level of VAT tax rates or firm size. This has to be explicitly acknowledged.
Analytically, the basic model we estimate is as follows:
𝑉𝐴𝑇 𝐺𝐴𝑃𝑖𝑡 = 𝛽1𝐴𝑔𝑒𝑖𝑡 + 𝛽2𝑈𝑛𝑒𝑚𝑝𝑖𝑡 + 𝛽3𝐺𝑜𝑣′𝑡 𝐸𝑓𝑓𝑒𝑐𝑡𝑖𝑡 +
+ 𝛽4𝑆𝑒𝑙𝑙𝑒𝑟𝑠𝑖𝑡 + 𝛽5𝐸𝑠𝑡𝑎𝑡𝑒𝑖𝑡 + 𝛽6𝐶𝑜𝑛𝑠𝑡𝑟𝑖𝑡 + 𝛽7𝐼𝑛𝑑𝑖𝑡 + 𝛽8𝑇𝑒𝑙𝑒𝑐𝑜𝑖𝑡 + 𝛽9𝐴𝑟𝑡𝑖𝑡 + 𝛽10𝐷𝑖𝑠𝑝𝑖𝑡 +
+𝛽11𝑆𝑐𝑎𝑙𝑒𝑖𝑡−1 + 𝛽12𝐼𝑇 𝐸𝑥𝑝𝑖𝑡−1 + 𝛽13𝐷𝑒𝑓𝑖𝑡−1 +
+ 𝛽14𝐺𝐷𝑃𝑝𝑐𝑖𝑡 + 𝛽15𝑃𝑜𝑝𝑖𝑡 + 𝛽16𝑃𝑜𝑝2𝑖𝑡 + 𝐹𝑖𝑥𝑒𝑑 𝐸𝑓𝑓𝑒𝑐𝑡𝑠 + 𝑇𝑖𝑚𝑒 𝐸𝑓𝑓𝑒𝑐𝑡𝑠 + 𝐸𝑟𝑟𝑜𝑟 𝑇𝑒𝑟𝑚𝑖𝑡
Our endogenous variable, VAT Gap of country i in year t, is explained by a set of variables as
indicated above. In the first row, there are the variables related to final consumers; in the second
row, we include the variables related to the behaviour of firms; and in the third row, lagged one
period to account for expectations, there are the variables related to the behaviour of the tax
administration. Finally, in the fourth row, there are the control variables, including fixed effects (a
variable for each country that remains unchanged along time), time effects (a common variable
for all countries that varies along time), and the error term with the usual statistical properties.
The beta coefficients are the estimates of the impact of a given variable on our endogenous
variable. With the exception of Pop, we expect the impact of all variables to be linear—that is, to
be independent of the value of the variable. However, due to its potential interest for
policymakers, we will also test whether the impact of the variables under direct control of the tax
administration is non-linear. This could imply that its impact holds from a given value of the
explanatory variable onwards or that its impact vanishes when the variable has reached a given
threshold.
Empirical Results
We have proceeded parsimoniously—that is, we have tested one group of factors after another,
and in the end, we have tested all groups simultaneously. In all models, though, we control for
population (and its square), VAT tax rate dispersion, and GDP per capita. Next, we discuss the
results, which are shown in Table 5.2.
In column 1, we have tested the importance of only those factors picking up the impact of the tax
administration. All estimated signs are the expected ones, although the estimate of IT Exp is not
statistically significant. Thus, the greater the scale of the administration or the greater the
importance of IT expenditure and of the public deficit, the lower the level of the VAT Gap. These
estimates have to be taken with caution, though, as we have not included all variables that might
have an impact on the Gap (the last two columns of the table present the results of the model
including all variables). However, we can use these first results as an example of the quantitative
explanation of the estimates. For example, when Scale increases by 0.1 percentage points (pooled
average of the sample = 0.3 percent over GDP), the Gap decreases by 0.18 percentage points
(pooled average = 16.45 percent).
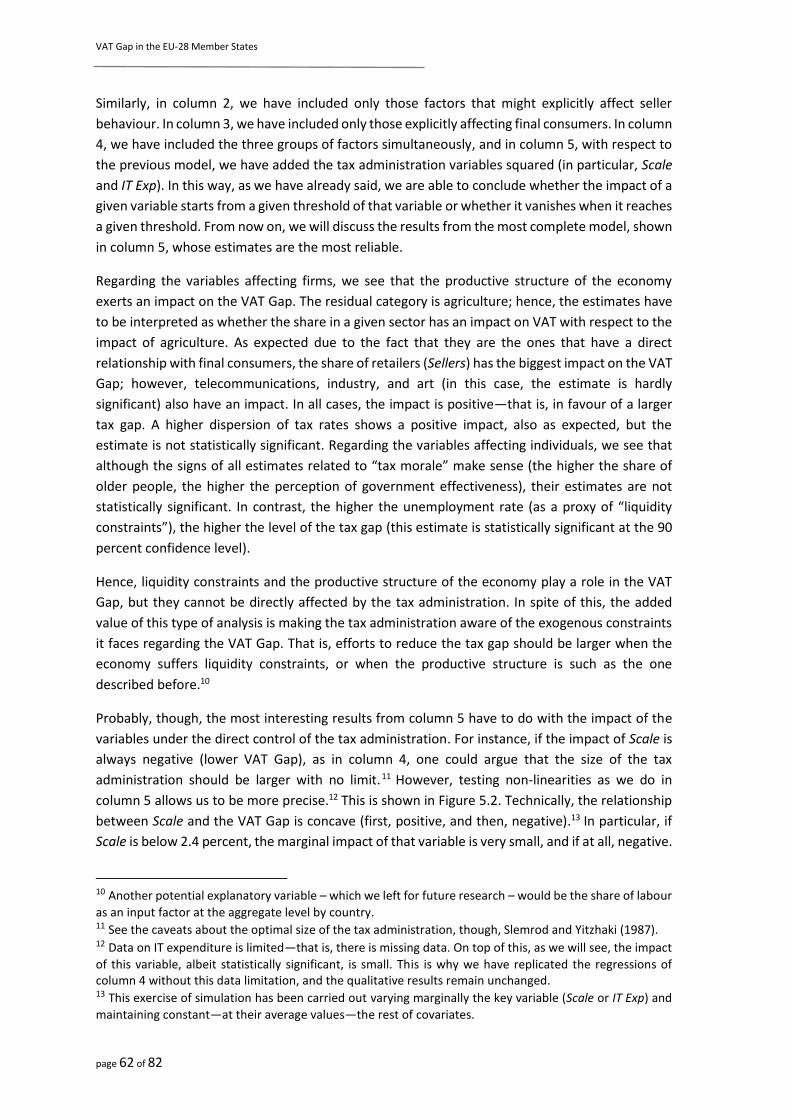
VAT Gap in the EU-28 Member States
page 62 of 82
Similarly, in column 2, we have included only those factors that might explicitly affect seller
behaviour. In column 3, we have included only those explicitly affecting final consumers. In column
4, we have included the three groups of factors simultaneously, and in column 5, with respect to
the previous model, we have added the tax administration variables squared (in particular, Scale
and IT Exp). In this way, as we have already said, we are able to conclude whether the impact of a
given variable starts from a given threshold of that variable or whether it vanishes when it reaches
a given threshold. From now on, we will discuss the results from the most complete model, shown
in column 5, whose estimates are the most reliable.
Regarding the variables affecting firms, we see that the productive structure of the economy
exerts an impact on the VAT Gap. The residual category is agriculture; hence, the estimates have
to be interpreted as whether the share in a given sector has an impact on VAT with respect to the
impact of agriculture. As expected due to the fact that they are the ones that have a direct
relationship with final consumers, the share of retailers (Sellers) has the biggest impact on the VAT
Gap; however, telecommunications, industry, and art (in this case, the estimate is hardly
significant) also have an impact. In all cases, the impact is positive—that is, in favour of a larger
tax gap. A higher dispersion of tax rates shows a positive impact, also as expected, but the
estimate is not statistically significant. Regarding the variables affecting individuals, we see that
although the signs of all estimates related to “tax morale” make sense (the higher the share of
older people, the higher the perception of government effectiveness), their estimates are not
statistically significant. In contrast, the higher the unemployment rate (as a proxy of “liquidity
constraints”), the higher the level of the tax gap (this estimate is statistically significant at the 90
percent confidence level).
Hence, liquidity constraints and the productive structure of the economy play a role in the VAT
Gap, but they cannot be directly affected by the tax administration. In spite of this, the added
value of this type of analysis is making the tax administration aware of the exogenous constraints
it faces regarding the VAT Gap. That is, efforts to reduce the tax gap should be larger when the
economy suffers liquidity constraints, or when the productive structure is such as the one
described before.10
Probably, though, the most interesting results from column 5 have to do with the impact of the
variables under the direct control of the tax administration. For instance, if the impact of Scale is
always negative (lower VAT Gap), as in column 4, one could argue that the size of the tax
administration should be larger with no limit.11 However, testing non-linearities as we do in
column 5 allows us to be more precise.12 This is shown in Figure 5.2. Technically, the relationship
between Scale and the VAT Gap is concave (first, positive, and then, negative).13 In particular, if
Scale is below 2.4 percent, the marginal impact of that variable is very small, and if at all, negative.
10 Another potential explanatory variable – which we left for future research – would be the share of labour
as an input factor at the aggregate level by country. 11 See the caveats about the optimal size of the tax administration, though, Slemrod and Yitzhaki (1987). 12 Data on IT expenditure is limited—that is, there is missing data. On top of this, as we will see, the impact
of this variable, albeit statistically significant, is small. This is why we have replicated the regressions of column 4 without this data limitation, and the qualitative results remain unchanged. 13 This exercise of simulation has been carried out varying marginally the key variable (Scale or IT Exp) and
maintaining constant—at their average values—the rest of covariates.
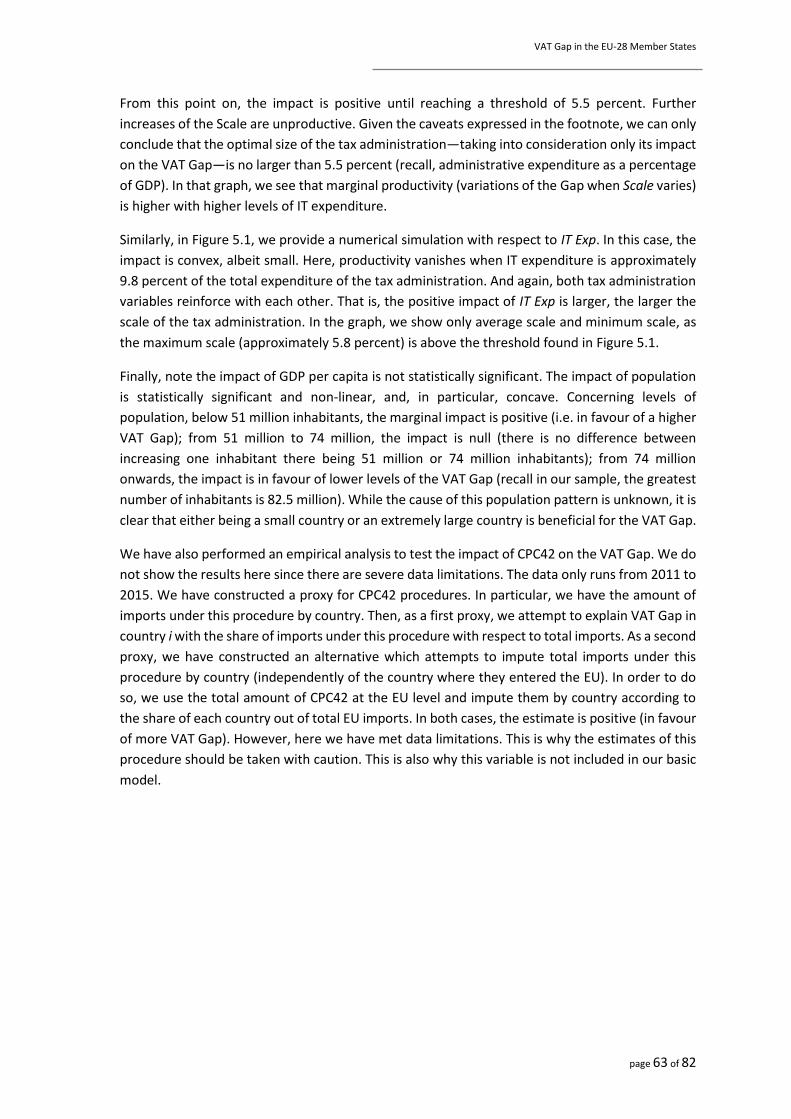
VAT Gap in the EU-28 Member States
page 63 of 82
From this point on, the impact is positive until reaching a threshold of 5.5 percent. Further
increases of the Scale are unproductive. Given the caveats expressed in the footnote, we can only
conclude that the optimal size of the tax administration—taking into consideration only its impact
on the VAT Gap—is no larger than 5.5 percent (recall, administrative expenditure as a percentage
of GDP). In that graph, we see that marginal productivity (variations of the Gap when Scale varies)
is higher with higher levels of IT expenditure.
Similarly, in Figure 5.1, we provide a numerical simulation with respect to IT Exp. In this case, the
impact is convex, albeit small. Here, productivity vanishes when IT expenditure is approximately
9.8 percent of the total expenditure of the tax administration. And again, both tax administration
variables reinforce with each other. That is, the positive impact of IT Exp is larger, the larger the
scale of the tax administration. In the graph, we show only average scale and minimum scale, as
the maximum scale (approximately 5.8 percent) is above the threshold found in Figure 5.1.
Finally, note the impact of GDP per capita is not statistically significant. The impact of population
is statistically significant and non-linear, and, in particular, concave. Concerning levels of
population, below 51 million inhabitants, the marginal impact is positive (i.e. in favour of a higher
VAT Gap); from 51 million to 74 million, the impact is null (there is no difference between
increasing one inhabitant there being 51 million or 74 million inhabitants); from 74 million
onwards, the impact is in favour of lower levels of the VAT Gap (recall in our sample, the greatest
number of inhabitants is 82.5 million). While the cause of this population pattern is unknown, it is
clear that either being a small country or an extremely large country is beneficial for the VAT Gap.
We have also performed an empirical analysis to test the impact of CPC42 on the VAT Gap. We do
not show the results here since there are severe data limitations. The data only runs from 2011 to
2015. We have constructed a proxy for CPC42 procedures. In particular, we have the amount of
imports under this procedure by country. Then, as a first proxy, we attempt to explain VAT Gap in
country i with the share of imports under this procedure with respect to total imports. As a second
proxy, we have constructed an alternative which attempts to impute total imports under this
procedure by country (independently of the country where they entered the EU). In order to do
so, we use the total amount of CPC42 at the EU level and impute them by country according to
the share of each country out of total EU imports. In both cases, the estimate is positive (in favour
of more VAT Gap). However, here we have met data limitations. This is why the estimates of this
procedure should be taken with caution. This is also why this variable is not included in our basic
model.
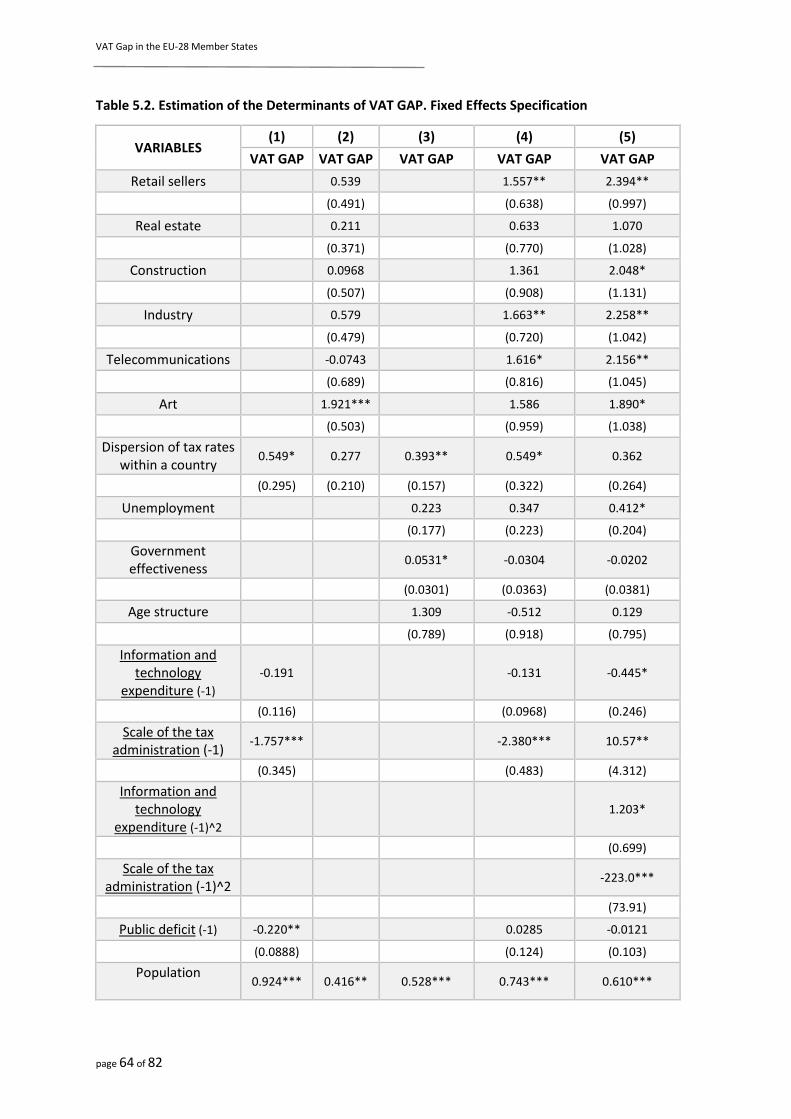
VAT Gap in the EU-28 Member States
page 64 of 82
Table 5.2. Estimation of the Determinants of VAT GAP. Fixed Effects Specification
VARIABLES (1) (2) (3) (4) (5)
VAT GAP VAT GAP VAT GAP VAT GAP VAT GAP
Retail sellers 0.539 1.557** 2.394**
(0.491) (0.638) (0.997)
Real estate 0.211 0.633 1.070
(0.371) (0.770) (1.028)
Construction 0.0968 1.361 2.048*
(0.507) (0.908) (1.131)
Industry 0.579 1.663** 2.258**
(0.479) (0.720) (1.042)
Telecommunications -0.0743 1.616* 2.156**
(0.689) (0.816) (1.045)
Art 1.921*** 1.586 1.890*
(0.503) (0.959) (1.038)
Dispersion of tax rates within a country
0.549* 0.277 0.393** 0.549* 0.362
(0.295) (0.210) (0.157) (0.322) (0.264)
Unemployment 0.223 0.347 0.412*
(0.177) (0.223) (0.204)
Government effectiveness
0.0531* -0.0304 -0.0202
(0.0301) (0.0363) (0.0381)
Age structure 1.309 -0.512 0.129
(0.789) (0.918) (0.795)
Information and technology
expenditure (-1) -0.191 -0.131 -0.445*
(0.116) (0.0968) (0.246)
Scale of the tax administration (-1)
-1.757*** -2.380*** 10.57**
(0.345) (0.483) (4.312)
Information and technology
expenditure (-1)^2 1.203*
(0.699)
Scale of the tax administration (-1)^2
-223.0***
(73.91)
Public deficit (-1) -0.220** 0.0285 -0.0121
(0.0888) (0.124) (0.103)
Population
0.924*** 0.416** 0.528*** 0.743*** 0.610***

VAT Gap in the EU-28 Member States
page 65 of 82
VARIABLES (1) (2) (3) (4) (5)
VAT GAP VAT GAP VAT GAP VAT GAP VAT GAP
(0.308) (0.154) (0.174) (0.260) (0.214)
Population ^2
-0.0708*** -0.0330** -0.0383** -0.0603*** -0.0481***
(0.0237) (0.0132) (0.0146) (0.0195) (0.0158)
GDP per capita 0.00126 -0.000787 0.000462 -0.00230 -0.00109
(0.00212) (0.00212) (0.00208) (0.00254) (0.00204)
Constant -1.060*** -0.794 -1.035** -1.928*** -2.663***
(0.372) (0.507) (0.374) (0.682) (0.883)
Observations 187 418 418 187 187
R-squared 0.259 0.233 0.188 0.341 0.380
Number of countries 28 28 28 28 28
Robust standard errors in parentheses
*** p<0.01, ** p<0.05, * p<0.1
VAT Gap in the EU-28 Member States
page 66 of 82
Figure 5.1. Impact of Administrative Scale of the Tax Administration on VAT Gap, Contingent
on IT expenditure
Source: own calculations.
Figure 5.2. Impact of IT on VAT Gap, Contingent on Tax Administration Scale
Source: own calculations.

VAT Gap in the EU-28 Member States
page 67 of 82
Annex A. Methodological Considerations
I. Source of Revisions of VAT Gap Estimates
Every year, the estimates of the VAT Gap are updated and revised backwards. There are three
different sources of such revisions:
1) Updates in the underlying national accounts data published by Eurostat: updates in VAT
revenues, new supply and use tables, and revised industry specific growth rates, among others.
2) Updates in the estimated GFCF liability, based on the new information from the own resource
submissions (ORS) on taxable shares of GFCF by five sectors: households, government, NPISH, and
exempt financial and non-financial enterprises.
3) Revision of the parameters of the VTTL model: effective rates, pro-rata coefficients, and net
adjustments, either due to new information from ORS or due to correcting errors in the previous
computation.
The most significant revisions in 2016 concerned liability from GFCF in Germany and Sweden. The
use of more accurate estimations led to an upward revision of the VAT Gap in Sweden above 0. In
Slovakia and Lithuania, the revisions concerned the liability from government consumption.
Thanks to the figures on individual government consumption delivered by MS Authorities, the Gap
in these MS was revised downwards for the entire period of the analysis.
II. Decomposition of VAT Revenue
As VAT Revenue (VR) is the difference between the VTTL and the VAT Gap (𝑉𝑅 = 𝑉𝑇𝑇𝐿 −
𝑉𝐴𝑇 𝐺𝑎𝑝) , and the VTTL is a product of the effective rate and the base ( 𝑉𝑇𝑇𝐿 =
𝑒𝑓𝑓𝑒𝑐𝑡𝑖𝑣𝑒 𝑟𝑎𝑡𝑒 × 𝑏𝑎𝑠𝑒), VAT revenue could be decomposed using the following formula:
𝑉𝑅 = 𝑉𝑇𝑇𝐿 × 𝑉𝐴𝑇 𝑐𝑜𝑚𝑝𝑙𝑖𝑎𝑛𝑐𝑒 = 𝑒𝑓𝑓𝑒𝑐𝑡𝑖𝑣𝑒 𝑟𝑎𝑡𝑒 × 𝑏𝑎𝑠𝑒 × (1 −𝑉𝐴𝑇 𝐺𝑎𝑝
𝑉𝑇𝑇𝐿)
Thus, the year-over-rear relative change in revenue is denoted as:
∆𝑉𝑅
𝑉𝑅=
∆(𝑒𝑓𝑓𝑒𝑐𝑡𝑖𝑣𝑒 𝑟𝑎𝑡𝑒)
𝑒𝑓𝑓𝑒𝑐𝑡𝑖𝑣𝑒 𝑟𝑎𝑡𝑒×
∆𝑏𝑎𝑠𝑒
𝑏𝑎𝑠𝑒×
∆ (1 −𝑉𝐴𝑇 𝐺𝑎𝑝
𝑉𝑇𝑇𝐿 )
(1 −𝑉𝐴𝑇 𝐺𝑎𝑝
𝑉𝑇𝑇𝐿 )⁄
where ∆(𝑒𝑓𝑓𝑒𝑐𝑡𝑖𝑣𝑒 𝑟𝑎𝑡𝑒)
𝑒𝑓𝑓𝑒𝑐𝑡𝑖𝑣𝑒 𝑟𝑎𝑡𝑒 denotes change in effective rate,
∆𝑏𝑎𝑠𝑒
𝑏𝑎𝑠𝑒 denotes change in base, and
∆ (1 −𝑉𝐴𝑇 𝐺𝑎𝑝
𝑉𝑇𝑇𝐿)
(1 −𝑉𝐴𝑇 𝐺𝑎𝑝
𝑉𝑇𝑇𝐿)
⁄ denotes change in VAT compliance.
III. Data Sources and Estimation Method
The “top-down” method that is utilised for VAT Gap estimation relies on national accounts figures.
These figures are used to estimate the VAT liability generated by different sub-aggregates of the
total economy. The VTTL is estimated as the sum of the liability from six main components:
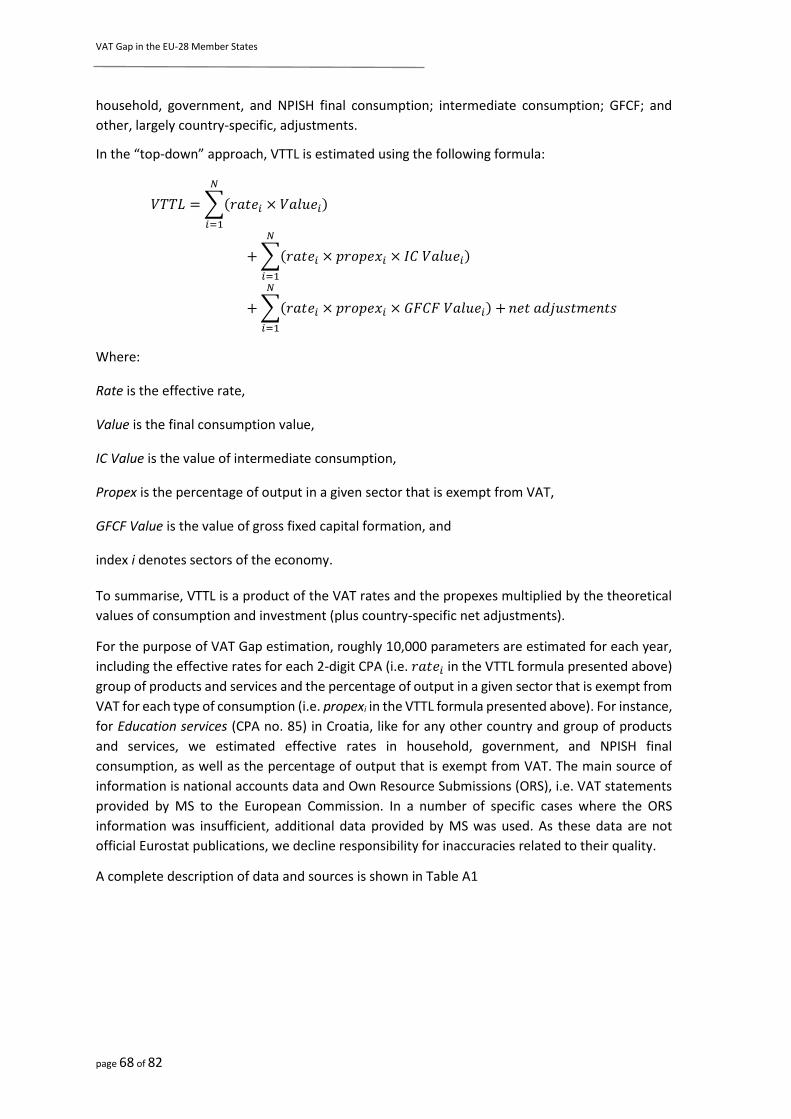
VAT Gap in the EU-28 Member States
page 68 of 82
household, government, and NPISH final consumption; intermediate consumption; GFCF; and
other, largely country-specific, adjustments.
In the “top-down” approach, VTTL is estimated using the following formula:
𝑉𝑇𝑇𝐿 = ∑(𝑟𝑎𝑡𝑒𝑖 × 𝑉𝑎𝑙𝑢𝑒𝑖)
𝑁
𝑖=1
+ ∑(𝑟𝑎𝑡𝑒𝑖 × 𝑝𝑟𝑜𝑝𝑒𝑥𝑖 × 𝐼𝐶 𝑉𝑎𝑙𝑢𝑒𝑖)
𝑁
𝑖=1
+ ∑(𝑟𝑎𝑡𝑒𝑖 × 𝑝𝑟𝑜𝑝𝑒𝑥𝑖 × 𝐺𝐹𝐶𝐹 𝑉𝑎𝑙𝑢𝑒𝑖) +
𝑁
𝑖=1
𝑛𝑒𝑡 𝑎𝑑𝑗𝑢𝑠𝑡𝑚𝑒𝑛𝑡𝑠
Where:
Rate is the effective rate,
Value is the final consumption value,
IC Value is the value of intermediate consumption,
Propex is the percentage of output in a given sector that is exempt from VAT,
GFCF Value is the value of gross fixed capital formation, and
index i denotes sectors of the economy.
To summarise, VTTL is a product of the VAT rates and the propexes multiplied by the theoretical
values of consumption and investment (plus country-specific net adjustments).
For the purpose of VAT Gap estimation, roughly 10,000 parameters are estimated for each year,
including the effective rates for each 2-digit CPA (i.e. 𝑟𝑎𝑡𝑒𝑖 in the VTTL formula presented above)
group of products and services and the percentage of output in a given sector that is exempt from
VAT for each type of consumption (i.e. propexi in the VTTL formula presented above). For instance,
for Education services (CPA no. 85) in Croatia, like for any other country and group of products
and services, we estimated effective rates in household, government, and NPISH final
consumption, as well as the percentage of output that is exempt from VAT. The main source of
information is national accounts data and Own Resource Submissions (ORS), i.e. VAT statements
provided by MS to the European Commission. In a number of specific cases where the ORS
information was insufficient, additional data provided by MS was used. As these data are not
official Eurostat publications, we decline responsibility for inaccuracies related to their quality.
A complete description of data and sources is shown in Table A1
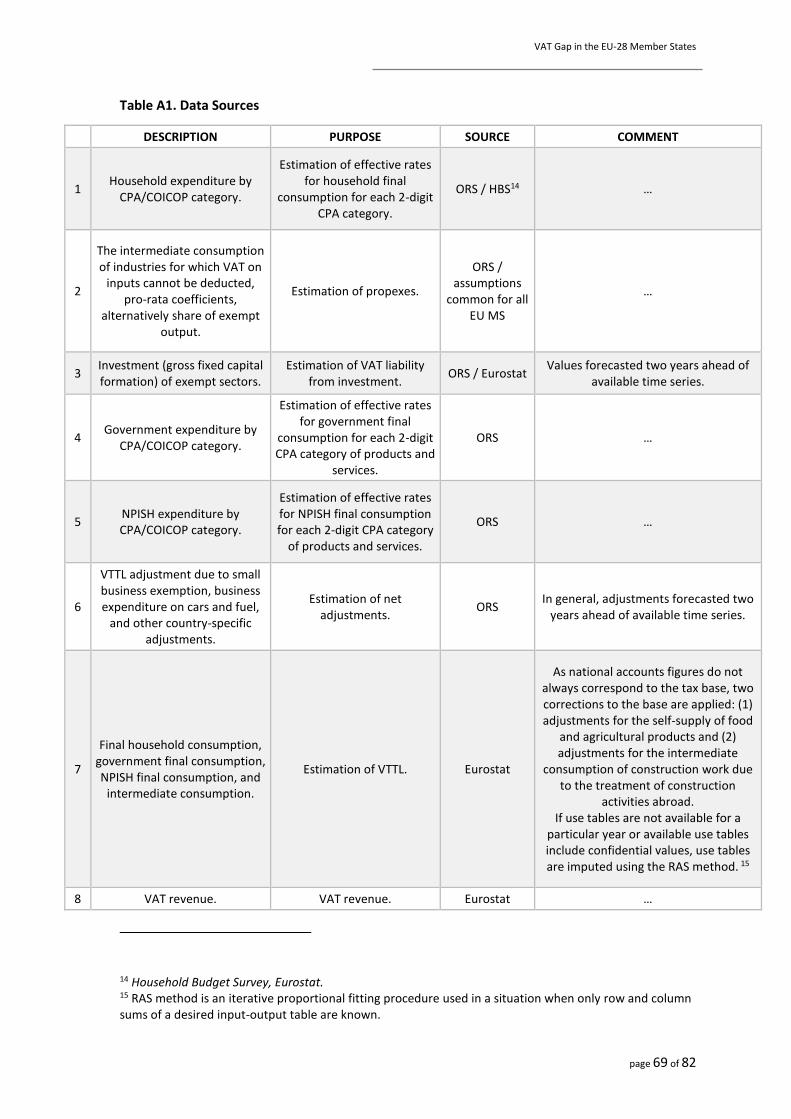
VAT Gap in the EU-28 Member States
page 69 of 82
Table A1. Data Sources
DESCRIPTION PURPOSE SOURCE COMMENT
1 Household expenditure by
CPA/COICOP category.
Estimation of effective rates for household final
consumption for each 2-digit CPA category.
ORS / HBS14 …
2
The intermediate consumption of industries for which VAT on
inputs cannot be deducted, pro-rata coefficients,
alternatively share of exempt output.
Estimation of propexes.
ORS / assumptions
common for all EU MS
…
3 Investment (gross fixed capital formation) of exempt sectors.
Estimation of VAT liability from investment.
ORS / Eurostat Values forecasted two years ahead of
available time series.
4 Government expenditure by
CPA/COICOP category.
Estimation of effective rates for government final
consumption for each 2-digit CPA category of products and
services.
ORS …
5 NPISH expenditure by CPA/COICOP category.
Estimation of effective rates for NPISH final consumption for each 2-digit CPA category
of products and services.
ORS …
6
VTTL adjustment due to small business exemption, business expenditure on cars and fuel,
and other country-specific adjustments.
Estimation of net adjustments.
ORS In general, adjustments forecasted two
years ahead of available time series.
7
Final household consumption, government final consumption, NPISH final consumption, and
intermediate consumption.
Estimation of VTTL. Eurostat
As national accounts figures do not always correspond to the tax base, two corrections to the base are applied: (1) adjustments for the self-supply of food
and agricultural products and (2) adjustments for the intermediate
consumption of construction work due to the treatment of construction
activities abroad. If use tables are not available for a
particular year or available use tables include confidential values, use tables are imputed using the RAS method. 15
8 VAT revenue. VAT revenue. Eurostat …
14 Household Budget Survey, Eurostat. 15 RAS method is an iterative proportional fitting procedure used in a situation when only row and column sums of a desired input-output table are known.
VAT Gap in the EU-28 Member States
page 70 of 82
IV. Derivation of the Policy Gap
In this section of the Annex, we define the concepts used in Chapter IV and discuss some of the
methodological considerations.
We begin with the Notional Ideal Revenue that, by definition, should indicate an upper limit of
VAT revenue (i.e. the revenue levied at a uniform rate in the environment of perfect tax
compliance). As shown in Figure A1, ideal revenue is larger than VTTL and subsequently larger
than VAT collection. However, due to the existence of exemptions, it does not capture the entire
VTTL and tax collection. If no exemptions were applied, neither intermediate consumption nor the
GFCF of the business sector would be the base for computing VTTL.
The problem arises when deciding whether investment by the non-business sector should be a
part of the VAT base. According to the OECD (2014)16, Notional Ideal Revenue is defined as the
standard rate of VAT times the aggregate net final consumption. Multiplying the standard rate
and final consumption would yield, however, lower liability than in the case where a country
applied no exemptions, no reduced rates, and was able to enforce all tax payments. In real life,
VTTL is comprised partially from VAT liability from investment made by households, government,
and NPISH. In the case of the non-inclusion of this investment to the base, VTTL would be partially
extended beyond the ideal revenue despite “no exemptions” present in the system (see Figure A1
(c)).
Policymakers can see the upper limit of VAT revenue by considering all final use categories of
households, non-profit, and government sectors. Thus, in this Report, Notional Ideal Revenue is
defined as the standard rate of VAT times the aggregate net final and net GFCF of the household,
non-profit, and government sectors, as recorded in the national accounts (interdependence
among the various concepts presented is shown in Figure A1).17
The Policy Gap is defined as one minus the ratio of the “legal” tax liability (i.e. the chunk of the
Notional Ideal Revenue that, in the counterfactual case of perfect tax compliance, is not collected
due to the presence of exemptions and reduced rates). The Policy Gap is denoted by the following
formula:
Policy Gap = (Notional Ideal Revenue – VTTL)/Notional Ideal Revenue
The Policy Gap could be further decomposed to account for the loss of revenue. Such components
are the Rate Gap and the Exemption Gap, which capture the loss in VAT liability due to the
application of reduced rates and the loss in liability due to the implementation of exemptions.
The Rate Gap is defined as the difference between the VTTL and what would be obtained in a
counterfactual situation, in which the standard rate, instead of the reduced, parking, and zero
rates, is applied to final consumption. Thus, the Rate Gap captures the loss in revenue that a
16 OECD (2014), "VAT Revenue Ratio (VRR)", in Consumption Tax Trends 2014: VAT/GST and excise rates, trends and policy issues, OECD Publishing, Paris. 17 National accounts for most countries report final consumption on a gross (i.e. VAT-inclusive) basis. Net consumption is estimated on the basis of the gross consumption recorded in the use tables, from which VAT revenues are subtracted.
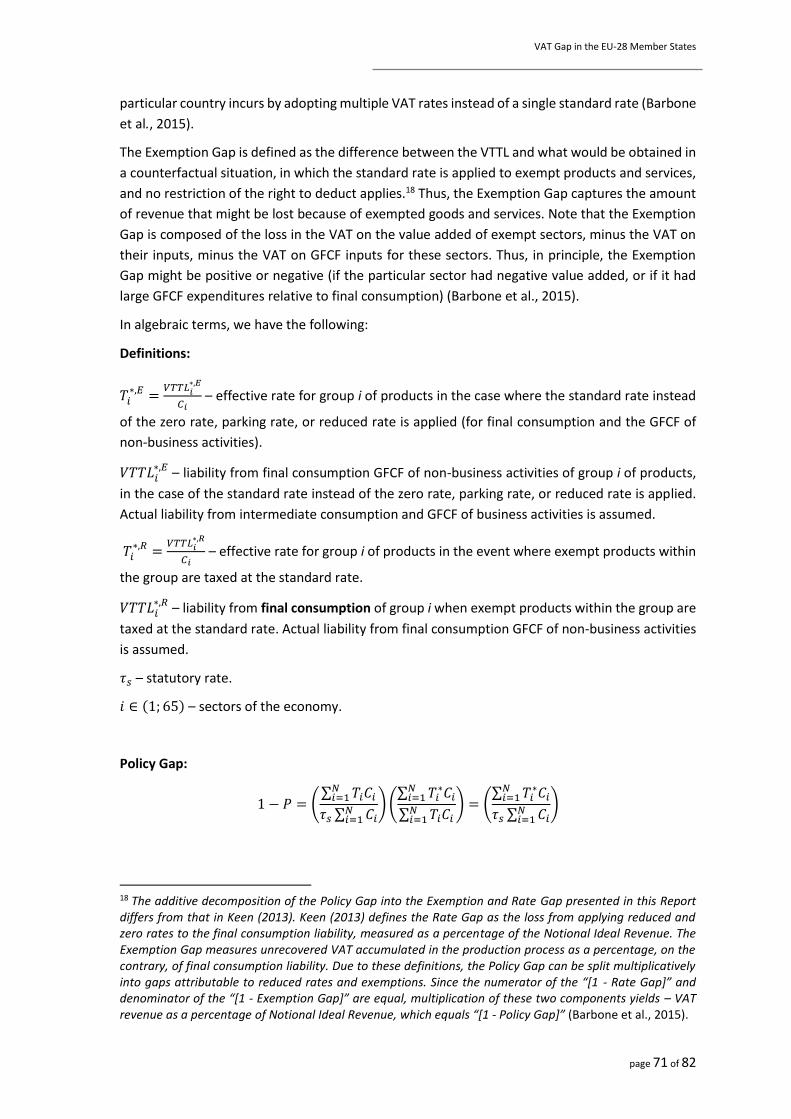
VAT Gap in the EU-28 Member States
page 71 of 82
particular country incurs by adopting multiple VAT rates instead of a single standard rate (Barbone
et al., 2015).
The Exemption Gap is defined as the difference between the VTTL and what would be obtained in
a counterfactual situation, in which the standard rate is applied to exempt products and services,
and no restriction of the right to deduct applies.18 Thus, the Exemption Gap captures the amount
of revenue that might be lost because of exempted goods and services. Note that the Exemption
Gap is composed of the loss in the VAT on the value added of exempt sectors, minus the VAT on
their inputs, minus the VAT on GFCF inputs for these sectors. Thus, in principle, the Exemption
Gap might be positive or negative (if the particular sector had negative value added, or if it had
large GFCF expenditures relative to final consumption) (Barbone et al., 2015).
In algebraic terms, we have the following:
Definitions:
𝑇𝑖∗,𝐸 =
𝑉𝑇𝑇𝐿𝑖∗,𝐸
𝐶𝑖 – effective rate for group i of products in the case where the standard rate instead
of the zero rate, parking rate, or reduced rate is applied (for final consumption and the GFCF of
non-business activities).
𝑉𝑇𝑇𝐿𝑖∗,𝐸 – liability from final consumption GFCF of non-business activities of group i of products,
in the case of the standard rate instead of the zero rate, parking rate, or reduced rate is applied.
Actual liability from intermediate consumption and GFCF of business activities is assumed.
𝑇𝑖∗,𝑅 =
𝑉𝑇𝑇𝐿𝑖∗,𝑅
𝐶𝑖 – effective rate for group i of products in the event where exempt products within
the group are taxed at the standard rate.
𝑉𝑇𝑇𝐿𝑖∗,𝑅 – liability from final consumption of group i when exempt products within the group are
taxed at the standard rate. Actual liability from final consumption GFCF of non-business activities
is assumed.
𝜏𝑠 – statutory rate.
𝑖 ∈ (1; 65) – sectors of the economy.
Policy Gap:
1 − 𝑃 = (∑ 𝑇𝑖𝐶𝑖
𝑁𝑖=1
𝜏𝑠 ∑ 𝐶𝑖𝑁𝑖=1
) (∑ 𝑇𝑖
∗𝐶𝑖𝑁𝑖=1
∑ 𝑇𝑖𝐶𝑖𝑁𝑖=1
) = (∑ 𝑇𝑖
∗𝐶𝑖𝑁𝑖=1
𝜏𝑠 ∑ 𝐶𝑖𝑁𝑖=1
)
18 The additive decomposition of the Policy Gap into the Exemption and Rate Gap presented in this Report differs from that in Keen (2013). Keen (2013) defines the Rate Gap as the loss from applying reduced and zero rates to the final consumption liability, measured as a percentage of the Notional Ideal Revenue. The Exemption Gap measures unrecovered VAT accumulated in the production process as a percentage, on the contrary, of final consumption liability. Due to these definitions, the Policy Gap can be split multiplicatively into gaps attributable to reduced rates and exemptions. Since the numerator of the “[1 - Rate Gap]” and denominator of the “[1 - Exemption Gap]” are equal, multiplication of these two components yields – VAT revenue as a percentage of Notional Ideal Revenue, which equals “[1 - Policy Gap]” (Barbone et al., 2015).
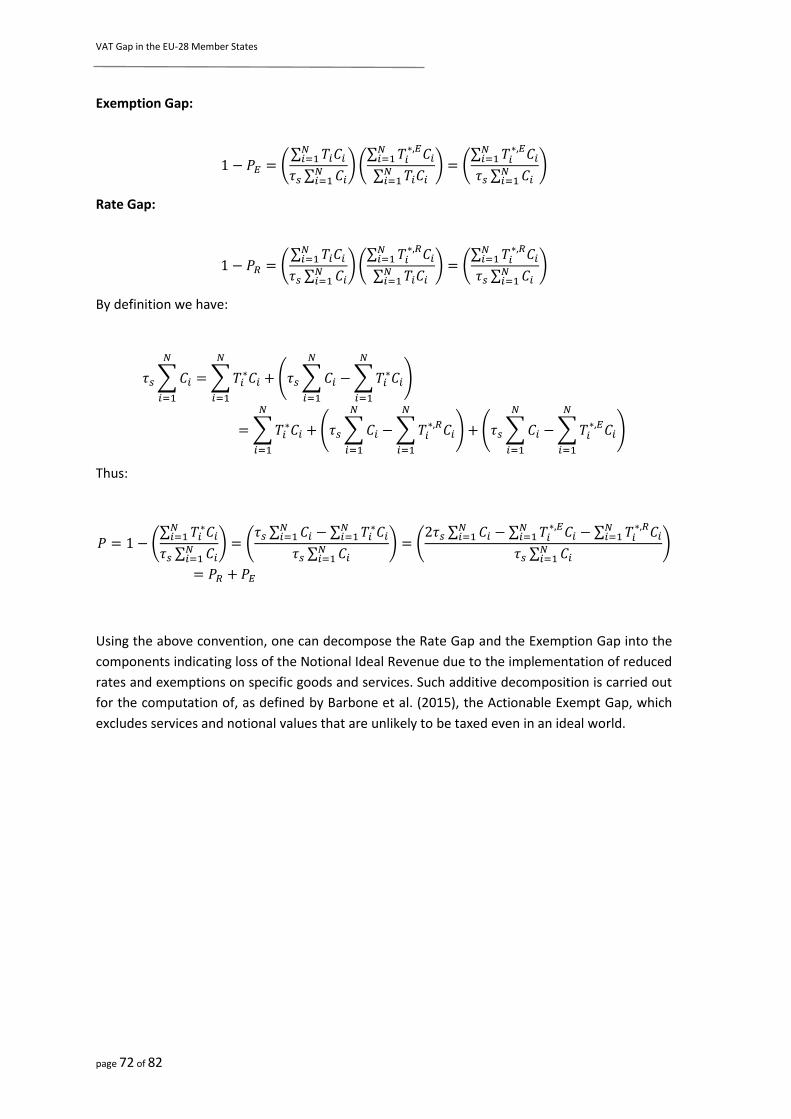
VAT Gap in the EU-28 Member States
page 72 of 82
Exemption Gap:
1 − 𝑃𝐸 = (∑ 𝑇𝑖𝐶𝑖
𝑁𝑖=1
𝜏𝑠 ∑ 𝐶𝑖𝑁𝑖=1
) (∑ 𝑇𝑖
∗,𝐸𝐶𝑖𝑁𝑖=1
∑ 𝑇𝑖𝐶𝑖𝑁𝑖=1
) = (∑ 𝑇𝑖
∗,𝐸𝐶𝑖𝑁𝑖=1
𝜏𝑠 ∑ 𝐶𝑖𝑁𝑖=1
)
Rate Gap:
1 − 𝑃𝑅 = (∑ 𝑇𝑖𝐶𝑖
𝑁𝑖=1
𝜏𝑠 ∑ 𝐶𝑖𝑁𝑖=1
) (∑ 𝑇𝑖
∗,𝑅𝐶𝑖𝑁𝑖=1
∑ 𝑇𝑖𝐶𝑖𝑁𝑖=1
) = (∑ 𝑇𝑖
∗,𝑅𝐶𝑖𝑁𝑖=1
𝜏𝑠 ∑ 𝐶𝑖𝑁𝑖=1
)
By definition we have:
𝜏𝑠 ∑ 𝐶𝑖
𝑁
𝑖=1
= ∑ 𝑇𝑖∗𝐶𝑖
𝑁
𝑖=1
+ (𝜏𝑠 ∑ 𝐶𝑖
𝑁
𝑖=1
− ∑ 𝑇𝑖∗𝐶𝑖
𝑁
𝑖=1
)
= ∑ 𝑇𝑖∗𝐶𝑖
𝑁
𝑖=1
+ (𝜏𝑠 ∑ 𝐶𝑖
𝑁
𝑖=1
− ∑ 𝑇𝑖∗,𝑅𝐶𝑖
𝑁
𝑖=1
) + (𝜏𝑠 ∑ 𝐶𝑖
𝑁
𝑖=1
− ∑ 𝑇𝑖∗,𝐸𝐶𝑖
𝑁
𝑖=1
)
Thus:
𝑃 = 1 − (∑ 𝑇𝑖
∗𝐶𝑖𝑁𝑖=1
𝜏𝑠 ∑ 𝐶𝑖𝑁𝑖=1
) = (𝜏𝑠 ∑ 𝐶𝑖
𝑁𝑖=1 − ∑ 𝑇𝑖
∗𝐶𝑖𝑁𝑖=1
𝜏𝑠 ∑ 𝐶𝑖𝑁𝑖=1
) = (2𝜏𝑠 ∑ 𝐶𝑖
𝑁𝑖=1 − ∑ 𝑇𝑖
∗,𝐸𝐶𝑖𝑁𝑖=1 − ∑ 𝑇𝑖
∗,𝑅𝐶𝑖𝑁𝑖=1
𝜏𝑠 ∑ 𝐶𝑖𝑁𝑖=1
)
= 𝑃𝑅 + 𝑃𝐸
Using the above convention, one can decompose the Rate Gap and the Exemption Gap into the
components indicating loss of the Notional Ideal Revenue due to the implementation of reduced
rates and exemptions on specific goods and services. Such additive decomposition is carried out
for the computation of, as defined by Barbone et al. (2015), the Actionable Exempt Gap, which
excludes services and notional values that are unlikely to be taxed even in an ideal world.
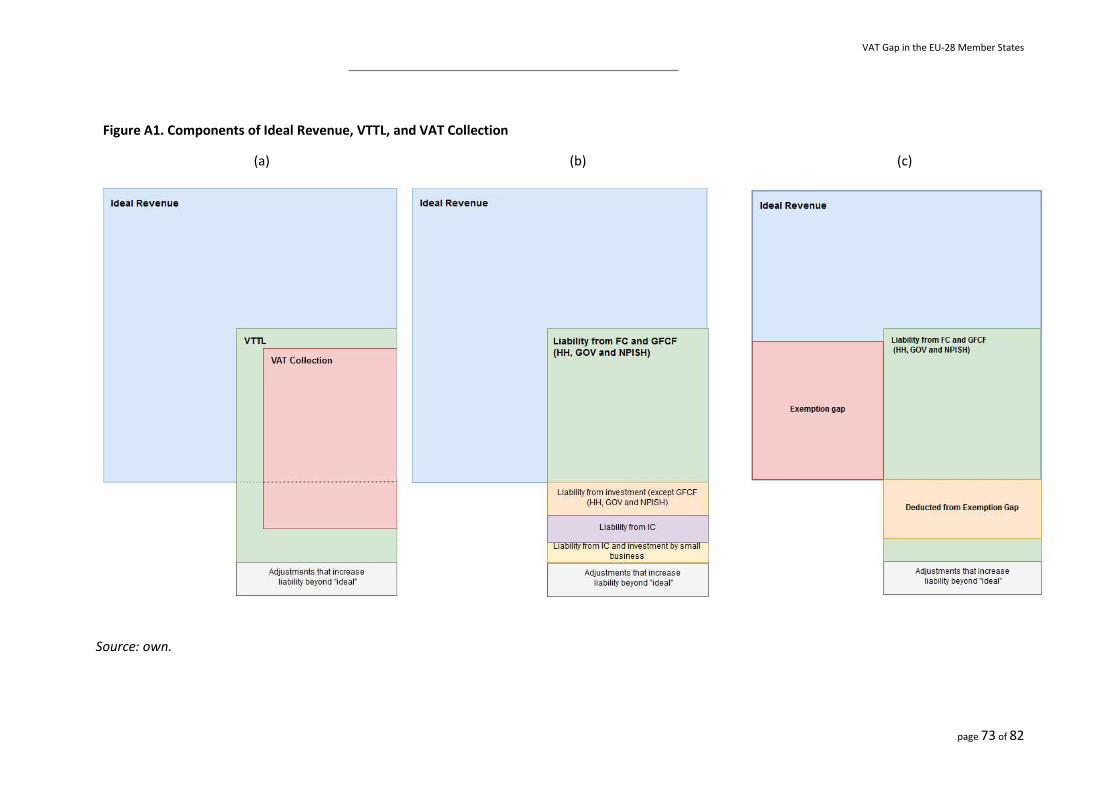
VAT Gap in the EU-28 Member States
page 73 of 82
Figure A1. Components of Ideal Revenue, VTTL, and VAT Collection
(a) (b) (c)
Source: own.
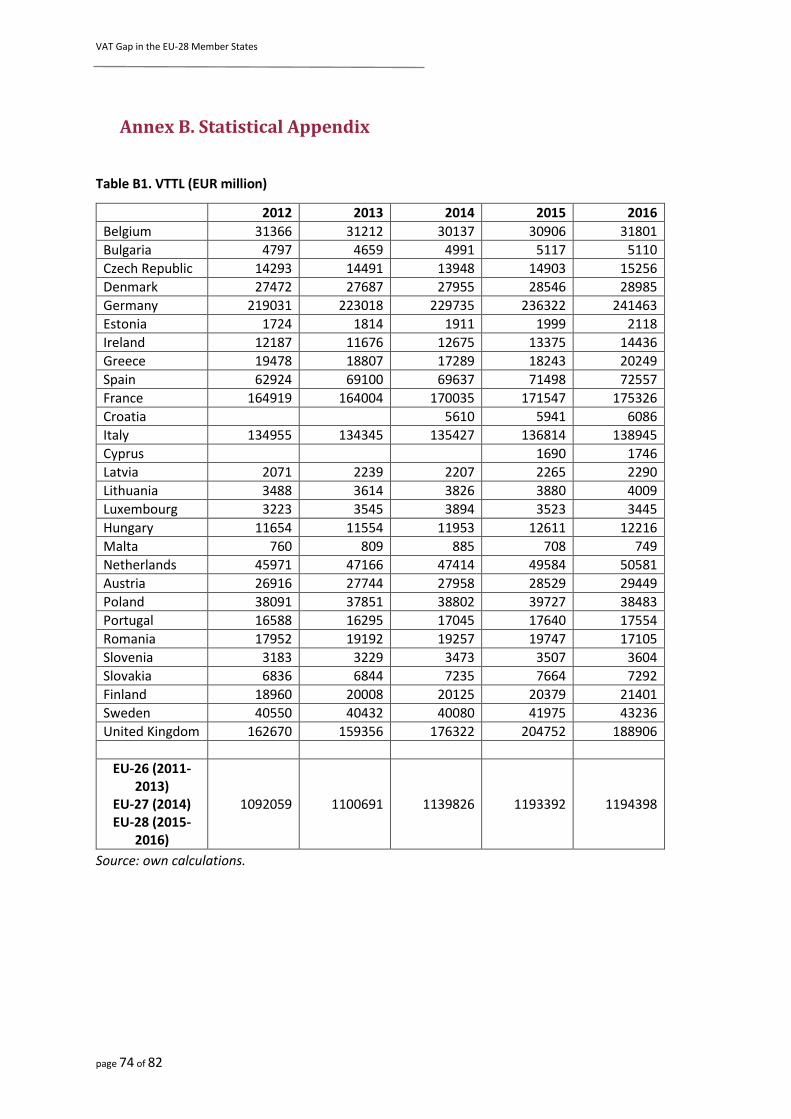
VAT Gap in the EU-28 Member States
page 74 of 82
Annex B. Statistical Appendix
Table B1. VTTL (EUR million)
2012 2013 2014 2015 2016
Belgium 31366 31212 30137 30906 31801
Bulgaria 4797 4659 4991 5117 5110
Czech Republic 14293 14491 13948 14903 15256
Denmark 27472 27687 27955 28546 28985
Germany 219031 223018 229735 236322 241463
Estonia 1724 1814 1911 1999 2118
Ireland 12187 11676 12675 13375 14436
Greece 19478 18807 17289 18243 20249
Spain 62924 69100 69637 71498 72557
France 164919 164004 170035 171547 175326
Croatia 5610 5941 6086
Italy 134955 134345 135427 136814 138945
Cyprus 1690 1746
Latvia 2071 2239 2207 2265 2290
Lithuania 3488 3614 3826 3880 4009
Luxembourg 3223 3545 3894 3523 3445
Hungary 11654 11554 11953 12611 12216
Malta 760 809 885 708 749
Netherlands 45971 47166 47414 49584 50581
Austria 26916 27744 27958 28529 29449
Poland 38091 37851 38802 39727 38483
Portugal 16588 16295 17045 17640 17554
Romania 17952 19192 19257 19747 17105
Slovenia 3183 3229 3473 3507 3604
Slovakia 6836 6844 7235 7664 7292
Finland 18960 20008 20125 20379 21401
Sweden 40550 40432 40080 41975 43236
United Kingdom 162670 159356 176322 204752 188906
EU-26 (2011-2013)
EU-27 (2014) EU-28 (2015-
2016)
1092059 1100691 1139826 1193392 1194398
Source: own calculations.
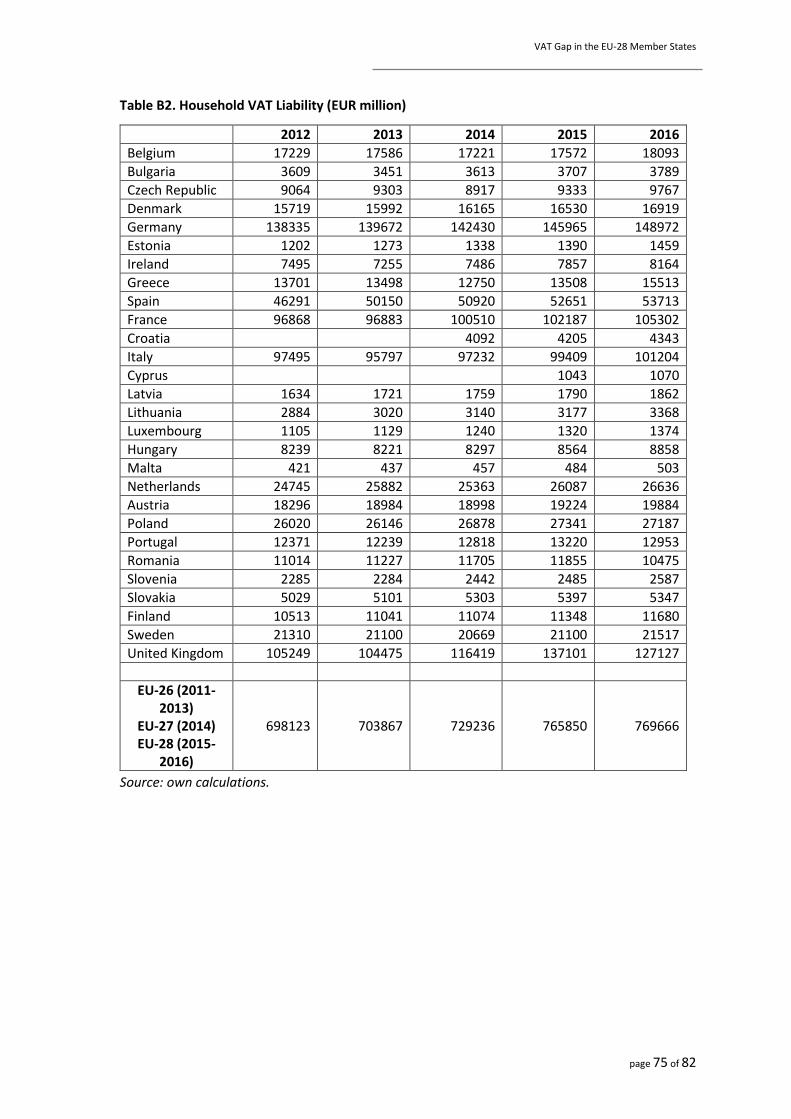
VAT Gap in the EU-28 Member States
page 75 of 82
Table B2. Household VAT Liability (EUR million)
2012 2013 2014 2015 2016
Belgium 17229 17586 17221 17572 18093
Bulgaria 3609 3451 3613 3707 3789
Czech Republic 9064 9303 8917 9333 9767
Denmark 15719 15992 16165 16530 16919
Germany 138335 139672 142430 145965 148972
Estonia 1202 1273 1338 1390 1459
Ireland 7495 7255 7486 7857 8164
Greece 13701 13498 12750 13508 15513
Spain 46291 50150 50920 52651 53713
France 96868 96883 100510 102187 105302
Croatia 4092 4205 4343
Italy 97495 95797 97232 99409 101204
Cyprus 1043 1070
Latvia 1634 1721 1759 1790 1862
Lithuania 2884 3020 3140 3177 3368
Luxembourg 1105 1129 1240 1320 1374
Hungary 8239 8221 8297 8564 8858
Malta 421 437 457 484 503
Netherlands 24745 25882 25363 26087 26636
Austria 18296 18984 18998 19224 19884
Poland 26020 26146 26878 27341 27187
Portugal 12371 12239 12818 13220 12953
Romania 11014 11227 11705 11855 10475
Slovenia 2285 2284 2442 2485 2587
Slovakia 5029 5101 5303 5397 5347
Finland 10513 11041 11074 11348 11680
Sweden 21310 21100 20669 21100 21517
United Kingdom 105249 104475 116419 137101 127127
EU-26 (2011-2013)
EU-27 (2014) EU-28 (2015-
2016)
698123 703867 729236 765850 769666
Source: own calculations.

VAT Gap in the EU-28 Member States
page 76 of 82
Table B3. Intermediate Consumption and Government VAT Liability (EUR million)
2012 2013 2014 2015 2016
Belgium 7716 7826 7498 7805 8056
Bulgaria 652 635 735 698 734
Czech Republic 3439 3501 3312 3535 3648
Denmark 7900 7793 7795 7868 7681
Germany 44029 45877 48769 50653 51155
Estonia 240 254 266 279 314
Ireland 3458 3231 3588 3718 3987
Greece 2669 2352 2185 2418 2503
Spain 10692 11206 11032 10841 11162
France 29784 30379 31310 31894 32320
Croatia 910 1086 1112
Italy 20343 20882 21097 20795 20917
Cyprus 512 515
Latvia 346 348 357 367 372
Lithuania 351 323 384 411 398
Luxembourg 791 851 905 1102 1078
Hungary 1990 1910 1961 2007 2036
Malta 293 320 364 131 163
Netherlands 12916 13565 13677 14027 13874
Austria 4663 4778 5060 5214 5296
Poland 7143 7060 7182 7655 7487
Portugal 2878 2833 2875 2941 3185
Romania 2908 2808 3050 3026 2570
Slovenia 490 510 542 552 628
Slovakia 1043 1006 1084 1187 1094
Finland 4401 4799 4951 4989 5255
Sweden 11958 12164 11911 12355 12797
United Kingdom 39578 37901 42234 48676 43781
EU-26 (2012-2013)
EU-27 (2014) EU-28 (2015-
2016)
222671 225112 235034 246742 244118
Source: own calculations.
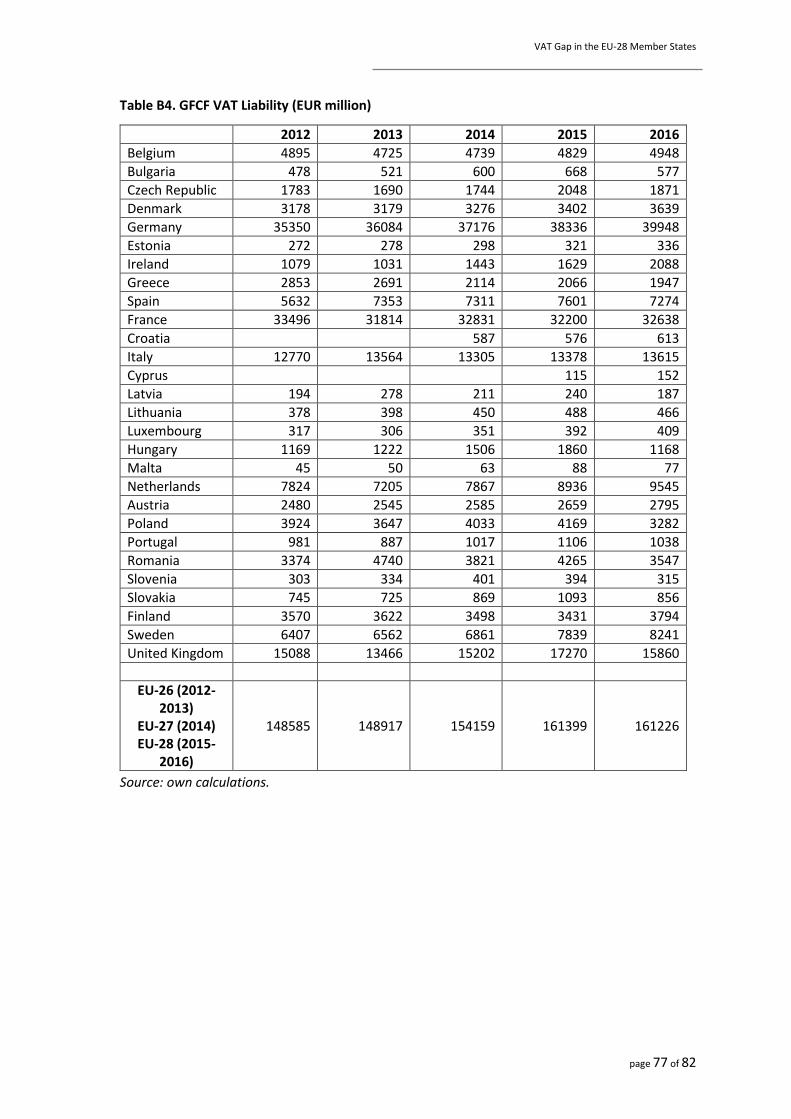
VAT Gap in the EU-28 Member States
page 77 of 82
Table B4. GFCF VAT Liability (EUR million)
2012 2013 2014 2015 2016
Belgium 4895 4725 4739 4829 4948
Bulgaria 478 521 600 668 577
Czech Republic 1783 1690 1744 2048 1871
Denmark 3178 3179 3276 3402 3639
Germany 35350 36084 37176 38336 39948
Estonia 272 278 298 321 336
Ireland 1079 1031 1443 1629 2088
Greece 2853 2691 2114 2066 1947
Spain 5632 7353 7311 7601 7274
France 33496 31814 32831 32200 32638
Croatia 587 576 613
Italy 12770 13564 13305 13378 13615
Cyprus 115 152
Latvia 194 278 211 240 187
Lithuania 378 398 450 488 466
Luxembourg 317 306 351 392 409
Hungary 1169 1222 1506 1860 1168
Malta 45 50 63 88 77
Netherlands 7824 7205 7867 8936 9545
Austria 2480 2545 2585 2659 2795
Poland 3924 3647 4033 4169 3282
Portugal 981 887 1017 1106 1038
Romania 3374 4740 3821 4265 3547
Slovenia 303 334 401 394 315
Slovakia 745 725 869 1093 856
Finland 3570 3622 3498 3431 3794
Sweden 6407 6562 6861 7839 8241
United Kingdom 15088 13466 15202 17270 15860
EU-26 (2012-2013)
EU-27 (2014) EU-28 (2015-
2016)
148585 148917 154159 161399 161226
Source: own calculations.
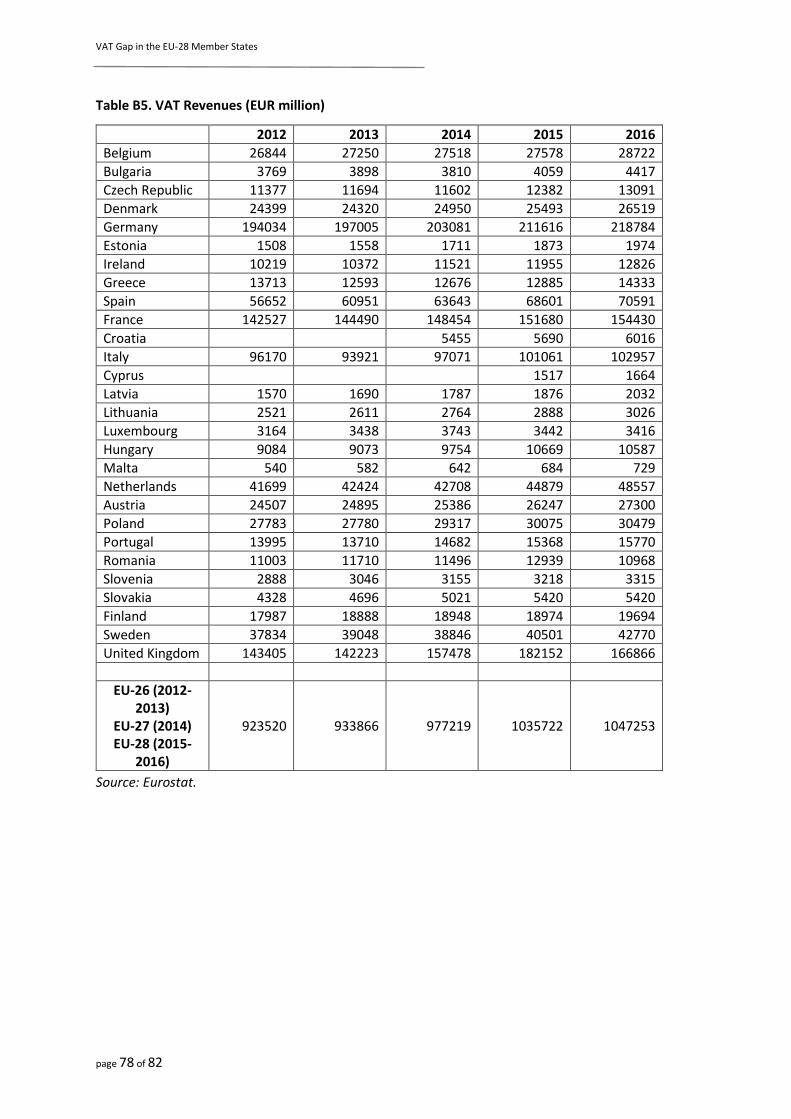
VAT Gap in the EU-28 Member States
page 78 of 82
Table B5. VAT Revenues (EUR million)
2012 2013 2014 2015 2016
Belgium 26844 27250 27518 27578 28722
Bulgaria 3769 3898 3810 4059 4417
Czech Republic 11377 11694 11602 12382 13091
Denmark 24399 24320 24950 25493 26519
Germany 194034 197005 203081 211616 218784
Estonia 1508 1558 1711 1873 1974
Ireland 10219 10372 11521 11955 12826
Greece 13713 12593 12676 12885 14333
Spain 56652 60951 63643 68601 70591
France 142527 144490 148454 151680 154430
Croatia 5455 5690 6016
Italy 96170 93921 97071 101061 102957
Cyprus 1517 1664
Latvia 1570 1690 1787 1876 2032
Lithuania 2521 2611 2764 2888 3026
Luxembourg 3164 3438 3743 3442 3416
Hungary 9084 9073 9754 10669 10587
Malta 540 582 642 684 729
Netherlands 41699 42424 42708 44879 48557
Austria 24507 24895 25386 26247 27300
Poland 27783 27780 29317 30075 30479
Portugal 13995 13710 14682 15368 15770
Romania 11003 11710 11496 12939 10968
Slovenia 2888 3046 3155 3218 3315
Slovakia 4328 4696 5021 5420 5420
Finland 17987 18888 18948 18974 19694
Sweden 37834 39048 38846 40501 42770
United Kingdom 143405 142223 157478 182152 166866
EU-26 (2012-2013)
EU-27 (2014) EU-28 (2015-
2016)
923520 933866 977219 1035722 1047253
Source: Eurostat.

VAT Gap in the EU-28 Member States
page 79 of 82
Table B6. VAT Gap (EUR million)
2012 2013 2014 2015 2016
Belgium 4522 3962 2620 3329 3079
Bulgaria 1029 761 1181 1058 693
Czech Republic 2916 2796 2345 2521 2165
Denmark 3073 3367 3006 3054 2466
Germany 24997 26013 26654 24706 22679
Estonia 216 256 200 127 144
Ireland 1967 1304 1154 1419 1610
Greece 5765 6214 4613 5358 5916
Spain 6272 8149 5994 2897 1966
France 22392 19514 21581 19867 20896
Croatia 155 251 70
Italy 38785 40424 38356 35753 35988
Cyprus 174 83
Latvia 501 549 420 389 258
Lithuania 967 1002 1062 992 983
Luxembourg 59 107 151 80 29
Hungary 2569 2481 2199 1943 1629
Malta 220 227 243 24 20
Netherlands 4272 4742 4706 4705 2024
Austria 2409 2849 2572 2282 2149
Poland 10308 10071 9485 9652 8004
Portugal 2594 2586 2363 2272 1784
Romania 6949 7483 7760 6808 6137
Slovenia 295 183 318 289 290
Slovakia 2508 2147 2214 2243 1872
Finland 973 1120 1177 1405 1707
Sweden 2716 1384 1234 1474 465
United Kingdom 19264 17133 18844 22600 22040
EU-26 (2011-2013)
EU-27 (2014) EU-28 (2015-
2016)
168538 166824 162607 157672 147146
Source: own calculations.
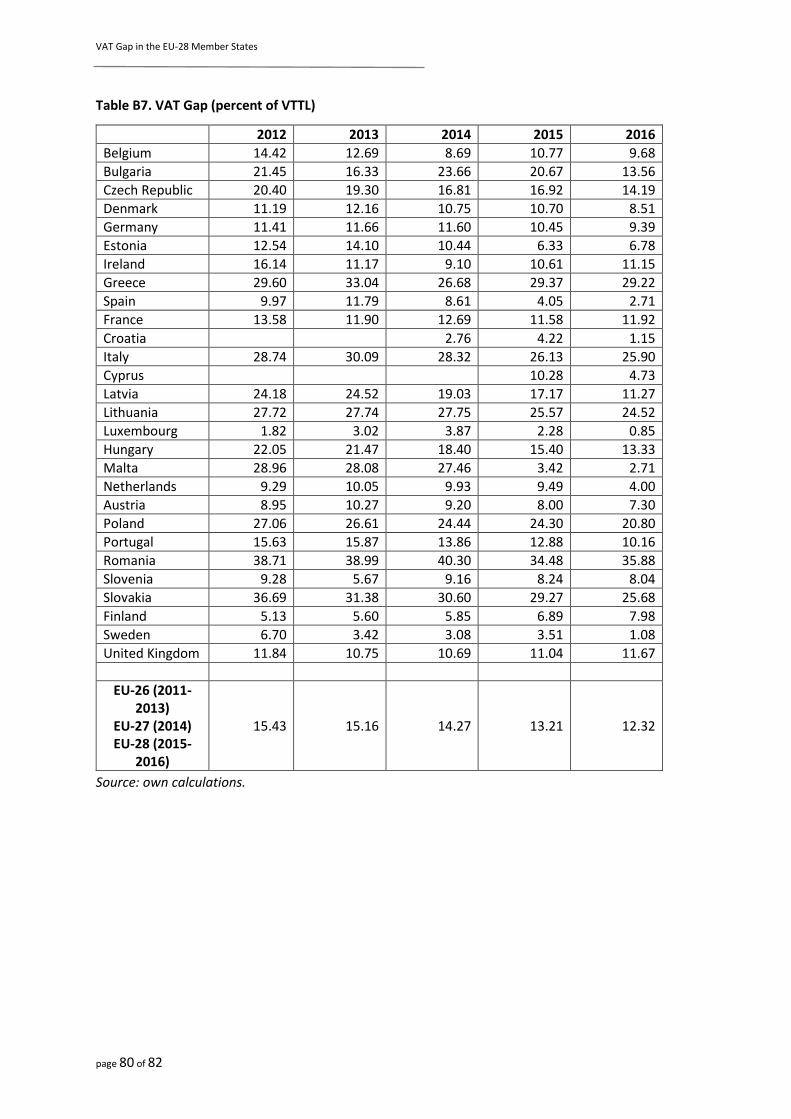
VAT Gap in the EU-28 Member States
page 80 of 82
Table B7. VAT Gap (percent of VTTL)
2012 2013 2014 2015 2016
Belgium 14.42 12.69 8.69 10.77 9.68
Bulgaria 21.45 16.33 23.66 20.67 13.56
Czech Republic 20.40 19.30 16.81 16.92 14.19
Denmark 11.19 12.16 10.75 10.70 8.51
Germany 11.41 11.66 11.60 10.45 9.39
Estonia 12.54 14.10 10.44 6.33 6.78
Ireland 16.14 11.17 9.10 10.61 11.15
Greece 29.60 33.04 26.68 29.37 29.22
Spain 9.97 11.79 8.61 4.05 2.71
France 13.58 11.90 12.69 11.58 11.92
Croatia 2.76 4.22 1.15
Italy 28.74 30.09 28.32 26.13 25.90
Cyprus 10.28 4.73
Latvia 24.18 24.52 19.03 17.17 11.27
Lithuania 27.72 27.74 27.75 25.57 24.52
Luxembourg 1.82 3.02 3.87 2.28 0.85
Hungary 22.05 21.47 18.40 15.40 13.33
Malta 28.96 28.08 27.46 3.42 2.71
Netherlands 9.29 10.05 9.93 9.49 4.00
Austria 8.95 10.27 9.20 8.00 7.30
Poland 27.06 26.61 24.44 24.30 20.80
Portugal 15.63 15.87 13.86 12.88 10.16
Romania 38.71 38.99 40.30 34.48 35.88
Slovenia 9.28 5.67 9.16 8.24 8.04
Slovakia 36.69 31.38 30.60 29.27 25.68
Finland 5.13 5.60 5.85 6.89 7.98
Sweden 6.70 3.42 3.08 3.51 1.08
United Kingdom 11.84 10.75 10.69 11.04 11.67
EU-26 (2011-2013)
EU-27 (2014) EU-28 (2015-
2016)
15.43 15.16 14.27 13.21 12.32
Source: own calculations.
VAT Gap in the EU-28 Member States
page 81 of 82
References
Allingham, M. G., A. Sandmo (1972), Income tax evasion: A theoretical analysis, Journal of Public
Economics, 1, 323-38.
Alm, J., B. R. Jackson, M. McKee (1993), Fiscal exchange, collective decision institutions, and tax
compliance, Journal of Economic Behavior & Organization, 22, 255-373.
Andreoni, J. (1992), IRS as loan shark tax compliance with borrowing constraints, Journal of Public
Economics, 49, 35-46.
Andreoni, J., B. Erard, J. Feinstein (1998), Tax Compliance, Journal of Economic Literature, 36,
818-860.
Barbone, L., Belkindas, M., Bettendorf L., Bird R., Bonch-Osmolovskiy, M., Smart, M. (2013),
Study to quantify and analyse the VAT Gap in the EU-27 Member States, Final Report of project
TAXUD/2012/DE/316.
Barbone, L., Bonch-Osmolovskiy, M., Poniatowski, G. (2014), 2012 Update Report to the Study
to quantify and analyse the VAT Gap in the EU-27 Member States, Report of project
TAXUD/2013/DE/321
Barbone, L., Bonch-Osmolovskiy, M., Poniatowski, G. (2015), 2013 Update Report to the Study
to quantify and analyse the VAT Gap in the EU Member States, Report of project
TAXUD/2013/DE/321.
Boadway, R., M. Marchand, P. Pestieau (1994), Towards a Theory of the Direct-Indirect Tax Mix,
Journal of Public Economics, 55, 71-88.
Crocker, K., J. Slemrod (2005), Corporate tax evasion with agency costs, Journal of Public
Economics, 89, 1593-1610.
Esteller-Moré, A. (2005), Is There a Connection Between the Tax Administration and the Political
Power?, International Tax and Public Finance, 12, 639-63, 2005.
Fedeli, S., F. Forte (1999), Joint income-tax and VAT-chain evasion, European Journal of Political
Economy, 15, 391-415.
Godin, M., J. Hindriks (2015), A Review of critical issues on tax design and tax administration in a
global economy and developing countries, CRED-UNamur, Working Paper 7.
IMF (2015), Current Challenges in Revenue Mobilization: Improving Tax Compliance, IMF Staff
Report, IMF, Washington D.C.
Keen, M., B. Lockwood (2006), Is the VAT a Money Machine?, National Tax Journal, 59, 905-928.
Keen, M. (2013), The Anatomy of the VAT, IMF Working Paper, WP/13/111, May.
Kleven, H., M. Knudsen, C. Kreiner, S. Pedersen, E. Saez (2011), Unwilling or Unable to Cheat?
Evidence from a Tax Audit Experiment in Denmark, Econometrica, 79, 651-692.
VAT Gap in the EU-28 Member States
page 82 of 82
Luttmer, E. F. P., M. Singhal (2014), Tax Morale, Journal of Economic Perspectives, 28, 149-168.
OECD (2017), Tax Administration 2017: Comparative Information on OECD and Other Advanced
and Emerging Economies, OECD Publishing, Paris.
Pomeranz, D. (2015), No Taxation without Information: Deterrence and Self-Enforcement in the
Value Added Tax, American Economic Review, 2539-69.
Poniatowski, G., Bonch-Osmolovskiy, M., Belkindas, M. (2016), 2014 Update Report to the Study
to quantify and analyse the VAT Gap in the EU Member States, Report of project
TAXUD/2015/CC/131.
Slemrod, J., S. Yitzhaki (1987), The optimal size of a tax collection agency, Scandinavian Journal of
Economics, 89, 25-34.
Slemrod, J., C. Gillitzer (2014), Tax Systems, The MIT Press.
Yitzhaki, S. (1974), A note on “Income tax evasion: A theoretical analysis, Journal of Public
Economics, 3, 201-2.