studies on biosecured shrimp culture of penaeus … annals of aquaculture and research. cite this...
TRANSCRIPT

Central Annals of Aquaculture and Research
Cite this article: Natarajan S, Deivasigamani B (2017) Studies on Biosecured Shrimp Culture of Penaeus monodon (Fabricius, 1798). Ann Aquac Res 4(1): 1031.
*Corresponding author
Santhi Natarajan, Department of Biotechnology, New Prince Shri Bhavani Arts & Science College, Medavakkam, Chennai, India, Tel: 04144 227606; Email:
Submitted: 07 December 2016
Accepted: 28 February 2017
Published: 15 March 2017
ISSN: 2379-0881
Copyright© 2017 Natarajan et al.
OPEN ACCESS
Keywords•Shrimp Culture•Penaeusmonodon
Research Article
Studies on Biosecured Shrimp Culture of Penaeus monodon (Fabricius, 1798)Santhi Natarajan1* and B.Deivasigamani2
1Department of Biotechnology, New Prince Shri Bhavani Arts & Science College, Chennai2CAS in Marine Biology, Annamalai University, India
Abstract
Aquaculture has been the fastest growing food production sector in the world among other sectors over the past 30 years. However, in some cases the rapid growth of the aquaculture sector has out stripped planning and regulation environmental impact and marketing have become unavoidably overriding issues in aquaculture development. At the same time demand for product quality and safety increased significantly. There is an urgent need in aquaculture to develop microbial control strategies, since outbreaks are recognized as important constraints to aquaculture production and since the development of antibiotic resistance has become a matter of growing concern. One of the alternatives to antimicrobials in disease control could be the use of probiotic bacteria as microbial control agents. This work to study the use of probiotic bacteria in the culture of larval aquatic organisms which may improve the survival rates of these larvae also stimulates their immune.
INTRODUCTIONShrimp aquaculture expanded significantly throughout Asia
and Latin America during the 1980’s and this expansion was possible by abundant wild seed resources, static production of shrimp from capture fisheries and high profits from shrimp culture (Fast and Menasveta, 2000). Despite high levels of shrimp production by culture, shrimp farmers suffered significant economic losses in recent years due to disease problems that have plagued the industry. In Asia, mortalities of cultured shrimp due to White Spot Syndrome Virus (WSSV) and Yellow Head Virus (YHV) have resulted in economic losses of about $1 billion per year since 1994 (Lightner et al., 1998). In Ecuador alone, Taura Syndrome Virus (TSV) has been responsible for an estimated loss of 400 million US$ in revenue per year and this virus has had an equally devastating impact in other shrimp farming countries of the Western Hemisphere including the U.S. (Brock et al., 1997). To meet the growing demand for high-quality shrimp products, novel production systems must be designed to minimize the introduction and spread of pathogenic agents as well as to protect coastal resources. Biosecured zero-exchange systems represent an emerging technology that provides a high degree of pathogen exclusion with minimal water exchange. An important ramification associated with reduced or zero water exchange is the increased importance of in situ microorganisms both in regulating biogeochemical cycles within the culture environment and in directly affecting shrimp growth and survival.
Aquaculture uses resources from and interacts with the environment. Many aquaculture operations generate metabolic waster products (e.g., feces, ammonia, uneaten food etc.) that are released into the receiving waters. In some cases, the organic particulate waste will accumulate on the seabed in the immediate vicinity of the farm, while soluble waste will eventually end up in the receiving waters. Organic enrichment of the benthic ecosystem may result in formation of anoxic conditions. Under extreme cases, reduction in macrofauna biomass, abundance and species composition may also follow [4]. In semi-intensive and intensive pond systems, sometime upto 40% of pond volume is exchanged daily. For example, old shrimp production practices in Taiwan, required upto 43 m3 of water for every 1 Kg of shrimp produced [5]. Often on large farms, water exchange is based on a set schedule with occasional emergency flushes [6] rather than as an ongoing response to changing pond conditions. The concept of biological disease control, particularly using microbiological modulator for disease prevention has received widespread attention.
MATERIALS AND METHODSThe study was carried out in a commercial shrimp farm
situated at Marakkanam near Pondicherry. This shrimp farm with three ponds had a total water spread area of 2.9 ha (Pond 1 – 0.6 ha; Pond 2 – 0.7 ha and Pond 3 – 1.6 ha). Ponds 1 and 2 were used as experimental ponds and pond 3 was used as control.

Central
Natarajan et al. (2017)Email:
Ann Aquac Res 4(1): 1031 (2017) 2/11
Pond preparation
Soil Culture: Initially the pH of the soil was checked and was found to be between 5.9 and 6.3. Lime was applied at the rate of 500, 500 and 600 Kg in ponds 1, 2 and 3 respectively. And the pH was increased to 7.2. The bottom was tilled and dried. After a week, water was pumped in with the help of a 10 HP pump.
Water culture: Water was pumped from Uppanar estuary into the reservoir and the pumped in water was disinfected with bleaching powder at the rate of 60 ppm/ha. The water was left undisturbed for 10 days to remove the residual chlorine. Later the water was pumped to the culture ponds.
Fertilizing the ponds: In ponds 1 and 2, an organic mixture of rice bran, cow dung, yeast and a blend of probiotic bacteria were inoculated for plankton production. In pond No. 3, initial fertilization to develop the plankton bloom was done with inorganic fertilizers in the ratio of 10:2 (N: P).
STOCKINGHealthy and WSSV negative Penaeus monodon seeds were
purchased from a reputed hatchery at Marakkanam, Tamil Nadu. The seeds were stocked at a density of 10/m2. Before stocking, the seeds were acclimatized to the pond environment as given below.
1. Seed bags were allowed to float in the water surface in each pond for 30 min. to adjust the temperature.
2. The bags were opened and the pond water was introduced slowly by sprinkling into the bags for 60 min. to equalize with pond water quality.
3. The bags were drawn to different parts of the pond and seeds were released slowly.
The survival rate after socking was estimated using survival cages (happa nets), laid near the outlet of each pond with 100 PLS in each pond. Based on the survival rate on the 3rd day, the feed ratio was decided.
FEEDING Feeding was done using CP feed (Charoen Pokhpand
aquaculture India Pvt. Ltd, Thaiwan). The feeding schedule was based on the feed chart provided by the manufacturing company. Blind feeding was done for the first 30 days. Later the feeding was adjusted based on the check tray observation and sampling. Four check trays were provided per pond.
The feed ration was divided into 4 times in a day (25%, 20%, 30% and 25% at morning (6.00 AM), noon (12.00 Noon), evening (6.00 PM) and night (1.00 AM) and provided respectively. The feed was broadcasted from the dyke during the initial phase and center feeding using a float followed during the later stages.
SAMPLINGSampling was done in all ponds every fortnight during early
hours of the day with a cast net. Five hauls were made in each pond. The shrimps caught per haul and their individual weights were recorded. Healthiness, survival rate, average body weight (ABW) and average daily growth (ADG) of the animal was
estimated through the samples. The diameter of the cast net used for sampling was 3.3 mts. The area of the net was calculated with 60% efficiency of coverage at the bottom.
WATER EXCHANGESExchange of water was not carried out throughout the culture
period in the experimental ponds, but topping up of water from the reservoir compensated the water loss due to evaporation, percolation and seepage.
PROBIOTICSCommercially available probiotic super NB (CP aquaculture
India Pvt. (Ltd) was used.
Activationof Probiotics
200 ml of the probiotic with rice bran, tapioca flour, sugar and yeast were added to 200 l of freshwater and left overnight with vigorous aeration. After fermentation, the slurry was applied evenly in the ponds. The dosage of the probiotic was increased as the culture days increased.
Water quality assessment
Water quality analysis was done in all the ponds following standard method. pH cone was used to find out the soil pH. pH pen (Scan – 2- Eutech cybernetics PTE Ltd, Singapore) was used to measure the water pH and handy refractometer (Atago, Japan) for estimating salinity. Dissolved oxygen and temperature together were measured with the help of handy D.O meter (YSI 55 model). Ammonia was determined using the sea water method as described by [9] and recorded as parts per million (ppm). Nitrate, nitrite, total phosphate and silicate were estimated following the methods described by [10]. A secchi disc was used to measure the transparency. The total heterotrophic bacterial population was estimated following the standard procedures.
Total heterotrophic bacteria (THB) population
To estimate the total heterotrophic bacterial population in the experimental ponds and control pond, the water and sediment samples were collected to find out the differences in the THB population. For this study, dehydrated bacteriological medium, Zobell’s 2216 (Himedia Laboratories Private Limited, Mumbai, India) was dissolved in 50% sea water and sterilized by autoclaving at 15 lb. pressure for 15 minutes. The glasswares such as petriplates and conical flasks were sterilized in a hot-air oven at 165oC for 2 hours. One ml of sample was mixed in 9 ml of sterilized water and from this tube 1ml was transferred to the next dilution blank. Likewise appropriate dilutions were made. From the above sample, 1ml of aliquot was transferred to the sterile petriplates, to which 15-20 ml of melted and cooled Zobell’s marine agar medium was poured and mixed with the sample thoroughly. For sediments 99 ml was used. The following procedures were similar to those done to water samples. Then the inoculated plates were incubated in an inverted position. After 48 hours they were counted and expressed as colony forming units (CFU)
RESULTSWater quality Parameters
Temperature: The variations in the temperature are plotted in Figures (1, 2 and 3) and it ranged from 27.8 to 32.8°C in the

Central
Natarajan et al. (2017)Email:
Ann Aquac Res 4(1): 1031 (2017) 3/11
control pond, 26.9 to 34.3°C and 26.7 to 32.9°C in experimental ponds1and 2 respectively (Figures 1,2 and 3).
Salinity: The salinity levels varied between 29 to 40 ppt. There was not much difference between control and experimental ponds. The results are given in Figures (4, 5 and 6).
pH: The pH values in the control pond ranged from 6.1 to 8.3. In the experimental ponds the values ranged between 7.2 and 8.5. Fluctuation was higher in the control pond when compared to the experimental ponds (Figures 7, 8 and 9).
Dissolved Oxygen: The dissolved oxygen concentration varied from 3.6 to 5.2 mg/l in the control pond and 4.1 to 6.8 in the experimental ponds (Figures 10, 11 and 12).
TRANSPARENCYThe transparency of the water in the control pond decreased
from 90 to 70 cm and in the experimental ponds the transparency gradually decreased from 85 to 55 cm after the application of probiotics (Figures 13, 14 and 15).
TOXIC METABOLITES
Ammonia
The ammonia concentration was from 0.31 to 0.68 ppm in the
Days of culture
15 30 45 60 75 90 105 120 135
Tem
pera
ture
o C
27
28
29
30
31
32
33
34
Figure 1 Range of temperature in control pond.
Days Of Culture
15 30 45 60 75 90 105 120 135
Tem
pera
ture
o C
27
28
29
30
31
32
33
34
35
Figure 2 Range of temperature in experimental pond 1.
Days of Culture
15 30 45 60 75 90 105 120 135
Temp
eratu
re 0 C
26
28
30
32
34
36
Figure 3 Range of temperature in experimental pond 2.
Days of culture
15 30 45 60 75 90 105 120 135
Salin
ity 0 / 00
20
25
30
35
40
45
50
Figure 4 Range of salinity in control pond.
Days of Culture
15 30 45 60 75 90 105 120 135
Salin
ity 0 / 00
25
30
35
40
45
50
Figure 5 Range of salinity in experimental pond 1.
experimental ponds and in the control pond it ranged between 0.38 and 0.93 ppm (Figures 16, 17 and 18).
NitriteNitrite concentration ranged from 0.0014 to 0.0077 ppm in
the experimental ponds. In the control pond the values of nitrite varied from 0.0016 to 0.0105 ppm (Figures 19, 20 and 21).
NUTRIENTSNitrate
Nitrate concentration varied from 0.0037 to 0.0169 ppm in the experimental ponds. In the control pond, nitrate levels ranged

Central
Natarajan et al. (2017)Email:
Ann Aquac Res 4(1): 1031 (2017) 4/11
Days of Culture
15 30 45 60 75 90 105 120 135
Salin
ity 0 / 00
22
24
26
28
30
32
34
36
38
40
42
44
Figure 6 Range of salinity in experimental pond 2.
Days of culture
15 30 45 60 75 90 105 120 135
DO (m
g/l)
3
4
5
6
Figure 10 Range of DO in control pond.
Days of culture
15 30 45 60 75 90 105 120 135
pH
5
6
7
8
9
Figure 7 Range of pH in control pond.
Days of Culture
15 30 45 60 75 90 105 120 135
DO (m
g/l)
4
5
6
7
Figure 11 Range of DO in experimental pond 1.
Days of Culture
15 30 45 60 75 90 105 120 135
pH
6
7
8
9
Figure 8 Range of pH in experimental pond 1.
Days of Culture
15 30 45 60 75 90 105 120 135
DO (m
g/l)
3
4
5
6
7
Figure 12 Range of DO in experimental pond 2.
Days of Culture
15 30 45 60 75 90 105 120 135
pH
6
7
8
9
Figure 9 Range of pH in experimental pond 2.Days of culture
15 30 45 60 75 90 105 120 135
Tran
spar
ency
(cm)
60
65
70
75
80
85
90
95
100
Figure 13 Range of transparency in control pond.

Central
Natarajan et al. (2017)Email:
Ann Aquac Res 4(1): 1031 (2017) 5/11
Days of Culture
15 30 45 60 75 90 105 120 135
Tran
spar
ency
(Cm)
40
50
60
70
80
90
Figure 14 Range of transparency in experimental pond 1.
Days of Culture
15 30 45 60 75 90 105 120 135
Ammo
nia(p
pm)
0.3
0.4
0.5
0.6
0.7
0.8
Figure 18 Range of ammonia in experimental pond 2.
Days of Culture
15 30 45 60 75 90 105 120 135
Tran
spar
ency
(Cm
)
50
60
70
80
90
100
Figure 15 Range of transparency in experimental pond 2.
Days of Culture
15 13 45 60 75 90 105 120 135
Nitri
te (p
pm)
0.000
0.002
0.004
0.006
0.008
0.010
0.012
Figure 19 Range of nitrite in control pond.
Days of Culture
15 30 45 60 75 90 105 120 135
Ammo
nia (p
pm)
0.2
0.4
0.6
0.8
1.0
1.2
Figure 16 Range of ammonia in control pond.
Days of Culture
15 30 45 60 75 90 105 120 135
Nitrit
e (pp
m)
0.000
0.001
0.002
0.003
0.004
0.005
0.006
0.007
0.008
Figure 20 Range of nitrite in experimental pond 1.
Days of Culture
15 30 45 60 75 90 105 120 135
Ammo
nia (p
pm)
0.25
0.30
0.35
0.40
0.45
0.50
0.55
0.60
0.65
Figure 17 Range of ammonia in experimental pond 1.Days of Culture
15 30 45 60 75 90 105 120 135
Nitrit
e (pp
m)
0.000
0.002
0.004
0.006
0.008
0.010
Figure 21 Range of nitrite in experimental pond 2.

Central
Natarajan et al. (2017)Email:
Ann Aquac Res 4(1): 1031 (2017) 6/11
between 0.0029 and 0.0141 ppm (Figures 22, 23 and 24).
Total phosphate
In the experiment ponds the total phosphate levels varied from 0.0034 to 0.0136 ppm. The concentration in the control pond ranged between 0.0023 and 0.0097 ppm (Figures 25, 26 and 27).
Silicate
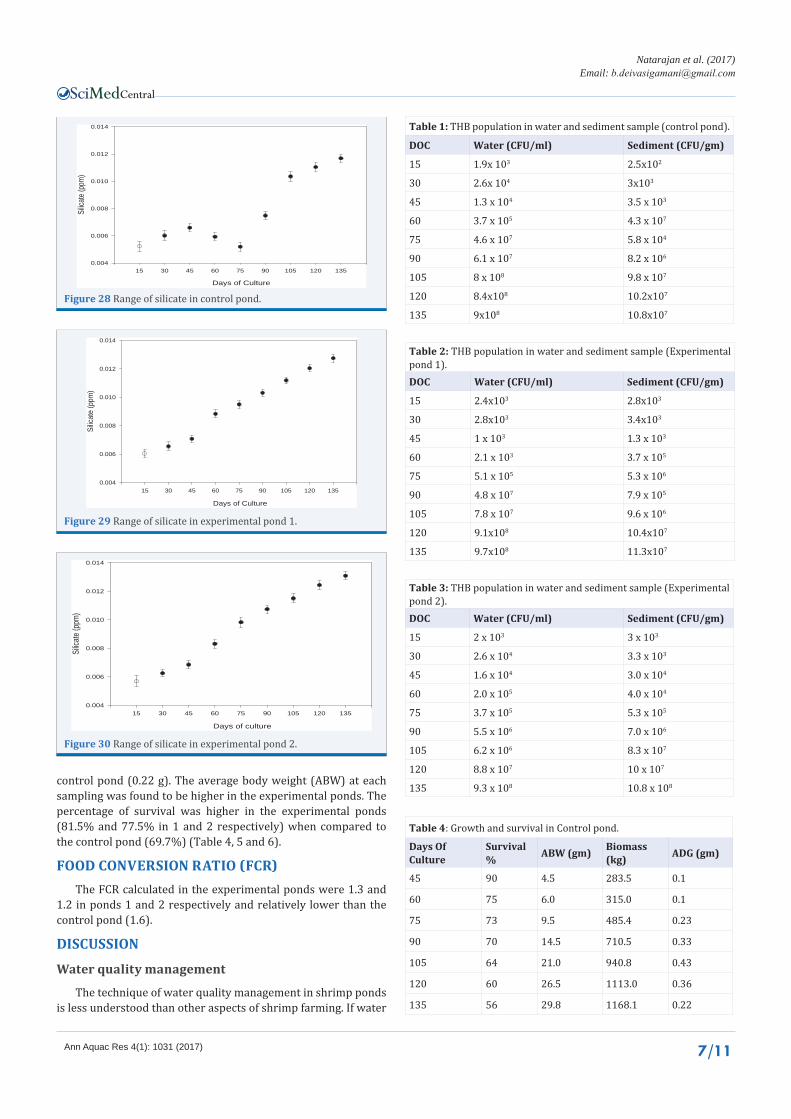
The silicate concentration in the experimental ponds was from 0.0058 to 0.0131 ppm. The levels of silicate in the control pond declined. However there was an increase in the levels after 90 DOC. The values ranged from 0.0053 to 0.0118 ppm (Figures 28, 29 and 30).
Total Heterotrophic Bacterial Population (THB)
In the water samples, the maximum value of THB population ranged from 2x10³ to 10.3x10⁸ and from 2x10³ to 9.9x10⁸ in the experimental ponds 1 and 2 respectively. In the control pond, the values were between 1.9x10³ and 9x10⁸.
In the sediment samples, the THB population was from 2.8x10³ to 12.1x10⁸ in the experimental pond 1 and 3x10³ to 11.6x10⁸ in the experimental pond 2. In the control pond the value increased from 2.5x10² to 10.8x10⁷ (Tables 1, 2 and 3).
GROWTH AND SURVIVALThe daily growth rate of cultured shrimps was higher in the
experimental ponds (0.25 and 0.24 g), when compared to the
Days of Culture
15 30 45 60 75 90 105 120 135
Nitra
te (p
pm)
0.000
0.002
0.004
0.006
0.008
0.010
0.012
0.014
0.016
Figure 22 Range of nitrate in control pond.
Days of Culture
15 30 45 60 75 90 105 120 135
Nitra
te (p
pm)
0.002
0.004
0.006
0.008
0.010
0.012
0.014
0.016
0.018
0.020
Figure 23 Range of nitrate in experimental pond 1.
Days of culture
15 30 45 60 75 90 105 120 135
Nitra
te (p
pm)
0.000
0.002
0.004
0.006
0.008
0.010
0.012
Figure 24 Range of nitrate in experimental pond 2.
Days of Culture
15 30 45 60 75 90 105 120 135
Phos
phat
e (p
pm)
0.000
0.002
0.004
0.006
0.008
0.010
0.012
Figure 25 Range of total phosphate in control pond.
Days of Culture
15 30 450 60 75 90 105 120 135
Phos
phate
(ppm
)
0.002
0.004
0.006
0.008
0.010
0.012
0.014
0.016
Figure 26 Range of total phosphate in experimental pond 1.
Days of Culture
15 30 45 60 75 90 105 120 135
Phos
phate
(ppm
)
0.001
0.002
0.003
0.004
0.005
0.006
0.007
0.008
Figure 27 Range of total phosphate in experimental pond 2.
Central
Natarajan et al. (2017)Email:
Ann Aquac Res 4(1): 1031 (2017) 7/11
Days of Culture
15 30 45 60 75 90 105 120 135
Silic
ate (p
pm)
0.004
0.006
0.008
0.010
0.012
0.014
Figure 28 Range of silicate in control pond.
Days of Culture
15 30 45 60 75 90 105 120 135
Silic
ate
(ppm
)
0.004
0.006
0.008
0.010
0.012
0.014
Figure 29 Range of silicate in experimental pond 1.
Days of culture
15 30 45 60 75 90 105 120 135
Silic
ate (p
pm)
0.004
0.006
0.008
0.010
0.012
0.014
Figure 30 Range of silicate in experimental pond 2.
control pond (0.22 g). The average body weight (ABW) at each sampling was found to be higher in the experimental ponds. The percentage of survival was higher in the experimental ponds (81.5% and 77.5% in 1 and 2 respectively) when compared to the control pond (69.7%) (Table 4, 5 and 6).
FOOD CONVERSION RATIO (FCR)The FCR calculated in the experimental ponds were 1.3 and
1.2 in ponds 1 and 2 respectively and relatively lower than the control pond (1.6).
DISCUSSION
Water quality management
The technique of water quality management in shrimp ponds is less understood than other aspects of shrimp farming. If water
Table 1: THB population in water and sediment sample (control pond).
DOC Water (CFU/ml) Sediment (CFU/gm)
15 1.9x 10³ 2.5x10²
30 2.6x 10⁴ 3x10³
45 1.3 x 10⁴ 3.5 x 10³
60 3.7 x 10⁵ 4.3 x 10⁷
75 4.6 x 10⁷ 5.8 x 10⁴
90 6.1 x 10⁷ 8.2 x 10⁶
105 8 x 10⁸ 9.8 x 10⁷
120 8.4x10⁸ 10.2x10⁷
135 9x10⁸ 10.8x10⁷
Table 2: THB population in water and sediment sample (Experimental pond 1).DOC Water (CFU/ml) Sediment (CFU/gm)
15 2.4x10³ 2.8x10³
30 2.8x10³ 3.4x10³
45 1 x 10³ 1.3 x 10³
60 2.1 x 10³ 3.7 x 10⁵
75 5.1 x 10⁵ 5.3 x 10⁶
90 4.8 x 10⁷ 7.9 x 10⁵
105 7.8 x 10⁷ 9.6 x 10⁶
120 9.1x10⁸ 10.4x10⁷
135 9.7x10⁸ 11.3x10⁷
Table 3: THB population in water and sediment sample (Experimental pond 2).DOC Water (CFU/ml) Sediment (CFU/gm)
15 2 x 10³ 3 x 10³
30 2.6 x 10⁴ 3.3 x 10³
45 1.6 x 10⁴ 3.0 x 10⁴
60 2.0 x 10⁵ 4.0 x 10⁴
75 3.7 x 10⁵ 5.3 x 10⁵
90 5.5 x 10⁶ 7.0 x 10⁶
105 6.2 x 10⁶ 8.3 x 10⁷
120 8.8 x 10⁷ 10 x 107
135 9.3 x 10⁸ 10.8 x 10⁸
Table 4: Growth and survival in Control pond.
Days Of Culture
Survival % ABW (gm) Biomass
(kg) ADG (gm)
45 90 4.5 283.5 0.1
60 75 6.0 315.0 0.1
75 73 9.5 485.4 0.23
90 70 14.5 710.5 0.33
105 64 21.0 940.8 0.43
120 60 26.5 1113.0 0.36
135 56 29.8 1168.1 0.22

Central
Natarajan et al. (2017)Email:
Ann Aquac Res 4(1): 1031 (2017) 8/11
quality is not maintained properly shrimps will not feed and become more susceptible to disease, which leads to poor survival and growth [11], studied the problems in culturing black tiger shrimp (Penaeus monodon) – semi intensive way as an Indian experience. The water quality parameters that affect the shrimp productions in ponds are salinity, temperature, pH, dissolved oxygen, transparency, toxic metabolites (ammonia, nitrite) and nutrients (nitrate, total phosphate and silicate). Addition of probiotics, as water cleaner was found to be highly beneficial in the water quality management. This fact is established clearly in the present study.
Salinity and temperature are mainly dependent on climatic factors and others are altered by liming, fertilization, stocking and feeding [12], reported that the shrimps will respond to changes in each water quality parameter.
Temperature
Temperature plays a vital role in metabolism of shrimps. In culture pond the optimum temperature range is 25 to 30°C and temperature beyond this range is lethal [13] to shrimps. During the present study, the temperature was between 26.7 and 34.3°C. There was no difference between the experimental and control ponds. Being a tropical country, temperature is known to be high in Tamil Nadu, especially during summer and the recorded temperature did not affect the shrimps.
Salinity
Penaeus monodon is a euryhaline species which can adapt easily to wide variation in salinity. The normal growth of P. monodon can be achieved between 15 and 20 ppt [14-19] also stated that the ideal salinity for P. monodon is from 15 to 25 ppt and high or low salinity affects the moulting frequency. In this
study, salinity was varying vastly from 29 to 40 ppt in all the ponds.
pH
The pH of brackish water is not a direct threat to shrimps’ health because brackish water is well buffered against pH change and pH will mostly remain within the range of 6.5 to 9.5. The pH of the culture medium is directly related with metabolism and other physiological process of shrimps. Low pH increases the toxicity of nitrite to cultured organism (Wedemeyer and Yasulake 1978) and the toxic form of sulfide [20] and high pH increases the unionized ammonia [21]. It also reduces the natural pond production presumably by reducing the availability of nutrients [22] including phosphorus [23]. During the present study the water pH ranged from 6.1 to 8.3 in the control pond.
Dissolved Oxygen
The major factors that affect the solubility of dissolved oxygen in water are temperature, salinity, pressure and biological process. Generally the concentration of dissolved oxygen is high in the afternoon due to photosynthetic activity of phytoplankton and low in the early morning due to only respiration and no photosynthesis in the night [24,25], concluded that emergency
Table 5: Growth and survival in Experimental pond 1.Days of Culture Survival % ABW (gm) Biomass
(kg) ADG (gm)
45 95 4.8 273.6 0.10
60 88 7.8 411.8 0.2
75 85 11.6 591.6 0.25
90 80 16.2 777.6 0.30
105 75 23.1 1039.5 0.46
120 74 29.3 1300.9 0.41
135 74 34.5 1531.8 0.34
Table 6: Growth and survival in Experimental pond 2. Days Of Culture
Survival % ABW (gm) Biomass
(kg) ADG (gm)
45 90 4.6 248.4 0.10
60 83 7.1 353.5 0.16
75 80 10.6 508.8 0.23
90 76 15.8 720.4 0.34
105 74 22.6 1003.4 0.45
120 70 28.4 1192.8 0.38
135 70 32.6 1369.2 0.28
Plate 1

Central
Natarajan et al. (2017)Email:
Ann Aquac Res 4(1): 1031 (2017) 9/11
measures must be taken if the dissolved oxygen concentration falls below 3 ppm. [26] suggested that the dissolved oxygen levels should be kept above 2 ppm at all times, [27] reported that the rate of respiration in Penaeus monodon remained constant at dissolved oxygen concentration level of 3 to 4 ppm in water. Low dissolved oxygen level occurs in shrimp ponds due to phytoplankton die off and decomposition of the same [28] and can cause stress or even mortality of shrimps in ponds [29-31]. Low dissolved oxygen increases the ammonia concentration and decreases the pH levels [23]. In the present study, in the control pond the dissolved oxygen levels ranged between 3.6 to 5.2 ppm. The dissolved oxygen level was always above 4 ppm in the experimental ponds, favourable for the health of shrimps. This may be correlated with the stable bloom throughout the culture period.
Transparency
Phytoplankton plays a significant role in the pond ecosystem and minimizes the water quality fluctuations. A stable phytoplankton population enriches the culture medium and competes with other pathogenic bacterial population for nutrients and suppresses the bacterial growth. Generally phytoplankton density is monitored by secchi disc. Water colour is also a good indicator. Dull green or yellowish or green brownish green colours are associated with green algae and diatoms. The visibility of secchi disc increases with decreasing phytoplankton abundance and decreases with increasing phytoplankton population. The optimum level of transparency is from 25 to 40 cm [32]. According to Boyd and Fast (1992) secchi disc readings of 25 to 35 cm are considered desirable by most shrimp farmers and the measurements should be made 800 and 1000 hr or between 1400 and 1600 hr. (Almazan and Boyd, 1978). In the present study, the transparency levels in the control pond ranged from 90 to 75 cm. This was due to unstable bloom in the control pond. In the experimental ponds, the levels decreased gradually from 85 to 55 cm. From the results of the present study it is quite evident that probiotics are helpful in the maintenance of phytoplankton bloom and hence the recorded transparency in the experimental ponds.
Toxic metabolites
Ammonia is the end product of protein catabolism in crustaceans and can account for 40 to 90 % of nitrogen excretion [33], and nitrite is an intermediate product of nitrification. However, ammonia is more toxic than nitrite. Generally, ammonia exists in water both in ionized and unionized forms. Among these two, ionized ammonia is more toxic than unionized form. Ammonia concentration depends on pH, temperature and to lesser extent salinity [34], observed that the safe level of total ammonia for adolescent of Penaeus monodon was 4.3 ppm. Previously, [23] stated that pond seldom contains more than 2 or 3 ppm of total ammonia nitrogen. The safe level of nitrite was 1.2 ppm for P. monodon [26].In the present study, values of total ammonia were found well within the safe levels, varying from 0.38 to 0.93 in the control pond and 0.31 to 0.68 in the experimental ponds. The nitrite levels ranged from 0.0016 to 0.0105 ppm in the control pond. In the experimental ponds, the values fluctuated between 0.0014
and 0.0077 ppm. The controlled levels of ammonia and nitrite in the experimental ponds may be attributed to the addition of probiotics.
Nutrients
Nitrate and phosphate are the major nutrients, which commonly determine the phytoplankton production and abundance. There is no need to apply these nutrients as fertilizers in the later stages of culture. Sometimes, nutrients do not significantly increase in the water column due to rapid uptake by phytoplankton.
Nitrate is an end product of nitrification and phosphate in pond water is dependent on the addition of fertilizers and feed. The optimum levels of the nutrients for the establishments of phytoplankton are unknown [13]. During the present study, the concentrations of the nutrients in the experimental ponds were higher, than in the control pond. This can be attributed to mineralization of organic matter by the beneficial microbes.
TOTAL HETEROTROPHIC BACTERIAL (THB) POPULATION IN POND WATER AND IN SEDIMENT
In general, bacterial productivity was higher in the sediment than in water [35], experienced a rapid degradation of pellet feeds by bacteria due to high temperature and he concluded that the pellet feed was primarily the base for a microbial food chain Allan et al.,(1995) reported that the bacterial population depends upon the presence of organic load in the sediment. Putro et al., (1990) and Peranginangin et al., (1992) reported that pond waters of South East Asian countries showed relatively higher bacterial load. In the present study, the total heterotrophic bacteria were found higher in the experimental ponds than the control pond. This indicates that the higher values occurred due to the addition of probiotics in the experimental ponds.
FEED MANAGEMENTManagement and quality of feed play a major role in FCR
(Feed Conversion Ratio) and production. Over feeding leads to pond bottom deteriorations [36-38] proved that multiple feeding will improve growth rate, better FCR and minimize the accumulation of uneaten feed as the juvenile and adult penaeid shrimps ingest what they can effectively assimilate at one time and stop feeding once their cardiac chamber has been filled [39-40]. found that the growth rate of Penaeus vannamei significantly improved with increase in feeding frequency from one to four times per day. The same schedule of 4 times feeding per day was followed in this experiment also [32], postulated that maximum growth was sustained by adjustment of feeding rate in such a way that the shrimps are slightly under fed. In the present study, the feed ration was adjusted based on the monitoring of feeding trays.
GROWTH[41] Reported that Penaeus monodon gained an average body
weight of 16 g after 4 months of culture in ponds [42], reported that the daily growth rate of prawn ranged from 0.6 mm/0.039g to 1.2 mm/0.18 g. [43] recorded the maximum growth rate of 0.17 g per day for P. monodon in a culture pond. Koshio, (1985) reported that higher growth rate was related to higher moult

Central
Natarajan et al. (2017)Email:
Ann Aquac Res 4(1): 1031 (2017) 10/11
frequency and higher weight gain [45], recorded weight of 37.15 g (133 DOC) and 33.2 g (121 DOC) in semi-intensive culture system using probiotics and extensive culture ponds respectively. In the present study, the animals reached a weight of 34.5 g and 32.6 g in the experimental ponds 1 and 2 respectively and 29.8 g in the control pond.
WATER EXCHANGEThe present study was carried out to understand the merits of
‘zero water exchange’ system of farming and the results obtained were satisfactory. This study has brought out the fact that producing shrimp in ‘zero water exchange’ system has beneficial effects on survival and mean final weight or FCR. Further, it has good water quality for culture during the entire duration of grow out period. These results obtained are supported by the works carried out by [46-50]. They also stated that, when carefully managed, the water quality with no water exchange could support the growth of fish and shellfish. Use of probiotics improves water quality, increased shrimp survival and enhanced production with advantageous FCR. Based on the earlier reports and the present findings, shrimp farmers may be recommended to revise their system of farming for safety of the shrimp stock in ponds and their productivity [50-53], studied the usefulness of applying probiotics in shrimp culture pond.
DISEASEAlso, in the present study, there was no incidence of disease in
the experimental ponds, whereas in the control pond, there were some problems related to bacterial infection. The healthiness of shrimps in the experimental ponds may be attributed to the use of probiotics. The application of probiotics have improved the water quality and also increased the disease resistance capacity in shrimps as mentioned by [53-56]. The probiotics organisms produce specific components like bacteriocins, which inhibit major pathogens [57]. Though the pathogens cannot be eliminated in total from the culture system, their growth can be suppressed and kept under control by the beneficial bacteria, as established by this study.
REFERENCES1. Alabaster JS, Lloyd R. Water quality criteria for freshwater fish.
Butterworth, London. 1980; 361: 22.
2. Allan GL. NSW prawn production up. Aust Aquacult Mag. 1989; 4: 23-25.
3. Almazan C, Boyd CE. An evaluation of secchi disc visibility for estimating plankton density in fish ponds. Hydrobiology. 1978; 65: 601-608.
4. Barg UC. Guidelines for the promotion of environmental management of coastal aquaculture development. FAO Fish Tech Pap. 1993; 328: 122.
5. Chien YH, Liao IC, Yang CM. The evolution of prawn grow-out system and their management in Taiwan. Chem Symp Ser. 1989; 111: 143-168.
6. Macia RP. Penaeus shrimp pond grow-out in Panama, In: McVey, J.P. (ed.) CRC Handbook of Mariculture, Vol 1. Crustacean Aquaculture, CRC Press, Boca Raton, FL. 1983; 169-178.
7. Strickland JDH, Parsons TR. A practical hand book of sea water analysis. Bull. Fish Res. Bd. Canada. 1972; 167: 301.
8. Rajagopal S, Srinivasan M, Ajmal khan s. Problems in culturing black tiger shrimp (Penaeus monodon) the semi-intensive way: An Indian experiences, NAGA, (ICLARM, quarterly). 1995; 18: 29-30.
9. Boyd CE. Water quality management and aeration in shrimp farming. Fisheries and Allied Aquaculture Departmental Series, Auburn University. 1989; 2: 83.
10. Browdy C. Recent developments in penaeid broodstock and seed precaution technologies: improving the outlook for superior captive stocks. Aquaculture. 1998; 164: 3-21.
11. Boyd CE, Fast AW. Pond monitoring and management of marine shrimps culture, principle and practices. Elsevier Science Publisher. 1992; 497-513.
12. Chen TP. Aquaculture practices in Taiwan. Fishing News Books Ltd. Farnham, Surrey. 1976.
13. Hopkins JS, Hamilton RD, Sandifer PA, Browdy CL, Stokes AD. Effect of water exchange rates on production, water quality, effluent characteristics and nitrogen budgets in intensive shrimp ponds. J World Aquacult Soc. 1993; 24: 304-320.
14. Chen MC. Water quality criteria for farming the grass shrimp Penaeus monodon. In: Taki, Y., J.H. Primavera (eds.), Proc. 1st Intern. Conf. on the Culture of penaeid prawns/shrimps. Aquaculture Department, SEAFDEC, Phillippines. 1985.
15. Ferraris RP, Estepa FDP, Ladja JM, EG, De Jesus. Osmotic, total protein and chloride regulation in Penaeus monodon, In: Taki, Y., J.H. Primavera and J.A. Llobrera, (eds.), Proc. First International Conference on the Culture of Penaeid Prawns/shrimps. Aquacult. Dep., SEAFDEC, Illoilo, Phillipnes. 1985: 165.
16. Cheng JH, Liao IC. The effect of salinity on the osmotic and ionic concentration in the haemolymph of Penaeus monodon and P. penicillatus. In: Maclean, J.L., L.B. Dizon and L.V. Hosillos (eds.). The First Asian Fisheries Forum, Asian Fisheries Society, Manila, Philippines. 1986; 633-636.
17. Wedemeyer GA, Yasulake WT. Prevention and treatment of nitrite toxicity in juvenile steel head trout (Salmo gairdneri). J Fish Res Br Canada. 1978; 35: 822-827.
18. Chien YH. Water quality requirements and managements for marine shrimp culture. In: Wyban, J. (ed.), Proc. Special Session on Shrimp Farming. World Aquacult. Soc., Baton Ronge., L.A. XX-XX. 1992.
19. Clot JE, Armstrong DA. Nitrogen toxicity to crustaceans, fish and molluscs. In: Allen, L.J. and E.C. Kinney, (eds.), Proc. bio-engineering symposium for fish culture. Fish Culture Section of the American Fisheries Society, Bethesda, MD. 1981: 34-47.
20. Alabaster JS, Lloyd R. Water quality criteria for freshwater fish. Butterworth, London. 1980; 361.
21. Boyd CE. Water quality management for warm water fish culture. Developments in Aquaculture and Fisheries Science, Elsevier, Amsterdam. 1982; 9: 318.
22. Almazan C, Boyd CE. An evaluation of secchi disc visibility for estimating plankton density in fish ponds. Hydrobiology. 1978; 65: 601-608.
23. Jory DE. Use of probiotics in penaeid shrimp grow-out. Aquacult. Magazine. 1998; 24: 62-67.
24. Law AT. Water quality requirements for Penaeus monodon culture. In: Proc. Sem. Marine Prawn Farming in Malaysia Serdang. Malaysia. Fish. Sco. 1988; 53-65.
25. Lavilla – Pitogo CR. Bacterial diseases of penaeid shrimp: An Asian view. In: Shariff, M., J.R. Arthur and R.P. Subasinghae (eds.), Diseases in

Central
Natarajan et al. (2017)Email:
Ann Aquac Res 4(1): 1031 (2017) 11/11
Natarajan S, Deivasigamani B (2017) Studies on Biosecured Shrimp Culture of Penaeus monodon (Fabricius, 1798). Ann Aquac Res 4(1): 1031.
Cite this article
Asian Aquaculture II, Fish Health Section, Asian Fish Society, Manila. 1995; 107-121.
26. Chang WYB, Ouyang H. Dynamics of dissolved oxygen and vertical circulation in fish ponds. Aquaculture. 1988; 74: 263-276.
27. Shigueno K. Shrimp culture in Japan. Association for International Technical Promotion, Tokyo, Japan. 1975; 153.
28. Wickens JW. Prawn biology and culture. Oceanogr Mar Biol Annual Rev. 1976; 14: 435-507.
29. Madenjian CP, Rogers GL, Fast AW. Predicting nightime dissolved oxygen loss in prawn ponds of Hawaii Part 1. Evaluation of traditional Methods, Aquacult Eng. 1987; 6: 191-208.
30. Clifford HC. Marine shrimp pond management a review. In: Wyban, J. (ed.), Proceedings of the Special Session on Shrimp Farming. Am. Soybean Assoc. L.A. U.S.A. 1992.
31. Parry G. Excretion, the physiology of crustacean. In: Waterman, T.H. (ed.), Academic Press, New York. 1960; 1: 341-366.
32. Chen JC, TSheu S. Effect of ammonia at different pH on Penaeus japanicus postlarvae. In: Hirano, R. and I. Hanyu, (eds.), The Second Asian Fisheries Forum. Asian Fishereis Society, Manila, Phillipines. 1990; 61-64.
33. Moriarty DJW. Control of luminous Vibrio species in aquaculture ponds. Aquaculture. 1998; 164: 351-358.
34. Sedgewick RW. Effect of ration size and feeding frequency on the growth and food conversion of juvenile Penaeus merguiensis (de Man). Aquaculture. 1979; 16: 279-298.
35. Dall W, Hill BJ, Rothlisberg PC, Staples DJ. The biology of Penaeidae. In: Blaxter, J.H.S. and A.J. Southward (eds.), Advances in Marine Biology, Academic Press, New York. 1990; 27.
36. Lovett DL, Feler DL. Ontogeny of kinematics in the gut of the white shrimp Penaeus setiferus (Decapoda: Penaeidae). J Crust Biol. 1990; 10: 53-68.
37. Wyban JA, Sweeney JN. Intensive shrimp growout trials in a round pond. Aquaculture. 1989; 76: 215-225.
38. Robertson L, Lawreace AL, Castill F. Feeding frequency and feeding time effects on growth of Penaeus vanname. Was. 1992; 92.
39. Santiago AC. Successful spawning of cultured Penaeus monodon Fabricius after eyestalk ablation. Aquaculture. 1977; 11: 185-196.
40. Rajalaxmi T, Pillai SM, Royand AK, Varghese PV. Studies on rearing of Penaeus monodon (Fabricius) in brackishwater ponds using pelleted feeds. J. Inland Fish. Soc. India. 1982; 14: 28.
41. Allan GL. NSW prawn production up. Aust. Aquacult. Mag. 1989; 4: 23-25.
42. Lewus CB, Kaiser A, Montville JJ. Inhibition of food-borne bacterial pathogens by Bacteriocins form Lactic Acid Bacteria isolated from
Meat. Appl Microbiol. 1991; 57: 1683-1688.
43. Mayavu P. Studies on shrimp diseases in aqua farms with special reference to white spot and loose shell in tiger shrimp Penaeus monodon (Fabricius, 1798). Ph.D. Thesis, Annamalai University, India. 2002; 144.
44. McIntosh D, Samocha TM, Jones ER, Lawrence AL, Mckee DA, Horowitz S, Horowitz A. The effect of a commercial bacterial supplement on the high-density culturing of L. vannamei with a low-protein diet in an out door tank system and no waters exchange. Aquacult Eng. 2000; 21: 215-227.
45. Boyd CE, Hollerman WD, Plumb JA, Saeed M. Effect of treatment with a commercial bacterial suspension on water quality in channel catfish ponds. Prog. Fish Cult. 1984; 46: 36-40.
46. Tucker CS, Lloyd SW. Water quality in streams and channel catfish (Ictalurus puctatus) ponds in west-central Mississippi. Technical Bulletin No. 129, Mississippi Agricultural and Forestry Experiment Station, Mississippi State University, Starkville, Mississippi, USA. 1985.
47. Queiroz J, Boyd C. Effects of a bacterial inoculum in channel catfish ponds. J World Aquacult Soc. 1998; 29: 67-73.
48. Lin CK. Progression of intensive marine shrimp culture in Thailand, In: Browdy CL, J.S. Hopkins (eds.), Swimming through troubled water. Proc. Special Session on Shrimp Farming, World Aquaculture Society, Baton Rouge, L.A. Aquacult. 1995; 95: 13-23.
49. Lotz JM. Viruses, biosecurity, and specific pathogen free stocks in shrimp aquaculture. Wo J of Microb Biotech. 1997; 13: 405-413.
50. Prabhu NM, Nazar AR, Rajagopal S, Ajmal Khan S. Use of probiotics in water quality management during shrimp culture. J Aqua Trop. 1999; 14: 227-236.
51. Saravanan R, Rajagopal S, Vijayanand P. The role of organics and probiotics in shrimp culture. ICFAI J.Li. Scie., Vol III. 2009; 60–68.
52. Lunestad BT. Impact of farmed fish on the environment, presentation by representative of Norway. In: Notes of the Workshop on Aquaculture/Environment Interactions: Impacts on Microbial Ecology. Canadian Aquaculture Society, Halifax, Nova Scotia, Canada. 1998.
53. Parker RB. Probiotics, the other half of the antimicrobial story. Anim Nutr Health. 1974; 29: 4-8.
54. Pollman DS, Danielson DM, Pbo ER. Effects of microbial feed additives on performance of starter and growing-finishing pigs. J Ani Sci. 1980; 51: 557-581.
55. Primavera JH, Lavilla CR, Pitogo JM, Ladija, De La Pena MR. A survey of chemical and biological products used to intensive prawn farms in the Philippines. Mar. Poll. Bull. 1993; 26: 33-40.
56. Tihole F. Possible treatment of AIDS patients with live Lactobacteria Med. Hypothesis. 1988; 26: 85-88.