studies of recent eruptive phenomena at … of recent eruptive phenomena at kĪlauea volcano ......
TRANSCRIPT

STUDIES OF RECENT ERUPTIVE
PHENOMENA AT KĪLAUEA VOLCANO
A DISSERTATION SUBMITTED TO THE GRADUATE DIVISION OF
THE UNIVERSITY OF HAWAI‘I AT MĀNOA IN PARTIAL
FULFILLMENT FOR THE DEGREE REQUIREMENTS OF
DOCTOR OF PHILOSOPHY
IN
GEOLOGY AND GEOPHYSICS
DECEMBER 2015
By
Tim R. Orr
Dissertation Committee:
Bruce Houghton, Chairperson
Sarah Fagents
Scott Rowland
Don Swanson
Steve Businger

ii
Acknowledgments
This work is the culmination of a plan, long set aside, that brought me to Hawaiʻi
more than a decade ago. I extend my sincere gratitude to my advisor, Bruce Houghton,
for helping to finally bring this plan to fruition. Bruce’s support and advice have been
invaluable, and I look forward to continued collaboration. In addition, Alison Houghton
has been a gem, and I am grateful for her hospitality. I am also indebted to my
dissertation committee—Sarah Fagents, Scott Rowland, Don Swanson, and Steve
Businger—for their guidance and support.
This research would not have been possible without my colleagues at the Hawaiian
Volcano Observatory (HVO), in particular Matt Patrick and Kelly Wooten, with whom I
spend many long days in the trenches. I am appreciative to my supervisors, Jim
Kauahikaua and Tina Neal, for permitting me to take time off to pursue my studies.
HVO’s technical staff worked tirelessly to ensure continued operation of the webcam
network from which many of the observations used in this dissertation are acquired.
Thanks, too, to helicopter pilot David Okita, for always bringing me back from the field
safely.
Finally, I am humbled by the unwavering love and support of my family, who were
always there when I came home.
The data presented in this dissertation was collected in the normal course of my
duties as a geologist at the Hawaiian Volcano Observatory, funded through the U.S.
Geological Survey’s Volcano Hazards Program. Additional support was provided by
Bruce Houghton under NSF grant EAR-1427357e.
iii
Abstract
Kīlauea Volcano, on the island of Hawaiʻi, hosts a broad range of basaltic eruptive
styles that have traditionally been studied with relatively sparse observations and data.
Recent advances in digital camera and webcam technology, however, as well as
improvements in the sensitivity and acquisition rate of geophysical data, offer new
opportunities to study these processes. Here, robust visual and continuous camera
observations are integrated with high-rate geophysical data in four studies, to enhance our
understanding of eruptive activity at Kīlauea: (1) A brief eruption on Kīlauea’s East Rift
Zone during 2007 led to a pause in the long-lived Puʻu ʻŌʻō eruption. Activity resumed
with the refilling of the Puʻu ʻŌʻō crater, first by lava, and then by endogenous uplift.
Filling culminated in the opening of a new eruptive fissure at Puʻu ʻŌʻō, marking the start
of a new period of eruptive activity. (2) During 2010, lava flows advanced toward the
Kalapana Gardens subdivision on Hawaiʻi’s southeast coast, eventually destroying three
homes. As the relatively low-discharge flow advanced into this area, it was laterally
confined by low topography. Subsequent inflation was focused over the lava tube that
developed in the flow, forming a long, sinuous tumulus that snaked across the gently
sloping terrain. The unusual feature may be an analog for similar lava flow structures
identified in New Mexico and on Mars. In addition, the sinuous tumulus was the source
of frequent breakouts associated with cycles of deflation and inflation at Kīlauea’s
summit, providing a means of forecasting activity. (3) Kīlauea’s ongoing summit
eruption has been punctuated by small, impulsive explosive eruptions since it began in
2008. High-rate webcam imagery shows convincingly that these explosive events were
triggered by rockfalls from the vent walls that directly impacted the top of the lava
column, generating a rebound splash (Worthington jet). (4) The March 2011 Kamoamoa
eruption, preceded by months of precursory changes, was exceptionally well documented
with an array of geological, geophysical, and geochemical observations. This
multiparametric monitoring suggests that the eruption was driven by an imbalance
between the magma supplied to and erupted from the Puʻu ʻŌʻō vent.
iv
Table of Contents
Acknowledgments .................................................................................................... ii
Abstract ................................................................................................................... iii
List of Tables ......................................................................................................... viii
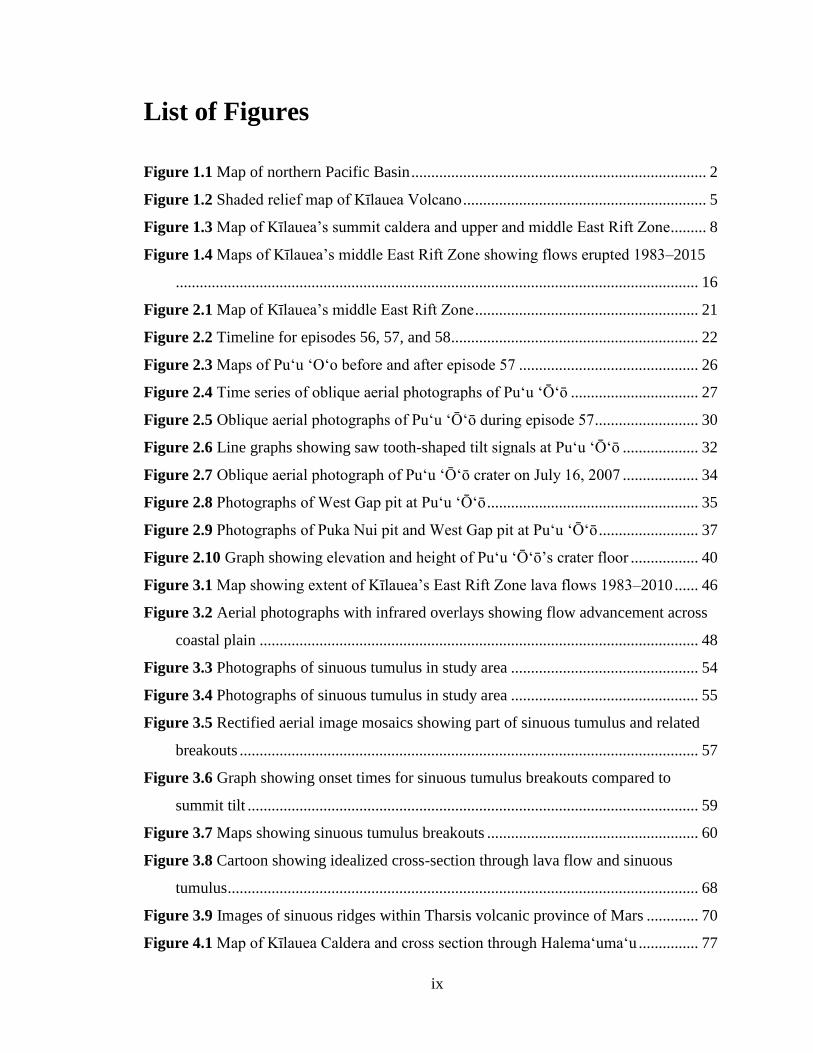
List of Figures ......................................................................................................... ix
Chapter 1 .................................................................................................................. 1
1.1 Dissertation Overview ............................................................................... 1
1.2 Kīlauea magmatic system and structure .................................................... 2
1.3 Early eruptive history ................................................................................ 3
1.4 The Puʻu ʻŌʻō eruption ............................................................................. 7
1.4.1 1983–1986: High fountaining at Pu‘u ‘Ō‘ō ........................................... 7
1.4.2 1986–1992: Continuous effusion from Kupaianaha .............................. 7
1.4.3 1992–1997: Flank vents and shield building at Pu‘u ‘Ō‘ō .................. 11
1.4.4 1997–2007: Resumption of flank vents and shield building ............... 11
1.4.5 2007–2011: Down-rift migration to the episode 58 vent .................... 15
1.4.6 2011–2014 Shifting vents; flows transition to northeast ..................... 17
1.4.7 2014–2015 The Pāhoa lava flow crisis ................................................ 18
Chapter 2 ................................................................................................................ 20
2.1 Introduction ............................................................................................. 20
2.2 Data collection......................................................................................... 22
2.3 Eruption chronology ................................................................................ 25
2.3.1 Setting the stage (early 2007) .............................................................. 25
2.3.2 Crater floor subsidence at Pu‘u ‘Ō‘ō ................................................... 25
2.3.3 Refilling of Pu‘u ‘Ō‘ō.......................................................................... 29
2.3.4 Crater floor uplift ................................................................................. 33
2.3.5 Opening of vents along crater-bounding fault ..................................... 34
2.3.6 Resumption of crater vent effusion ..................................................... 36
2.3.7 Onset of episode 58 ............................................................................. 36
2.4 Results and discussion ............................................................................. 38
v
2.4.1 Crater floor subsidence ........................................................................ 38
2.4.2 Crater infilling and uplift ..................................................................... 39
2.4.3 Onset of episode 58 ............................................................................. 40
2.4.4 Eruption petrology ............................................................................... 41
2.4.5 Trends in intrusive and eruptive activity ............................................. 42
2.5 Conclusions ............................................................................................. 43
Chapter 3 ................................................................................................................ 45
3.1 Introduction ............................................................................................. 45
3.2 Eruption monitoring methods.................................................................. 49
3.2.1 Flow field mapping .............................................................................. 49
3.2.2 Webcams and time-lapse cameras ....................................................... 49
3.3 Tumulus geometry measurements ........................................................... 50
3.3.1 Digital Elevation Models ..................................................................... 50
3.3.2 Crack and tumulus measurements ....................................................... 51
3.4 Description of eruptive activity ............................................................... 51
3.4.1 June–July 2010 eruptive activity ......................................................... 51
3.4.2 Sinuous tumulus formation and morphology ...................................... 53
3.4.3 DI events and breakouts: August–November 2010 ............................. 56
3.5 Discussion ............................................................................................... 63
3.5.1 Development of an inflated lava tube .................................................. 63
3.5.2 Earth and Mars examples .................................................................... 67
3.5.3 Forecasting lava tube breakouts .......................................................... 71
3.6 Summary ................................................................................................. 73
Chapter 4 ................................................................................................................ 75
4.1 Introduction ............................................................................................. 75
4.2 Eruption Overview .................................................................................. 76
4.3 Data Collection ........................................................................................ 78
4.4 Key Observations .................................................................................... 78

vi
4.5 Gas Slugs or Rockfalls? .......................................................................... 80
4.6 Eruption Mechanism ............................................................................... 82
4.7 Conclusions ............................................................................................. 85
Chapter 5 ................................................................................................................ 87
5.1 Introduction ............................................................................................. 87
5.2 The Puʻu ʻŌʻō eruption ........................................................................... 89
5.3 The 5–9 March 2011 Kamoamoa fissure eruption .................................. 94
5.3.1 Eruption Onset ..................................................................................... 97
5.3.2 Fissure eruption ................................................................................... 97
5.4 Results ................................................................................................... 101
5.4.1 Puʻu ʻŌʻō crater subsidence on 5 March ........................................... 101
5.4.2 Summit lava lake draining ................................................................. 103
5.4.3 Kamoamoa fissure eruption rates ...................................................... 105
5.4.4 Petrology ............................................................................................ 109
5.4.5 Gas Geochemistry.............................................................................. 110
5.4.6 Deformation ....................................................................................... 111
5.4.7 Seismicity .......................................................................................... 113
5.5 Discussion ............................................................................................. 117
5.6 Summary and Conclusions .................................................................... 121
Chapter 6 .............................................................................................................. 123
6.1 Overview: Role of imaging technology in geological observations ..... 123
6.2 Research limitations .............................................................................. 124
6.2.1 Chapter 2............................................................................................ 124
6.2.2 Chapter 3............................................................................................ 124
6.2.3 Chapter 4............................................................................................ 125
6.2.4 Chapter 5............................................................................................ 126
6.3 Research ideas for the future ................................................................. 126
6.3.1 Endogenous crater floor uplift ........................................................... 127

vii
6.3.2 Eruption along cone sheets at Puʻu ʻŌʻō ........................................... 127
6.3.3 Characterization of low-intensity Hawaiian fountains ...................... 128
6.3.4 Cross-section through a sinuous tumulus .......................................... 128
6.4 Some wider applications of studies at Kīlauea...................................... 128
viii
List of Tables
Table 1.1 Eruption statistics for episodes 1–61 of Puʻu ʻŌʻō eruption .............................. 9
Table 1.2 Kīlauea East Rift Zone intrusions .................................................................... 13
Table 2.1 Large saw tooth-shaped tilt events ................................................................... 33
Table 2.2 Description and major element composition of episode 57 lava samples. ...... 42
Table 3.1 Sinuous tumulus and axial crack measurements. ............................................. 58
Table 3.2 Timing and area of sinuous tumulus breakouts. ............................................... 62
Table 5.1 Area, DRE volume, duration, time-averaged discharge, and distance to STC
seismometer for Kamoamoa eruptive fissures. ....................................................... 106
ix
List of Figures
Figure 1.1 Map of northern Pacific Basin .......................................................................... 2
Figure 1.2 Shaded relief map of Kīlauea Volcano ............................................................. 5
Figure 1.3 Map of Kīlauea’s summit caldera and upper and middle East Rift Zone......... 8
Figure 1.4 Maps of Kīlauea’s middle East Rift Zone showing flows erupted 1983–2015
................................................................................................................................... 16
Figure 2.1 Map of Kīlauea’s middle East Rift Zone ........................................................ 21
Figure 2.2 Timeline for episodes 56, 57, and 58.............................................................. 22
Figure 2.3 Maps of Pu‘u ‘O‘o before and after episode 57 ............................................. 26
Figure 2.4 Time series of oblique aerial photographs of Puʻu ʻŌʻō ................................ 27
Figure 2.5 Oblique aerial photographs of Pu‘u ‘Ō‘ō during episode 57.......................... 30
Figure 2.6 Line graphs showing saw tooth-shaped tilt signals at Puʻu ʻŌʻō ................... 32
Figure 2.7 Oblique aerial photograph of Pu‘u ‘Ō‘ō crater on July 16, 2007 ................... 34
Figure 2.8 Photographs of West Gap pit at Puʻu ʻŌʻō ..................................................... 35
Figure 2.9 Photographs of Puka Nui pit and West Gap pit at Puʻu ʻŌʻō ......................... 37
Figure 2.10 Graph showing elevation and height of Puʻu ʻŌʻō’s crater floor ................. 40
Figure 3.1 Map showing extent of Kīlauea’s East Rift Zone lava flows 1983–2010 ...... 46
Figure 3.2 Aerial photographs with infrared overlays showing flow advancement across
coastal plain .............................................................................................................. 48
Figure 3.3 Photographs of sinuous tumulus in study area ............................................... 54
Figure 3.4 Photographs of sinuous tumulus in study area ............................................... 55
Figure 3.5 Rectified aerial image mosaics showing part of sinuous tumulus and related
breakouts ................................................................................................................... 57
Figure 3.6 Graph showing onset times for sinuous tumulus breakouts compared to
summit tilt ................................................................................................................. 59
Figure 3.7 Maps showing sinuous tumulus breakouts ..................................................... 60
Figure 3.8 Cartoon showing idealized cross-section through lava flow and sinuous
tumulus ...................................................................................................................... 68
Figure 3.9 Images of sinuous ridges within Tharsis volcanic province of Mars ............. 70
Figure 4.1 Map of Kīlauea Caldera and cross section through Halemaʻumaʻu ............... 77

x
Figure 4.2 Photographs of lava lake in Halemaʻumaʻu, ash plume, and erupted tephra . 80
Figure 4.3 Comparison between video and seismicity for rockfall and explosive eruption
at Kīlauea .................................................................................................................. 81
Figure 4.4 Seismic traces for periods encompassing rockfall sequences during January–
March 2011 ............................................................................................................... 83
Figure 5.1 Map of Kīlauea’s summit and East Rift Zone during 2011 ............................ 88
Figure 5.2 Conceptual model of Kīlauea’s shallow summit and East Rift Zone magmatic
system ....................................................................................................................... 89
Figure 5.3 Map showing Kamoamoa lava flows and eruptive fissures ........................... 90
Figure 5.4 Time series of geological, geophysical, and geochemical data ...................... 91
Figure 5.5 Locations of earthquakes at Kīlauea’s summit and East Rift Zone ................ 93
Figure 5.6 Photographs of Puʻu ʻŌʻō and summit lava lake before Kamoamoa eruption94
Figure 5.7 Seismicity spanning start of intrusion, subsidence of Puʻu ʻŌʻō, and onset of
Kamoamoa eruption. ................................................................................................. 95
Figure 5.8 Lava level, tilt, and RSAM compared to Kamoamoa eruptive activity ......... 96
Figure 5.9 Photographs showing subsidence of Puʻu ʻŌʻō crater floor on March 5, 2011,
collected by time‐lapse camera ................................................................................. 98
Figure 5.10 Photographs showing Kamoamoa eruption on March 5, 2011 .................... 99
Figure 5.11 Infrared camera images of lava lake in Overlook crater ............................ 100
Figure 5.12. Photographs showing Kamoamoa eruption on March 6, 2011 ................. 103
Figure 5.13 Photographs of Kamoamoa eruption during March 8–9, 2011 .................. 104
Figure 5.14 Photographs showing Kamoamoa eruption during March 7–9, 2011 ........ 108
Figure 5.15 Interferogram from PALSAR instrument on ALOS satellite spanning
January 24–March 11, 2011 .................................................................................... 113
Figure 5.16 Photographs showing fractured, tephra‐covered ground between eastern and
western fissure systems ........................................................................................... 115
1
Chapter 1
Introduction
1.1 Dissertation Overview
Volcanism at Kīlauea, on the island of Hawaiʻi, spans a broad range of basaltic
eruptive styles, including effusive lava flows, persistent lava lake activity, sustained
fountaining, and impulsive explosive eruptions. This dissertation examines recent
examples that encompass this range of styles, thus furthering our understanding of
Hawaiʻi’s volcanoes. To provide the volcanological context for these studies, which are
presented in chronological order, I first review, in this chapter, Kīlauea’s eruptive history,
with an emphasis on the ongoing Puʻu ʻŌʻō eruption. This review extends Heliker and
Mattox (2003) by updating the Puʻu ʻŌʻō eruption chronology in a generalized fashion
through August 2015. Eruptive activity is formalized as discrete episodes and sub-
episodes based on eruption location and continuity, as shown in Table 1.1, by
summarizing the episodes discussed in Heliker and Mattox (2003) and defining new
episodes to highlight changes in the ongoing eruption.
Chapter 2 describes the activity between episodes 55 and 58 of the Puʻu ʻŌʻō
eruption during 2007—a brief period characterized by an eruption upslope from Puʻu
ʻŌʻō and subsidence of Puʻu ʻŌʻō’s crater floor, followed by a short hiatus before activity
resumed at Puʻu ʻŌʻō. This general pattern of events is one which has been documented
both before and since at Puʻu ʻŌʻō, and it offers a way to forecast eruptive changes at
Kīlauea.
Chapter 3 focuses on Puʻu ʻŌʻō’s tube-fed pāhoehoe flow field in 2010 and
describes the formation and evolution of a long sinuous, ridge-like tumulus over the
active lava tube. Breakouts from the base of the tumulus coincided with geodetic changes
at Kīlauea’s summit, and could be reasonably forecast on a time scale of about a day. The
sinuous tumulus may also be an analog for similar features in New Mexico and on Mars.
2
Chapter 4 shifts attention to Kīlauea’s ongoing (since 2008) summit eruption in
Halemaʻumaʻu, describing the evolution of the active vent and, specifically, the
triggering of small, impulsive explosive eruptions via wall rock collapses during 2011.
Chapter 5 presents a multidisciplinary overview of the 2011 Kamoamoa eruption
(episode 59) and advances our understanding of the shallow portions of the magmatic
system connecting Kīlauea’s summit and Puʻu ʻŌʻō.
Chapter 6 weaves the dissertation’s conclusions into the broader volcanological
context and suggests possible avenues for further research.
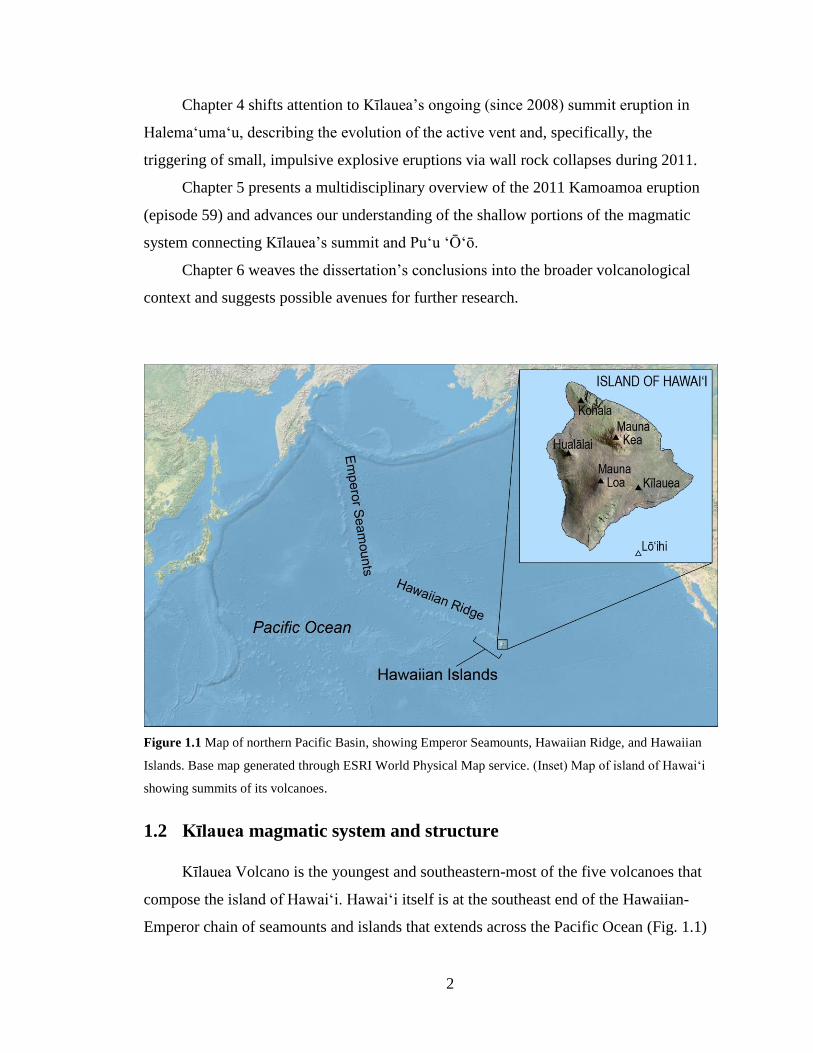
Figure 1.1 Map of northern Pacific Basin, showing Emperor Seamounts, Hawaiian Ridge, and Hawaiian
Islands. Base map generated through ESRI World Physical Map service. (Inset) Map of island of Hawai‘i
showing summits of its volcanoes.
1.2 Kīlauea magmatic system and structure
Kīlauea Volcano is the youngest and southeastern-most of the five volcanoes that
compose the island of Hawaiʻi. Hawaiʻi itself is at the southeast end of the Hawaiian-
Emperor chain of seamounts and islands that extends across the Pacific Ocean (Fig. 1.1)

3
and records some 70 m.y. of volcanic activity (Clague and Dalrymple, 1987). Kīlauea is
built on the southeastern flank of Mauna Loa (Fig. 1.2), and the two volcanoes interact in
a complex and not yet well understood way that modulates their respective eruptive
activity (Miklius and Cervelli, 2003; Trusdell, 2011). South of Kīlauea is Lōʻihi
Seamount, the youngest active volcano in the chain. Eruptive activity at Kīlauea is fed by
basaltic magma thought to rise from a zone of partial melting at depths of 60 to 90 km in
the upper mantle (e.g., Eaton and Murata, 1960; Wright, 1984; Wyllie, 1988; Sen and
Jones, 1990; DePaolo and Stolper, 1996) and then collects within storage reservoirs ~1–5
km beneath Kīlauea’s summit (e.g., Fiske and Kinoshita, 1969; Ryan, 1987; Baker and
Amelung, 2012; Poland et al., 2014; Wright and Klein, 2014). From there, magma can
erupt within Kīlauea’s summit caldera or along either of its two sub-radial rift zones (the
East and Southwest Rift Zones), or rarely in the Koaʻe fault system that connects the two
rift zones (Fig. 1.2). In additional to these major structural features, the south flank of
Kīlauea is also broken by large intersecting faults that form a series of steep, south-facing
scarps in the Hilina fault system (Fig. 1.2).
1.3 Early eruptive history
Most of Kīlauea is surfaced by tube-fed pāhoehoe lava flows erupted since about
1000 CE (Holcomb, 1987). Recent studies show that this effusive period was preceded by
an interval lasting about 1200 yr (ca. 200 BCE to 1000 CE) that was dominated by
explosive activity, which produced the Uwēkahuna Tephra (Fiske et al., 2009). The
effusive activity of the last millennium was interrupted by explosive eruptions between
ca. 1500 and 1800 CE, probably following the formation of the present summit caldera,
which formed the Keanakākoʻi Tephra (Swanson et al., 2012). This repeated alternation
between effusive and explosive activity suggests a cyclicity to Kīlauea’s eruptive
activity—one represented by shield-building and lava overflows during prolonged
periods of relatively high magma supply, and a deep caldera and explosive activity during
prolonged periods of relatively low supply (Swanson et al., 2014). Other layers of ash
interbedded with lava flows exposed in fault scarps on Kīlauea’s south flank (Easton,
1987) could be interpreted to mean that this cyclicity, in some form, extends back at least
50 ka.

4
Kīlauea’s written historical period begins in 1823 (Ellis, 1963), shortly after ca.
three centuries of mostly explosive activity ceased at the summit and shortly after
eruption of the Keaīwa Lava Flow of 1823 from Great Crack on Kīlauea’s Southwest Rift
Zone (Ellis, 1963, pg. 165; Stearns, 1926). The Keaīwa Lava Flow is the youngest of
several relatively young lava flows that may have been erupted shortly after (and perhaps
during) the ca. 1500–1800 CE explosive period (e.g., the Kamoʻoaliʻi Lava Flow;
Stearns, 1926), though the timing of these flows is far from certain. Upon arrival at
Kīlauea’s summit in 1823, Ellis found that the caldera contained a ~120-m-deep central
crater surrounded by a narrow ledge of fresh black lava and surmised that lava had
recently filled the caldera to that level before emptying through fractures (along the
SWRZ) and feeding the Keaīwa Lava Flow (Ellis, 1963, pg. 165). According to Ellis’s
Hawaiian guides, similar eruptions had happened ever since the end of the ca. 1500–1800
CE explosive period (Ellis, 1963, pg. 171).
These observations imply another form of cyclicity—one characterized by repeated
episodes of slow caldera filling and pressurization followed by the abrupt diversion of
magma into the rift zones, as first envisioned by Dana (1887). Taken to the extreme, this
cyclicity could have occurred throughout the ca. 1500–1800 CE explosive period, with
repeated emptying of the summit reservoir dropping the caldera floor below the level of
the water table (now ~615 m below Kīlauea’s summit; Keller et al., 1979; Mastin, 1997),
leading to sequences of explosions, followed by lava partly filling the caldera again to
restart the cycle. This interpretation is supported by the presence of juvenile tephra within
most units of the Keanakākoʻi Tephra (e.g., McPhie et al., 1990; Swanson et al., 2012).
Such a cycle may have occurred during 1790 CE, perhaps with lava erupting low on
Kīlauea’s East Rift Zone (Ellis, 1963) and accompanied by collapse of the summit
caldera, which led to deadly explosions (e.g., Swanson et al., 2015).
From this interpretation, it may be that other relatively young lava flows exposed
along Kīlauea’s East and Southwest Rift Zones, though not definitively dated to this time
period, could be the products of successive fillings and drainage of the summit caldera as
suggested for the Keaīwa Lava Flow. Regardless, this cyclical process continued over the
decades following Ellis’s visit (summarized below from Macdonald (1955) and Wright
and Klein (2014)). After 1823, the caldera slowly refilled again, reaching a level about 15
5
m above that seen by Ellis, before collapsing in concert with an eruption on Byron Ledge
in 1832. The caldera quickly began to refill with lava, and by 1840, the resurrected
caldera floor had overflowed the previous black ledge and defined a broad 30-m-high
dome centered near the present Halemaʻumaʻu site.
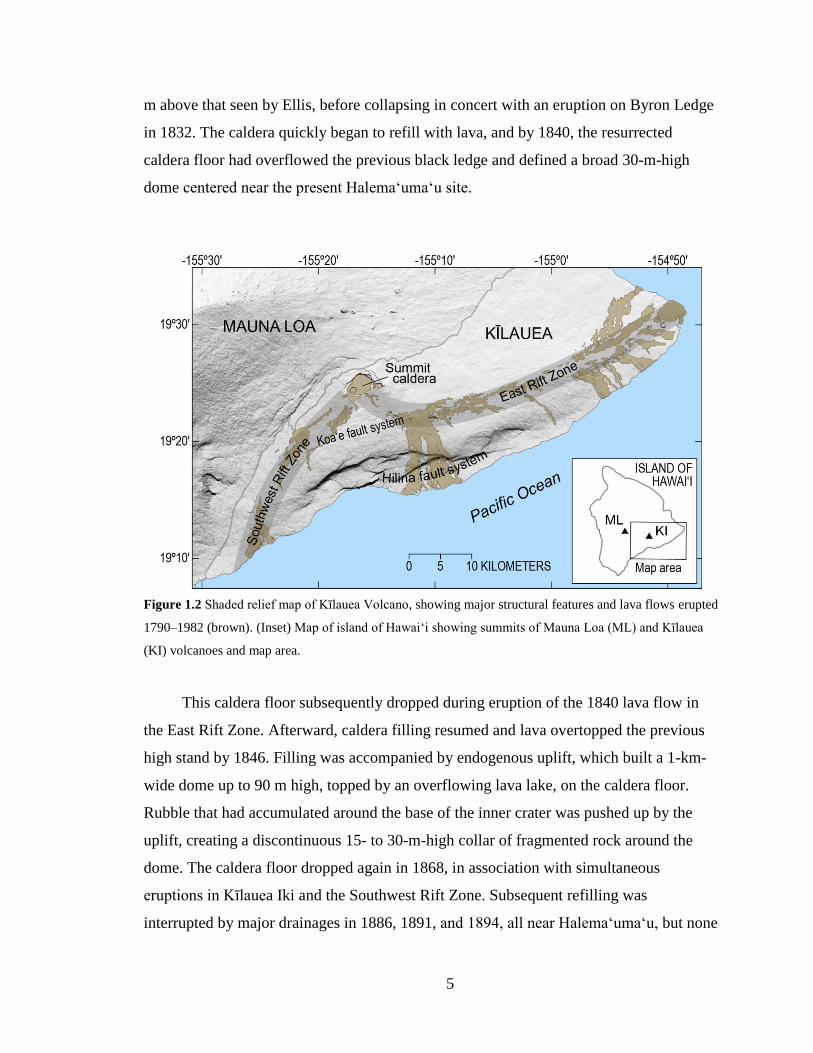
Figure 1.2 Shaded relief map of Kīlauea Volcano, showing major structural features and lava flows erupted
1790–1982 (brown). (Inset) Map of island of Hawai‘i showing summits of Mauna Loa (ML) and Kīlauea
(KI) volcanoes and map area.
This caldera floor subsequently dropped during eruption of the 1840 lava flow in
the East Rift Zone. Afterward, caldera filling resumed and lava overtopped the previous
high stand by 1846. Filling was accompanied by endogenous uplift, which built a 1-km-
wide dome up to 90 m high, topped by an overflowing lava lake, on the caldera floor.
Rubble that had accumulated around the base of the inner crater was pushed up by the
uplift, creating a discontinuous 15- to 30-m-high collar of fragmented rock around the
dome. The caldera floor dropped again in 1868, in association with simultaneous
eruptions in Kīlauea Iki and the Southwest Rift Zone. Subsequent refilling was
interrupted by major drainages in 1886, 1891, and 1894, all near Halemaʻumaʻu, but none
6
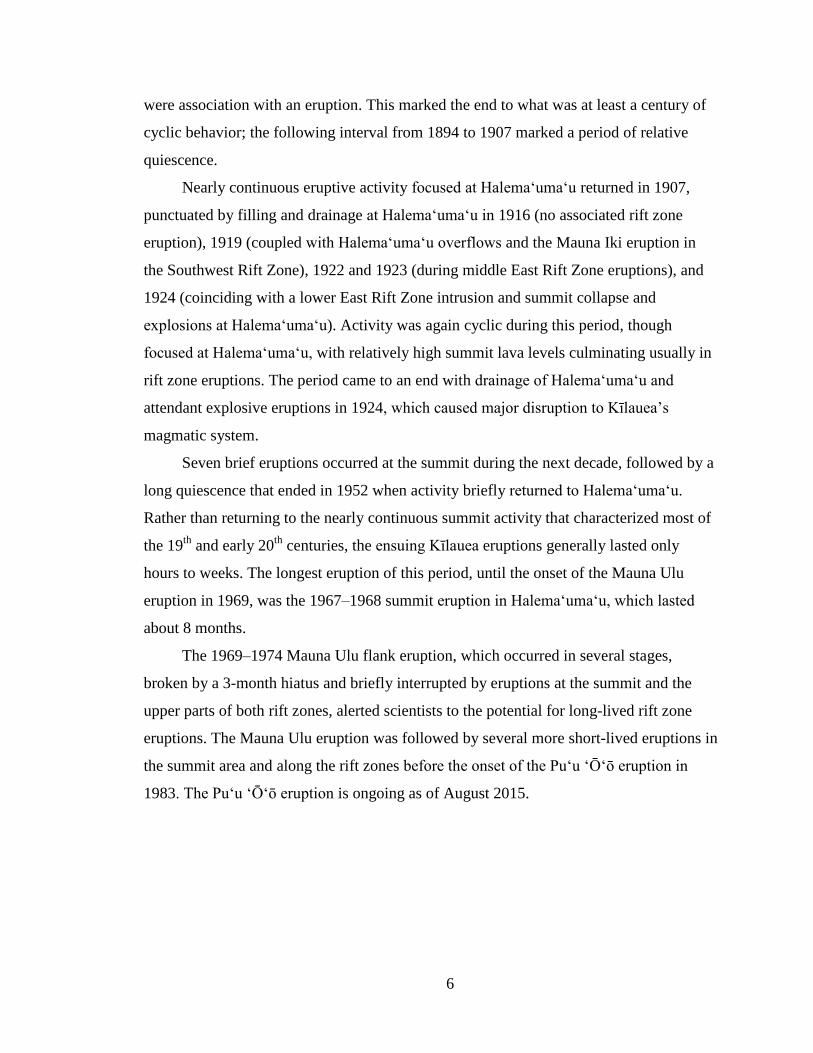
were association with an eruption. This marked the end to what was at least a century of
cyclic behavior; the following interval from 1894 to 1907 marked a period of relative
quiescence.
Nearly continuous eruptive activity focused at Halemaʻumaʻu returned in 1907,
punctuated by filling and drainage at Halemaʻumaʻu in 1916 (no associated rift zone
eruption), 1919 (coupled with Halemaʻumaʻu overflows and the Mauna Iki eruption in
the Southwest Rift Zone), 1922 and 1923 (during middle East Rift Zone eruptions), and
1924 (coinciding with a lower East Rift Zone intrusion and summit collapse and
explosions at Halemaʻumaʻu). Activity was again cyclic during this period, though
focused at Halemaʻumaʻu, with relatively high summit lava levels culminating usually in
rift zone eruptions. The period came to an end with drainage of Halemaʻumaʻu and
attendant explosive eruptions in 1924, which caused major disruption to Kīlauea’s
magmatic system.
Seven brief eruptions occurred at the summit during the next decade, followed by a
long quiescence that ended in 1952 when activity briefly returned to Halemaʻumaʻu.
Rather than returning to the nearly continuous summit activity that characterized most of
the 19th
and early 20th
centuries, the ensuing Kīlauea eruptions generally lasted only
hours to weeks. The longest eruption of this period, until the onset of the Mauna Ulu
eruption in 1969, was the 1967–1968 summit eruption in Halemaʻumaʻu, which lasted
about 8 months.
The 1969–1974 Mauna Ulu flank eruption, which occurred in several stages,
broken by a 3-month hiatus and briefly interrupted by eruptions at the summit and the
upper parts of both rift zones, alerted scientists to the potential for long-lived rift zone
eruptions. The Mauna Ulu eruption was followed by several more short-lived eruptions in
the summit area and along the rift zones before the onset of the Puʻu ʻŌʻō eruption in
1983. The Puʻu ʻŌʻō eruption is ongoing as of August 2015.
7
1.4 The Puʻu ʻŌʻō eruption
1.4.1 1983–1986: High fountaining at Pu‘u ‘Ō‘ō
The Puʻu ʻŌʻō eruption (Fig. 1.3) began on January 3, 1983, following 24 hours of
elevated East Rift Zone seismicity in the area of the eventual eruption site—an 8-km-long
fissure system that first reached the surface about 15 km down-rift of the summit. After
activity initially jumped from one fissure to another (episodes 1–3; Wolfe et al., 1988), it
localized at a single vent, Puʻu ʻŌʻō, in June 1983. Thereafter, a series of moderate to
high lava fountains produced short-lived ʻaʻā flows that buried much of the surrounding
area (episodes 4–47; Fig. 1.4a; Table 1.1; Wolfe et al., 1988; Heliker et al., 2003). Tephra
fallout and lava from this vent built the Pu‘u ‘Ō‘ō cone, which grew to a height of 255 m
above the pre-eruption landscape by 1986 (Wolfe et al., 1988; Heliker et al., 2003).
1.4.2 1986–1992: Continuous effusion from Kupaianaha
In July 1986, the conduit beneath Pu‘u ‘Ō‘ō ruptured and fed fissures for about a
day both up-rift and down-rift of Puʻu ʻŌʻō (Table 1.2). The following day, a new fissure
opened 3 km down-rift of Puʻu ʻŌʻō. Sustained eruption from this fissure eventually
formed the Kupaianaha lava shield (Fig. 1.4b). This shift in the eruption to a down-rift
vent marked a change in eruptive style from episodic Hawaiian fountaining to nearly
continuous effusion (episode 48; Table 1.1). A broad, tube-fed pāhoehoe flow field
developed over the next 5.5 years, extending southeast from the vent into the ocean and
eventually engulfing the community of Kalapana in 1990 (Heliker and Wright, 1991;
Mattox et al., 1993; Hon et al., 1994). During effusion from Kupaianaha, the vent at Pu‘u
‘Ō‘ō widened progressively and formed a crater that often contained a small lava lake
(Heliker et al., 1998, 2003).
Lava effusion from Kupaianaha began to decline in mid-1990 (Kauahikaua et al.,
1996), and activity at Pu‘u ‘Ō‘ō waxed commensurately, presumably as the conduit
between the two vent systems became progressively blocked (Mangan et al., 1995). The
Pu‘u ‘Ō‘ō lava lake rose 65 m during this period and flooded the surrounding crater floor,
and the summit of Kīlauea began to inflate (Kauahikaua et al., 1996). These changes
were accompanied by several small intrusions into Kīlauea’s upper East Rift Zone (Table
8
1.2). In November 1991, the lava lake withdrew and the crater floor fell 75 m as a fissure
opened between Pu‘u ‘Ō‘ō and Kupaianaha and erupted for three weeks (episode 49; Fig.
1.4b; Table 1.2; Mangan et al., 1995; Heliker and Mattox, 2003). Lava reappeared in
Puʻu ʻŌʻō a few days after the fissure eruption and refilled the crater to its previous level
within weeks. The eruptive output from Kupaianaha, which dropped dramatically during
episode 49, continued to fall thereafter and finally ceased altogether on February 7, 1992
(Kauahikaua et al., 1996).
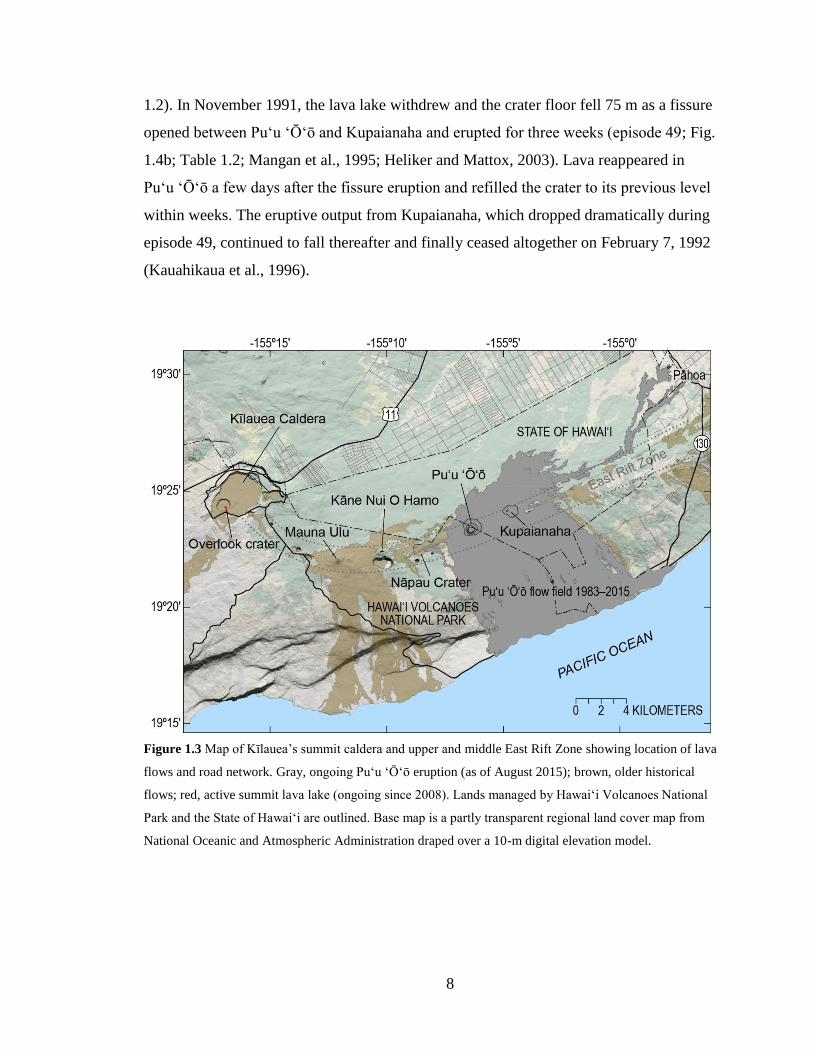
Figure 1.3 Map of Kīlauea’s summit caldera and upper and middle East Rift Zone showing location of lava
flows and road network. Gray, ongoing Puʻu ʻŌʻō eruption (as of August 2015); brown, older historical
flows; red, active summit lava lake (ongoing since 2008). Lands managed by Hawaiʻi Volcanoes National
Park and the State of Hawaiʻi are outlined. Base map is a partly transparent regional land cover map from
National Oceanic and Atmospheric Administration draped over a 10-m digital elevation model.
9
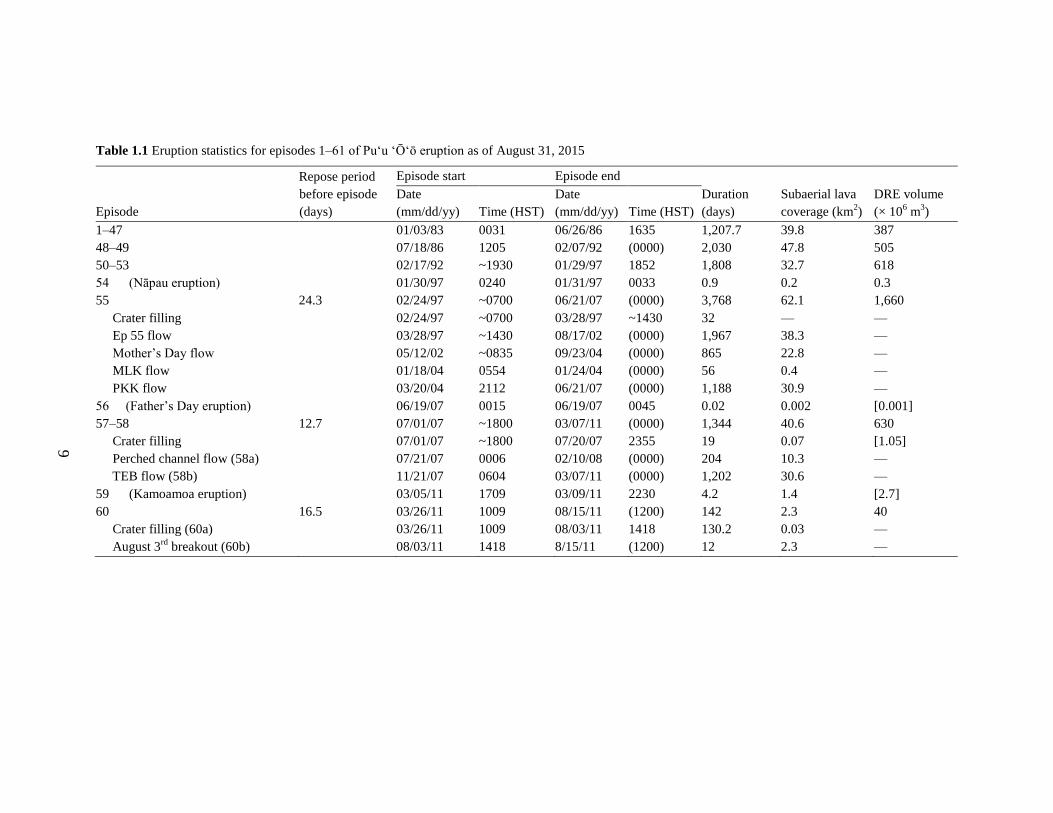
Table 1.1 Eruption statistics for episodes 1–61 of Puʻu ʻŌʻō eruption as of August 31, 2015
Episode
Repose period
before episode
(days)
Episode start Episode end
Duration
(days)
Subaerial lava
coverage (km2)
DRE volume
(× 106 m
3)
Date
(mm/dd/yy) Time (HST)
Date
(mm/dd/yy) Time (HST)
1–47 01/03/83 0031 06/26/86 1635 1,207.7 39.8 387
48–49 07/18/86 1205 02/07/92 (0000) 2,030 47.8 505
50–53 02/17/92 ~1930 01/29/97 1852 1,808 32.7 618
54 (Nāpau eruption) 01/30/97 0240 01/31/97 0033 0.9 0.2 0.3
55 24.3 02/24/97 ~0700 06/21/07 (0000) 3,768 62.1 1,660
Crater filling 02/24/97 ~0700 03/28/97 ~1430 32 — —
Ep 55 flow 03/28/97 ~1430 08/17/02 (0000) 1,967 38.3 —
Mother’s Day flow 05/12/02 ~0835 09/23/04 (0000) 865 22.8 —
MLK flow 01/18/04 0554 01/24/04 (0000) 56 0.4 —
PKK flow 03/20/04 2112 06/21/07 (0000) 1,188 30.9 —
56 (Father’s Day eruption) 06/19/07 0015 06/19/07 0045 0.02 0.002 [0.001]
57–58 12.7 07/01/07 ~1800 03/07/11 (0000) 1,344 40.6 630
Crater filling 07/01/07 ~1800 07/20/07 2355 19 0.07 [1.05]
Perched channel flow (58a) 07/21/07 0006 02/10/08 (0000) 204 10.3 —
TEB flow (58b) 11/21/07 0604 03/07/11 (0000) 1,202 30.6 —
59 (Kamoamoa eruption) 03/05/11 1709 03/09/11 2230 4.2 1.4 [2.7]
60 16.5 03/26/11 1009 08/15/11 (1200) 142 2.3 40
Crater filling (60a) 03/26/11 1009 08/03/11 1418 130.2 0.03 —
August 3rd
breakout (60b) 08/03/11 1418 8/15/11 (1200) 12 2.3 —
10
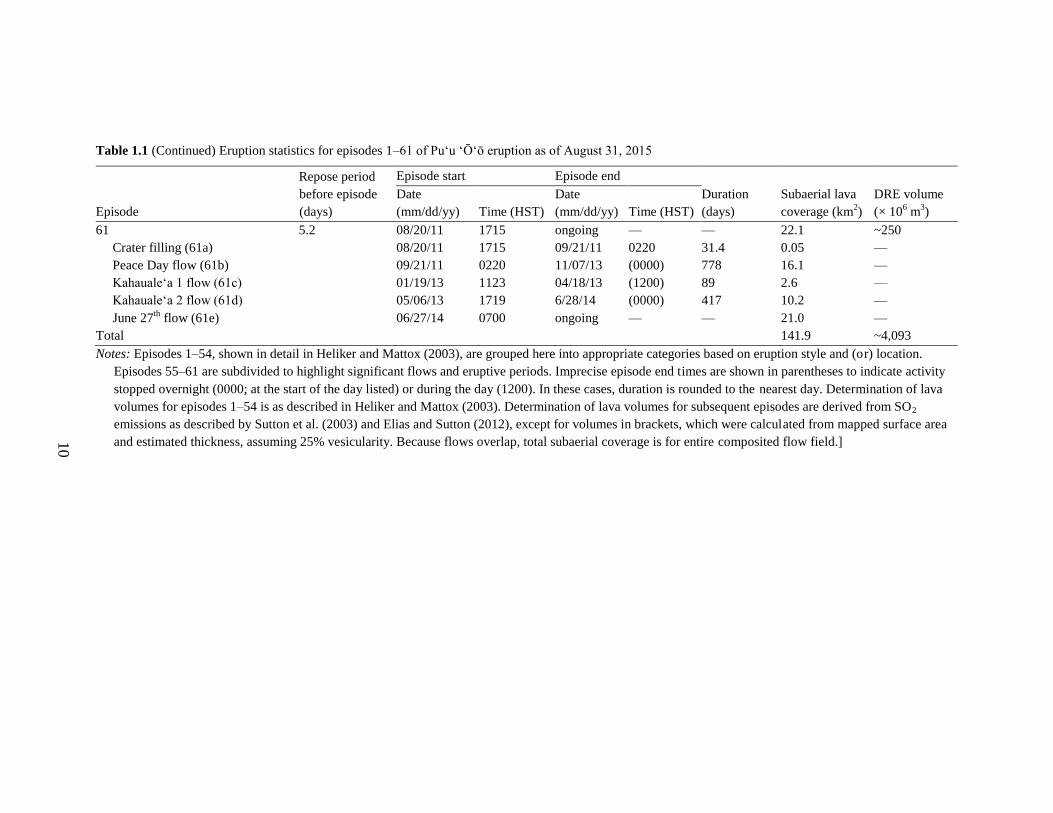
Table 1.1 (Continued) Eruption statistics for episodes 1–61 of Puʻu ʻŌʻō eruption as of August 31, 2015
Episode
Repose period
before episode
(days)
Episode start Episode end
Duration
(days)
Subaerial lava
coverage (km2)
DRE volume
(× 106 m
3)
Date
(mm/dd/yy) Time (HST)
Date
(mm/dd/yy) Time (HST)
61 5.2 08/20/11 1715 ongoing — — 22.1 ~250
Crater filling (61a) 08/20/11 1715 09/21/11 0220 31.4 0.05 —
Peace Day flow (61b) 09/21/11 0220 11/07/13 (0000) 778 16.1 —
Kahaualeʻa 1 flow (61c) 01/19/13 1123 04/18/13 (1200) 89 2.6 —
Kahaualeʻa 2 flow (61d) 05/06/13 1719 6/28/14 (0000) 417 10.2 —
June 27th
flow (61e) 06/27/14 0700 ongoing — — 21.0 —
Total 141.9 ~4,093
Notes: Episodes 1–54, shown in detail in Heliker and Mattox (2003), are grouped here into appropriate categories based on eruption style and (or) location.
Episodes 55–61 are subdivided to highlight significant flows and eruptive periods. Imprecise episode end times are shown in parentheses to indicate activity
stopped overnight (0000; at the start of the day listed) or during the day (1200). In these cases, duration is rounded to the nearest day. Determination of lava
volumes for episodes 1–54 is as described in Heliker and Mattox (2003). Determination of lava volumes for subsequent episodes are derived from SO2
emissions as described by Sutton et al. (2003) and Elias and Sutton (2012), except for volumes in brackets, which were calculated from mapped surface area
and estimated thickness, assuming 25% vesicularity. Because flows overlap, total subaerial coverage is for entire composited flow field.]
11
1.4.3 1992–1997: Flank vents and shield building at Pu‘u ‘Ō‘ō
New eruptive vents formed on the west flank of the Pu‘u ‘Ō‘ō cone ten days after
Kupaianaha stopped erupting. This new period in the eruption, comprising episodes 50–
53 (Fig. 1.4c; Table 1.1), saw the progressive burial of the west and south flanks of Pu‘u
‘Ō‘ō beneath a lava shield and the nearly continuous eruption of lava to widen the
existing tube-fed pāhoehoe flow field south of the rift zone (Heliker et al., 1998; Heliker
and Mattox, 2003). The lava level within Puʻu ʻŌʻō varied widely over this time period,
with subsidence and drainage events accompanying intrusive activity along the upper
East Rift Zone (Table 1.2; Clague and Heliker, 1993; Okubo et al., 1996; Heliker et al.,
1998, 2003).
Episode 53 ended on January 29, 1997, with an intrusion up-rift of Puʻu ʻŌʻō in,
and adjacent to, Nāpau Crater (Table 1.2; Owen et al., 2000; Thornber et al., 2003;
Heliker and Mattox, 2003). In response, the floor of Pu‘u ‘Ō‘ō crater, originally 60 m
below the northeast rim, dropped 150 m, and part of the western wall of the Puʻu ʻŌʻō
cone collapsed. The intrusion culminated in a brief eruption, episode 54 (Fig. 1.4c; Table
1.1), which lasted for less than a day and was followed by a 24-day hiatus in eruptive
activity (Heliker and Mattox, 2003).
1.4.4 1997–2007: Resumption of flank vents and shield building
Lava reappeared within Puʻu ʻŌʻō crater in late February 1997, marking the onset
of episode 55 (Fig. 1.4d; Table 1.1), and rose to within 50 m of the crater’s northeast rim
before new vents opened and began to erupt on the west and south flanks during March–
July (Heliker et al., 2003). The lava level in Puʻu ʻŌʻō fluctuated dramatically during this
period but by June had risen high enough to flow over the crater rim for the first time
since high fountaining ended in 1986 (Heliker and Mattox, 2003). Intermittent overflows
continued until early 1998, even though a single dominant vent on the south side of the
Puʻu ʻŌʻō cone was sending tube-fed flows southeast to the ocean by July 1997. The
episode 55 lava tube was active until September 12, 1999, when an intrusion into
Kīlauea’s upper East Rift Zone triggered subsidence and drainage at Puʻu ʻŌʻō (Table

12
1.2; Cervelli et al., 2002). The crater floor dropped 65 m, stabilizing 120 m below the
crater’s northeast rim.
Lava reappeared at the bottom of Puʻu ʻŌʻō a few days after the intrusion and
began to fill the crater. When the lava had reached within 65 m of the crater’s northeast
rim, 11 days after the September 12 intrusion, it began to erupt from a vent outside the
crater, and the upper few kilometers of the episode 55 lava tube system were reoccupied.
A string of rootless shields formed above breakout points along this tube section during
its reoccupation and continued to grow during the months that followed, eventually
merging to form a broad, ~2-km-long ridge that marked the trace of the tube. The crater
at Puʻu ʻŌʻō filled to within 40 m of the northeast rim over the same period, and a new
tube system developed, extending downslope from the rootless shields to the coastline
southeast of Puʻu ʻŌʻō. Another intrusion occurred in the upper East Rift Zone in
February 2000, resulting in an hours-long pause in eruptive activity, but Puʻu ʻŌʻō was
not obviously affected otherwise.
The lava tube system began to deteriorate in December 2001, and rootless shields
started growing over a branch of the tube (which by then had captured all discharge) in
the same general area as, but just east of, the rootless shields that formed in 1999. The
new rootless shields grew through April 2002, coalescing to form a 2.7-km-long ridge
above the tube. At the same time, lava flows in Puʻu ʻŌʻō filled the crater to within 12 m
of its northeast rim between January and April 2002. On May 12, 2002, the southwest
flank of Puʻu ʻŌʻō ruptured, and lava poured out to form the Mother’s Day flow (Table
1.1). By August, the new flow had captured the entire eruptive output from Puʻu ʻŌʻō and
was transporting lava southeast to the ocean. The episode 55 vent established in 1997,
and waning for months, was finally abandoned in August 2002.
In late 2003, after more than a year of relative stability, the lower reaches of the
Mother’s Day tube system began to atrophy during an increase in magma supply to the
volcano (Poland et al., 2012) and, as in late 2001–early 2002, rootless shields began to
grow along the active part of the lava tube closer to Puʻu ʻŌʻō. Eruptive activity at Puʻu
ʻŌʻō also began to increase, and the crater filled until lava overtopped both the east and
west crater rims. On January 18, 2004, a new vent opened on Puʻu ʻŌʻō’s south flank,
13
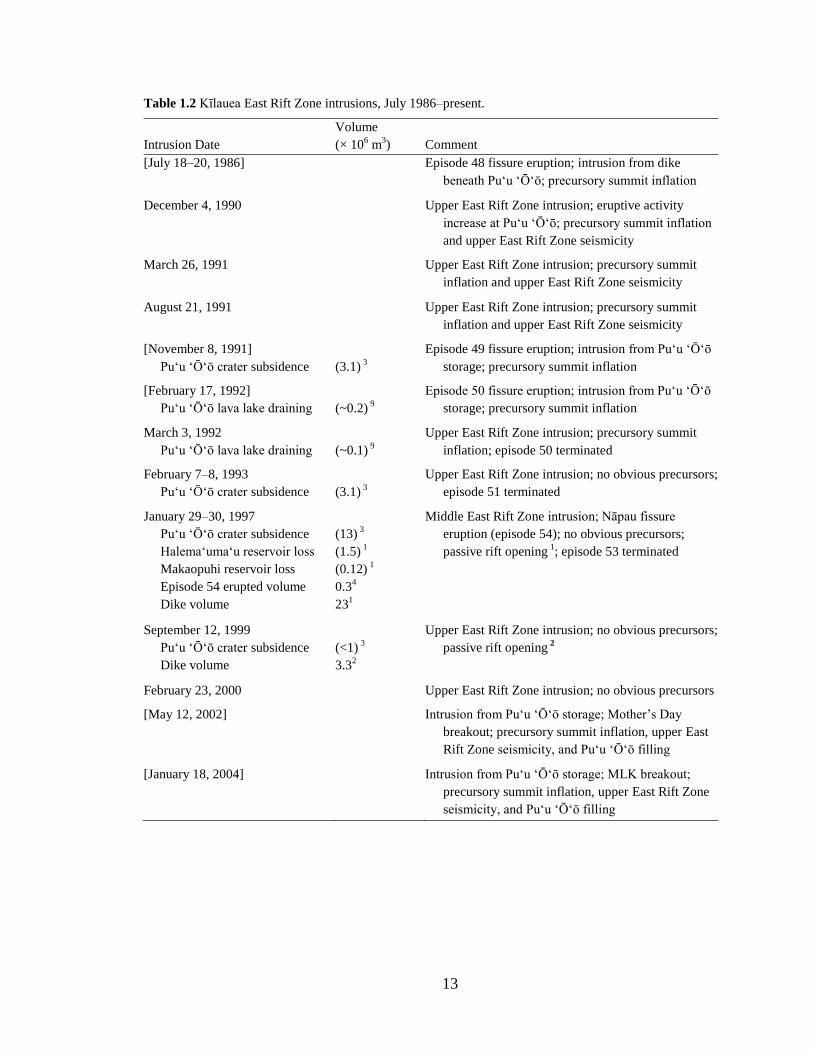
Table 1.2 Kīlauea East Rift Zone intrusions, July 1986–present.
Intrusion Date
Volume
(× 106 m
3) Comment
[July 18–20, 1986]
Episode 48 fissure eruption; intrusion from dike
beneath Puʻu ʻŌʻō; precursory summit inflation
December 4, 1990
Upper East Rift Zone intrusion; eruptive activity
increase at Puʻu ʻŌʻō; precursory summit inflation
and upper East Rift Zone seismicity
March 26, 1991
Upper East Rift Zone intrusion; precursory summit
inflation and upper East Rift Zone seismicity
August 21, 1991
Upper East Rift Zone intrusion; precursory summit
inflation and upper East Rift Zone seismicity
[November 8, 1991] Episode 49 fissure eruption; intrusion from Puʻu ʻŌʻō
storage; precursory summit inflation Puʻu ʻŌʻō crater subsidence (3.1) 3
[February 17, 1992] Episode 50 fissure eruption; intrusion from Puʻu ʻŌʻō
storage; precursory summit inflation Puʻu ʻŌʻō lava lake draining (~0.2) 9
March 3, 1992 Upper East Rift Zone intrusion; precursory summit
inflation; episode 50 terminated Puʻu ʻŌʻō lava lake draining (~0.1) 9
February 7–8, 1993 Upper East Rift Zone intrusion; no obvious precursors;
episode 51 terminated Puʻu ʻŌʻō crater subsidence (3.1) 3
January 29–30, 1997 Middle East Rift Zone intrusion; Nāpau fissure
eruption (episode 54); no obvious precursors;
passive rift opening 1; episode 53 terminated
Puʻu ʻŌʻō crater subsidence (13) 3
Halemaʻumaʻu reservoir loss (1.5) 1
Makaopuhi reservoir loss (0.12) 1
Episode 54 erupted volume 0.34
Dike volume 231
September 12, 1999 Upper East Rift Zone intrusion; no obvious precursors;
passive rift opening 2
Puʻu ʻŌʻō crater subsidence (<1) 3
Dike volume 3.32
February 23, 2000 Upper East Rift Zone intrusion; no obvious precursors
[May 12, 2002] Intrusion from Puʻu ʻŌʻō storage; Mother’s Day
breakout; precursory summit inflation, upper East
Rift Zone seismicity, and Puʻu ʻŌʻō filling
[January 18, 2004] Intrusion from Puʻu ʻŌʻō storage; MLK breakout;
precursory summit inflation, upper East Rift Zone
seismicity, and Puʻu ʻŌʻō filling
14
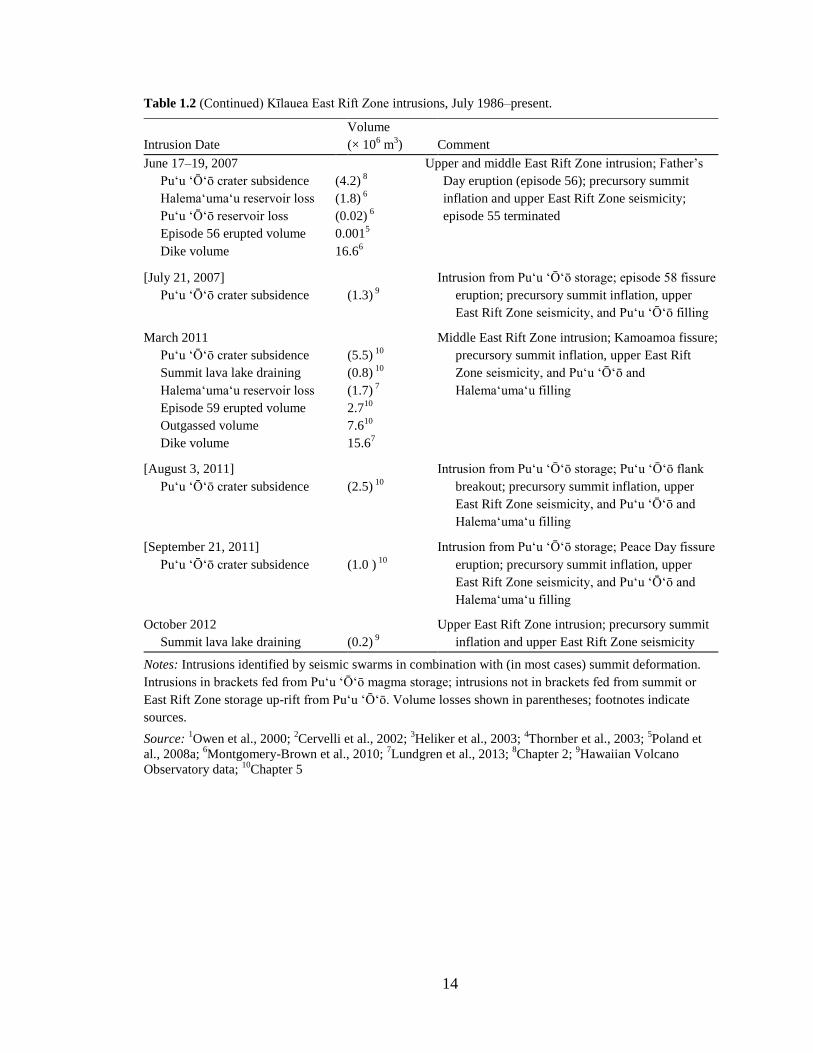
Table 1.2 (Continued) Kīlauea East Rift Zone intrusions, July 1986–present.
Intrusion Date
Volume
(× 106 m
3) Comment
June 17–19, 2007 Upper and middle East Rift Zone intrusion; Father’s
Day eruption (episode 56); precursory summit
inflation and upper East Rift Zone seismicity;
episode 55 terminated
Puʻu ʻŌʻō crater subsidence (4.2) 8
Halemaʻumaʻu reservoir loss (1.8) 6
Puʻu ʻŌʻō reservoir loss (0.02) 6
Episode 56 erupted volume 0.0015
Dike volume 16.66
[July 21, 2007] Intrusion from Puʻu ʻŌʻō storage; episode 58 fissure
eruption; precursory summit inflation, upper
East Rift Zone seismicity, and Puʻu ʻŌʻō filling
Puʻu ʻŌʻō crater subsidence (1.3) 9
March 2011 Middle East Rift Zone intrusion; Kamoamoa fissure;
precursory summit inflation, upper East Rift
Zone seismicity, and Puʻu ʻŌʻō and
Halemaʻumaʻu filling
Puʻu ʻŌʻō crater subsidence (5.5) 10
Summit lava lake draining (0.8) 10
Halemaʻumaʻu reservoir loss (1.7) 7
Episode 59 erupted volume 2.710
Outgassed volume 7.610
Dike volume 15.67
[August 3, 2011] Intrusion from Puʻu ʻŌʻō storage; Puʻu ʻŌʻō flank
breakout; precursory summit inflation, upper
East Rift Zone seismicity, and Puʻu ʻŌʻō and
Halemaʻumaʻu filling
Puʻu ʻŌʻō crater subsidence (2.5) 10
[September 21, 2011] Intrusion from Puʻu ʻŌʻō storage; Peace Day fissure
eruption; precursory summit inflation, upper
East Rift Zone seismicity, and Puʻu ʻŌʻō and
Halemaʻumaʻu filling
Puʻu ʻŌʻō crater subsidence (1.0 ) 10
October 2012 Upper East Rift Zone intrusion; precursory summit
inflation and upper East Rift Zone seismicity Summit lava lake draining (0.2) 9
Notes: Intrusions identified by seismic swarms in combination with (in most cases) summit deformation.
Intrusions in brackets fed from Puʻu ʻŌʻō magma storage; intrusions not in brackets fed from summit or
East Rift Zone storage up-rift from Puʻu ʻŌʻō. Volume losses shown in parentheses; footnotes indicate
sources.
Source: 1Owen et al., 2000;
2Cervelli et al., 2002;
3Heliker et al., 2003;
4Thornber et al., 2003;
5Poland et
al., 2008a; 6Montgomery-Brown et al., 2010;
7Lundgren et al., 2013;
8Chapter 2;
9Hawaiian Volcano
Observatory data; 10
Chapter 5

15
marking the onset of the short-lived Martin Luther King (MLK) flow (Table 1.1).
Eruptive activity in Puʻu ʻŌʻō crater stopped at the same time, and the crater floor sagged
by about 5 m.
The cessation of activity within Puʻu ʻŌʻō did not last, however, and lava was
again erupting on the crater floor by early February 2004. This was followed by a brief
resurgence of activity from the MLK vent in mid-February. In March, the Prince Kūhiō
Kalaniana‘ole (PKK) flow (Table 1.1) broke out from the lower south flank of Puʻu ʻŌʻō,
finally relieving the pressure beneath the cone and marking the end of rootless shield
growth along the Mother’s Day tube system, which remained active until September
2004, when the Mother’s Day vent finally died. This activity was supplanted by the PKK
flow, which increased in vigor as the Mother’s Day flow waned. The PKK flow reached
the ocean southeast of Puʻu ʻŌʻō in November 2004, setting up a tube system which
remained relatively stable for the next 2.5 years—until June 2007.
1.4.5 2007–2011: Down-rift migration to the episode 58 vent
An intrusion into Kīlauea’s East Rift Zone near Mauna Ulu during June 17–19,
2007 (Table 1.2), resulted in the subsidence of Pu‘u ‘Ō‘ō’s crater floor, which dropped
about 80 m, and culminated in a brief eruption on the northeast flank of Kāne Nui o
Hamo lava shield (Father’s Day eruption—episode 56; Fig. 1.4d; Table 1.1; Poland et al.,
2008a; Fee et al., 2011). A 12-day hiatus in activity followed, ending with the return of
lava to Pu‘u ‘Ō‘ō on July 1 (episode 57; Table 1.1; see Chapter 2). The subsequent
refilling of Pu‘u ‘Ō‘ō crater was accompanied by several meters of endogenous uplift of
the crater floor—evidence of pressure building beneath the cone. This pressure was
relieved with the opening of fissures between Pu‘u ‘Ō‘ō and Kupaianaha on July 21,
2007 (episode 58; Fig. 1.4e; Tables 1.1 and 1.2; Poland et al., 2008a). Activity quickly
localized at the eastern end of the fissure system—the main episode 58 vent—and built a
lava shield and a ~2-km-long “perched” lava channel, up to ~50 m above the preexisting
surface (Patrick et al., 2011a). The channel facilitated flow advancement toward the
northeast, sparking lava-inundation concerns in populated areas downslope along the East
Rift Zone (Kauahikaua, 2007).
16
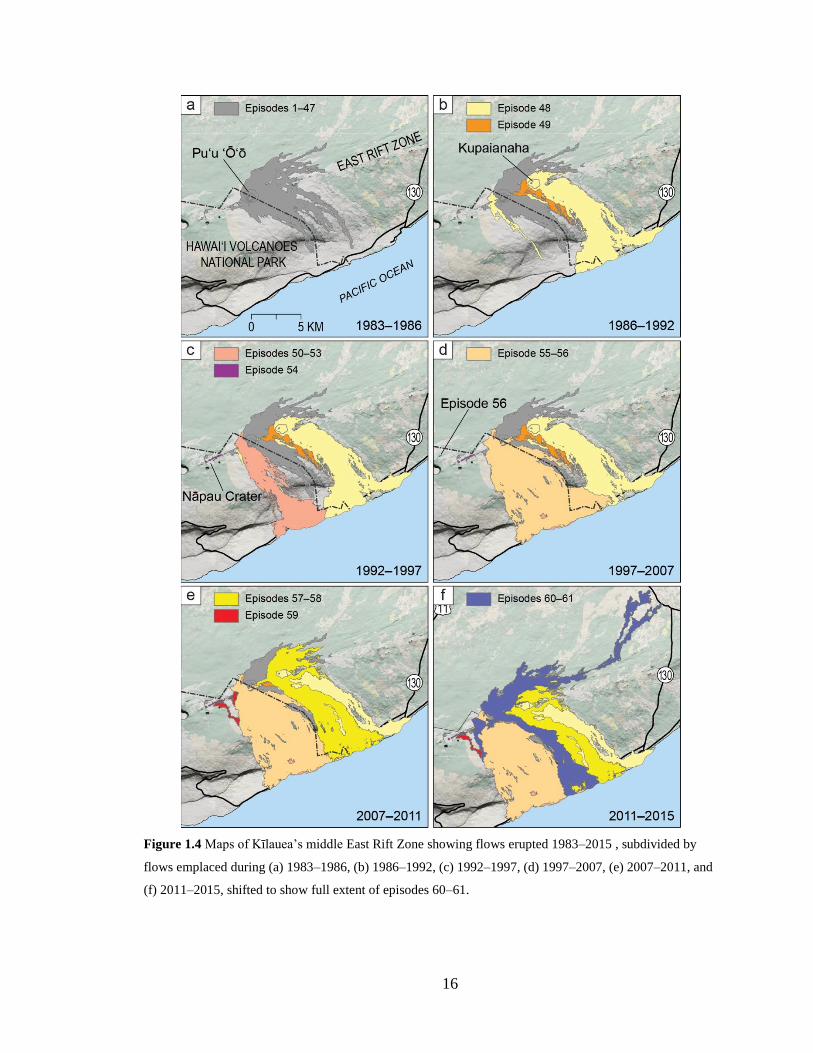
Figure 1.4 Maps of Kīlauea’s middle East Rift Zone showing flows erupted 1983–2015 , subdivided by
flows emplaced during (a) 1983–1986, (b) 1986–1992, (c) 1992–1997, (d) 1997–2007, (e) 2007–2011, and
(f) 2011–2015, shifted to show full extent of episodes 60–61.
17
In November 2007, the southern flank of the shield ruptured over the episode 58
vent, and flows northeast of the vent stagnated as lava was diverted southeastward. At
first, a series of rootless shields grew over the developing lava tube (Patrick and Orr,
2012), but this growth stopped after the flow reached the ocean near Kalapana in March
2008. Thereafter, the lava tube system transported lava to the ocean until early 2011 (see
Chapter 3). It was during this period, in March 2008, that an eruptive vent (the Overlook
vent) opened in Halemaʻumaʻu Crater, at Kīlauea’s summit (Fig. 1.3; Wilson et al., 2008;
Patrick et al., 2013; see Chapter 4). This marked the start of the first recorded instance of
simultaneous, extended summit and rift eruptions at Kīlauea.
1.4.6 2011–2014 Shifting vents; flows transition to northeast
Puʻu ʻŌʻō’s crater began filling with lava in mid-2010, mirrored by a rising summit
lava lake at the Overlook vent, as well as by inflation and an increase in upper East Rift
Zone seismicity. These increases culminated in a 4-day-long eruption between Puʻu ʻŌʻō
and Nāpau Crater starting March 5, 2011 (Kamoamoa eruption—episode 59; Fig. 1.4e;
Table 1.1; see Chapter 5). Puʻu ʻŌʻō’s crater floor dropped 113 m and the lava lake in
Halemaʻumaʻu dropped 143 m during the first day, and the eruption was followed by a
16-day hiatus in East Rift Zone eruptive activity.
Lava reappeared in Puʻu ʻŌʻō in late March 2011, and overflows from a slowly
rising lava lake began to fill the crater. The summit lava lake likewise began to rise.
Starting at the beginning of July 2011, the crater floor at Puʻu ʻŌʻō began lift
endogenously, forming a dome topped by a circulating lava lake. Lava, erupting from the
circumferential fault bounding the uplifting crater floor, flowed out of the crater and
mantled the southwest flank of the cone. Uplift ended on August 3, 2011, when a fissure
opened low on the west flank of Puʻu ʻŌʻō and erupted for the next 12 days (episode 60;
Fig. 1.3f; Tables 1.1 and 1.2). Puʻu ʻŌʻō’s crater floor dropped about 80 m, and the
summit lava lake fell about 75 m.
After another short hiatus, lava began to fill Puʻu ʻŌʻō on August 20, 2011,
marking the start of episode 61 (Fig. 1.4f), and it was overflowing the crater onto both the
east and west flanks of Puʻu ʻŌʻō by mid-September. Overflows ended with the opening
of a fissure high on the eastern flank of Puʻu ʻŌʻō on September 21, 2011 (Peace Day
18
flow—episode 61b; Tables 1.1 and 1.2). In response, the eastern part of the crater floor
dropped about 20 m, and the summit lava lake fell slightly. The Peace Day flow
advanced southeastward and reached the coast in December, where an ocean entry was
sporadically active through the end of the year.
At the beginning of 2012, activity shifted upslope, and lava did not reach the ocean
again until November, nearly a year later. At about the same time, lava began to erupt
sporadically at Puʻu ʻŌʻō, filling the shallow crater formed in 2011. In mid-January 2013,
lava overtopped the northeast rim of Puʻu ʻŌʻō and began to flow northeastward
(Kahaualeʻa 1 flow—episode 61c; Table 1.1). The Kahaualeʻa 1 flow stopped in mid-
April, but a second flow overtopped the northeast rim of Puʻu ʻŌʻō in early May and sent
flows back into the same area (Kahaualeʻa 2 flow—episode 61d; Table 1.1). The Peace
Day flow, also active throughout this period, entered the ocean until August 2013, when
its activity shifted upslope once again, probably as its discharge waned. The Peace Day
flow finally died in mid-November 2013. The Kahaualeʻa 2 flow was the only active lava
flow for several months thereafter, slowly advancing about 9 km northeastward.
1.4.7 2014–2015 The Pāhoa lava flow crisis
Eruptive activity from vents at Puʻu ʻŌʻō began to increase in early 2014, feeding
several short-lived flows onto the flanks of Puʻu ʻŌʻō. Then, on June 27, 2014, a series of
fissures erupted lava on the northeast flank of Puʻu ʻŌʻō (June 27th
flow—episode 61e;
Table 1.1), ending the Kahaualeʻa 2 flow. After building a perched lava pond on the
northeast flank of the Puʻu ʻŌʻō cone, the June 27th
flow began to advance rapidly
northeastward in early July. In mid-August, the flow intersected and entered a deep
ground crack in the rift zone about 11 km from the vent. Lava, out of sight, continued to
advance within the ground crack, pushing the crack open further as it was filled, and
eventually emerged 1 km downslope several days later. The flow entered and exited three
more cracks as it advanced to the northeast.
In early September, the flow veered northward, bypassing the Kaohe Homesteads
subdivision, and then turned back northeastward and began to move directly toward the
town of Pāhoa. The flow eventually reached the outskirts of the town, destroying one
house and partly burying a cemetery and the community’s rubbish transfer station in late

19
October and early November. The flow stalled just 155 m from the main street through
Pāhoa.
A new branch of the flow, starting from the area of the ground cracks, began
moving downslope in mid-November. This branch followed a slightly more northerly
path and soon began to threaten the main shopping complex in Pāhoa and State Highway
130, the main transportation route serving the eastern tip of the island. Lava reached
within about 500 m of the marketplace and highway before stalling in early March 2015.
Lava flows remained active northeast of Puʻu ʻŌʻō thereafter, through late 2015, but were
restricted to within about 9 km of the vent.

20
Chapter 2
The June–July 2007 subsidence and refilling of Puʻu
ʻŌʻō crater, Kīlauea Volcano, Hawai‘i
Published as:
Orr, T., 2014, The June-July 2007 collapse and refilling of Puʻu ʻŌʻō Crater, Kīlauea
Volcano, Hawaiʻi. U.S. Geological Survey Scientific Investigations Report 2014–
5124, 15 p.
2.1 Introduction
As outlined in Chapter 1, Kīlauea Volcano’s long-lived Puʻu ʻŌʻō eruption
changed dramatically in mid-2007. An up-rift intrusion and eruption on June 17–19, 2007
(episode 56; Fig. 2.1) disrupted 10 years of nearly continuous lava effusion from vents on
the southwest flank of Puʻu ʻŌʻō cone. In response, the floor of Puʻu ʻŌʻō crater dropped
dramatically over a period of 3 days, and the eruption paused for 12 days.
Eruptive activity returned to Puʻu ʻŌʻō late on July 1 (episode 57), and lava,
erupting from two vents on the crater floor, was sighted on July 2. A lava lake developed
on the floor of Puʻu ʻŌʻō crater over the next several days as the crater began to refill. By
July 8, the crater floor had begun to lift in a somewhat piston-like fashion and,
eventually, uplift superseded refilling. As uplift progressed and refilling waned, new
vents opened along the circumferential fractures bounding Puʻu ʻŌʻō crater. Lava from
these vents began to fill the West Gap and Puka Nui pits—collapse pits on the west flank
of Puʻu ʻŌʻō cone positioned at a higher elevation than the crater floor. Just before
midnight on July 20, vent activity at Puʻu ʻŌʻō ceased, and the floor of the crater began
to subside rapidly. Minutes later—shortly after midnight—a new fissure eruption began
on the east flank of Puʻu ʻŌʻō. This marked the onset of episode 58, a new phase in the
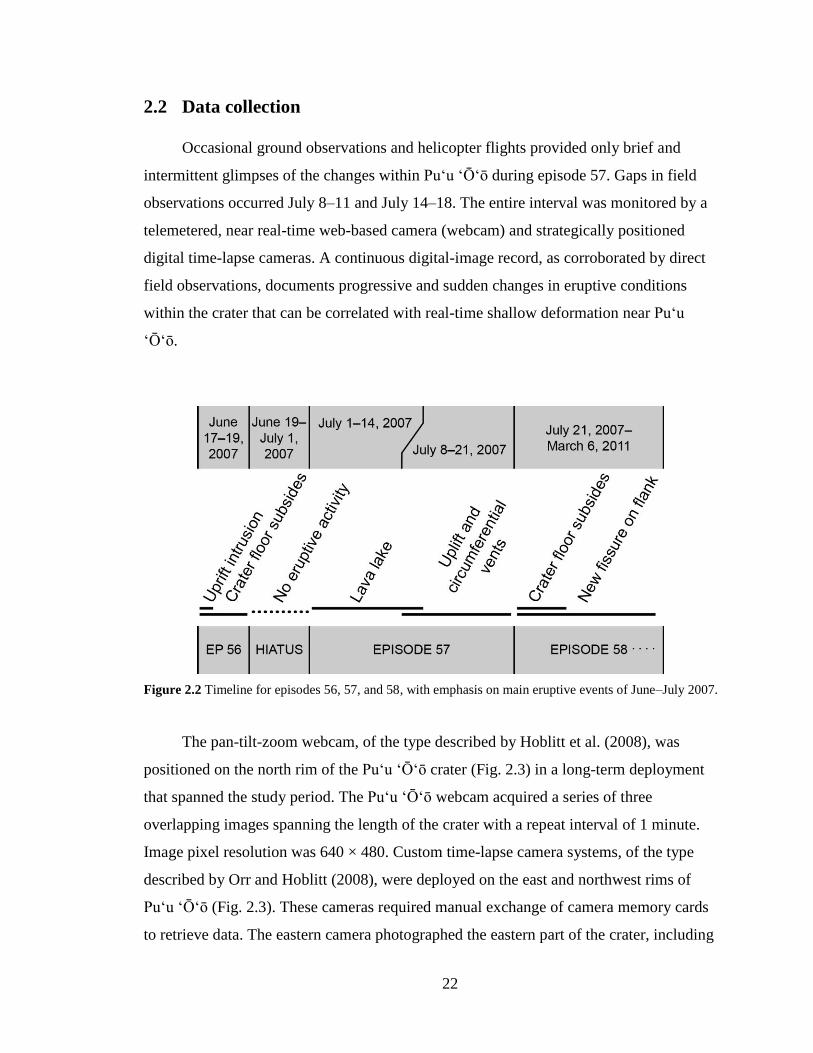
Puʻu ʻŌʻō eruption that continued until March 2011. Figure 2.2 shows a timeline that
highlights the main eruptive events that occurred during the June to July 2007 interval.
21
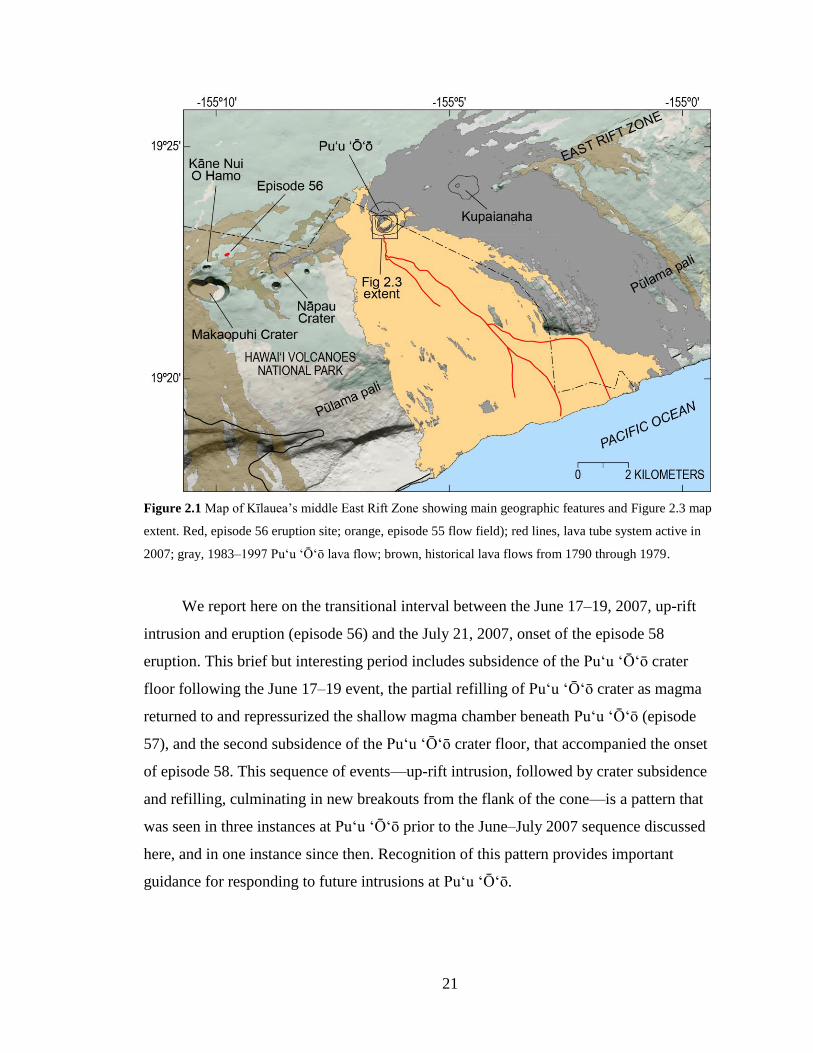
Figure 2.1 Map of Kīlauea’s middle East Rift Zone showing main geographic features and Figure 2.3 map
extent. Red, episode 56 eruption site; orange, episode 55 flow field); red lines, lava tube system active in
2007; gray, 1983–1997 Puʻu ʻŌʻō lava flow; brown, historical lava flows from 1790 through 1979.
We report here on the transitional interval between the June 17–19, 2007, up-rift
intrusion and eruption (episode 56) and the July 21, 2007, onset of the episode 58
eruption. This brief but interesting period includes subsidence of the Puʻu ʻŌʻō crater
floor following the June 17–19 event, the partial refilling of Puʻu ʻŌʻō crater as magma
returned to and repressurized the shallow magma chamber beneath Puʻu ʻŌʻō (episode
57), and the second subsidence of the Puʻu ʻŌʻō crater floor, that accompanied the onset
of episode 58. This sequence of events—up-rift intrusion, followed by crater subsidence
and refilling, culminating in new breakouts from the flank of the cone—is a pattern that
was seen in three instances at Puʻu ʻŌʻō prior to the June–July 2007 sequence discussed
here, and in one instance since then. Recognition of this pattern provides important
guidance for responding to future intrusions at Puʻu ʻŌʻō.
22
2.2 Data collection
Occasional ground observations and helicopter flights provided only brief and
intermittent glimpses of the changes within Puʻu ʻŌʻō during episode 57. Gaps in field
observations occurred July 8–11 and July 14–18. The entire interval was monitored by a
telemetered, near real-time web-based camera (webcam) and strategically positioned
digital time-lapse cameras. A continuous digital-image record, as corroborated by direct
field observations, documents progressive and sudden changes in eruptive conditions
within the crater that can be correlated with real-time shallow deformation near Puʻu
ʻŌʻō.
Figure 2.2 Timeline for episodes 56, 57, and 58, with emphasis on main eruptive events of June–July 2007.
The pan-tilt-zoom webcam, of the type described by Hoblitt et al. (2008), was
positioned on the north rim of the Puʻu ʻŌʻō crater (Fig. 2.3) in a long-term deployment
that spanned the study period. The Puʻu ʻŌʻō webcam acquired a series of three
overlapping images spanning the length of the crater with a repeat interval of 1 minute.
Image pixel resolution was 640 × 480. Custom time-lapse camera systems, of the type
described by Orr and Hoblitt (2008), were deployed on the east and northwest rims of
Puʻu ʻŌʻō (Fig. 2.3). These cameras required manual exchange of camera memory cards
to retrieve data. The eastern camera photographed the eastern part of the crater, including
23
the East vent, with an acquisition interval of 1 minute. Operation of this camera was
sporadic due to malfunctions, and image acquisition was limited to parts of June 18–19,
June 21, June 25–27, July 5, and July 13. Image pixel resolution was set at 640 × 480.
The northwestern camera captured images of the western part of the crater, including a
partial view of the West vent, and was programmed with an acquisition interval of 1
minute and a pixel resolution of 640 × 480. This camera operated flawlessly, acquiring
images for the period June 18–July 19, but subsequent images were lost when the part of
the Puʻu ʻŌʻō cone on which the camera was positioned collapsed into the crater on July
21.
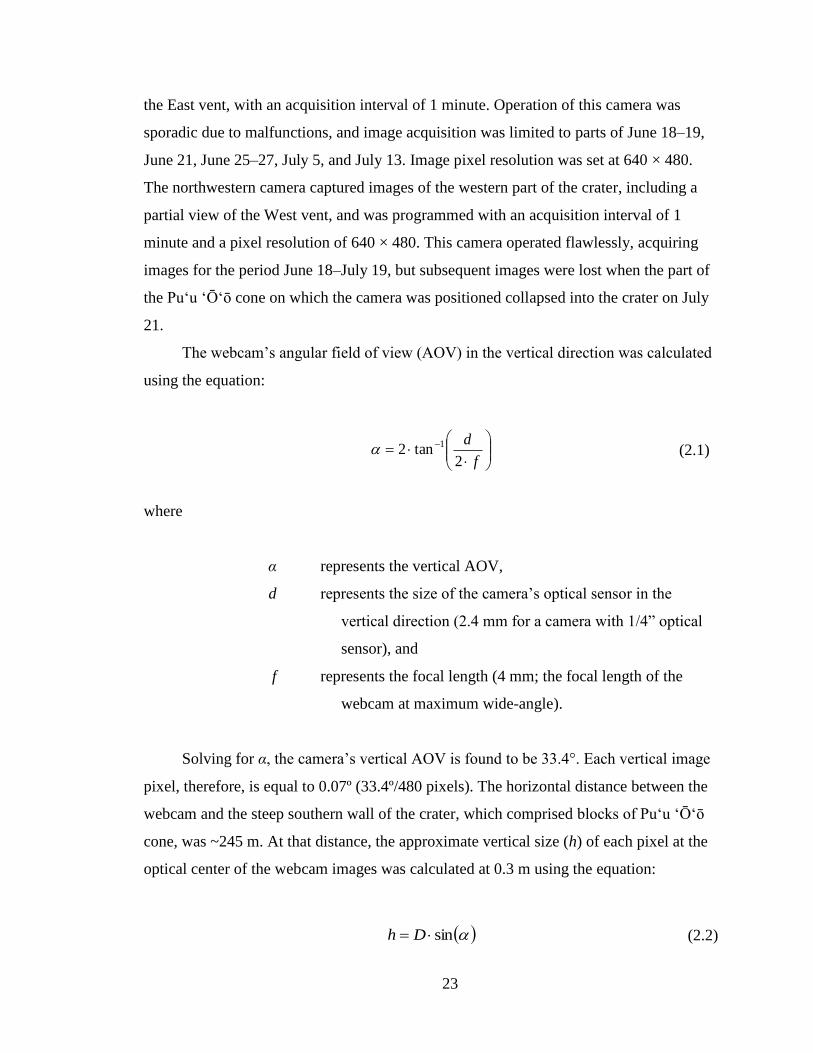
The webcam’s angular field of view (AOV) in the vertical direction was calculated
using the equation:
(2.1)
where
α represents the vertical AOV,
d represents the size of the camera’s optical sensor in the
vertical direction (2.4 mm for a camera with 1/4” optical
sensor), and
f represents the focal length (4 mm; the focal length of the
webcam at maximum wide-angle).
Solving for α, the camera’s vertical AOV is found to be 33.4°. Each vertical image
pixel, therefore, is equal to 0.07º (33.4º/480 pixels). The horizontal distance between the
webcam and the steep southern wall of the crater, which comprised blocks of Pu‘u ‘Ō‘ō
cone, was ~245 m. At that distance, the approximate vertical size (h) of each pixel at the
optical center of the webcam images was calculated at 0.3 m using the equation:
sin Dh (2.2)
f
d
2tan2 1

24
where
D is the horizontal distance between the webcam and the
southern crater wall, and
α is the vertical AOV of each pixel as solved above.
Changes in pixel size, because of the webcam view angle and crater wall slope, are small
and, thus, ignored.
The y-pixel value for the intersection between new lava on the floor of the crater
and the south crater wall was recorded from a webcam image captured as close in time to
1200 Hawaiian Standard Time (HST) as possible (visibility dependent) each day, starting
July 4, when crater visibility first improved, through July 20, the last day before the onset
of episode 58. These measurements were made along a vertical axis at an x-pixel of 320
±5 on the middle image of the three webcam images that compose the crater panorama.
Crater uplift was recorded in the same fashion, along the same centerline, using an
obvious rock face above the level of infilling as a reference point.
A laser rangefinder survey on July 13 determined the vertical distance from the
crater rim to feature surfaces within the crater. The east rim of the crater had a known
elevation of 860 m, allowing elevations of these measured surfaces to be calculated. The
dimensions of the crater, and of the lava surface accumulating within it, were estimated
from existing crater maps. These data were used to calculate the volume of accumulated
lava, as well as to constrain the rate of infilling and to track uplift of the crater floor by
way of webcam images, as described above.
Deformation of the Puʻu ʻŌʻō edifice was recorded by an electronic borehole
tiltmeter installed at a depth of ~3 m about 500 m north of the crater rim at an elevation
of 700 m (Fig. 2.3). Data from this tiltmeter (designated POC) were used to infer inflation
and deflation of the shallow magmatic source beneath Puʻu ʻŌʻō.
Five samples of episode 57 lava, the locations of which are shown in Figure 2.3b,
were collected on July 19, 2007. Three samples were the glassy crust and drapery from
the edge of lava flows (two were cold and erupted days earlier; one was warm and
25
probably erupted hours earlier). One sample was air-quenched spatter collected from the
ground surface near an eruptive vent. One molten sample was collected by rock hammer
and quenched in water. Whole-rock major analyses for all five samples were performed
at the Washington State University GeoAnalytical Laboratory in Pullman, Washington
(USA), using wave-length dispersive X-ray fluorescence techniques (Johnson et al.,
1999). Microbeam quantitative analysis was performed on one sample by Carl Thornber
at the U.S. Geological Survey Denver Microbeam Facility under the conditions described
by Thornber et al. (2002).
2.3 Eruption chronology
2.3.1 Setting the stage (early 2007)
Relatively steady lava effusion from Pu‘u ‘Ō‘ō’s southwest flank vents, typical of
prolonged episode 55 activity, prevailed throughout early 2007 and until the June 17
event. The floor of Pu‘u ‘Ō‘ō crater was about 5 m below the crater’s east rim, which
stood at an elevation of 860 m. Several outgassing vents were present on the crater floor
and within three large collapse pits (West Gap pit, Puka Nui pit, and Martin Luther King
(MLK) pit) that intersected the west and southwest edges of the crater (Fig. 2.3a). Most
vents were topped by spatter cones, but the easternmost (East Pond vent) was a small pit
with a circulating lava lake about 20 m below the pit rim, or 25 m below the east rim of
the crater at an elevation of 835 m (Figs. 2.3a and 2.4a). In addition, lava was erupting
from a vent on Pu‘u ‘Ō‘ō’s southwest flank where it flowed through the Prince Kūhiō
Kalaniana‘ole (PKK) lava tube (Figs. 2.1 and 2.3a) to feed active surface flows and ocean
entries. The vent and lava tube names discussed here are informal names used by the
Hawaiian Volcano Observatory for identification purposes.
2.3.2 Crater floor subsidence at Pu‘u ‘Ō‘ō
The subsidence of Puʻu ʻŌʻō’s crater floor was preceded by an eruption (episode
56) near the Kāne Nui o Hamo lava shield on the upper East Rift Zone of Kīlauea
Volcano (Fig. 2.1) on June 17–19, 2007 (Poland et al., 2008a). The subsidence disrupted
10 years of almost continuous East Rift Zone eruption (since the onset of episode 55 in

26
Figure 2.3 Maps of Pu‘u ‘O‘o before and after episode 57 showing crater, flank pits, active vents (red
triangles), active lava tube (red line), and monitoring equipment (white circles). POC, tiltmeter; PKK,
Prince Kuhio Kalaniana‘ole; MLK, Martin Luther King; hachured black line, crater rim; brown, flows
erupted 1992–2007; gray, exposed Pu‘u ‘O‘o cone constructed 1983–1986. (a) Configuration of Pu‘u ‘O‘o
in early 2007 before the June 17–19 intrusion. Rim buried on west and southwest side of cone by overflows
from crater before 2007. (b) Configuration of Pu‘u ‘O‘o on July 21, 2007, after episode 57 ended. Pink,
episode 57 flows; hachured black line, crater rim (connected to flank pits by subsidence of septa between
pits and crater on June 17–19); dashed black line, approximate trace of fault accommodating uplift
(question marks indicate uncertainty in continuation of fracture). Lava samples (black circles) include 1 =
KE57-2647F; 2 = KE57-2649F; 3 = KE57-2650F; 4 = KE57-2651S; 5 = KE57-2652F. Also shown is
southwest end of fissure A of episode 58 eruption.
1997). The intrusion started at 0216 HST with the onset of rapid deflation at Kīlauea’s
summit. Deflation at Puʻu ʻŌʻō began minutes later, signaling that the supply of magma
to the middle East Rift Zone had been disrupted. Outwardly, however, no change was
seen at Puʻu ʻŌʻō for several hours, and the view was similar to that shown in Figure
2.4a. During a helicopter flight shortly after dawn (~0745 HST) on June 17, the lava
surface within the East Pond vent was observed at its typical level. Also, lava continued
to flow through the PKK lava tube and was feeding active surface flows and an ocean
entry that appeared unchanged compared to observations from previous days.
27
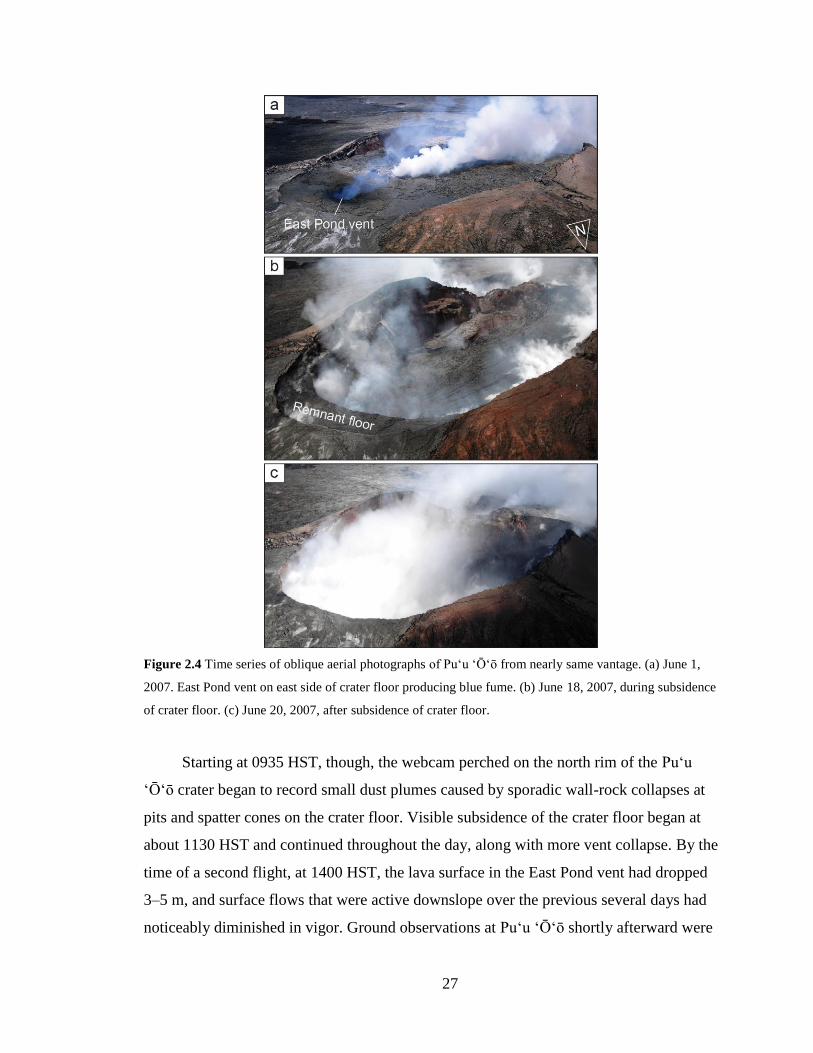
Figure 2.4 Time series of oblique aerial photographs of Puʻu ʻŌʻō from nearly same vantage. (a) June 1,
2007. East Pond vent on east side of crater floor producing blue fume. (b) June 18, 2007, during subsidence
of crater floor. (c) June 20, 2007, after subsidence of crater floor.
Starting at 0935 HST, though, the webcam perched on the north rim of the Puʻu
ʻŌʻō crater began to record small dust plumes caused by sporadic wall-rock collapses at
pits and spatter cones on the crater floor. Visible subsidence of the crater floor began at
about 1130 HST and continued throughout the day, along with more vent collapse. By the
time of a second flight, at 1400 HST, the lava surface in the East Pond vent had dropped
3–5 m, and surface flows that were active downslope over the previous several days had
noticeably diminished in vigor. Ground observations at Puʻu ʻŌʻō shortly afterward were
28
enlivened by the frequent sound of rock slides from the south crater wall and wall-rock
collapses in slowly enlarging pits on the crater floor. Many of the collapse events were
energetic enough to be recorded by infrasound (Fee et al., 2011).
By the following morning (June 18), the crater floor of Puʻu ʻŌʻō below the north
rim of the crater had dropped ~30 m (Fig. 2.4b). A lava pond ~100 × 60 m across (long
axis oriented north–south) filled a pit on the east crater floor, where the East Pond vent
had been. Adjacent to this pond, to the west, another pit had formed and hosted a small
lava pond ~15 m in diameter. The lava surface within both pits was estimated to be 40–
45 m below the edge of a remnant slice of crater floor attached to the east rim of Puʻu
ʻŌʻō crater (Fig. 2.4b). This indicated that the lava level had dropped 20–25 m since the
previous morning and was at an elevation of 815–810 m.
Elsewhere, subsidence of the south crater floor had caused slumping of the south
wall of the Puʻu ʻŌʻō cone. In addition, the West Gap and Puka Nui pits on the west flank
of Puʻu ʻŌʻō had approximately doubled in diameter and depth, while the MLK pit
increased only in depth. Aerial views into a skylight on the eastern of the two branches of
the PKK lava tube showed it had been abandoned. The ocean entry, fed by the western
branch of the tube system, remained active, but the steam plume had diminished
substantially.
By June 19, most of the crater floor was observed to have subsided. All three pits
on the west flank of the cone had grown larger and deeper, consuming parts of the
adjacent walls of the Puʻu ʻŌʻō cone. At the coast, the ocean entry had dwindled to minor
steaming with only sporadic drips of viscous-looking, residual lava draining into the
ocean, indicating that the lava supply to the tube system had been severed. Though fume
hampered views into Puʻu ʻŌʻō on June 19 and 20, brief but slightly better views on June
21 (Fig. 2.4c)—after subsidence is thought to have stopped—suggested that the central
part of the crater floor had subsided ~80 m and formed a concave depression, its floor
composed of rubble at an elevation of ~775 m.
Fume prevented views into the crater in the days following the subsidence.
Webcam images on July 4 showed a pit on the east side of the crater floor, with a depth
probably similar to that of the central part of the crater, but separated from it by a septum
10–20 m higher. A part of the original crater floor, down-dropped by about 15 m,
29
remained attached to the east wall of the crater and formed a crescent-shaped shelf as
wide as ~20 m. The lack of eruptive activity anywhere on Kīlauea after June 19 indicated
that the volcano had entered an eruptive hiatus.
2.3.3 Refilling of Pu‘u ‘Ō‘ō
Following a repose period of ~12.5 days, infrasonic energy from Puʻu ʻŌʻō
resumed at ~1800 HST on July 1 (M. Garces, written communication, 2007), and weak
flashes of red glow recorded by the webcam became apparent after dark at 1930 HST and
continued overnight. A radiometer on the north rim of Puʻu ʻŌʻō (Harris et al., 2005),
pointed toward the center of the crater, began to record elevated temperatures at 0750
HST on July 2, suggesting that lava had begun to pond at the bottom of the crater. Lava
erupting from two vents (referred to hereafter as the East vent and the West vent; Figs.
2.3b and 2.5) was sighted less than an hour later, verifying that episode 57 had begun.
The two vents were positioned close to, but slightly north of, the positions of vents that
had been active on the crater floor before June 17 (compare Figs. 2.3a and 2.3b). Within a
few days, a growing lava lake spanned much of the length and width of the crater (Fig.
2.5).
Early on July 3, the POC tiltmeter began to record an unusual saw tooth-shaped
signal that slowly grew in amplitude (Fig. 2.6a). The duration between peaks was ~1 hr,
and the inflationary and deflationary limbs appeared to be relatively linear and
symmetrical. This behavior was interspersed with, and eventually replaced by, a series of
eight larger tilt excursions on July 3–6 (Fig. 2.6; Table 2.1) that were characterized by an
abrupt and rapid inflation of 0.6–1.6 microradians and followed by an equally abrupt and
rapid deflation. The inflationary and deflationary limbs were not linear and exhibited a
decay pattern than created an obvious asymmetry to the shape of most events on the tilt
graph. Event durations ranged from 1h 46
m to 3
h 22
m. Improved viewing conditions as the
lava lake developed allowed the volcanic events that accompanied five of the eight large
tilt excursions to be recorded, at least in part, by webcam and also, in a few cases, by the
time-lapse camera deployed on the northwest rim of Puʻu ʻŌʻō.
30
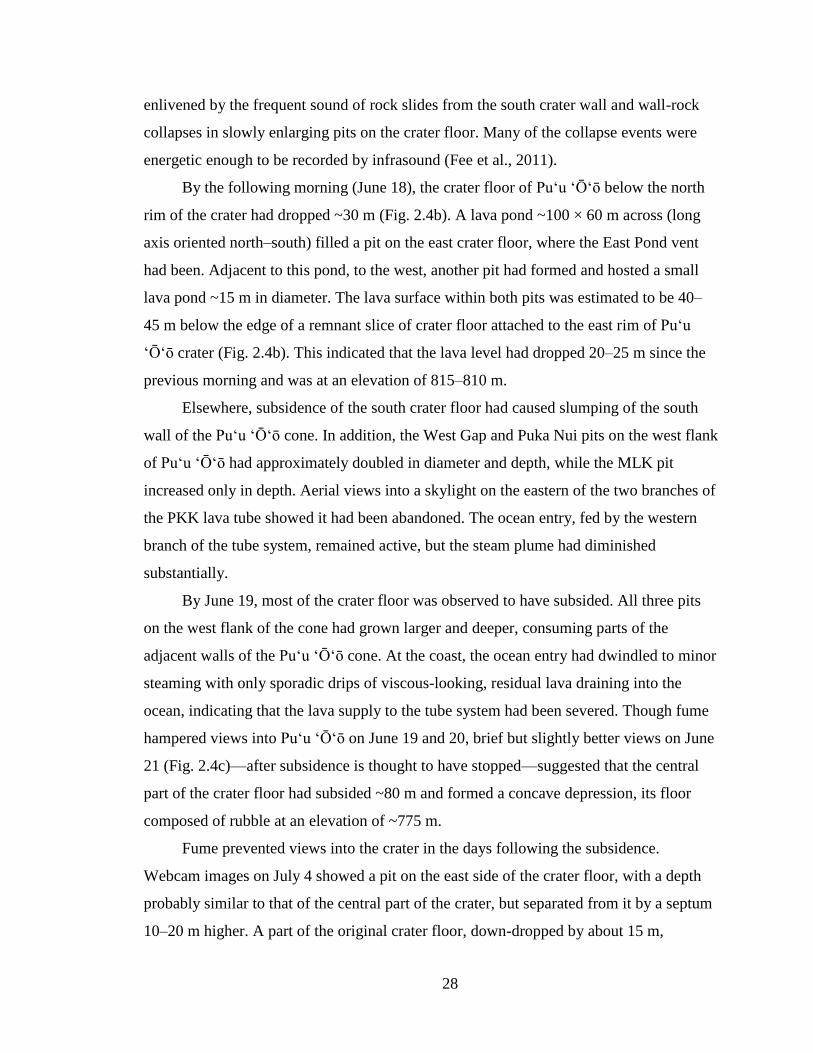
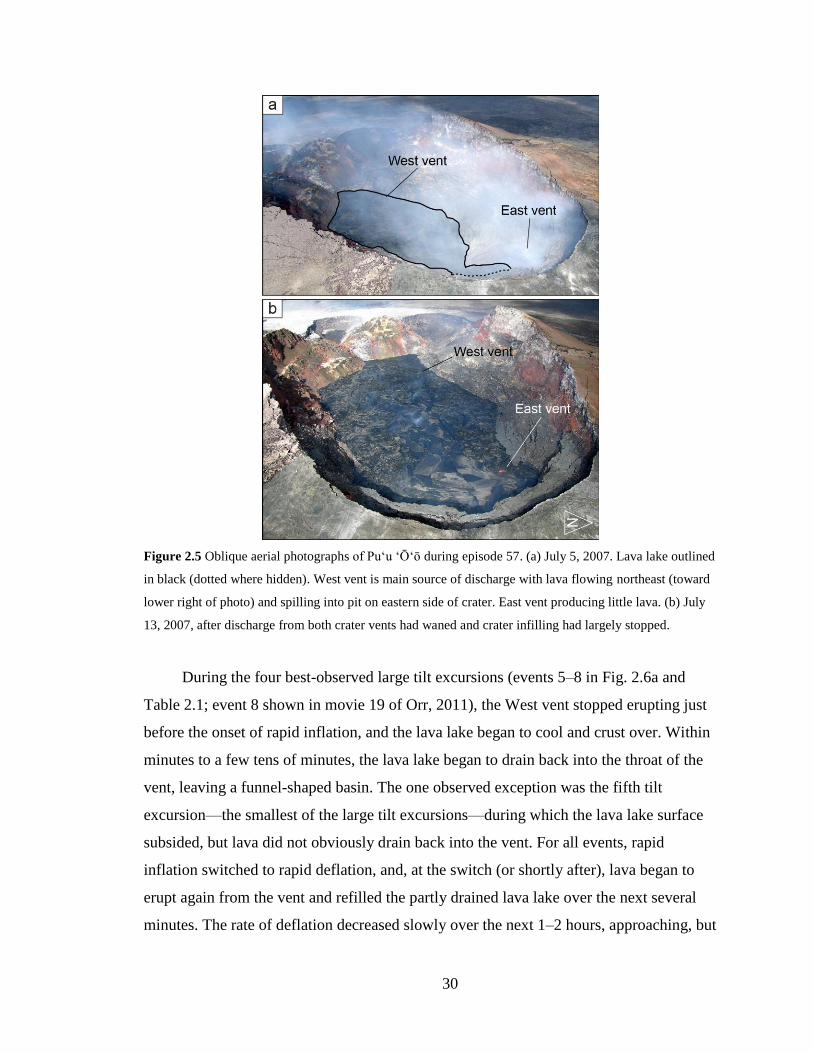
Figure 2.5 Oblique aerial photographs of Pu‘u ‘Ō‘ō during episode 57. (a) July 5, 2007. Lava lake outlined
in black (dotted where hidden). West vent is main source of discharge with lava flowing northeast (toward
lower right of photo) and spilling into pit on eastern side of crater. East vent producing little lava. (b) July
13, 2007, after discharge from both crater vents had waned and crater infilling had largely stopped.
During the four best-observed large tilt excursions (events 5–8 in Fig. 2.6a and
Table 2.1; event 8 shown in movie 19 of Orr, 2011), the West vent stopped erupting just
before the onset of rapid inflation, and the lava lake began to cool and crust over. Within
minutes to a few tens of minutes, the lava lake began to drain back into the throat of the
vent, leaving a funnel-shaped basin. The one observed exception was the fifth tilt
excursion—the smallest of the large tilt excursions—during which the lava lake surface
subsided, but lava did not obviously drain back into the vent. For all events, rapid
inflation switched to rapid deflation, and, at the switch (or shortly after), lava began to
erupt again from the vent and refilled the partly drained lava lake over the next several
minutes. The rate of deflation decreased slowly over the next 1–2 hours, approaching, but

31
not quite reaching, the previous tilt level. Though the lava lake was not visible during
every large tilt excursion, it is inferred that all tilt excursions exhibited similar eruptive
behavior. The last large tilt excursion (event 8; Fig. 2.6) was followed by a small tilt
excursion similar in shape and magnitude to the small saw tooth-shaped tilt events
recorded at POC on July 3–4. Based on the webcam record, this tilt excursion was also
accompanied by a drain-back event, but a commensurately smaller one that trailed the
switch to deflation by several minutes. It is therefore possible that the small sawtooth-
shaped tilt events described previously, and which preceded the 8 large tilt excursions,
also correlated with brief eruptive slowdowns, that may or may not have been
accompanied by drain-back behavior. (This inference is supported by observations made
in 2010 and 2011 of a lava lake over a similarly located vent on Puʻu ʻŌʻō’s crater floor.
In this later case, a nearly identical small-amplitude saw tooth-shaped signal, as recorded
by the POC tiltmeter, occurred repeatedly over periods of up to several days. The tilt
signal corresponded to effusion slow-downs during inflation and pulses in effusion
during deflation.)
Initially, the West vent was the dominant source of lava accumulation on the crater
floor, and the East vent added very little to the lava output. By July 5, lava from the West
vent had filled the central part of the crater floor to a depth estimated at 10–20 m and was
spilling into, and filling, the east pit (Fig. 2.5a). Shortly after 1300 HST on July 6,
coincident with the onset of prolonged inflation recorded by the POC tiltmeter, effusion
from the East vent increased suddenly and that from the West vent stopped. Though the
West vent began to erupt again by mid-morning on July 7, the East vent was the source of
most of the erupting lava for the next several days (Fig. 2.5b). While both vents were
erupting, East vent flows crossed the crater floor toward the west, often overwhelming
the West vent (see movie 20 of Orr, 2011).
As lava pooled on the crater floor, it constructed low levees, impounding a perched
lava lake that stood a few meters above the surrounding crater floor. Early in the
afternoon of July 12, the West vent became inactive again, and flows from the East vent
were the sole source of erupting lava (see movie 21 of Orr, 2011). By July 14, the output
from the East vent had also waned, with flows rarely reaching halfway across the crater
floor. The West vent reactivated the same day, however, and began to erupt sporadically,

32
Figure 2.6 Line graphs showing saw tooth-shaped tilt signals at Puʻu ʻŌʻō during (a) July 3–6. For the
large tilt excursions, cessation of eruptive activity and lava lake drain-back corresponds to periods of
inflation, and resumption of eruptive activity corresponds to subsequent deflation. Numbers correlate with
event numbers in Table 2.1. (b) Detail of tilt event 7. (c) Detail of tilt event 8. Red lines in b and c
correspond to cessation of eruptive activity, black lines correspond to onset of lava lake draining, and green
lines correspond to resumption of extrusive activity.
feeding small flows that were confined to the west end of the crater. By July 16, cooling
and subsidence of the lava lake and crater floor uplift left the levee walls standing several
meters higher than the chilled surface of the lake (Fig. 2.7). Estimates from oblique aerial
photographs compared to the known dimensions of the Puʻu ʻŌʻō crater rim indicated
that the crater floor, composed of new lava, had reached a maximum size of about 350 ×
130 m, exclusive of the West Gap pit (Fig. 2.3b). The east part of the crater floor was ~30
m below the east rim of the crater, indicating that the lava had accumulated in the crater
to a thickness of ~55 m.
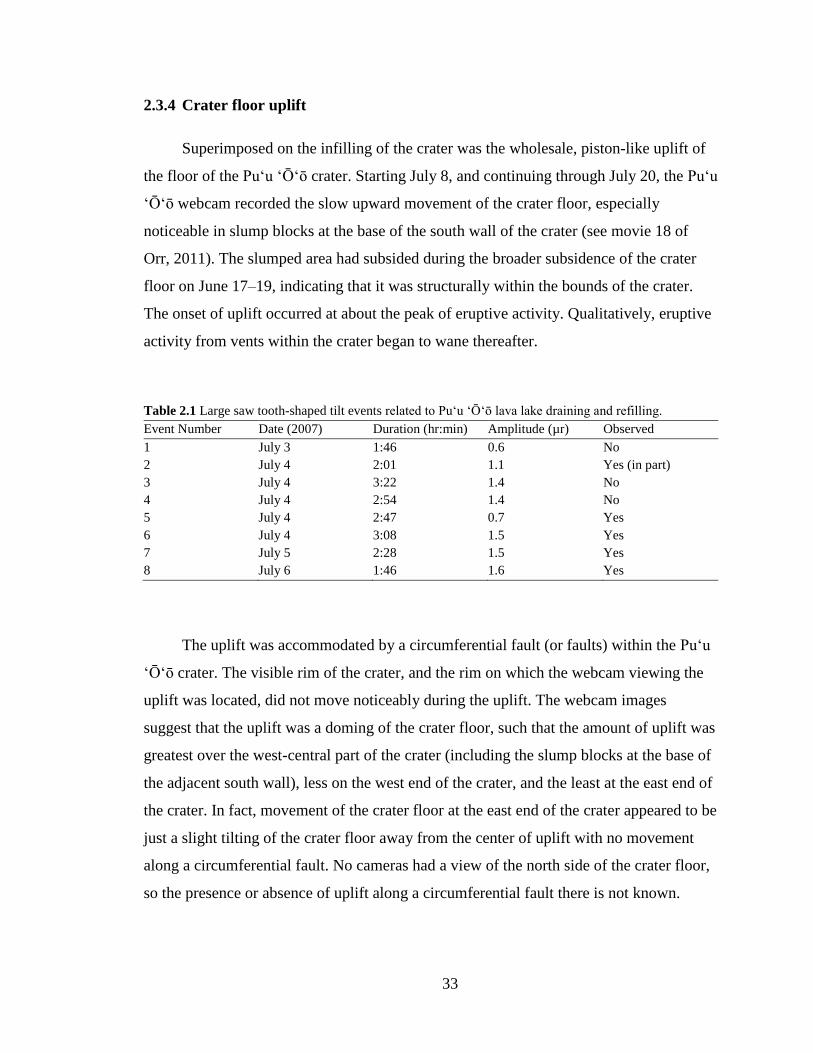
33
2.3.4 Crater floor uplift
Superimposed on the infilling of the crater was the wholesale, piston-like uplift of
the floor of the Puʻu ʻŌʻō crater. Starting July 8, and continuing through July 20, the Puʻu
ʻŌʻō webcam recorded the slow upward movement of the crater floor, especially
noticeable in slump blocks at the base of the south wall of the crater (see movie 18 of
Orr, 2011). The slumped area had subsided during the broader subsidence of the crater
floor on June 17–19, indicating that it was structurally within the bounds of the crater.
The onset of uplift occurred at about the peak of eruptive activity. Qualitatively, eruptive
activity from vents within the crater began to wane thereafter.
Table 2.1 Large saw tooth-shaped tilt events related to Pu‘u ‘Ō‘ō lava lake draining and refilling.
Event Number Date (2007) Duration (hr:min) Amplitude (µr) Observed
1 July 3 1:46 0.6 No
2 July 4 2:01 1.1 Yes (in part)
3 July 4 3:22 1.4 No
4 July 4 2:54 1.4 No
5 July 4 2:47 0.7 Yes
6 July 4 3:08 1.5 Yes
7 July 5 2:28 1.5 Yes
8 July 6 1:46 1.6 Yes
The uplift was accommodated by a circumferential fault (or faults) within the Puʻu
ʻŌʻō crater. The visible rim of the crater, and the rim on which the webcam viewing the
uplift was located, did not move noticeably during the uplift. The webcam images
suggest that the uplift was a doming of the crater floor, such that the amount of uplift was
greatest over the west-central part of the crater (including the slump blocks at the base of
the adjacent south wall), less on the west end of the crater, and the least at the east end of
the crater. In fact, movement of the crater floor at the east end of the crater appeared to be
just a slight tilting of the crater floor away from the center of uplift with no movement
along a circumferential fault. No cameras had a view of the north side of the crater floor,
so the presence or absence of uplift along a circumferential fault there is not known.
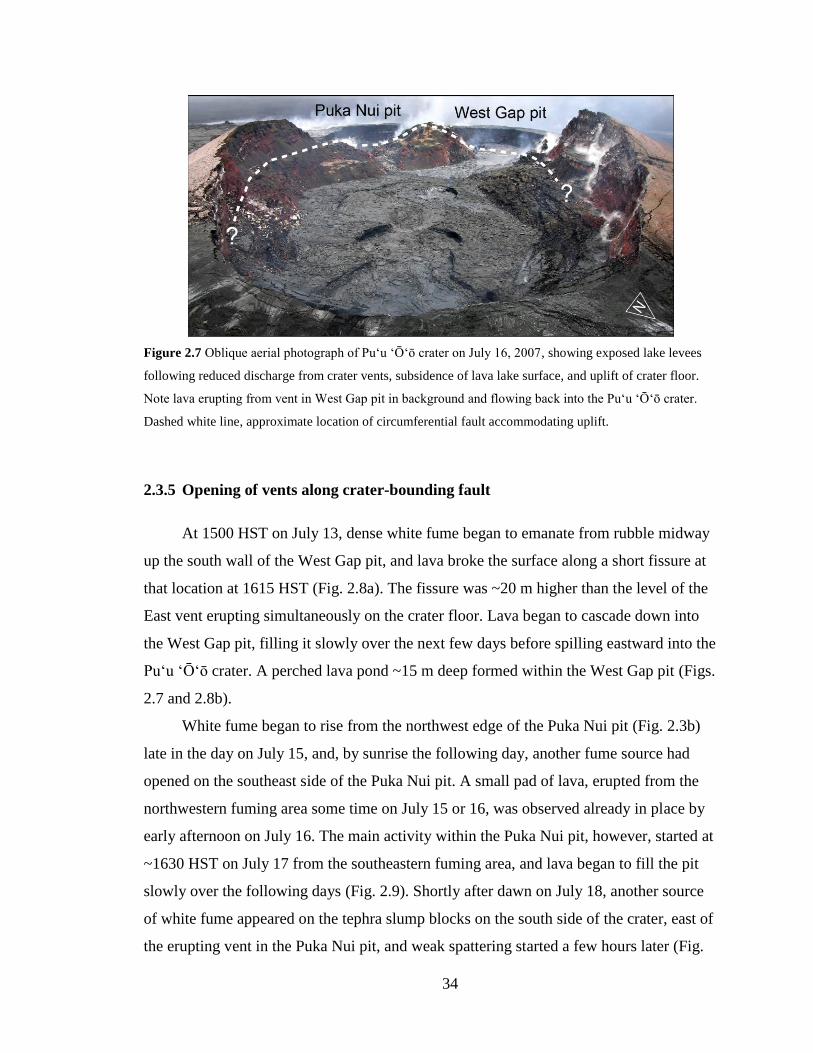
34
Figure 2.7 Oblique aerial photograph of Pu‘u ‘Ō‘ō crater on July 16, 2007, showing exposed lake levees
following reduced discharge from crater vents, subsidence of lava lake surface, and uplift of crater floor.
Note lava erupting from vent in West Gap pit in background and flowing back into the Pu‘u ‘Ō‘ō crater.
Dashed white line, approximate location of circumferential fault accommodating uplift.
2.3.5 Opening of vents along crater-bounding fault
At 1500 HST on July 13, dense white fume began to emanate from rubble midway
up the south wall of the West Gap pit, and lava broke the surface along a short fissure at
that location at 1615 HST (Fig. 2.8a). The fissure was ~20 m higher than the level of the
East vent erupting simultaneously on the crater floor. Lava began to cascade down into
the West Gap pit, filling it slowly over the next few days before spilling eastward into the
Puʻu ʻŌʻō crater. A perched lava pond ~15 m deep formed within the West Gap pit (Figs.
2.7 and 2.8b).
White fume began to rise from the northwest edge of the Puka Nui pit (Fig. 2.3b)
late in the day on July 15, and, by sunrise the following day, another fume source had
opened on the southeast side of the Puka Nui pit. A small pad of lava, erupted from the
northwestern fuming area some time on July 15 or 16, was observed already in place by
early afternoon on July 16. The main activity within the Puka Nui pit, however, started at
~1630 HST on July 17 from the southeastern fuming area, and lava began to fill the pit
slowly over the following days (Fig. 2.9). Shortly after dawn on July 18, another source
of white fume appeared on the tephra slump blocks on the south side of the crater, east of
the erupting vent in the Puka Nui pit, and weak spattering started a few hours later (Fig.
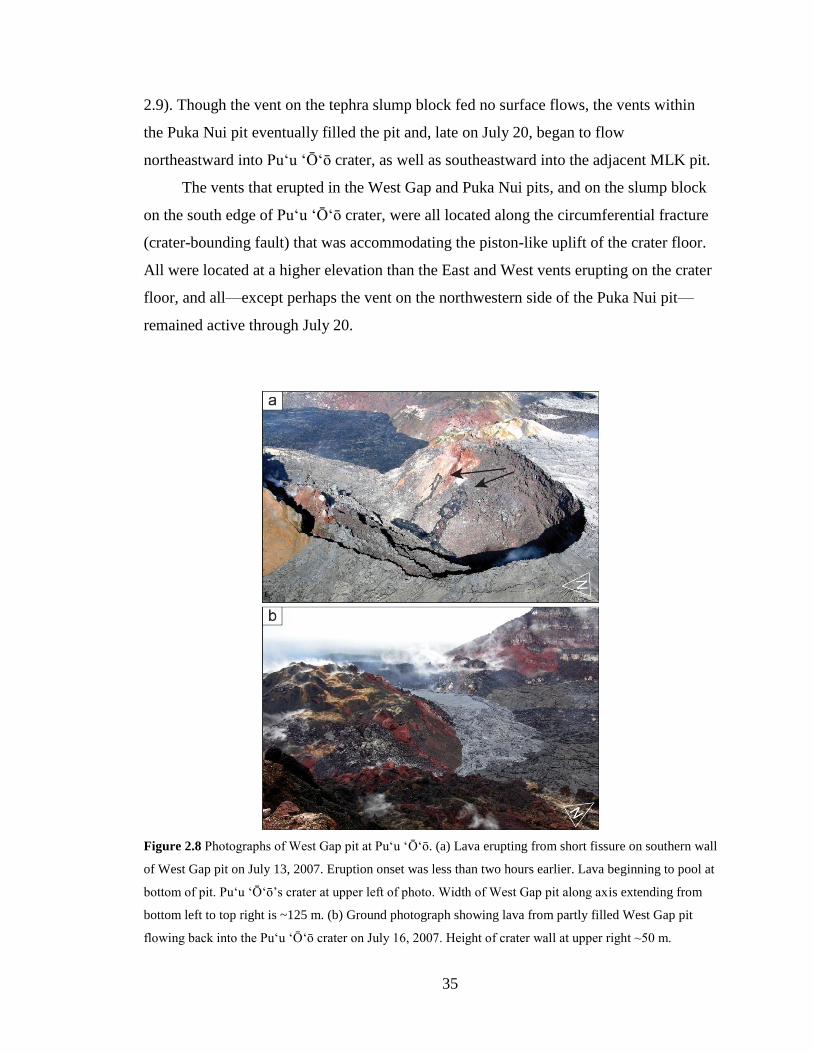
35
2.9). Though the vent on the tephra slump block fed no surface flows, the vents within
the Puka Nui pit eventually filled the pit and, late on July 20, began to flow
northeastward into Puʻu ʻŌʻō crater, as well as southeastward into the adjacent MLK pit.
The vents that erupted in the West Gap and Puka Nui pits, and on the slump block
on the south edge of Puʻu ʻŌʻō crater, were all located along the circumferential fracture
(crater-bounding fault) that was accommodating the piston-like uplift of the crater floor.
All were located at a higher elevation than the East and West vents erupting on the crater
floor, and all—except perhaps the vent on the northwestern side of the Puka Nui pit—
remained active through July 20.
Figure 2.8 Photographs of West Gap pit at Puʻu ʻŌʻō. (a) Lava erupting from short fissure on southern wall
of West Gap pit on July 13, 2007. Eruption onset was less than two hours earlier. Lava beginning to pool at
bottom of pit. Pu‘u ‘Ō‘ō’s crater at upper left of photo. Width of West Gap pit along axis extending from
bottom left to top right is ~125 m. (b) Ground photograph showing lava from partly filled West Gap pit
flowing back into the Pu‘u ‘Ō‘ō crater on July 16, 2007. Height of crater wall at upper right ~50 m.
36
2.3.6 Resumption of crater vent effusion
The East vent within Pu‘u ‘Ō‘ō erupted flows sporadically through July 20, but all
were small and confined to the area immediately surrounding the vent. The West vent
was also a source of small, sporadic flows during this period, but during mid-afternoon
on July 18, lava began to erupt vigorously from the West vent. Though not matching the
level of activity observed earlier in July, flows began to pond on the west side of the
crater, largely confined by the levees from the earlier-formed lava lake. Activity
increased over the following few days and, by late in the day on July 20, West vent flows
had reached nearly to the east end of the crater, where they occasionally converged with
small flows fed from the East vent.
2.3.7 Onset of episode 58
Eruptive activity within Pu‘u ‘Ō‘ō and from the vents along the crater-bounding,
circumferential fault stopped at ~2250 HST on July 20, coincident with the abrupt onset
of rapid deflationary tilt toward the southeast as recorded by the POC tiltmeter. Though
their supply had been severed, lava flows continued to advance across the crater floor
until ~2315 HST. At 2355 HST, the floor of Pu‘u ‘Ō‘ō crater began to subside rapidly.
Minutes later—shortly after midnight on July 21—lava began to erupt from a new fissure
high on the northeast flank of Pu‘u ‘Ō‘ō cone (Fig. 2.3b). The first acoustic signal from
the direction of Pu‘u ‘Ō‘ō’s east flank was detected at 0006 HST and a higher amplitude
signal appeared at 0013 HST (Fee et al., 2011), suggesting an eruptive onset at one of
these two times. Definitive glow was first detected beyond the east rim of Pu‘u ‘Ō‘ō by
webcam at 0039 HST. Over the next several hours, a series of four left- and right-
stepping, en echelon fissure segments propagated ~1.5 km down-rift. This signaled the
start of episode 58 of the long-lived Pu‘u ‘Ō‘ō eruption (Poland et al., 2008a).
Pu‘u ‘Ō‘ō underwent a prolonged, but rather dramatic, response to the episode 58
eruption. By the following day, the floor of the crater had sagged ~20 m, and a small pit
had formed at the site of the West vent. Thick fume obscured views of the East vent and
the east end of the crater. The center of the West Gap pit had dropped ~20 m, and a part
of the northwest rim of Pu‘u ‘Ō‘ō, on the north side of the West Gap pit, had collapsed,
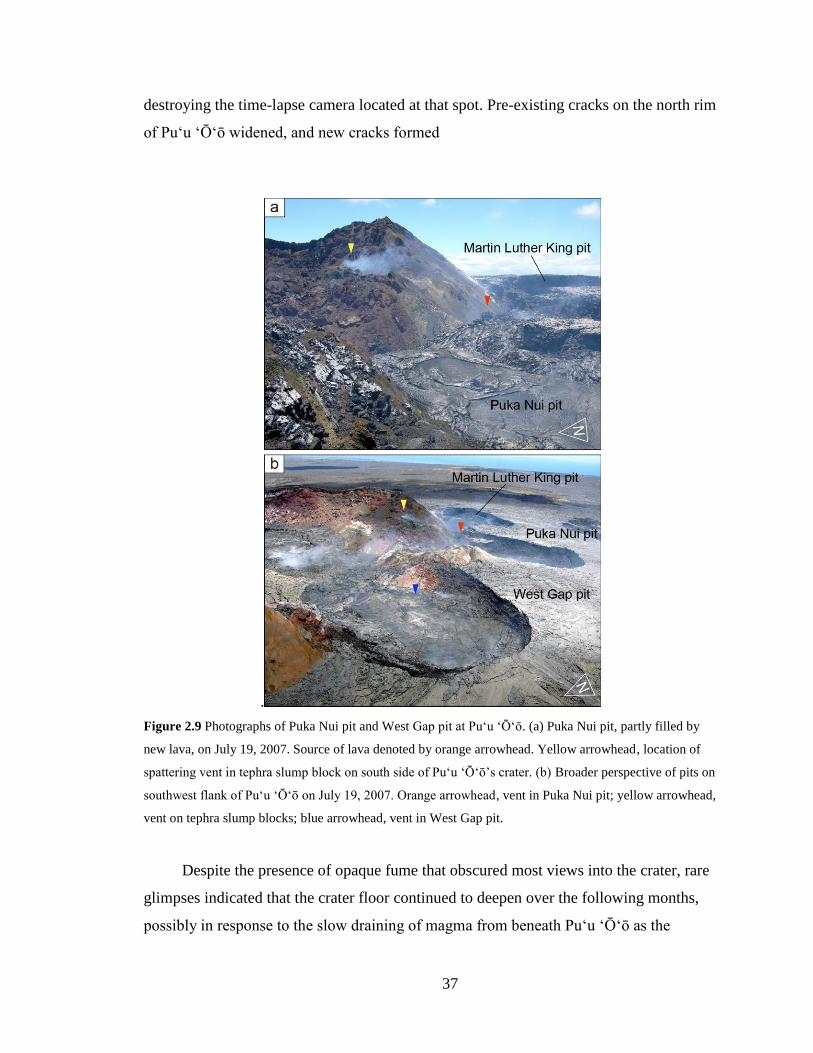
37
destroying the time-lapse camera located at that spot. Pre-existing cracks on the north rim
of Pu‘u ‘Ō‘ō widened, and new cracks formed
.
Figure 2.9 Photographs of Puka Nui pit and West Gap pit at Puʻu ʻŌʻō. (a) Puka Nui pit, partly filled by
new lava, on July 19, 2007. Source of lava denoted by orange arrowhead. Yellow arrowhead, location of
spattering vent in tephra slump block on south side of Pu‘u ‘Ō‘ō’s crater. (b) Broader perspective of pits on
southwest flank of Pu‘u ‘Ō‘ō on July 19, 2007. Orange arrowhead, vent in Puka Nui pit; yellow arrowhead,
vent on tephra slump blocks; blue arrowhead, vent in West Gap pit.
Despite the presence of opaque fume that obscured most views into the crater, rare
glimpses indicated that the crater floor continued to deepen over the following months,
possibly in response to the slow draining of magma from beneath Pu‘u ‘Ō‘ō as the

38
episode 58 eruption evolved. Many collapses were recorded by nearby seismometers
during this period, each accompanied by small, positive tilt offsets recorded on the POC
tiltmeter. Some collapses deposited dust onto the window of the webcam enclosure on the
north rim of the crater. The eventual result of crater subsidence was a bowl-shaped
depression floored by rubble, its low point 95–100 m below the east rim of the crater.
2.4 Results and discussion
2.4.1 Crater floor subsidence
The shape of Pu‘u ‘Ō‘ō crater floor after the subsidence on June 17–19 was
complex, but in simplest form can be approximated as a half-ellipsoid. A subsidence
volume (Vc) can therefore be calculated from
6
hwlVc
(2.3)
where
l is the crater length,
w is the crater width, and
h is the amount of subsidence.
Using crater dimensions of 400 × 280 m (pre-subsidence dimensions), and a depth
of 80 m, the derived volume of the crater subsidence is 4.2 × 10⁶ m
3. This is similar to the
volume-loss approximation of 3.65 × 10⁶ m
3 of lava calculated by Montgomery-Brown et
al. (2010) based on the length of time required for lava to reappear at Puʻu ʻŌʻō.
Experimental work on crater-collapse mechanisms by Roche et al. (2001) suggests that,
following subsidence, Pu‘u ‘Ō‘ō’s crater was probably a column of brecciated material
occupying a volume greater than that of the same material preceding the subsidence.
Thus, the crater subsidence volume calculated here may represent a minimum value.
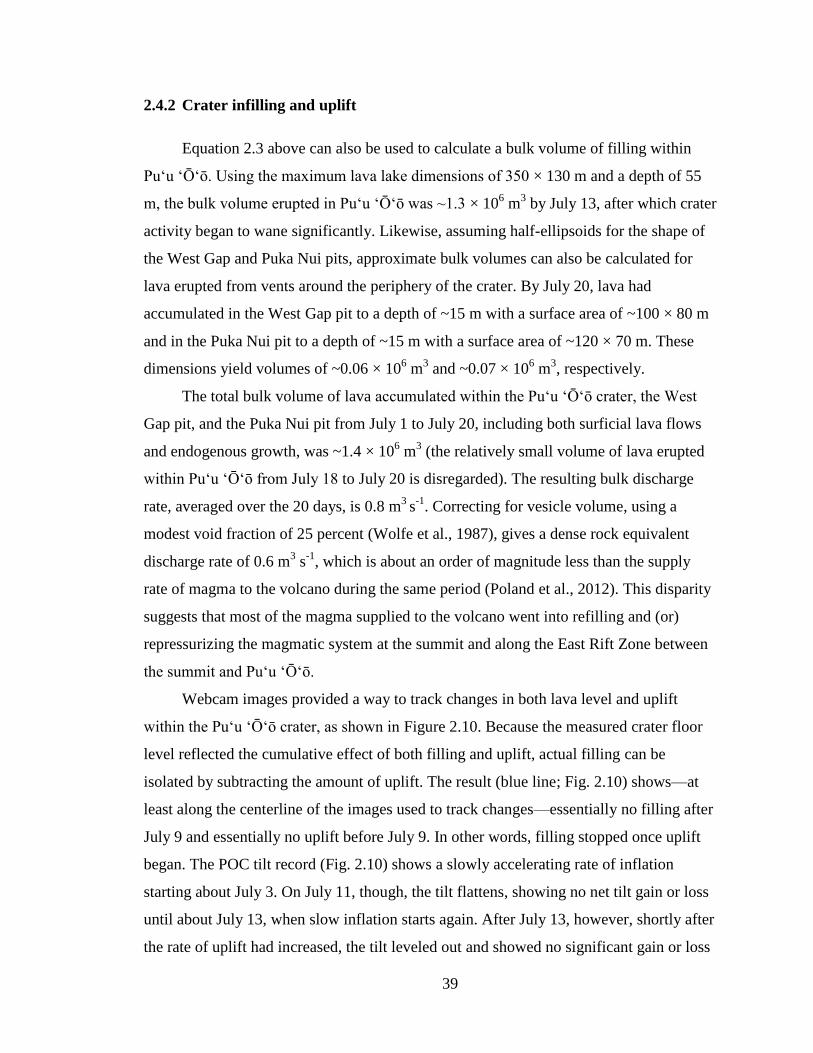
39
2.4.2 Crater infilling and uplift
Equation 2.3 above can also be used to calculate a bulk volume of filling within
Pu‘u ‘Ō‘ō. Using the maximum lava lake dimensions of 350 × 130 m and a depth of 55
m, the bulk volume erupted in Pu‘u ‘Ō‘ō was ~1.3 × 10⁶ m
3 by July 13, after which crater
activity began to wane significantly. Likewise, assuming half-ellipsoids for the shape of
the West Gap and Puka Nui pits, approximate bulk volumes can also be calculated for
lava erupted from vents around the periphery of the crater. By July 20, lava had
accumulated in the West Gap pit to a depth of ~15 m with a surface area of ~100 × 80 m
and in the Puka Nui pit to a depth of ~15 m with a surface area of ~120 × 70 m. These
dimensions yield volumes of ~0.06 × 10⁶ m
3 and ~0.07 × 10
6 m
3, respectively.
The total bulk volume of lava accumulated within the Pu‘u ‘Ō‘ō crater, the West
Gap pit, and the Puka Nui pit from July 1 to July 20, including both surficial lava flows
and endogenous growth, was ~1.4 × 10⁶ m
3 (the relatively small volume of lava erupted
within Puʻu ʻŌʻō from July 18 to July 20 is disregarded). The resulting bulk discharge
rate, averaged over the 20 days, is 0.8 m3
s-1
. Correcting for vesicle volume, using a
modest void fraction of 25 percent (Wolfe et al., 1987), gives a dense rock equivalent
discharge rate of 0.6 m3 s
-1, which is about an order of magnitude less than the supply
rate of magma to the volcano during the same period (Poland et al., 2012). This disparity
suggests that most of the magma supplied to the volcano went into refilling and (or)
repressurizing the magmatic system at the summit and along the East Rift Zone between
the summit and Puʻu ʻŌʻō.
Webcam images provided a way to track changes in both lava level and uplift
within the Puʻu ʻŌʻō crater, as shown in Figure 2.10. Because the measured crater floor
level reflected the cumulative effect of both filling and uplift, actual filling can be
isolated by subtracting the amount of uplift. The result (blue line; Fig. 2.10) shows—at
least along the centerline of the images used to track changes—essentially no filling after
July 9 and essentially no uplift before July 9. In other words, filling stopped once uplift
began. The POC tilt record (Fig. 2.10) shows a slowly accelerating rate of inflation
starting about July 3. On July 11, though, the tilt flattens, showing no net tilt gain or loss
until about July 13, when slow inflation starts again. After July 13, however, shortly after
the rate of uplift had increased, the tilt leveled out and showed no significant gain or loss
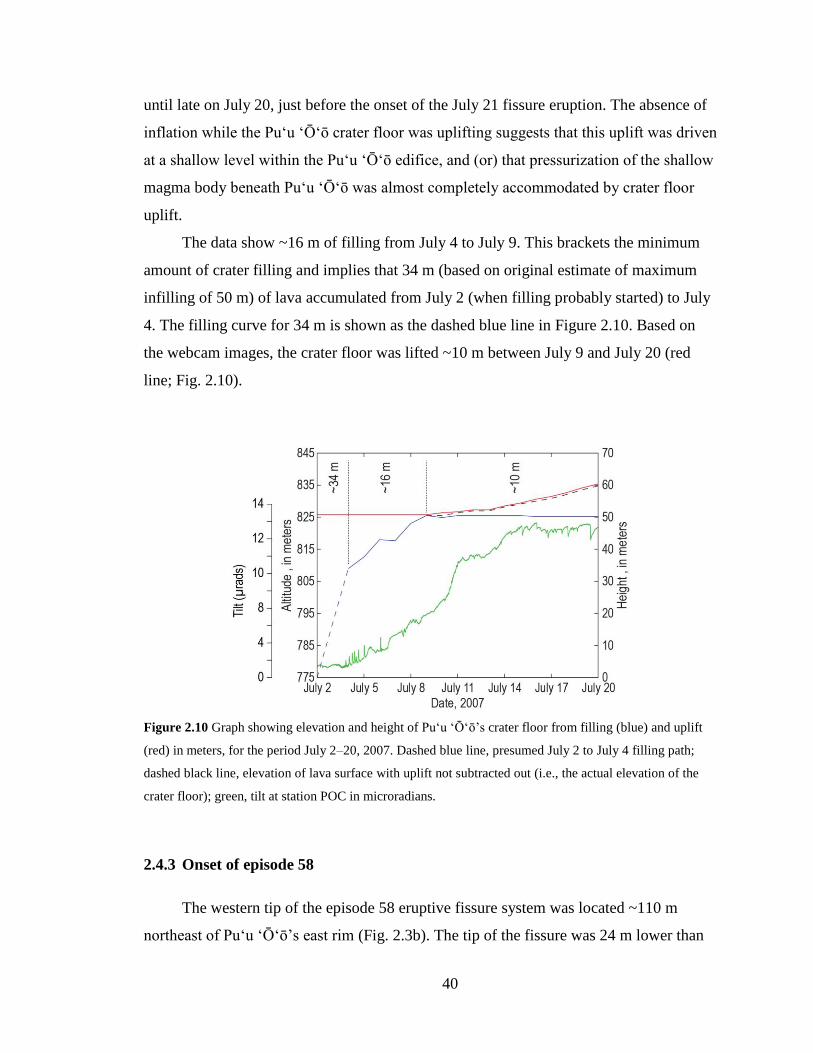
40
until late on July 20, just before the onset of the July 21 fissure eruption. The absence of
inflation while the Pu‘u ‘Ō‘ō crater floor was uplifting suggests that this uplift was driven
at a shallow level within the Pu‘u ‘Ō‘ō edifice, and (or) that pressurization of the shallow
magma body beneath Puʻu ʻŌʻō was almost completely accommodated by crater floor
uplift.
The data show ~16 m of filling from July 4 to July 9. This brackets the minimum
amount of crater filling and implies that 34 m (based on original estimate of maximum
infilling of 50 m) of lava accumulated from July 2 (when filling probably started) to July
4. The filling curve for 34 m is shown as the dashed blue line in Figure 2.10. Based on
the webcam images, the crater floor was lifted ~10 m between July 9 and July 20 (red
line; Fig. 2.10).
Figure 2.10 Graph showing elevation and height of Puʻu ʻŌʻō’s crater floor from filling (blue) and uplift
(red) in meters, for the period July 2–20, 2007. Dashed blue line, presumed July 2 to July 4 filling path;
dashed black line, elevation of lava surface with uplift not subtracted out (i.e., the actual elevation of the
crater floor); green, tilt at station POC in microradians.
2.4.3 Onset of episode 58
The western tip of the episode 58 eruptive fissure system was located ~110 m
northeast of Pu‘u ‘Ō‘ō’s east rim (Fig. 2.3b). The tip of the fissure was 24 m lower than
41
the crater rim and ~6 m higher than the level of lava on the crater floor. Cracks that
defined the westward extension of the fissure continued westward toward the crater rim,
but did not intersect it. In addition, the tip of the fissure was bounded by a zone of
circumferential fractures. Views of Pu‘u ‘Ō‘ō’s east crater wall in the months following
the onset of episode 58, when the crater floor had reached a depth estimated at 95–100 m
below the crater’s east rim, showed no evidence of a lateral connection between the crater
and the episode 58 fissure.
These observations show that the episode 58 fissure was not fed from a lateral
breach of the cone by lava that had accumulated within the Pu‘u ‘Ō‘ō crater. Instead,
magma that fed the episode 58 fissures probably originated directly from the shallow
conduit, bypassing the Pu‘u ‘Ō‘ō crater above. The subsequent depressurization
(eruption) resulted in crater floor subsidence and perhaps some recycling of molten lava
still present beneath the crusted surface of the lava lake on the crater floor.
2.4.4 Eruption petrology
Starting in April 2001, the olivine-phyric magma that had been erupting at Puʻu
ʻŌʻō changed to a mixture of olivine-only magma and a cooler magma containing
clinopyroxene phenocrysts and glomerocrysts (± olivine ± plagioclase). This change is
thought to be derived from the mixing of hotter and cooler components within the
magmatic system (Thornber et al., 2015). Glass temperature and bulk MgO decreased
slowly and finally stabilized at ~1,146º C and ~7.1 weight percent, and remained stable
through the end of episode 55 in June 2007.
Episode 56, however, erupted a hotter (1,160º C) and more Mg-rich (8.7 weight
percent MgO) olivine-only basalt, probably representing the primitive end-member for
the mixed magma erupted since 2001 (Thornber et al., 2015). When the eruption resumed
at Pu‘u ‘Ō‘ō with the start of episode 57, a cooler (1,143º C) low-MgO (~7.3 weight
percent), olivine- and clinopyroxene-phyric lava (Table 2.2) erupted once again, and this
hybrid magma continued to erupt during episode 58 (Thornber et al., 2015). This suggests
that the magmatic system was not significantly disrupted by the episode 56 eruption, and
that the presumed hybridization of hotter and cooler magmatic components likely occurs
along the East Rift Zone en route to Puʻu ʻŌʻō, possibly beneath Makaopuhi Crater (Fig.
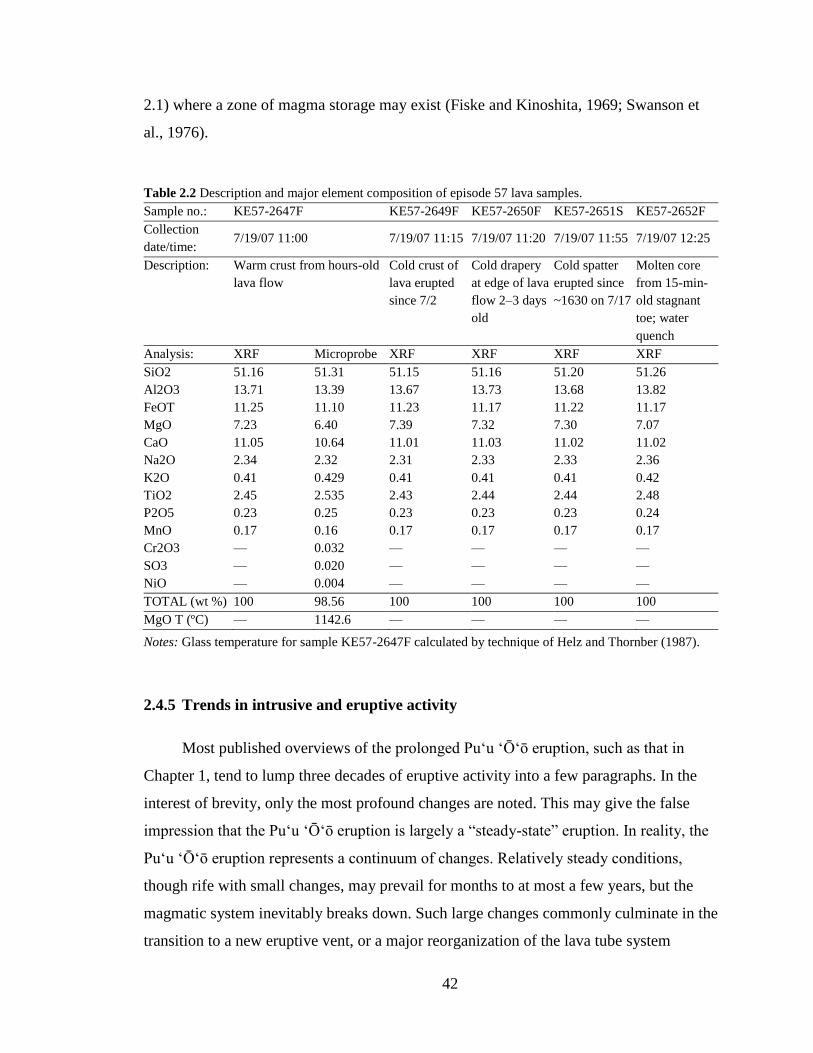
42
2.1) where a zone of magma storage may exist (Fiske and Kinoshita, 1969; Swanson et
al., 1976).
Table 2.2 Description and major element composition of episode 57 lava samples.
Sample no.: KE57-2647F KE57-2649F KE57-2650F KE57-2651S KE57-2652F
Collection
date/time: 7/19/07 11:00 7/19/07 11:15 7/19/07 11:20 7/19/07 11:55 7/19/07 12:25
Description: Warm crust from hours-old
lava flow
Cold crust of
lava erupted
since 7/2
Cold drapery
at edge of lava
flow 2–3 days
old
Cold spatter
erupted since
~1630 on 7/17
Molten core
from 15-min-
old stagnant
toe; water
quench
Analysis: XRF Microprobe XRF XRF XRF XRF
SiO2 51.16 51.31 51.15 51.16 51.20 51.26
Al2O3 13.71 13.39 13.67 13.73 13.68 13.82
FeOT 11.25 11.10 11.23 11.17 11.22 11.17
MgO 7.23 6.40 7.39 7.32 7.30 7.07
CaO 11.05 10.64 11.01 11.03 11.02 11.02
Na2O 2.34 2.32 2.31 2.33 2.33 2.36
K2O 0.41 0.429 0.41 0.41 0.41 0.42
TiO2 2.45 2.535 2.43 2.44 2.44 2.48
P2O5 0.23 0.25 0.23 0.23 0.23 0.24
MnO 0.17 0.16 0.17 0.17 0.17 0.17
Cr2O3 — 0.032 — — — —
SO3 — 0.020 — — — —
NiO — 0.004 — — — —
TOTAL (wt %) 100 98.56 100 100 100 100
MgO T (ºC) — 1142.6 — — — —
Notes: Glass temperature for sample KE57-2647F calculated by technique of Helz and Thornber (1987).
2.4.5 Trends in intrusive and eruptive activity
Most published overviews of the prolonged Puʻu ʻŌʻō eruption, such as that in
Chapter 1, tend to lump three decades of eruptive activity into a few paragraphs. In the
interest of brevity, only the most profound changes are noted. This may give the false
impression that the Puʻu ʻŌʻō eruption is largely a “steady-state” eruption. In reality, the
Puʻu ʻŌʻō eruption represents a continuum of changes. Relatively steady conditions,
though rife with small changes, may prevail for months to at most a few years, but the
magmatic system inevitably breaks down. Such large changes commonly culminate in the
transition to a new eruptive vent, or a major reorganization of the lava tube system
43
transporting lava away from the vent. With the benefit of time, trends have begun to
emerge that forecast some of these profound changes.
One such trend—up-rift intrusion with or without eruption, accompanied by crater
floor subsidence and eruptive hiatus—has repeated several times at Puʻu ʻŌʻō. Such
sequences were initiated by the February 7, 1993, intrusion (Okubo et al., 1996; Heliker
et al., 1998); the January 29, 1997, intrusion and eruption (Owen et al., 2000; Thornber et
al., 2003); the September 12, 1999, intrusion (Cervelli et al., 2002); and the June 17,
2007, intrusion and eruption (Poland et al., 2008a; Montgomery-Brown et al., 2010).
Activity resumed within Puʻu ʻŌʻō following each of these events, and crater refilling
eventually culminated in the outbreak of lava from new vents on the flank of the Puʻu
ʻŌʻō cone. The sequences in 1993 and 1999 involved the reoccupation of the previously
active vent and a reorganization of the tube system, while the sequences in 1997 and
2007 (the focus of this report) led to the opening of new vents.
The pattern was repeated in 2011, when an intrusion and brief fissure eruption up-
rift from Puʻu ʻŌʻō started on March 5 (Lundgren et al., 2013; see Chapter 5). The
sequence of events that followed culminated on August 3, 2011, in a large, rapidly
moving breakout on the west flank of the Puʻu ʻŌʻō cone (episode 60) and another
subsidence of the crater floor of Puʻu ʻŌʻō. Recognizing that the pattern of intrusion,
crater subsidence, and refilling could culminate in a major breakout on Puʻu ʻŌʻō allowed
Hawaiian Volcano Observatory scientists to prepare a response well in advance of the
August 3 event. As in July 2007, the crater floor prior to the August 2011 breakout began
to lift bodily via endogenous accumulation, providing a tell-tale sign of the increased
pressure within the Puʻu ʻŌʻō edifice. While not always present (there was no evidence
of such endogenous uplift in 1993, 1997, or 1999), this uplift provides additional
guidance for forecasting changes in activity in some instances.
2.5 Conclusions
In this chapter, I have presented a detailed chronology of the events associated with
the June–July 2007 subsidence and refilling of the Pu‘u ‘Ō‘ō crater on Kīlauea’s East Rift
Zone. Of special note was the transition from the surficial accumulation of lava to uplift
of the crater floor via endogenous processes. The sequence of events in 2007 unfolded in
44
a somewhat predictable fashion, based on Pu‘u ‘Ō‘ō’s previous response to up-rift
intrusions. Recognition of the pattern of East Rift Zone intrusion, followed by crater
subsidence, refilling, and breakout at Puʻu ʻŌʻō, provides guidance when preparing for
future eruption crises that evolve similarly. In fact, the occurrence of another up-rift
intrusion and eruption (episode 59) on March 5, 2011, followed a strikingly similar
pattern, with crater floor subsidence, eventual refilling of the crater evolving into crater
floor uplift, and culmination with the opening of a new vent (episode 60) on the west
flank of Pu‘u ‘Ō‘ō. The lessons learned from episode 57 guided the Hawaiian Volcano
Observatory in responding preemptively to the August 3, 2011, breakout.
45
Chapter 3
A sinuous tumulus over an active lava tube at Kīlauea
Volcano: evolution, analogs, and hazard forecasts
Published as:
Orr, T.R., Bleacher, J.E., Patrick, M.R., and Wooten, K.M., 2015, A sinuous tumulus over
an active lava tube at Kīlauea Volcano: Evolution, analogs, and hazard forecasts.
Journal of Volcanology and Geothermal Research 291(0), 35–48.
3.1 Introduction
Pāhoehoe flow fields emplaced on low-slopes (<~2º) commonly thicken
endogenously via flow inflation (Nichols, 1939; Wentworth and Macdonald, 1953;
Walker, 1991; Chitwood, 1994; Peterson et al., 1994; Hon et al., 1994; Cashman and
Kauahikaua, 1997; Kauahikaua et al., 1998; Self et al., 1998; Anderson et al., 1999;
Anderson et al., 2005; Walker, 2009; Anderson et al., 2012; Hoblitt et al., 2012) and are
usually broad because flow advancement is generally accompanied by considerable flow
widening. As inflation progresses, the upper surface of the flow lifts, and the separation
between individual flow lobes vanishes, forming a molten core of interconnected
pathways within the flow (Hon et al., 1994; Kauahikaua et al., 1998; Self et al., 1998;
Anderson et al., 1999; Schaefer and Kattenhorn, 2004; Anderson et al., 2005; Anderson
et al., 2012; Hoblitt et al., 2012). Inflation broadly affects the entire flow because of this
hydraulic connection. The result is a flat to hummocky flow surface bounded by steep,
rifted margins.
Hummocky flow surfaces are characterized by the presence of tumuli—low, dome-
like mounds, commonly 1–5 m high, but occasionally exceeding 10 m in height (e.g.,
Wentworth and Macdonald, 1953; Walker, 1991; Chitwood, 1994). Most tumuli are
crudely circular to elliptical in map view with deep axial cracks (e.g., Walker, 1991) and
form in response to magmatic overpressure within the flow as the flow’s crust thickens
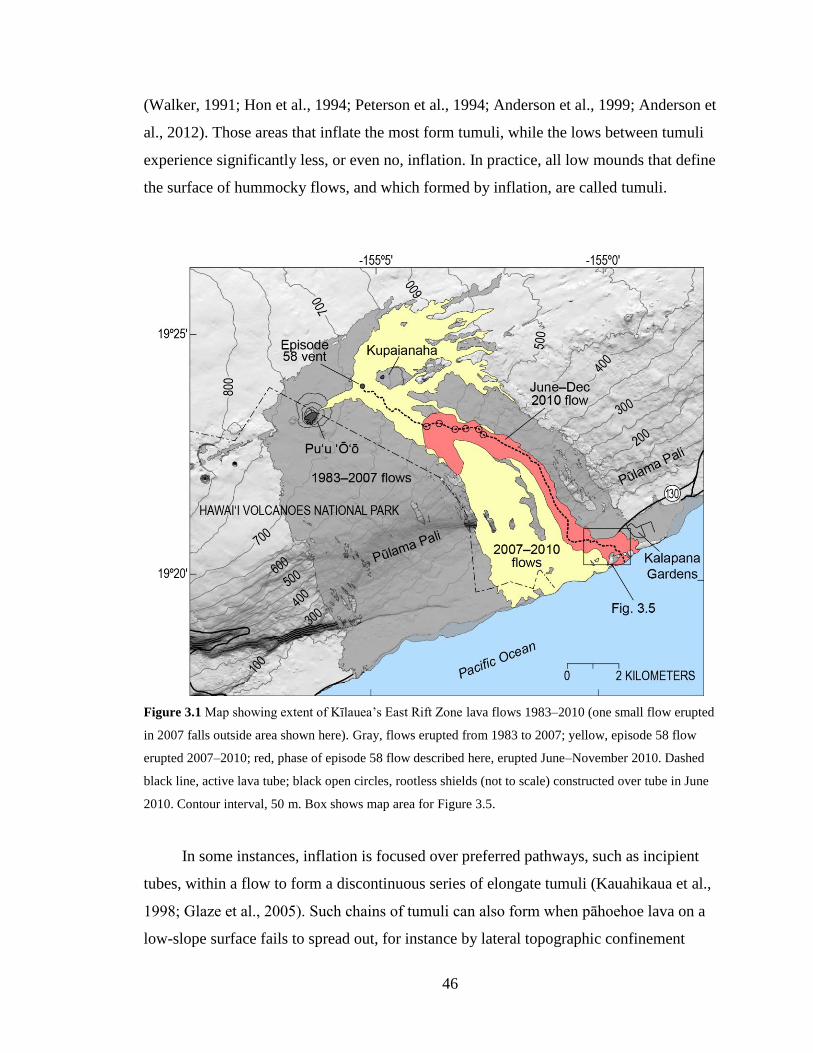
46
(Walker, 1991; Hon et al., 1994; Peterson et al., 1994; Anderson et al., 1999; Anderson et
al., 2012). Those areas that inflate the most form tumuli, while the lows between tumuli
experience significantly less, or even no, inflation. In practice, all low mounds that define
the surface of hummocky flows, and which formed by inflation, are called tumuli.
Figure 3.1 Map showing extent of Kīlauea’s East Rift Zone lava flows 1983–2010 (one small flow erupted
in 2007 falls outside area shown here). Gray, flows erupted from 1983 to 2007; yellow, episode 58 flow
erupted 2007–2010; red, phase of episode 58 flow described here, erupted June–November 2010. Dashed
black line, active lava tube; black open circles, rootless shields (not to scale) constructed over tube in June
2010. Contour interval, 50 m. Box shows map area for Figure 3.5.
In some instances, inflation is focused over preferred pathways, such as incipient
tubes, within a flow to form a discontinuous series of elongate tumuli (Kauahikaua et al.,
1998; Glaze et al., 2005). Such chains of tumuli can also form when pāhoehoe lava on a
low-slope surface fails to spread out, for instance by lateral topographic confinement
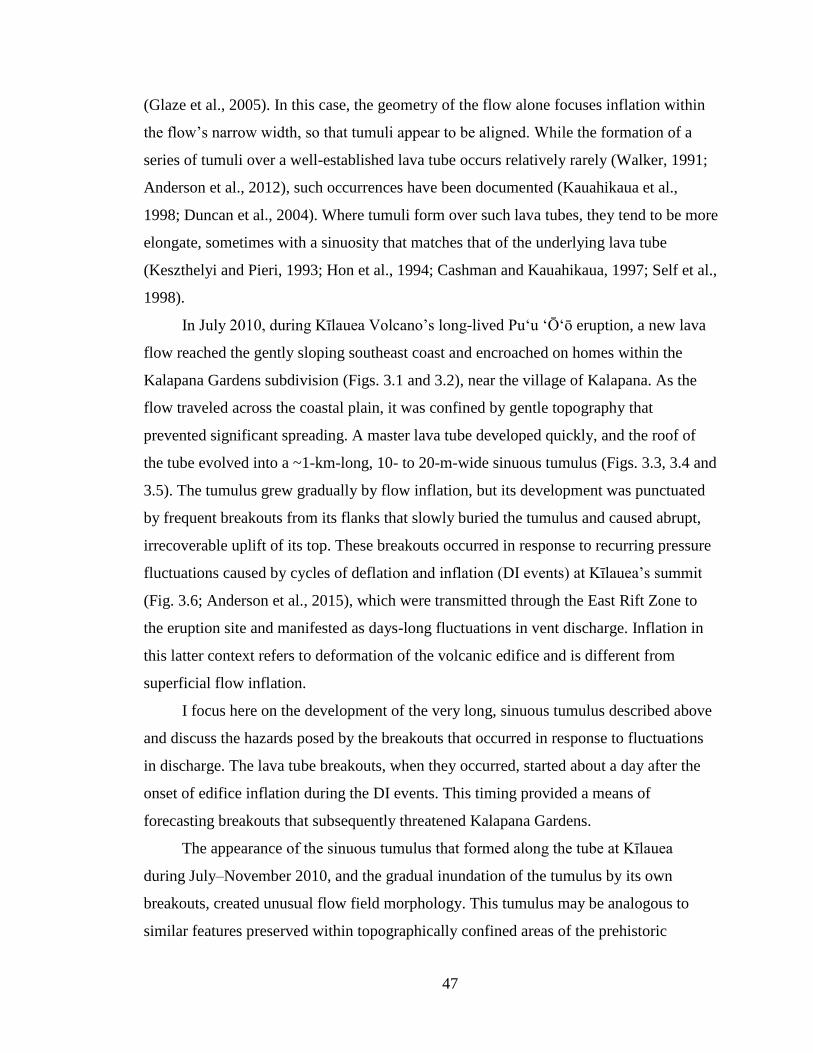
47
(Glaze et al., 2005). In this case, the geometry of the flow alone focuses inflation within
the flow’s narrow width, so that tumuli appear to be aligned. While the formation of a
series of tumuli over a well-established lava tube occurs relatively rarely (Walker, 1991;
Anderson et al., 2012), such occurrences have been documented (Kauahikaua et al.,
1998; Duncan et al., 2004). Where tumuli form over such lava tubes, they tend to be more
elongate, sometimes with a sinuosity that matches that of the underlying lava tube
(Keszthelyi and Pieri, 1993; Hon et al., 1994; Cashman and Kauahikaua, 1997; Self et al.,
1998).
In July 2010, during Kīlauea Volcano’s long-lived Puʻu ʻŌʻō eruption, a new lava
flow reached the gently sloping southeast coast and encroached on homes within the
Kalapana Gardens subdivision (Figs. 3.1 and 3.2), near the village of Kalapana. As the
flow traveled across the coastal plain, it was confined by gentle topography that
prevented significant spreading. A master lava tube developed quickly, and the roof of
the tube evolved into a ~1-km-long, 10- to 20-m-wide sinuous tumulus (Figs. 3.3, 3.4 and
3.5). The tumulus grew gradually by flow inflation, but its development was punctuated
by frequent breakouts from its flanks that slowly buried the tumulus and caused abrupt,
irrecoverable uplift of its top. These breakouts occurred in response to recurring pressure
fluctuations caused by cycles of deflation and inflation (DI events) at Kīlauea’s summit
(Fig. 3.6; Anderson et al., 2015), which were transmitted through the East Rift Zone to
the eruption site and manifested as days-long fluctuations in vent discharge. Inflation in
this latter context refers to deformation of the volcanic edifice and is different from
superficial flow inflation.
I focus here on the development of the very long, sinuous tumulus described above
and discuss the hazards posed by the breakouts that occurred in response to fluctuations
in discharge. The lava tube breakouts, when they occurred, started about a day after the
onset of edifice inflation during the DI events. This timing provided a means of
forecasting breakouts that subsequently threatened Kalapana Gardens.
The appearance of the sinuous tumulus that formed along the tube at Kīlauea
during July–November 2010, and the gradual inundation of the tumulus by its own
breakouts, created unusual flow field morphology. This tumulus may be analogous to
similar features preserved within topographically confined areas of the prehistoric
48
McCartys and Carrizozo flow fields (New Mexico, USA), as well as in the Tharsis
volcanic province of Mars. Understanding how the inflated lava tube formed provides
constraints on emplacement conditions in these other environments.
Figure 3.2 Aerial photographs with infrared overlays showing flow advancement across coastal plain.
Warmer colors indicate higher temperatures; areas of bright yellow to white, active or very recently active
flows. (a) Abrupt eastward turn in flow direction at base of Pūlama Pali on July 14, 2010. White dotted
line, active flow margin. Flow surface at lower left with mottled violet coloration, previously emplaced
episode 58 flows. Dashed white line, trace of lava tube formed later. (b) Flow butted against Hākuma horst
and filling in adjacent graben on July 23, 2010. White dotted line, active flow margin. White arrow, study
area at narrow part of flow. White circles, houses labeled in Fig. 3.7a. House 1 destroyed July 25.
49
3.2 Eruption monitoring methods
3.2.1 Flow field mapping
Lava flow hazard assessments were conducted on almost a daily basis during the
study period because of the proximity of lava flows to Kalapana Gardens. The margins of
the active flows were mapped simply by walking around each flow while recording a
track log with a handheld Global Positioning System (GPS) device. While time-
consuming, this gave us a simple way to measure flow progress and to gauge other flow
properties such as vigor, flow inflation, and potential flow paths. The flow’s advance rate
was very slow and therefore of little immediate concern. The initial western edge of the
flow as it advanced across the coastal plain was not mapped on the ground due to time
constraints, nor was most of the perimeter of the August 2, 2010, breakout, which is
described below. The flow edges in these cases were approximated from oblique aerial
photographs taken during weekly helicopter observation flights. The mapping was
compiled using ESRI® ArcGIS software. Updated flow maps, accompanied by a
descriptive hazard assessment, were then transmitted via email to Hawaiʻi County Civil
Defense (HCCD; the agency charged with disaster preparedness and response in Hawaiʻi)
on a near-daily basis. More immediate hazards-related concerns, when present, were
transmitted directly to the HCCD administrator via text message.
3.2.2 Webcams and time-lapse cameras
Webcams and time-lapse cameras have long played a role at Kīlauea and are now
among the standard tools used by many groups, including the United States Geological
Survey’s Hawaiian Volcano Observatory (HVO), to monitor and study eruptive activity
(e.g., Thornber, 1997; Poland et al., 2008b; Paskievitch et al., 2010; Orr, 2011). During
the activity described here, two webcams provided images (1296 × 960 pixels) of the
coastal flow field in real-time. Both were Stardot®
Netcam SC webcams which
transmitted images via the Verizon®
cell phone network using an Airlink® Raven XE
cellular modem. One camera was positioned on the second-floor patio of a house in
Kalapana Gardens roughly 1.6 km from the sinuous tumulus. It operated almost
continuously starting on September 18, 2010, and archived an image at HVO
50
automatically every 30 minutes. The other webcam was positioned on Pūlama Pali, the
300-m-high slope overlooking the coastal flow field near Kalapana Gardens (Pūlama Pali
is the common-usage name for this prominent slope, for which an official name has not
been designated by the United States Board on Geographic Names), roughly 1.1 km from
the sinuous tumulus. It began operation on November 9, 2010, and an image was
archived at HVO every 5 minutes. The webcams were programmed to automatically
switch to a near-IR mode in low-light conditions. The images produced by the webcams
were useful in determining the onset times of many of the breakouts, particularly those
that occurred at night when the near-IR mode was functioning.
As many as six time-lapse cameras were deployed simultaneously along the crest
of the sinuous tumulus, or adjacent to it, during the study period, specifically to document
the evolution of the tumulus described in this paper. The cameras were of two types—
low-cost Wingscapes® time-lapse cameras mounted on inexpensive tripods and more
robust (and expensive) systems custom built at HVO (Orr and Hoblitt, 2008) and
mounted on heavy surveying tripods. The built-in light sensor on the Wingscapes®
cameras, meant to turn the cameras off at night, was removed to allow continuous
photography. The time-lapse images from both system types provided start times for
some breakouts and offered a unique look at tube-roof uplift in a few instances. Both
systems recorded images only on-site, requiring frequent visits to exchange camera
memory cards. The Wingscapes® cameras required regular exchange of internal batteries;
the batteries for the HVO-constructed cameras were charged via a small solar panel.
Image sizes varied from 1600 × 1200 to 3264 × 2448 pixels, depending on deployment.
3.3 Tumulus geometry measurements
3.3.1 Digital Elevation Models
Accurate topographic measurements of the sinuous tumulus, such as by using
kinematic GPS, were not made during the tumulus’s development due to insufficient field
time. However, a Digital Elevation Model (DEM) of the distal part of the tumulus was
created well after emplacement from oblique aerial photographs using the Agisoft®
Photoscan Professional software package. The aerial photographs were captured from
51
helicopter in July 2014 with a Canon® EOS 60D digital SLR camera (18 megapixel
image resolution). Photo registration is based on targets (white crosses) visible within the
photographs and located by kinematic GPS (vertical and horizontal accuracy empirically
determined to be ~5 cm). Target heights were transformed from ellipsoidal coordinates to
orthometric coordinates using the National Geodetic Survey GEOID12a model. The
horizontal and vertical accuracy of the resulting DEM is estimated at 10 cm.
The pre-eruption surface was taken from a June 2006 Federal Emergency
Management Agency (FEMA) coastal LiDAR survey with a horizontal accuracy of 30
cm and a vertical accuracy of 14 cm. The LiDAR data were transformed into a DEM
using ESRI®
ArcGIS 10.1, which was also used to perform DEM calculations and
differencing between pre- and post-emplacement surfaces.
3.3.2 Crack and tumulus measurements
The width and depth of the axial (or dominant) crack on or near the crest of the
sinuous tumulus were measured using a metal carpenter’s tape at 20 locations along the
part of the tumulus still exposed in 2014. The crack width was measured between
piercing points; the crack depth that was measured is a minimum because the metal tab at
the end of the tape prevented full insertion into the crack, as did roughness and rubble at
the base of the crack. ESRI® ArcGIS 10.1 was used to measure the width of the tumulus
at each location from a rectified aerial image mosaic created using Agisoft®
Photoscan
Professional.
3.4 Description of eruptive activity
This study focuses on the eruptive activity that occurred from June to November
2010, while the episode 58 vent was active.
3.4.1 June–July 2010 eruptive activity
The lava tube transporting lava from the episode 58 vent to the Pacific Ocean
ruptured at an elevation of ~600 m in early June 2010, and the new breakout captured the
entire East Rift Zone eruptive output (Fig. 3.1). At first, the surface flow advanced slowly
52
across gently sloping (2–3º) terrain near the breakout point, sequentially constructing six
low rootless shields over the developing lava tube.
The front of the lava flow reached the upper slope of Pūlama Pali in early July, at
the eastern end of the Hilina fault system that cuts Kīlauea’s southeastern flank.
Following the eastern margin of older episode 58 lava flows, the active flow gained speed
and began traveling southward down the ~6º slope of Pūlama Pali. As it neared the base
of the slope, the flow split into two branches—a more rapid western branch and a slower,
broader eastern branch (Fig. 3.2). The western branch reached the base of the slope at an
elevation of ~40 m on July 14. Blocked by older, inflated episode 58 flows to the south,
the active flow turned sharply to the east, seeking the easiest path across the gently
sloping (<2º) coastal plain (Fig. 3.2).
Traveling 400–500 m day-1
, the western branch of the flow advanced in a sheet-like
fashion following the margin of an inflated flow (generally less than 2 m high) emplaced
a few months earlier (Fig. 3.2a). The northern side of the advancing flow abutted a gentle
slope (≤1º) with mostly small-scale (<1 m-high) flow features. Confined by low
topography on both sides, the flow remained narrow (Fig. 3.2), rarely exceeding a width
of 80 m. In a few places the entire flow was less than 30 m across. The flow thickness
after its initial emplacement was ~1 m but locally may have been as much as 2 m along
its axis. Assuming an average thickness of 1 m and the area of the coastal flow as mapped
each day, a bulk discharge of ~0.6 m3 s
-1 is derived for the advancing lobe. The average
void space fraction for the upper meter of the flow was measured after emplacement at
40%, which yields a dense rock equivalent (DRE) discharge that rounds to 0.4 m3 s
-1.
This is an order of magnitude less than Kīlauea’s long-term East Rift Zone DRE
discharge of ~4 m3 s
-1 (converted from ~0.13 km
3 yr
-1; Sutton et al., 2003). Based on field
observations, the discharge of the eastern branch appeared to be comparable to (or
slightly less than) that of the western branch. Together, the eastern and western flow
branches constituted the entire output from the episode 58 vent—the only active vent.
This calculation implies that the East Rift Zone eruptive output at that time was ~1 m3 s
-1,
or roughly a quarter of the long-term rate.
On July 17, the flow reached a low (~6-m-high), south-facing embankment, on the
southern side of State Highway 130 (Fig. 3.2), and spilled down into a shallow graben
53
bounded to the south by the Hākuma horst. The flow moved slowly eastward, filling the
graben and destroying one home while threatening others in Kalapana Gardens. This
same subdivision was inundated previously by lava in 1990 (Mattox et al., 1993), and
about 30 houses had since been built—or rebuilt—upon the 1990 lava flows. On July 25,
lava topped the Hākuma horst and flowed into the ocean. The flow’s eastward
advancement stopped within a few days, having reached within ~50 m of two other
homes.
The volume of lava accumulated within the graben between July 17 and July 25 is
derived by subtracting the underlying topography from the new flow surface, assumed to
form a level plain with an elevation of 15 m (the elevation of the Hākuma horst at the
point where it was topped). Flows emplaced outside the bounds of the graben during this
period were assumed to have a thickness of 1 m, based on field observations, and a time
span of 192 hours was used (mapping was completed on both days at about 1100 HST).
Using these values yields a bulk discharge of ~0.7 m3 s
-1 and a DRE discharge that
rounds to 0.4 m3 s
-1, consistent with our earlier calculation.
A relatively well-developed lava tube had formed as early as July 26, establishing a
subsurface connection between the episode 58 vent and the Pacific Ocean (Fig. 3.1). Part
of the tube’s path, extending ~1.5 km from the buried trace of Highway 130 to the base
of Pūlama Pali, was well expressed by a distinct line of fume easily followed on the
ground. The lava tube approximately followed the centerline of the flow and crudely
traced the shape of the older underlying episode 58 flow margin through much of this
zone. Over the following ~10 days, lava from the eastern flow branch crossed and buried
most of the lava tube within ~0.5 km of the base of the slope.
3.4.2 Sinuous tumulus formation and morphology
By late August 2010, the lava tube roof had begun to arch up in response to flow
inflation. This formed a 1-km-long tumulus with a pronounced sinuosity (Fig. 3.3). The
tumulus was a single continuous feature, not a series of adjacent or overlapping tumuli.
Where the lava flow was very narrow, nearly its entire width was involved in the
inflation, and in a few places one edge of the tumulus coincided with the edge of the
flow. In one location, buried early in the study period, patches of the older flow ~20 m

54
apart bounded both sides of the tumulus, showing that the entire width of the flow at that
location had evolved into the tumulus.
Figure 3.3 Photographs of sinuous tumulus in study area. (a) October 19, 2010, photograph showing
distant perspective of sinuous tumulus. Dashed white line, lava tube trace; arrowhead denotes flow
direction. Partly transparent white line, buried trace of Highway 130. White boxes, approximate area of
coverage of 3.3b and 3.4b. Dark lava surface along and adjacent to tube trace is early-formed lava surface
emplaced July 2010. Lighter-colored lava surfaces are younger tube breakouts. (b) October 14, 2010,
photograph of sinuous tumulus. Dashed white line, approximate trace of lava tube beyond ends of
pronounced tumulus. Four recent breakouts prior to October 14 labeled. White box, approximate coverage
area of 3.3c and d,and 3.4a and c. (c) August 23, 2010, photograph and (d) November 16, 2010, photograph
demonstrating inflation and tumulus uplift. White arrows mark matching point in (c) and (d).
The tumulus was covered by a network of cracks (the most pronounced sub-parallel
to the trend of the tumulus) that appeared to have largely evolved from early-formed
cooling joints (Figs. 3.3, 3.4 and 3.5; Peck and Minakami, 1968; Hon et al., 1994; Rossi
and Gudmundsson, 1996; Schaefer and Kattenhorn, 2004). As a result, the axial crack
was not simply a single linear feature, but instead jogged sharply along its trend,
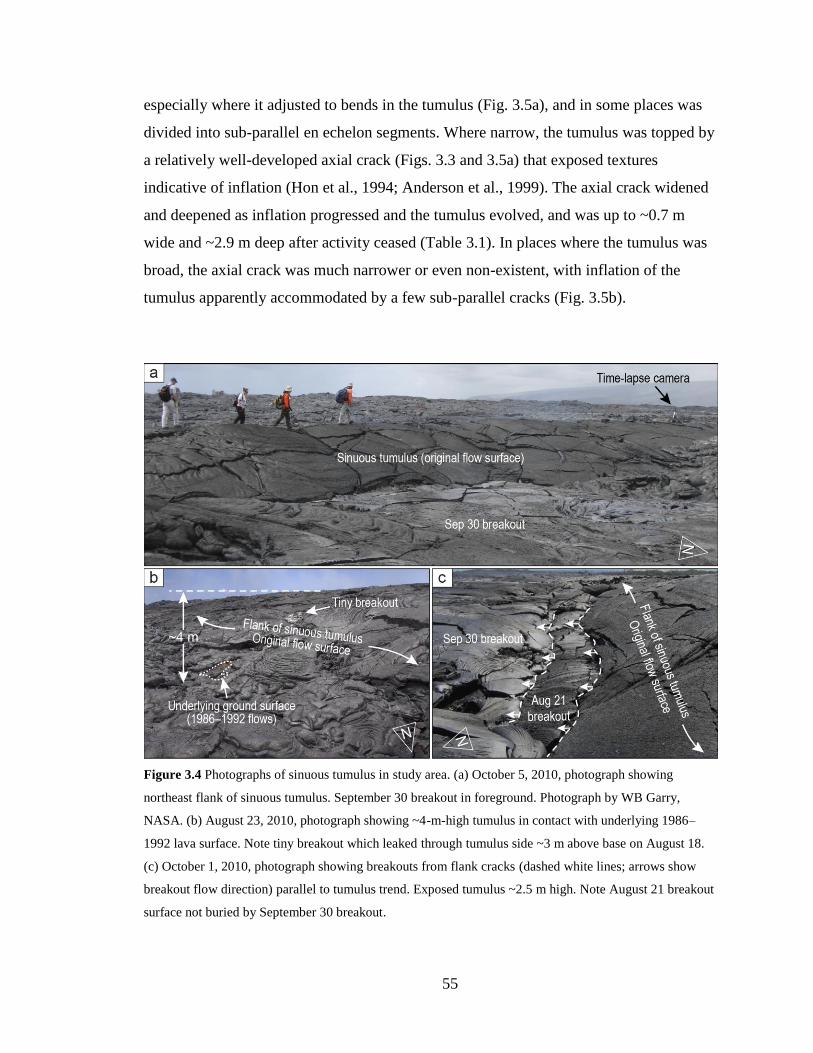
55
especially where it adjusted to bends in the tumulus (Fig. 3.5a), and in some places was
divided into sub-parallel en echelon segments. Where narrow, the tumulus was topped by
a relatively well-developed axial crack (Figs. 3.3 and 3.5a) that exposed textures
indicative of inflation (Hon et al., 1994; Anderson et al., 1999). The axial crack widened
and deepened as inflation progressed and the tumulus evolved, and was up to ~0.7 m
wide and ~2.9 m deep after activity ceased (Table 3.1). In places where the tumulus was
broad, the axial crack was much narrower or even non-existent, with inflation of the
tumulus apparently accommodated by a few sub-parallel cracks (Fig. 3.5b).
Figure 3.4 Photographs of sinuous tumulus in study area. (a) October 5, 2010, photograph showing
northeast flank of sinuous tumulus. September 30 breakout in foreground. Photograph by WB Garry,
NASA. (b) August 23, 2010, photograph showing ~4-m-high tumulus in contact with underlying 1986–
1992 lava surface. Note tiny breakout which leaked through tumulus side ~3 m above base on August 18.
(c) October 1, 2010, photograph showing breakouts from flank cracks (dashed white lines; arrows show
breakout flow direction) parallel to tumulus trend. Exposed tumulus ~2.5 m high. Note August 21 breakout
surface not buried by September 30 breakout.

56
The flanks of the tumulus expressed no significant inflation rifts as is seen on the
sides of inflated sheet flows (Hon et al., 1994; Hoblitt et al., 2012). However, long cracks
with minor vertical offset formed along the lower flanks of the tumulus in response to
local breakouts. There was also no apparent vertical asymmetry in the growth history of
the two flanks of the tumulus anywhere along its length (Anderson et al., 2012), nor did
the axial crack contain lava squeeze-ups, as is often seen on other tumuli (Walker, 1991;
Duraiswami et al., 2001; Anderson et al., 2012). The upslope end of the sinuous tumulus
was buried early on by other flows, and the tumulus there emerged from beneath this
younger cover, indicating that it extended farther upslope. Indeed, short sections of the
tumulus farther upslope were visible through holes within this younger cover up to the
base of Pūlama Pali. The terminus of the tumulus, roughly coincident with the buried
trace of Highway 130, sloped down and merged with the surrounding flow surface in a
fashion typical for tumuli (Walker, 1991; Rossi and Gudmundsson, 1996).
The tumulus stood up to ~4 m above the surrounding lava surface. This was,
however, an apparent height because the flanks of the tumulus were partly inundated by
breakouts from the tumulus itself (described below). Differencing of the pre- and post-
emplacement surfaces show that the sinuous tumulus had a maximum height of nearly 8
m (Table 3.1).
3.4.3 DI events and breakouts: August–November 2010
During 2010, cycles of deflation and inflation (DI events) at Kīlauea’s summit (Fig.
3.6; Cervelli and Miklius, 2003; Poland et al., 2011), recorded across the summit tiltmeter
network, deformed the edifice and caused variations in discharge from the episode 58
vent. Generally, within a few hours of the onset of summit deflation, a
tiltmeter on the north flank of Pu‘u ‘Ō‘ō likewise recorded the onset of deflation. This
was followed, over the next day, by a decline in the abundance and vigor of surface flows
as well as a pronounced diminution in the steam plume created by lava entering the
ocean. These decreases in flow field activity were observed repeatedly, and reductions in
discharge are inferred to have accompanied all DI events.
Deflation at Kīlauea’s summit switched invariably to rapid inflation, usually within
a day or two (Fig. 3.6). After a few hours, Pu‘u ‘Ō‘ō likewise began to inflate, and

57
discharge from the episode 58 vent increased soon after that. In most cases, recovery of
the magmatic system resulted in a surge in output from the vent, which commonly
resulted in short-lived breakouts from points along the lava tube between the top of the
Pūlama Pali and the ocean, where the carrying capacity of the tube was exceeded. In
some instances, the delay between the onset of the inflation phase of a DI event and its
related breakout was such that, by the time the breakout started, the deflation phase of the
next DI event had already begun.
Figure 3.5 Rectified aerial image mosaics showing part of sinuous tumulus and related breakouts.Tumulus
outlined with dotted yellow lines; contact between breakouts demarkated by dashed yellow lines (labeled
with start date in 2010). Numbered locations correspond to measurements recorded in Table 3.1. Flow
direction in tube from left to right and (a) is immediately upstream from (b).
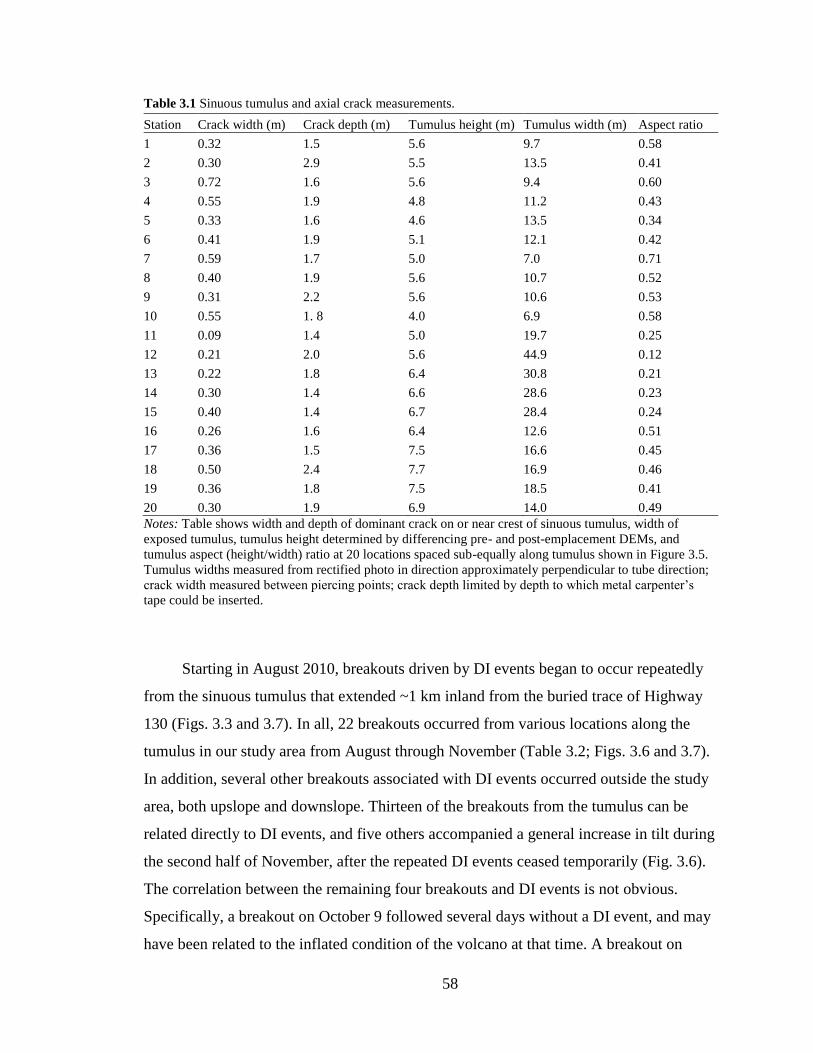
58
Table 3.1 Sinuous tumulus and axial crack measurements.
Station Crack width (m) Crack depth (m) Tumulus height (m) Tumulus width (m) Aspect ratio
1 0.32 1.5 5.6 9.7 0.58
2 0.30 2.9 5.5 13.5 0.41
3 0.72 1.6 5.6 9.4 0.60
4 0.55 1.9 4.8 11.2 0.43
5 0.33 1.6 4.6 13.5 0.34
6 0.41 1.9 5.1 12.1 0.42
7 0.59 1.7 5.0 7.0 0.71
8 0.40 1.9 5.6 10.7 0.52
9 0.31 2.2 5.6 10.6 0.53
10 0.55 1. 8 4.0 6.9 0.58
11 0.09 1.4 5.0 19.7 0.25
12 0.21 2.0 5.6 44.9 0.12
13 0.22 1.8 6.4 30.8 0.21
14 0.30 1.4 6.6 28.6 0.23
15 0.40 1.4 6.7 28.4 0.24
16 0.26 1.6 6.4 12.6 0.51
17 0.36 1.5 7.5 16.6 0.45
18 0.50 2.4 7.7 16.9 0.46
19 0.36 1.8 7.5 18.5 0.41
20 0.30 1.9 6.9 14.0 0.49
Notes: Table shows width and depth of dominant crack on or near crest of sinuous tumulus, width of
exposed tumulus, tumulus height determined by differencing pre- and post-emplacement DEMs, and
tumulus aspect (height/width) ratio at 20 locations spaced sub-equally along tumulus shown in Figure 3.5.
Tumulus widths measured from rectified photo in direction approximately perpendicular to tube direction;
crack width measured between piercing points; crack depth limited by depth to which metal carpenter’s
tape could be inserted.
Starting in August 2010, breakouts driven by DI events began to occur repeatedly
from the sinuous tumulus that extended ~1 km inland from the buried trace of Highway
130 (Figs. 3.3 and 3.7). In all, 22 breakouts occurred from various locations along the
tumulus in our study area from August through November (Table 3.2; Figs. 3.6 and 3.7).
In addition, several other breakouts associated with DI events occurred outside the study
area, both upslope and downslope. Thirteen of the breakouts from the tumulus can be
related directly to DI events, and five others accompanied a general increase in tilt during
the second half of November, after the repeated DI events ceased temporarily (Fig. 3.6).
The correlation between the remaining four breakouts and DI events is not obvious.
Specifically, a breakout on October 9 followed several days without a DI event, and may
have been related to the inflated condition of the volcano at that time. A breakout on

59
October 12 began just a few hours after the start of the inflation phase of a DI event, but
it may have been related to the earlier inflated condition of the volcano to which the
October 9 breakout possibly responded. Two breakouts occurred several hours apart on
October 15. Though both were probably related to the same DI event, the 17-hour delay
between them makes the relation ambiguous. For this reason, only the earlier breakout is
counted as being related to a DI event. Finally, a breakout on October 31 occurred just
before the trough of a DI event. Because of the nearly 2-day delay between the onset of
the previous inflation and the start of the breakout, the cause of the breakout is uncertain
and it is not counted as being related to a DI event.
Figure 3.6 Graph showing onset times for sinuous tumulus breakouts compared to summit tilt. Red lines,
breakout onset; black line, tilt recorded by UWE tiltmeter; gray boxes, approximate breakout durations
(darker gray shows where boxes overlap, indicating multiple active breakouts).
Several of the breakouts were composed of multiple breakout points along the
length of the sinuous tumulus and from both flanks (e.g., August 21 breakout; Fig. 3.7a).
Many of these additional breakouts were small (hundreds of square meters or smaller),
and all the individual breakouts associated with a particular event are grouped together.
The areas of coverage shown in Table 3.2 reflect this. We suspected, but were not able to
confirm directly that, during instances when there were multiple breakout points from the
sinuous tumulus during a single event, the breakout point farthest upslope occurred first,
suggesting a pulse of lava traveling through the tube and causing breakouts progressively
downslope as the pulse advanced. This was certainly the case in a broader sense, with
breakouts upslope, on Pūlama Pali, starting before breakouts on the coastal plain. That
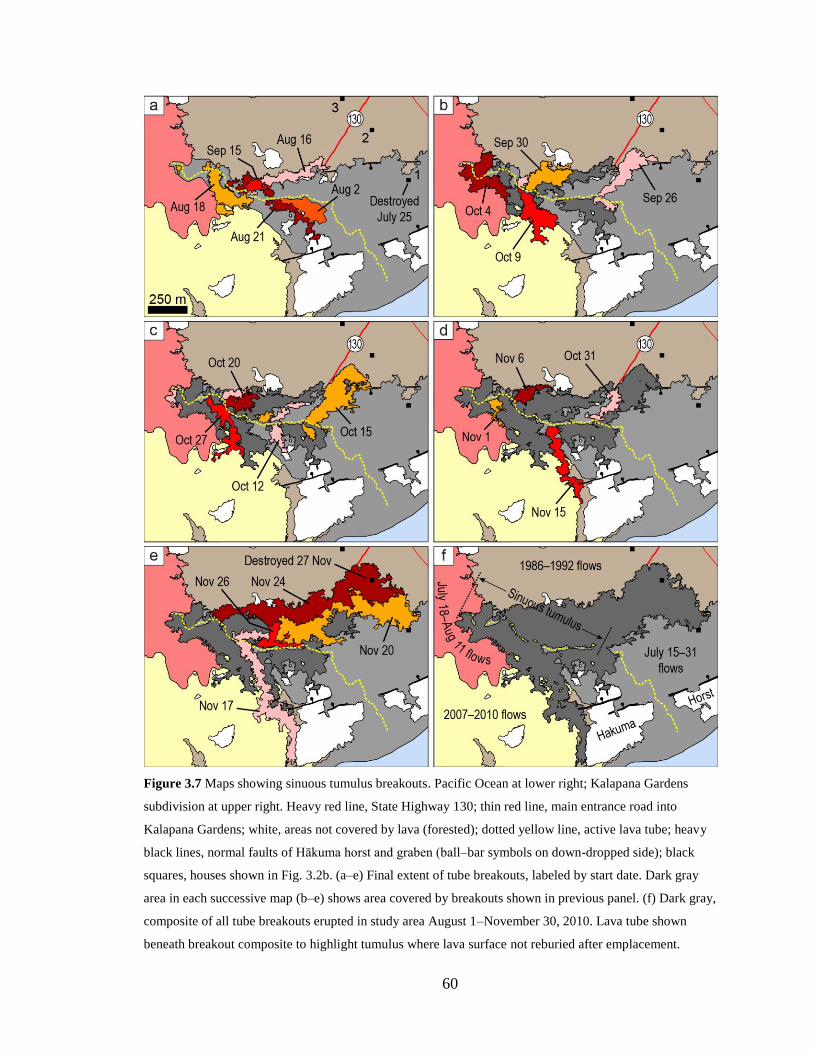
60
Figure 3.7 Maps showing sinuous tumulus breakouts. Pacific Ocean at lower right; Kalapana Gardens
subdivision at upper right. Heavy red line, State Highway 130; thin red line, main entrance road into
Kalapana Gardens; white, areas not covered by lava (forested); dotted yellow line, active lava tube; heavy
black lines, normal faults of Hākuma horst and graben (ball–bar symbols on down-dropped side); black
squares, houses shown in Fig. 3.2b. (a–e) Final extent of tube breakouts, labeled by start date. Dark gray
area in each successive map (b–e) shows area covered by breakouts shown in previous panel. (f) Dark gray,
composite of all tube breakouts erupted in study area August 1–November 30, 2010. Lava tube shown
beneath breakout composite to highlight tumulus where lava surface not reburied after emplacement.
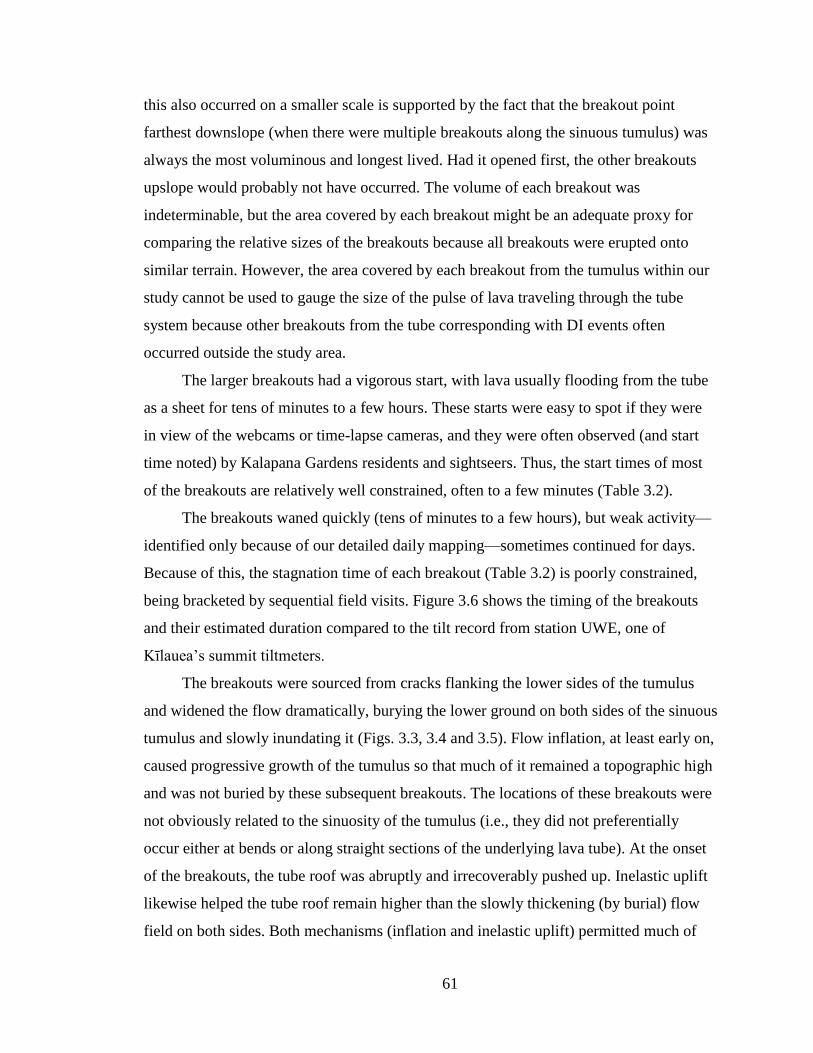
61
this also occurred on a smaller scale is supported by the fact that the breakout point
farthest downslope (when there were multiple breakouts along the sinuous tumulus) was
always the most voluminous and longest lived. Had it opened first, the other breakouts
upslope would probably not have occurred. The volume of each breakout was
indeterminable, but the area covered by each breakout might be an adequate proxy for
comparing the relative sizes of the breakouts because all breakouts were erupted onto
similar terrain. However, the area covered by each breakout from the tumulus within our
study cannot be used to gauge the size of the pulse of lava traveling through the tube
system because other breakouts from the tube corresponding with DI events often
occurred outside the study area.
The larger breakouts had a vigorous start, with lava usually flooding from the tube
as a sheet for tens of minutes to a few hours. These starts were easy to spot if they were
in view of the webcams or time-lapse cameras, and they were often observed (and start
time noted) by Kalapana Gardens residents and sightseers. Thus, the start times of most
of the breakouts are relatively well constrained, often to a few minutes (Table 3.2).
The breakouts waned quickly (tens of minutes to a few hours), but weak activity—
identified only because of our detailed daily mapping—sometimes continued for days.
Because of this, the stagnation time of each breakout (Table 3.2) is poorly constrained,
being bracketed by sequential field visits. Figure 3.6 shows the timing of the breakouts
and their estimated duration compared to the tilt record from station UWE, one of
Kīlauea’s summit tiltmeters.
The breakouts were sourced from cracks flanking the lower sides of the tumulus
and widened the flow dramatically, burying the lower ground on both sides of the sinuous
tumulus and slowly inundating it (Figs. 3.3, 3.4 and 3.5). Flow inflation, at least early on,
caused progressive growth of the tumulus so that much of it remained a topographic high
and was not buried by these subsequent breakouts. The locations of these breakouts were
not obviously related to the sinuosity of the tumulus (i.e., they did not preferentially
occur either at bends or along straight sections of the underlying lava tube). At the onset
of the breakouts, the tube roof was abruptly and irrecoverably pushed up. Inelastic uplift
likewise helped the tube roof remain higher than the slowly thickening (by burial) flow
field on both sides. Both mechanisms (inflation and inelastic uplift) permitted much of

62
Table 3.2 Timing and area of sinuous tumulus breakouts.
No. Start Date/Time End Date/Time (Bracketed) Area (km2) DI Event Inflation Start Delay (h)
1 Aug 2, 0200 (±4 hr) Aug 4, ~1330 – Aug 5, ~1030 0.028 Aug 1, 1004 15.9
2 Aug 16, 0300 (±15 min) Aug 17, ~2000 – Aug 18, ~1000 0.033 Aug 14, 2248 28.2
3 Aug 18, 0300 (±5 hr) Aug 18, ~1000 – Aug 19, ~1000 0.037 Aug 16, 1112 39.8
4 Aug 21, 1500 (±3 hr) Aug 22, 1000 – Aug 23, 1045 0.028 Aug 20, 1014 28.8
5 Sep 15, 1800 (±6 hr) Sep 15, Night – Sep 16, Morning 0.009 Sep 14, 1814 23.8
6 Sep 26, 0445 (±5 min) Sep 28, 1200 – Sep 28, 2000 0.043 Sep 25, 0844 20.0
7 Sep 30, 1430 (±1 hr) Oct 4, 1200 – Oct 5, 1030 0.030 Sep 28, 1356 24.6
8 Oct 4, 1600 (±2.5 hr) Oct 10, 1330 – Oct 11, 1100 0.039 Oct 3,1508 24.9
9 Oct 9, 1040 (±5 min) Oct 11, 1400 – Oct 13, 1000 0.035 (no related DI event) —
10 Oct 12, 0215 (±5 min) Oct 13, 1200 – Oct 15, 1030 0.036 (uncertain relation) —
11 Oct 15, 0045 (±5 min) Oct 15, 1250 – Oct 16, 0830 0.004 Oct 14, 0553 18.9
12 Oct 15, 1740 (±30 min) Oct 19, 1130 – Oct 20, 1300 0.066 (uncertain relation) —
13 Oct 20, 1033 (±2 min) Oct 21, 1530 – Oct 22, 1145 0.016 Oct 19, 1851 15.7
14 Oct 27, 0007 (±2 min) Oct 28, 1100 – Oct 29, 1330 0.027 Oct 25, 2214 25.9
15 Oct 31, 1435 (±15 min) Nov 1, 1400 – Nov 2, 1100 0.016 (uncertain relation) —
16 Nov 1, 1839 (±2 min) Nov 2, 1300 – Nov 2, 1800 0.007 Oct 31, 1810 24.5
17 Nov 6, 1646 (±5 min) Nov 8, 0550 – Nov 8, 1800 0.013 Nov 5, 2053 19.9
18 Nov 15, 1314 (±2 min) Nov 18, 1115 – Nov 19, 1030 0.028 (no related DI event) —
19 Nov 17, 0555 (±1 min) Nov 25, 1030 – Nov 27, 0930 0.076 (no related DI event) —
20 Nov 20, 0458 (±1 min) Nov 29, 1530 – Nov 30, 1000 0.162 (no related DI event) —
21 Nov 24, 1642 (±2 min) Nov 29, 1530 – Nov 30, 1000 0.143 (no related DI event) —
22 Nov 26, 2018 (±1 min) Nov 28, 1515 – Nov 29, 1000 0.017 (no related DI event) —
Notes: Tables shows start date and time for each sinuous tumulus breakout (precision in parentheses), dates and times that bracketed end time of breakouts, and
final area of breakouts. Date and time also shown for onset of summit inflation for DI events associated with breakouts, except where noted. Final column shows
delay between onset of summit inflation and onset of breakouts, where applicable.
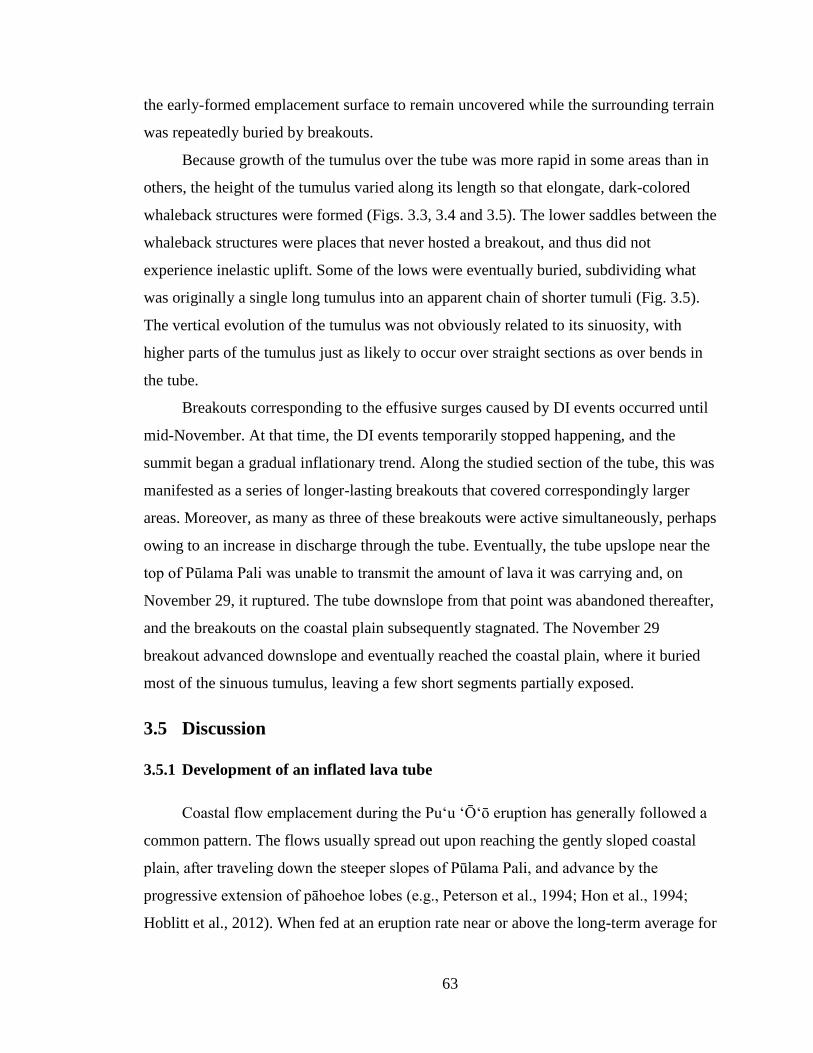
63
the early-formed emplacement surface to remain uncovered while the surrounding terrain
was repeatedly buried by breakouts.
Because growth of the tumulus over the tube was more rapid in some areas than in
others, the height of the tumulus varied along its length so that elongate, dark-colored
whaleback structures were formed (Figs. 3.3, 3.4 and 3.5). The lower saddles between the
whaleback structures were places that never hosted a breakout, and thus did not
experience inelastic uplift. Some of the lows were eventually buried, subdividing what
was originally a single long tumulus into an apparent chain of shorter tumuli (Fig. 3.5).
The vertical evolution of the tumulus was not obviously related to its sinuosity, with
higher parts of the tumulus just as likely to occur over straight sections as over bends in
the tube.
Breakouts corresponding to the effusive surges caused by DI events occurred until
mid-November. At that time, the DI events temporarily stopped happening, and the
summit began a gradual inflationary trend. Along the studied section of the tube, this was
manifested as a series of longer-lasting breakouts that covered correspondingly larger
areas. Moreover, as many as three of these breakouts were active simultaneously, perhaps
owing to an increase in discharge through the tube. Eventually, the tube upslope near the
top of Pūlama Pali was unable to transmit the amount of lava it was carrying and, on
November 29, it ruptured. The tube downslope from that point was abandoned thereafter,
and the breakouts on the coastal plain subsequently stagnated. The November 29
breakout advanced downslope and eventually reached the coastal plain, where it buried
most of the sinuous tumulus, leaving a few short segments partially exposed.
3.5 Discussion
3.5.1 Development of an inflated lava tube
Coastal flow emplacement during the Puʻu ʻŌʻō eruption has generally followed a
common pattern. The flows usually spread out upon reaching the gently sloped coastal
plain, after traveling down the steeper slopes of Pūlama Pali, and advance by the
progressive extension of pāhoehoe lobes (e.g., Peterson et al., 1994; Hon et al., 1994;
Hoblitt et al., 2012). When fed at an eruption rate near or above the long-term average for
64
the Puʻu ʻŌʻō eruption, it usually takes one to three weeks for the leading tip of a flow to
cross the coastal plain. Significant flow thickening via inflation and overplating occurs
during this advance. On the other hand, when a flow is fed at an eruption rate well below
the long-term average, or when a flow near or above the average rate is subdivided into
smaller branches, the lava may stall on the hummocky surface of the coastal plain and
make little forward progress. In such situations, it may take months before lava
completely crosses the coastal plain, if it does so at all. In either case, once a flow tops
the sea cliff, the inflating flow probably experiences a sudden drop in fluid pressure.
Thereafter, the fluid core of the flow inland of the sea cliff chills quickly as lava is
focused preferentially into the most energy efficient pathway between the base of Pūlama
Pali and the ocean. Flow inflation and lateral spreading slow and stop, usually within a
day or two, and a well-developed lava tube forms quickly.
The flow studied during July–November 2010 evolved in a slightly different
fashion, in that it was easily confined by low topography because of its low discharge. As
a result, the flow failed to spread out and crossed the coastal plain quickly despite its
relatively low flux. Little inflation occurred before the flow poured over the low
embankment on the south side of Highway 130. This embankment provided the same sort
of topographic break that the sea cliff affords in other circumstances. Because of the
inferred drop in fluid pressure, lava beneath the surface crust of the flow upslope from
Highway 130 became concentrated along the thickest part of the flow. Thus, flow
advance and lava tube formation occurred more rapidly than is typical for low discharge
flows at Kīlauea and did not involve significant lateral spreading. Initial inflation across
the entire width of the flow was minimal, and the flow failed to resurface itself as it
usually does during flow emplacement through pāhoehoe lobe extension (Peterson et al.,
1994). Morphologically, the flow had a relatively flat surface characteristic of sheet flows
(Hon et al., 1994). The section of the lava tube between the base of Pūlama Pali and the
Highway 130 embankment was, in a sense, isolated, and it evolved somewhat
independently from other parts of the tube.
The inflation that occurred subsequently was focused along the axis of the incipient
lava tube, which, when it began to form, was correspondingly thinner than the total
thickness of the flow and probably had a wide, elliptical cross-section (Kauahikaua et al.,
65
1998). Conduction of heat through the roof, floor, and sides of the tube caused crustal
growth and thickening. The subsequent corresponding pressure increase within the tube,
due to decreasing cross-sectional area without a decrease in flow rate, forced the tube
roof to arch up (Fig. 3.8; Hon et al., 1994; Kauahikaua et al., 1998). The result was a low,
but well-defined, sinuous tumulus above the axis of the lava tube that meandered as a
continuous feature across the coastal plain for a distance of ~1 km (Fig. 3.3). The height
of the sinuous tumulus was further enhanced by irrecoverable uplift caused by the many
breakouts from its flanks.
Peterson et al. (1994) describe another process by which an arched tube roof can
form—accretion of lava onto levees during channelized flow. If the channel is
sufficiently narrow these levees can grow together, forming an arched roof over the
channel. While morphologically similar, the formation process is different from that
described here, and the tube roof that forms in each case should be easily distinguishable
in the field setting.
Inflation was possible only while the tube was completely full and lava was in
contact with the tube roof. The depth of the axial crack on top of the tube gives an
estimate of the time elapsed to develop a crust of that thickness. The empirical formula of
Hon et al. (1994),
28.164 Ct (3.1)
where
t is time in hours, and
C is crustal thickness,
yields a total duration of ~57 days to form a 2.9-m-thick crust. The flow on the coastal
plain at the measurement location, however, was active for a total of ~137 days,
suggesting that the lava stream was in contact with the tube ceiling slightly less than half
the time. Keszthelyi (2012) modified the formula of Hon et al. (1994) to better account

66
for emplacement and environmental conditions appropriate for Kīlauea’s south coast.
Using the Keszthelyi (2012) formula,
25.323 Ct (3.2)
yields a duration of ~113 days for formation of a 2.9-m-thick crust. This result indicates
that the lava stream was in contact with the tube ceiling most of the time. Regardless,
both results suggest periods during which head space separated the lava stream and tube
ceiling.
The sinuous tumulus does not fit into any tumulus classification scheme defined
previously, though it is most similar to the flow-lobe tumuli of Walker (1991) and Rossi
and Gudmunsson (1996). Walker (1991) and Rossi and Gudmunsson (1996) classify
flow-lobe tumuli by height/width and width/length aspect ratios. However, partial burial
of the flanks of the sinuous tumulus by its own breakouts, combined with the extreme
length and sinuosity of the tumulus, prevent a meaningful comparison with these
parameters. For example, Rossi and Gudmunsson (1996) found that the flow-lobe tumuli
that they measured had an average aspect ratio of 0.17 ± 0.06, while the aspect ratio of
the sinuous tumulus varies from 0.12 to 0.71, depending on where along the tumulus’s
length the measurement is made (Table 3.1, Fig. 3.5).
No relation has been established between axial crack width and other geometrical
tumulus parameters. In general, though, the width of the axial crack in the sinuous
tumulus (Table 3.1) is much narrower than the axial cracks in similarly sized flow-lobe
tumuli as described by Walker (1991) and Rossi and Gudmunsson (1996). This is
consistent with our model that the sinuous tumulus was formed in part by inelastic uplift
of the lava tube roof during breakouts, when the tube was overfilled by increased flux,
and not entirely by inflation.
Anderson et al. (2012) found that some tumuli form over horizontal bends in the
underlying flow pathways. Variations in height along the length of the sinuous tumulus
showed no obvious correspondence to bends in the tube. In our case, height variations
reflect the presence or absence of breakouts—the lowest areas along the tumulus were
those that experienced no breakouts and, thus, little or no inelastic uplift. What controlled
67
the location of the breakouts along the tumulus, however, is not known, but may have
been related to local variations in other factors, such as tube width, tube slope, or flow
thickness.
3.5.2 Earth and Mars examples
Very long sinuous tumuli aligned with a lava tube, like that described here, have
not been described before from Hawaiʻi, though they have been observed both before and
since. Very long tumuli, with no mention of sinuosity or tube relationship, are mentioned
by Wentworth and Macdonald (1953), who call them “pressure ridges”. However, they
lump together ridge-like features formed by inflation as well as those formed by lateral
compression. Hon et al. (1994) mention “long sinuous ridges” that form over blockages
in major lava tubes, but provide no additional description. Cashman and Kauahikaua
(1997) also mention “sinuous tumuli” forming over lava tubes, but likewise provide no
additional description. The large tumulus they studied (the Woodchip tumulus) did form
over a lava tube, but it was a single elongate whaleback structure, about 230 m long and
weakly sinuous, that formed in a large sheet flow. Kauahikaua et al. (1998) describe “a
train of inflating, elongate tumuli” that developed over a Puʻu ʻŌʻō lava tube on
Kīlauea’s gently sloping coastal plain during 1996–1997. These tumuli were a source of
breakouts during pulses of lava through the tube following eruptive pauses. The tumuli,
however, were smaller and more equant than the sinuous tumulus describe here, though
their positions followed the sinuous trace of the tube over which they developed (J.
Kauahikaua, personal communication, 2013).
Glaze et al. (2005) describe a chain of very large tumuli on the 1843 flow from
Mauna Loa (Hawaiʻi). While those tumuli cluster along a linear trend, they are not
shaped like the sinuous tumulus, and Glaze et al. (2005) found no evidence for a long-
lived tube beneath the tumuli. Some elongate, crescent-shaped tumuli are present on the
coastal plain portion of the 1859 Mauna Loa flow (F. Trusdell, personal communication,
2013), but they are no more than about 100 m in length. Their relation to a tube system is
not known, and they are not mentioned by Walker (2009) who conducted a detailed study
of tumuli and lava rises in the same area. Chitwood (1994) describes inflated lava fields
in central and southeast Oregon, USA, and indicates that long narrow tumuli can form

68
Figure 3.8 Cartoon showing idealized cross-section through lava flow and sinuous tumulus at different
development stages. (a) Time step 1: Shortly after emplacment; well-developed tube not yet formed and
inflation is minimal. (b) Time step 2: Tube has developed and tumulus has begun to form; pressurization of
tube has resulted in breakout from tumulus flank. (c) Time step 3: Tumulus has undergone additional
growth; breakouts, no longer active, have emerged from both flanks of tumulus, partly inundating it; head
space has formed between lava stream and tube ceiling. (d) Time step 4: 3D perspective of tumulus
showing active breakouts from several places along tumulus flanks in response to re-pressurization of lava
tube.
over lava tubes but provides no discussion of tumuli dimensions and points to no specific
examples. Finally, the Undara lava field in north Queensland, Australia, contains a 40-
km-long sinuous inflation ridge (“The Wall”; Atkinson et al., 1975; Stephenson et al.,
69
1998) which has been suggested as an analog for lunar rilles (Atkinson and Atkinson,
1995). This 200-m-wide, flat-topped feature has been demonstrated to be a narrow,
inflated sheet flow (J. Kauahikaua, personal communication, 2013), much like similar
inflation ridges on the much younger Toomba basalt flow of north Queensland, Australia
(Whitehead and Stephenson, 1998).
Only a few sinuous tumuli like the one observed forming in Hawaiʻi during 2010
have been described world-wide. While many examples probably exist, the two we are
aware of are found on the prehistoric Carrizozo and McCartys flows, New Mexico, USA.
These are among the youngest and best preserved basaltic flow fields in the continental
United States (Zimbelman and Johnston, 2002). The proximal and distal regions of both
flows display evidence for flow inflation and were presumably linked by lava tubes
(Keszthelyi and Pieri, 1993; Zimbelman and Johnston, 2001; 2002; Crumpler et al.,
2007). The medial section of each flow is comparatively narrow due to confining
topography and contains an elongate ridge that is, in some places, more than 10 m high.
If the model presented here explains the formation of these ridges, then they are capped
by lava emplaced early in each flow’s history, and pāhoehoe flows that flank and partly
inundate the ridges were sourced from the ridges themselves. Testing these expected
relationships should help to determine if these sinuous ridges formed as described above,
and will help constrain the emplacement conditions.
Sinuous ridges similar in size to those identified in Hawaiʻi and New Mexico are
observed within the plains flows of the Tharsis volcanic province of Mars (Fig. 3.9).
Here, low shields and fissure vents erupted flows that coalesced to form a gently sloping
plain. The sinuous ridges within the flows are up to 10 m in height and are the sources for
small, local surface flows. Similar ridges found elsewhere across the surface of Mars
have been interpreted as inverted fluvial channels (e.g., Burr et al., 2009; Williams et al.,
2009; Burr et al., 2010; Zimbelman and Griffin, 2010; Lefort et al., 2012), eskers (Baker,
2001; Head and Pratt, 2001; Bleacher et al., 2003; Ghatan and Head, 2004; Banks et al.,
2009), or eroded remnants of subsurface dikes (Head et al., 2006). The development of
inverted fluvial channels and eskers involves flowing water, and all three of these
proposed processes require significant erosion and regional deflation.
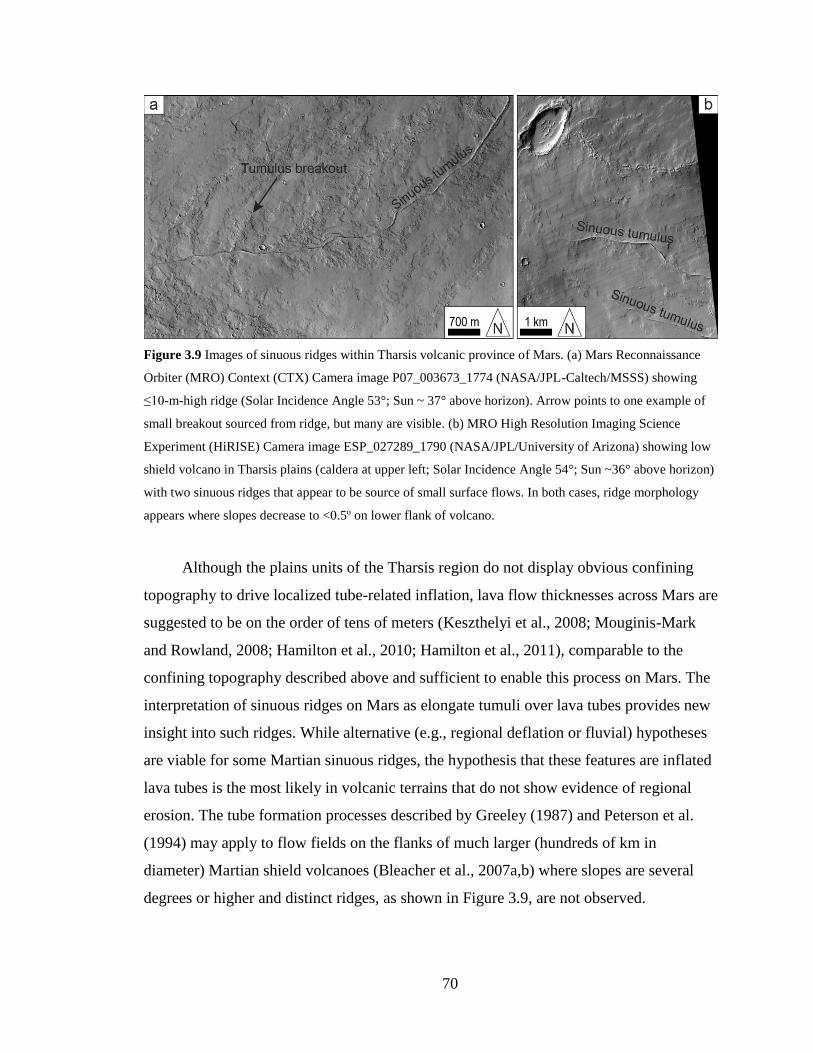
70
Figure 3.9 Images of sinuous ridges within Tharsis volcanic province of Mars. (a) Mars Reconnaissance
Orbiter (MRO) Context (CTX) Camera image P07_003673_1774 (NASA/JPL-Caltech/MSSS) showing
≤10-m-high ridge (Solar Incidence Angle 53°; Sun ~ 37° above horizon). Arrow points to one example of
small breakout sourced from ridge, but many are visible. (b) MRO High Resolution Imaging Science
Experiment (HiRISE) Camera image ESP_027289_1790 (NASA/JPL/University of Arizona) showing low
shield volcano in Tharsis plains (caldera at upper left; Solar Incidence Angle 54°; Sun ~36° above horizon)
with two sinuous ridges that appear to be source of small surface flows. In both cases, ridge morphology
appears where slopes decrease to <0.5º on lower flank of volcano.
Although the plains units of the Tharsis region do not display obvious confining
topography to drive localized tube-related inflation, lava flow thicknesses across Mars are
suggested to be on the order of tens of meters (Keszthelyi et al., 2008; Mouginis-Mark
and Rowland, 2008; Hamilton et al., 2010; Hamilton et al., 2011), comparable to the
confining topography described above and sufficient to enable this process on Mars. The
interpretation of sinuous ridges on Mars as elongate tumuli over lava tubes provides new
insight into such ridges. While alternative (e.g., regional deflation or fluvial) hypotheses
are viable for some Martian sinuous ridges, the hypothesis that these features are inflated
lava tubes is the most likely in volcanic terrains that do not show evidence of regional
erosion. The tube formation processes described by Greeley (1987) and Peterson et al.
(1994) may apply to flow fields on the flanks of much larger (hundreds of km in
diameter) Martian shield volcanoes (Bleacher et al., 2007a,b) where slopes are several
degrees or higher and distinct ridges, as shown in Figure 3.9, are not observed.
71
3.5.3 Forecasting lava tube breakouts
Forecasting volcanic activity is a driving motivation for volcano research and
monitoring. Generally, forecasts for impending eruptive activity, especially the larger
changes, improve as the time of the eruption approaches. During ongoing eruptive
activity, though, there are myriad small changes that occur with little or no warning.
During August–November 2010, however, activity at Kīlauea behaved in such a way that
the occurrence, and to some extent the location and timing, of lava tube breakouts that
threatened houses in the nearby Kalapana Gardens subdivision could be forecast. This
information was disseminated in daily volcanic activity updates on the HVO webpage
and was transmitted directly to HCCD to improve their preparedness in the event that
homes were threatened.
The correlation between the inflationary phase of DI events at Kīlauea’s summit
and the subsequent increase in eruptive activity along Kīlauea’s East Rift Zone has been
seen in hundreds of instances over more than a decade of observation, and the period
discussed here was no exception. The occurrence of breakouts from the active tube
system hours after the onset of summit inflation became apparent shortly after the flow
was emplaced. It was not a perfect correlation with regard to our study area—33 DI
events occurred from the beginning of August to mid-November, but only thirteen were
associated with breakouts from the sinuous tumulus (Table 2). However, the DI events
also often resulted in breakouts from other parts of the tube system, both upslope and
downslope from the sinuous tumulus. Thus, those DI events that were not followed by
breakouts from the sinuous tumulus were typically associated with breakouts elsewhere
along the tube system. It was also noticed that, on a few occasions (in particular
September 30 and October 15), a coastal plain breakout spanned two DI events. In the
September 30 case, the breakout waned quickly and was nearly inactive by October 2, but
its activity had increased again by October 3, following another DI event. The same is
inferred for the October 15 case, though a gap in observation prevented confirmation.
Finally, the effusive surge following some DI events, in particular those of the smallest
magnitude, may have been completely accommodated by the tube system without a
breakout.

72
Despite these shortcomings, hazard assessments were predicated on the assumption
that every DI event was capable of producing a breakout on the coastal flow field near
Kalapana Gardens. The delay between the onset of the inflationary phase of the DI events
and the start of the related breakouts ranged from 15.7 hours to 39.8 hours (Table 3.2),
with an average delay of 23.9 hours. The goal when communicating with Hawaiʻi County
Civil Defense authorities was to provide an assessment of potential activity for the
following 24 hours. The delay between the inflation onset and subsequent breakouts fits
well within this scheme.
Each breakout from the sinuous tumulus partly inundated the adjacent flank of the
tumulus while leaving other sections unburied. Not surprisingly, it was found that later
breakouts were more likely to occur in areas that had not previously hosted a breakout,
where the flank of the tumulus was not partly buried. With this in mind, a few attempts
were made, with marginal success, to forecast the most likely points along the sinuous
tumulus for the next breakout. Based on a visual inspection of the neighboring landscape,
it was possible to make a rough estimate of the presumed flow direction for each of these
potential breakout locations. However, there were simply too many spots along the
tumulus from which breakouts could potentially occur for each DI event, and the
breakouts did not always emerge from parts of the tumulus that were not covered, so this
part of the hazard assessment was abandoned. Moreover, because the distance from the
tumulus to the nearest house was too great for breakouts to pose an immediate hazard,
there was ample time once a breakout began to assess its probable flow path.
Destruction of Kalapana Gardens and neighboring communities in 1990 was
controlled, in part, by eruptive pauses and subsequent restarts (Mattox et al., 1993). These
pauses caused the flow that was active on the coastal plain to stall, and resumption of
activity through the tube system resulted in new breakouts that followed the inflated
margins of the existing flow (Mattox et al., 1993). Repeated breakouts led to flow field
widening and further destruction. While modern tiltmeters like those monitoring Kīlauea
in 2010 were not in use at that time, other deformation tools showed a pattern of deflation
and inflation similar to the DI events that caused variations in discharge in 2010. The
1990 events, however, were probably more akin to the “DID events” that occurred during
2000–2004 (Cervelli and Miklius, 2003; Poland et al., 2011), which were larger in
73
magnitude, more infrequent, and associated with a much larger surge in discharge.
Regardless, the unsteady supply of lava through Kīlauea’s East Rift Zone conduit, both in
1990 and in 2010, directly controlled the occurrence of lava tube breakouts near
Kalapana, and these breakouts could be reliably forecast hours in advance using
deformation data recorded at Kīlauea’s summit.
3.6 Summary
Lateral confinement of a non-channelized basaltic lava flow by topography
provides an important control on the flow’s subsequent evolution. Rather than developing
into a broad, inflated flow field, flow inflation may be focused directly over the tube, to
form a long tumulus axial to the tube. The sinuous tumulus described here is one of a few
examples known worldwide, and is the only one to have been observed throughout its
formation. Its morphology and mechanism of formation were different than typical
tumuli and, as such, it does not fit into any of the previously published tumuli
classification schemes (Walker, 1991; Rossi and Gudmundsson, 1996). Its presence also
shows conclusively that tumuli can form over major lava tube systems, a process
questioned in the past (e.g., Walker, 1991).
Temporary increases in discharge pressurized the lava tube and caused inelastic
uplift of the sinuous tumulus and breakouts from its flanks. The abrupt, forced uplift of
the tube roof was in addition to flow inflation that occurred while the lava stream was in
contact with the tube roof. The result was a sinuous tumulus composed of an early-
formed lava surface surrounded by younger flows that emerged from the sides of the
tumulus itself and buried the surrounding landscape. Eventually, low parts of the tumulus
were buried by breakouts from adjacent areas of the tumulus itself. This subdivided the
tumulus into a chain of shorter, elongate tumuli. It would not have been known that these
were all part of a single, very long sinuous tumulus if its entire evolution had not been
observed.
The ability of topography to confine a flow must be closely tied to the discharge.
While all flows will be confined by sufficiently high topography, flows fed by lower
discharges can be confined by correspondingly lower topography, even down to the
centimetric-scale (Hon et al., 1994; Rossi and Gudmundsson, 1996; Hamilton et al.,

74
2013). We contend that the failure of the flow emplaced on Kīlauea’s south flank during
July–November 2010 to spread, thus causing its evolution into a sinuous, elongate
tumulus, was controlled in part by its low discharge in this instance. A higher discharge,
matching the long-term average at Kīlauea, would have likely resulted in a wider flow,
more distributed inflation, and no tumulus above the axis of the tube that would have
eventually formed. Sinuous tumuli found within narrow, topographically confined
sections of the prehistoric McCartys and Carrizozo flows (New Mexico, USA) probably
formed in an equivalent fashion, and we propose that these examples on Earth may be
analogs for at least some sinuous ridges found within the Tharsis volcanic province and
elsewhere on Mars.
Cycles of edifice deflation and inflation (DI events) at Kīlauea’s summit cause
decreases and increases in East Rift Zone output respectively. During the July–November
2010 study period, the decreases were manifested on the active flow field as diminutions
in eruptive activity, while the increases led to breakouts from the active lava tube. As
described above, many of these breakouts came from the section of the lava tube topped
by a ~1-km-long sinuous tumulus. Though imperfect, the correlation between DI events
and lava tube breakouts was used to forecast the possibility of new, potentially hazardous
flows, which was communicated to Hawaiʻi County Civil Defense.
75
Chapter 4
Explosive eruptions triggered by rockfalls at Kīlauea
Volcano, Hawai‘i
Published as:
Orr, T.R., Thelen, W.A., Patrick, M.R., Swanson, D.A., and Wilson, D.C., 2013, Explosive
eruptions triggered by rockfalls at Kīlauea volcano, Hawai‘i. Geology 41(2),
207–210.
4.1 Introduction
Ongoing eruptive activity at Kīlauea Volcano’s summit (Wilson et al., 2008;
Houghton et al., 2011) has been dominated by outgassing from a lava lake in a pit within
Halema‘uma‘u Crater (Figs. 4.1 and 4.2). Since the onset of the eruption, the generally
steady outgassing from the vent has been punctuated sporadically by dozens of small
explosive eruptions, and hundreds of even smaller outgassing bursts (Patrick et al.,
2011b). Associated with these bursts are “composite” seismic events, defined here as
being characterized by an emergent high-frequency (HF) onset that transitions into long-
period (LP) seismicity superimposed on a distinctive very-long-period (VLP) oscillation
(Figs. 4.3 and 4.4). The VLP oscillation is often large enough to be seen in the raw
velocity waveforms without the aid of filtering.
Continuously recording webcams have documented the eruption since its onset in
2008, and the video observations of lava lake dynamics and explosive activity are
unparalleled. The video record, enhanced by near-daily field observations, shows that the
explosive eruptions and outgassing bursts—which have occurred sporadically since the
vent opened—were triggered by rockfalls from the vent walls onto the top of the lava
column. Here we examine in detail rockfalls that occurred during January–March 2011,
which was a period of slowly rising lava level within the vent. These were among the
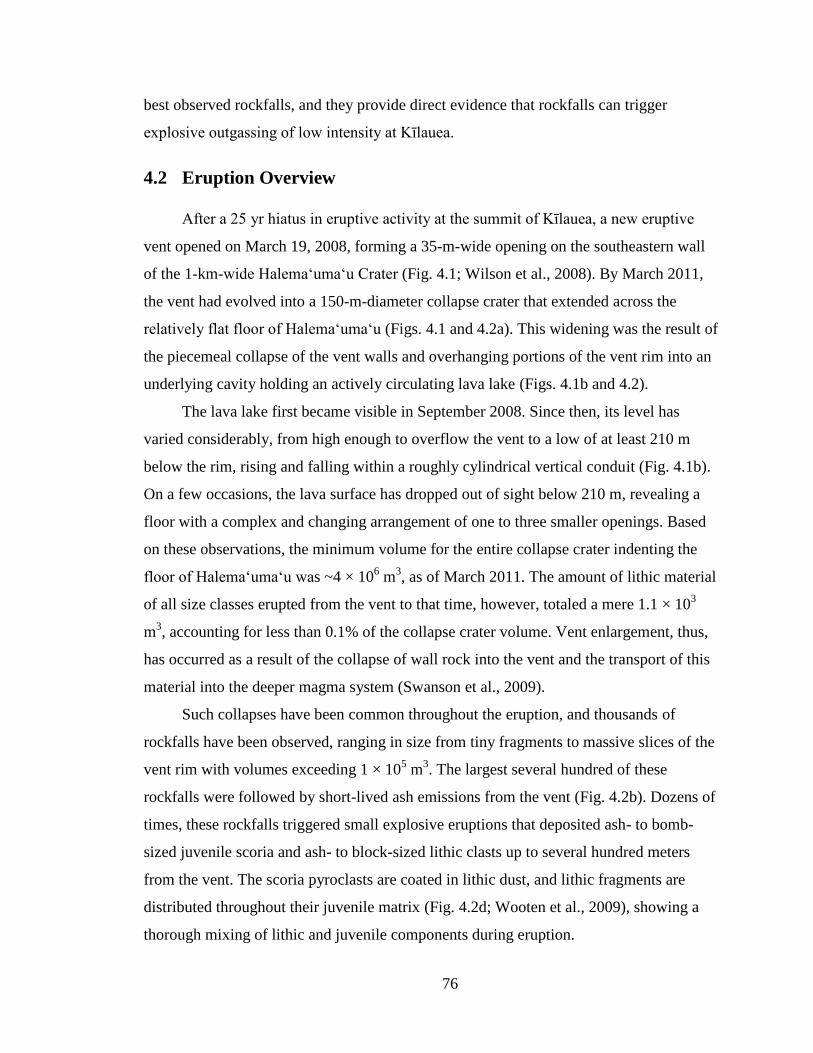
76
best observed rockfalls, and they provide direct evidence that rockfalls can trigger
explosive outgassing of low intensity at Kīlauea.
4.2 Eruption Overview
After a 25 yr hiatus in eruptive activity at the summit of Kīlauea, a new eruptive
vent opened on March 19, 2008, forming a 35-m-wide opening on the southeastern wall
of the 1-km-wide Halema‘uma‘u Crater (Fig. 4.1; Wilson et al., 2008). By March 2011,
the vent had evolved into a 150-m-diameter collapse crater that extended across the
relatively flat floor of Halema‘uma‘u (Figs. 4.1 and 4.2a). This widening was the result of
the piecemeal collapse of the vent walls and overhanging portions of the vent rim into an
underlying cavity holding an actively circulating lava lake (Figs. 4.1b and 4.2).
The lava lake first became visible in September 2008. Since then, its level has
varied considerably, from high enough to overflow the vent to a low of at least 210 m
below the rim, rising and falling within a roughly cylindrical vertical conduit (Fig. 4.1b).
On a few occasions, the lava surface has dropped out of sight below 210 m, revealing a
floor with a complex and changing arrangement of one to three smaller openings. Based
on these observations, the minimum volume for the entire collapse crater indenting the
floor of Halema‘uma‘u was ~4 × 10⁶ m
3, as of March 2011. The amount of lithic material
of all size classes erupted from the vent to that time, however, totaled a mere 1.1 × 10³
m3, accounting for less than 0.1% of the collapse crater volume. Vent enlargement, thus,
has occurred as a result of the collapse of wall rock into the vent and the transport of this
material into the deeper magma system (Swanson et al., 2009).
Such collapses have been common throughout the eruption, and thousands of
rockfalls have been observed, ranging in size from tiny fragments to massive slices of the
vent rim with volumes exceeding 1 × 10⁵ m
3. The largest several hundred of these
rockfalls were followed by short-lived ash emissions from the vent (Fig. 4.2b). Dozens of
times, these rockfalls triggered small explosive eruptions that deposited ash- to bomb-
sized juvenile scoria and ash- to block-sized lithic clasts up to several hundred meters
from the vent. The scoria pyroclasts are coated in lithic dust, and lithic fragments are
distributed throughout their juvenile matrix (Fig. 4.2d; Wooten et al., 2009), showing a
thorough mixing of lithic and juvenile components during eruption.

77
Figure 4.1 Map of Kīlauea Caldera and cross section through Halemaʻumaʻu. (a) Map shows location of
eruptive vent on southeast edge of Halema‘uma‘u. HVO, Hawaiian Volcano Observatory; NPT, North Pit
seismometer. A–Aʹ denotes (b) cross section through Halema‘uma‘u and eruptive vent, drawn to scale.
Black diamond, webcam; dotted line, high lava lake level achieved in March 2011. Deeper conduits based
on locations of upwelling lava following March 5–6, 2011, lava lake draining.
In mid-November 2010, the lava lake began to rise slowly as Kīlauea’s magmatic
system pressurized. By January 2011, the lava lake surface had reached to within ~100 m
of the rim of the vent. Over the following 2 months, the lava level rose an additional 35
m, bringing it to within 62 m of the vent rim by early March (Figs. 4.1b and 4.2a). Then,
on March 5–6, 2011, the lava lake dropped ~145 m over a period of about a day as
summit magma intruded Kīlauea’s East Rift Zone, where it fed a new eruption (episode
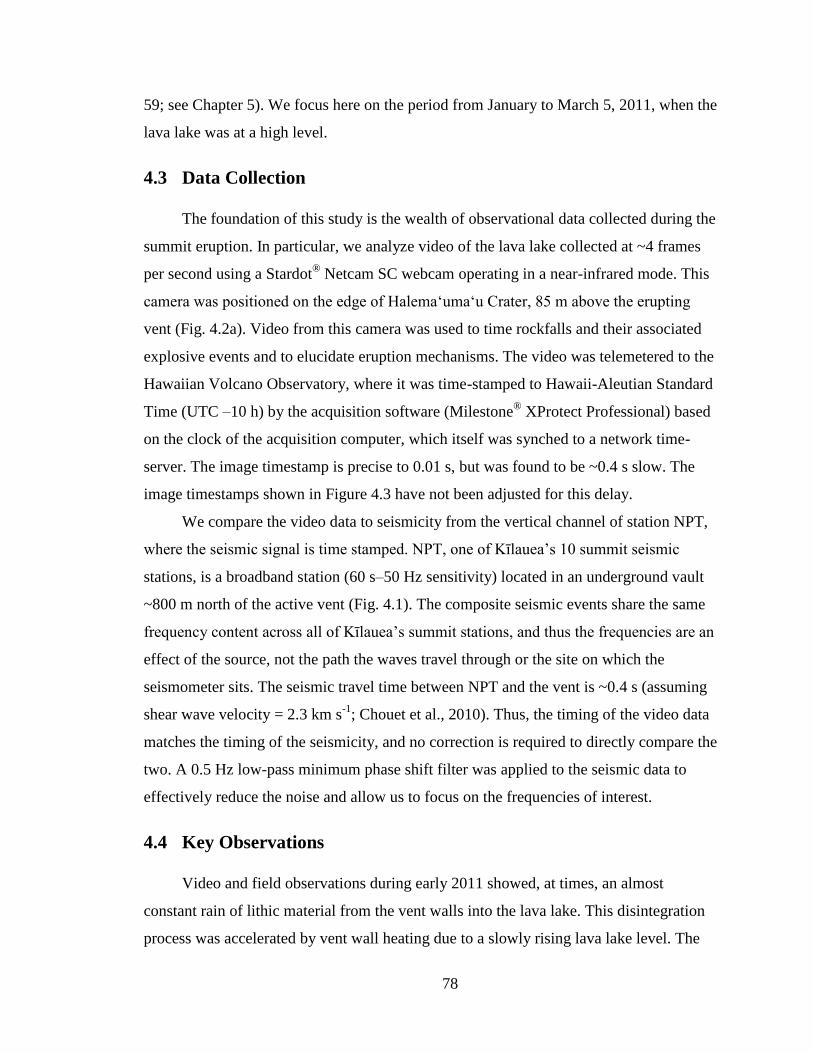
78
59; see Chapter 5). We focus here on the period from January to March 5, 2011, when the
lava lake was at a high level.
4.3 Data Collection
The foundation of this study is the wealth of observational data collected during the
summit eruption. In particular, we analyze video of the lava lake collected at ~4 frames
per second using a Stardot® Netcam SC webcam operating in a near-infrared mode. This
camera was positioned on the edge of Halema‘uma‘u Crater, 85 m above the erupting
vent (Fig. 4.2a). Video from this camera was used to time rockfalls and their associated
explosive events and to elucidate eruption mechanisms. The video was telemetered to the
Hawaiian Volcano Observatory, where it was time-stamped to Hawaii-Aleutian Standard
Time (UTC –10 h) by the acquisition software (Milestone®
XProtect Professional) based
on the clock of the acquisition computer, which itself was synched to a network time-
server. The image timestamp is precise to 0.01 s, but was found to be ~0.4 s slow. The
image timestamps shown in Figure 4.3 have not been adjusted for this delay.
We compare the video data to seismicity from the vertical channel of station NPT,
where the seismic signal is time stamped. NPT, one of Kīlauea’s 10 summit seismic
stations, is a broadband station (60 s–50 Hz sensitivity) located in an underground vault
~800 m north of the active vent (Fig. 4.1). The composite seismic events share the same
frequency content across all of Kīlauea’s summit stations, and thus the frequencies are an
effect of the source, not the path the waves travel through or the site on which the
seismometer sits. The seismic travel time between NPT and the vent is ~0.4 s (assuming
shear wave velocity = 2.3 km s-1
; Chouet et al., 2010). Thus, the timing of the video data
matches the timing of the seismicity, and no correction is required to directly compare the
two. A 0.5 Hz low-pass minimum phase shift filter was applied to the seismic data to
effectively reduce the noise and allow us to focus on the frequencies of interest.
4.4 Key Observations
Video and field observations during early 2011 showed, at times, an almost
constant rain of lithic material from the vent walls into the lava lake. This disintegration
process was accelerated by vent wall heating due to a slowly rising lava lake level. The
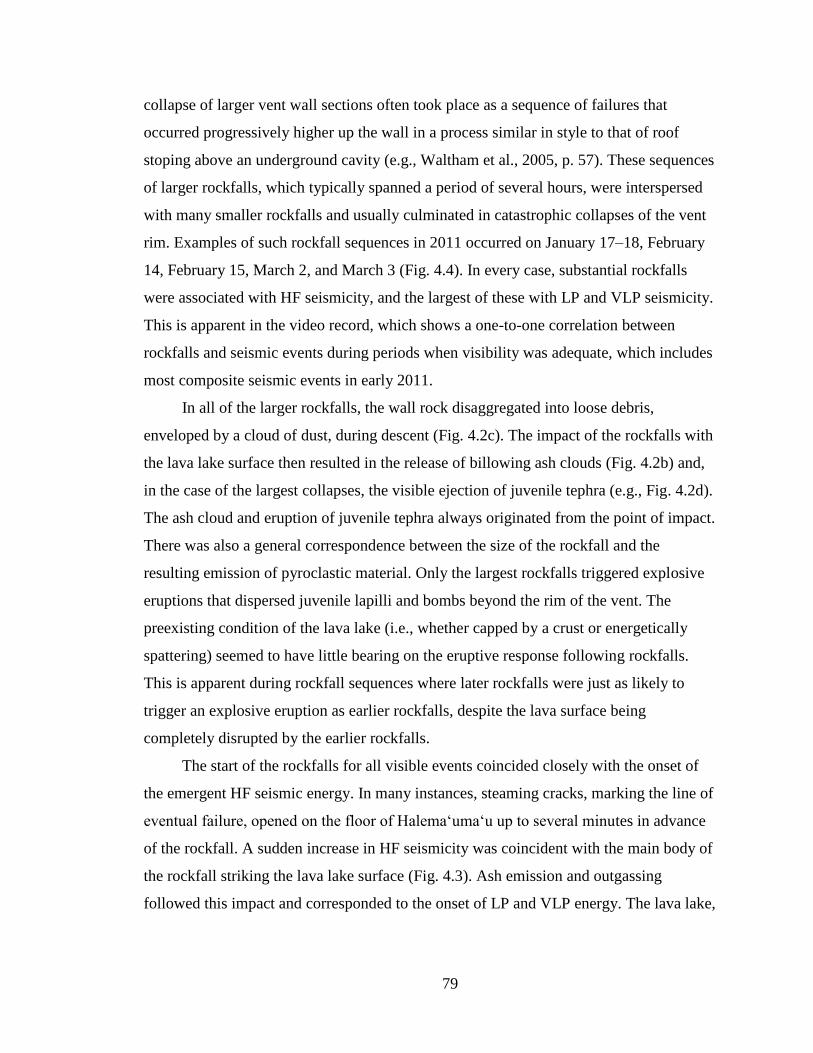
79
collapse of larger vent wall sections often took place as a sequence of failures that
occurred progressively higher up the wall in a process similar in style to that of roof
stoping above an underground cavity (e.g., Waltham et al., 2005, p. 57). These sequences
of larger rockfalls, which typically spanned a period of several hours, were interspersed
with many smaller rockfalls and usually culminated in catastrophic collapses of the vent
rim. Examples of such rockfall sequences in 2011 occurred on January 17–18, February
14, February 15, March 2, and March 3 (Fig. 4.4). In every case, substantial rockfalls
were associated with HF seismicity, and the largest of these with LP and VLP seismicity.
This is apparent in the video record, which shows a one-to-one correlation between
rockfalls and seismic events during periods when visibility was adequate, which includes
most composite seismic events in early 2011.
In all of the larger rockfalls, the wall rock disaggregated into loose debris,
enveloped by a cloud of dust, during descent (Fig. 4.2c). The impact of the rockfalls with
the lava lake surface then resulted in the release of billowing ash clouds (Fig. 4.2b) and,
in the case of the largest collapses, the visible ejection of juvenile tephra (e.g., Fig. 4.2d).
The ash cloud and eruption of juvenile tephra always originated from the point of impact.
There was also a general correspondence between the size of the rockfall and the
resulting emission of pyroclastic material. Only the largest rockfalls triggered explosive
eruptions that dispersed juvenile lapilli and bombs beyond the rim of the vent. The
preexisting condition of the lava lake (i.e., whether capped by a crust or energetically
spattering) seemed to have little bearing on the eruptive response following rockfalls.
This is apparent during rockfall sequences where later rockfalls were just as likely to
trigger an explosive eruption as earlier rockfalls, despite the lava surface being
completely disrupted by the earlier rockfalls.
The start of the rockfalls for all visible events coincided closely with the onset of
the emergent HF seismic energy. In many instances, steaming cracks, marking the line of
eventual failure, opened on the floor of Halema‘uma‘u up to several minutes in advance
of the rockfall. A sudden increase in HF seismicity was coincident with the main body of
the rockfall striking the lava lake surface (Fig. 4.3). Ash emission and outgassing
followed this impact and corresponded to the onset of LP and VLP energy. The lava lake,
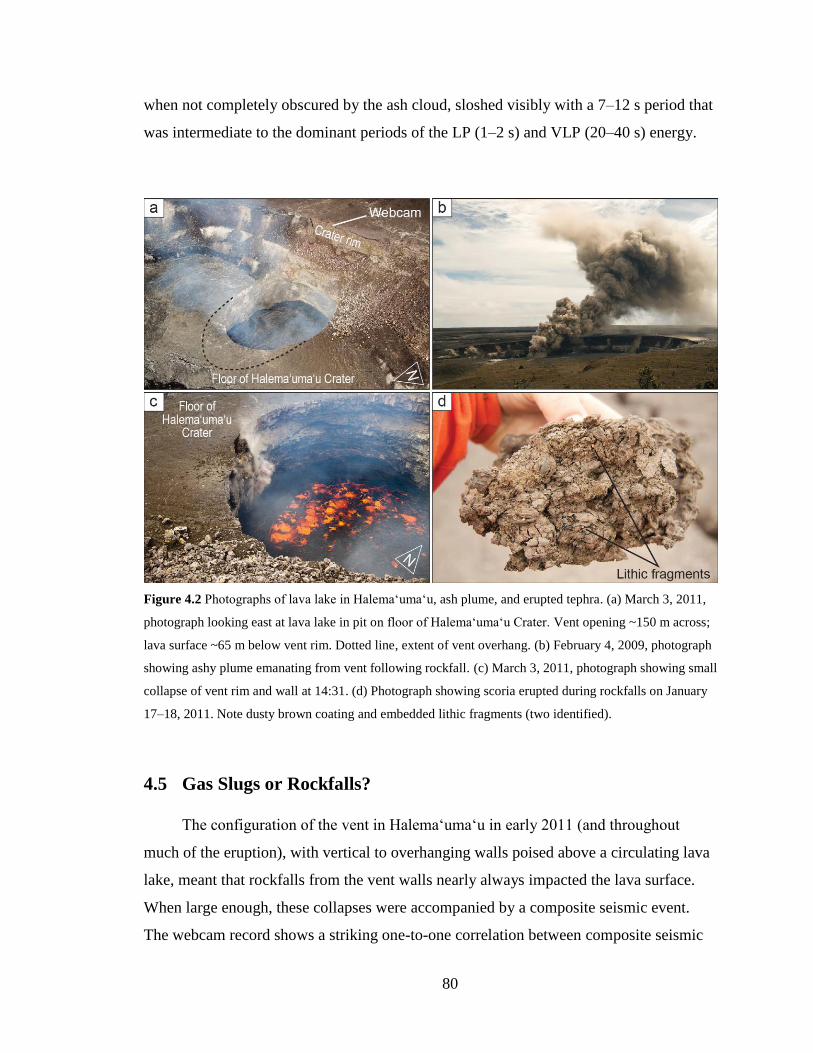
80
when not completely obscured by the ash cloud, sloshed visibly with a 7–12 s period that
was intermediate to the dominant periods of the LP (1–2 s) and VLP (20–40 s) energy.
Figure 4.2 Photographs of lava lake in Halemaʻumaʻu, ash plume, and erupted tephra. (a) March 3, 2011,
photograph looking east at lava lake in pit on floor of Halema‘uma‘u Crater. Vent opening ~150 m across;
lava surface ~65 m below vent rim. Dotted line, extent of vent overhang. (b) February 4, 2009, photograph
showing ashy plume emanating from vent following rockfall. (c) March 3, 2011, photograph showing small
collapse of vent rim and wall at 14:31. (d) Photograph showing scoria erupted during rockfalls on January
17–18, 2011. Note dusty brown coating and embedded lithic fragments (two identified).
4.5 Gas Slugs or Rockfalls?
The configuration of the vent in Halema‘uma‘u in early 2011 (and throughout
much of the eruption), with vertical to overhanging walls poised above a circulating lava
lake, meant that rockfalls from the vent walls nearly always impacted the lava surface.
When large enough, these collapses were accompanied by a composite seismic event.
The webcam record shows a striking one-to-one correlation between composite seismic
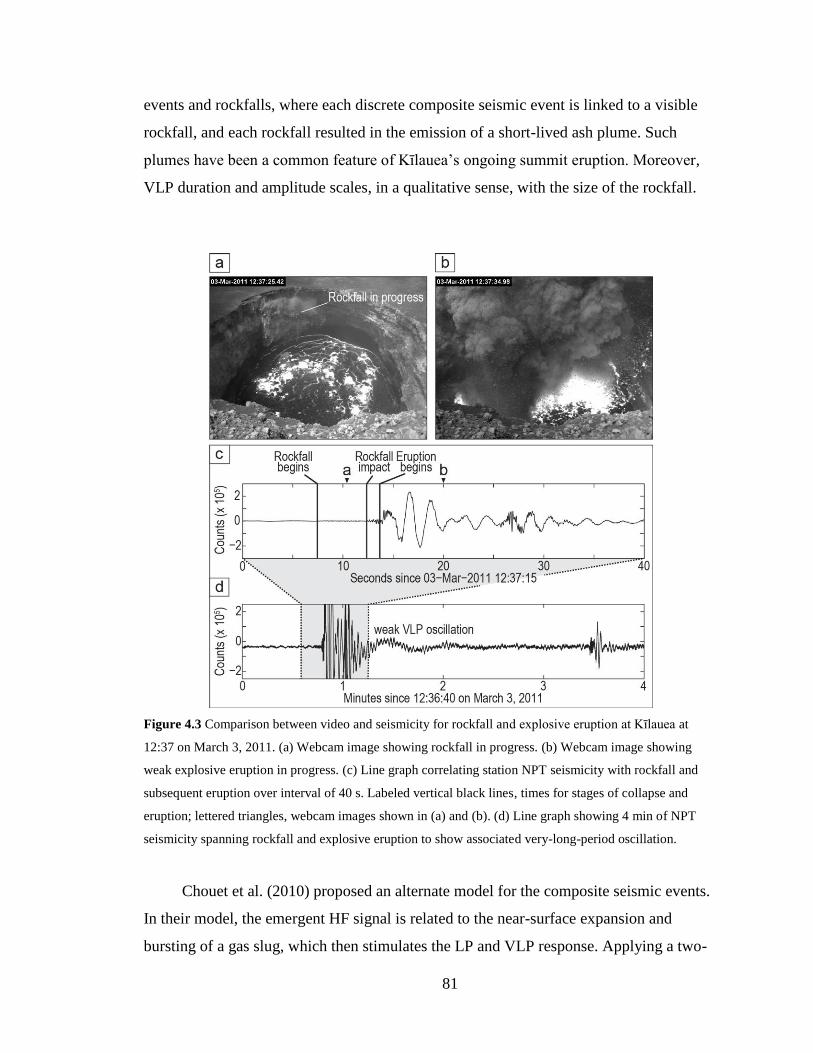
81
events and rockfalls, where each discrete composite seismic event is linked to a visible
rockfall, and each rockfall resulted in the emission of a short-lived ash plume. Such
plumes have been a common feature of Kīlauea’s ongoing summit eruption. Moreover,
VLP duration and amplitude scales, in a qualitative sense, with the size of the rockfall.
Figure 4.3 Comparison between video and seismicity for rockfall and explosive eruption at Kīlauea at
12:37 on March 3, 2011. (a) Webcam image showing rockfall in progress. (b) Webcam image showing
weak explosive eruption in progress. (c) Line graph correlating station NPT seismicity with rockfall and
subsequent eruption over interval of 40 s. Labeled vertical black lines, times for stages of collapse and
eruption; lettered triangles, webcam images shown in (a) and (b). (d) Line graph showing 4 min of NPT
seismicity spanning rockfall and explosive eruption to show associated very-long-period oscillation.
Chouet et al. (2010) proposed an alternate model for the composite seismic events.
In their model, the emergent HF signal is related to the near-surface expansion and
bursting of a gas slug, which then stimulates the LP and VLP response. Applying a two-
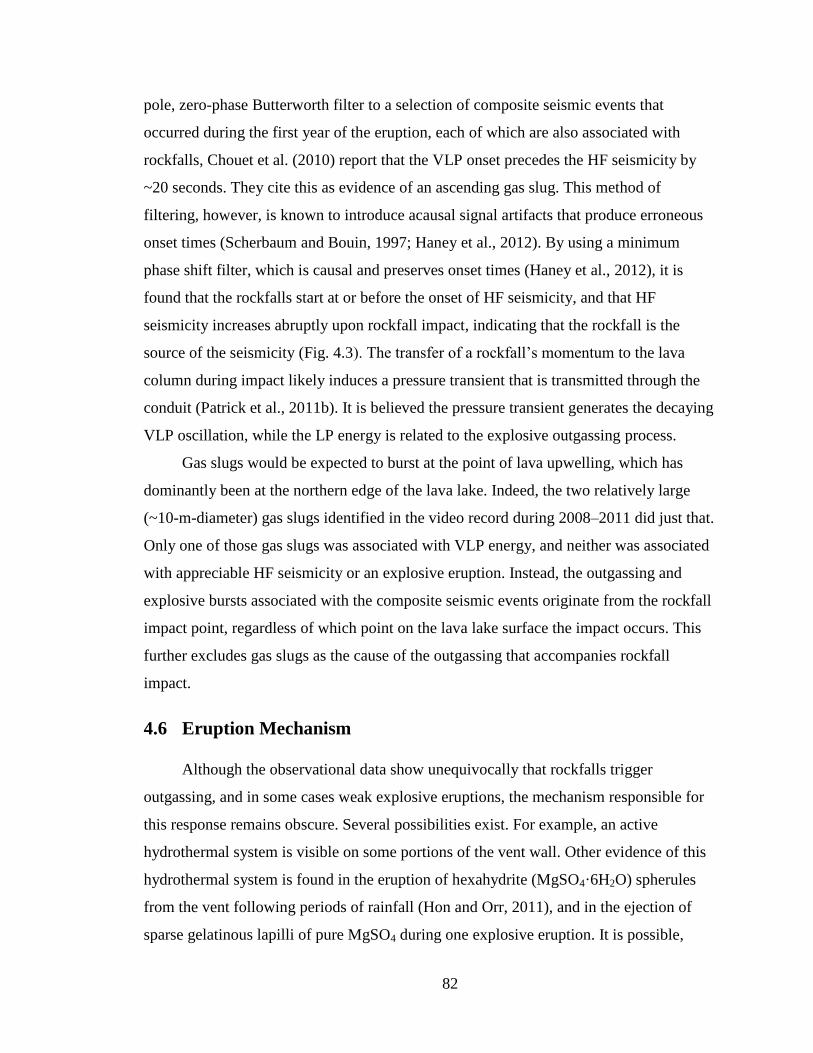
82
pole, zero-phase Butterworth filter to a selection of composite seismic events that
occurred during the first year of the eruption, each of which are also associated with
rockfalls, Chouet et al. (2010) report that the VLP onset precedes the HF seismicity by
~20 seconds. They cite this as evidence of an ascending gas slug. This method of
filtering, however, is known to introduce acausal signal artifacts that produce erroneous
onset times (Scherbaum and Bouin, 1997; Haney et al., 2012). By using a minimum
phase shift filter, which is causal and preserves onset times (Haney et al., 2012), it is
found that the rockfalls start at or before the onset of HF seismicity, and that HF
seismicity increases abruptly upon rockfall impact, indicating that the rockfall is the
source of the seismicity (Fig. 4.3). The transfer of a rockfall’s momentum to the lava
column during impact likely induces a pressure transient that is transmitted through the
conduit (Patrick et al., 2011b). It is believed the pressure transient generates the decaying
VLP oscillation, while the LP energy is related to the explosive outgassing process.
Gas slugs would be expected to burst at the point of lava upwelling, which has
dominantly been at the northern edge of the lava lake. Indeed, the two relatively large
(~10-m-diameter) gas slugs identified in the video record during 2008–2011 did just that.
Only one of those gas slugs was associated with VLP energy, and neither was associated
with appreciable HF seismicity or an explosive eruption. Instead, the outgassing and
explosive bursts associated with the composite seismic events originate from the rockfall
impact point, regardless of which point on the lava lake surface the impact occurs. This
further excludes gas slugs as the cause of the outgassing that accompanies rockfall
impact.
4.6 Eruption Mechanism
Although the observational data show unequivocally that rockfalls trigger
outgassing, and in some cases weak explosive eruptions, the mechanism responsible for
this response remains obscure. Several possibilities exist. For example, an active
hydrothermal system is visible on some portions of the vent wall. Other evidence of this
hydrothermal system is found in the eruption of hexahydrite (MgSO4·6H2O) spherules
from the vent following periods of rainfall (Hon and Orr, 2011), and in the ejection of
sparse gelatinous lapilli of pure MgSO4 during one explosive eruption. It is possible,
83
therefore, that water within the body of the rockfall may play a role in initiating an
explosive response.
Figure 4.4 Seismic traces for periods encompassing rockfall sequences during January–March 2011.
Nearly all impulsive seismic events shown here are related to rockfalls
Most lapilli and bombs erupted from the vent during explosive events are scoria
with vesicularities up to 89%, and pyroclasts lofted from the vent at other times have
vesicularities up to 95% (R. Carey, 2012, personal communication). These products

84
indicate a significant amount of dissolved and/or exsolved gas stored at a shallow level in
the lava lake. A massive disruption to the top of the lava lake could abruptly release this
gas, and may even trigger a run-away decompressive vesiculation that helps drive the
explosive response. This may be further enhanced by the addition of a multitude of
vesiculation surfaces provided by the rockfall (vesicles within the erupted tephra
commonly contain lithic ash particles, suggesting that these were a catalyst for
vesiculation). On the other hand, the observation that the explosive response is largely
unaffected by the preexisting condition of the lava lake argues against the release of gas
trapped beneath a capping crust as the driving mechanism behind rockfall-triggered
bursts.
Another possibility is that the explosive eruptions are a manifestation of a rebound
splash caused by the collapse of a rockfall’s impact cavity. Such splashes, called
Worthington jets, can occur in both liquids and granular materials (e.g., Worthington,
1908; Lohse et al., 2004; Gekle and Gordillo, 2010, and references therein) and are seen
in everyday settings as simple as raindrops impacting a puddle, or a rock being tossed
into a pool of water. Studies have shown that Worthington jets can achieve velocities 20–
30 times higher than the velocity of the impacting object (Thoroddsen et al., 2004; Gekle
and Gordillo, 2010), and that jet height in some instances can exceed the initial drop
height (Worthington, 1908; Lohse et al., 2004). Furthermore, higher impact velocities
result in higher jets (Harlow and Shannon 1967; Bergmann et al., 2006). Small jets,
formed by tiny rockfalls impacting the lava lake surface, are seen often at Kīlauea. As the
size of the rockfall scales up, however, the formation of a larger Worthington jet is not
always directly observable because of the introduction of other factors such as occlusion
by ash, fragmentation of the jet, and saturation of the webcam video from the
incandescence of the freshly exposed lava. In general, though, the largest rockfalls
triggered the most energetic eruption response, perhaps by creating a larger impact crater
and a correspondingly larger Worthington jet. The coherence of the rockfall probably
also plays a role in determining the height of the jet, with rockfalls that form a
consolidated mass producing higher jets than rockfalls composed of loose debris. The
collapse of the impact cavity could also temporarily trap air beneath the surface of the
lava lake, similar to what has been observed in some Worthington jet studies (Lohse et
85
al., 2004; Gekle and Gordillo, 2010). This air, especially when heated, could then act as a
supplementary driving mechanism.
In the volcanological scenario presented here, a rockfall plunging into the surface
of the lava lake creates a deep impact crater in its wake, compressing the lava column
beneath the impact site while decompressing that surrounding the impact site. The size of
this crater should depend on the ratio between the rockfall’s inertial force and the surface
tension of the lava lake (i.e., the Weber number). The crater then collapses and, if the
Weber number is high enough (Hsiao et al., 1988), forms a Worthington jet which, when
it is composed mostly of lava from beneath the lake surface, undergoes immediate
decompression and fragmentation. Some smaller lithic clasts are also swept back up in
the jet, as is seen in jets formed during water impacts (Worthington, 1908; Harlow and
Shannon, 1967). The rising fragments that compose the jet then travel through the lithic
ash plume, incorporating additional rockfall material. Evidence of these interactions
between the jet and the lithic rockfall is preserved in the tephra, which shows a thorough
mixing of lithic and juvenile components and a coating of lithic ash to fine lapilli
(Wooten et al., 2009). The formation of the Worthington jet is almost certainly coupled
with several mechanisms that together drive the transient explosive eruptions triggered by
rockfalls. These include decompressive and shock vesiculation (Carey et al., 2012), the
release of trapped magmatic gas, the trapping of air, the release of volatiles within the
lithic material of the rockfalls, and the introduction of vesiculation surfaces. The
formation of a rebound splash, however, probably plays a primary role in this complex
process.
4.7 Conclusions
Geologic observations have been crucial in developing our understanding of vent
evolution and shallow degassing and outgassing processes at Kīlauea. These observations
show that rockfalls within the vent, when they impact the top of the lava column, are
capable of triggering transient outgassing bursts and weak explosive eruptions, possibly
by generating a Worthington jet that may be closely coupled with other processes. This
type of triggering mechanism has not been recognized before, and it seems likely that
other small, enigmatic explosive events reported at Kīlauea over the past century, and

86
possibly at other open-system basaltic volcanoes as well, could have been triggered in a
similar fashion.
Network-enabled webcams have become an important monitoring tool at volcano
observatories around the globe in recent years and provide another way to study volcanic
activity and its associated hazards (e.g., Paskievitch et al., 2010). The study here
highlights the importance of using observational data, when available, to constrain
eruption mechanisms based on geophysical interpretations.
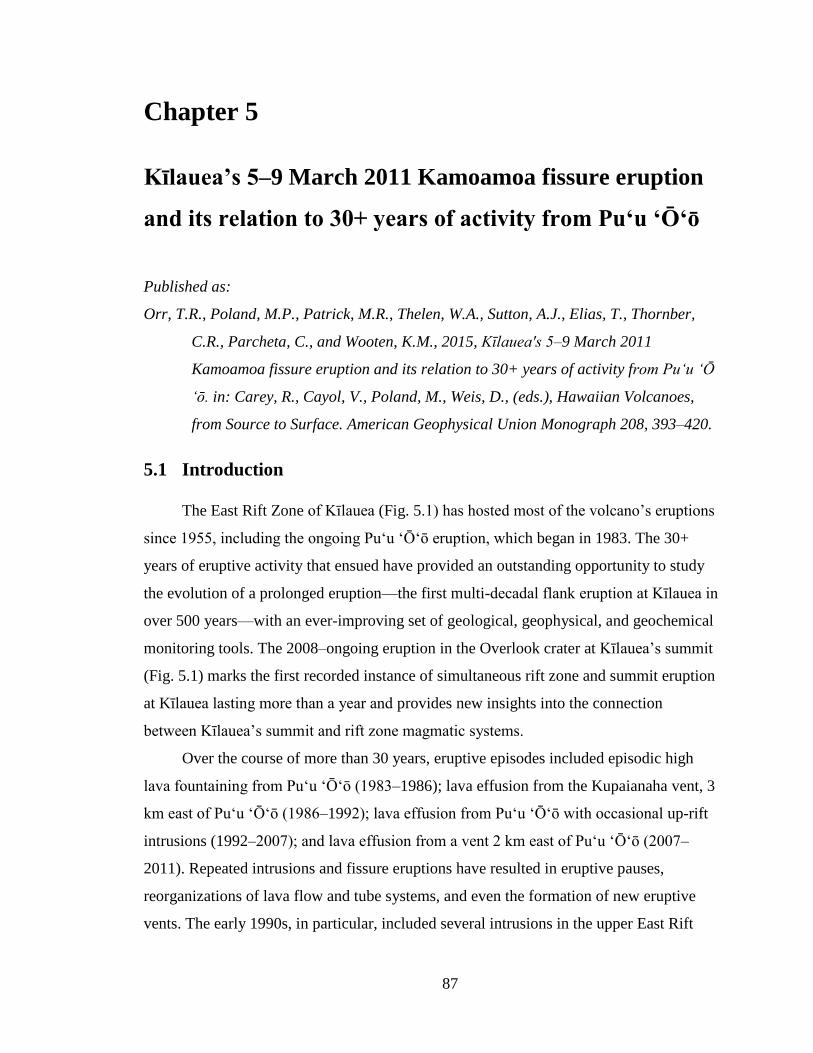
87
Chapter 5
Kīlauea’s 5–9 March 2011 Kamoamoa fissure eruption
and its relation to 30+ years of activity from Puʻu ʻŌʻō
Published as:
Orr, T.R., Poland, M.P., Patrick, M.R., Thelen, W.A., Sutton, A.J., Elias, T., Thornber,
C.R., Parcheta, C., and Wooten, K.M., 2015, Kīlauea's 5–9 March 2011
Kamoamoa fissure eruption and its relation to 30+ years of activity from Pu‘u ‘Ō
‘ō. in: Carey, R., Cayol, V., Poland, M., Weis, D., (eds.), Hawaiian Volcanoes,
from Source to Surface. American Geophysical Union Monograph 208, 393–420.
5.1 Introduction
The East Rift Zone of Kīlauea (Fig. 5.1) has hosted most of the volcano’s eruptions
since 1955, including the ongoing Puʻu ʻŌʻō eruption, which began in 1983. The 30+
years of eruptive activity that ensued have provided an outstanding opportunity to study
the evolution of a prolonged eruption—the first multi-decadal flank eruption at Kīlauea in
over 500 years—with an ever-improving set of geological, geophysical, and geochemical
monitoring tools. The 2008–ongoing eruption in the Overlook crater at Kīlauea’s summit
(Fig. 5.1) marks the first recorded instance of simultaneous rift zone and summit eruption
at Kīlauea lasting more than a year and provides new insights into the connection
between Kīlauea’s summit and rift zone magmatic systems.
Over the course of more than 30 years, eruptive episodes included episodic high
lava fountaining from Puʻu ʻŌʻō (1983–1986); lava effusion from the Kupaianaha vent, 3
km east of Puʻu ʻŌʻō (1986–1992); lava effusion from Puʻu ʻŌʻō with occasional up-rift
intrusions (1992–2007); and lava effusion from a vent 2 km east of Puʻu ʻŌʻō (2007–
2011). Repeated intrusions and fissure eruptions have resulted in eruptive pauses,
reorganizations of lava flow and tube systems, and even the formation of new eruptive
vents. The early 1990s, in particular, included several intrusions in the upper East Rift

88
Zone that caused hours- to days-long eruptive pauses and some minor subsidences at
Puʻu ʻŌʻō. More significant intrusions and eruptions occurred in 1997 (Owen et al., 2000;
Thornber et al., 2003), 1999 (Cervelli et al., 2002), and 2007 (Poland et al., 2008a;
Montgomery-Brown et al., 2010), the latter of which was accompanied by a shift in the
locus of eruption away from Puʻu ʻŌʻō to a new vent 2 km farther east (episode 58 vent).
Figure 5.2, a cross section of Kīlauea’s summit and part of its East Rift Zone,
conceptualizes the basic geometry of Kīlauea’s shallow magmatic system during episode
58.
Figure 5.1 Map of Kīlauea’s summit and East Rift Zone during 2011 showing extent of flows erupted
during March 5–9, 2011, Kamoamoa eruption (red) in relation to 1983–2011 Puʻu ʻŌʻō flow field (pre-
Kamoamoa; gray) and historical flows (brown). Area depicted in Figure 5.2 outlined. Blue circles,
continuously recording GPS stations spanning summit (UWEV–AHUP), East Rift Zone near Makaopuhi
Crater (NUPM–KTPM), and Puʻu ʻŌʻō crater (PUOC–SPIL); orange circle, gravimeter (HOVL) near
Overlook crater; yellow circles, seismic stations (NPT, PAU, KNH, STC); green circles, tiltmeters (UWE,
POC).
During March 5–9, 2011, the Kamoamoa fissure eruption (Figs. 5.1 and 5.3), a few
kilometers west (up-rift) of Puʻu ʻŌʻō, marked the end of the eruptive vent established
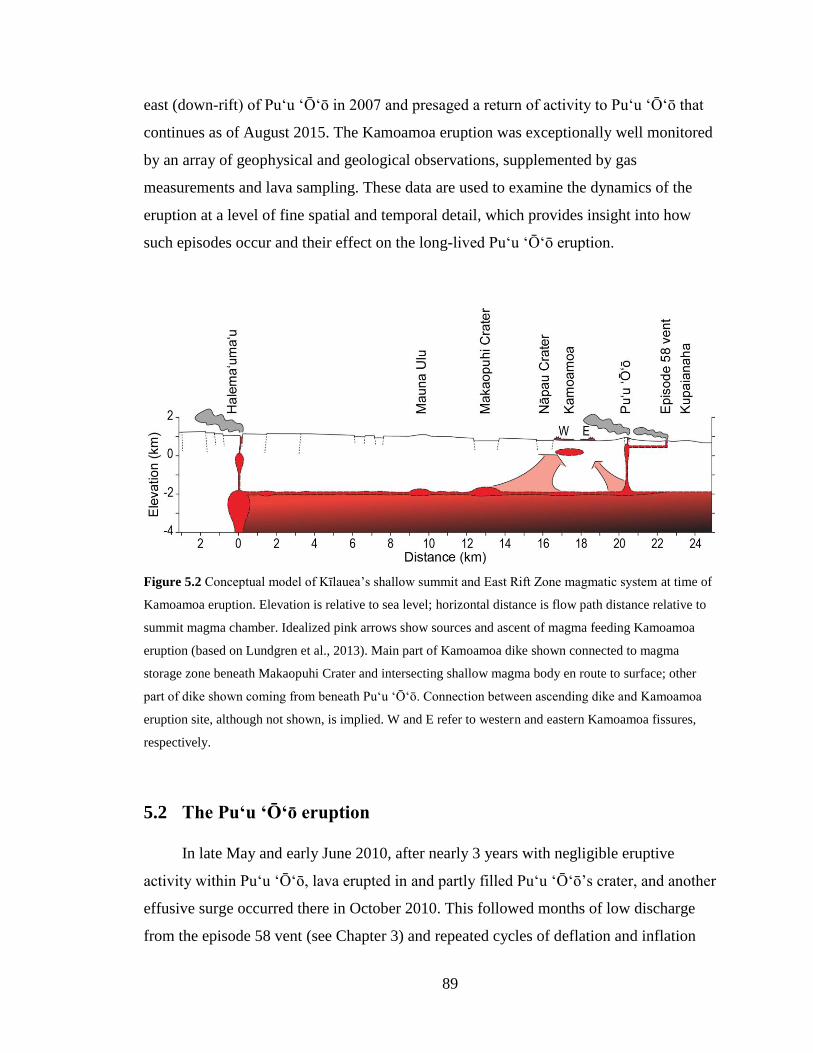
89
east (down-rift) of Puʻu ʻŌʻō in 2007 and presaged a return of activity to Puʻu ʻŌʻō that
continues as of August 2015. The Kamoamoa eruption was exceptionally well monitored
by an array of geophysical and geological observations, supplemented by gas
measurements and lava sampling. These data are used to examine the dynamics of the
eruption at a level of fine spatial and temporal detail, which provides insight into how
such episodes occur and their effect on the long-lived Puʻu ʻŌʻō eruption.
Figure 5.2 Conceptual model of Kīlauea’s shallow summit and East Rift Zone magmatic system at time of
Kamoamoa eruption. Elevation is relative to sea level; horizontal distance is flow path distance relative to
summit magma chamber. Idealized pink arrows show sources and ascent of magma feeding Kamoamoa
eruption (based on Lundgren et al., 2013). Main part of Kamoamoa dike shown connected to magma
storage zone beneath Makaopuhi Crater and intersecting shallow magma body en route to surface; other
part of dike shown coming from beneath Puʻu ʻŌʻō. Connection between ascending dike and Kamoamoa
eruption site, although not shown, is implied. W and E refer to western and eastern Kamoamoa fissures,
respectively.
5.2 The Puʻu ʻŌʻō eruption
In late May and early June 2010, after nearly 3 years with negligible eruptive
activity within Pu‘u ‘Ō‘ō, lava erupted in and partly filled Puʻu ʻŌʻō’s crater, and another
effusive surge occurred there in October 2010. This followed months of low discharge
from the episode 58 vent (see Chapter 3) and repeated cycles of deflation and inflation
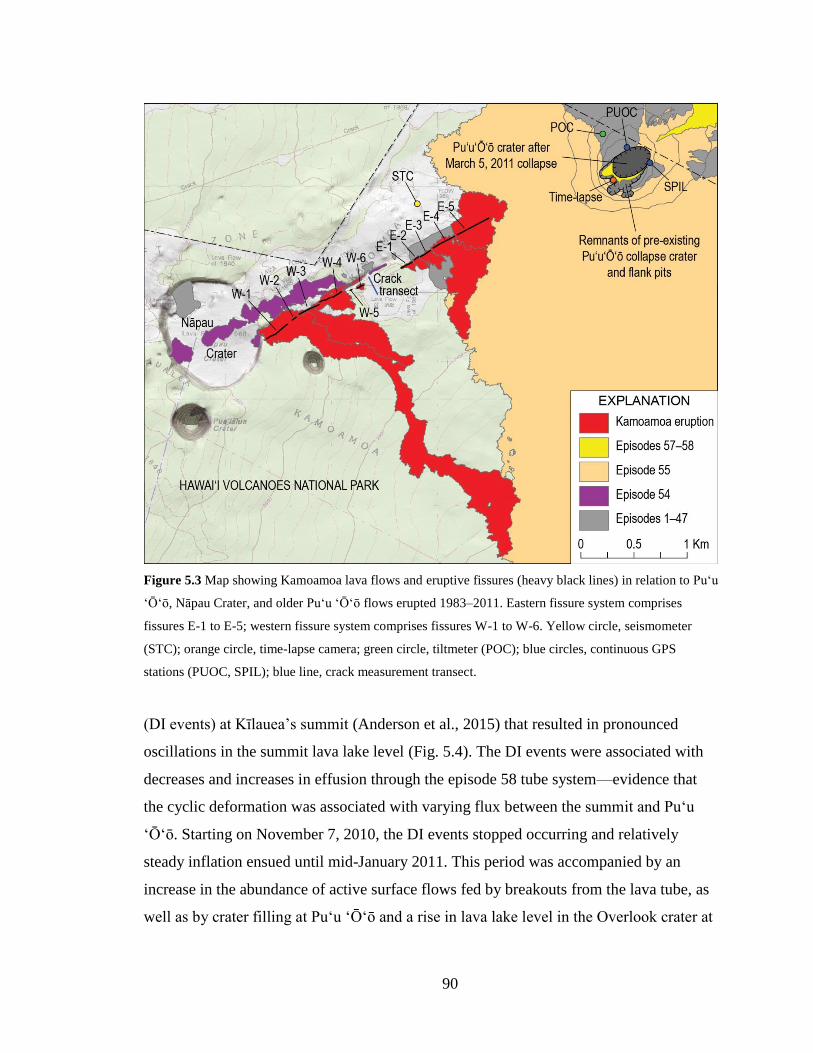
90
Figure 5.3 Map showing Kamoamoa lava flows and eruptive fissures (heavy black lines) in relation to Puʻu
ʻŌʻō, Nāpau Crater, and older Puʻu ʻŌʻō flows erupted 1983–2011. Eastern fissure system comprises
fissures E-1 to E-5; western fissure system comprises fissures W-1 to W-6. Yellow circle, seismometer
(STC); orange circle, time-lapse camera; green circle, tiltmeter (POC); blue circles, continuous GPS
stations (PUOC, SPIL); blue line, crack measurement transect.
(DI events) at Kīlauea’s summit (Anderson et al., 2015) that resulted in pronounced
oscillations in the summit lava lake level (Fig. 5.4). The DI events were associated with
decreases and increases in effusion through the episode 58 tube system—evidence that
the cyclic deformation was associated with varying flux between the summit and Puʻu
ʻŌʻō. Starting on November 7, 2010, the DI events stopped occurring and relatively
steady inflation ensued until mid-January 2011. This period was accompanied by an
increase in the abundance of active surface flows fed by breakouts from the lava tube, as
well as by crater filling at Puʻu ʻŌʻō and a rise in lava lake level in the Overlook crater at
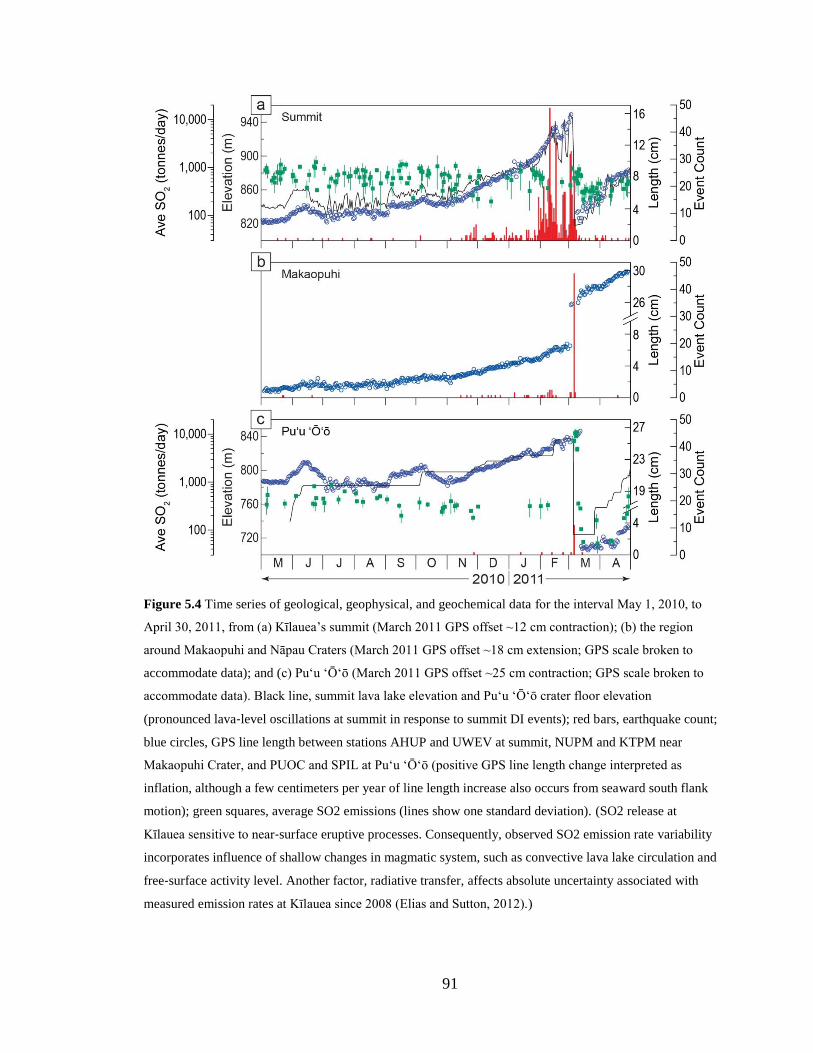
91
Figure 5.4 Time series of geological, geophysical, and geochemical data for the interval May 1, 2010, to
April 30, 2011, from (a) Kīlauea’s summit (March 2011 GPS offset ~12 cm contraction); (b) the region
around Makaopuhi and Nāpau Craters (March 2011 GPS offset ~18 cm extension; GPS scale broken to
accommodate data); and (c) Puʻu ʻŌʻō (March 2011 GPS offset ~25 cm contraction; GPS scale broken to
accommodate data). Black line, summit lava lake elevation and Puʻu ʻŌʻō crater floor elevation
(pronounced lava‐level oscillations at summit in response to summit DI events); red bars, earthquake count;
blue circles, GPS line length between stations AHUP and UWEV at summit, NUPM and KTPM near
Makaopuhi Crater, and PUOC and SPIL at Puʻu ʻŌʻō (positive GPS line length change interpreted as
inflation, although a few centimeters per year of line length increase also occurs from seaward south flank
motion); green squares, average SO2 emissions (lines show one standard deviation). (SO2 release at
Kīlauea sensitive to near‐surface eruptive processes. Consequently, observed SO2 emission rate variability
incorporates influence of shallow changes in magmatic system, such as convective lava lake circulation and
free‐surface activity level. Another factor, radiative transfer, affects absolute uncertainty associated with
measured emission rates at Kīlauea since 2008 (Elias and Sutton, 2012).)
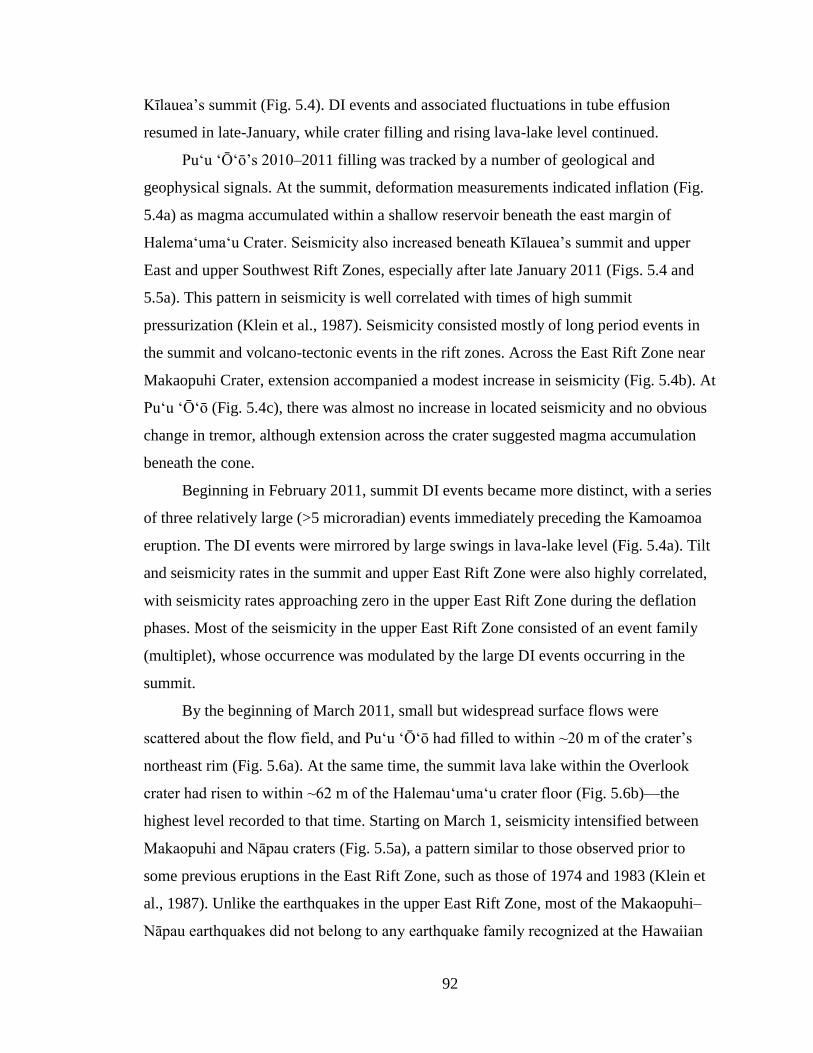
92
Kīlauea’s summit (Fig. 5.4). DI events and associated fluctuations in tube effusion
resumed in late-January, while crater filling and rising lava-lake level continued.
Pu‘u ‘Ō‘ō’s 2010–2011 filling was tracked by a number of geological and
geophysical signals. At the summit, deformation measurements indicated inflation (Fig.
5.4a) as magma accumulated within a shallow reservoir beneath the east margin of
Halemaʻumaʻu Crater. Seismicity also increased beneath Kīlauea’s summit and upper
East and upper Southwest Rift Zones, especially after late January 2011 (Figs. 5.4 and
5.5a). This pattern in seismicity is well correlated with times of high summit
pressurization (Klein et al., 1987). Seismicity consisted mostly of long period events in
the summit and volcano-tectonic events in the rift zones. Across the East Rift Zone near
Makaopuhi Crater, extension accompanied a modest increase in seismicity (Fig. 5.4b). At
Puʻu ʻŌʻō (Fig. 5.4c), there was almost no increase in located seismicity and no obvious
change in tremor, although extension across the crater suggested magma accumulation
beneath the cone.
Beginning in February 2011, summit DI events became more distinct, with a series
of three relatively large (>5 microradian) events immediately preceding the Kamoamoa
eruption. The DI events were mirrored by large swings in lava-lake level (Fig. 5.4a). Tilt
and seismicity rates in the summit and upper East Rift Zone were also highly correlated,
with seismicity rates approaching zero in the upper East Rift Zone during the deflation
phases. Most of the seismicity in the upper East Rift Zone consisted of an event family
(multiplet), whose occurrence was modulated by the large DI events occurring in the
summit.
By the beginning of March 2011, small but widespread surface flows were
scattered about the flow field, and Pu‘u ‘Ō‘ō had filled to within ~20 m of the crater’s
northeast rim (Fig. 5.6a). At the same time, the summit lava lake within the Overlook
crater had risen to within ~62 m of the Halemauʻumaʻu crater floor (Fig. 5.6b)—the
highest level recorded to that time. Starting on March 1, seismicity intensified between
Makaopuhi and Nāpau craters (Fig. 5.5a), a pattern similar to those observed prior to
some previous eruptions in the East Rift Zone, such as those of 1974 and 1983 (Klein et
al., 1987). Unlike the earthquakes in the upper East Rift Zone, most of the Makaopuhi–
Nāpau earthquakes did not belong to any earthquake family recognized at the Hawaiian
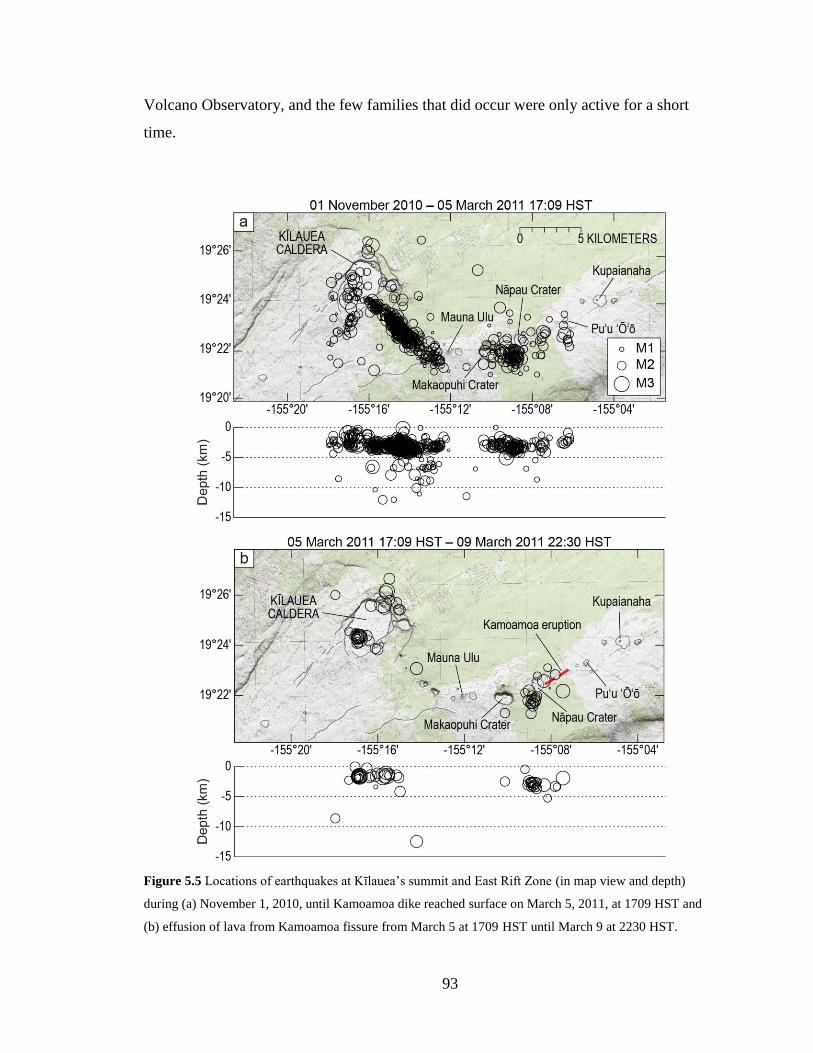
93
Volcano Observatory, and the few families that did occur were only active for a short
time.
Figure 5.5 Locations of earthquakes at Kīlauea’s summit and East Rift Zone (in map view and depth)
during (a) November 1, 2010, until Kamoamoa dike reached surface on March 5, 2011, at 1709 HST and
(b) effusion of lava from Kamoamoa fissure from March 5 at 1709 HST until March 9 at 2230 HST.
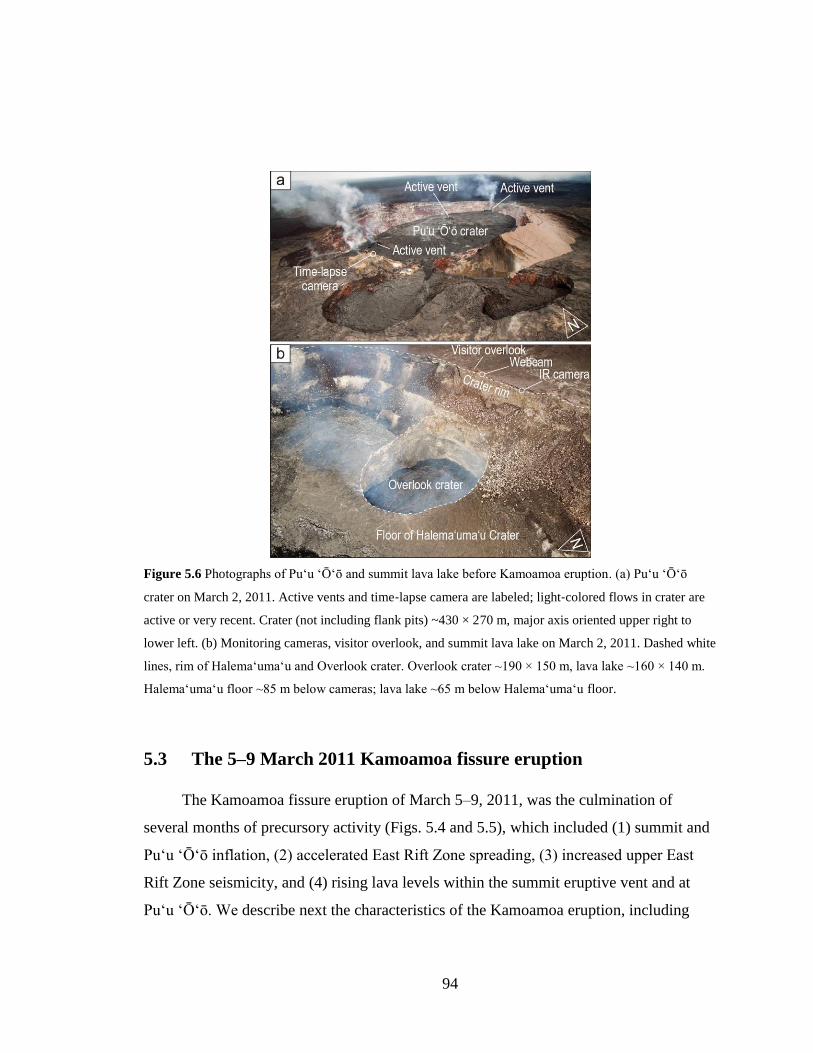
94
Figure 5.6 Photographs of Puʻu ʻŌʻō and summit lava lake before Kamoamoa eruption. (a) Puʻu ʻŌʻō
crater on March 2, 2011. Active vents and time‐lapse camera are labeled; light‐colored flows in crater are
active or very recent. Crater (not including flank pits) ~430 × 270 m, major axis oriented upper right to
lower left. (b) Monitoring cameras, visitor overlook, and summit lava lake on March 2, 2011. Dashed white
lines, rim of Halemaʻumaʻu and Overlook crater. Overlook crater ~190 × 150 m, lava lake ~160 × 140 m.
Halemaʻumaʻu floor ~85 m below cameras; lava lake ~65 m below Halemaʻumaʻu floor.
5.3 The 5–9 March 2011 Kamoamoa fissure eruption
The Kamoamoa fissure eruption of March 5–9, 2011, was the culmination of
several months of precursory activity (Figs. 5.4 and 5.5), which included (1) summit and
Pu‘u ‘Ō‘ō inflation, (2) accelerated East Rift Zone spreading, (3) increased upper East
Rift Zone seismicity, and (4) rising lava levels within the summit eruptive vent and at
Pu‘u ‘Ō‘ō. We describe next the characteristics of the Kamoamoa eruption, including
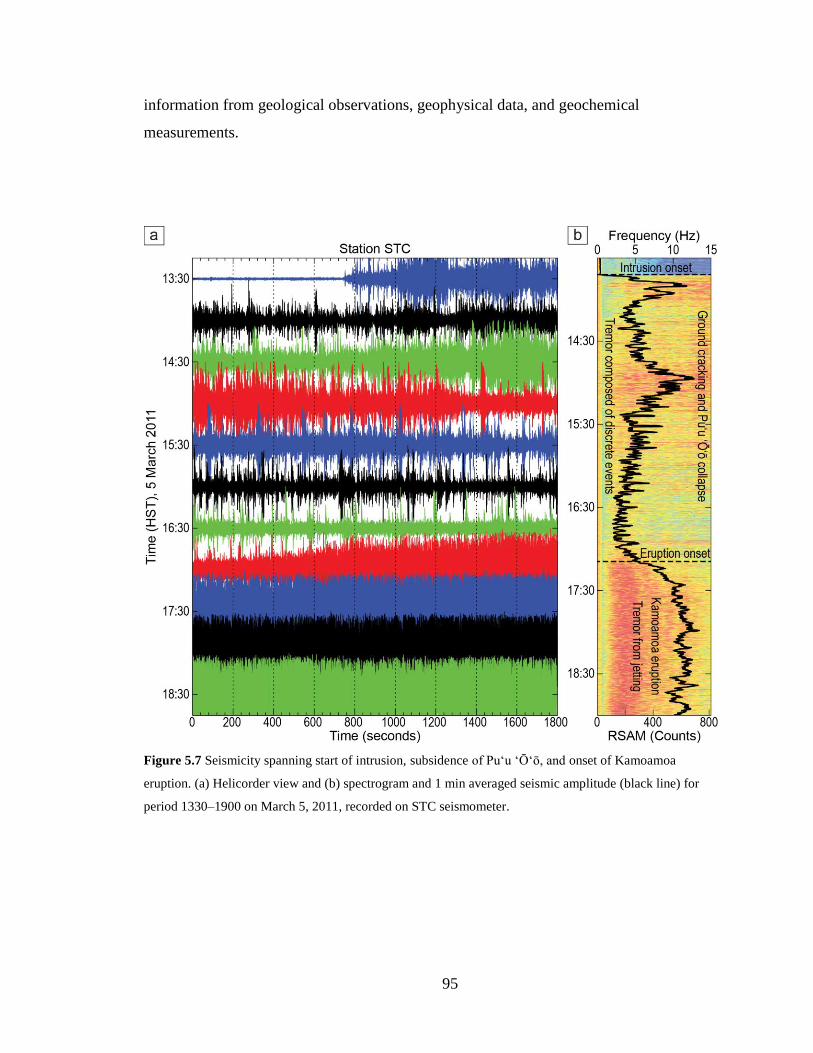
95
information from geological observations, geophysical data, and geochemical
measurements.
Figure 5.7 Seismicity spanning start of intrusion, subsidence of Puʻu ʻŌʻō, and onset of Kamoamoa
eruption. (a) Helicorder view and (b) spectrogram and 1 min averaged seismic amplitude (black line) for
period 1330–1900 on March 5, 2011, recorded on STC seismometer.

96
Figure 5.8 Lava level, tilt, and RSAM compared to Kamoamoa eruptive activity. (a) Red line, radial tilt at
Puʻu ʻŌʻō (station POC); blue line; radial tilt at summit (station UWE); green line, summit lava lake
surface elevation; black line, RSAM near eruption site (station STC). Numbers above RSAM discussed in
text (see Section 5.4.7). (b) Time‐averaged discharge rate for specific dominant fissures. (c) Pink bars,
periods of Kamoamoa eruptive activity showing fountain height (red areas) where quantifiable.
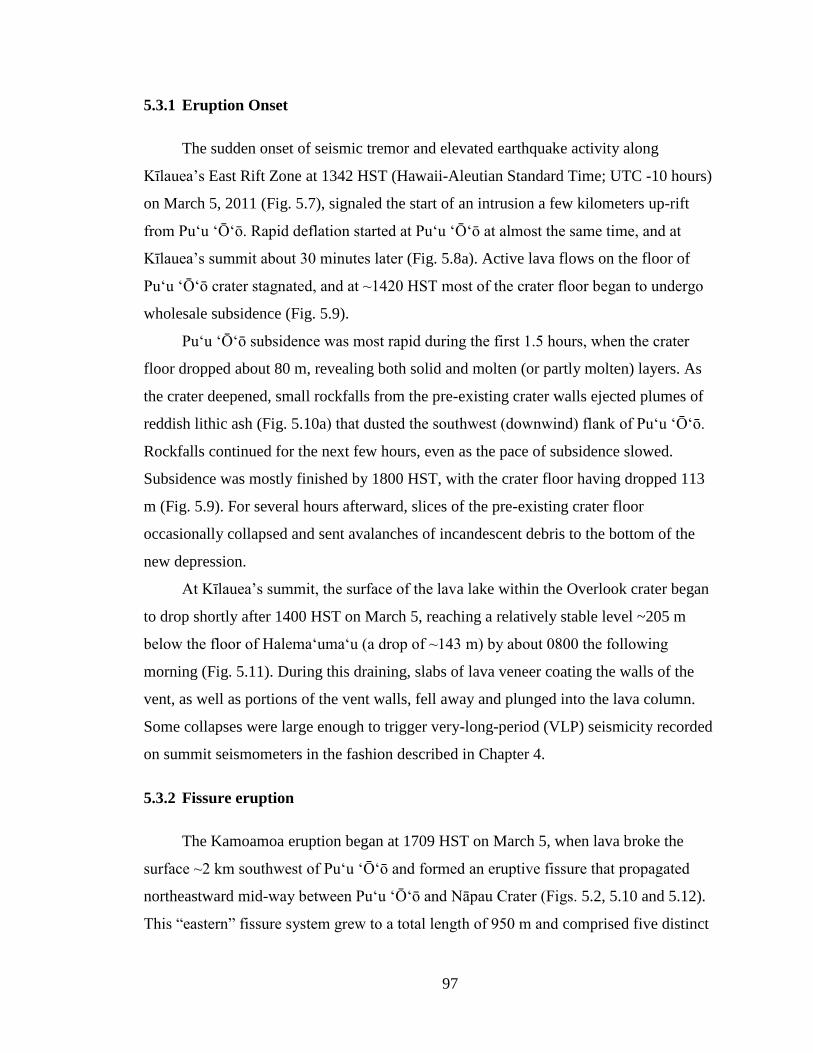
97
5.3.1 Eruption Onset
The sudden onset of seismic tremor and elevated earthquake activity along
Kīlauea’s East Rift Zone at 1342 HST (Hawaii-Aleutian Standard Time; UTC -10 hours)
on March 5, 2011 (Fig. 5.7), signaled the start of an intrusion a few kilometers up-rift
from Pu‘u ‘Ō‘ō. Rapid deflation started at Puʻu ʻŌʻō at almost the same time, and at
Kīlauea’s summit about 30 minutes later (Fig. 5.8a). Active lava flows on the floor of
Pu‘u ‘Ō‘ō crater stagnated, and at ~1420 HST most of the crater floor began to undergo
wholesale subsidence (Fig. 5.9).
Pu‘u ‘Ō‘ō subsidence was most rapid during the first 1.5 hours, when the crater
floor dropped about 80 m, revealing both solid and molten (or partly molten) layers. As
the crater deepened, small rockfalls from the pre-existing crater walls ejected plumes of
reddish lithic ash (Fig. 5.10a) that dusted the southwest (downwind) flank of Pu‘u ‘Ō‘ō.
Rockfalls continued for the next few hours, even as the pace of subsidence slowed.
Subsidence was mostly finished by 1800 HST, with the crater floor having dropped 113
m (Fig. 5.9). For several hours afterward, slices of the pre-existing crater floor
occasionally collapsed and sent avalanches of incandescent debris to the bottom of the
new depression.
At Kīlauea’s summit, the surface of the lava lake within the Overlook crater began
to drop shortly after 1400 HST on March 5, reaching a relatively stable level ~205 m
below the floor of Halema‘uma‘u (a drop of ~143 m) by about 0800 the following
morning (Fig. 5.11). During this draining, slabs of lava veneer coating the walls of the
vent, as well as portions of the vent walls, fell away and plunged into the lava column.
Some collapses were large enough to trigger very-long-period (VLP) seismicity recorded
on summit seismometers in the fashion described in Chapter 4.
5.3.2 Fissure eruption
The Kamoamoa eruption began at 1709 HST on March 5, when lava broke the
surface ~2 km southwest of Puʻu ʻŌʻō and formed an eruptive fissure that propagated
northeastward mid-way between Puʻu ʻŌʻō and Nāpau Crater (Figs. 5.2, 5.10 and 5.12).
This “eastern” fissure system grew to a total length of 950 m and comprised five distinct

98
Figure 5.9 Photographs showing subsidence of Puʻu ʻŌʻō crater floor on March 5, 2011, collected by time‐
lapse camera. Distance from camera to opposite (northeast) rim of crater is ~430 m; camera location shown
in Figures 5.2 and 5.6. (a) 1345 HST, immediately after onset of tremor but before onset of subsidence. (b)
1440 HST, ~20 min after subsidence onset. Central part of crater sagging to form elongate trough aligned
with East Rift Zone orientation; ring fractures beginning to form. (c) 1520 HST, ~1 h after subsidence
onset. Crater floor has dropped along ring fractures, exposing incandescent lava fill accumulated over
preceding several months. (d) 1240 HST on March 13, eight days after subsidence. Deepest part of crater
~133 m below northeast rim.
fissures (E-1 to E-5, labeled from southwest to northeast; Fig. 5.2). A “western” fissure
system (Figs. 5. 2 and 5.13) opened early on March 6 about 1 km farther southwest and
propagated both northeast and southwest. This fissure system reached a final length of
1,050 m and comprised six individual fissures (W-1 to W-6, labeled from southwest to
northeast; Fig. 5.2). The eastern and western fissure systems were separated by 360 m of
heavily cracked ground. Eruption along both fissure systems was initially sporadic, and
activity migrated from one spot to another in semi-random fashion, repeatedly starting
and stopping (Fig. 5.8). Early on March 8, the eruption became focused near the opposing
ends of the two fissure systems (Figs. 5.13 and 5.14).
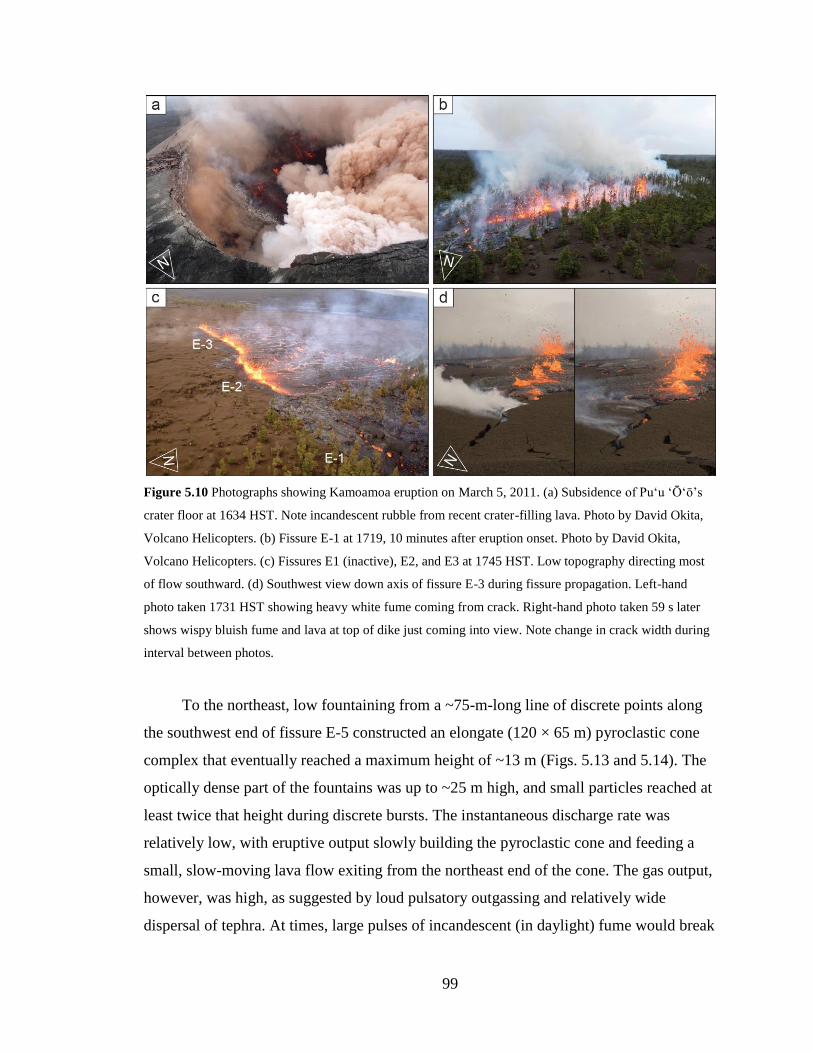
99
Figure 5.10 Photographs showing Kamoamoa eruption on March 5, 2011. (a) Subsidence of Puʻu ʻŌʻō’s
crater floor at 1634 HST. Note incandescent rubble from recent crater-filling lava. Photo by David Okita,
Volcano Helicopters. (b) Fissure E-1 at 1719, 10 minutes after eruption onset. Photo by David Okita,
Volcano Helicopters. (c) Fissures E1 (inactive), E2, and E3 at 1745 HST. Low topography directing most
of flow southward. (d) Southwest view down axis of fissure E-3 during fissure propagation. Left-hand
photo taken 1731 HST showing heavy white fume coming from crack. Right-hand photo taken 59 s later
shows wispy bluish fume and lava at top of dike just coming into view. Note change in crack width during
interval between photos.
To the northeast, low fountaining from a ~75-m-long line of discrete points along
the southwest end of fissure E-5 constructed an elongate (120 × 65 m) pyroclastic cone
complex that eventually reached a maximum height of ~13 m (Figs. 5.13 and 5.14). The
optically dense part of the fountains was up to ~25 m high, and small particles reached at
least twice that height during discrete bursts. The instantaneous discharge rate was
relatively low, with eruptive output slowly building the pyroclastic cone and feeding a
small, slow-moving lava flow exiting from the northeast end of the cone. The gas output,
however, was high, as suggested by loud pulsatory outgassing and relatively wide
dispersal of tephra. At times, large pulses of incandescent (in daylight) fume would break
100
through the fountains like a jet and produce a lava “spray” laced with sparse small clots
of lava. Eruptive activity at E-5 waxed and waned repeatedly—at times, the fountains
would die down to almost nothing, then quickly rebuild to their previous level (Fig. 5.8c).
Figure 5.11 Infrared camera images of lava lake in Overlook crater at southeast edge of Halemaʻumaʻu at
(a) 1400 HST on March 5, 2011, immediately before onset of draining, and (b) 0800 HST on March 6,
2011, after lava lake level had dropped ~143 m and stabilized.
At the W-1 fissure, a ~200-m-long line of fountains with the optically dense part up
to ~15 m high (and small clasts reaching occasionally to ~50 m) constructed an elongate
(115 × 55 m) pyroclastic cone complex with a maximum height of ~14 m (Figs. 5.13 and
5.14). The instantaneous discharge rate at W-1 appeared to be far greater than at E-5, and
W-1 fed a channelized ʻaʻā flow that advanced southeastward (Fig. 5.14c,d). A perched
lava pond grew atop the northeastern half of the W-1 fissure at the head of the lava
channel (Fig. 5.14c). No pyroclastic edifice was constructed over the fountains on the
northeastern half of W-1, because flowing lava constantly removed spatter from the site
of the eruption (e.g., Parcheta et al., 2012). The smaller of the W-1 fountains were
episodically drowned by the lava pond (e.g., Wilson and Head, 1981), sometimes
disappearing completely for a few seconds before bursting back through the pond surface
moments later.
Fissure E-5 shut down on the afternoon of March 8 (Fig. 5.8c), although distant
webcam views indicated occasional spatter bursts overnight. W-1, however, remained
active through the next day. Late in the afternoon of March 9, W-1 began to wane, and

101
the lava level in the perched pond over the northeast end of the fissure began to drop. The
fissure shut down at about 2230 HST on March 9, marking the end of the Kamoamoa
eruption (Fig. 5.8c). The channelized ʻaʻā flow stalled soon afterward, having reached a
final length of 3.3 km (Fig. 5.2). Kīlauea’s East Rift Zone was quiet for several days
following the end of the Kamoamoa eruption. During mid-morning on March 26, lava
began erupting on Puʻu ʻŌʻō’s crater floor, ending an East Rift Zone eruption hiatus of
16.5 days.
5.4 Results
5.4.1 Puʻu ʻŌʻō crater subsidence on 5 March
Prior to subsidence, Pu‘u ‘Ō‘ō had filled to within about 20 m of the northeast rim
of the cone (Fig. 5.6a); the crater floor was then at an elevation of about 840 m (Fig. 5.4c;
the northeast rim elevation was 860 m). The crater floor, held up by the magma body
beneath Puʻu ʻŌʻō, dropped as the magma drained away. After subsidence, the crater
floor was measured by laser rangefinder as 133 m below the northeast rim, or at an
elevation of 727 m. The result was a 380 × 245 m concave depression (Fig. 5.9d) with a
depth of 113 m (compared to the pre-subsidence crater floor height; Fig. 5.4c). The shape
of the Pu‘u ‘Ō‘ō crater floor after subsidence can be approximated by a half ellipsoid. A
subsidence volume (Vs) can therefore be calculated from:
6
hwlVs
(5.1)
where
l is the crater length,
w is the crater width, and
h is the amount of subsidence.
Using the dimensions above, the volume of the crater subsidence is calculated to be
5.5 × 10⁶ m
3. Assuming the duration of the subsidence to be 3.7 hours (based on camera
102
observations), this equates to an average volume loss rate of ~400 m³ s-1
. The magma
body that drained from beneath Puʻu ʻŌʻō was likely a mix of (1) magma that had not yet
circulated to the surface and was too deep to have experienced significant vesiculation,
and (2) magma that had mostly outgassed to atmospheric pressure, and in which its
remaining vesicles may have collapsed upon being carried back to the depth of the
storage chamber; therefore, the calculated volume and volume loss rate could approach
dense-rock equivalent (DRE) values.
In comparison with volume-loss approximations for two previous crater
subsidences at Puʻu ʻŌʻō, which were also calculated using the formula for a half ellipse
(equation 5.1), the volume derived for the 2011 subsidence falls between the 13 × 106 m
3
for the 1997 subsidence associated with episode 54 (Heliker et al., 2003) and the 4.2 ×
106 m
3 for the 2007 subsidence associated with episode 56 (see Chapter 2). Though the
subsidence of Pu‘u ‘Ō‘ō’s crater floor was not fully brittle, involving both brittle and
ductile layers, the subsequent crater fill was probably, in part, a column of brecciated
material that occupied a volume greater than that of the same material preceding the
collapse (Roche et al., 2001). Thus, the crater subsidence volumes calculated in each of
these cases may represent minimum values for the actual volume lost from the magma
storage body beneath Puʻu ʻŌʻō, because the crater floor subsidence included some
disaggregation.
Montgomery-Brown et al. (2010) calculated an approximate volume loss from Puʻu
ʻŌʻō during the episode 56 eruption in 2007 by multiplying the time elapsed from the end
of the eruption until lava reappeared in Puʻu ʻŌʻō by the long-term supply rate to Kīlauea
(0.12 km3 yr
-1; Heliker and Mattox, 2003). Following this example, the 16.5-day hiatus
between the end of the Kamoamoa eruption and the reappearance of lava in Puʻu ʻŌʻō
corresponds to a volume of 5.4 × 10⁶ m
3—strikingly similar to the value calculated from
the volume of crater subsidence. As noted earlier, however, the discharge rate starting at
least by mid-2010 was lower than the long-term discharge rate, perhaps by as much as
25–50% (see Chapter 3), which could reflect a decrease in the rate of supply to Puʻu
ʻŌʻō. While the actual supply rate at the time of the Kamoamoa eruption remains
uncertain, the similarity between these two methods of approximating volume-loss could
be interpreted to indicate that there was actually no significant change in supply rate and
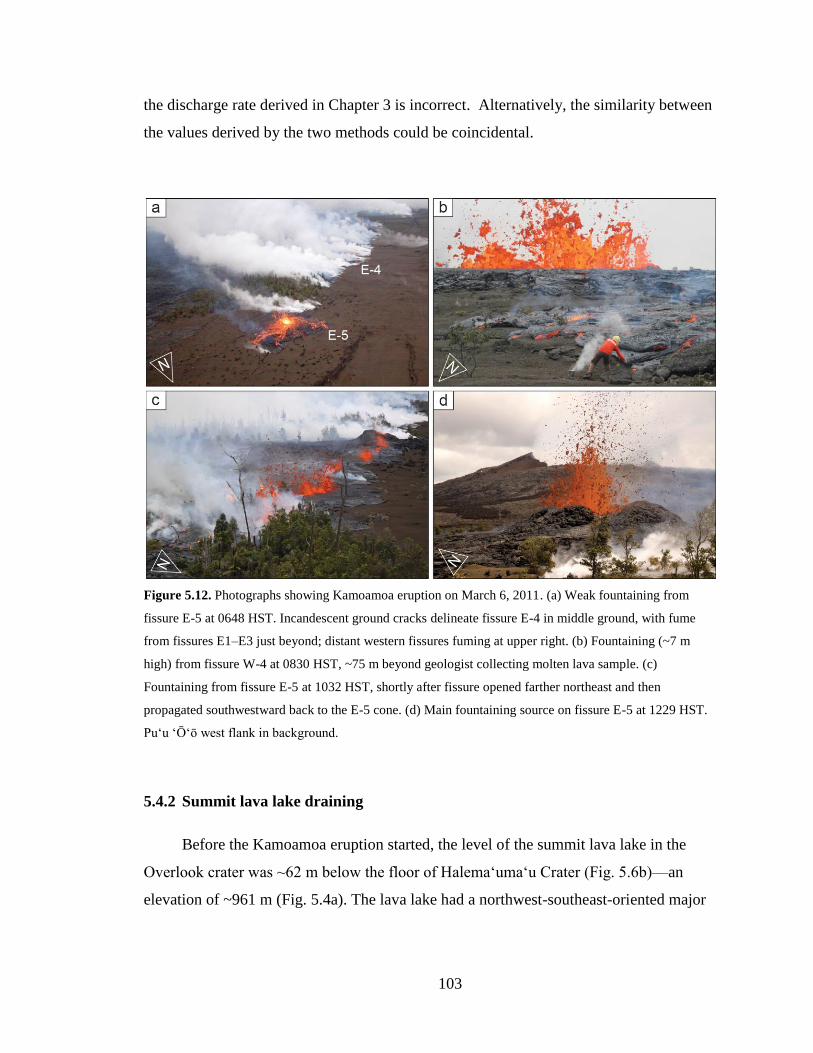
103
the discharge rate derived in Chapter 3 is incorrect. Alternatively, the similarity between
the values derived by the two methods could be coincidental.
Figure 5.12. Photographs showing Kamoamoa eruption on March 6, 2011. (a) Weak fountaining from
fissure E-5 at 0648 HST. Incandescent ground cracks delineate fissure E-4 in middle ground, with fume
from fissures E1–E3 just beyond; distant western fissures fuming at upper right. (b) Fountaining (~7 m
high) from fissure W-4 at 0830 HST, ~75 m beyond geologist collecting molten lava sample. (c)
Fountaining from fissure E-5 at 1032 HST, shortly after fissure opened farther northeast and then
propagated southwestward back to the E-5 cone. (d) Main fountaining source on fissure E-5 at 1229 HST.
Puʻu ʻŌʻō west flank in background.
5.4.2 Summit lava lake draining
Before the Kamoamoa eruption started, the level of the summit lava lake in the
Overlook crater was ~62 m below the floor of Halema‘uma‘u Crater (Fig. 5.6b)—an
elevation of ~961 m (Fig. 5.4a). The lava lake had a northwest-southeast-oriented major
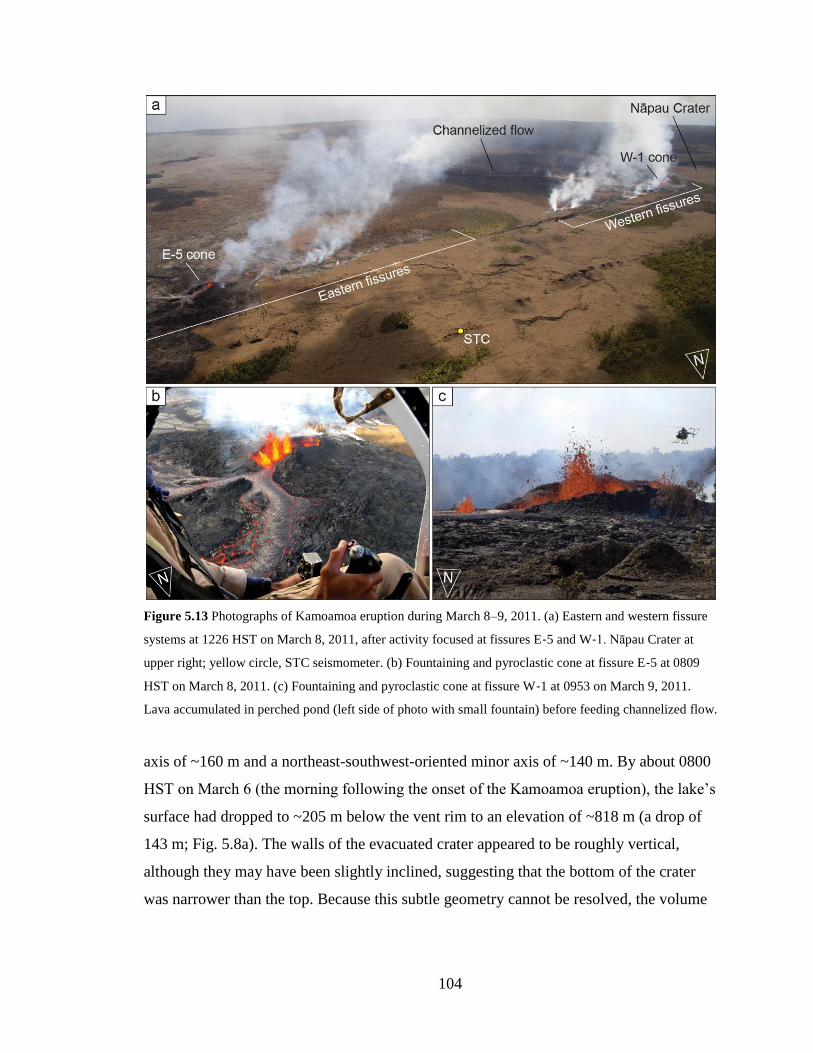
104
Figure 5.13 Photographs of Kamoamoa eruption during March 8–9, 2011. (a) Eastern and western fissure
systems at 1226 HST on March 8, 2011, after activity focused at fissures E‐5 and W‐1. Nāpau Crater at
upper right; yellow circle, STC seismometer. (b) Fountaining and pyroclastic cone at fissure E‐5 at 0809
HST on March 8, 2011. (c) Fountaining and pyroclastic cone at fissure W‐1 at 0953 on March 9, 2011.
Lava accumulated in perched pond (left side of photo with small fountain) before feeding channelized flow.
axis of ~160 m and a northeast-southwest-oriented minor axis of ~140 m. By about 0800
HST on March 6 (the morning following the onset of the Kamoamoa eruption), the lake’s
surface had dropped to ~205 m below the vent rim to an elevation of ~818 m (a drop of
143 m; Fig. 5.8a). The walls of the evacuated crater appeared to be roughly vertical,
although they may have been slightly inclined, suggesting that the bottom of the crater
was narrower than the top. Because this subtle geometry cannot be resolved, the volume
105
of lava drained from the lake (Vd) is derived by modeling the summit vent as an elliptical
cylinder:
4
hwlVd
(5.2)
where
l is the lake length,
w is the lake width, and
h is the amount of lava-lake drop.
Using the vent dimensions stated above and a lava level drop of 143 m, the volume
of lava drained from the lake is ~2.5 × 10⁶ m
3. This suggests an average bulk-volume-
loss rate of ~39 m3 s
-1 during the first 18 hours of drainage, although lava level
measurements indicate that the volume-loss rate was not constant, instead slowing during
those 18 hours (Fig. 5.8a). Using gravity data recorded on the southeast rim of
Halema‘uma‘u Crater (station HOVL), Carbone et al. (2013) calculated an average lava
lake density of ~950 kg m-3
, or about a third of the DRE density of ~2800 kg m-3
. This
corresponds to an average DRE volume loss rate of ~13 m3 s
-1 during drainage and a total
DRE volume loss of ~0.8 × 10⁶ m
3. This estimate, added to the modeled (from InSAR
and GPS data) volume loss of 1.7 × 10⁶ m
3 from the shallow summit magma reservoir
(Lundgren et al., 2013), gives a nominal summit volume loss of ~2.5 × 10⁶ m
3.
5.4.3 Kamoamoa fissure eruption rates
The Kamoamoa eruption was active for a total duration of 4.2 days. The detailed
observations made during the eruption, coupled with field mapping and estimates of flow
thickness, allow calculation of the mean output rate for the entire eruption, as well as for
distinct periods during the eruption. Table 5.1 provides a summary of the duration, area
covered, volume erupted, and time-averaged discharge rate for individual fissures over
the course of the eruption. DRE volumes are based on a void space correction factor of

106
25%, the value used by Wolfe et al. (1988) for Puʻu ʻŌʻō ʻaʻā flows. Durations are based
on observed start and stop times of eruptive activity, which, when not precisely known,
are defined as the temporal mid-point between bracketing observations. Inaccuracy in our
estimates of flow thickness is the largest source of uncertainty in calculating volume,
which could be in error by as much as ±50%.
Table 5.1 Area, DRE volume, duration, time-averaged discharge, and distance to STC seismometer for
Kamoamoa eruptive fissures.
Fissure Area (ha)
DRE Volume
(m3) Duration (h)
Discharge Rate
(m3 s
-1)
Distance to STC
(m)
E-1, E-2, and E-3a 4.12 0.015 × 10
6 2.2 ~2 580; 510; 475
E-4b 23.82 0.27 × 10
6 9.5 ~8 440
E-5c 19.0 0.33 × 10
6 17.7 ~5 500
W-1d 68.61 1.68 × 10
6 44.4 ~10 1765
W-2e 4.0 0.03 × 10
6 3.3 ~3 1580
W-3f 22.43 0.26 × 10
6 10.6 ~7 1500
W-4g
W-4 w/no grabeng
W-4 w/grabeng
5.70
5.25
na
0.043 × 10⁶
0.039 × 10⁶
0.065 × 10⁶
4.1
2.5
4.1
~3
~4
~4 1120
W-5 and W-6h 0.35 0.0013 × 10
6 1.0 ~0.4 1020; 940
Total 139.06 2.7 × 10⁶ 89.5 ~8 —
Notes: DRE volume calculated assuming 25% void space. Three different sets of values shown for fissure
W-4 (see text for discussion). Total volume uses “W-4 w/graben” value. Total duration is actual time spent
in eruption (i.e., not counting inactive periods). aAverage flow thickness for fissures E-1, E-2, and E-3 estimated at 0.5 m.
bAverage flow thickness for fissure E-4 estimated at 1.5 m. Duration of E-4 does not include initial E-4
activity on March 6 or ~20 minutes of E-4 activity during afternoon of March 7. Both were periods of very
low discharge. cFlows from fissure E-5 subdivided into areas with average thicknesses of 1–3 m. Small volume of E-5
cone not included. Duration of E-5 considers main effusive period from this fissure. dFlows from fissure W-1 subdivided into areas with average thicknesses of 1–6 m. Duration of W-1
considers only main effusive period from this fissure. Small volume of W-1 cone not included. eW-2 lava buried by W-1 and W-3 flows before mapped. Area and thickness (1.5 m) approximated from
oblique aerial and ground photographs. fFlows from fissure W-3 subdivided into areas with average thicknesses of 1–3 m. Duration of W-3
considers main effusive period from this fissure. gAverage thickness of W-4 flow outside graben estimated at 1 m (based on thickness of lava exposed in
tree molds). hFissures W-5 and W-6 represent two different eruptive periods on 6 March, but lumped because of small
volume erupted. Average flow thickness estimated at 0.5 m.
During the eruption, lava flows covered 1.39 km2 with a total volume of ~2.7 × 10
6
m3 DRE (Table 5.1). This estimate is considerably lower than that calculated from gas
emissions (a minimum of 7.6 × 10⁶ m
3 DRE; see Gas geochemistry results, below). The

107
gas-based lava-discharge estimate, however, reflects the volume of magma that outgassed
even though not all of this magma necessarily erupted. In fact, the outgassed volume is
no more than a factor of 2 lower than the dike volume modeled from deformation data
(15.6 × 10⁶ m
3 DRE (Lundgren et al., 2013); see Deformation results, below). The
outgassed volume may therefore be a better reflection of not only the magma that
erupted, but also that which intruded shallowly but did not erupt, either freezing in place
or convecting to deeper levels.
Using the mapped flow volume and duration, the time-averaged discharge rate of
the Kamoamoa eruption was approximately 8 m3 s
-1. More than half of the volume was
erupted from the W-1 fissure, with fissures W-3, E-4, and E-5 composing most of the
remainder. The other fissures contributed very little to the overall volume of the flow
field, although the amount erupted from fissure W-4 is unknown, since a significant
portion of its volume poured into a graben north of the fissure between 0736 and 1003
HST on March 6. If the mapped surface area of that part of the flow in the graben is
disregarded, a new volume and time-averaged discharge rate for lava from fissure W-4
that was extruded outside the graben prior to 0736 can be calculated; these assumptions
yield a time-averaged discharge rate that is 53% higher. Assuming this higher rate for the
entire duration of W-4 activity, a revised volume of lava erupted from fissure W-4 can be
calculated (Table 5.1). This is probably more representative of W-4 output than the initial
value calculated from surface area and average thickness alone, but it does not change the
mean output rate calculated for the entire eruption.
For much of the Kamoamoa eruption, discharge occurred simultaneously from
multiple fissures, and discharge from a particular fissure was sometimes episodic and
interspersed with activity from other fissures (Fig. 5.8c). In general, however, the time-
averaged discharge rate increased over the course of the eruption (Fig. 5.8b), and near the
end it had reached a level nearly three times higher (~10 m3 s
-1) than the long-term
average rate (~4 m3 s
-1) over the course of the Puʻu ʻŌʻō eruption (Sutton et al., 2003).
As with other fissure eruptions and dike intrusions during Kīlauea’s ongoing East
Rift Zone activity (e.g., Owen et al., 2000; Rivalta and Segall, 2008; Montgomery-Brown
et al., 2010), there is a discrepancy between the volume of magma withdrawal and that

108
Figure 5.14 Photographs showing Kamoamoa eruption during March 7–9, 2011, and E-5 and W-1
pyroclastic cones on March 17, 2011. (a) 8-m-high fountain on fissure W-3 at 1328 HST on March 7
feeding fast-moving flow extending beyond left side of photo. (b) Fountain 15–20 m high over fissure E-5
at 0810 HST on March 8. (c) Fountains up to 13 m high from fissure W-1 at 0712 HST on March 9.
Northeast part of fissure (to left) erupting through perched lava pond, which feeds channelized flow.
Inactive fissure W-2 fuming at lower left; edge of Nāpau Crater at upper right. (d) Channelized ʻaʻā flow
from fissure W-1 reaching edge of older Puʻu ʻŌʻō flow field at 0727 HST on March 9. Photo overlain with
handheld thermal camera (FLIR SC620) image, clipped to match shape of flow, captured at same time. (e)
Pyroclastic cone constructed over main vents of fissure E-5 as seen on March 17, after Kamoamoa eruption
ended. (f) Pyroclastic cone constructed over main vents of fissure W-1 as seen on March 17.
109
associated with dike intrusion and eruption. DRE volume loss at the summit and Puʻu
ʻŌʻō combine to total 8.0 × 10⁶ m
3, compared to the DRE erupted volume (from field
mapping) plus modeled dike volume of 18.3 × 10⁶ m
3. The erupted/intruded volume is
therefore more than double that lost from beneath the summit and Puʻu ʻŌʻō (Lundgren et
al., 2013)—nearly the same as the ratio between erupted/intruded and lost volumes
calculated for the June 2007 intrusion and eruption (Montgomery-Brown et al., 2010). As
pointed out by Lundgren et al. (2013), this falls within the range of expected volume
ratios for compressible magma (Rivalta and Segall, 2008); therefore, no additional
sources of magma are required to explain the volume discrepancy.
5.4.4 Petrology
During 2000–2001, the petrologic character of East Rift Zone lava shifted to that of
a hybrid comprising two components: (1) a volatile-rich, high-MgO, high-temperature
magma that is fed to Kīlauea from the mantle, and (2) a partially outgassed, lower-MgO,
lower-temperature, partially crystallized resident magma that was stored at shallow levels
beneath the summit and within the rift zones (e.g., Thornber et al., 2015). Through the
early 2000s, lava composition showed a pattern of decreasing magnesia (MgO) and
eruption temperatures, but this trend reversed in 2006 in tandem with a surge in magma
supply to Kīlauea that caused an influx of hotter recharge magma to the eruption site
(Poland et al., 2012). By 2009 (well into episode 58), however, whole-rock
concentrations of MgO had begun declining again, reaching values near 7.0 weight
percent by early 2011. Corresponding magmatic temperatures, based on MgO glass
thermometry (Helz and Thornber, 1987), were about 1140°C. Mineral phenocrysts in
erupted lavas were an assemblage of clinopyroxene, plagioclase, and lower-magnesium
olivine. These observations suggest a progressive increase in the proportion of cooler
resident magma (relative to hotter recharge magma) being erupted from the episode 58
vent after 2009. Thornber et al. (2015) gives a thorough overview of the petrologic trends
and petrographic character of erupted products throughout this period, as well as
subsequent periods discussed below.
Lavas discharged during the Kamoamoa fissure eruption have significantly lower
whole-rock magnesia concentrations than those erupted during episode 58, ranging from
110
6.1 to 6.7 weight percent and corresponding to cooler magmatic temperatures (1130–
1145°C). The mineral assemblage remains a mix of clinopyroxene, plagioclase, and
olivine; however, these phenocrysts display an array of disequilibrium textures indicative
of a complex heating and cooling history (Thornber et al., 2015). As the eruption
progressed, the last products from fissure W-1 had chemical compositions which trended
toward values typical of those observed during episode 58. It seems, then, that the dike
that fed the Kamoamoa eruption either originated from or encountered (and mingled
with) a pod of cooler magma that had been stored within the East Rift Zone (Fig. 5.2).
The East Rift Zone probably contains numerous such isolated magma storage zones, and
the area beneath Makaopuhi Crater, where the dike originated (see Deformation results,
below), has long been thought to be a region of magma storage (Fig. 5.2; e.g., Swanson et
al., 1976). The cooler component was gradually flushed over the course of the eruption,
and, by March 9, lavas began to resemble the compositions erupted from the East Rift
Zone prior to the Kamoamoa activity. In contrast, gases released from fissure W-1
showed an evolved composition even when last measured a few hours before the eruption
shut down (USGS unpublished data).
After the Kamoamoa eruption ended, whole-rock magnesia concentrations that
erupted within Puʻu ʻŌʻō crater varied erratically between 6.5 and 7.5 weight percent, but
the overall trend was a return to values seen during episode 58 (although magmatic
temperatures were slightly cooler, with values around 1140°C or less) (Thornber et al.,
2015). Mineral assemblages continued to include clinopyroxene, plagioclase, and lower-
magnesium olivine, and phenocryst textures still suggested disequilibrium conditions—a
testament to the disruption in the East Rift Zone plumbing system wrought by the
Kamoamoa eruption.
5.4.5 Gas Geochemistry
The Kamoamoa eruptive episode produced the highest SO2 emission rates recorded
at Kīlauea since Puʻu ʻŌʻō’s high fountaining episodes during 1983–1986. For five sets
of measurements spanning March 6–9, emissions averaged 8,500 ± 2,500 t d-1
, with a
peak daily value of 11,000 ± 1,500 t d-1
on March 8 (Fig. 5.4). These reported emission
rates represent a minimum constraint because recent studies indicate that dense, SO2-rich

111
plumes, like that of the Kamoamoa eruption, result in an underestimation of column SO2
and, therefore, calculated emission rates (Elias and Sutton, 2012; Kern et al., 2012).
Neither the East Rift Zone SO2 emissions nor those of the summit showed any clear
premonitory changes during the year leading up to the eruption—in fact, both sites
displayed subtly declining SO2 emissions (Fig. 5.4a,c). Furthermore, summit CO2
emissions, which are closely tied to the magma supply rate to the volcano (Gerlach et al.,
2002, Poland et al., 2012), showed relatively steady, or even declining, emissions for the
year running up to the eruption, suggesting no significant changes in magma supply prior
to the Kamoamoa eruption.
Post-Kamoamoa SO2 emissions from the East Rift Zone declined rapidly, hovering
at or below the lower limit of quantification (approximately 100 t d-1
) for six weeks
before finally recovering and surpassing the pre-eruption levels (Fig. 5.4c). Summit SO2
emissions after the Kamoamoa eruption decreased as well, although in a more muted
fashion, with values never dropping below 200 t d-1
(Fig. 5.4a).
Taken together, the post-eruptive SO2 extinction from Kīlaueaʻs East Rift Zone,
and the sharp depression of summit emissions through and beyond the Kamoamoa
eruption, supports the idea that the dike feeding the Kamoamoa fissure system tapped
magma sources beneath both the summit and Pu‘u ‘Ō‘ō. A rough gas-based estimate of
lava output for the Kamoamoa eruption, using the method of Sutton et al. (2001),
indicates that 7.6 × 10⁶ m
3 of dense rock equivalent (DRE) magma was outgassed to
atmospheric pressure during March 6–9, although only a fraction of this may have
actually erupted. The gas data suggest that this value is a minimum magma-outgassed
constraint, as it is based on minimum-constraint SO2 emission rates. Actual values could
be up to a factor of three higher.
5.4.6 Deformation
The Kamoamoa eruption was accompanied by deflation at the summit and Pu‘u
‘Ō‘ō, as well as by widening of the East Rift Zone (Figs. 5.8a and 5.15). Subsidence at
the summit occurred at a steadily decreasing rate over the course of the eruption and
switched to inflation at about 1700 HST on March 9 (shortly before the end of activity at
fissure W-1). GPS results indicate a maximum subsidence during March 5–9 of 15 cm
112
along the east margin of Halema‘uma‘u Crater. Summit deformation modeled from
Interferometric Synthetic Aperture Radar (InSAR) and Global Positioning System (GPS)
data suggest a volume loss of 1.7×10⁶ m
3 from a magma reservoir at 1.7 km depth
(Lundgren et al., 2013), which is a known area of magma storage that has deflated during
previous East Rift Zone dike intrusions and eruptions (e.g., Owen et al., 2000;
Montgomery-Brown et al., 2010). At Pu‘u ‘Ō‘ō, deflation also waned over time but
continued beyond the end of the eruption until the afternoon of March13. Deformation at
Pu‘u ‘Ō‘ō was highly localized, suggesting a source perhaps only a few hundred meters
deep, which is consistent with previous estimates of Pu‘u ‘Ō‘ō magma storage (Heliker et
al., 2003).
Deformation modeling based on InSAR and GPS data from the East Rift Zone
indicate that the magma initially feeding the Kamoamoa eruption originated at ~3 km
depth near the eastern edge of Makaopuhi Crater (Lundgren et al., 2013) and ascended
along an inclined (~45º) trajectory. The eruption began when the magma arrived at the
surface ~3.5 hours later, after traveling an ascent-path distance of ~4.25 km. This
suggests that the dike tip advanced at an average velocity of ~1.2 km hr-1
(0.3 m s-1
),
similar to average dike propagation rates for past Kīlauea intrusions (~1 km hr-1
; Klein et
al., 1987; Okamura et al., 1988; Mangan et al., 1995; Owen et al., 2000; Cervelli et al.,
2002). The horizontal component of this vector equates to ~0.8 km hr-1
(0.2 m s-1
). Field
observations of the opening of fissures E-1 to E-3 show that the fissures ruptured over a
distance of 330 meters in about 25 minutes, or 0.8 km hr-1
—the same as the horizontal
propagation rate of the dike as it ascended toward the surface.
The East Rift Zone spread apart by several meters at the site of the Kamoamoa
eruption, with progressive opening over time as indicated by both fracture measurements
and InSAR data (Lundgren et al., 2013). The ground between the eastern and western
fissure systems is covered by tephra from the 1983–1986 high fountains of the Pu‘u ‘Ō‘ō
eruption. As a result, cracks that formed due to emplacement of the Kamoamoa dike were
very well exposed (Fig. 5.16a). A transect perpendicular to the rift zone on March 6
measured the opening amounts of cracks in the area, finding a total of 1.5 m of
cumulative crack opening over a distance of 200 m (Fig. 5.16b). The total opening was
2.75 m when the transect was repeated on March 9 (Fig. 5.16b). These amounts are
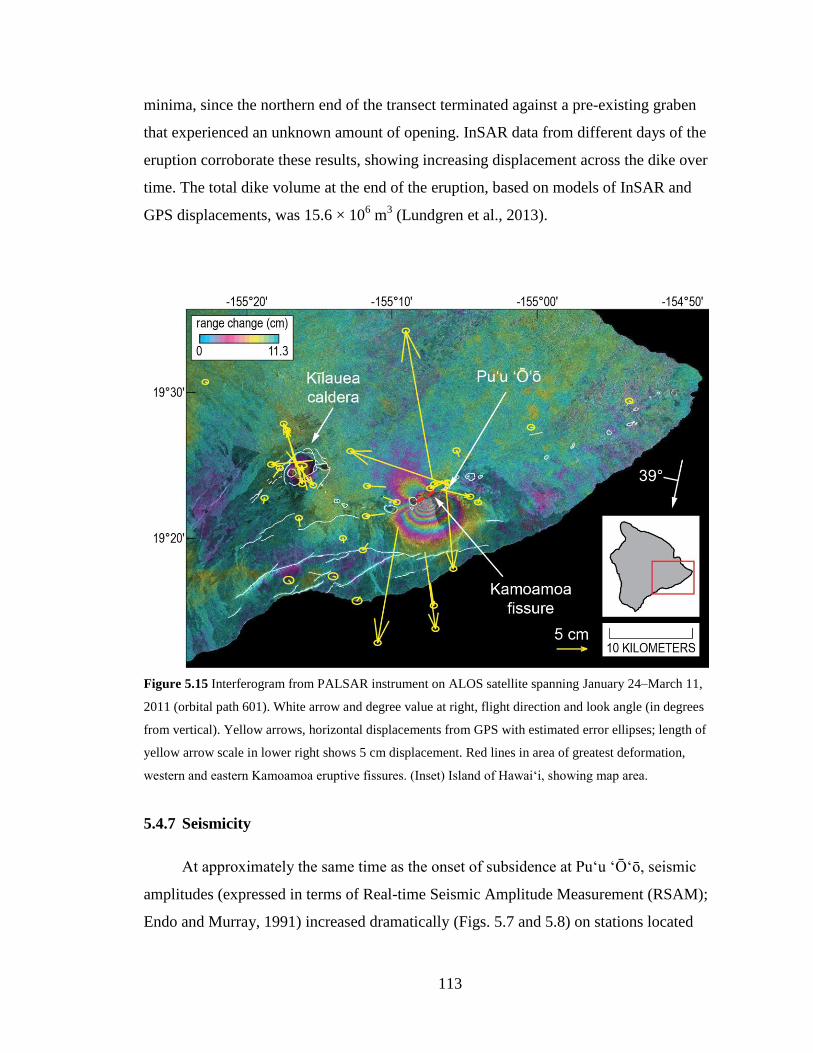
113
minima, since the northern end of the transect terminated against a pre-existing graben
that experienced an unknown amount of opening. InSAR data from different days of the
eruption corroborate these results, showing increasing displacement across the dike over
time. The total dike volume at the end of the eruption, based on models of InSAR and
GPS displacements, was 15.6 × 10⁶ m
3 (Lundgren et al., 2013).
Figure 5.15 Interferogram from PALSAR instrument on ALOS satellite spanning January 24–March 11,
2011 (orbital path 601). White arrow and degree value at right, flight direction and look angle (in degrees
from vertical). Yellow arrows, horizontal displacements from GPS with estimated error ellipses; length of
yellow arrow scale in lower right shows 5 cm displacement. Red lines in area of greatest deformation,
western and eastern Kamoamoa eruptive fissures. (Inset) Island of Hawai‘i, showing map area.
5.4.7 Seismicity
At approximately the same time as the onset of subsidence at Pu‘u ‘Ō‘ō, seismic
amplitudes (expressed in terms of Real-time Seismic Amplitude Measurement (RSAM);
Endo and Murray, 1991) increased dramatically (Figs. 5.7 and 5.8) on stations located
114
along the East Rift Zone (PAU, STC and KNH). The seismic signal was initially
composed of discrete events that were often so close together temporally that they
combined to create a tremor-like signal (Fig. 5.7a). Most of these events did not record on
enough stations to be located; however, it is clear that the seismicity was associated both
with dike propagation between Makaopuhi Crater and Nāpau Crater and the failure of
Pu‘u ‘Ō‘ō’s crater floor. Long-period and volcano-tectonic events were simultaneously
present. Once fountaining along the Kamoamoa fissure started, the character of tremor
changed at the station closest to the fissure site (STC), becoming more energetic and also
having a broader and higher-frequency spectral signature than previous activity (Fig.
5.7b).
For the remainder of the eruption, tremor recorded at station STC (using RSAM as
a proxy) had frequencies between 1.5 and 7 Hz, and tremor amplitudes generally matched
changes in fountaining (Fig. 5.8). The amplitude of tremor (and RSAM value) recorded
on STC depended on two factors: (1) the intensity of the source, and (2) the distance from
the source to the seismometer. The distance between STC and the fountaining source
centroid on each fissure ranged from 440 m (E-4) to 1765 m (W-1) (Table 5.1). Clearly,
when two fountaining sources occurred simultaneously, the closer source was the
dominant signal, assuming both sources had similar intensities.
Over the course of the eruption, large changes in RSAM corresponded to variations
in fountain behavior. A significant bump in RSAM during ~1700–1930 HST on March 5
corresponded to the initiation of fountaining from fissures E-1, E-2 and E-3 (see 1, Fig.
5.8a). Even though the fountain heights and rate of extrusion were low, STC was only
~500 m away, and thus the response in RSAM was significant. Activity resumed shortly
after midnight on March 6 with fountaining at fissure W-3 (1500 m distance from STC)
occurring during a small, temporary bump in RSAM. Another small rise in RSAM started
at ~0140 HST on March 6 but began to climb more rapidly at ~0240, when sporadic
activity started at fissures E-3 and (or) E-4 and propagated to E-5 (~500 m from STC; see
2, Fig. 5.8a). Fissure W-4 activated during the decline of this RSAM anomaly, but W-4’s
distance from STC resulted in no significant contribution to the RSAM compared to the
decline in activity at the eastern fissures. Another increase in RSAM started at ~0945
HST on March 6. As the RSAM ramped up, eruptive activity resumed at fissure E-5
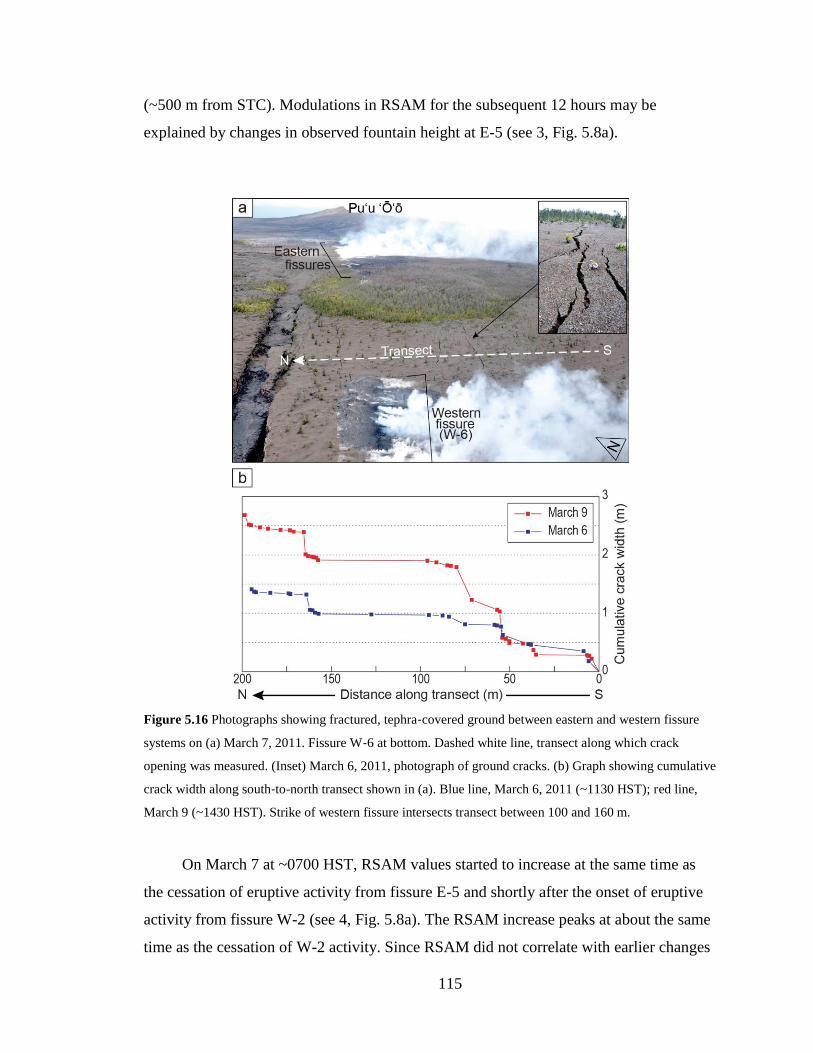
115
(~500 m from STC). Modulations in RSAM for the subsequent 12 hours may be
explained by changes in observed fountain height at E-5 (see 3, Fig. 5.8a).
Figure 5.16 Photographs showing fractured, tephra‐covered ground between eastern and western fissure
systems on (a) March 7, 2011. Fissure W‐6 at bottom. Dashed white line, transect along which crack
opening was measured. (Inset) March 6, 2011, photograph of ground cracks. (b) Graph showing cumulative
crack width along south‐to-north transect shown in (a). Blue line, March 6, 2011 (~1130 HST); red line,
March 9 (~1430 HST). Strike of western fissure intersects transect between 100 and 160 m.
On March 7 at ~0700 HST, RSAM values started to increase at the same time as
the cessation of eruptive activity from fissure E-5 and shortly after the onset of eruptive
activity from fissure W-2 (see 4, Fig. 5.8a). The RSAM increase peaks at about the same
time as the cessation of W-2 activity. Since RSAM did not correlate with earlier changes
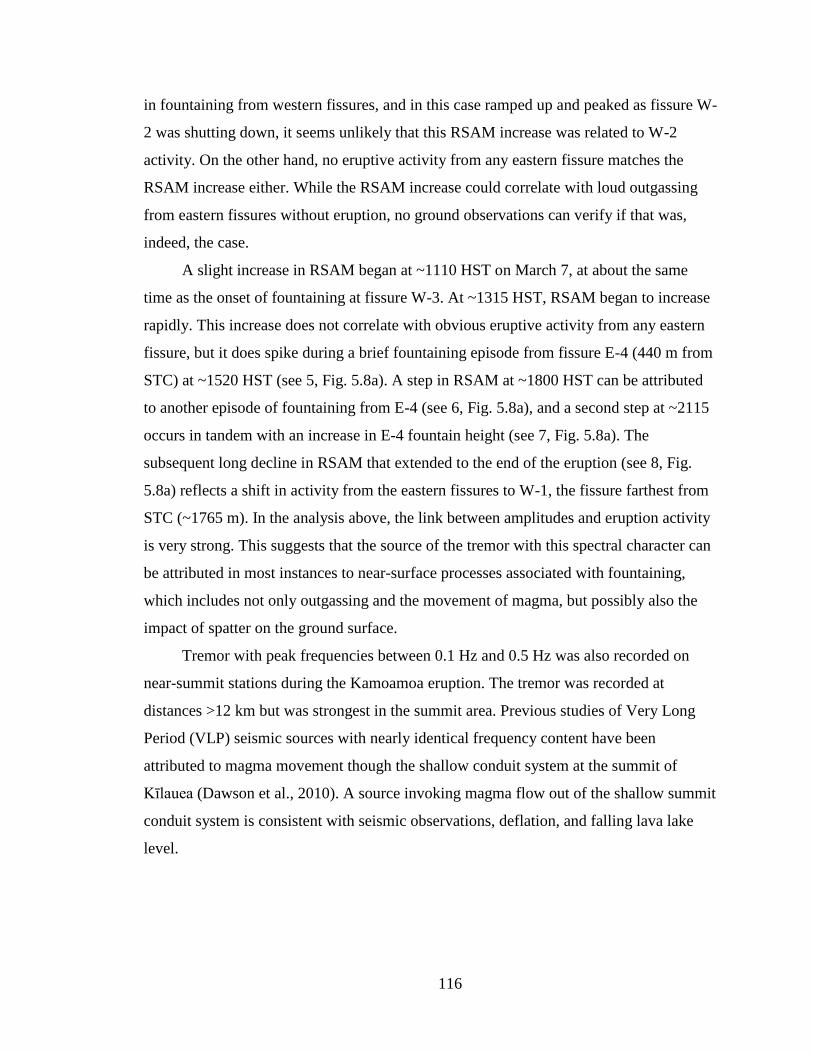
116
in fountaining from western fissures, and in this case ramped up and peaked as fissure W-
2 was shutting down, it seems unlikely that this RSAM increase was related to W-2
activity. On the other hand, no eruptive activity from any eastern fissure matches the
RSAM increase either. While the RSAM increase could correlate with loud outgassing
from eastern fissures without eruption, no ground observations can verify if that was,
indeed, the case.
A slight increase in RSAM began at ~1110 HST on March 7, at about the same
time as the onset of fountaining at fissure W-3. At ~1315 HST, RSAM began to increase
rapidly. This increase does not correlate with obvious eruptive activity from any eastern
fissure, but it does spike during a brief fountaining episode from fissure E-4 (440 m from
STC) at ~1520 HST (see 5, Fig. 5.8a). A step in RSAM at ~1800 HST can be attributed
to another episode of fountaining from E-4 (see 6, Fig. 5.8a), and a second step at ~2115
occurs in tandem with an increase in E-4 fountain height (see 7, Fig. 5.8a). The
subsequent long decline in RSAM that extended to the end of the eruption (see 8, Fig.
5.8a) reflects a shift in activity from the eastern fissures to W-1, the fissure farthest from
STC (~1765 m). In the analysis above, the link between amplitudes and eruption activity
is very strong. This suggests that the source of the tremor with this spectral character can
be attributed in most instances to near-surface processes associated with fountaining,
which includes not only outgassing and the movement of magma, but possibly also the
impact of spatter on the ground surface.
Tremor with peak frequencies between 0.1 Hz and 0.5 Hz was also recorded on
near-summit stations during the Kamoamoa eruption. The tremor was recorded at
distances >12 km but was strongest in the summit area. Previous studies of Very Long
Period (VLP) seismic sources with nearly identical frequency content have been
attributed to magma movement though the shallow conduit system at the summit of
Kīlauea (Dawson et al., 2010). A source invoking magma flow out of the shallow summit
conduit system is consistent with seismic observations, deflation, and falling lava lake
level.
117
5.5 Discussion
The exceptional suite of geological, geophysical, and geochemical observations
collected before and during the Kamoamoa eruption provides an excellent window into
the mechanism for eruptive activity that can be applied to future episodes of eruptive
change at Kīlauea (and elsewhere). Based on these data, it can be concluded that the
Kamoamoa eruption was caused by an imbalance between the rates of magma supply and
eruption. Similar imbalances, regardless of whether they are controlled by an increase in
supply or a decrease in output, have caused other changes in activity during the Puʻu ʻŌʻō
eruption, such as at the June 2007 eruption at Kāne Nui o Hamo. This is in contrast to
eruptive changes that occur in response to the “passive” opening of the rift (e.g. January
1997 and September 1999 intrusions (Owen et al., 2000; Cervelli et al., 2002)), which is
related to seaward motion of Kīlauea’s south flank.
The time-averaged discharge rate of the episode 58 vent in 2007 was approximately
6 m3 s
-1 (0.18 km
3 yr
-1; Poland et al., 2012). By mid-2010, however, the time-averaged
discharge rate from that vent had dropped precipitously by several times (to ~1–2 m3 s
-1;
see Chapter 3). The decline in discharge rate was reflected in a waning of lava flow
activity on the flow field between the East Rift Zone and the ocean, as well as by a
decrease in the SO2 emission rate from the East Rift Zone. Unfortunately, the SO2
emission rates cannot be used to precisely quantify the discharge rate as was possible
prior to 2008 (Sutton et al., 2001, 2003) because lava erupting from the East Rift Zone
after 2008 is thought to have already partly outgassed as it circulated through the summit
lava lake (Elias and Sutton, 2012). Nevertheless, the decrease in SO2 emission rates from
the East Rift Zone during 2009–2010 (which, at the end of 2010, were the lowest
recorded to that time since vehicle-based measurements began in 1992 (Elias and Sutton,
2012)) supports direct geological observations of a decline in discharge rate.
The influence of a decrease in magma throughput on the shallow, subhorizontal
conduit connecting Puʻu ʻŌʻō to the episode 58 vent, its top at a depth of no more than a
few hundred meters (Fig. 5.2; Poland et al., 2008a), probably induced cooling and
shrinking of the conduit. This would have the effect of reducing the conduit’s cross-
sectional area and, hence, its carrying capacity. The reduction in carrying capacity was
probably exacerbated by interruptions in magma transport from the summit to the East
118
Rift Zone caused by repeated DI events. When the DI events stopped occurring for
several months starting in November 2010, the conduit was not able to accommodate the
supply of magma being fed constantly from the summit, and pressure built quickly within
Kīlauea’s shallow magma plumbing system (beneath the summit and within the East Rift
Zone). The increase in pressure was manifested as uplift at the summit and Puʻu ʻŌʻō and
as extension across the East Rift Zone (Fig. 5.4), and also as an increase in the number of
earthquakes beneath the summit and upper East Rift Zone (Figs. 5.4 and 5.5). Eventually,
the system reached its breaking point, and the weakest link—in this case, the East Rift
Zone near Nāpau Crater—failed. This is not surprising, given the history of the area,
which has been the site of frequent eruptions over the past several decades, including in
1961, 1963, 1965, 1968, 1983 (episode 1 of the Puʻu ʻŌʻō eruption), and 1997 (episode
54 of the Puʻu ʻŌʻō eruption). These and previous eruptions might have left residual pods
of melt in the subsurface that could be incorporated into subsequent eruptions, as
indicated by petrologic evidence from early Puʻu ʻŌʻō lavas (Garcia et al., 1992) and the
1997 Nāpau Crater eruption (Thornber et al., 2003), as well as the Kamoamoa eruption.
The pressurization of Kīlauea’s magma plumbing system, as well as periods of
filling of the Puʻu ʻŌʻō crater during 2010 (in particular, the sustained filling that began
in November of that year), is interpreted as being caused by an imbalance between the
amount of magma arriving at Puʻu ʻŌʻō and the amount being erupted from the episode
58 vent. A small increase in the rate of magma supply to Kīlauea also cannot be ruled
out, especially since supply has been shown to fluctuate on time scales of years (Poland
et al., 2012). Such an increase in supply could not have been large, given the lack of any
substantive change in the rate of CO2 emission from the summit, and may be part of a
natural waxing and waning of magma supply that is generally too small to be recognized.
Regardless, the volume of magma reaching Puʻu ʻŌʻō exceeded that which could be
erupted from the episode 58 vent, resulting in a backup that caused the volcano’s summit
and East Rift Zone magma systems to pressurize and eventually rupture, leading to the
Kamoamoa fissure eruption.
Although fed initially by magma from both Puʻu ʻŌʻō and the summit, the summit
probably contributed the bulk of the magma being erupted after the first few hours.
Deflation at Kīlauea’s summit decayed rapidly and smoothly following eruption onset

119
(Fig. 5.8a), and there were no geophysical changes that matched the intermittency of the
Kamoamoa eruption as it jumped between fissures during the initial three days of the
eruption. If the transport of magma from the summit to the Kamoamoa eruption site
occurred in a steady-state fashion, as suggested by the smoothness of the tilt record, then
variations in eruptive location and output must have been caused by more localized
factors, such as changes in magma viscosity, the near-surface stress field, or the shape of
the erupting fissures over time. As with many basaltic fissure eruptions, activity
eventually focused on a single fissure (W-1), which was the dominant source of lava
discharge over the last two days of the eruption (Fig. 5.8c; Table 5.1).
Once the excess pressure that had accumulated during 2010 and early 2011 had
dissipated, the pressure gradient between the summit and the Kamoamoa fissure was not
sufficient to sustain the eruption. This allowed activity to cease, and the Kamoamoa dike
presumably cooled thereafter due to the large thermal gradient between the dike and the
surrounding country rock (Wilson and Head, 1981). After the eruption ended, pressure
began to climb within Kīlauea’s magma storage areas and transport pathways in response
to the continuous supply of magma to the volcano. This pressure led to the reappearance
of the summit lava lake in the Overlook crater and was eventually directed toward
restarting eruptive activity at Puʻu ʻŌʻō, probably because that well-worn conduit
remained hot and provided an easy way for magma to reach the surface along the East
Rift Zone.
The 2010–2011 gradual abandonment of the episode 58 vent and onset of the
episode 59 Kamoamoa fissure eruption bears striking resemblance to the 1991–1992
slowdown of the episode 48 Kupaianaha vent and onset of the episode 49 fissure. In the
latter case, output from Kupaianaha waned over several months, while the summit
inflated and eruptive activity increased at Puʻu ʻŌʻō (Kauahikaua et al., 1996). Also
during 1990–1991, a series of seismic swarms in the upper East Rift Zone, interpreted as
intrusions, interrupted magma flow to the eruption site (Kauahikaua et al., 1996; Heliker
and Mattox, 2003). Kauahikaua et al. (1996) interpreted these events as an indication that
cooling and crystallization had caused the magma reservoir beneath Kupaianaha to
become increasingly isolated from the rest of the magmatic system, which led to a
decline in the magma pressure driving the eruption. The up-rift buildup in pressure in
120
response to the Kupaianaha slowdown probably led to the episode 49 fissure eruption
between Puʻu ʻŌʻō and Kupaianaha in November 1991 (Mangan et al., 1995), although
Kupaianaha continued to be weakly active until February 1992 (Kauahikaua et al., 1996).
Based on the examples from the Kupaianaha decline and episode 49 fissure
eruption and from the episode 58 decline and Kamoamoa fissure eruption, it should be
possible to project the likelihood of future changes in eruptive activity several months in
advance, provided the activity follows a similar pattern. Such changes are most likely to
occur when eruption is occurring at a vent away from Puʻu ʻŌʻō but still connected to
Puʻu ʻŌʻō via a shallow conduit. Our model is not, however, suitable for forecasting
fissure eruptions like that which occurred in 1997 from Nāpau Crater (Owen et al., 2000;
Thornber et al., 2003). As discussed above, that eruption, as well as a dike intrusion in
1999 (Cervelli et al., 2002), were inferred to have resulted from passive opening of the
East Rift Zone due to seaward motion of the south flank, and neither event was preceded
by summit inflation or increased East Rift Zone spreading. The transitions of eruptive
activity away from both the episode 48 (in 1991–1992) and episode 58 (2011) vents, and
the ensuing fissure eruptions, were, in contrast, associated with waning lava effusion and
pressurization of the magmatic system.
The magma transport pathway between the summit and Puʻu ʻŌʻō is robust after
decades of activity and continues to be used, even when lava effusion is focused away
from Puʻu ʻŌʻō. In contrast, conduits associated with vents that are satellitic to Puʻu ʻŌʻō
tend to be shallow and more susceptible to choking by minor changes in magma supplied
to the vent. Repeated interruptions in magma flow from the summit to the East Rift Zone,
either due to up-rift intrusions, DI events, or other processes, could therefore cause the
satellite vent system to cool and become isolated. The discharge rate would wane as a
result, causing pressurization of Kīlauea’s magma plumbing system manifested as
inflation of the summit (along with inflation at the eruption site and spreading of the East
Rift Zone), increases in seismicity along the upper East Rift Zone, and rising lava level
within the summit eruptive vent. Eruptive activity at the satellite vent would decline,
while lava effusion at Puʻu ʻŌʻō would increase. Once a critical threshold is reached, the
conduit system will rupture in response to the building pressure.

121
5.6 Summary and Conclusions
The March 5–9, 2011, Kamoamoa fissure eruption (episode 59) occurred as part of
a shift in vent location of the long-lived Puʻu ʻŌʻō eruption at Kīlauea, which has been
ongoing since 1983. On the afternoon of March 5, a dike began propagating from the
East Rift Zone conduit between Makaopuhi and Nāpau craters (a site of repeated fissure
eruptions since the 1960s), originating from and (or) intersecting and incorporating older,
cooler, more evolved magma. Magma from Puʻu ʻŌʻō was also diverted into the growing
dike, causing the cone’s crater floor to drop. The lava lake in the Overlook crater began
to drain as magma likewise withdrew from beneath Kīlauea’s summit. The dike reached
the surface about 3.5 hours after its initiation and fed an eruption that extended over more
than 2 km along two fissure systems (each of which was composed of 5–6 fissures).
Eruptive activity jumped between the fissures during the first three days before finally
settling on the westernmost fissure for the final day of the eruption. The total volume
erupted was approximately 2.7 × 10⁶ m
3, and the peak eruption rate was about 3 times
higher than the long-term average eruption rate from Puʻu ʻŌʻō.
The Kamoamoa eruption was probably a result of the gradual shutdown of the
episode 58 vent, which was located about 2 km down-rift of Puʻu ʻŌʻō. The vent had
been active since 2007 but experienced a slow decline in eruption rate that became
evident in 2010. Repeated interruptions in magma flow from the summit to the East Rift
Zone due to cycles of summit deflation and inflation may have led to the gradual cooling
and isolation of the episode 58 conduit, which in turn caused pressurization within
Kīlauea’s magma system. The pressurization was manifested by inflation of the summit
and Puʻu ʻŌʻō, spreading of the East Rift Zone, increased seismicity along the upper East
Rift Zone, and rising lava levels within both the summit eruptive vent and Puʻu ʻŌʻō’s
crater. The activity culminated in the Kamoamoa fissure eruption, after which the locus
of long-term lava effusion moved back to Puʻu ʻŌʻō, and the episode 58 vent ceased
erupting altogether. The 2010–2011 pattern of activity strongly resembled that of 1990–
1992, when waning of the Kupaianaha eruptive vent culminated in an East Rift Zone
fissure eruption and subsequent shift in eruptive activity to Puʻu ʻŌʻō. Based on these
patterns and the excellent geological, geophysical, and geochemical monitoring of

122
Kīlauea, it should be possible to recognize similar progressions months in advance of any
shifts in eruption style and/or location.

123
Chapter 6
Conclusions
6.1 Overview: Role of imaging technology in geological observations
Kīlauea Volcano offers a unique opportunity for the study of basaltic volcanism
because it hosts frequent and relatively benign activity (at least for the last two centuries)
that is generally accessible year-round. It is for this reason, and the desire to enhance
global knowledge, that Thomas Jaggar established the Hawaiian Volcano Observatory at
Kīlauea in 1912. Subsequent geological observations at Kīlauea have formed the
foundation of many landmark studies. However, while eruptions at Kīlauea tend to be
approachable, direct observations are often impractical. It may be days, weeks, or even
years between significant events. Many events are short-lived, and access, when those
events do occur, is not instantaneous. Thus, many important eruptive changes, especially
at their onset, have been missed. In addition, while the eye is a fantastic tool, many
characteristics of eruptive activity occur at time- or length-scales not easily discernable,
either being too fast or too slow.
To overcome these limitations, and to explore new avenues of research, modern
digital cameras and imaging technologies have been applied increasingly to
volcanological studies. High-frame-rate, telemetered webcam networks and high-
resolution time-lapse camera systems now monitor volcanoes across the globe, and the
images they collect, often through integration with geophysical and geochemical data,
have given scientists new insights into an array of volcanic processes. High-speed camera
systems are now able to acquire images at rates comparable to those achievable by
geophysical monitoring systems, such as seismometers. Conversely, the ability to review
long sequences of images, representing durations of hours, days, or weeks, in time-lapse
movies that last seconds, gives us a means of studying change that occurs over long
periods. Such geological observations can be combined with geophysical observations
that operate over similar time spans, such as tiltmeters and GPS receivers.
124
The research described in Chapters 2 through 5, which form the body of this
dissertation, all relied on time-lapse and (or) webcam imaging technologies, without
which these studies would have been far less robust or even impossible. Because of their
reliance on observations acquired via cameras, these chapters are examples of one way in
which volcanology is evolving. Other new research avenues will undoubtedly arise as
camera systems continue to improve, for example by the development of affordable,
high-resolution long-wave infrared cameras. Even new improvements in battery and solar
recharging technologies will be important, by permitting the development of more
compact and portable camera systems.
6.2 Research limitations
6.2.1 Chapter 2
The research presented in Chapter 2 would have benefited from additional camera
systems providing more thorough visual coverage of the crater in Puʻu ʻŌʻō. This was
impossible, however, given the lack of additional resources, both in terms of equipment
and time. Achieving the right balance of equipment coverage versus the time investment
required to deploy and maintain that equipment will always be a challenge.
Better topography of Puʻu ʻŌʻō crater would have also aided this study. The work
done was the best that could be achieved at the time. Now, newly developed structure-
from-motion software packages permit the construction of digital elevation models from
oblique aerial photographs captured with handheld digital cameras. Puʻu ʻŌʻō crater was
largely fume-free during its refilling, which would have been the ideal situation for
capturing photographs that could be processed via structure-from-motion software.
6.2.2 Chapter 3
The uniqueness of the sinuous tumulus that developed on the coastal plain near the
Kalapana Gardens subdivision was not recognized until after it had begun to form. Once
it formed, however, it would have been useful to immediately record repeat transects over
the tumulus with kinematic GPS. This would have given a detailed growth history of the
tumulus. Moreover, the width and depth of the axial crack could have been measured at
125
each of those transects at the same time. Producing this dataset, however, would have
been challenging. With the lava flow threatening houses in Kalapana Gardens, mapping
the flow margins, assessing potential flow paths, and producing maps for Hawaiʻi County
Civil Defense and the public were the priority. Time for additional work was not always
available.
Photographing the sinuous tumulus was challenging, because of its length and the
bland gray color of young basaltic lava. The paucity of photographs, especially aerial
views, is unfortunate. I have learned from this shortsightedness and have since made a
conscious effort to capture an abundance of field photographs. Camera memory cards are
inexpensive and can now hold hundreds of high-resolution photographs, so that poses no
barrier to capturing more pictures than may seem necessary. One downside, however, is
the additional time spent cataloging a multitude of photographs.
As noted in Chapter 3, several time-lapse camera systems were deployed on and
adjacent to the sinuous tumulus. Most of these deployments relied on inexpensive time-
lapse cameras used for watching birds and other wildlife. These systems were used
because of the perceived likelihood of their destruction by lava flows. The cameras
proved to be unreliable. They produced low quality images, and the resulting image
sequences were so strongly affected by wind shake that quantification of tumulus motion
was impossible. In hindsight, placement of cameras atop the sinuous tumulus was
perhaps the safest place for close-up views. The low quality cameras were finally
replaced by high-quality, custom-made time-lapse systems, but the tube beneath the
sinuous tumulus was abandoned shortly afterward, and so the improved camera systems
captured data for only a short time.
6.2.3 Chapter 4
Relatively fast (4 frames per second) webcam acquisition was crucial to visualizing
the small explosive eruptions that occurred at Kīlauea’s summit in early 2011, on which
this study is based. While a slower webcam was deployed on the rim of Halemaʻumaʻu
since September 2008, the high-quality webcam used in this study was not installed until
September 2009, and higher-rate data were collected from May 2010. The changes in the
126
systems used at the summit were driven in large part by evolution of camera and
telemetry technologies. The 2010 system was not available in 2008–2009.
Though better observations are always valuable, understanding the contributions of
the various processes involved in driving the summit explosions is the more important
goal. This will always be challenging, but an integrative modeling approach, which melds
the ideas presented here, including the Worthington jet model, with the shock
vesiculation model of Carey et al. (2012), may help untangle the processes involved.
There is clearly a lack of analog studies of splashes comparable to the scenario we
describe. Most of those studies focus on small, spherical objects impacting water,
whereas the research presented in Chapter 4 would have benefited from studies which
looked at large irregular masses impacting water, at impacts by disaggregated groups of
objects of varying size, and by objects impacting fluids of different viscosities.
6.2.4 Chapter 5
The Kamoamoa eruption may be the best documented eruption in Hawaiʻi, but
more thorough observations of fissure propagation and fountaining, along with the
collection of tephra at regular intervals from a fountain at the same time that the fountain
was documented by video, would have added significant value to the research. This was
prevented, mostly, by a lack of manpower, which always presents a challenge during
eruptive crises at Kīlauea. Better management of people and other resources, as well as a
better prioritization of duties, will play an important role in managing future eruption
responses, though having these resources available and in place at the onset of new
eruptive activity remains elusive and unlikely.
6.3 Research ideas for the future
These studies have spawned an array of questions that fall outside the scope of this
dissertation. In addition, the camera imagery used in these studies is but a small subset of
a record from time-lapse cameras and webcams collected as part of an ongoing eruption
response. This image record includes many other camera observations that reveal a
variety of other new processes, or have shed new light on old processes, that could be the

127
basis of future studies. Several such studies are addressed below to give a flavor of the
types of research projects that could be produced.
6.3.1 Endogenous crater floor uplift
Endogenous uplift of Puʻu ʻŌʻō crater in 2007, as described in Chapter 2, occurred
with even more profound consequences in 2011, in the aftermath of the Kamoamoa
eruption (Chapter 5). In fact, recognition of the 2011 uplift, based on the sequence of
events in 2007, prepared scientists in advance for the subsequent August 2011 flank
eruption at Puʻu ʻŌʻō. These two recent instances of uplift may also be direct analogs for
the endogenous uplift described from Kīlauea’s caldera during the mid-19th
century (see
section 1.3) and at Halemaʻumaʻu during the early 20th
century (Jaggar, 1947, p. 113–
114), suggesting a fundamental process that distributes stress and pressure during shallow
accumulation of magma at Kīlauea. The crater floor subsidence at Puʻu ʻŌʻō in August
2011 also revealed a juvenile rind coating the crater wall. This rind was inferred to be the
remnant of a dike that fed lava onto the crater floor from the circumferential fault
accommodating the uplift, and it probably acted as a lubricant that aided the uplift.
Descriptions of subsidence at Halemaʻumaʻu during the early 20th
century remark on a
very similar coating on the crater wall (Jaggar, 1947, p. 135).
6.3.2 Eruption along cone sheets at Puʻu ʻŌʻō
Most flank eruptions at Puʻu ʻŌʻō can be classified into two categories—eruptions
from vertical fissures (up-rift or down-rift) aligned with the East Rift Zone, and eruptions
from inwardly inclined fissures circumferential to Puʻu ʻŌʻō cone (cone sheets), which
have not been described there before. The two most obvious examples of the second
group are the August 2011 breakout and the June 2014 breakout. Other major breakouts
at Puʻu ʻŌʻō probably also fall into this category, but their characterization is less clear.
The 2011 and 2014 events both occurred during periods of high pressure (inferred from
geological and geophysical observations) and their respective dikes probably rose from
the shallow magma body beneath Puʻu ʻŌʻō, following the stress field caused by the
weight of the Puʻu ʻŌʻō cone. As these intrusions started, the overlying flank of Puʻu
ʻŌʻō was uplifted abruptly, as documented by time-lapse cameras and webcams. The

128
dikes also splayed vertically as they intruded, resulting in offset dike segments, much like
those formed by vertical dikes elsewhere in the rift zone. A detailed study of cone sheet
emplacement would be, to my knowledge, unique, integrating geological observations
with geophysical modeling of tilt and GPS data.
6.3.3 Characterization of low-intensity Hawaiian fountains
As mentioned in section 6.2.4, Kīlauea offers the opportunity of improved
characterization of low-intensity Hawaiian fountains, because many of its fissure
eruptions can be closely accessed. Under the right conditions, another eruption like the
2011 Kamoamoa eruption would offer an outstanding opportunity to collect tephra from a
fountain being simultaneously documented with video. These, along with a detailed study
of pyroclast parameters, such as density and vesicularity, and deposit measurements like
isomass, would provide yet another one-of-a-kind dataset.
6.3.4 Cross-section through a sinuous tumulus
During 2014–2015, lava flows encroached on and threatened the town of Pāhoa in
the Puna district. In several areas along the length of the flow, the feeder tube developed
a raised, ridge-like sinuous tumulus, similar to that which formed near Kalapana Gardens
subdivision during 2010. In one location, a sinuous tumulus grew over the tube where it
crossed a street on the outskirts of Pāhoa. In September 2015, several months after the
flow was abandoned, the County of Hawaiʻi Department of Public Works opened bids for
reestablishment of this roadway at its original grade. This work will expose a complete
cross-section through the flow and the sinuous tumulus, allowing a unique opportunity to
characterize its internal stratigraphy and the underlying lava tube.
6.4 Some wider applications of studies at Kīlauea
The rapid advances in digital imaging technologies, which continue to change and
improve at a rapid pace, have breathed new life into the study of physical volcanology.
The studies presented here, and the volcanological community in general, have all
benefited from these technologies.
129
Geological observations often take a back seat to numerical models. Observations,
however, play a vital role in constraining those models. One clear example from this
research is the determination that rockfalls were the trigger for the small explosive
eruptions at Halemaʻumaʻu after the vent opened in 2008. One of the first publications
about the summit eruption inferred that the explosive events were the result of large gas
slugs bursting through the top of the lava column; the interpretation was based on seismic
data and overlooked the clear association between rockfalls and explosions. The
geological observations my colleagues and I collected established this link undeniably,
defined a new class of small explosive eruption, and highlighted a new hazard at
Kīlauea’s summit. It remains to be seen if this class of eruption is unique to the current
Halemaʻumaʻu eruption, or if eruptions triggered by rockfalls will be identified
elsewhere.
The detailed geological observations during the 2011 Kamoamoa eruption, in
particular several videos that show Hawaiian fountaining along the fissure system,
engendered new insights into this eruptive style and the dynamics of fissure opening and
propagation. These have helped guide ideas about the early stages of fissure eruption
(Parcheta, 2013; Parcheta et al., 2013). The eruption observations also show a behavior
that occupies a middle ground between Hawaiian and Strombolian activity (Orr et al.,
2013), highlighting inconsistencies in how these terms are used by volcanologists, based
on the style with which they are most familiar. Scientists who work primarily in Hawaiʻi
would likely identify this style of activity as Hawaiian fountaining, while scientists who
work primarily in Italy might call it Strombolian. These two styles of activity describe
end-member conditions but are inadequate for activity with characteristics of both styles.
This has led to new considerations for how to classify Strombolian and Hawaiian
eruption based on measureable parameters.
The identification of raised ridges as sinuous tumuli over lava tubes within volcanic
provinces on Mars will likely play a role in the ongoing discussion of the relative
importance of water in shaping the Martian landscape. Research continues in this area,
along with identifying other lava flow features in Hawaiʻi as analogs to features observed
in Mars imagery. Research on the sinuous tumulus that formed in 2010 accompanied
study of the ongoing Puʻu ʻŌʻō eruption. A key observation was the association between
130
cycles in summit deformation and the occurrence of breakouts from the sinuous tumulus,
several of which threatened nearby houses. Recognition of this association improved
hazard assessments and provided a means of forecasting activity that proved useful for
Hawaiʻi County Civil Defense. The relation between summit deformation and flow-field
activity is now well established and regularly used by the Hawaiian Volcano Observatory
to forecast and track activity as part of the ongoing eruption monitoring of Kīlauea.
Finally, watching for crater floor uplift at Puʻu ʻŌʻō is one of many key
observations carried out during monitoring of Kīlauea’s East Rift Zone eruption, and it
stems from my work at Puʻu ʻŌʻō in 2007. Its recognition has already proved useful and
allowed early preparation for the August 2011 breakout at Puʻu ʻŌʻō. Though not
described previously elsewhere, identifying crater floor uplift may prove important at
other basaltic volcanoes as well. Moreover, further modeling of the crater floor uplift
may help constrain the size and depth of the magma storage beneath Puʻu ʻŌʻō, which
would broaden our understanding of the emplacement and evolution of the shallowest
magma bodies within the crust.

131
References
Anderson, K.R., Poland, M. P., Johnson, J. H., and Miklius, A., 2015, Episodic deflation-
inflation events at Kīlauea Volcano and implications for the shallow magma
system: in: Carey, R., Cayol, V., Poland, M., Weis, D., (eds.), Hawaiian
Volcanoes, from Source to Surface. American Geophysical Union Monograph
208, 229–250.
Anderson, S.W., Stofan, E.R., Smrekar, S.E., Guest, J.E., and Wood, B., 1999, Pulsed
inflation of pahoehoe lava flows: implications for flood basalt emplacement.
Earth and Planetary Science Letters 168(1–2), 7–18.
Anderson, S.W., McColley, S.M., Fink, J.H., and Hudson, R.K., 2005, The development
of fluid instabilities and preferred pathways in lava flow interiors: Insights from
analog experiments and fractal analysis. Geological Society of America Special
Papers 396, 147–161.
Anderson, S.W., Smrekar, S.E., and Stofan, E.R., 2012, Tumulus development on lava
flows: insights from observations of active tumuli and analysis of formation
models. Bulletin of Volcanology 74(4), 931–946.
Atkinson, A., Griffin, T.J., and Stephenson, P.J., 1975, A major lava tube system from
Undara Volcano, North Queensland. Bulletin of Volcanology 39, 266–293.
Atkinson, A., and Atkinson, V.G., 1995, Undara Volcano and its tubes. Anne and Vernon
Atkinson, Brisbane, Queensland.
Baker, S., and Amelung, F., 2012, Top-down inflation and deflation at the summit of
Kīlauea Volcano, Hawaii observed with InSAR. Journal of Geophysical Research
117(B12406).
Baker, V.R., 2001, Water and the martian landscape. Nature 412(6843), 228–236.
Banks, M.E., Lang, N.P., Kargel, J.S., McEwen, A.S., Baker, V.R., Grant, J.A., Pelletier,
J.D., and Strom, R.G., 2009, An analysis of sinuous ridges in the southern Argyre
Planitia, Mars using HiRISE and CTX images and MOLA data. Journal of
Geophysical Research 114(E9), E09003.
132
Bleacher, J.E., Sakimoto, S.E.H., Garvin, J.B., and Wong, M., 2003, Deflation/erosion
rates for the Parva Member, Dorsa Argentea Formation and implications for the
south polar region of Mars. Journal of Geophysical Research 108(E7), 5075.
Bleacher, J.E., Greeley, R., Williams, D.A., Werner, S.C., Hauber, E., and Neukum, G.,
2007a, Olympus Mons, Mars: Inferred changes in late Amazonian aged effusive
activity from lava flow mapping of Mars Express High Resolution Stereo Camera
data. Journal of Geophysical Research 112, E04003.
Bleacher, J.E., Greeley, R., Williams, D.A., Cave, S.R., and Neukum, G., 2007b, Trends
in effusive style at the Tharsis Montes, Mars, and implications for the
development of the Tharsis province. Journal of Geophysical Research 112,
E09005.
Bergmann, R., van der Meer, D., Stijnman, M., Sandtke, M., Prosperetti, A., and Lohse,
D., 2006, Giant bubble pinch-off. Physical Review Letters 96(15), 154505.
Burr, D.M., Bruno, B.C., Lanagan, P.D., Glaze, L.S., Jaeger, W.L., Soare, R.J., Wan Bun
Tseung, J.-M., Skinner Jr., J.A., and Baloga, S.M., 2009, Mesoscale raised rim
depressions (MRRDs) on Earth: A review of the characteristics, processes, and
spatial distributions of analogs for Mars. Planetary and Space Science 57, 579–
596.
Burr, D.M., Williams, R.M.E., Wendell, K.D., Chojnacki, M., and Emery, J.P., 2010,
Inverted fluvial features in the Aeolis/Zephyria Plana region, Mars: Formation
mechanism and initial paleodischarge estimates. Journal of Geophysical Research
115(E7), E07011.
Carbone, D., Poland, M.P., Patrick, M.R., and Orr, T.R., 2013, Continuous gravity
measurements reveal a low-density lava lake at Kīlauea Volcano, Hawai‘i. Earth
and Planetary Science Letters 376(0): 178–185.
Carey, R.J., Manga, M., Degruyter, W., Swanson, D., Houghton, B., Orr, T., and Patrick,
M., 2012, Externally triggered renewed bubble nucleation in basaltic magma: The
12 October 2008 eruption at Halema‘uma‘u Overlook vent, Kīlauea, Hawai‘i,
USA. Journal of Geophysical Research: Solid Earth 117(B11).
Cashman, K.J., and Kauahikaua, J.P., 1997, Reevaluation of vesicle distributions in
basaltic lava flows. Geology 25(5), 419–422.

133
Cervelli, P., Segall, P., Amelung, F., Garbeil, H., Meertens, C., Owen, S., Miklius, A.,
and Lisowski, M., 2002, The 12 September 1999 Upper East Rift Zone dike
intrusion at Kilauea Volcano, Hawaii. Journal of Geophysical Research 107(B7),
13.
Cervelli, P.F., and Miklius, A., 2003, The shallow magmatic system of Kilauea volcano.
149–163.
Chitwood, L.A., 1994, Inflated basaltic lava—Examples of processes and landforms from
central and southeast Oregon. Oregon Geology 56, 11–21.
Chouet, B.A., Dawson, P.B., James, M.R., and Lane, S.J., 2010, Seismic source
mechanism of degassing bursts at Kilauea Volcano, Hawaii: Results from
waveform inversion in the 10–50 s band. Journal of Geophysical Research 115,
B09311.
Clague, D.A., and Dalrymple, G.B., 1987, The Hawaiian-Emperor volcanic chain; part 1.
Geologic evolution. in: Decker, R.W., Wright, T.L., Stauffer, P.H., (eds.),
Volcanism in Hawaii: U.S. Geological Survey Professional Paper 1350 (1), 5–54.
Clague, D.A., and Heliker, C., 1993, The ten-year eruption of Kilauea Volcano. U.S.
Geological Survey Earthquakes and Volcanoes 23(6), 244–254.
Crumpler, L.S., Aubele, J.C., and Zimbelman, J.R., 2007, Volcanic features of New
Mexico analogous to volcanic features on Mars. in: Chapman, M.G., (ed.), The
Geology of Mars: Evidence from Earth-Based Analog. Cambridge University
Press, Cambridge, UK.
Dana, J.D., 1887, History of the changes in the Mt. Loa craters. American Journal of
Science, Third Series 34(200), 81–97.
Dawson, P., Benítez, M., Chouet, B., and Wilson, D., 2010, Monitoring very-long-period
seismicity at Kilauea Volcano, Hawaii. Geophysical Research Letters
37(L18306), 1–5.
DePaolo, D.J., and Stolper, E.M., 1996, Models of Hawaiian volcano growth and plume
structure: Implications of results from the Hawaii Scientific Drilling Project.
Journal of Geophysical Research 101(B5), 11643–11654.
Duncan, A.M., Guest, J.E., Stofan, E.R., Anderson, S.W., Pinkerton, H., and Calvari, S.,
2004, Development of tumuli in the medial portion of the 1983 aa flow-field,

134
Mount Etna, Sicily. Journal of Volcanology and Geothermal Research 132(2–3),
173–187.
Duraiswami, R.A., Bondre, N.R., Dole, G., Phadnis, V.M., and Kale, V.S., 2001, Tumuli
and associated features from the western Deccan Volcanic Province, India.
Bulletin of Volcanology 63(7), 435–442.
Easton, R.M., 1987, Stratigraphy of Kīlauea Volcano, in: Decker, R.W., Wright, T.L.,
Stauffer, P.H., (eds.), Volcanism in Hawaii: U.S. Geological Survey Professional
Paper 1350 (1), 243–260.
Eaton, J.P., and Murata, K.J., 1960, How volcanoes grow. Science 132(3432), 925–938.
Elias, T., and Sutton, A.J., 2012, Sulfur dioxide emission rates from Kīlauea Volcano,
Hawai‘i, 2007–2010. U.S. Geological Survey Open-File Report 2012–1107, 25 p.
Ellis, W., 1963, Narrative of a tour of Hawaii, or Owhyhee; with remarks on the history,
traditions, manners, customs and language of the inhabitants of the sandwich
Islands. Reprint of the London 1827 Edition and the Hawaii 1917 Edition.
Advertiser Publishing Company, LTD., Honolulu, Hawaii. 342 p.
Endo, E.T., and Murray, T., 1991, Real-time seismic amplitude measurement (RSAM): a
volcano monitoring and prediction tool. Bulletin of Volcanology 53(7), 533–545.
Fee, D., Garces, M., Orr, T., and Poland, M., 2011, Infrasound from the 2007 fissure
eruptions of Kīlauea Volcano, Hawai‘i. Geophysical Research Letters 38
(L06309), 5.
Fiske, R.S., and Kinoshita, W.T., 1969, Inflation of Kilauea Volcano prior to its 1967–
1968 eruption. Science 165(3891), 341–349.
Fiske, R.S., Rose, T.R., Swanson, D.A., Champion, D.E., and McGeehin, J.P., 2009,
Kulanaokuaiki Tephra (ca. A.D. 400–1000): Newly recognized evidence for
highly explosive eruptions at Kilauea Volcano, Hawai‘i. Geological Society of
America Bulletin 121(5-6), 712–728.
Garcia, M.O., Rhodes, J.M., Wolfe, E.W., Ulrich, G.E., and Ho, R.A., 1992, Petrology of
lavas from episodes 2–47 of the Puu Oo eruption of Kilauea Volcano, Hawaii:
Evaluation of magmatic processes. Bulletin of Volcanology 55(1-2), 1–16.
Gekle, S., and Gordillo, J.M., 2010, Generation and breakup of Worthington jets after
cavity collapse. Part 1. Jet formation: Journal of Fluid Mechanics 663, 293–330.
135
Gerlach, T.M., McGee, K.A., Elias, T., Sutton, A.J., and Doukas, M.P., 2002, Carbon
dioxide emission rate of Kilauea Volcano: Implications for primary magma and
the summit reservoir. Journal of Geophysical Research 107(2189).
Glaze, L.S., Anderson, S.W., Stofan, E.R., Baloga, S., and Smrekar, S.E., 2005,
Statistical distribution of tumuli on pahoehoe flow surfaces: Analysis of examples
in Hawaii and Iceland and potential applications to lava flows on Mars. Journal of
Geophysical Research, Solid Earth 110(B8), B08202.
Ghatan, G.J., and Head, J.W., III, 2004, Regional drainage of meltwater beneath a
Hesperian-aged south circumpolar ice sheet on Mars. Journal of Geophysical
Research 109(E7), E07006.
Greeley, R., 1987, The role of lava tubes in Hawaiian volcanoes. in: Decker, R.W.,
Wright, T.L., and Stauffer, P.H., (eds.), Volcanism in Hawaii: U.S. Geological
Survey Professional Paper 1350 (2), 1589–1602.
Hamilton, C.W., Fagents, S.A., and Wilson, L., 2010, Explosive lava–water interactions
in Elysium Planitia, Mars: constraints on the formation of the Tartarus Colles
cone groups. Journal of Geophysical Research 115, E09006.
Hamilton, C.W., Fagents, S.A., and Thordarson, T., 2011, Lava–ground ice interactions
in Elysium Planitia, Mars: geomorphological and geospatial analysis of the
Tartarus Colles cone groups. Journal of Geophysical Research 116, E03004.
Hamilton, C., Glaze, L., James, M., and Baloga, S., 2013, Topographic and stochastic
influences on pāhoehoe lava lobe emplacement. Bulletin of Volcanology 75(11),
1–16.
Haney, M.M., Power, J., West, M., and Michaels, P., 2012, Causal instrument corrections
for short-period and broadband seismometers. Seismological Research Letters
83(5), 834–845.
Harlow, F.W., and Shannon, J.P., 1967, The splash of a liquid drop: Journal of Applied
Physics 38(10), 3855–3866.
Harris, A., Pirie, D., Horton, K., Garbeil, H., Pilger, E., Ramm, H., Hoblitt, R., Thornber,
C., Ripepe, M., Marchetti, E., and Poggi, P., 2005, DUCKS: Low cost thermal
monitoring units for near-vent deployment. Journal of Volcanology and
Geothermal Research 143(4), 335–360.

136
Head, J.W., and Pratt, S., 2001, Extensive Hesperian-aged south polar ice sheet on Mars:
Evidence for massive melting and retreat, and lateral flow and ponding of
meltwater. Journal of Geophysical Research 106(E6), 12275–12299.
Head, J.W., Wilson, L., Dickson, J., and Neukum, G., 2006, The Huygens-Hellas giant
dike system on Mars: Implications for Late Noachian–Early Hesperian volcanic
resurfacing and climatic evolution. Geology 34(4), 285–288.
Heliker, C., and Wright, T.L., 1991, Lava-flow hazards from Kilauea’s current eruption.
Geotimes, 36(5), 16–18.
Heliker, C.C., Mangan, M.T., Mattox, T.N., Kauahikaua, J.P., and Helz, R.T., 1998, The
character of long-term eruptions: inferences from episodes 50–53 of the Pu‘u
‘Ō‘ō - Kūpaianaha eruption of Kīlauea Volcano. Bulletin of Volcanology 59(6),
381–393.
Heliker, C., and Mattox, T.N., 2003, The first two decades of the Pu‘u ‘Ō‘ō–Kupaianaha
eruption; chronology and selected bibliography. in: Heliker, C., Swanson, D.A.,
Takahashi T.J., (eds.). The Puʻu ʻŌʻō-Kupaianaha Eruption of Kīlauea Volcano,
Hawaii: The First 20 Years. U.S. Geological Survey Professional Paper 1676, 1–
27.
Heliker, C., Kauahikaua, J., Sherrod, D.R., Lisowski, M., and Cervelli, P., 2003, The rise
and fall of Pu‘u ‘Ō‘ō cone, 1983–2002. in: Heliker, C., Swanson, D.A., Takahashi
T.J., (eds.). The Puʻu ʻŌʻō-Kupaianaha Eruption of Kīlauea Volcano, Hawaii: The
First 20 Years. U.S. Geological Survey Professional Paper 1676, 29–51.
Helz, R.T., and Thornber, C.R., 1987, Geothermometry of Kilauea Iki lava lake, Hawaii.
Bulletin of Volcanology 49(5), 651–668.
Hoblitt, R.P., Orr, T.R., Castella, F., and Cervelli, P.F., 2008, Remote-controlled pan, tilt,
zoom cameras at Kīlauea and Mauna Loa volcanoes, Hawai‘i: U.S. Geological
Survey Scientific Investigations Report 2008–5129, 14 p.
Hoblitt, R.P., Orr, T.R., Heliker, C., Denlinger, R.P., Hon, K., and Cervelli, P.F., 2012,
Inflation rates, rifts, and bands in a pāhoehoe sheet flow. Geosphere 8(1), 179–
195.

137
Holcomb, R.T., 1987, Eruptive history and long-term behavior of Kilauea volcano. in:
Decker, R.W., Wright, T.L., Stauffer, P.H., (eds.), Volcanism in Hawaii: U.S.
Geological Survey Professional Paper 1350 (1), 261–350.
Hon, K., Kauahikaua, J., Denlinger, R., and Mackay, K., 1994, Emplacement and
inflation of pahoehoe sheet flows: observations and measurements of active lava
flows on Kilauea Volcano, Hawaii. Geological Society of America Bulletin
106(3), 351–370.
Hon, K., and Orr, T., 2011, Hydrothermal hexahydrite spherules erupted during the
2008–2010 summit eruption of Kīlauea Volcano, Hawai‘i. Bulletin of
Volcanology 73(9), 1369–1375.
Houghton, B.F., Swanson, D.A., Carey, R.J., Rausch, J., and Sutton, A.J., 2011,
Pigeonholing pyroclasts: Insights from the 19 March 2008 explosive eruption of
Kilauea volcano. Geology, 39(3), 263–266.
Hsiao, M., Lichter, S., and Quintero, L.G., 1988, The critical Weber number for vortex
and jet formation for drops impinging on a liquid pool. Physics of Fluids 31(12),
3560–3562.
Jaggar, T.A., 1947, Origin and development of craters. Baltimore, Waverly Press, Inc.,
508 p.
Johnson, D.M., Hooper P.R., and Conrey, R.M., 1999, XRF analysis of rocks and
minerals for major and trace elements on a single low dilution Li-tetraborate fused
bead. Advances in X-ray Analysis 41, 843–867.
Kauahikaua, J., Mangan, M., Heliker, C., and Mattox, T., 1996, A quantitative look at the
demise of a basaltic vent: the death of Kupaianaha, Kilauea Volcano, Hawai‘i.
Bulletin of Volcanology 57(8), 641–648.
Kauahikaua, J., Cashman, K.V., Mattox, T.N., Heliker, C.C., Hon, K.A., Mangan, M.T.,
and Thornber, C.R., 1998, Observations on basaltic lava streams in tubes from
Kilauea Volcano, Island of Hawaii. Journal of Geophysical Research 103(B11),
27303–27323.
Kauahikaua, J., 2007, Lava flow hazard assessment, as of August 2007, for Kīlauea East
Rift Zone eruptions, Hawai‘i Island. U.S. Geological Survey Open-File Report
2007-1264, 9 p.
138
Keller, G.V., Grose, L.T., Murray, J.C., and Skokan, C.K., 1979, Results of an
experimental drill hole at the summit of Kilauea Volcano, Hawaii. Journal of
Volcanology and Geothermal Research 5(3-4), 345–385.
Kern, C., Deutschmann, T., Werner, C., Sutton, A.J., Elias, T., and Kelly, P.J., 2012,
Improving the accuracy of SO2 column densities and emission rates obtained from
upward-looking UV-spectroscopic measurements of volcanic plumes by taking
realistic radiative transfer into account. Journal of Geophysical Research:
Atmospheres 117(D20), D20302.
Keszthelyi, L.P., and Pieri, D.C., 1993, Emplacement of the 75-km-long Carrizozo lava
flow field, south-central New Mexico. Journal of Volcanology and Geothermal
Research 59(1-2), 59–75.
Keszthelyi, L., Jaeger, W., McEwe, A., Tornabene, L., Beyer, R.A., Dundas, C., and
Milazzo, M., 2008, High Resolution Imaging Science Experiment (HiRISE)
images of volcanic terrains from the first 6 months of the Mars Reconnaissance
Orbiter Primary Science Phase. Journal of Geophysical Research 113, E04005.
Keszthelyi, L., 2012, Rate of solidification of silicate melts on the Earth, Moon, Mars,
and beyond. Proceedings of the 43rd Lunar and Planetary Science Conference,
Contribution 1659, Woodlands, Texas, 19–23 Mar.
Klein, F.W., Koyanagi, R.Y., Nakata, J.S., and Tanigawa, W.R., 1987, The seismicity of
Kilauea’s magma system. in: Decker, R.W., Wright, T.L., Stauffer, P.H., (eds.),
Volcanism in Hawaii: U.S. Geological Survey Professional Paper 1350 (2), 1019–
1185.
Lefort, A., Burr, D.M., Beyer, R.A., and Howard, A.D., 2012, Inverted fluvial features in
the Aeolis-Zephyria Plana, western Medusae Fossae Formation, Mars: Evidence
for post-formation modification. Journal of Geophysical Research 117(E3),
E03007.
Lohse, D., Bergmann, R., Mikkelsen, R., Zeilstra, C., van der Meer, D., Versluis, M., van
der Weele, K., van der Hoef, M., and Kuipers, H., 2004, Impact on soft sand:
Void collapse and jet formation. Physical Review Letters 93(19), 1–4.
Lundgren, P., Poland, M., Miklius, A., Orr, T., Yun, S.-H., Fielding, E., Liu, Z., Tanaka,
A., Szeliga, W., Hensley, S., and Owen, S., 2013, Evolution of dike opening

139
during the March 2011 Kamoamoa fissure eruption, Kīlauea Volcano, Hawai`i.
Journal of Geophysical Research: Solid Earth 118.
Macdonald, G.A., 1955, Hawaiian volcanoes during 1952, U.S. Geological Survey
Bulletin 1021B, 15–108.
Mangan, M.T., Heliker, C.C., Mattox, T.N., Kauahikaua, J.P., and Helz, R.T., 1995,
Episode 49 of the Pu‘u ‘O‘o–Kupaianaha eruption of Kilauea volcano –
breakdown of a steady-state eruptive era. Bulletin of Volcanology 57(2), 127–
135.
Mastin, L.G., 1997, Evidence for water influx from a caldera lake during the explosive
hydromagmatic eruption of 1790, Kilauea volcano, Hawaii. Journal of
Geophysical Research: Solid Earth 102(B9), 20093–20109.
Mattox, T.N., Heliker, C., Kauahikaua, J., and Hon, K., 1993, Development of the 1990
Kalapana flow field, Kilauea Volcano, Hawaii. Bulletin of Volcanology 55(6),
407–413.
McPhie, J., Walker, G., and Christiansen, R., 1990, Phreatomagmatic and phreatic fall
and surge deposits from explosions at Kilauea volcano, Hawaii, 1790 a.d.:
Keanakakoi Ash Member. Bulletin of Volcanology 52(5), 334–354.
Miklius, A., and Cervelli, P., 2003, Interaction between Kilauea and Mauna Loa. Nature
421(6920), 229.
Montgomery-Brown, E.K., Sinnett, D.K., Poland, M., Segall, P., Orr, T., Zebker, H., and
Miklius, A., 2010, Geodetic evidence for en echelon dike emplacement and
concurrent slow slip during the June 2007 intrusion and eruption at Kīlauea
volcano, Hawaii. Journal of Geophysical Research 115(B7).
Mouginis-Mark, P.J., and Rowland, S.K., 2008, Lava flows at Arsia Mons, Mars: Insights
from a graben imaged by HiRISE. Icarus 198.
Nichols, R.L., 1939, Surficial banding and shark's-tooth projections in the cracks of
basaltic lava. American Journal of Science 237, 188–194.
Okamura, A.T., Dvorak, J.J., Koyanagi, R.Y., and Tanigawa, W.R., 1988, Surface
deformation during dike propagation, in: Wolfe, E.W., (ed.), The Puu Oo eruption
of Kilauea Volcano, Hawaii; episodes 1 through 20, January 3, 1983, through
June 8, 1984. U.S. Geological Survey Professional Paper 1463, 165–182.

140
Okubo, P., Nakata, J., Chouet, B., and Dawson, P., 1996, The February 1, 1996, Kilauea
summit earthquake swarm [abs.]. Eos (Transactions, American Geophysical
Union) 77(46), F798.
Orr, T.R., and Hoblitt, R.P., 2008, A versatile time-lapse camera system developed by the
Hawaiian Volcano Observatory for use at Kīlauea Volcano, Hawai‘i. U.S.
Geological Survey Scientific Investigations Report 2008-5117, 8 p.
Orr, T.R., 2011, Selected time-lapse movies of the East Rift Zone eruption of Kīlauea
Volcano, 2004–2008. U.S. Geological Survey Data Series 621, 15 p., 26 time-
lapse movies.
Orr, T., Houghton, B., Poland, M., Patrick, M., Thelen, W., Sutton, A., Parcheta, C., and
Thornber, C., 2013, Low intensity Hawaiian fountaining as exemplified by the
March 2011, Kamoamoa eruption at Kilauea Volcano, Hawaii. Abstract V33F-01
presented at 2013 Fall Meeting, AGU, San Francisco, California, 9–13 December.
Owen, S., Segall, P., Lisowski, M., Miklius, A., Murray, M., Bevis, M., and Foster, J.,
2000, January 30, 1997 eruptive event on Kilauea Volcano, Hawaii, as monitored
by continuous GPS. Geophysical Research Letters 27(17), 2757–2760.
Parcheta, C.E., Houghton, B.F., and Swanson, D.A., 2012, Hawaiian fissure fountains 1:
decoding deposits—episode 1 of the 1969–1974 Mauna Ulu eruption. Bulletin of
Volcanology 74(7), 1729–1743.
Parcheta, C., 2013, Weak-intensity, basaltic, explosive volcanism: Dynamics of Hawaiian
fountains [Ph.D. dissertation]. University of Hawaiʻi at Mānoa, 200 p.
Parcheta, C., Orr, T., and Houghton, B., 2013, Chronology-based Physical Volcanology
of the 2011 Kamoamoa Eruption of Kīlauea. Abstract V33F-02 presented at 2013
Fall Meeting, AGU, San Francisco, California, 9–13 December.
Patrick, M.R., Orr, T., Wilson, D., Dow, D., and Freeman R., 2011a, Cyclic spattering,
seismic tremor, and surface fluctuation within a perched lava channel, Kīlauea
Volcano. Bulletin of Volcanology 73(6), 639–653.
Patrick, M., Wilson, D., Fee, D., Orr, T., and Swanson, D., 2011b, Shallow degassing
events as a trigger for very-long-period seismicity at Kīlauea Volcano. Hawai‘i:
Bulletin of Volcanology 73(9), 1179–1186.
141
Patrick, M.R., and Orr, T., 2012, Rootless shield and perched lava pond collapses at
Kīlauea Volcano, Hawai'i. Bulletin of Volcanology 74(1), 67–78.
Patrick, M., Orr, T., Sutton, A.J., Elias T., and Swanson, D., 2013, The first five years of
Kīlauea's summit eruption in Halemaʻumaʻu, 2008–2013. U.S. Geological Survey
Fact Sheet 2013–3116, 4 p.
Paskievitch, J., Read, C., and Parker, T., 2010, Remote telemetered and time-lapse
cameras at Augustine Volcano. in: Power, J.A., Coombs, M.L., Freymueller, J.T.,
(eds.), The 2006 eruption of Augustine Volcano, Alaska. U.S. Geological Survey
Professional Paper 1769, 285–293.
Peck, D.L., and Minakami, T., 1968, The formation of columnar joints in the upper part
of Kilauean lava lakes, Hawaii. Geological Society of America Bulletin 79(9),
1151–1166.
Peterson, D.W., Holcomb, R.T., Tilling, R.I., and Christiansen, R.L., 1994, Development
of lava tubes in the light of observations at Mauna Ulu, Kilauea Volcano, Hawaii.
Bulletin of Volcanology 56(5), 343–360.
Poland, M., Miklius, A., Orr, T., Sutton, J., Thornber, C., and Wilson, D., 2008a, New
episodes of volcanism at Kilauea Volcano, Hawaii. Eos (Transactions, American
Geophysical Union) 89(5), 37–38.
Poland, M.P., Dzurisin, D., LaHusen, R.G., Major, J.J., Lapcewich, D., Endo, E.T.,
Gooding, D.J., Schilling, S.P., and Janda, C.G., 2008b, Remote camera
observations of lava dome growth at Mount St. Helens, Washington, October
2004 to February 2006. in: Sherrod, D.R., Scott, W.E., Stauffer, P.H., (eds.), A
Volcano Rekindled: The Renewed Eruption of Mount St. Helens, 2004–2006.
Geological Survey Professional Paper 1750, 225–236.
Poland, M.P., Miklius, A., Lundgren, P., and Sutton, A.J., 2011, Repeated deflation-
inflation events at Kilauea Volcano, Hawai'i: What's up (and down) with that?
American Geophysical Union Fall Meeting, San Francisco, Calif., 5–9 Dec.,
V51G-01
Poland, M.P., Miklius, A., Sutton, A.J., and Thornber, C.R., 2012, A mantle-driven surge
in magma supply to Kilauea Volcano during 2003–2007. Nature Geoscience 5(4),
295–300.
142
Poland, M.P., Miklius, A., Montgomery-Brown, E.K., 2014, Magma supply, storage, and
transport at shield-stage Hawaiian volcanoes. in: Poland, M.P., Takahashi, T.J.,
Landowski, C.M., (eds), Characteristics of Hawaiian volcanoes. U.S. Geological
Survey Professional Paper 1801, 179–234.
Rivalta, E., and Segall, P., 2008, Magma compressibility and the missing source for some
dike intrusions. Geophysical Research Letters 34(L04306).
Roche, O., van Wyk de Vries, B., and Druitt, T.H., 2001, Sub-surface structures and
collapse mechanisms of summit pit craters. Journal of Volcanology Geothermal
Research 105(1-2), 1–18.
Rossi, M.J., and Gudmundsson, A., 1996, The morphology and formation of flow-lobe
tumuli on Icelandic shield volcanoes. Journal of Volcanology Geothermal
Research 72(3–4), 291–308.
Ryan, M.P., 1987, Neutral buoyancy and the mechanical evolution of magmatic systems.
in: Mysen, B.O., (ed.), Magmatic Processes: Physiochemical Principles. The
Geochemical Society, 259–287.
Schaefer, C.J., and Kattenhorn, S.A., 2004, Characterization and evolution of fractures in
low-volume pahoehoe lava flows, eastern Snake River Plain, Idaho. Geological
Society of America Bulletin 116(3-4), 322–336.
Scherbaum, F., and Bouin, M.P., 1997, FIR filter effects and nucleation phases.
Geophysical Journal International 130(3), 661–668.
Self, S., Keszthelyi, L., and Thordarson, T., 1998, The importance of pāhoehoe. Annual
Review of Earth and Planetary Science 26(1), 81–110.
Sen, G., and Jones, R.E., 1990, Cumulate Xenolith in Oahu, Hawaii: Implications for
Deep Magma Chambers and Hawaiian Volcanism. Science 249(4973), 1154–
1157.
Stearns, H.T., 1926, The Keaiwa or 1823 Lava Flow from Kilauea Volcano, Hawaii. The
Journal of Geology 34(4), 336–351.
Stephenson, P.J., Burch-Johnston, A.T., Stanton, D., and Whitehead, P.W., 1998, Three
long lava flows in north Queensland. Journal of Geophysical Research 103(B11),
27359–27370.
143
Sutton, A.J., Elias, T., Gerlach, T.M. and Stokes, J.B., 2001, Implications for eruptive
processes as indicated by sulfur dioxide emissions from Kilauea Volcano,
Hawai`i, 1979–1997. Journal of Volcanology Geothermal Research 108(1–4),
283–302.
Sutton, A.J., Elias, T., and Kauahikaua, J., 2003, Lava-effusion rates for the Pu‘u ‘Ō‘ō -
Kupaianaha eruption derived from SO2 emissions and very low frequency (VLF)
measurements. in: Heliker, C., Swanson, D.A., Takahashi T.J., (eds.). The Puʻu
ʻŌʻō-Kupaianaha Eruption of Kīlauea Volcano, Hawaii: The First 20 Years. U.S.
Geological Survey Professional Paper 1676, 137–148.
Swanson, D.A., Jackson, D.B., Koyanagi, R.Y., and Wright, T.L., 1976, The February
1969 east rift eruption of Kilauea Volcano, Hawaii. U.S. Geological Survey
Professional Paper 891, 33p.
Swanson, D., Wooten, K., and Orr, T., 2009, Buckets of ash track tephra flux from
Halema‘uma‘u Crater, Hawai‘i. Eos (Transactions, American Geophysical Union)
90(46), 427.
Swanson, D.A., Rose, T.R., Fiske, R.S., and McGeehin, J.P., 2012, Keanakākoʻi Tephra
produced by 300 years of explosive eruptions following collapse of Kīlauea's
caldera in about 1500 CE. Journal of Volcanology and Geothermal Research 215-
216(0), 8–25.
Swanson, D.A., Rose T.R., Mucek, A.E., Garcia, M.O., Fiske, R.S., and Mastin, L.G.,
2014, Cycles of explosive and effusive eruptions at Kīlauea Volcano, Hawai‘i.
Geology 42(7), 631–634.
Swanson, D.A., Weaver, S.J., Houghton, B.F., 2015, Reconstructing the deadly eruptive
events of 1790 CE at Kīlauea Volcano, Hawai‘i. Geological Society of America
Bulletin 127(3-4), 503–515.
Thornber, C.R., 1997, HVO/RVTS-1; a prototype remote video telemetry system for
monitoring the Kilauea East Rift Zone eruption. U.S. Geological Survey Open-
File Report 97-537, 18 p.
Thornber, C.R., Sherrod, D.R., Siems, D.F., Heliker, C.C., Meeker, G.P., Oscarson, R.L.,
and Kauahikaua, J.P., 2002, Whole-rock and glass major-element geochemistry of
144
Kilauea Volcano, Hawaii, near-vent eruptive products—September 1994 through
September 2001. U.S. Geological Survey Open-File Report 2002-17, 9 p.
Thornber, C.R., Heliker, C., Sherrod, D.R., Kauahikaua, J.P., Miklius, A., Okubo, P.G.,
Trusdell, F.A., Budahn, J.R., Ridley, W.I., and Meeker, G.P., 2003, Kilauea east
rift zone magmatism; an episode 54 perspective. Journal of Petrology 44(9),
1525–1559.
Thornber, C.R., Orr, T.R., Heliker, C., and Hoblitt, R.P., 2015, Petrologic testament to
changes in shallow magma storage and transport during 30+ years of recharge and
eruption at Kīlauea Volcano, Hawai‘i. in: Carey, R., Cayol, V., Poland, M., Weis,
D., (eds.), Hawaiian Volcanoes, from Source to Surface. American Geophysical
Union Monograph 208, 147–188.
Thoroddsen, S.T., Etoh, T.G., Takehara, K., and Takano, Y., 2004, Impact jetting by a
solid sphere. Journal of Fluid Mechanics 499, 139–148.
Trusdell, F., 2011, Dueling volcanoes: How activity levels at Kilauea influence eruptions
at Mauna Loa. American Geophysical Union Fall Meeting, San Francisco, Calif.,
5–9 Dec., V33E-08.
Walker, G.P.L., 1991, Structure, and origin by injection of lava under surface crust, of
tumuli, “lava rises”, “lava-rise pits”, and “lava-inflation clefts” in Hawaii.
Bulletin of Volcanology 53(7), 546–558.
Walker, G.P.L., 2009, The endogenous growth of pahoehoe lava lobes and morphology
of lava-rise edges. in: Thordarson, T., Self, S., Larsen, G., Rowland, S.K.,
Hoskuldsson, A., (eds.), Studies in volcanology—the legacy of George Walker
(Special Publications of IAVCEI No. 2). The Geological Society, 17–32.
Waltham, T., Bell, F., and Culshaw, M., 2005, Sinkholes and subsidence—karst and
cavernous rocks in engineering and construction. Springer, Berlin, 382 p.
Wentworth, C.K., and Macdonald, G.A., 1953, Structures and forms of basaltic rocks in
Hawaii. U.S. Geological Survey Bulletin 994, 98 p.
Whitehead, P.W., and Stephenson, P.J., 1998, Lava rise ridges of the Toomba basalt
flow, north Queensland, Australia. Journal of Geophysical Research: Solid Earth
103(B11), 27371–27382.

145
Williams, K.E., Toon, O.B., Heldmann, J.L., and Mellon, M.T., 2009, Ancient melting of
mid-latitude snowpacks on Mars as a water source for gullies. Icarus 200(2), 418–
425.
Wilson, D., Elias, T., Orr, T., Patrick, M., Sutton, A.J., and Swanson, D., 2008, Small
explosion from new vent at Kilauea’s summit. EOS, Transactions, American
Geophysical Union 89(22), 203.
Wilson, L., and Head, J.W., 1981, Ascent and eruption of basaltic magma on the Earth
and Moon. Journal of Geophysical Research 86(B4), 2971–3001.
Wolfe, E.W., Garcia, M.O., Jackson, D.B., Koyanagi, R.Y., Neal, C.A., and Okamura,
A.T., 1987, The Puu Oo eruption of Kilauea Volcano, episodes 1–20, January 3,
1983, to June 8, 1984. in: Decker, R.W., Wright, T.L., Stauffer, P.H., (eds.),
Volcanism in Hawaii. Geological Survey Professional Paper 1350(1), 471–508.
Wolfe, E.W., Neal, C.A., Banks, N.G., and Duggan, T.J., 1988, Geologic observations
and chronology of eruptive events. in: Wolfe, E.W., (ed.), The Puu Oo eruption of
Kilauea Volcano, Hawaii; episodes 1 through 20, January 3, 1983, through June
8, 1984. U.S. Geological Survey Professional Paper 1463, 1–97.
Wooten, K.M., Thornber, C.R., Orr, T.R., Ellis, J.F., and Trusdell, F.A., 2009, Catalog of
tephra samples from Kilauea’s summit eruption, March-December 2008. U.S.
Geological Survey Open-File Report 2009-1134, 26 p.
Worthington, A.M., 1908, A study of splashes. London, Longmans, Green & Co., 129 p.
Wright, T.L., 1984, Origin of Hawaiian tholeiite: A metasomatic model. Journal of
Geophysical Research 89(B5), 3233–3252.
Wright, T.L., and Klein, F.W., 2014, Two hundred years of magma transport and storage
at Kīlauea Volcano, Hawai'i, 1790–2008. U.S. Geological Survey Professional
Paper 1806, 258 p.
Wyllie, P.J., 1988, Solidus curves, mantle plumes, and magma generation beneath
Hawaii. Journal of Geophysical Research 93(B5), 4171–4181.
Zimbelman, J.R., and Johnston, A.K., 2001, Improved topography of the Carrizozo lava
flow: Implications for emplacement conditions. in: Crumpler, L.S., Lucas, S.G.,
(eds.), Volcanology in New Mexico. New Mexico Museum of Natural History
and Science, Bulletin 18, 31–136.
146
Zimbelman, J.R., and Johnston, A.K., 2002, New precision topographic measurements of
Carrizozo and McCartys basalt flows, New Mexico. in: Lueth, V.W., Giles, K.A.,
Lucas, S.G., Kues, B.S., Myers, R.G., Ulmer-Scholle, D.S., (eds.), Geology of
White Sands. New Mexico Geological Society Guidebook, 53rd Field
Conference, 121–127.
Zimbelman, J.R., and Griffin, L.J., 2010, HiRISE images of yardangs and sinuous ridges
in the lower member of the Medusae Fossae Formation, Mars. Icarus 205(1),
198–210.