studies of a method of wetland reconstruction …
TRANSCRIPT


The Florida lnstitute of Phosphate Research was created in 1978 by the Florida Legislature(Chapter 378.101, Florida Statutes) and empowered to conduct research supportive to theresponsible development of the state’s phosphate resources. The lnstitute has targeted areas ofresearch responsibility. These are: reclamation alternatives in mining and processing, includingwetlands reclamation, phosphogypsum storage areas and phosphatic clay containment areas;methods for more efficient, economical and environmentally balanced phosphate recovery andprocessing; disposal and utilization of phosphatic clay; and environmental effects involving thehealth and welfare of the people, including those effects related to radiation and waterconsumption.
FIPR is located in Polk County, in the heart of the central Florida phosphate district. The lnstituteseeks to serve as an information center on phosphate-related topics and welcomes informationrequests made in person, by mail or telephone.
Research Staff
Executive Director
David P. Borris
Research Directors
G. Michael Lloyd, Jr.Ulray ClarkDavid J. RobertsonHenry L. BarwoodRobert S. Akins
- Chemical Processing- Environmental Services- Reclamation- Beneficiation- Mining
Florida lnstitute of Phosphate Research1855 West Main StreetBartow, Florida 33830(813)533-0983

STUDIES OF A METHOD OF WETLAND RECONSTRUCTIONFOLLOWING PHOSPHATE MINING
FINAL REPORT
Mark T. Brown and H. T. Odum
with
F. Gross, J. Higman, M. Miller, and C. DiamondGraduate Assistants
CENTER FOR WETLANDSPhelps Laboratory
University of FloridaGainesville, Florida 32611
Prepared for
FLORIDA INSTITUTE OF PHOSPHATE RESEARCH1855 West Main StreetBartow, Florida 33830
Contract Manager: David J. Robertson
September, 1985

iii

PERSPECTIVE
David J. Robertson, Ph.D.
Florida Institute of Phosphate Research Project Manager
The successful recreation and replacement of wetland ecosystemsfollowing mining is among the phosphate industry's highest priorities.Approximately 15 percent of Florida's phosphate reserves are locatedbeneath wetlands, and the state has enacted legislation insuring thatmost of these wetlands will be reclaimed as such. In order to extractthe resources buried under wetlands, the phosphate industry has investedheavily in projects to demonstrate that reclamation technology has beenrefined to the point that restoration of wetland values is virtuallyassured.
Since reclamation became mandatory in 1975, the phosphate industry hasundertaken at least 30 wetland reclamation projects. Perhaps the mostsignificant finding that has emerged from this decade of research is thevalue of spreading organic topsoil excavated from undisturbed wetlands ontorecontoured sites that will be reclaimed as wetland ecosystems. Spreadingtopsoil (also referred to as muck, mulch or peat) onto reclaimed wetlandbasins enhances reclamation in two ways. First, the peat introduces anutrient-rich inoculum onto droughty, bare mineral soil. As long as the peat remains moist and is not allowed to oxidize, the soil structure willapproximate that found in the original wetland and the conditions presentin the undisturbed soil will be duplicated at the new site. Secondly, thepropagules and herbaceous rhizomes that are present in the soil will alsobe transferred to the reclaimed site, thereby replacing and enriching thearea in the same operation. Success in introducing vegetation with themulch depends upon the viability of the individual plant species and theirability to withstand disturbance. Repeated demonstrations using organictopsoil in herbaceous marsh reclamation have led to the widespread adoptionof the technique for all wetland projects. In an effort to evaluate thepotential benefits conferred by spreading peat salvaged from a cypress domeonto a swamp reclamation site, the Institute sponsored this research, whichwas conducted by Dr. Mark Brown of the Center for Wetlands, University ofFlorida.
The organizing theme of the project was the need to quantify theestablishment and survival of wetland plant species on an area that hadbeen spread with salvaged peat. To accomplish this goal, Dr. Brown evalua-ted mulching from three perspectives: the influence of thickness, thepattern of application , and the cost of excavating, transporting andspreading the material. When originally proposed, the project called forpeat to be spread in plots at three depths and in two configurations. Thesite chosen was a lakeside reclamation area at Occidental ChemicalCompany's Suwannee River Mine in Hamilton County, Florida. As the soil was

being delivered, Dr. Brown soon realized that precise application topredetermined specifications would be impossible. In the end, soilthickness ranged from 8 cm to 45 cm. The two configurations consisted ofcomplete coverage at a uniform thickness and of alternating strips of peatand bare ground. The alternating pattern was incorporated into the studyto test the ability of wetland vegetation to colonize unmulched soils, amatter of particular concern since reclamation planners rarely have enoughpeat at hand to effect complete coverage. Detailed cost data weredeveloped to evaluate the effectiveness of this method of wetlandreconstruction. In addition, tree seedlings were planted in the peat andgrowth and survival were compared to seedlings at other locations.
Prior to the inception of Dr. Brown's research, the value of applyingpeat during swamp reclamation had never been gauged, although mulching wasroutinely practiced. In 1982, Agrico Mining Company began reclamation of a366 acre watershed restoration site at its Fort Green Mine. On site, 240acres of upland containing two lakes were designed to spill over into a 126acre wetland. The wetland consisted of 75 acres of march, one acre ofbayhead swamp and 50 acres of floodplain hardwoods. Agrico reported thatspreading organic soil from donor wetlands was very beneficial ininoculating the site.
Three projects begun in 1983 incorporated mulching into the reclama-tion plans. Mobil Chemical Company began work on a project in the head-waters of McCullough Creek which lie partially within the boundaries of thecompany's Ft. Meade Mine. The total wetland area in the project was 21acres, consisting of two acres of marsh and 19 acres of hardwood swamp.Mobil mulched the site with peat material borrowed from similar habitatsslated for mining. Brewster Phosphates received approval of dredge-and-fill plans to relocate two small tributaries of the South Prong of theAlafia River at the Lonesome Mine: Lizard Branch and Dogleg Branch. Theseprojects are model demonstrations with considerable chance for successfulreclamation of stream channels and associated forests. In addition totransplanting large numbers of mature trees, stumps and seedlings onto thesite, Brewster spread wetland topsoil over a significant portion of thereclaimed area. Revegetation was also recently completed on a project atGardinier's Fort Meade Mine. This wetland project was designed by theCenter for Wetlands in cooperation with Gardinier, Inc. Two perchedbayheads in the upper watershed were sealed with phosphatic clays toppedwith organic muck soils. These wetlands drain through a series of swalesand an herbaceous wetland into a small lake. Eventually, the water findsits way through a forested channel into Whidden Creek. The total wetlandarea on the site is about 10.5 acres with a watershed of 153 acres, most ofwhich encompasses two consolidated clay settling areas.
The Institute has also been actively involved in swamp and floodplainforest reclamation investigations that have incorporated mulching. Since1982, the Institute has been a partner in a cooperative agreement with theU.S. Bureau of Mines, the United States Geological Survey and the U.S. Fishand Wildlife Service to reclaim a stream and its associated floodplainforest at AMAX Chemical's Big Four Mine. The revegetation plan for themine, developed by AMAX reclamation planners and the Fish and WildlifeService, "Reestablishment of a Forested Wetland" (FIPR #83-03-052),involves spreading wetland peat over the reclaimed overburden soil.

In mid-1983, Dr. Howard Odum and his graduate researchers at theCenter for Wetlands completed work on a two-year project supported by theInstitute detailing the impact of mining on wetlands. The investigationwas primarily a descriptive study of the vegetative communities thatdevelop in response to a wide variety of landscape modifications producedby phosphate mining. Using data from the project as a foundation, Dr. Odumprepared a follow-up study, "Interactions of Wetlands with PhosphateMining" (FIPR #83-03-041R) which takes an experimental approach to wetlandreclamation. Ms. Betty Rushton, one of the project researchers, has beenconducting research designed to break arrested succession on clay settlingareas dominated by willows. Her primary goal is to accelerate successionby introducing wetland peat, seeds and seedlings from four swampcommunities into heavily vegetated settling areas. This project, currentlyin progress, is scheduled for completion in 1987.
The Institute's most recently funded project, "Viability of Stock-piled Peat for Wetland Reclamation" (FIPR #85-03-063) is an in-houseexamination of the potential for storing wetland peat between the time itis excavated and the time it is spread onto reclaimed basins. Severalmining companies routinely stockpile peat for mulching but have notevaluated the effects of length or depth of storage on the physical,chemical and biological characteristics of the soil. If this researchproves that stockpiling is feasible, topsoil could be applied on reclaimedsites as needed, instead of as available, making coordination of mining andreclamation less critical and reducing the possibility that wetland areaswill be reclaimed without addition of peat. In addition, valuable topsoilcould be preserved for later use as a mulch and inoculum in reclamationprojects even if a site is not ready. Results of this investigation willbe available in 1988.
INTRODUCTION
Wetland reconstruction involving the transfer of peat from a forestedwetland about to be mined to a recently recontoured reclamation site was thegoal of this project. The research was conducted at a site known as Block "B"of Occidental Chemical Company's reclamation project SR-8 near White Springs,Florida (Figure 1). Mining of the reclamation site was completed in 1981 andrecontouring was completed just before September 1982. Wetland development wasmonitored through January 1984.
The original project design called for three different thicknesses and twodifferent treatments of the applied peat. In reality, limitations on accuratelyestimating volume of material as it was delivered to the site led to a varietyof thicknesses ranging from about 8 cm to 45 cm. The treatments consisted ofcomplete coverage in a uniform thickness and of alternating strips of peat andbare ground. Detailed cost data were recorded to evaluate cost effectiveness ofthis method of wetland reconstruction. In addition, tree seedlinqs were plantedin the peat material, and growth and survival were compared to seedlinqs atother locations.
At 3-month intervals, project personnel completed a census of plants,recorded biomass of major species, and measured depth of peat. Water level andpH of water in an adjacent lake were recorded weekly. Germination studies ofundisturbed peat from a forested wetland similar to the "donor swamp" were alsoconducted at the Center for Wetlands for comparison with germination on theexperimental sites. Trays of sterilized soil were placed throuqhout theexperimental sites to account for windblown and waterborne seeds.
Application of Peat
With all site recontouring completed, the peat material was applied to theexperimental sites on 23 and 24 November 1982. The peat was dug from the donorswamp and transported to the experimental site usinq Cat 627 scrapper pans. Inall, 64 scrapper pan loads were applied to the experimental sites.
Approximately three-fourths of the 3-mile round trip haul distance was overfreshly recontoured overburden, which resulted in difficulties due to the weightof the equipment. A motor grader was necessary to maintain the haul road inpassable condition. Difficulties were also encountered in digging the peat fromthe donor swamp with the scrapper pans. It was necessary to push the pansthrough the swamp with a D-8 dozer and at one point even the D-8 dozer bogged
1

3
down, requiring a second dozer for its retrieval. Once the peat was deposited on the experimental sites, a small dozer spread the material to the desired thickness.
Elevation of Experimental Sites
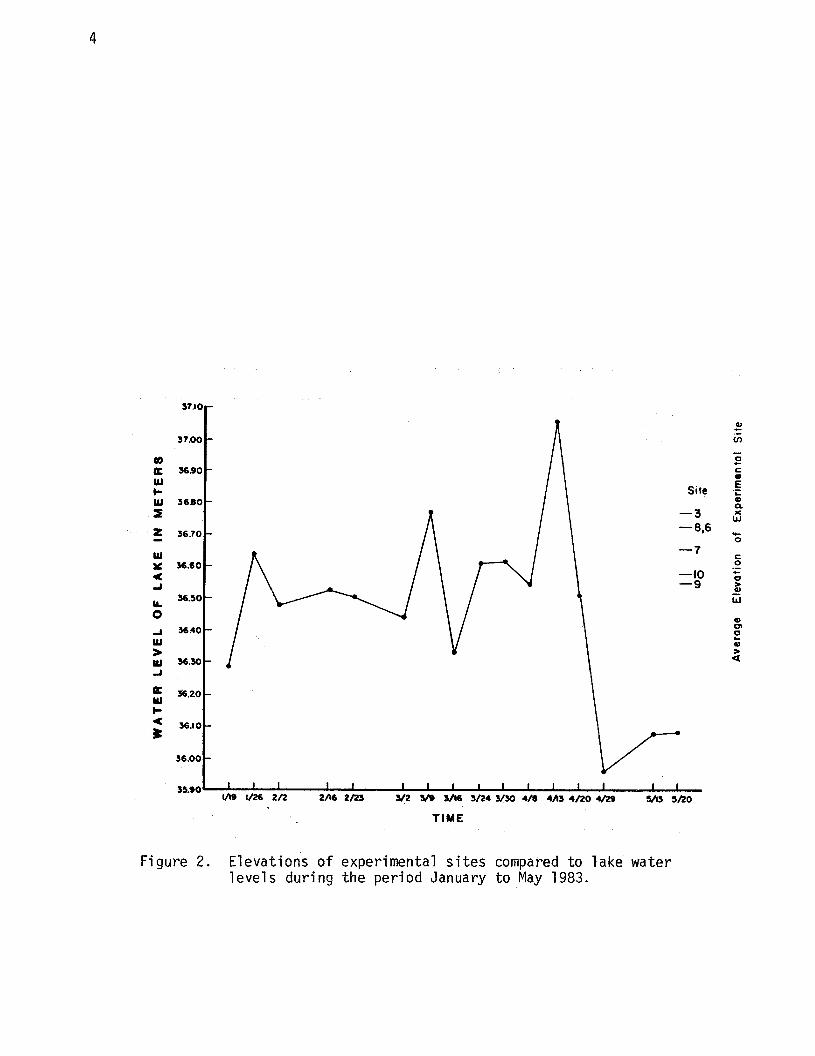
Shown in Figure 2 are the elevations of the experimental sites. Since there is much variation within experimental sites, the elevations in Figure 2 are expressed as the mean of 12 study plots within each of the sites. The fluc- tuation in water level for the first 5 months of 1983 is also given in Figure 2. As shown in the graph, wat.er levels could not be maintained at levels sufficient to inundate the experimental sites. This, combined with the fact that expected compaction of the site by the heavy equipment used to transport the peat did not occur, resulted in the experimental sites being much drier than desired.
Proper water depth and period of inundation are two of the most critical parameters necessary to establish and maintain wetland systems. Without suffic- ient water depth and hydroperiod, the germination, growth, and survival of the wetland species contained in the peat material was, in all likelihood, adversely affected. These unfortunate circumstances led to an early termination of the research project.
However, while the sites were drier than desired, the sites were inundated for a period of time. Germination and one full year's growth under these some- what adverse conditions still resulted in colonization by herbaceous wetland vegetation. The results of this study indicate that significant differences in species composition and total biomass between the control and areas where peat was applied did occur and that colonization by wetland species is far quicker and greater in biomass and number than can be expected without such treatments.
Description of Study Sites
Given in Figure 3 and summarized in Table 1 are the layout and pertinent data for the 10 experimental sites. The long axis of each site runs in a north- south direction with the lake's edge on the north. Peat was applied in alternating strips of peat and bare ground to sites 3, 6, and 9, while sites 7, 8, and 10 had peat applied uniformly. Each site had a different thickness of peat applied. Sites 1, 2, 4, and 5 were set aside as controls, for which, site 5 was used as a control in this first year. The remaining three sites were intended to be used as controls for additional work in the second year that was abandoned as a result of inadequate water levels over the experimental sites.
The first experimental site to have peat applied was site 10, second was site 9, and so on, until the final application to site 3. The order of application was to prove important later, as the material applied to site 10 was from the perimeter of the donor swamp and was far sandier than peat dug from the middle of the swamp. Later, as the plant censuses were taken, this site had far


7
greater numbers and diversity of upland species characteristic of pinelandsystems.
An accurate estimate of the total volume of material applied to the experi-mental sites is difficult. The total number of pan loads was recorded, and avisual estimate of the volume within each pan was made. The application ratewas controlled by the number of pan loads and the assumption that each pancarried approximately 20 cubic yards. This assumption later proved to beinaccurate since measured depths of material suggested that the average volumeper pan was nearer 18 cubic yards.
Within each experimental site, 12 l-m2 study plots were randomly located.These study plots were the basis for plant population structure, biomass, andseed germination studies. Those experimental sites that had peat applied instrips had some study plots located in the bare areas between strips, thus datafor these sites are considerably more variable than for sites that had completecoverage. This was purposely done to test overall germination, growth, and sur-vival in situations where peat may not be applied evenly, but it is important tobear this in mind since these sites had greater variability in measured param-eters.
Background Data for Undisturbed Swamps
To quantify community structure of typical cypress/gum swamps like thechosen donor swamp, vegetation transects were undertaken in two swamps near thedonor site. Vegetation transects could not be done in the donor swamp since ithad been partially cleared in August 1982 in preparation for mining. Observa-tions indicated, however, that the selected cypress/gum swamps where transectswere performed had similar vegetative structure.
Companion Project for Cost Comparison
In March 1983, a second project involving the reconstruction of wetlandswas begun in central Florida. This project, funded by Gardinier near FortMeade, Florida, had a total of approximately 3 ha (8 acres) of wetlands thatwere to be "inoculated" with peat from a donor swamp. Typical wetlands in thisarea of central Florida are bayheads rather than the cypress/gum swamps of northFlorida; thus, comparisons between vegetative structure were not made. However,different techniques of digging and hauling peat material were employed,affording a cost comparison between techniques used at the Occidental site withthose employed at the Gardinier site.
METHODS
Veqetation Transects
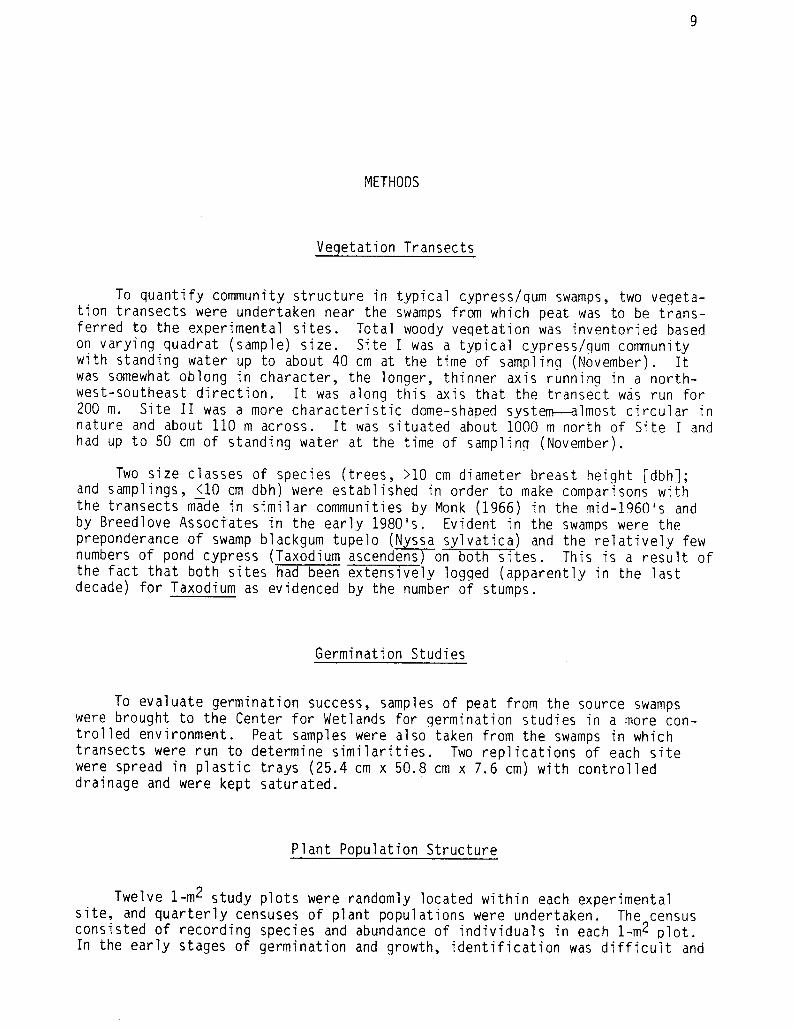
To quantify community structure in typical cypress/qum swamps, two vegeta- tion transects were undertaken near the swamps from which peat was to be trans- ferred to the experimental sites. Total woody veqetation was inventoried based on varying quadrat (sample) size. Site I was a typical cypress/gum community with standing water up to about 40 cm at the time of sampling (November). It was somewhat oblong in character, the longer, thinner axis running in a north- west-southeast direction. It was along this axis that the transect was run for 200 m. Site II was a more characteristic dome-shaped system-almost circular in nature and about 110 m across. It was situated about 1000 m north of Site I and had up to 50 cm of standing water at the time of sampling (November).
Two size classes of species (trees, and samplings,
>lO cm diameter breast heiqht rdbh]; <lO cm dbh) were established in order to make comparisons with
the transects mahe in similar communities by Monk (1966) in the mid-1960's and by Breedlove Associates in the early 1980's. Evident in the swamps were the preponderance of swamp blackgum tupelo (Nyssa sylvatica) and the relatively few numbers of pond cypress (Taxodium ascendens)on both sites. This is a result of the fact that both sites had been extensively logged (apparently in the last decade) for Taxodium as evidenced by the number of stumps.
Germination Studies
To evaluate germination success, samples of peat from the source swamps were brought to the Center for Wetlands for germination studies in a more con- trolled environment. Peat samples were also taken from the swamps in which transects were run to determine similarities. Two replications of each site were spread in plastic trays (25.4 cm x 50.8 cm x 7.6 cm) with controlled drainage and were kept saturated.
Plant Population Structure
Twelve l-m2 study plots were randomly located within each experimental site, and quarterly censuses of plant populations were undertaken. The census consisted of recording species and abundance of individuals in each l-m2 plot. In the early stages of germination and growth, identification was difficult and

10
thus resulted in a large percentage of unknowns. The first census was conductedin February 1983 (3 months after peat application), the second was conducted inMay 1983, the third was conducted in August 1983, and the final census was con-ducted in October 1983.
Censuses of plant population structure for the germination studies undercontrolled conditions at the Center for Wetlands were also conducted. Sixsamples of the peat material that was applied to the experimental sites and twosamples of undisturbed soil from cypress/gum swamps where vegetative transectswere conducted were returned to the greenhouse, and censuses of plant populationstructure were done at the same intervals as those on the experimental sites.
Relative density, frequency, relative frequency, and importance values werecalculated for each study plot, and means for each experimental site were deter-mined. Statistical comparisons between plots and sites were then conducted totest differences in response of these variables with elevation, peat depth, andtreatment (complete coverage versus strip application).
To compare germination, growth,upland species,
and survival of wetland species versusa list of typical wetland plants, transitional plants, and
upland plants was compiled using the latest information from the Department ofEnvironmental Regulation (proposed Rule 17-4.02 (17) and Rule 17-4.022, F.A.C.)and from Godfrey and Wooten (1979) and are given in Table 2.
Biomass
The change in biomass over time and under differing conditions was ofimportance. Biomass was determined without destructive sampling of the studyplots due to the limited area of each experimental site. Instead, after theplant population census, the most abundant species were determined (in all casesthese species represented over 96% of individuals present and an estimated 98%of total biomass), and 10 individuals of each species on each experimental sitewere harvested, dried, and weighed. Selection was carried out in the followingmanner: a line running north to south was established randomly within eachexperimental site and a starting point was randomly selected. From this start-ing point, the first 10 individuals of each species that came in contact withthe line were harvested. An exception to this strict method was made only ifone of these first 10 individuals was within one of the square meter studyplots, then the plot was skipped and the next individual was harvested outsidethe plot.
Statistical analyses were conducted on the differences in biomass betweenexperimental sites only, since data could not be reduced to the individualsquare meter study plots with the method used to determine biomass. DuringApril 1983, the experimental sites were completely covered with water due toextremely high rainfall. Water hyacinth (Eichhornia crassipes) drifted over thesites during this time. As the water receded, much of the hyacinth remained,covering some areas of the experimental plots. Using field maps of each site,the area of coverage was mapped, and percent cover was calculated.weight) was determined by harvesting,
Biomass (drydrying, and weighing a 0.25-m2 section


13
of the hyacinth. Total input of organic matter was then estimated using dryweight per square meter and area of coverage.
Planted Seeds and Seedlings
Three types of wetland tree species were planted as bare root seedlings ineach of the experimental sites. Seedlings were planted on the 2nd and 23rd ofFebruary 1983 in a north-south line through each site and were marked for lateridentification. Swamp blackgum tupelo (Nyssa biflora) seedlings were collectedfrom a natural area where disturbance had caused several thousand seedlings togerminate at the same time. These seedlings were washed and kept underrefrigeration for approximately 1 wk before transferring them to theexperimental sites. Bald cypress (Taxodium distichum) and sweetgum(Liquidambar styraciflua) were obtained from the Florida Department ofAgriculture, Division of Forestry. The height of each seedling was recorded,and growth rates for the 1983 growing season were determined by measuringheights at the end of the growing season (21 October 1983).
Four other reclamation sites planted within the last 4 years were selectedto compare the growth rates of seedlings planted on the peat material. One ofthe sites was planted at roughly the same time as the seedlings on theexperimental sites. This site (site D) was used for direct comparison ofsurvival and growth with the experimental sites. Only bald cypress (Taxodiumdistichum) was planted at this site. Other sites were planted at various timesstarting in 1981 and were selected as long-term comparisons for the experimentalsites. All four Occidental reclamation seedling sites were surveyed 13 May1983 and again on 21 October 1983. Percent survival was calculated and percentchange in height was determined.
Physical Parameters
Lake water pH and interstitial water pH were recorded throughout the year.An Orion Research Ionanalyzer model 339A was used in the field to determineweekly pH of the lake water. Interstitial water pH was measured on 30 March, 8April, and 20 April 1983. On all other dates, the experimental sites wereeither inundated or too dry for measurements.
Soil pH was determined in two ways: first using distilled water and secondusing 0.01 M CaCl. Soil samples were collected on 24 November 1982, 30 March,13 May, and 15 December 1983, returned to the Center for Wetlands laboratory,and analyzed. In addition, overburden samples were analyzed for comparativepurposes.
Peat depth was measured shortly after application to the experimental sitesand again in January 1984 to determine a rate of subsidience over time. Threepermanent sampling locations were established (one at the north end, one in themiddle, and one at the south end) at each experimental site. A hole was dug

14
through the peat and into the underlaying overburden. Several measurements ineach soil pit were made and a mean was calculated for each location.
Lake water levels were monitored from January 1983 to January 1984. In theearly phases of the project, a Stevens water level recorder was set up for acontinuous recording of the lake water fluctuations. Later in the year, aswater levels stabilized, weekly water levels were recorded.
Economic Costs
Detailed records were kept throughout the 2 days of peat application to thesites. The number of loads, estimates of volume per load, round-trip traveltime, and hours of equipment operation were recorded as the application progres-sed. The round-trip travel distance and total dollar costs (charged at Occi-dental's internal rate) were also determined. Later, estimates of total volumeof peat applications were adjusted using the measurements of peat depth and areaof each experimental site.
Later during 1983, we had a second opportunity to evaluate the dollar costsof peat mulching when Gardinier reclaimed two areas of wetlands (the firstconsisting of approximately 3 ha (8 acres) and the second of approximately 2.5ha (6 acres). Their methods of digging and transporting the material were quitedifferent, so these trials offered a comparison. Billing records were obtainedcourtesy of Gardinier staff, and only the costs associated with equipment usedin the digging, transporting, and spreading of the peat were used in theevaluation. Of the two trials, accurate cost records were kept for the 2.5 hawetland project. Those data were used as a comparison to those of theOccidental trials.
Statistical Evaluation
Statistical methods were applied to collected data to examine the relation-ships of experimental site characteristics (average elevation, peat depth, andpercent area covered by peat) to vegetation parameters (biomass and speciesdiversity).
The data were organized along two lines: 1) totals and averaqes of biomassand diversity for experimental sites, thereby reflecting the effects of sitecharacteristics (i.e., treatment), and 2) unaveraged values of diversity bystudy plot, providing a larger statistical basis for examining the effects ofelevation and peat depth regardless of context.
Computer facilities of the Northeast Regional Data Center on the campus ofUniversity of Florida were used. The followinq procedures (elements of the Sta-tistical Analysis Systems package) were used: correlation, analysis of variance,general linear model, multiple regression, and a plottinq routine.

15
RESULTS
Vegetation Transects
Summary data for vegetation transects through two cypress/gum swamps thathad no recent disturbance are given in Tables A-l and A-2 in the appendix. Thesites had been logged for pond cypress (Taxodium ascendens), however, within thelast decade and thus the population of this species within both swamps was lowerthan that found in like ecosystems by Monk and Brown 1965, and Brown 1978. Theonly evidence of logging was the number of stumps still present. Other signs ofdisturbance such as open canopy and trampled shrub vegetation had beenrepaired.
By far, the most important tree species (>l0 cm dbh) was swamp blackgumtupelo (Nyssa sylvatica) with pond cypress (Taxodium ascendens) the second mostimportant. The most prevalent sapling species (<10 cm dbh) was fetterbush(Lyonif lucida). Other species present included sweetbay magnolia (Maqnolia
virginiana), red maple (Acer rubrum), swampbay persea (Prersea palustris),summersweet clethra (Clethra alnifolia), and wax (Myrica cerifera) amongothers.
Herbaceous vegetation was not included in these surveys since tree specieswere the primary focus of the study.
Plant Population Structure on Experimental Sites
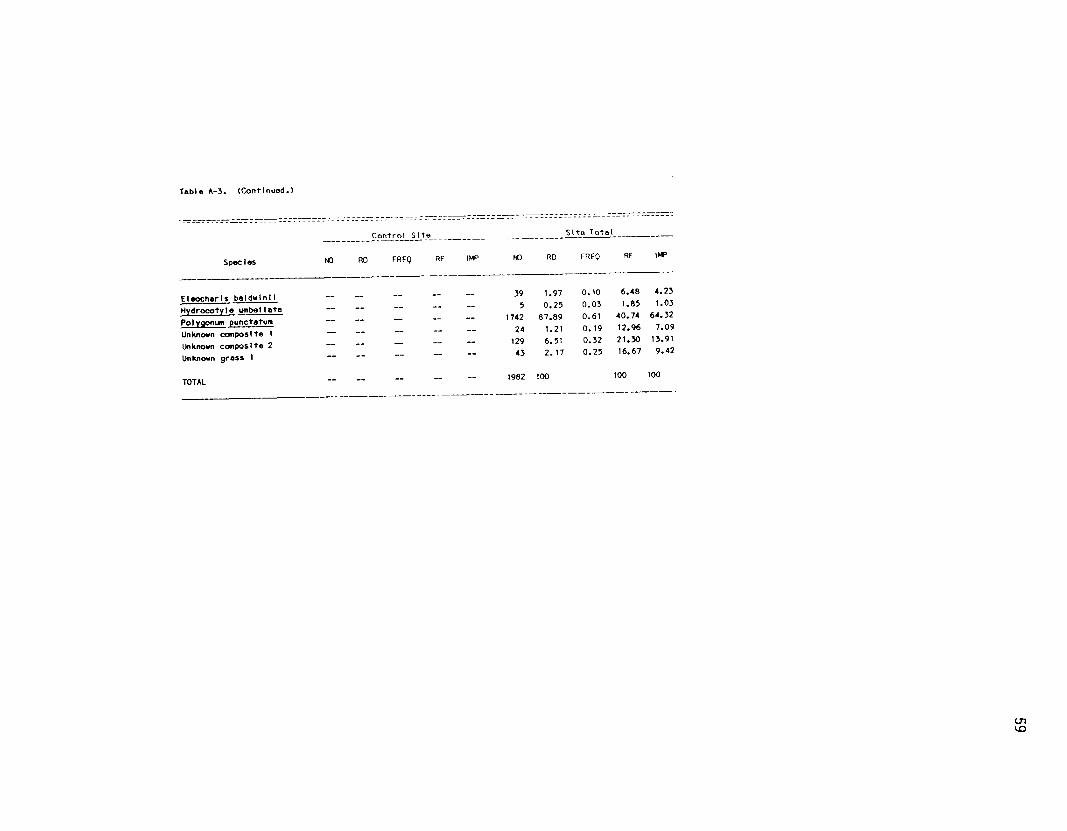
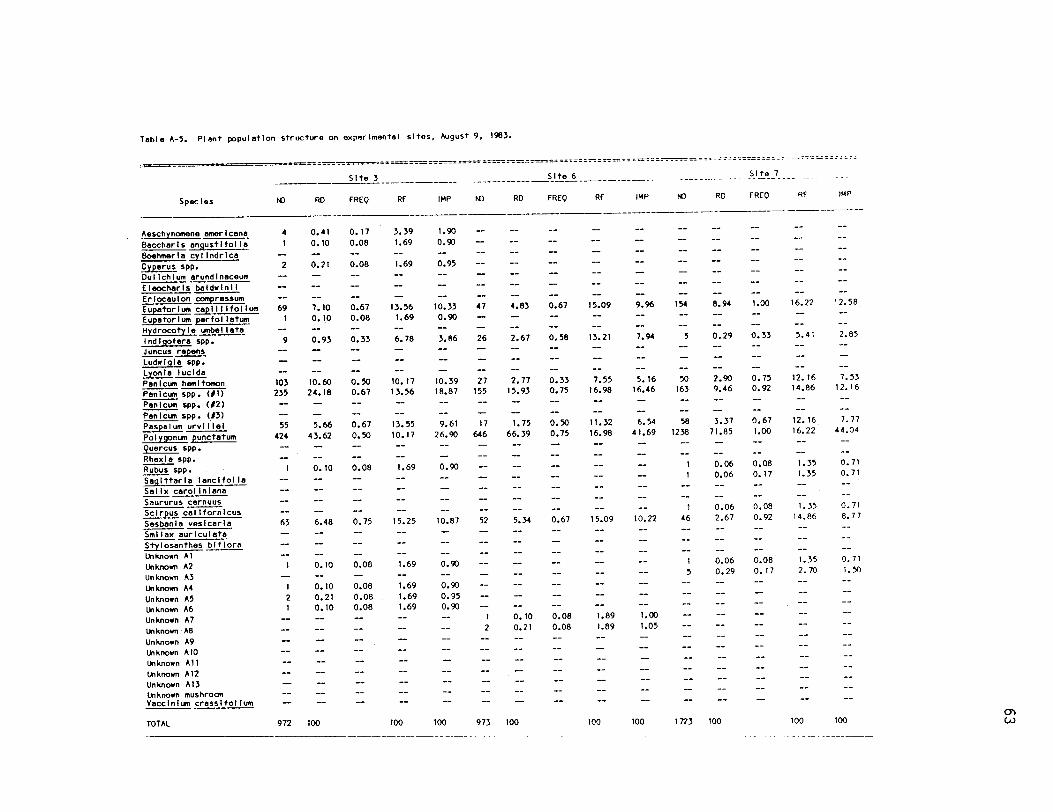
Four detailed censuses of the plant population structure were performedover the year following peat application to the experimental sites. The datafrom each census by experimental site and plot summaries of each census are pre-sented in the appendix of this report (Tables A-3 through A-6). Values for rel-ative density (number of individuals of a species per total number of allindividuals of all species times l00), frequency (number of plots on whichspecies occur per total number of plots), relative frequency (number of plots ofoccurrence of a species per number of plots of occurrence of all species timesl00), and species importance (relative density plus relative frequency convertedon a basis of 100% for all species) are given.
All plant species identified are listed in Table 3 by date of each plantcensus. In the very early stages of germination, plants were difficult toidentify and few individuals had germinated. In the second census quite a fewspecies remained unidentifiable, but there were fewer and fewer unknowns as theplants matured. In a few cases, plants were misidentified in the second or

16

17

18

19
third census, thus, in these instances, they were shown to be present in thesecond or third census, but not in the fourth.
Germination Studies
Germination studies of peat samples from each experimental plot and wetlandtransects run previous to the plot sampling were monitored during the course ofthe project at the Center for Wetlands. Statistics for relative density, fre-quency, relative frequency, and importance values were calculated for the germ-ination study. Tables of germination tray data for three census periods aregiven in the appendix as Tables A-7 through A-9.
Species composition in the germination trays was similar to that on theexperimental sites. In the first census, the dominant species (determined byimportance values), on both the experimental sites and the germination trays wassmart weed (Polygonurn punctatum), while the most frequent species was spike rush(Eleocharis baldwinii) in the germination trays and Polygonum on theexperimental sites.
Both the germination trays and the experimental sites had very low speciescounts early in the year, increasing over time. By the August census, therewere 42 different species present on the experimental sites and 21 in thegermination trays. At this time Panicum (total of 3 species) and Polygonum werethe most important species in the germination trays, while Polygonum, Panicum (Ispecies) and Sesbania were the most important on the experimental sites. Bythe end of the growing season, Polygonum and Panicum bartowense were clearly themost abundant, important, and dominant species on the experimental sites (seeTables A-6 and A-12 in the appendix).
Biomass
Biomass samples were taken the same day the population data were taken.Three biomass samples were obtained over a year's time. Plants were not abund-ant enough during the February sampling period for biomass to be measured. May,August, and October data are presented in Tables A-10 through A-12 in the appen-dix.
Five of the 16 species taken for biomass determination were represented ineach of the three sampling periods. These species were smartweed (Polygonurn
punctatum), dog fennel (Eupatorium capillifolium), panic grass (Panicum spp.),bagpod Sesbania (Sesbania vesicaria), and indigo (Indigofera spp.)
Given in Table 4 and Figure 4 are the biomass data for the experimentalsites and control site for the three sampling periods of May, August, andOctober. Biomass was not determined for the first sampling period since littlevegetative growth had occurred prior to the beginning of February. As expected,biomass of upland and wetland species increased over time. Average wetlandspecies biomass was greater than upland species biomass on all sites during theentire year except for sites 3 and 10 in August and for site 10 at year's end.Site 10 had the greatest upland species of all sites, and no wetland speciesbiomass at the year end census.


21

22
The control site wetland biomass throughout the year was lower whencompared to the mean for all sites, and showed an increase above the mean foruplands species biomass. Sites 8 and 9 showed the greatest increase above themean wetland species biomass,in upland species biomass.
while sites 9 and 10 showed the greatest increaseAt the end of the growing season, sites 8 and 9 had
the greatest wetland species biomass.
At the end of the growing season sites 9 and 10 had the greatest uplandbiomass of all sites, including the control. This is probably the result of thedifferences in peat applied to these two sites verses the other sites. Thesewere the first two sites to have peat applied and consequently, the materialwas dug from the edges of the donor swamp and may have contained more uplandspecies' genetic material than other peat that was obtained from more interiorlocations. This is particularly unfortunate, since these two sites had thelowest elevations and greatest thicknesses of peat applied of all sites, andcorrelations of wetland biomass with elevation and peat thickness showed nostrong relationships.
Site 3 (the highest and driest site) had lowest total biomass and lowestwetland biomass at year end, while site 9 (the wettest site) had highest totalbiomass and second highest wetland biomass.of applied peat.
Site 9 also had the greatest depthSite 8, one of the drier sites, had the highest wetland
biomass at year's end.
The contribution to non-living biomass on the experimental sites from thewater hyacinth (Eichhornia crassipes) that drifted over the sites during thehigh water of April 1983 was determined. Percent cover of each site wascalculated from detailed maps and is shown schematically in Figure 5. Theoverall contribution to non-living biomass based on percent cover of each siteand measured non-living biomass of hyacinth of 1594.84 q dry weight/m2 isgiven in Table 5. Sites 6 and 7 were most affected with 30.19% and 35.87%cover, respectively.
Seedling Census
Three types of tree seedlings were planted in each experimental plot.Swamp blackgum tupelo (Nyssa biflora) seedlings were collected from the naturalarea and bald cypress (Taxodium distichum) and sweetgum (Liquidambarstyraciflua) were purchased from the Florida Division of Forestry. Growth andsurvival rates of these seedlings were compared to four other seedling sites onOccidental's reclamation areas, which were planted over the past 4 years. Eachof these sites varied in ape and growth conditions. A 10-m wide transect wasplotted in each of the four areas. Originally not less than 30 individuals weretagged and measured for height at each site. Average heights of trees plantedon the experimental sites and on Occidental's reclamation sites are given inTable A-13 of the appendix. Survival on some plots was affected by excessiveflooding in April 1983 and wild animal grazing.
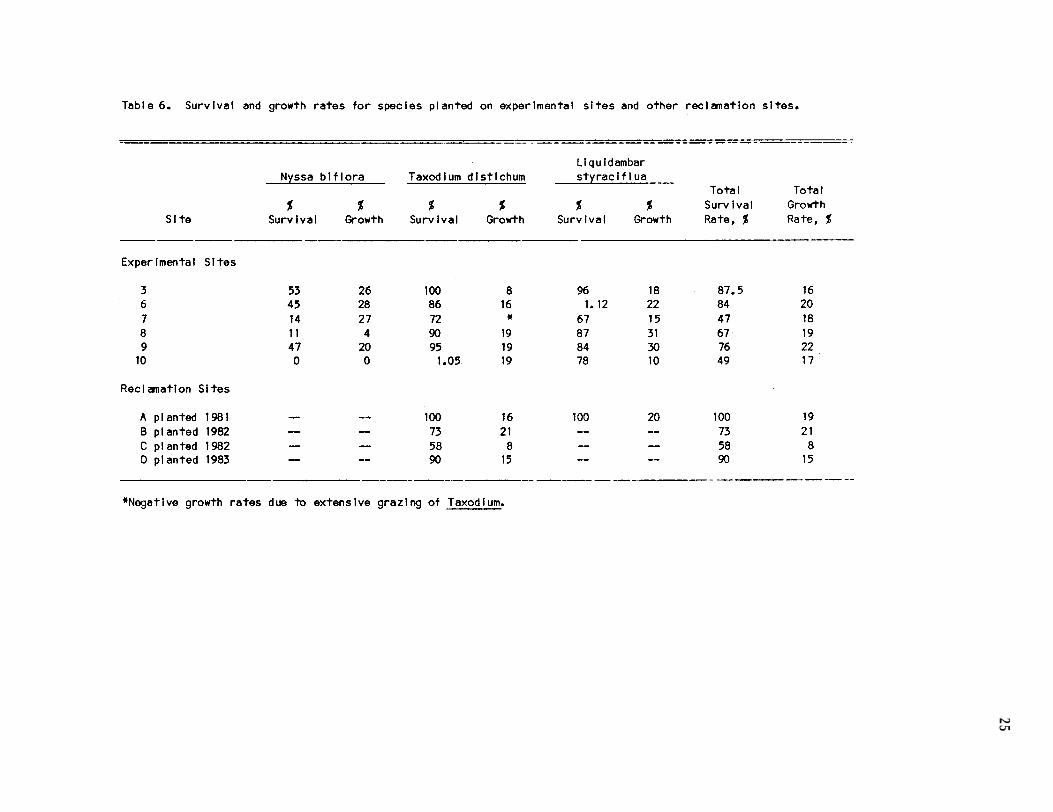
Survival and growth rates are given in Table 6 for the experimental sitesand Occidental's other reclamation areas. Growth rates on the experimentalsites were highest for sweetgum, followed by blackgum and bald cypress.

23

24
25

26
Survival rates sites were highest for cypress,gum, respectively.
followed by sweet gum and black
During the very high water of April,hyacinth that floated across the sites.
many seedlings were covered by
hard hit.Site 7 (note Figure 5) was particularly
The lowest site, site 10, had highest seedling mortality of blackgumand cypress, and significant mortality of sweetgum, probably as a result of thelength of time and depth of inundation. If sites 7 and 10 are not included,percent survival over the remaining sites for blackgum, cypress, and sweetgumaveraged 39%, 93%, and 67% respectively.
The only comparison in this first years growth, between the seedlingsplanted on the experimental sites and those planted elsewhere on overburden is acomparison between the experimental sites and site "D" in Table 6. The site "D"cypress were planted at about the same time and were from basically the samesource, although different purchases. Overall growth rates and survival on theexperimental sites were not statistically different from those planted on theoverburden at site "D".
Accumulation/Loss of Peat
Peat depth was initially calculated from estimates of the volume of peatapplied to each experimental site and measured for more accurate determinationin April 1983 and January 1984. Water seldom covered the sites during the year,thus peat was exposed to weathering and oxidation. Given in Table 7 are themeasured depths of peat at three locations on each of the experimental sites.While there is no clear indication of trends of peat loss, half of the sitesshowed decreases in depth, the majority of which were along the northern edgenext to the lake. The average loss of peat at these points was 8.5 cm. Theremaining locations showed a net increase in peat depth, probably due to differ-ences in measuring technique rather than an actual increase in peat.
pH of Soils, Interstitial Waters, and Lake
Weekly measurements of lake water pH were made using an Orion Research Ion-analyzer model 339A. When the experimental peat sites were saturated withwater, interstitial pH was measured. Given in Table 8 are the measured pH's ofinterstitial water and the lake water for those periods when the peat on theexperimental sites was saturated. The experimental sites remained too dry tohold measureable interstitial water from 29 April 1983 to 5 January 1984. Shownin Figure 6 is the fluctuation of pH in the lake water adjacent to theexperimental sites.
The pH of the peat on the experimental sites was measured initially whenthe peat was applied, again in March and May 1983, and finally in December 1983.Given in Table 9 are the pH measurements in distilled water and 0.01 M CaClsolution on the experimental sites. Representative samples of overburden and

27
Table 7. Peat depth (cm) on experimental sites.
-
Site
04/29/83 01/05/84 - Initial*
Estimate, cm South Middle North South Middle North
3 11.3 11 8 19 6 11 7
6 22.6 25 20 16 24 24 20
7 8.7 7 11 19 9 10 9
8 17.3 . 18 15 15 18 13 8
9 45.2 32 26 29 37 28 27
10 32.1 38 32 40 41 36 28.5
*Calculated from area covered by peat and estimation of volumes applied.

28

29

30
31
peat from an undisturbed cypress/gum swamp are given for comparison. No signif-icant trends in pH changes over the duration of the project are apparent.
Water Levels
Rainfall was monitored daily by Occidental Chemical Company on weekdays:weekend values were summed. Monthly totals are given in Table A-14. Amountswere typical for north-central Florida, though the summer rainfall made up asmaller proportion of the total than was expected. During the early stages ofthe project, January through April, total rainfall was greater than usual. Mayand October were very dry.
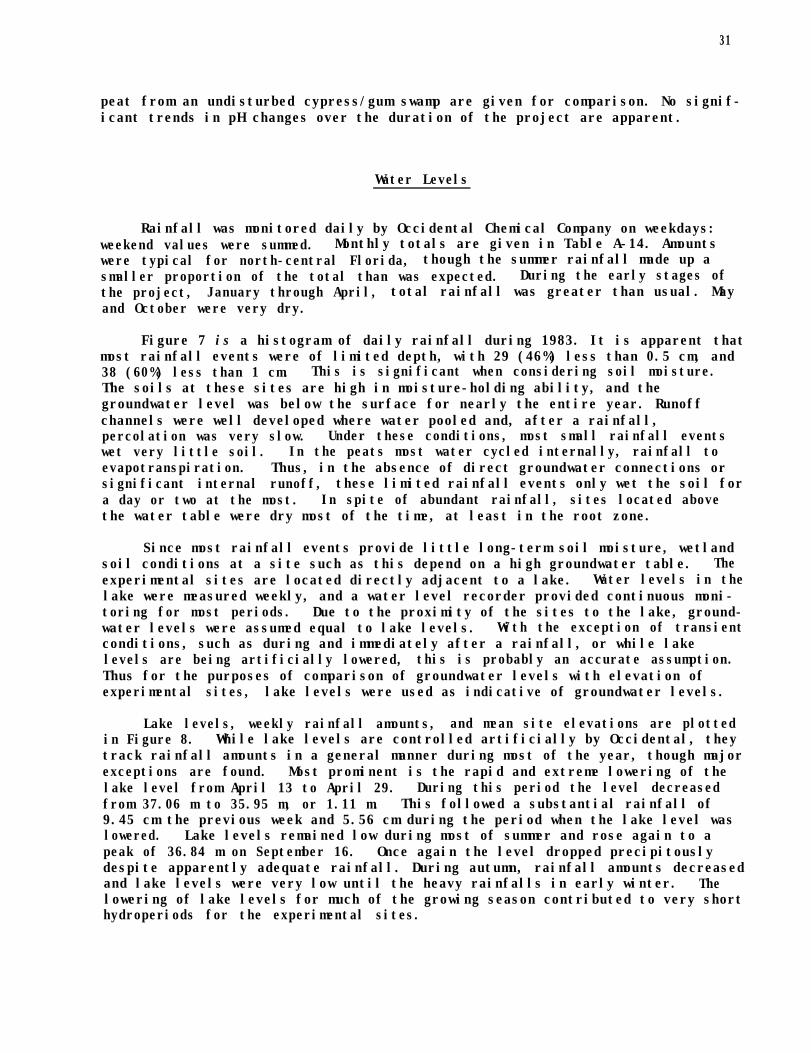
Figure 7 is a histogram of daily rainfall during 1983. It is apparent thatmost rainfall events were of limited depth, with 29 (46%) less than 0.5 cm, and38 (60%) less than 1 cm. This is significant when considering soil moisture.The soils at these sites are high in moisture-holding ability, and thegroundwater level was below the surface for nearly the entire year. Runoffchannels were well developed where water pooled and, after a rainfall,percolation was very slow. Under these conditions, most small rainfall eventswet very little soil. In the peats most water cycled internally, rainfall toevapotranspiration. Thus, in the absence of direct groundwater connections orsignificant internal runoff, these limited rainfall events only wet the soil fora day or two at the most. In spite of abundant rainfall, sites located abovethe water table were dry most of the time, at least in the root zone.
Since most rainfall events provide little long-term soil moisture, wetlandsoil conditions at a site such as this depend on a high groundwater table. Theexperimental sites are located directly adjacent to a lake. Water levels in thelake were measured weekly, and a water level recorder provided continuous moni-toring for most periods. Due to the proximity of the sites to the lake, ground-water levels were assumed equal to lake levels. With the exception of transientconditions, such as during and immediately after a rainfall, or while lakelevels are being artificially lowered, this is probably an accurate assumption.Thus for the purposes of comparison of groundwater levels with elevation ofexperimental sites, lake levels were used as indicative of groundwater levels.
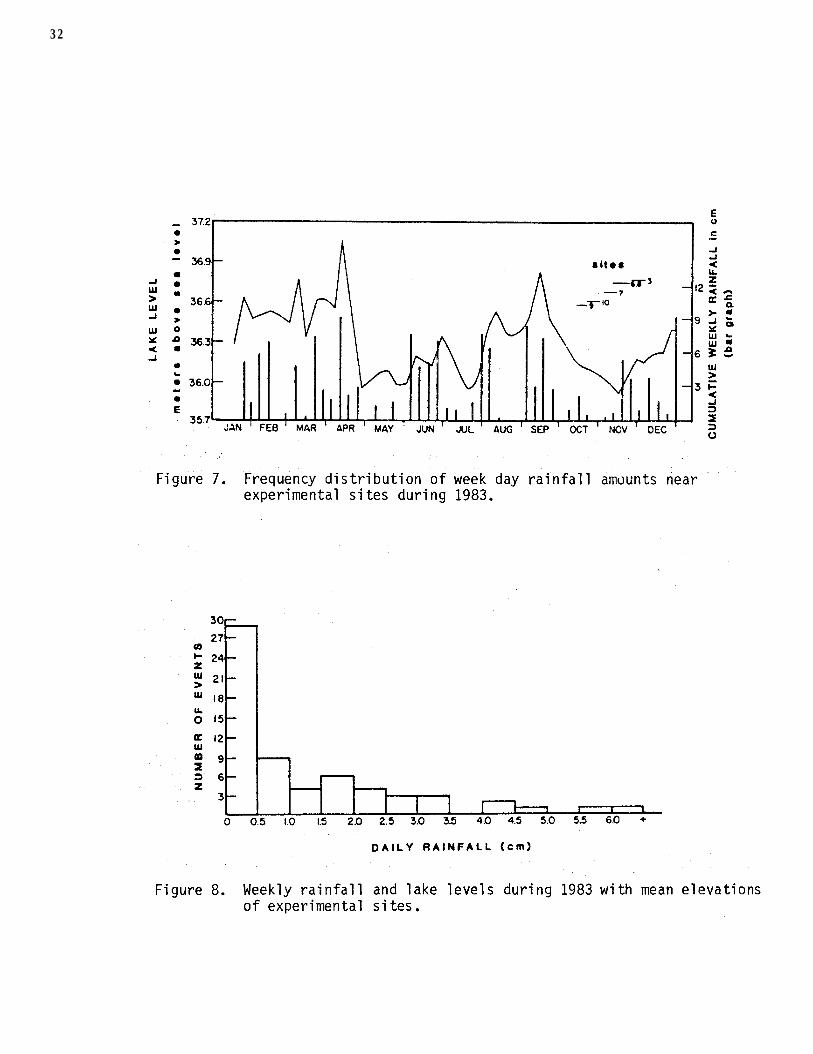
Lake levels, weekly rainfall amounts, and mean site elevations are plottedin Figure 8. While lake levels are controlled artificially by Occidental, theytrack rainfall amounts in a general manner during most of the year, though majorexceptions are found. Most prominent is the rapid and extreme lowering of thelake level from April 13 to April 29. During this period the level decreasedfrom 37.06 m to 35.95 m, or 1.11 m. This followed a substantial rainfall of9.45 cm the previous week and 5.56 cm during the period when the lake level waslowered. Lake levels remained low during most of summer and rose again to apeak of 36.84 m on September 16. Once again the level dropped precipitouslydespite apparently adequate rainfall. During autumn, rainfall amounts decreasedand lake levels were very low until the heavy rainfalls in early winter. Thelowering of lake levels for much of the growing season contributed to very shorthydroperiods for the experimental sites.
32

33
Hydroperiod
Hydroperiod, or the total number days during the year when water is at orabove the soil surface, is a critical parameter in the establishment and differ-entiation of wetlands types. Approximate hydroperiods have been measured fordifferent wetlands ecosystems in Florida by Wharton et al. (1977) and Brown andStarnes (1983). Hydroperiods range from 365 days a year for marshes to 100-150days for hydric hammocks. Given in Table 10 are the mean elevations and hydro-periods (determined from water level records and mean elevations) for the exper-imental sites. The longest hydroperiod was 48 days for experimental site 9,indicating that appropriate wetland hydroperiods fell short of those observedfor natural wetland communities. The timing of inundation was also inappropri-ate for wetland formation, with little flooding occurring during the activegrowing season. It is thus clear that hydrologic conditions were generally notconducive to wetland development.
It is apparent from Table 10 that very small changes in elevation can makemajor changes in hydroperiods. The hydroperiods for each of the square meterstudy plots were determined using elevation of each plot and water levelrecordings, and compared with the number of wetland, transitional, and upland
species found on each plot. These data are given in Table 11. The majority ofplots had short hydroperiods with 74% having hydroperiods less than 30 days.While there are fewer species in all groups as hydroperiod increases (probablydue to the decreasing sample size [i.e., number or plots]), some trends areapparent. Transition zone species make up a larger proportion of the speciesfound at longer hydroperiods and upland species make up a smaller proportion.This could indicate that the upland species are at a competitive disadvantage onthe wetter sites and that some of these plot hydroperiods are approachingwetland duration. It is interesting that only two upland species, panic grass(Panicum commutatum) and crab grass (Digitaria sanguinalis) are found athydroperiods greater than 50 days. However, there are too few plots in theselonger hydroperiod classes to be conclusive and one year may be too short a timeto draw hard conclusions. The number of submerged species exhibits no obviouspattern, indicating again that these hydroperiods may be too short forestablishment of species requiring greater periods of saturated and/or inundatedsoils.
The relationships of hydroperiod to number and mean biomass of submerged,transitional, and upland species are given in Figures 9A and 9B. The graphsexpress hydroperiod as a mean for each experimental site. While there are nosignificant differences between numbers of species of each class versushydroperiod, total biomass in each class exhibits some change with increasinghydroperiod. As might be expected the biomass of upland species decreasesrapidly with increasing hydroperiod, while the biomass of transitional speciesincreases. The biomass of submerged species is lowest with a hydroperiod of 40days. This low point corresponds to experimental site 10 and as statedpreviously, may be the result of differences in the peat material instead of anyrelationship to hydroperiod.
A more detailed picture of the relationships of hydroperiod to mean biomassis given in Figures 1OA and 10B. The hydroperiod and mean biomass for each ofthe square meter study plots are graphed. Since there is much greater variationin elevation for each of the study plots as compared to the mean elevation ofthe experimental sites, there are a number of plots with hydroperiods greater

34

35

36

37

38
than 50 days (see Tables 10 and 11). In Figure 10A the larger number of datapoints gives a clearer picture of the increase in transitional species biomasswith increasing hydroperiod when compared to the graph in Figure 9B. Total meanbiomass (the sum of upland, transitional, and submerged biomass) versus hydro-period is graphed in Figure 10B.increasing hydroperiod; however,
The trend indicates increasing biomass withit is important to bear in mind the relatively
small number of sites that had hydroperiods greater than 50 days when drawingconclusions from both Figures 10A and 10B.
Topographic Diversity
Natural wetland ecosystems, whether young or mature, tend to have small-scale topographic variation. The variation results from geologic forces, treegrowth and uprooting, animal activity, and hydrologic events, and creates manypotential habitat types. In ecosystems with a fluctuating water table close tothe surface, this variation in topography may be of great importance to micro-habitat conditions and the development of community plant diversity.
During the application of peat to the experimental sites, large equipmentwas used to deposit and spread the material under somewhat adverse conditions.Some unevenness of the applied peat could be expected, adding to the existingvariation in terrain resulting from initial contouring. Elevations at all 12study plots within each of the experimental sites were determined and thestandard deviation of these elevations, expressed in meters, was used as themeasure of topographic diversity. Given in Table 12 are the mean depths ofpeat, volume applied, and topographic diversity (s) for each of the experimentalsites. The first three sites are strip treatments, and the second three sitesare uniform spreading treatments. Within each of the major treatment categories(strips and uniform spreading) greater topographic diversity was associated withgreater volumes of material. For the same volume, there was greater diversitywith the strips than the uniform treatment, as would be expected.
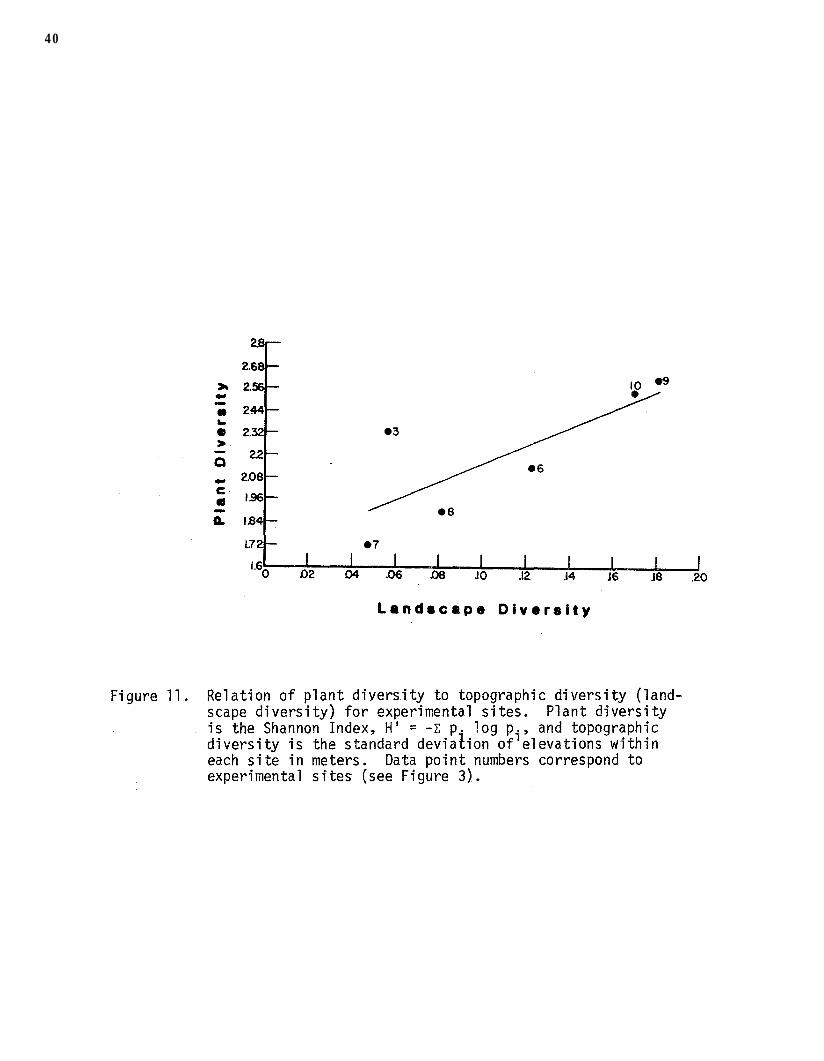
To test whether the biotic factors are closely related to microhabitatvariation at this early stage of ecosystem development, overall plant diversitywas calculated for each study site using the Shannon Index (Shannon and Weaver1949) and was regressed on topographic diversity (Figure 11). The positivelinear correlation (r = 0.79) is significant at the 90% level, using a t-testfor population correlation (Steel and Torrie 1980). Site 3 has the greatestdivergance from the general pattern. This site is at the highest elevationrelative to water level and had peat applied in strips. These two factors mayexplain the higher plant diversity because of the inclusion of a larger numberof upland species. Presence of peat was highly significant at early samplingdates but became less significant as high-growth legumes took over the nonpeatareas.

39
40

41
Statistical Evaluation of Results
Various statistical tests were performed to evaluate the effects of thetreatments, presence and absence of peat, elevation, hydroperiod, and thicknessof peat on the numbers, diversity, and biomass of plant species on the experi-mental sites. With only one year's data, and the complications induced becauseof the low water levels, the statistical evaluations are not as strong as onewould like. Where correlation coefficients were close to "1" the results werenot statistically significant.
Differences in mean biomass between plots that received peat and those thatdid not were evaluated with t-tests. Figure 12 shows the relationships betweenpeat and non-peat plots. The non-peat plots are all plots in the striptreatment experimental sites that were not on the peat and the control plot.The differences (assuming unequal variances) between total biomass on plots withpeat and without peat are significant to the 96% confidence level. The testsfor differences in submerged species biomass were also significant at the 99.95confidence level. However, such high confidence levels were not associated withthe differences in peat and no peat for transitional and upland species biomass.There was no significant difference in transitional or upland species biomassbetween peat and non-peat plots.
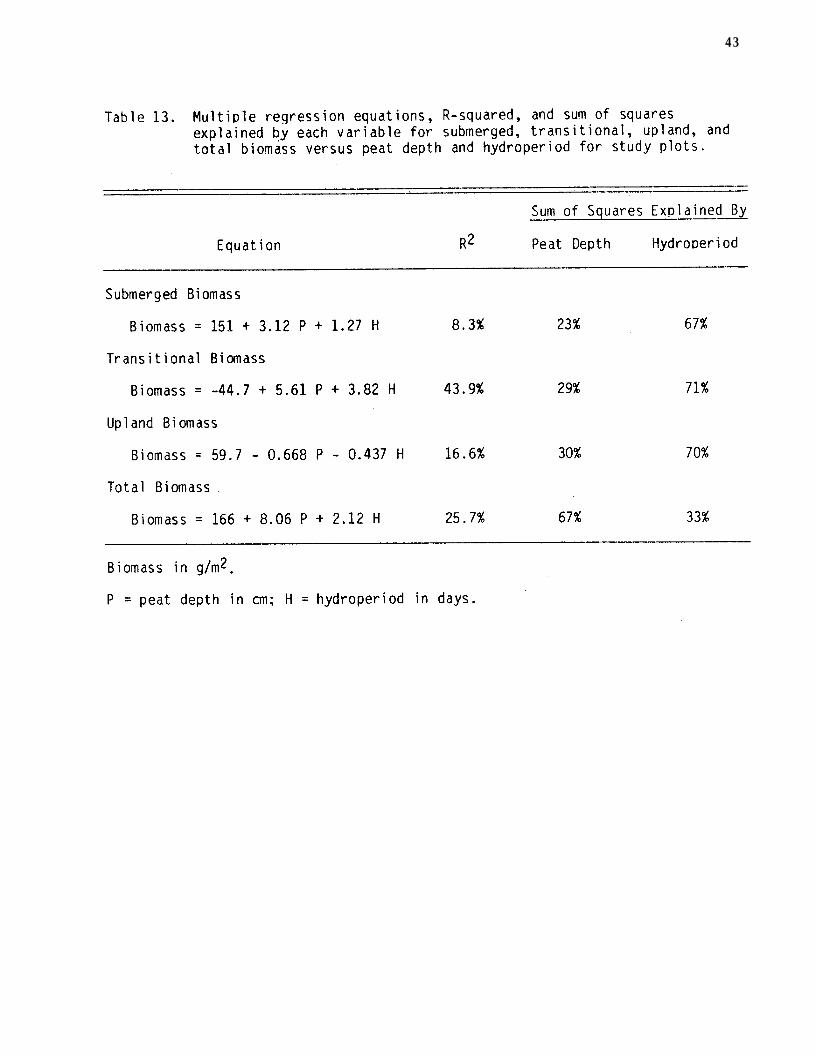
Multiple regressions on plot data for upland, transitional, and submergedspecies versus peat depth and hydroperiod were performed. The regression equa-tions, R-squared, and sum of squares explained by each variable are given inTable 13. These statistical results are given for comparative purposes, sincethe R2 for regression equations suggests that there still exists significantunexplained variation in the biomass occurring on the study plots.
Economic Costs
Two nomograms relating travel distance and application rate to the costsper acre of applying peat material to reclamation sites are given in Figure 13.These relationships based on data obtained from the experimental plots at theOccidental reclamation site are shown in Figure 13a. Data from a reclamationsite at the Gardinier mine near Fort Meade, Florida, are used to construct thenomogram in Figure 13b.
The differences in costs reflect different conditions and different methodsof transporting the material from the donor swamps to the reclamation site. Atthe Occidental sites, Cat 627 scrapper pans were used to transport the material,while at the Gardinier site, lo-yard dump trucks were used. Conditions at theOccidental site were much different than those at Gardinier. Much of the haulroad at Occidental was over newly recontoured land, and due to the weight of thepans, the condition of the road deteriorated rapidly. An additional piece ofequipment (motor grader) was necessary to maintain the condition of the haulroad. The road conditions did not seem to affect the round trip travel timesignificantly, however, since travel times were almost identical when the dif-ferences in distance were considered.

42
43

44

45
Generally, the Occidental trials were done as follows: The peat materialwas obtained from a swamp after the vegetative cover had been removed by a CatD-8 dozer. Groundwater levels were lowered prior to the work progressing; how-ever, there were still saturated soils within the swamp. The material in theswamp could not be removed by the Cat 627 pans alone and the help of a D-8 dozerwas required. Once loaded, travel time over the 4.8 km (3-mile) round trip wasabout 25 minutes. Spreading of material was accomplished directly with the pansand was finished using a small Komatsu dozer.
The trials at Gardinier were done as follows: The peat material was dugfrom the donor swamp using a 30B dragline and stockpiled whenever a dump truckwas not available for loading, otherwise the material was placed directly intothe dump truck. The travel time over the 3.6 km (2.25-mile) round trip wasabout 20 minutes. The material was dumped along the edges of the wetland areaand pushed into the wetland by dozers. The conditions within the wetlands werequite wet, causing spreading costs to be somewhat higher than might be expectedwith drier conditions.
The cost breakdown for transporting and spreading the material to bothsites is given in Figure 14. Details of calculations are given as notes toFigure 14. Costs are calculated on a cubic-yard basis and do not reflect thedifferences in round-trip travel distances. The bulk of the costs for trans-porting material at the Occidental site was for the Cat 627 pans (costing nearly3 times what a dump truck costs while delivering only about 39% more materialper trip). Spreading costs at the Gardinier site were over twice those at theOccidental site reflecting the difficulty in spreading material in very lowareas with unstable soils due to standing water. At the Occidental site, enoughdrawdown of water levels had occurred so as to minimize effect of unstable soilsin the application process.

46

Notes to Figure 13 and Figure 14.
47
1. Occidental Experimental Sites.
Total Cost, $10,484.00Material Moved, 1148.8 yd3 (878.4 m3)Round Trip Travel Distance, 3 miles (4.8 km)Area of Application, 0.986 acres (.4 ha)
Four Cat 627 scrapper pans were used to dig and transport material. A D-6dozer was required to push pans through the donor wetland, and a 16 G motorgrader was required for continual maintenance of about half of the haulroad. A Komatsu dozer was used to spread the material on the sites.
The calculations for Figure 13a are as follows:
(1148.8 yd3 x 27 ft3/yd3)/(43560 ft*/acre) = 0.712 acre ft applied
= 8.54 acre inches applied.
($10,484)/(8.54 acre in x 3 mi) = $408.98/acre.in*mi.
In Figure 14 the 627 scrapper pans, D-8 dozer and motor grader were chargedto digging and transport, while the Komatsu dozer was charged to spreading.
2. Gardinier Site.
Total Cost, $13,406.50Material Moved, 3381 CU yd (2585.1 m3)Round Trip Travel Distance, 2.25 miles (3.6 km)Area of Application, 6.1 acres (2.5 ha)
Four 10-yard dump trucks were used to transport material. A 30B draglineand 966 payloader were used to dig and load material. D-6, D-5, and D-3dozers were used to spread material.
The calculations for Figure 13b are as follows:
(3381 yd3 x 27 ft3/yd3)/(43560 ft2/acre) = 2.1 acre ft applied
= 25.15 acre inces applied.
($13,406.50)/(25.15 acre in x 2.25 mi) = $236.94/acreain*mi.
In Figure 14 the dump trucks, dragline, and payloader were charged todigging and transport, while the 3 dozers were charged to spreading.

49
DISCUSSION
The lower than anticipated water levels over the experimental sites haveovershadowed the results of this test of peat "inoculation" as a means of for-ested wetland re-creation. Undoubtedly, the lower water levels and the factthat the sites were dry for long periods of the year affected the germination,survival, and growth rates of the plant species present as propagules and seeds.While no woody species were seen to germinate on the experimental sites, thesites were quite rapidly colonized by herbaceous wetland species. The prepon-derance of wetland species and their contribution to total biomass on each ofthe experimental sites, especially when compared with the control site where nopeat was applied, is strong evidence that this method warrants serious consider-ation as a method of wetland re-creation.
Biomass at the end of the growing season on the experimental sites whencompared to the control was impressive. Total biomass on two of the sites wasnearly 5 times the biomass on the control. Wetland species biomass was non-existent on the control while the mean standing crop of wetland species wasgreater than 200 g dry wt./m2 for the
26 experimental sites. Two of the exper-
imental sites had over 300 g dry wt./m of wetland species biomass at the endof the growing season (sites 8 and 9).
The survival and growth rates of tree seedlings planted in peat are encour-aging. Of the three species planted, bald cypress (Taxodium distichum) had thehighest survival rate (when those damaged by grazing were excluded). The bestgrowth rates were exhibited by sweetgum (Liquidambar styraciflua), althoughsurvival rates were not as high as Taxodium. The survival of swamp blackgumtupelo (Nyssa biflora) was lower, but growth rates of those that survived wereexcellent.
The lack of a sufficient hydroperiod undoubtedly affected the overallresults of the project, yet the strong relationships between biotic factorswithin wetland systems and hydroperiod are reinforced. Generally the amount andtypes (upland, transitional, and submerged species) of plants that survived andgrew on the experimental sites were controlled by the hydroperiod. It cannot bestressed enough how important hydroperiod is to developing and maintainingwetland ecological systems.
The amount of peat applied and method of application seems to have someaffect on the survival and growth of wetland species and overall communitystructure. The relationship is not as clear as one would like, when the effectof decreased hydroperiod due to higher elevations is taken into account. Gener-ally, as the thickness of peat increases, survival and growth of submerged andtransitional species increases while upland species show a marked decline ingrowth and survival. Highest wetland biomass at the end of the growing seasonwas on site 8 where peat thickness averaged about 16 cm (6 inches). Average

50
biomass per experimental site is higher on those sites where peat was spreaduniformly, yet greatest diversity is achieved where there is greater variationin topographic relief created by uneven application of peat in strips.
The quality of peat strongly influences the quality of wetland achievedafter inoculation.dug.
Of importance is the area and depth from which the peat isThe first material removed from the donor swamp was dug from the edge
where the material resembled the sandier soils of the surrounding pine flatwoodscommunity. Germination of wetland species on this material was not nearly asprevalent as with material that was obtained from more interior locations. Manystudies in a variety of ecological systems (for example see Harper, 1977) haveconfirmed that viable seeds drop off rapidly with increasing soil depth. As aconsequence it is recommended that material should be taken from the top 1 footor so of the soil column within the donor wetland.
While it is impossible to tell in only one year if this method of wetlandre-creation will establish sufficient numbers of wetland tree species to meetcurrent reclamation rules, these tests do show that a herbaceous cover ofwetland species can be established.woody species,
Even without the successful germination ofthe inoculating method might be used in conjunction with direct
planting of wetland tree seedlings where forested wetlands are needed. In thisway, rapid colonization by wetland herbaceous species is insured to helpestablish some wetland function from the outset, rather than waiting years forsuch establishment and the resulting functional equivalency. A second benefitof the inoculation technique used in conjunction with direct planting may be theestablishment of a diverse wetland capable of competing with cattail (Typhaspp.) and thus preventing the monospecific strands of cattail that sometimesdevelop in wetland reclamation areas.
There is no question that of the two techniques of transporting the peatmaterial analyzed in this study, the use of draglines to dig and dump trucks totransport the peat is far more cost effective than using scrapper pans. Thecosts of digging and transporting peat using a dragline and dump trucks were$1.33/yd3 (2.25 miles round trip distance) as compared to $8.01 for diggingand transporting the material using scrapper pans (3.0 round trip miles). Whenthe costs of spreading are included, the north Florida trial costs were $9.13per yd3 while the costs at the central Florida trial were $3.97 per yd3.The differences in spreading costs between the two trials can be attributed tothe differences in site conditions. The central Florida site was lower andwetter than the north Florida site, and required extra effort for spreading.
In summary, the following points can be made:
1. Proper hydroperiod is one of the most critical parameters thatmust be controlled when reconstructing wetland systems.
2. Herbaceous wetland species are easily established through inocu-lation or mulching with wetland peats, although it has yet to beestablished if woody species germination will be a success.
3. It is possible to develop a high quality herbaceous wetland with-in one (1) growing season using wetland peat mulching that hasgreater total biomass, far greater wetland biomass, and greater

51
species diversity than is possible on sites with no peat inocula-tion.
4. A high degree of variation in elevation within wetland systemtends to increase diversity of plant species. With hummocks andlow areas present within the wetland, more micro-environments arepresent that are colonized by a greater variety of species toler-ant to a variety of hydrologic conditions.
5. The costs of wetland peat mulching can vary considerably depend-ing on the equipment and techniques used but are competitive withother techniques such as purchase and direct planting of wetlandspecies.

53
LITERATURE CITED
Brown, S. L. 1978. A Comparison of Cypress Ecosystems in the Landscape ofFlorida. Ph.D. Dissertation, University of Florida, Gainesville.
Brown, M. T. and E. M. Starnes. 1983. A wetlands study of Seminole County:identification, evaluation, and preparation of development standards andguidelines. Technical Report 41, Center for Wetlands, University ofFlorida, Gainesville.
Godfrey, R. K. and J. W. Wooten. 1979. Aquatic and Wetland plants of South-eastern United States. University of Georgia Press. Athens, Georgia.
Harper, J. L. 1977. Population Biology of Plants. Academic Press. New York.
Monk, C. D. and T. W. Brown 1965. Ecological considerations of Cypress Heads inNorth Central Florida. American Midland Naturalist 74(1) p. 126-140.
Shannon, C. E., and W. Weaver. 1949. The mathematical theory of communication.University of Illinois Press, Urbana.
Steel, R. G. D., and J. H. Torrie. 1980. Principles and procedures of statis-tics: a biometrical approach, 2nd ed. McGraw-Hill, New York.
Wharton, C. H., H. T. Odum, K. Ewel, M. Duever, A. Lugo, R. Boyt, J. Bartholo-mew, E. DeBellevue, S. Brown, M. Brown, and L. Duever. 1977. ForestedWetlands of Florida- Their Management and Use. Center for Wetlands,University of Florida, Gainesville.

55
APPENDIX ASummary Data for Experimental Sites

56

57

58
59

60

61

62
63

64

65

66

67

68

69

70

71

72

73

74

75

76