students with disabilities in the p-16 framework outcomes and improvement strategies scdn, 12/07/07,...
TRANSCRIPT

Students with Disabilities in Students with Disabilities in the P-16 Frameworkthe P-16 Framework
Outcomes and Improvement Strategies
SCDN, 12/07/07, DVJ

“Facing today’s educational
challenges means improving
critical systems and structures that
support achievement from the
earliest years though college
completion.”
Source: Commissioner Mills Report to the Board of Regents, October 2006 SCDN, 12/07/07, DVJ

GOALS:
1. Close the great divide in achievement along lines of income, race and ethnicity, language and disability.
2. Keep up with growing demands for still more knowledge and skill in the face of increasing competition in a changing global economy.
Source: Commissioner Mills Report to the Board of Regents, October 2006 SCDN, 12/07/07, DVJ

Results forResults forStudents with Students with
DisabilitiesDisabilities
Source: Report to the Board of Regents, June 2007 SCDN, 12/07/07, DVJ

We’re Making Progress
Achievement is up in Grades 3-8 in English Language Arts and Mathematics
Few students are educated in Separate Settings
More take and pass Regents exams every year
More graduate every year
More earn Regents diplomas
More attend college than a decade agoSCDN, 12/07/07, DVJ

But Achievement and Graduation Rates Remain Far Too Low
Black students are disproportionately classified.
Too few students with disabilities are in general education settings in the Big Five Cities.
Achievement in Grades 3-8 is a fraction of what it should be.
Successful outcomes (graduation) are too low.
Too many students are being lost.
SCDN, 12/07/07, DVJ

Final: April 2007
Classification Rate increased slightlybut has been fairly stable for the past few years.
*Revised methodology
SCDN, 12/07/07, DVJ

Source: 2005-06 BEDS Data and December 1, 2005 PD1/4, Final: April 2007
All minorities are over represented in special education except Asians, who are significantly underrepresented.
SCDN, 12/07/07, DVJ

Final: June 2007
Compared to rest of State, special education services in Big Five Cities are much more often provided in separate classes & separate settings
SCDN, 12/07/07, DVJ

2006 & 2007 English Language Arts (ELA): Percentages of Students with Disabilities at
Levels 3 & 4• Students with disabilities meeting the ELA learning standards increased at
every grade, even with the increase in ELL students with disabilities tested.
• Overall, 1 in 5 students with disabilities performs at grade level.
• Gap: Compare the 22.8% average for students with disabilities across grades 3-8 with that for all students in grades 3-8 at 63.4%.
SCDN, 12/07/07, DVJ

2006 and 2007 English Language Arts (ELA)Students with Disabilities English Language
LearnersPercentages at Levels 3 & 4
13
.1%
10
.3%
9.6
%
4.1
%
3.2
%
1.1
%
6.5
%14
.1%
11
.0%
9.8
%
5.0
%
3.6
%
2.5
%
8.4
%
Grade 3 Grade 4 Grade 5 Grade 6 Grade 7 Grade 8 Grades 3-8
2006 ELL SWD (n=12,482) 2007 ELL SWD (n=18,952)
• Students with disabilities (SWD) who are English Language Learners (ELL) meeting the ELA learning standards increased at every grade, but the increases are very low.
• Overall, 1 in 12 students with disabilities who is an English Language Learner performs at grade level.
• Gap: Students with disabilities in grades 3-8 who were not English Language Learners were 3 times as likely to meet the standards than students with disabilities who are English Language Learners.
SCDN, 12/07/07, DVJ

2006 & 2007 English Language Arts (ELA): Percentages of Students with Disabilities at Level
1• In every grade, fewer students with disabilities showed serious academic
problems.
• Gap: Compare the averages across grades 3-8 for students with disabilities at 25.1% with that for all students in grades 3-8 at 6.1%.
SCDN, 12/07/07, DVJ

• Except in the Large City Districts, more students with disabilities met the standards in 2007.
• Gap: Variations among need/resource categories were substantial.
2006 & 2007 English Language Arts (ELA) by Need/Resource Categories:
Percentages of Students with Disabilities at Levels 3 & 4
SCDN, 12/07/07, DVJ

• The percentage of students with disabilities in serious academic difficulties decreased in every category.
• Gap: Students in Large City Districts were 4 times as likely as those in Low Need Districts to score at Level 1.
2006 & 2007 English Language Arts (ELA) by Need/Resource Categories:
Percentages of Students with Disabilities at Level 1
SCDN, 12/07/07, DVJ

2006 & 2007 Mathematics:Percentages of Students with Disabilities at Levels 3 & 4• Performance of students with disabilities meeting the Mathematics
Standards increased at every grade in 2007.
• Overall, 1 out of 3 students with disabilities performs at grade level.
• Gap: Compare the 37.2% average for students with disabilities across grades 3-8 with that for all grade 3-8 at 72.7%.
SCDN, 12/07/07, DVJ

2006 & 2007 Mathematics:Percentages of Students with Disabilities at
Level 1•In every grade, fewer students with disabilities showed serious academic problems.
•Gap: Compare the average across grades 3-8 for students with disabilities at 28.2% with that for all students in grades 3-8 at 7.5%
SCDN, 12/07/07, DVJ

2006 & 2007 Mathematics by Need/Resource Categories:Percentages of Students with Disabilities at Levels 3 & 4• Students with Disabilities in Low Need Districts were 3 times as likely as
those in Large City Districts to meet the standards in 2007.
• Gap: Variations among need/resource categories were substantial.
SCDN, 12/07/07, DVJ

• The percentage of students with disabilities in serious academic difficulties decreased in every category.
• Gap: Students with Disabilities in Large City Districts were about 4 times times as likely as those in Low Need Districts to score at Level 1.
2006 & 2007 Mathematics by Need/Resource Categories: Percentages of Students with Disabilities at Level 1
SCDN, 12/07/07, DVJ

9,7678,424
7,2268,305
5,6756,790
2,832
4,9694,154
2,499
13,07912,144
9,68011,194
8,60610,461
4,175
7,545
9,514
3,414
20,08118,949
16,309
14,101
17,321
15,36613,518
12,607
5,6474,419
1997 1998 1999 2000 2001 2002 2003 2004 2005 2006
Number with Score of 65-100Number with Score of 55-100Number Tested
• Since 1997, there has been more than 354% increase in the number of students with disabilities tested.
• Of the students tested in 2006, 65% achieved a score between 55-100.
Regents English Examination and Students with Disabilities
Public Schools-Including Charter Schools, Final April 2007 SCDN, 12/07/07, DVJ

• Since 1997, there has been a 323% increase in the number of students with disabilities tested.
• Of the students tested in 2006, 70% achieved a score between 55-100.
5,7325,736
12,28410,894
3,162
10,068
6,0394,8714,028
2,675
17,127
15,000
8,267 7,709
13,663
4,867
8,1516,773
4,9903,421
18,468
24,48322,129
16,82619,015
13,016
17,074
13,304
5,7768,327
1997 1998 1999 2000 2001 2002 2003 2004 2005 2006Number with Score of 65-100Number with Score of 55-100Number Tested
*Beginning in 1999, students take either of the two math examinations. Sequential Mathematics Course I examination ended in 2002.
Regents Sequential Mathematics Course Iand Math A Examinations and Students with Disabilities
Public Schools-Including Charter Schools, Final April 2007 SCDN, 12/07/07, DVJ

Regents Diplomas Earned by Students with Disabilities
526
623
774
1,11
5
1,32
9
1,83
9
2,25
7
2,86
5
864
4,67
3 5,36
6
Total State
1995-96 1996-97 1997-98 1998-99 1999-00 2000-01 2001-02 2002-032003-04 2004-05 2005-06
Public Schools-Including Charter Schools
Students graduating with Regents diplomas in 2004-05 were required to pass five Regents examinations compared to eight being required in previous years.
• Since higher standards were adopted in 1996, more than 10 times as many students with disabilities are earning Regents diplomas.
SCDN, 12/07/07, DVJ

Student Group
CohortEnrollmen
t
Regents/Local
Diploma
IEP Diploma & Other
Still Enrolled
Transfer to GED
Dropout
2001 Total Cohort After 4 Years
All Students 214,494 64.2% 1.8% 18.4% 4.8% 10.9%
Gen.Ed. Students
187,792 68.0% 0.0% 17.7% 4.5% 9.7%
Students with
Disabilities
26,702 37.3% 14.4% 22.8% 6.6% 18.9%
2001 Total Cohort After 5 Years
All Students 212,135 72.3% 2.4% 5.1% 1.4% 18.9%
Gen. Ed. Students
185,854 76.4% 0.1% 4.7% 1.2% 17.5%
Students with
Disabilities
26,281 42.8% 18.8% 7.3% 2.4% 28.6%
2002 Total Cohort After 4 Years
All Students 216,910 66.7% 2.0% 15.8% 1.4% 14.2%
Gen. Ed. Students
189,457 70.9% 0.1% 14.7% 1.3% 13.0%
Students with
Disabilities
27,453 37.5% 14.8% 23.1% 2.6% 21.9%
High School Outcomes for 2001 and 2002 Total Cohorts
Final: June 2007SCDN, 12/07/07, DVJ

Outcomes for 2001 Total Cohort of Students with Disabilities After 5 Years by Need/Resource Capacity
Total State Includes Charter Schools, Final- April 2007
• More students in the Big Five Cities dropped out than graduated.
• Gap: There are substantial variations in outcomes by need/resource capacity of school districts.
SCDN, 12/07/07, DVJ

Dropping Out Is Not A Sudden Decision And Can Be Made As Early As 6th Grade
Observable Risk Factors Predicting Drop Outs
Problem behaviors coupled with academic difficulties or prior academic failures
Repeated exclusion from class for disciplinary reasons
High absenteeism and being held back
Feelings of isolation and alienation from school environment
Bost, L.W. “Building Effective Dropout Prevention Programs- Some Practical Strategies from Research and Practice,” 2007
SCDN, 12/07/07, DVJ

Two Major Types of Drop Out Risk Factors
Academic Performance
Educational Engagement
SCDN, 12/07/07, DVJ

Effective Dropout Prevention Practices
Use a whole-school approach
Establish an early warning system to collect data on the predictive factors and be ready to intervene
Intervene often and early with support for reading, math and prosocial behavior, especially at transition points
Engage parents in setting high expectations for students’ post-school transitions
Create safe & supportive learning environments in school
Help students build positive relationships with teachers and peers; assist them with resolving personal problems
SCDN, 12/07/07, DVJ

Post School Status of Special Education Students
At Interview, One Year After June 2006 School Exit
28%36% 38%
37%13% 13%
26%
21% 11%
0%
10%
20%
30%
40%
50%
60%
70%
80%
90%
100%
Regents or LocalDiploma, including
GED
IEP Diploma orCertificate
Dropped Out
Postsecondary Education or Training Only, Not Employed
Both Employed and Postsecondary Education or Training
Competitively Employed Only
91%
62% 70%
Post-School Outcome Interviews, 2007 SCDN, 12/07/07, DVJ

What Makes a Difference in Successful Post-School Transitions?
What Makes a Difference in Successful Post-School Transitions?
Transition Planning, K-12.
Career Preparation, especially Paid or Unpaid Work Experiences in the Community.
Safe, Supportive Educational Environment.
Integrated Learning Environments.
Attainment of a Standards Based Diploma.
Collaboration among Student, Parents, School and Community.
New York State Education Department, Office of Vocational and Educational Services for Individuals with Disabilities, LPSI Study
SCDN, 12/07/07, DVJ
Strategies for Strategies for Improving Student Improving Student
Performance in the P-Performance in the P-16 Initiative16 Initiative
SCDN, 12/07/07, DVJ

The Regents & the State Education Department are
Targeting help to schools that need it
Addressing literacy, specifically reading
Addressing behavioral issues
Identifying and promoting effective practices
Identifying and promoting effective delivery of special education services for students appropriate for special education services
Reducing disproportionality
SCDN, 12/07/07, DVJ
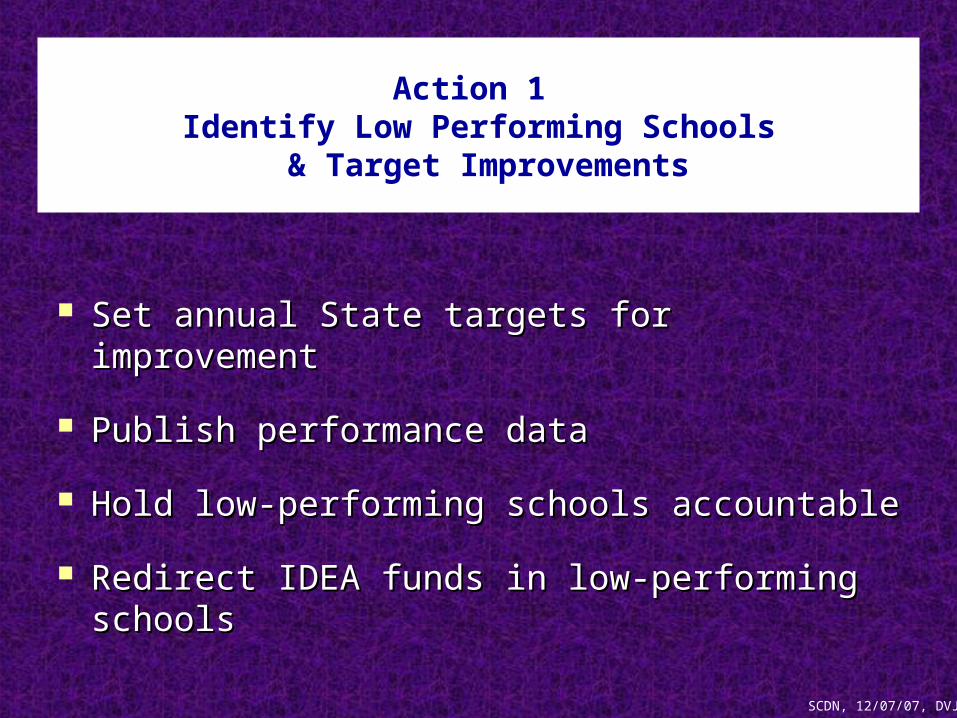
Action 1 Identify Low Performing Schools
& Target Improvements
Set annual State targets for improvementSet annual State targets for improvement
Publish performance data Publish performance data
Hold low-performing schools accountableHold low-performing schools accountable
Redirect IDEA funds in low-performing Redirect IDEA funds in low-performing schoolsschools
SCDN, 12/07/07, DVJ
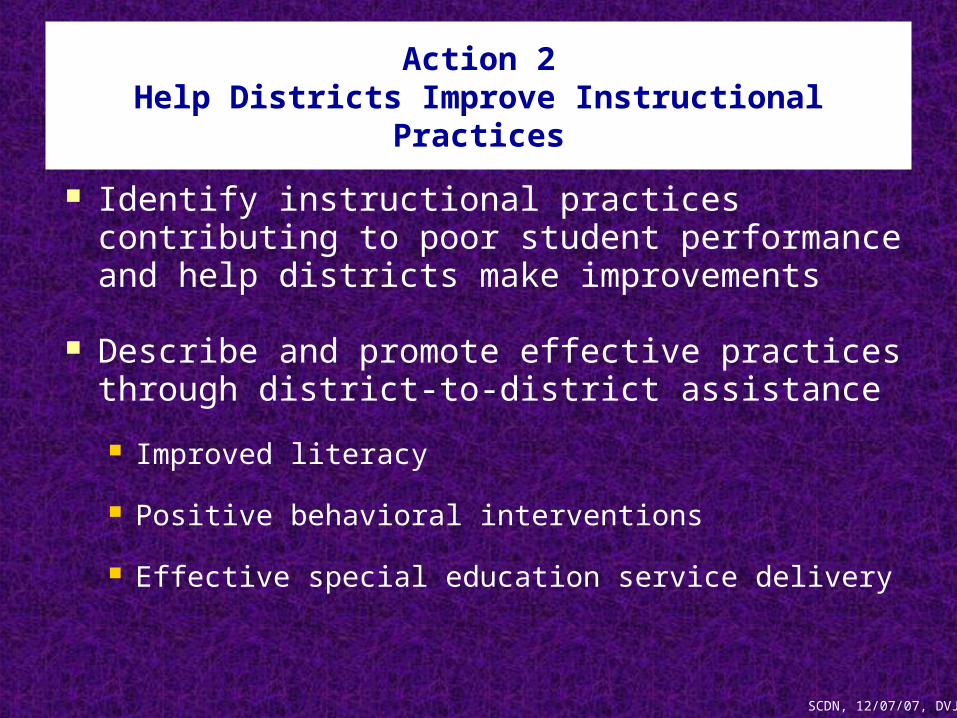
Action 2Help Districts Improve Instructional Practices
Identify instructional practices contributing to poor student performance and help districts make improvements
Describe and promote effective practices through district-to-district assistance
Improved literacy
Positive behavioral interventions
Effective special education service delivery
SCDN, 12/07/07, DVJ

Contracts for Excellence: Targets
Predominantly benefit students with greatest educational needs English language learners & limited English
proficiency Students in poverty Students with disabilities
Schools identified as requiring academic progress, corrective action or restructuring with emphasis on the most serious academic problems
For evidence-based practices that facilitate student attainment of learning standards
SCDN, 12/07/07, DVJ

dedicated block(s) of time created for instruction in content areas that facilitate student attainment of State learning standards;
research-based core instructional program must be used during such daily dedicated block(s) of instructional time;
a response-to-intervention program; and/or
individualized intensive intervention shall be provided.
Contracts for Excellence Require Dedicated Instructional Time, such as
SCDN, 12/07/07, DVJ

Action 3Align VESID Technical Assistance Resources
Direct technical assistance (TA) resources to address school improvements in: Literacy Behavioral supports Quality delivery of special education services
Improve achievement and reduce disproportionate representation of minority students by: Preventing inappropriate referrals Increasing declassification rates
Expand availability and capacity of TA centers to promote training and implementation of Positive Behavior Interventions and Supports (PBIS) in the Large 4 and BOCES
SCDN, 12/07/07, DVJ

Action 4Increase Positive Post School Outcomes
Increase the number of students with disabilities transitioning directly from high schools to: vocational rehabilitation training
programs employment college
SCDN, 12/07/07, DVJ

Policy Context Policy Context for Assessment,for Assessment, Curriculum and Curriculum and
InstructionInstruction
SCDN, 12/07/07, DVJ

Special Education 101
Access to general education in the least restrictive environment
Eligibility for special education only if poor performance due to disability is not due to poor instruction
Alternative and Modified Achievement Assessments align to core curriculum
Educational benefit
State Performance Plan
Purpose of IDEA is post-school transition

All IEPs developed on or after January 1, 2009 must be on a form prescribed by the Commissioner
Effective January 1, 2009, all Prior Notices must be on a form prescribed by the Commissioner
Effective January 1, 2009, all Meeting Notices must be on a form prescribed by the Commissioner
Mandated Forms
SCDN, 12/07/07, DVJ
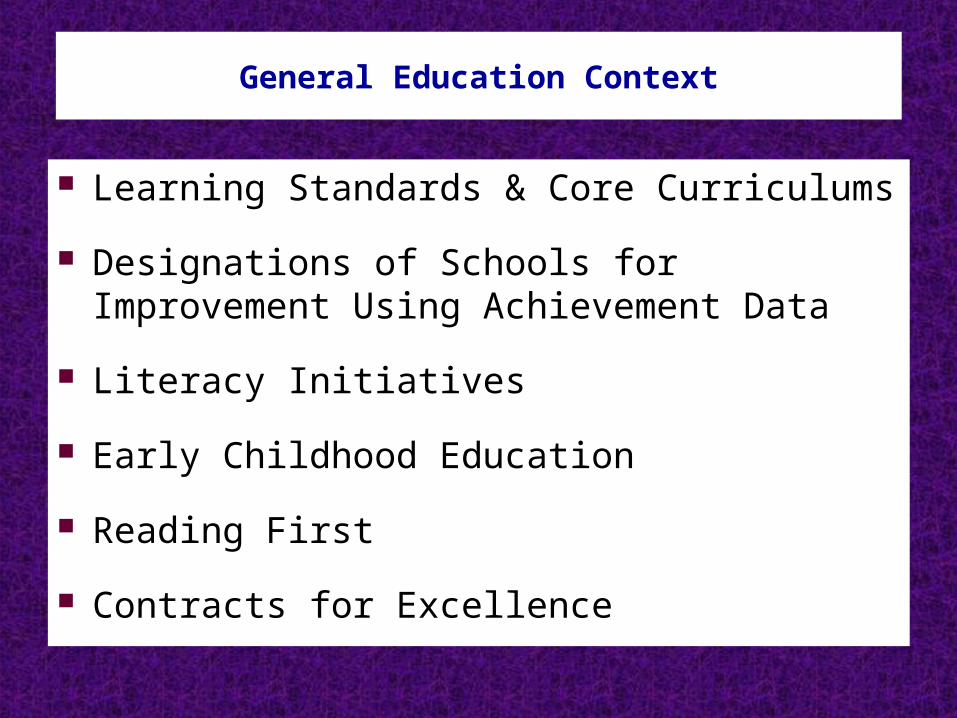
General Education Context
Learning Standards & Core Curriculums
Designations of Schools for Improvement Using Achievement Data
Literacy Initiatives
Early Childhood Education
Reading First
Contracts for Excellence

Response to Intervention Policy Framework Intertwines General and Special Education
RtI minimum components, §100.2(ii)
RtI and school wide screening, §117.3
RtI as a “Contracts for Excellence” program
Boards of education pre-referral responsibilities, §200.2(b)(7)
RtI and learning disabilities, §200.4(j)

RtI Minimum Components, §100.2(ii)
Appropriate instruction in the general education class by qualified personnel
Screenings identify students not making academic progress at expected rates
Instruction matched to student need with increasingly intensive levels of targeted intervention for those not making satisfactory progress
Repeated assessments determine if interventions result in student making progress toward standards
Information about student’s response to intervention used to make educational decisions

Parents Informed about RtI
Written notification about the:
amount and nature of student performance data to be collected and the general education services to be provided
strategies for increasing the student’s rate of learning; and
parents’ right to request an evaluation for special education

Each District Designs Its RtI Model
Each district must select and define the Each district must select and define the specific structure and components of its RtI specific structure and components of its RtI program, including, but not limited to: program, including, but not limited to:
criteria for determining levels of intervention to provide to students,
types of interventions,
amount and nature of student performance data to be collected and
manner and frequency for progress monitoring

Fidelity of Implementation of RtI
The district must take appropriate steps to ensure that
staff have the knowledge and skills necessary to implement a response to intervention program, and the
program is implemented consistent with the specific structure and components of the model.

School-wide Screening for Students with Low Test Scores, §117.2 and §117.3
shall be monitored periodically through screenings and on-going assessments of the student’s reading and mathematic abilities and skills; and
if making sub-standard progress, instruction shall be tailored to meet individual needs with increasingly intensive levels of targeted intervention and instruction.
Parents shall receive written notification … including their right to a referral for special education services.

Board of Education Pre-referral Responsibilities, §200.2(b)(7)
Written policy shall establish administrative practices and procedures for implementing schoolwide approaches, which may include a response to intervention process and prereferral interventions in order to remediate a student’s performance prior to referral for special education

Determining Learning Disabilities for Special Education, §200.4(j)
If you use the RtI process, you still must conduct a complete individual evaluation
May not rely on any single procedure
Must include observation of student’s academic performance in the regular classroom
Determine that learning problems are NOT the result of lack of appropriate instruction in math and reading
SCDN, 12/07/07, DVJ

Key Actions for 2007-08
Direct TA resources to IDEA-identified districts
Contracts for Excellence prioritize students in greatest need, including students with disabilities
Focus TA on improving core instructional practices
Identify successful schools
Establish statewide Response to Intervention (RtI) Technical Assistance Center (TAC)
Provide grants to districts to implement RtI programs
Explore the development of Career and Technology Education (CTE) program options for students with disabilities to decrease dropout rates
SCDN, 12/07/07, DVJ

School Leadership Roles
Assure key personnel are informed about changing public policy reflected in law, regulation, guidance; know learning standards and understand the implications for their work.
Provide professional development in evidence-based instructional practices.
Use whole school approaches.
Use data to plan for individual student and programmatic improvements.
Lead instruction and change processes.SCDN, 12/07/07, DVJ
References & Links
P-16 Education: A Plan for Action http://usny.nysed.gov/summit/p-16ed.pdf
Report to the Board of Regents on Closing the Achievement Gap: Strategies for Students with Disabilities Implemented in 2006-07 http://www.regents.nysed.gov/2007Meetings/June2007/0607emscvesidd4.doc
Results for Students and Individuals with Disabilities in 2005-06 and 2006-07 http://www.regents.nysed.gov/2007Meetings/June2007/0607brd2.doc
http://www.oms.nysed.gov/press/documents/SpecialEdRepCardSlides-Final2007.ppt
State Performance Plan and Annual Performance Report http://www.vesid.nysed.gov/specialed/spp/home.html
Special Education Policy Guidance, Laws and Regulations http://www.vesid.nysed.gov/specialed/timely.htm
SCDN, 12/07/07, DVJ