students with disabilities at dawson college - adaptech research
TRANSCRIPT
La présente recherche a été subventionnée par le ministère de l'Éducation dans le cadre du Programme d'aide à la recherche surl'enseignement et l'apprentissage (PAREA). Le contenu du présent rapport n'engage que la responsabilité des auteures.
Final Report Presented to PAREARapport final présenté à PAREASpring / Printemps 2003
Authors / AuteuresShirley Jorgensen, M.B.A.Catherine Fichten, Ph.D.Alice Havel, Ph.D.Daniel Lamb, B.A.Crystal JamesMaria Barile, M.S.W.
Students With Disabilities At Dawson College: Success And OutcomesÉtudiants ayant des handicaps au Collège Dawson : réussite et avenir
Adaptech Research Network - Dawson CollegeRéseau de Recherche Adaptech - Collège Dawson

This page intentionally left blank.
Students With Disabilities At Dawson College: Success And OutcomesÉtudiants ayant des handicaps au Collège Dawson : réussite et avenir
Adaptech Research Network - Dawson CollegeRéseau de Recherche Adaptech - Collège Dawson
Final Report Presented to PAREARapport final présenté à PAREAPrintemps / Spring 2003
Authors / AuteuresShirley Jorgensen, M.B.A.Catherine Fichten, Ph.D.Alice Havel, Ph.D.Daniel Lamb, B.A.Crystal JamesMaria Barile, M.S.W.
La présente recherche a été subventionnée par le ministère de l'Éducation dans le cadre du Programme d'aide à la recherche surl'enseignement et l'apprentissage (PAREA). Le contenu du présent rapport n'engage que la responsabilité des auteures.
Dépôt légal — Bibliothèque nationale du Québec, 2003Dépôt légal — Bibliothèque nationale du Canada, 2003
ISBN 1-55016-064-8
Table of Contents
ACKNOWLEDGEMENTS...........................................................................................................................................................6
EXECUTIVE SUMMARY............................................................................................................................................................7
ABSTRACT ....................................................................................................................................................................................7PREAMBLE ....................................................................................................................................................................................7CHARACTERISTICS OF THE SAMPLES ............................................................................................................................................7GRADUATION RATES ....................................................................................................................................................................8AVERAGE FIRST SEMESTER GRADES ............................................................................................................................................8COURSE PASS RATES ....................................................................................................................................................................9COURSE SUCCESS .........................................................................................................................................................................9SUMMARY...................................................................................................................................................................................10IMPLICATIONS.............................................................................................................................................................................10CONTACT INFORMATION.............................................................................................................................................................10
SOMMAIRE.................................................................................................................................................................................11
RÉSUMÉ ......................................................................................................................................................................................11PRÉAMBULE................................................................................................................................................................................11CARACTÉRISTIQUES DE L’ÉCHANTILLON ....................................................................................................................................12TAUX DE DIPLOMATION ..............................................................................................................................................................12MOYENNE DES NOTES DU PREMIER SEMESTRE ............................................................................................................................13TAUX DE RÉUSSITE DE COURS .....................................................................................................................................................13RÉUSSITE DE COURS....................................................................................................................................................................14SOMMAIRE..................................................................................................................................................................................14CONSÉQUENCES..........................................................................................................................................................................14INFORMATION POUR NOUS REJOINDRE ........................................................................................................................................15
INTRODUCTION........................................................................................................................................................................16
1.1 THE QUÉBEC CONTEXT...................................................................................................................................................171.2 FACTORS RELATED TO ACADEMIC SUCCESS...................................................................................................................181.3 GOALS AND HYPOTHESES FOR THE PRESENT INVESTIGATION.........................................................................................18
METHODOLOGY.......................................................................................................................................................................20
2.1 STUDENTS INCLUDED IN THE STUDY..............................................................................................................................202.2 PROCEDURE FOR CLASSIFYING STUDENTS .....................................................................................................................202.3 STUDENT CHARACTERISTICS ..........................................................................................................................................212.4 SUCCESS INDICATORS .....................................................................................................................................................222.5 METHOD OF ANALYSIS ...................................................................................................................................................24
RESULTS: STUDENT CHARACTERISTICS.........................................................................................................................25
3.1 NATURE OF STUDENTS’ DISABILITIES.............................................................................................................................253.2 DEMOGRAPHIC CHARACTERISTICS .................................................................................................................................263.3 ACADEMIC BACKGROUND – AVERAGE HIGH SCHOOL (SECONDARY V) SCORES ...........................................................273.4 ACADEMIC PROGRAM .....................................................................................................................................................283.5 COURSE LOAD ................................................................................................................................................................29
RESULTS: ACADEMIC SUCCESS INDICATORS................................................................................................................30
3.6 COURSE PASS RATES – FIRST SEMESTER........................................................................................................................303.7 AVERAGE GRADES IN THE FIRST SEMESTER (INCLUDES FAILURE GRADES OF ZERO).......................................................313.8 IMPACT OF FAILURE GRADES OF ZERO ON AVERAGE GRADES .......................................................................................343.9 IMPACT OF GENDER ON AVERAGE FIRST SEMESTER GRADES.........................................................................................353.10 COURSE SUCCESS RATES ................................................................................................................................................373.11 GRADUATION RATES ......................................................................................................................................................383.12 TIME TAKEN TO GRADUATE BY GENDER AND DISABILITY STATUS (PRE-UNIVERSITY)..................................................40
RESULTS: SUCCESS INDICATORS BY DISABILITY TYPE ............................................................................................41
3.13 AVERAGE GRADES BY DISABILITY TYPE ........................................................................................................................413.14 COURSE PASS RATES BY DISABILITY TYPE.....................................................................................................................423.15 COURSE SUCCESS BY DISABILITY TYPE..........................................................................................................................423.16 GRADUATION RATES ......................................................................................................................................................43
SUMMARY AND DISCUSSION ...............................................................................................................................................44
4.1 SUMMARY OF FINDINGS ON ACADEMIC OUTCOMES ......................................................................................................444.2 SUMMARY OF FINDINGS ON SAMPLE CHARACTERISTICS ...............................................................................................454.3 LIMITATIONS OF THE INVESTIGATION AND GENERALIZABILITY OF THE FINDINGS .......................................................464.4 WHY DO STUDENTS WITH DISABILITIES PERFORM SO WELL AT DAWSON COLLEGE? ..................................................484.5 CONCLUSIONS, RECOMMENDATIONS, AND IMPLICATIONS .............................................................................................49
REFERENCES.............................................................................................................................................................................50
APPENDICES ..............................................................................................................................................................................55
APPENDIX 1 MAXIMUM PERIOD OF OBSERVATION FOR COMMENCING COHORTS..................................................................55APPENDIX 2 AGE DISTRIBUTION OF FIRST-TIME CEGEP COMMENCING STUDENTS................................................................56APPENDIX 3 PHONE CALL SCRIPT. ..........................................................................................................................................57APPENDIX 4 BREAKDOWN OF SAMPLE BY SECTOR OF ENROLMENT......................................................................................58

6
Students With Disabilities At Dawson College: Success And Outcomes
AcknowledgementsWe would like to thank Dawson College and the funding agency, PAREA, for making this project possible. In addition, we wouldlike to thank Jennison Asuncion, Jocelyne Cote, Bruno Geslain, Don Lewis, and Diane Wong for their help with different aspectsof this research. We are also grateful to Raymond Tam for assistance with the visual presentation and electronic version of thisreport.
7
Executive Summary
Executive Summary - Students With Disabilities At Dawson College: Success And OutcomesFinal Report Presented to PAREA
Spring, 2003
Shirley Jorgensen, M.B.A., Catherine S. Fichten, Ph.D., Alice Havel, Ph.D.,Daniel Lamb, B.A., Crystal James, Maria Barile, M.S.W.
Adaptech Research Network - Dawson College, Montréal
Executive SummaryAbstract
In an archival study the academic outcomes of 653 Dawson College students with and 41,357 without disabilities were comparedover a 12 year period starting in 1990 and ending in 2002. Results indicate that students with both physical and learning disabilitieshad graduation rates that were virtually identical to those of non-disabled students, although students with disabilities tookapproximately one semester longer to graduate. When average grades and course pass rates were examined, students withdisabilities generally did at least as well, and in some cases significantly better than their non-disabled peers. The overall trend forgrades and course pass rates was for students with learning disabilities/attention deficit disorder (ADD) to have similar or slightlypoorer outcomes than the non-disabled sample, and for students with all other disabilities to have slightly superior outcomes.Males had poorer results than females with respect to all indicators. This was true for students both with and without disabilities.
Preamble
The academic outcomes of 653 students who made a request for disability related services at Dawson College (students withdisabilities) were compared to those of 41,357 students who did not make a request for services (non-disabled students).
Dawson College is a junior / community college (public cegep) located in downtown Montreal. It offers diplomas (DEC: Diplômed'études collégiales) in two year pre-university programs (pre-university sector – courses of study such as health science and socialscience) and three-year career programs (courses of study such as nursing and mechanical technology). It also offers preparatorysessions as well as continuing education courses.
To be included in the study, students (1) must have enrolled at Dawson College for the first time between the autumn session of1990 and the winter session of 2002, and (2) must have had no prior history of having studied at a cegep. Of the 722 disabilitiesrecorded for the 653 students (some students had more than one disability), 52.6% (380) were learning disabilities and/or attentiondeficit disorder (ADD) and 47.4% (342) were other disabilities such as visual, hearing, speech, orthopedic, psychiatric and medicalimpairments.
Four outcome measures were examined: graduation rates, average grades in the first semester, course pass rates (percent of coursestaken that were passed), and course success rates (percentage of students who passed 100% of the courses they undertook in thefirst semester).
Characteristics of The Samples
When students with and without disabilities were compared, it was found that a higher proportion of students with disabilities wereenrolled in pre-university programs (72.7% vs 60.8%) and a lower proportion in continuing education (8.3% vs 22.1%). Theproportion enrolled in careers programs was the same for both groups (11.3%). The remaining students from both groups wereenrolled in preparatory sessions. The difference in the proportions of students enrolled across sectors was statistically significant.The majority of students from both groups were enrolled in the pre-university social science program.
8
Students With Disabilities At Dawson College: Success And Outcomes
The group of students with disabilities were, on average, about a year younger (19.4 vs 20.5) and a greater proportion of them wereaged 19 or under (77.3% vs 72.2%) when they first entered Dawson College. This age difference is due primarily to the largerproportion of older non-disabled students registered in continuing education courses. The mean age for students both withand without disabilities in careers programs was 19.3 years. The mean for students with disabilities in pre-university programs was18.7 years while those for students with no disabilities it was 18.3 years.
Other differences include: (1) a larger proportion of the sample of students with disabilities was male, had English as their mothertongue, and were born in Canada or the USA than was the case for the non-disabled sample; (2) students with disabilities tended toenter Dawson College with lower Secondary V (high school leaving certificate) averages. These differences were statisticallysignificant.
Graduation Rates
Graduation rates were calculated for students enrolled full-time in diploma programs. The sample was finalized in May, at the endof the 2002 winter session. This allowed all students included in the sample at least two additional years beyond the minimum timerequired to complete their diplomas. Therefore, only students who commenced in two-year pre-university programs between 1990and 1998 or in three-year career programs between 1990 and 1997 were included in analyses of graduation rates. This resulted in asample of 316 students with various physical, sensory and learning disabilities and 18,747 students with no disabilities.
Two-year pre-university programs. Of the 269 students with all types of disabilities who commenced in two-year pre-universityprograms between 1990 and 1998, 55.0% had graduated (or were eligible to graduate) by the end of May 2002. During the sameperiod, 54.5% of the 16,053 non-disabled students had graduated or were eligible to do so. The difference was not significant.When the pre-university sample was divided into those with disabilities other than learning disabilities (including multipleimpairments) (N=123), and those with learning disabilities and/or ADD (N=146), the graduation rates were 54.5% and 55.5%,respectively. Again, the difference was not significant.
Three-year career programs. Similarly, of the 47 students with disabilities who commenced in three-year career programsbetween 1990 and 1997, 53.2% had graduated or were eligible to do so by the end of May 2002. The rate for the 2694 non-disabled students during the same period was 51.7%. The difference was not significant.
Time taken to graduate. As expected, students with disabilities took slightly longer to graduate than their non-disabled peers. Forthe 9 pre-university cohorts who commenced between 1990 and 1998, students with disabilities took, on average, 6.0 semesters tograduate. Non-disabled students took, on average, 5.2 semesters. For the 8 career program cohorts commencing between 1990 and1997, the time taken to graduate was 8.2 semesters for students with disabilities and 6.9 semesters for the non-disabled students.These differences, which could be attributed to the fact that students with disabilities, on average, took lighter course loads, werestatistically significant. Thus, there was approximately a one-semester difference for both two-year pre-university and three-yearcareer programs.
Average First Semester Grades
Two sets of analyses were carried out. Average first semester grades were calculated for all students including those in continuingeducation, for the total period between 1990 and 2002. This includes grades for students who commenced in the winter session. Toallow for comparisons of students enrolled in the same program, we also analyzed grades for the subgroup of students who wereenrolled in the Social Science program. This is the program where the majority of both samples of students were registered.Because course requirements for these students are the same, differences due to discrepancies in field of study should not influencethe results.
9
Executive Summary
All students. When the average first semester grades of the 632 students with disabilities were compared to those of the 40,262non-disabled students, there was no statistically significant difference between the two groups (66.3% vs 65.9%, respectively).
The first semester grade averages of males tended to be lower than that of females for both groups of students. When males withand without a disability were compared for all programs there was no significant difference (63.3% vs 63.2%, respectively). Therewas also no significant difference between females with and without a disability for all programs (69.4% vs 68.3%, respectively).However, when corrected for Secondary V averages, both males and females with disabilities performed significantly better thanexpected when compared to their male and female non-disabled counterparts.
When the average of the first semester grades of 347 students with a learning disability/ADD were compared to the average gradesof 285 students with all other disabilities, the average was significantly lower for those who had learning disabilities/ADD (63.7%vs 69.5%). When grades of students with learning disabilities/ADD were compared to grades of non-disabled students (63.7% vs65.9%), the difference was not significant.
Grades in Social Science. When grades in the Social Science program were examined, students with disabilities (N=269) hadsignificantly higher grade averages than their non-disabled peers (N=13,908), even when the Secondary V average was not takeninto consideration as a covariate (66.0% vs 62.3%).
Females with disabilities in Social Science had averages that were significantly higher than their non-disabled peers, whether ornot a correction was made for the Secondary V average (70.9% vs 65.6%). Males with disabilities also had significantly higheraverage grades compared to their non-disabled counterparts (62.7% vs 58.7%), and performed better than would have beenpredicted by their incoming average.
When grades of students with learning disabilities/ADD were compared to the average grades of non-disabled students in SocialScience (63.6% vs 62.3% respectively) the difference was not significant.
Course Pass Rates
All students. Of 3,385 grades for students with disabilities, 81.2% were passing grades. This compares to a pass rate of 80.5% forthe non-disabled group. The difference was not significant. The pass rate of students with learning disabilities (78.3%), however,was significantly lower than that of both non-disabled students (80.5%) as well as students with all other disabilities (85.1%).
Social Science. The difference in course pass rates in the Social Science program, however, show that students with disabilities, ingeneral, had a significantly higher pass rate than non-disabled students (80.5% vs 76.6%). The pass rate for students with learningdisabilities/ADD (77.4%) was not significantly different from the pass rate for non-disabled students, although it is significantlyworse that the pass rate for students with other disabilities (86.0%).
Course Success
The proportion of students enrolled in full-time diploma (DEC) programs who passed 100% of their first semester courses wasevaluated for all programs and Social Science.
All programs. There was no significant difference between students with and without disabilities (49.2% vs 49.4%, respectively).There was a significant difference for students with learning disabilities/ADD compared to the group with all other disabilities(43.4% vs 57.1%) as well as with the non-disabled group, with students with learning disabilities having lower course successrates.
Social Science. The course success rate for students with disabilities was significantly higher than that on non-disabled students(48.1% vs 41.4%). The success rate for students with learning disabilities/ADD (41.6%), however, was not significantly differentfrom that for non-disabled students (41.4%), although it was significantly worse than the rate for students with other disabilities(58.8%).
10
Students With Disabilities At Dawson College: Success And Outcomes
Summary
The findings indicate that students with disabilities at Dawson College had graduation outcomes that were virtually identical tothose of non-disabled students. The main difference was that students with disabilities took, on average, approximately onesemester longer to graduate. When average grades were examined, students with disabilities did at least as well as, and in somecases significantly better, than their non-disabled peers. When students with disabilities were divided into two groups, studentswith learning disabilities/ADD and students with all other disabilities, the overall trend was for students with learningdisabilities/ADD to have similar or slightly poorer academic outcomes than the non-disabled sample, and for students with allother disabilities to have slightly superior outcomes. Males had poorer results than females on all indicators. This was true for bothstudents with and without disabilities.
Implications
What do these findings mean for the cegep system and Québec society? Should students with disabilities be encouraged to attendpostsecondary education? Are funds spent on supporting them in college well spent? Absolutely!
Contact Information
For additional information and the full report, consult the Adaptech Research Network web site or contact one of the principalinvestigators.
Shirley Jorgensen, [email protected]
Catherine S. Fichten, [email protected]
Alice Havel, [email protected]
Adaptech Research NetworkDawson College3040 Sherbrooke St. WestMontréal, QuébecCanada H3Z 1A4
Tel: (514) 931-8731Fax: (514) 931-3567www.adaptech.org
11
Sommaire
Sommaire - Etudiants ayant des handicaps au Collège Dawson : réussite et avenirRapport final présenté à PAREA
Printemps 2003
Shirley Jorgensen, M.B.A., Catherine S. Fichten, Ph.D., Alice Havel, Ph.D.,Daniel Lamb, B.A., Crystal James, Maria Barile, M.S.W.
Réseau de Recherche Adaptech – Collège Dawson, Montréal
SommaireRésumé
Dans le cadre d’une étude d’archives, les résultats scolaires de 653 étudiants ayant des incapacités du Collège Dawson furentcomparés à ceux de 41 357 étudiants sans incapacités au cours d’une période de douze ans, soit de 1990 à 2002. Les résultatsindiquent que les étudiants ayant des incapacités physiques et des troubles d’apprentissage avaient sensiblement le même taux dediplomation que ceux sans incapacités. Cependant, les étudiants ayant des incapacités prenaient approximativement un semestre deplus pour obtenir leur diplôme. Lorsque furent comparés les moyennes des notes et les taux de réussite de cours, les étudiantsayant des incapacités réussissaient aussi bien que, et dans certains cas mieux que, les étudiants sans incapacités. La tendancegénérale en ce qui a trait aux notes et aux taux de réussite de cours indique que les étudiants ayant des troubles d’apprentissage/dedéficit d’attention avaient des taux de réussite semblables ou légèrement inférieurs à l’échantillon sans incapacités. Des résultatslégèrement supérieurs ont été notés pour les étudiants ayant tous autres genres d’incapacités. Les garçons obtenaient des résultatsinférieurs aux filles et ce, en ce qui a trait à tous les indicateurs, aussi bien pour les étudiants ayant des incapacités que ceux sansincapacités.
Préambule
Les résultats scolaires de 653 étudiants ayant fait une demande pour l’obtention de services pour étudiants handicapés au CollègeDawson (étudiants ayant des incapacités) ont été comparés à ceux de 41 357 étudiants n’ayant pas fait de demande de services(étudiants sans incapacités).
Le Collège Dawson est un collège préuniversitaire/communautaire (cégep public) situé au centre-ville de Montréal. Y sont offertsdes diplômes (DEC : diplôme d’études collégiales) dans le cadre de programmes préuniversitaires de deux ans (secteurpréuniversitaire – programmes d’études tels les Sciences de la nature et les Sciences humaines) et des programmes techniques detrois ans (programmes d’études tels les Soins infirmiers et Technique de génie mécanique). Des sessions d’accueil et des cours deformation continue sont également offerts.
Pour faire partie de l’étude, les étudiants (1) devaient s’être inscrits au Collège Dawson pour la première fois entre la sessiond’automne 1990 et la session d’hiver 2002 et (2) ne devaient pas avoir étudié au collégial auparavant. Des 722 incapacités notéespour les 653 étudiants (certains étudiants avaient plus d’une incapacité), 52,6% (380) étaient des troubles d’apprentissage et(ou) dedéficit d’attention et 47,4% (342) étaient d’autres genres d’incapacités telles des déficiences visuelles, auditives, de la parole,orthopédiques, psychiatriques et médicales.
Quatre facteurs furent étudiés : les taux de diplomation, la moyenne des notes du premier semestre, les taux de réussite de cours (lepourcentage de cours suivis réussis) et les taux de réussite (pourcentage d’étudiants qui réussissent 100% des cours suivis aupremier semestre).
12
Étudiants ayant des handicaps au Collège Dawson : réussite et avenir
Caractéristiques de l’échantillon
La comparaison des étudiants ayant des incapacités à ceux sans incapacités révèle qu’un pourcentage plus élevé d’étudiants ayantdes incapacités étaient inscrits à des programmes préuniversitaires (72,7% contre 60,8%) et un pourcentage moindre était inscrit àl’éducation continue (8,3% contre 22,1%). La proportion inscrite à des programmes techniques était la même pour les deuxgroupes (11,3%). Les autres étudiants des deux groupes étaient inscrits aux sessions d’accueil. La différence existant dans lesproportions d’étudiants inscrits aux divers secteurs était statistiquement significative. La majorité des étudiants des deux groupesétait inscrite au programme préuniversitaire de Sciences humaines.
Les étudiants ayant des incapacités étaient, en moyenne, un an plus jeune (19,4 contre 20,5) et une proportion plus importante avait19 ans ou moins (77,3% contre 72,2%) lorsqu’ils se sont inscrits pour la première fois au Collège Dawson. La différence d’âges’explique principalement par la proportion importante d’étudiants plus âgés sans incapacités inscrits à des cours à l’éducationcontinue. L’âge moyen des étudiants ayant des incapacités et sans incapacités inscrits à des programmes techniques était de 19,3ans. L’âge moyen des étudiants ayant des incapacités inscrits à des programmes préuniversitaires était de 18,7 ans tandis qu’il étaitde 18,3 ans pour les étudiants sans incapacités.
D’autres différences comprennent : (1) une plus grande proportion de l’échantillon ayant des incapacités était des garçons, avaitl’anglais comme langue maternelle et était née au Canada ou aux États-Unis; (2) les étudiants ayant des incapacités avaitgénéralement une moyenne de Secondaire V plus faible lorsqu’ils ont entrepris des études au Collège Dawson. Ces différencesétaient statistiquement significatives.
Taux de diplomation
Les taux de diplomation ont été calculés pour les étudiants inscrits à temps complet à des programmes d’études menant à desdiplômes. L’échantillon s’est arrêté en mai, soit à la fin de la session d’hiver 2002. Ceci a permis d’accorder à tous les étudiants aumoins deux années supplémentaires au-delà de la période minimale requise pour l’obtention d’un diplôme. Par conséquent,seulement les étudiants qui ont commencé un programme d’études préuniversitaires entre 1990 et 1998 ou un programmetechnique de trois ans entre 1990 et 1997 sont inclus dans les analyses de taux de diplomation. Ces paramètres ont permis decerner un échantillon de 316 étudiants ayant divers handicaps physiques, sensoriels ou troubles d’apprentissage et de 18 747étudiants sans incapacités.
Programmes préuniversitaires de deux ans. Des 269 étudiants ayant tous genres d’incapacités qui ont entrepris des études dansle cadre de programmes préuniversitaires de deux ans entre 1990 et 1998, 55,0% ont obtenu leur diplôme (ou étaient admissibles àl’obtention d’un diplôme) à la fin de mai 2002. Au cours de la même période, 54,5% des 16 053 étudiants sans incapacités ontobtenu leur diplôme ou y étaient admissibles. La différence n’était pas significative. Lorsque l’échantillon préuniversitaire a étédivisée entre ceux ayant des incapacités comprenant les incapacités multiples, mais excluant les troubles d’apprentissage(N=123),et ceux ayant des troubles d’apprentissage et(ou) de déficit d’attention (N=146), les taux de diplomation étaient de 54,5%et 55,5% respectivement. Encore une fois, la différence n’était pas significative.
Programmes techniques de trois ans. De même, des 47 étudiants ayant des incapacités qui ont entrepris des programmestechniques de trois ans entre 1990 et 1997, 53,2% avaient obtenu leur diplôme ou y étaient admissibles à la fin de mai 2002. Letaux était de 51,7% pour les 2694 étudiants sans incapacités pour la même période. La différence n’était pas significative.
Durée pour l’obtention d’un diplôme. Tel que l’on pouvait s’y attendre, les étudiants ayant des incapacités prennent un peu plusde temps que ceux sans incapacités pour l’obtention d’un diplôme. Pour les neuf cohortes préuniversitaires qui ont entrepris desétudes entre 1990 et 1998, les étudiants ayant des incapacités ont pris, en moyenne, 6,0 semestres pour obtenir un diplôme. Lesétudiants sans incapacités ont pris, en moyenne, 5,2 semestres. Pour les huit cohortes de programmes techniques qui ont entreprisdes études entre 1990 et 1997, il a fallu 8,2 semestres pour les étudiants ayant des incapacités et 6,9 semestres pour les étudiantssans incapacités pour l’obtention d’un diplôme. Ces différences, qui peuvent s’expliquer par le fait que les étudiants ayant desincapacités prennent généralement moins de cours, étaient statistiquement significatives. Conséquemment, il y avait une différenceapproximative d’un semestre pour les programmes préuniversitaires de deux ans et les programmes techniques de trois ans.

13
Sommaire
Moyenne des notes du premier semestre
Deux analyses distinctes ont été réalisées. La moyenne des notes du premier semestre a été calculée pour tous les étudiants ycompris les étudiants de l’éducation continue, pour la période totale de 1990 à 2002. Y étaient inclus les notes des étudiants qui ontcommencé à la session d’hiver. Afin de permettre la comparaison d’étudiants inscrits à un même programme, nous avonségalement analysé les notes des sous-groupes d’étudiants inscrits en Sciences humaines. En effet, la majorité des étudiants desdeux échantillons y sont inscrits. Les divergences existant dans les champs d’études ne devraient pas agir sur les résultats car lescours requis pour ces étudiants sont les mêmes.
Tous les étudiants. Lorsque la moyenne des notes du premier semestre des 632 étudiants ayant des incapacités fut comparée àcelle du groupe de 40 262 étudiants sans incapacités, aucune différence statistiquement significative entre les groupes fut relevée(66,3% contre 65,9% respectivement).
La moyenne des notes du premier semestre des garçons avait tendance à être plus faible que celle des filles et ce, pour les deuxgroupes d’étudiants. De plus, il n’y avait aucune différence significative (63,3% contre 63,2% respectivement) lorsque les garçonsayant des incapacités et sans incapacités furent comparés dans tous les programmes d’études. La comparaison des filles ayant desincapacités et sans incapacités n’a révélé aucune différence significative (69,4% contre 68,3% respectivement). Néanmoins,lorsque la moyenne de Secondaire V fut prise en considération, les garçons et les filles ayant des incapacités ont obtenu desrésultats considérablement meilleurs que prévu comparativement aux garçons et aux filles sans incapacités.
La comparaison de la moyenne des notes de premier semestre de 347 étudiants ayant des troubles d’apprentissage/de déficitd’attention à celle de 285 étudiants ayant autres genres d’incapacités révèle que la moyenne était considérablement plus faible pourceux ayant des troubles d’apprentissage/de déficit d’attention (63,7% contre 69,5%). Lorsque les notes des étudiants ayant destroubles d’apprentissage/de déficit d’attention furent comparées à celles des étudiants sans incapacités (63,7% contre 65,9%), ladifférence n’était pas significative.
Notes en Sciences humaines. L’analyse des notes du programme de Sciences humaines révèle que les étudiants ayant desincapacités (N=269) avaient des moyennes de notes considérablement plus élevées que les étudiants sans incapacités (N=13908) etce, même lorsque la moyenne de Secondaire V n’était pas prise en considération en tant que covariante (66,0% contre 62,3%).
Les filles ayant des incapacités en Sciences humaines avaient des moyennes considérablement plus élevées que celles d’étudiantessans incapacités et ce, qu’un ajustement soit apporté ou non pour leur moyenne de Secondaire V (70,9% contre 65,6%). Lesgarçons ayant des incapacités avaient également des moyennes de notes considérablement plus élevées comparativement auxétudiants sans incapacités (62,7% contre 58,7%) et obtenaient de meilleurs résultats que pouvait le laisser croire leur moyenne deSecondaire V à l’entrée.
Lorsque les notes des étudiants ayant des troubles d’apprentissage/de déficit d’attention furent comparées à la moyenne de notesdes étudiants sans incapacités en Sciences humaines (63,6% contre 62,3%), la différence n’était pas significative.
Taux de réussite de cours
Tous les étudiants. Des 3385 notes pour les étudiants ayant des incapacités, 81,2%étaient de notes de passage comparativement à un taux de 80,5% pour le groupe sans incapacités. La différence n’était passignificative. Cependant, le taux de réussite des étudiants ayant des troubles d’apprentissage (78,3%) était considérablement moinsélevé que celui des étudiants sans incapacités (80,5%) et que celui des étudiants ayant autres genres d’incapacités (85,1%).
Sciences humaines. La différence du taux de réussite de cours dans le programme de Sciences humaines, cependant, révèle queles étudiants ayant des incapacités avaient généralement un taux de réussite plus élevé que les étudiants sans incapacités (80,5%contre 76,6%). Le taux de réussite pour les étudiants ayant des troubles d’apprentissage/de déficit d’attention (77,4%) n’était passignificativement différent que celui des étudiants sans incapacités même s’il était nettement plus faible que le taux de réussite desétudiants ayant autres genres d’incapacités (86,0%).
14
Étudiants ayant des handicaps au Collège Dawson : réussite et avenir
Réussite de cours
La proportion d’étudiants inscrits à temps complet dans des programmes menant à un diplôme (DEC) qui ont réussi 100% de leurscours de premier semestre fut évaluée pour tous les programmes et pour les Sciences humaines.
Tous les programmes. Aucune différence significative n’a été relevée entre les étudiants ayant des incapacités et ceux sansincapacités (49,2% contre 49,4% respectivement). La comparaison des résultats des étudiants ayant des troublesd’apprentissage/de déficit d’attention et du groupe ayant autres genres d’incapacités ainsi que ceux du groupe sans incapacitésrévèle une différence significative (43,4% contre 57,1%), les étudiants ayant des troubles d’apprentissage ayant le taux de réussitele moins élevé.
Sciences humaines. Le taux de réussite des étudiants ayant des incapacités était considérablement plus élevé que celui desétudiants sans incapacités (48,1% contre 41,4%). Celui des étudiants ayant des troubles d’apprentissage/de déficit d’attention(41,6%) n’était pas significativement différent que celui des étudiants sans incapacités (41,4%), même s’il était nettement plusfaible que le taux des étudiants ayant autres genres d’incapacités (58,8%).
Sommaire
Les résultats révèlent que les étudiants ayant des incapacités au Collège Dawson avaient un taux de diplomation sensiblementidentique à celui des étudiants sans incapacités. La différence principale était que les étudiants ayant des incapacités prenaient, enmoyenne, approximativement un semestre de plus pour obtenir leur diplôme. Lorsque la moyenne des notes fut analysée, lesétudiants ayant des incapacités réussissaient aussi bien, et dans certains cas considérablement mieux, que les étudiants sansincapacités. Lorsque les étudiants ayant des incapacités furent divisés en deux groupes, étudiants ayant des troublesd’apprentissage/de déficit d’attention et étudiants ayant autres genres d’incapacités, la tendance générale indiquait que les étudiantsayant des troubles d’apprentissage/de déficit d’attention obtenaient des résultats semblables ou moindres que le groupe sansincapacités et que les étudiants ayant autres genres d’incapacités obtenaient des résultats légèrement supérieurs. Les garçonsobtenaient des résultats moindres que les filles, et ce pour tous les indicateurs. Ceci a été confirmé pour les étudiants ayant desincapacités aussi bien que pour ceux sans incapacités.
Conséquences
Qu’est-ce que ces résultats signifient pour le réseau collégial et pour la société québécoise? Les étudiants ayant des incapacitésdevraient-ils être encouragés à poursuivre des études post-secondaires? Les fonds avancés pour les appuyer au collégial sont-ilsbien dépensés? Bien sûr!
15
Sommaire
Information pour nous rejoindre
Pour plus d'informations et pour le texte intégral du rapport, consultez la site du web Réseau de Recherche Adaptech ou contactezl'un des principaux chercheurs.
Shirley Jorgensen, [email protected]
Catherine S. Fichten, [email protected]
Alice Havel, [email protected]
Réseau de Recherche AdaptechCollège Dawson3040 rue Sherbrooke OuestMontréal (Québec)H3Z 1A4 Canada
Tél: (514) 931-8731Téléc: (514) 931-3567www.adaptech.org
16
Students With Disabilities At Dawson College: Success And Outcomes
Introduction
The public cegeps provided postsecondary education to approximately 145,000 Québec citizens in 2001 (Ministère de l'éducationdu Québec, 2003). Postsecondary education has been targeted as a key vehicle for providing a labour force ready to meet thechallenges of the new workplace (Butlin, 1999). Indeed, the 2001 Canadian Census showed that of the increase in the labor forcebetween 1991 and 2001, almost half of the growth "occurred in highly skilled occupations that normally require universityqualifications" (Statistics Canada, 2003). In its recently released report, Knowledge Matters, the Government of Canada (2002)estimates that, “by 2004, more than 70 percent of all new jobs created in Canada will require some form of post-secondaryeducation.” Similar sentiments have recently been voiced for the Québec context (e.g., Cartier, 2000).
As we become increasingly reliant on the new knowledge based economy, individuals with disabilities can have an unprecedentedopportunity to fully participate in the social and economic life of their communities. The 10% of Quebeckers over the age of 15who have some level of disabilities (Statistics Canada, 2002a) will have promising new possibilities in an environment wherevaluable commodities are no longer physical goods and services but information and knowledge (e.g., Loewen & Tomassetti,2002; Wolfe & Gertler, 2001). However, this will only become a reality when they have the same opportunities for postsecondaryeducation as other Quebeckers.
It is only in the past two decades that North American institutions of higher education have begun to recognize the need to deliverdisability related services to people with disabilities (Fichten, Bourdon, Creti, & Martos, 1987; Hill, 1992). This is also true ofQuébec’s cegeps (Leblanc, 1990, 1999). During this time, the number of people with disabilities in postsecondary education hasincreased substantially, both in the US and in Canada (e.g., Hill, 1996; Louis Harris & Associates, 1994; Tousignant, 1995). Theincrease has also been felt in the cegeps (e.g., Clermont, 1995; Freedman & Havel, 1994). Nevertheless, there are signs that, atleast in Québec, the numbers of students with disabilities in postsecondary education have leveled off since the mid 1990s (e.g.,OPHQ, 1998; AQEHPS, 1999; Généreux, 2001; Senécal, 1998).
According to Louis Harris & Associates (cited by the National Organization on Disability, 1999), by 1998 more than half of adultswith disabilities in the United States (51%) had completed some college - a proportion almost identical to that for the non-disabledpopulation. In Canada, a substantially smaller proportion of individuals with disabilities (35%) than without disabilities (49%) hadsome postsecondary education (Statistics Canada, 1992). Recent data indicate that by 1996, 26% of individuals with and 32% ofindividuals without disabilities completed either college or trade school training (Human Resources Development Canada, 2002).Twelve percent of Americans with disabilities graduated from university compared to 23% of the non-disabled population (HarrisInteractive, 2000). Projections based on the 1991 Health and Activity Limitations data (cf., Fawcett, 1996; Statistics Canada, 1992)and evaluations made by the Office des Personnes Handicapées du Québec (e.g., Allie & Hébert, 1998; OPHQ, 1995) suggest thatthis figure is likely to be lower in Canada. Indeed, according to the recently released “Advancing the Inclusion of Persons withDisabilities – A Government of Canada Report" (Human Resources Development Canada, 2002), in 1996 only 7% of Canadianswith disabilities held a university degree. The comparable figure for non-disabled Canadians was 17%, more than double the ratefor Canadians with disabilities.
Postsecondary education is as important for individuals with disabilities as it is for the rest of the Québec population because ithelps fulfill personal goals, allows for effective competition in the job market and contributes to independence and financialsecurity. Postsecondary graduates with and without disabilities have better employment outcomes than their counterparts with nopostsecondary education (e.g., Allen, Harris, & Butlin, 2003; Horn & Berktold, 1999; Government of Canada, 1996; Nichols,1998; Stodden & Dowrick, 2000). Data on postsecondary students and graduates with disabilities indicate that most want to work(Hubka & Killean, 1996). It has been shown, for example, that although employment of university graduates with disabilities issomewhat lower than that of their non-disabled peers both in the U.S. (e.g., Horn & Berktold, 1999) and Canada (Fawcett, 1996),once employed, salaries are similar, and rates of employment are still substantially higher than rates for students who did notcomplete university. Students who attend college, in turn, fare better than those who never went to college (Canadian Council onSocial Development, 2002; Government of Canada, 1996; Nichols, 1998; Louis Harris & Associates, 1994). In general, studentswith disabilities are more likely to enroll in colleges than universities in Canada, England and the United States (e.g., Fichten,Asuncion, Barile, Robillard, Fossey, & Lamb, 2003; Horn & Berktold, 1999; Richardson, 2001; Richardson & Roy, 2002).
17
Introduction
1.1 The Québec Context
Postsecondary education is highly valued in Québec. For example, data from the latest census (cited in Stahlman, 2000) shows thatMontréal had a larger proportion of higher education students than any of the 29 largest Canadian and American cities. Québecranks close to the top of the western world when it comes to schooling (Direction des statistiques et des études quantitatives, 1999;Lefebvre, 2000). Among new educational objectives announced recently by the Conseil supérieur de l'éducation (2000) is the goalof 40% of the Québec population under age 30 attending a university within the next decade (compared to the current 20% of thepopulation over age 15), with 30% graduating. For youth with disabilities, equal targets should be adopted and pursued. Yet, ourfindings show that of all Canadian provinces, Québec has the lowest proportion of postsecondary students with disabilities(Fichten, Asuncion, Robillard, Fossey, Généreux, Guimont, & Lamb, 2001; Fichten, Barile, & Asuncion, 1999; Fichten, Asuncion,Barile, Robillard, Fossey, Judd, Guimont, Tam, Lamb, Généreux, Juhel, Senécal, & Wolforth, 2001; Fichten, Asuncion, Barile,Robillard, Fossey, & Lamb, 2003).
Postsecondary students with disabilities on Québec campuses. In the late 1970s and 1980s a number of investigations wereundertaken with respect to Québec students with disabilities (e.g., Bérubé, Deschênes, & Juhel, 1985; Coallier, et al., 1987;Direction générale de l’enseignement collégial, 1989; Fédération des cégeps, 1988; Lavoie, 1986; Picard, 1986; Ministère del'Enseignement supérieur et de la science, 1990; Benoit & Gauthier, 1985; Young & Zawilski, 1980). Most studied and maderecommendations about what needed to be done to allow students with disabilities to attend postsecondary education. With theexception of our own studies (e.g., Amsel & Fichten 1990; Fichten, et al., 1990, 1995, 1996) and some other notable exceptions(e.g., AQEHPS, 1999; HERMES-Information stratégique, 1999; Leblanc, 1999; Ministère de l'éducation, 1995; Tousignant, 1995;Tremblay & Charron, 1992; Tremblay, Lacroix, Lacerte, Charron, & Noelting, 1994), research in the 1990’s has been sparse. Inaddition, in spite of the prevailing North American trend for students with learning disabilities to make up between ⅓ and ½ ofstudents with disabilities (e.g., Horn & Berktold, 1999; Jackson et al., 2001; Roessler & Kirk, 1998; Scott, 1997; Statistics Canada,2002b), much of the cegep based literature with respect to disabilities excludes students with learning disabilities such as dyslexia.
Encouraging students with disabilities to attend cegep is an important concern because the number of individuals with disabilitiesattending postsecondary education in Québec is very low. Data on the number of students with disabilities on campus are affectedby the definition of disability used, what question is asked, of whom it is asked, and how percentages are calculated. In large scaleAmerican freshman studies, most research is based on self-reports (e.g., Henderson, 1995; 1999; 2001) and Canadian postsecondarygraduate surveys (e.g., Paju, 1997; Taillon & Paju, 1999). Nevertheless, a substantial number of studies use responses of on-campusprofessionals who provide disability related services. Students identify themselves to these professionals as needing services oraccommodations. Between 1/4 to 1/2 of students with disabilities who are enrolled in postsecondary education register to receivedisability related services (Fichten, Asuncion, Barile, Robillard, Fossey, & Lamb, 2003).
At most North American colleges and universities, including the cegeps, there is at least one designated person whose responsibility it isto provide disability related services and accommodations to students with documented disabilities. Operating on campus from aspecialized office (e.g., Center for Students with Disabilities) or a mainstream one (e.g., Student Services), these individuals offer arange of services such as exam accommodations, advocacy, peer tutoring, production of academic material in alternative formats suchas on tape, in Braille, etc. and assistance with specialized computer technologies (e.g., Juhel, 2000). Students with disabilities have theoption of registering to receive such services. In most cases, the student needs to provide documented proof of the disability and theneed for specialized services. Many students with disabilities fail to register because they: do not need services, do not wish to be"stigmatized" as a student who has a disability, have a desire to "make it like anyone else,” etc. (Fichten, Bourdon, Creti, & Martos,1987). In several studies, including our own, the number of students with disabilities is determined by asking campus based disabilityservice providers to indicate how many students are registered to receive disability related services.
In the case of cegeps there is a another source of information based on data provided by the cegeps that have been designated as"centres d'accueil:" the Service d'Aide à l'Intégration Des Élèves (SAIDE) at Cégep du Vieux Montréal, Le Services aux étudiantshandicapés du Cégep de Sainte-Foy, and Dawson College (Ministère de l’éducation du Québec, 1998). This represents thosestudents for whom an individualized education plan (IEP/IIP) had been submitted and approved, and for whom services providedby the cegeps are funded by the Ministère de l'éducation du Québec (MEQ). The number of students who have been recognized toreceive services by the MEQ is considerably lower than the numbers furnished by disability service providers for virtually all publiccegeps (Fichten, Barile, Robillard, Fossey, Asuncion, Généreux, Judd, & Guimont, 2000).
18
Students With Disabilities At Dawson College: Success And Outcomes
Results of recent large scale Canada-wide and Québec based studies of students registered to receive campus based disabilityrelated services indicate that, overall, 2½% of Canadian students are registered to receive disability related services form theirpostsecondary institutions; this varies from ½% to 6% in different provinces (Fichten, Asuncion, Barile, Robillard, Fossey, &Lamb, 2003). Junior/community colleges had a higher percentage of students with disabilities registered to receive disabilityrelated services (3¾ %) than universities (1⅔ %). Québec has a substantially smaller proportion of both college (0.6% vs 6%) anduniversity (0.4% vs 2½%) students with disabilities than the rest of Canada. Although lack of recognition of learning disabilitiesfor postsecondary funding by the Québec government is an important contributor to the small percentages (cf. Cardyn, & Bégin,1998; Tousignant, 1995), it cannot explain the huge discrepancies between Québec and the rest of Canada. Consistent with ourfindings, others, too, have commented on the low enrollment of students with disabilities in Québec postsecondary institutions(Allie & Hébert, 1998; AQEHPS, 1999; Maisonneuve & DeCorwin, 1994; OPHQ, 1995, 1998). Maisonneuve and DeCorwin(1994) blame inadequate opportunities for education and training for the low employment rate of people with disabilities inQuébec. Although the figures above represent only the ¼ to ½ of students with disabilities on campus who register to receivedisability related services, the low number of students, as well as of workers with disabilities in Québec (Association desparaplégiques du Québec, 1994), makes it especially important to know about what happens to the students who are enrolled.
1.2 Factors Related to Academic Success
The literature on non-disabled students, driven by several theoretical views (e.g., Pascarella & Terenzini, 1994), shows that avariety of factors are related to academic success when this is defined in terms of grades and graduation (e.g., Astin, 1993; Flippo& Cavalry, 2000; Pinto, 1993). These can be categorized into “individual” (e.g., age, sex, high school grades) and “collegeprogram related” variables (e.g., pre-university program, careers program). Research on predictors of student success has gone onin Québec (Barbeau, 1994; Cokley, 2000; D'Amours, 1992; Meunier, 1989; Ouellet, Delisle, Couture, & Gauthier, 2000) as well aselsewhere, and is of considerable interest to the MEQ (1998). All cegeps in Québec have been required by the MEQ to developstudent success action plans (e.g., Dawson College, 2000a; Comité sur la réussite du Cégep de Sainte-Foy, 2000) and many,including Dawson, have already carried out research on this topic (e.g., Denison, 2000, Dawson College, 2000b).
Substantial data relevant cegep students in general exists. But what about students with disabilities? Are the conventionalpredictors of student success (defined as graduation within a reasonable period and grades) (cf. Dawson College, 2000a), relevantto this population of students? Or are there unique contributors for them? The literature here is particularly weak. For example,Québec-based data show that when university students with disabilities graduate, they frequently obtain high grades (Wolforth,2000) and that cegep students who are Deaf are slightly more likely than other students with disabilities to obtain their DEC(Étudiants handicapés du Cégep de Sainte-Foy, undated). Similarly, a study by the SAIDE of Cégep du Vieux Montréal on westernQuébec cegep students with hearing impairments showed that between 1982 and 1994 the number of students with hearingimpairments increased, and that 53% of students graduated, 32% did not complete their studies and 15% were still students at thetime of the study (Clermont, 1995). In general, there is surprisingly little systematic research on this topic and there are no ongoingprojects to study success outcomes of students with disabilities in the cegeps. Studies which do exist are based primarily on thelimited number of students for whom an individualized education plan had been submitted and approved, and for whom servicesprovided by the cegeps are funded by the MEQ. As noted earlier, the number of such students is substantially lower than thenumber registered with their colleges to receive disability related services (Fichten, Asuncion, Barile, Robillard, Fossey, & Lamb,2003) and, thus, they do not adequately represent either the actual number of students with disabilities registered to receiveservices at the cegeps or their academic performance related characteristics.
1.3 Goals and Hypotheses for the Present Investigation
In Québec, despite twenty years of planning, special funding, and the provision of specialized disability related services in thecegeps (cf. Leblanc, 1999) very little is known about how students with disabilities fare once they enter college. What proportionof them graduate or drop out? What programs do they attend? How long does it take students to graduate? What kinds of grades dothey receive? What are the predictors of successful outcomes for students with disabilities? How do these compare to those fornon-disabled students? The goal of this study was to provide answers to these questions for the largest cegep in Québec, DawsonCollege.

19
Introduction
Dawson is located in the downtown area of Montreal, a city with a population of 1.8 million. Since 1999, full-time day enrolmentshave ranged between 7000-7500. In addition 1800-2000 students enroll as part-time students through the continuing educationdivision.
Dawson College’s (undated) Mission Statement outlines its commitment to prepare students for university or immediateemployment. The College offers 19 career programs (of 3 years duration) and 5 pre-university programs (of 2 years duration)leading to a DEC (Diplôme d'études collégiales). About 30% of its full-time day students are enrolled in the career and 70% in thepre-university sector.
To ascertain what happened to students with disabilities after they enrolled at Dawson College we conducted an archivalcomparative study of the "success" outcomes of students with and without disabilities who first enrolled at Dawson Collegebetween 1990 and 2002. Four success indicators were chosen for analysis: (1) graduation rates (over three time frames); (2)average grades in the first semester; (3) course pass rates; (4) course success (percent of students who passed 100% of the coursesthey undertook in the first semester).
The following hypotheses were tested.
1. Disability status will be an important variable when time taken to graduate is evaluated. Other success criteria, such as grades,will not be affected by having a disability.
2. Students with learning disabilities may perform at a different level than students with other disabilities. We have no basis forformulating a hypothesis concerning the direction of the difference.
3. Individual factors that predict success for non-disabled students will be important predictors of success for students withdisabilities as well.
4. Females will have better success outcomes than males, regardless of disability status.5. Students with disabilities will be over-represented in: (a) social sciences and (b) and continuing education.
20
Students With Disabilities At Dawson College: Success And Outcomes
Methodology
2.1 Students Included In The Study
The sample consisted of 653 students (338 males; 315 females) who were registered to receive disability related services fromDawson College’s Center for Students With Disabilities (students with disabilities) and 41,357 students (19,770 males; 21,587females) who did not make a request for services (non-disabled students). To be included in the study, students (1) must haveenrolled at Dawson College for the first time between the autumn session of 1990 and the winter session of 2002, (2) must havehad no prior history of having studied at a cegep, and (3) if the student had a disability, they had to have had this for a minimum of6 months (cf. Taillon & Paju, 1999). Eligible students were identified based on the computerized records of Dawson College.Students with disabilities comprised 1.6% of the total sample. Although the number of students with disabilities enrolled atDawson College during the study period is likely to have been higher, this figure is realistic when compared to other data reportingthe proportion of students registered to receive disability related services in all cegeps (Fichten, Asuncion, Barile, Robillard,Fossey, & Lamb, 2003).
2.2 Procedure For Classifying Students
Students with disabilities. Of the 722 disabilities recorded for the 653 students (some students had more than one disability),52.6% (380) were learning disabilities and/or attention deficit disorder (ADD) and 47.4% (342) were other disabilities such asvisual, hearing, speech, orthopedic, psychiatric and medical impairments.
Students who attend Dawson College are able to register for disability related services through the College’s Center for StudentsWith Disabilities. The Center is designed to address the needs of students with disabilities registered in diploma programs as wellas in continuing education courses. Upon admission to Dawson College, students with disabilities are encouraged to identifythemselves to the Center for Students with Disabilities by providing the necessary documentation to support their request forservices. Although only students with major functional disabilities (visual, hearing, motor or organic impairments) are recognizedby the Ministère de l'éducation (MEQ) for funding, other students, including those with learning disabilities, attention deficitdisorder, psychiatric illness, and minor physical disabilities, are eligible for a variety of services offered through the Center. Theseinclude: early registration in appropriate courses of their choice, automatic permission to take a reduced course load, access toadaptive technologies (e.g., specialized software such as screen enlargement, text-to-speech, scanning), and special examaccommodations (e.g., extended time, distraction-free environment, scribes). Note-takers and material in alternative format (e.g.,Braille, enlargement, audiotape) are made available upon request, as are oral and sign language interpreters, attendant care workersand lab assistants. Liaison with the College’s Learning Centre provides assistance to students with disabilities such as ready accessto peer tutors, writing tutors, and educational consultants. Liaison with faculty who are, in fact, the key figures in accommodatingstudents with disabilities in the college milieu, assures that professors understand and are open to accommodating the varyingneeds of students with disabilities in their classes.
An analysis of the number of students with disabilities who, according to Dawson's computerized database, have been identified ashaving a major functional disability indicates that since the autumn of 1993 there have been only 109 students so identified. In thefall of 2000, approximately 180 Dawson students were registered with the Center as eligible to receive disability related services,although only 49 of them were "officially" designated as having a disability (i.e., have had an individualized education plan(IEP/IIP) submitted to the Ministère de l'éducation (MEQ)). This indicates that most students who were eligible to receivedisability related services from Dawson were not officially recognized by the MEQ as having a disability. Therefore, extensiveevaluation and categorization of the archives of Dawson’s Center for Students with Disabilities was undertaken to obtain thesample.

21
Methodology
Students’ records at the Center usually indicate their “primary” or “most important” impairment which necessitates anaccommodation. Although some of the students may have had several impairments, for the purpose of setting accommodations fewwere identified as having more than one. Students were classified by the Coordinator of the Center as having one or more of thefollowing:
• Visual impairmento Low visiono Blind
• Mobility impairmento No wheelchairo Wheelchair
• Arm/Hand coordination problem• Communication impairment• Hearing impairment /Deafness
o Oralo Sign
• Learning disability and/or attention deficit disorder (ADD)• Psychiatric impairment• Chronic medical condition• Other impairment or disability
The Center’s records were incomplete in a variety of cases. Therefore, we contacted students whose eligibility was uncertain bytelephone (see Appendix 3 for the telephone script). Students were asked to self identify as having one or more impairments inaccordance with the criteria noted above. Students with temporary disabilities (i.e., less than 6 months duration – see Taillon &Paju, 1999) were excluded from the analyses.
The majority of students in the sample had used the Center’s services for pre-registration at least once between 1990-2002. This isa popular service for most students because it allows them to select their courses and course times before other students, whenplaces are still available. These students also receive some guidance regarding course selection and course load.
Non-disabled students. Non-disabled students were those 41,357 students who met the eligibility criteria but did not register withthe Center for Students with Disabilities. However, it is highly likely that some of the students included in this group had adisability.
A satisfaction survey conducted at the College in 2002 (Office of Institutional Research, 2002) resulted in 1575 responses. Ofthese, 9% self-identified as having a disability. Although this figure related to the total student population rather than first-timefull-time college commencers, it represents a substantially larger number of students than the 1.6% of the total sample who areconsidered to be students with disabilities in this investigation. Moreover, the 9% figure is consistent with the findings of largescale American surveys which show that approximately 9% of university and college freshmen self-reported as having a disability(Henderson 1995,1999) and that 6% to 8% of first time full-time commencers at universities reported at least one disability(Henderson 2001). However, given the relatively large size of the sample (41,357), the inclusion of students with disabilities whodid not register with the Center is likely to have only a very minor impact.
2.3 Student Characteristics
Characteristics of students with and without disabilities, classified according the procedures described in Section 2.2, werecompared with respect to demographics, academic background, academic programs in which students were registered and the firstsemester course load in order to explore any differences which could impact on the academic outcomes of students.
22
Students With Disabilities At Dawson College: Success And Outcomes
2.4 Success Indicators
Four measures commonly used to compare the academic outcomes of students were examined:
• Graduation rates in diploma programs (in prescribed time; prescribed time plus two years; over the entire period ofobservation)
• Average grades in the first semester of study• Course pass rates in courses undertaken in the first semester of study• Course success rates (percentage of students who passed 100% of the courses they undertook in the first semester)
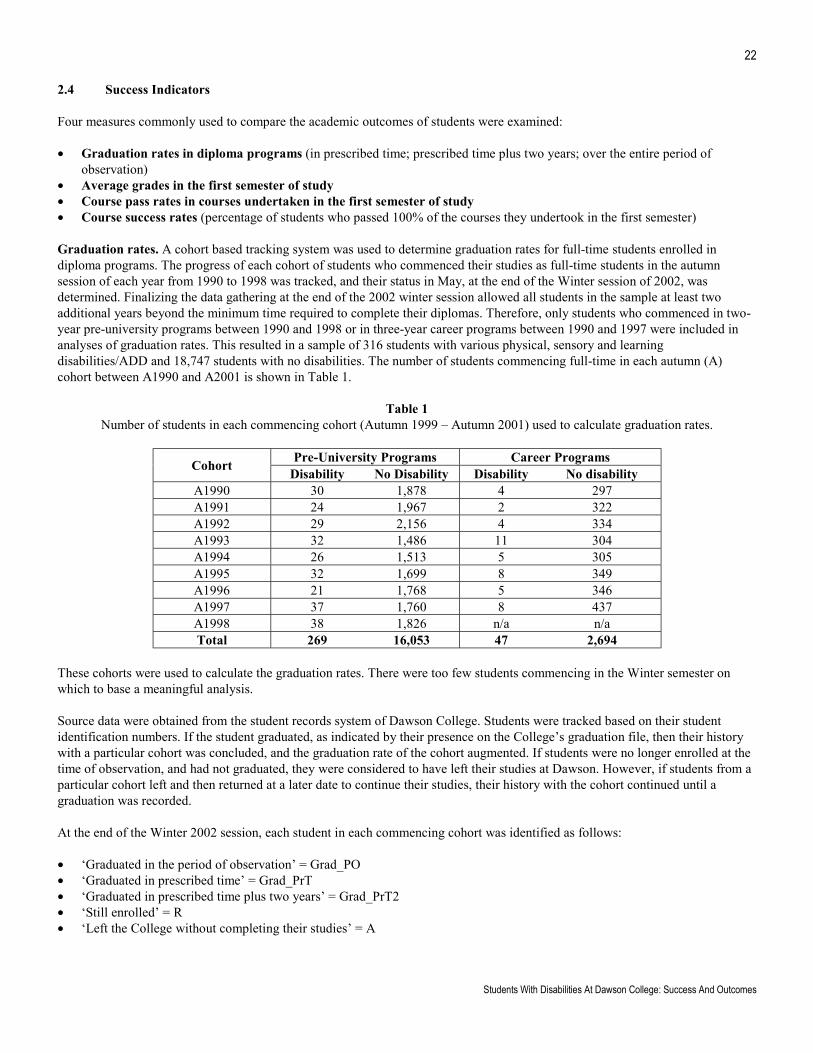
Graduation rates. A cohort based tracking system was used to determine graduation rates for full-time students enrolled indiploma programs. The progress of each cohort of students who commenced their studies as full-time students in the autumnsession of each year from 1990 to 1998 was tracked, and their status in May, at the end of the Winter session of 2002, wasdetermined. Finalizing the data gathering at the end of the 2002 winter session allowed all students in the sample at least twoadditional years beyond the minimum time required to complete their diplomas. Therefore, only students who commenced in two-year pre-university programs between 1990 and 1998 or in three-year career programs between 1990 and 1997 were included inanalyses of graduation rates. This resulted in a sample of 316 students with various physical, sensory and learningdisabilities/ADD and 18,747 students with no disabilities. The number of students commencing full-time in each autumn (A)cohort between A1990 and A2001 is shown in Table 1.
Table 1Number of students in each commencing cohort (Autumn 1999 – Autumn 2001) used to calculate graduation rates.
Pre-University Programs Career ProgramsCohort Disability No Disability Disability No disabilityA1990 30 1,878 4 297A1991 24 1,967 2 322A1992 29 2,156 4 334A1993 32 1,486 11 304A1994 26 1,513 5 305A1995 32 1,699 8 349A1996 21 1,768 5 346A1997 37 1,760 8 437A1998 38 1,826 n/a n/aTotal 269 16,053 47 2,694
These cohorts were used to calculate the graduation rates. There were too few students commencing in the Winter semester onwhich to base a meaningful analysis.
Source data were obtained from the student records system of Dawson College. Students were tracked based on their studentidentification numbers. If the student graduated, as indicated by their presence on the College’s graduation file, then their historywith a particular cohort was concluded, and the graduation rate of the cohort augmented. If students were no longer enrolled at thetime of observation, and had not graduated, they were considered to have left their studies at Dawson. However, if students from aparticular cohort left and then returned at a later date to continue their studies, their history with the cohort continued until agraduation was recorded.
At the end of the Winter 2002 session, each student in each commencing cohort was identified as follows:
• ‘Graduated in the period of observation’ = Grad_PO• ‘Graduated in prescribed time’ = Grad_PrT• ‘Graduated in prescribed time plus two years’ = Grad_PrT2• ‘Still enrolled’ = R• ‘Left the College without completing their studies’ = A
23
Methodology
The graduation rate was calculated by dividing the number of students who graduated by the total number in the commencingcohort. These rates, used in the College’s tracking of students, are cumulative (i.e., those flagged as graduating in the period ofobservation include those who graduated in PrT and PrT2, and those who graduated in PrT2 include those who graduated in PrT).
The total commencing cohort (T _Cohort) is determined as follows:
T_Cohort = GradPO + R + A
The graduation rates are calculated as follows:
• %Grad_PO = Number Grad_PO/T_ Cohort• %Grad_PrT = Number Grad_Prt/T_Cohort• %Grad_PrT2 = Number GradPrT2/T_Cohort
It is possible that students who left Dawson without completing their diplomas may have gone on to do so at another college. It is,in fact, known that approximately 2% to 3% of each commencing cohort at Dawson do complete their diploma at another cegep.Whether students with disabilities do so at a similar rate is unknown. The calculated rates are for graduations at Dawson, and willtend to under-report the true rates at which students graduate from college.
Due to the small numbers of students with disabilities comprising each cohort, the graduation rates were averaged for combinedcohorts. The rates for pre-university cohorts commencing between A1990 and A1998 were averaged (n=269 for students withdisabilities), since at the time that the data gathering was finalized, the A1998 cohort was the latest cohort for which graduationrates in prescribed time plus two years could be determined. For the same reason, graduation rates for career programs, a yearlonger in duration, were averaged for cohorts commencing between A1990 and A1997 (n=47 for students with disabilities).
For the purpose of this study the measures used to compare the graduation rates of the two groups of students are defined asfollows:
• Graduation rate in prescribed time (Grad_PrT): The percent of students in the commencing cohort who graduate in theminimum time prescribed for the program. This will occur if all courses are attempted and passed as outlined in the programdescription. Prescribed time is two years (4 semesters) for the College’s pre-university, and three years (6 semesters) for theCollege’s career programs.
• Graduation in prescribed time plus two years (GradPrT2): The percent of students in a commencing cohort who graduatewithin the minimum time prescribed for the program plus two years. This is four years (8 semesters) for the College’s pre-university and five years (10 semesters) for the College’s career programs.
• Graduation over the period of observation (GradPO): The percent of students in a commencing cohort who graduate over theperiod of the investigation. In this study the longest period of observation is for the Autumn 1990 commencing cohort as at theend of the Winter semester of 2002 - a total of 12 years or 24 semesters. The shortest period of observation is for the 1998cohort – a total of 8 semesters or 4 years. A table showing the period of observation for each successive commencing cohort isshown in Appendix 1.
Average grades in the first semester. The grades for each course undertaken for students in their first semester of study wereobtained from the College’s grades files. The grade averages of students with and without disabilities were compared.
Course pass rates in the first semester. The course pass rate is calculated by dividing the total number of passing grades by thetotal number of grades received by each of the two groups of students being compared.
Course success rates in the first semester. The percent of students who passed 100% of the courses they undertook in the firstsemester.

24
Students With Disabilities At Dawson College: Success And Outcomes
2.5 Method of Analysis
Characteristics of students with and without disabilities are compared with respect to demographics, academic background,academic programs in which students were registered and the first semester course load. This is followed by a comparison of theacademic success of both groups based on the analysis of the selected indicators.
For the analysis of course load, graduation and course success rates, only full-time day students enrolled in diploma programs wereincluded. For the grades analysis and course pass rates the grades for all students in all sectors were included, including thosestudents in continuing education. Continuing education includes those students who are studying part-time in the evening. Theymay be undertaking studies in attestation programs (AEC’s - usually of less than one year duration) or may be studying out-of-program. Data were also analyzed for the subgroup of students who were enrolled in the Social Science program. This was theprogram in which the largest proportion of both students with and without disabilities were registered. Because courserequirements for these students are the same, differences due to discrepancies in field of study would have a minimal impact on theresults.
Since the number of students in most of the disability classifications was small, it was difficult to compare the success indicatorsby disability type. Therefore, an analysis was carried out comparing the success indicators for students with learningdisabilities/ADD (the largest group) to the remaining students who were grouped into an ‘all other disabilities’ classification.Differences were considered significant at p<=.05 for the statistical tests used.
25
Results: Student Characteristics
Results: Student Characteristics
3.1 Nature of Students’ Disabilities
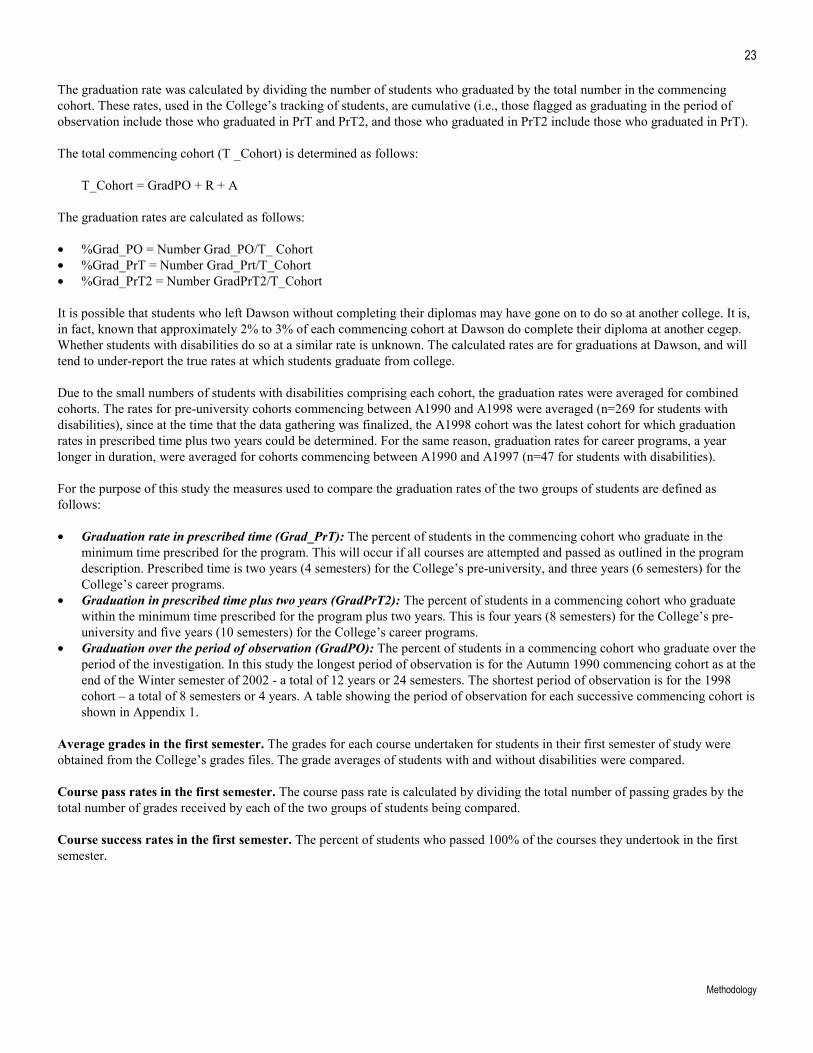
An examination of the nature of the disabilities recorded for the 653 students in the sample shows that the most commondisabilities recorded by the Centre were learning disability/attention deficit disorder (52.6%), followed by chronic medical (14.1%)and psychiatric disorders (8.4%) (Table 2).
Table 2Nature of the disabilities of the 653 students in the sample.
Nature of Disability Number %
Visual impairment Low Vision Blind
267
3.6%1.0%
Mobility impairment No wheelchair Wheelchair user
2234
3.0% 4.7%
Arms & hands 18 2.5% Hearing impairment/Deafness Oral Sign
3516
4.8%2.2%
Communication impairment 7 1.0% Learning disability / ADD 380 52.6% Psychiatric impairment 60 8.4% Chronic medical condition 102 14.1% Other disability or impairment 15 2.1%Total 722* 100%
* The total exceeds 653, because 54 students had more than one disability.
26
Students With Disabilities At Dawson College: Success And Outcomes
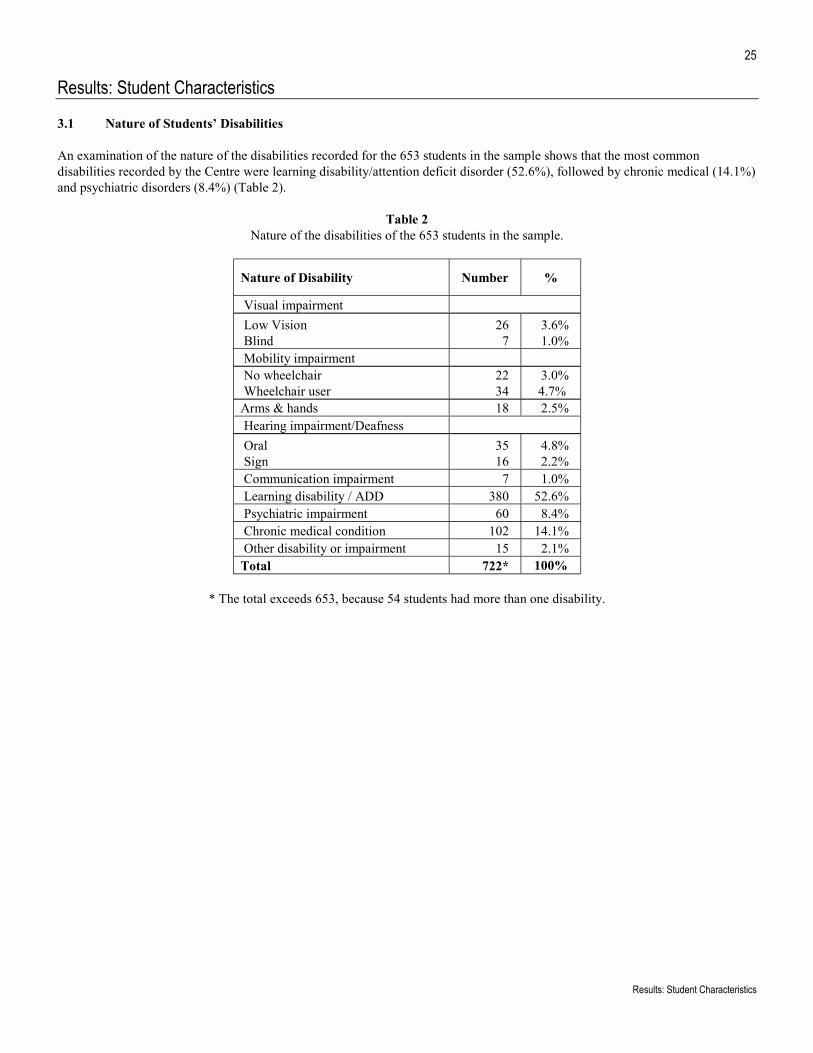
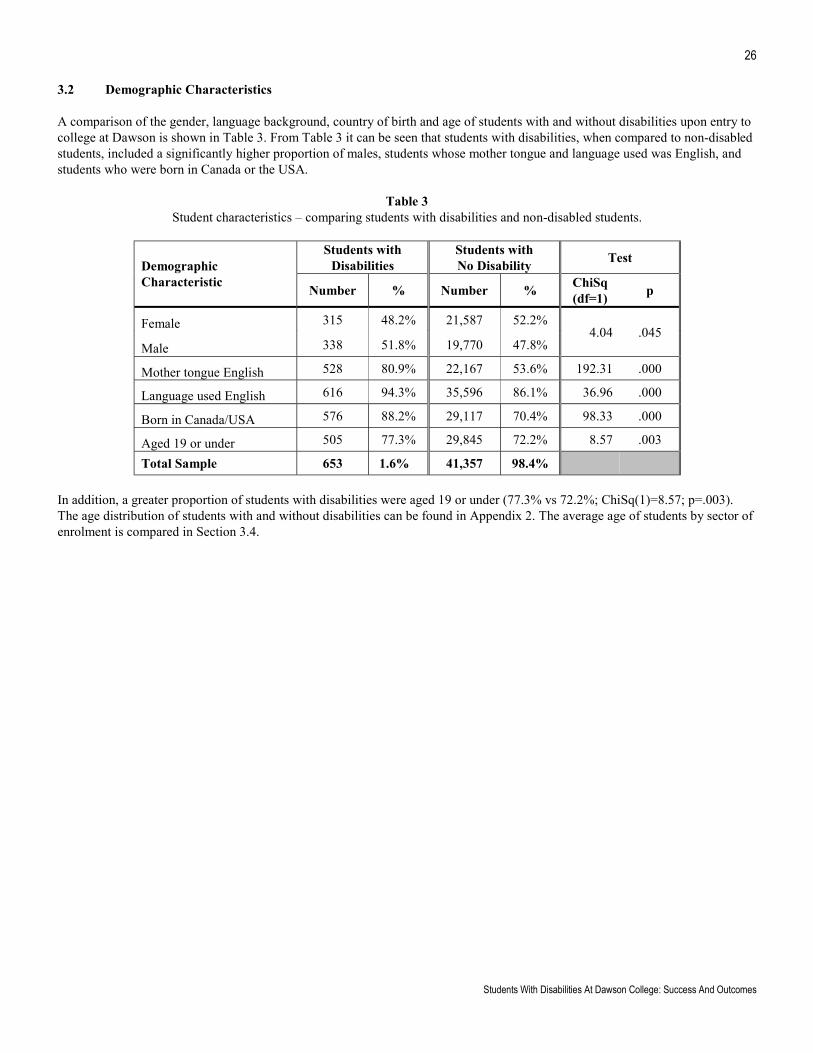
3.2 Demographic Characteristics
A comparison of the gender, language background, country of birth and age of students with and without disabilities upon entry tocollege at Dawson is shown in Table 3. From Table 3 it can be seen that students with disabilities, when compared to non-disabledstudents, included a significantly higher proportion of males, students whose mother tongue and language used was English, andstudents who were born in Canada or the USA.
Table 3Student characteristics – comparing students with disabilities and non-disabled students.
Students withDisabilities
Students withNo Disability TestDemographic
Characteristic Number % Number % ChiSq(df=1) p
Female 315 48.2% 21,587 52.2%
Male 338 51.8% 19,770 47.8%4.04 .045
Mother tongue English 528 80.9% 22,167 53.6% 192.31 .000
Language used English 616 94.3% 35,596 86.1% 36.96 .000
Born in Canada/USA 576 88.2% 29,117 70.4% 98.33 .000
Aged 19 or under 505 77.3% 29,845 72.2% 8.57 .003
Total Sample 653 1.6% 41,357 98.4%
In addition, a greater proportion of students with disabilities were aged 19 or under (77.3% vs 72.2%; ChiSq(1)=8.57; p=.003).The age distribution of students with and without disabilities can be found in Appendix 2. The average age of students by sector ofenrolment is compared in Section 3.4.

27
Results: Student Characteristics
3.3 Academic Background – Average High School (Secondary V) Scores
Many students are admitted to cegep on the basis of their average grades in the last year of high school. This is referred to as theSecondary V average (SecV). Not all students have a SecV record in the College’s archives because some students were admittedon a basis other than their performance in high school. In addition, scores prior to 1992 were not available for analysis. Averagesfor those students in the sample for whom scores were available (76% of students with a disability and 59% of non-disabledstudents) were compared to determine whether students with disabilities entered with higher or lower scores than non-disabledstudents.
Table 4 shows sample sizes and average SecV scores at entry for males and females with and without disabilities. A 2X2 ANOVAcomparing disability status (non-disabled vs students with disabilities) and gender (females vs males) showed that there was asignificant main effect for gender. Females had higher SecV averages than males (F(1;25,165)=38.10; p=.000). In addition, therewas a significant main effect for disability status. Students with disabilities had lower SecV averages compared to their non-disabled peers (F(1;25,165)=17.92; p=.000). There was no significant difference for the disability X gender interaction(F(1;25,165)=1.11; p=.292). Females with disabilities had lower scores than females without disabilities, and males withdisabilities had lower scores than males without disabilities.
Table 4Comparison of the SecV averages of males and females with and without disabilities.
Females Males TotalSamples N Mean
SD N MeanSD N Mean
SDStudents withdisabilities 251 70.4±11.2 245 66.4±11.7 496 68.4±11.6
Non-disabledstudents 13,502 72.1±12.0 11,171 69.3±12.2 24,673 70.8±12.1
Total 13,753 72.1±11.9 11,416 69.3±12.2 25,169 70.8±12.1
Some of the SecV averages recorded were lower than 50, and suggested that students had been admitted on a basis other than theirhigh school grades. When the SecV comparison was repeated using only averages at or above 50 (which would have qualifiedstudents for entry to cegep prior to 1997. From 1997 onwards the value was 60), the results were similar (Table 5).
Table 5Comparison of the SecV averages of males and females with and without disabilities for SecV averages of at least 50.
Females Males TotalSamples N Mean
SD N MeanSD N Mean
SDStudents withdisabilities 233 72.8±7.0 221 69.6±6.6 454 71.2±7.0
Non-disabledstudents 12,610 74.6±7.7 10,267 72.2±7.6 22,877 73.5±7.8
Total 12,843 74.5±7.7 10,488 72.1±7.6 23,331 73.4±7.8
There were statistically significant differences between the SecV averages of students with and without disabilities(F(1;23,327)=35.15; p=.000), as well as between those of males and females (F(1;23,327)=59.35; p=.000). There was nosignificant gender X disability interaction (F(1;23,327)=1.20; p=.274). The sample sizes, means and standard deviations arepresented in Table 5.
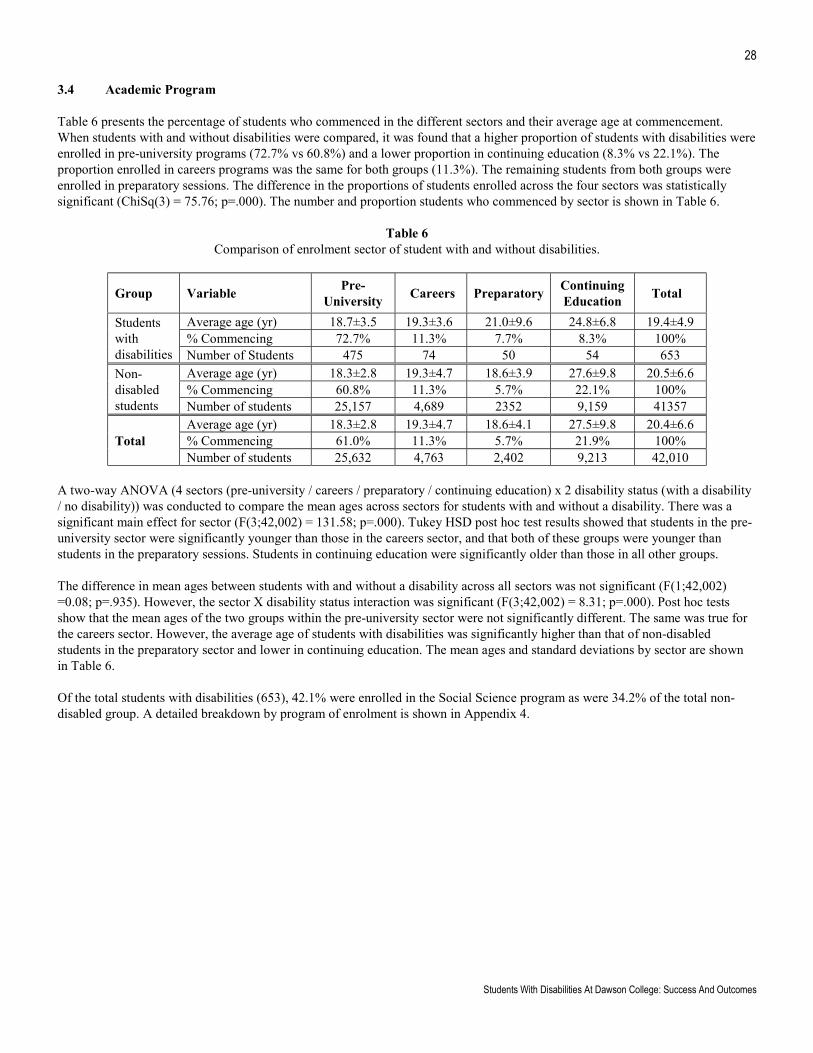
28
Students With Disabilities At Dawson College: Success And Outcomes
3.4 Academic Program
Table 6 presents the percentage of students who commenced in the different sectors and their average age at commencement.When students with and without disabilities were compared, it was found that a higher proportion of students with disabilities wereenrolled in pre-university programs (72.7% vs 60.8%) and a lower proportion in continuing education (8.3% vs 22.1%). Theproportion enrolled in careers programs was the same for both groups (11.3%). The remaining students from both groups wereenrolled in preparatory sessions. The difference in the proportions of students enrolled across the four sectors was statisticallysignificant (ChiSq(3) = 75.76; p=.000). The number and proportion students who commenced by sector is shown in Table 6.
Table 6Comparison of enrolment sector of student with and without disabilities.
Group Variable Pre-University Careers Preparatory Continuing
Education Total
Average age (yr) 18.7±3.5 19.3±3.6 21.0±9.6 24.8±6.8 19.4±4.9% Commencing 72.7% 11.3% 7.7% 8.3% 100%
Studentswithdisabilities Number of Students 475 74 50 54 653
Average age (yr) 18.3±2.8 19.3±4.7 18.6±3.9 27.6±9.8 20.5±6.6% Commencing 60.8% 11.3% 5.7% 22.1% 100%
Non-disabledstudents Number of students 25,157 4,689 2352 9,159 41357
Average age (yr) 18.3±2.8 19.3±4.7 18.6±4.1 27.5±9.8 20.4±6.6% Commencing 61.0% 11.3% 5.7% 21.9% 100%TotalNumber of students 25,632 4,763 2,402 9,213 42,010
A two-way ANOVA (4 sectors (pre-university / careers / preparatory / continuing education) x 2 disability status (with a disability/ no disability)) was conducted to compare the mean ages across sectors for students with and without a disability. There was asignificant main effect for sector (F(3;42,002) = 131.58; p=.000). Tukey HSD post hoc test results showed that students in the pre-university sector were significantly younger than those in the careers sector, and that both of these groups were younger thanstudents in the preparatory sessions. Students in continuing education were significantly older than those in all other groups.
The difference in mean ages between students with and without a disability across all sectors was not significant (F(1;42,002)=0.08; p=.935). However, the sector X disability status interaction was significant (F(3;42,002) = 8.31; p=.000). Post hoc testsshow that the mean ages of the two groups within the pre-university sector were not significantly different. The same was true forthe careers sector. However, the average age of students with disabilities was significantly higher than that of non-disabledstudents in the preparatory sector and lower in continuing education. The mean ages and standard deviations by sector are shownin Table 6.
Of the total students with disabilities (653), 42.1% were enrolled in the Social Science program as were 34.2% of the total non-disabled group. A detailed breakdown by program of enrolment is shown in Appendix 4.
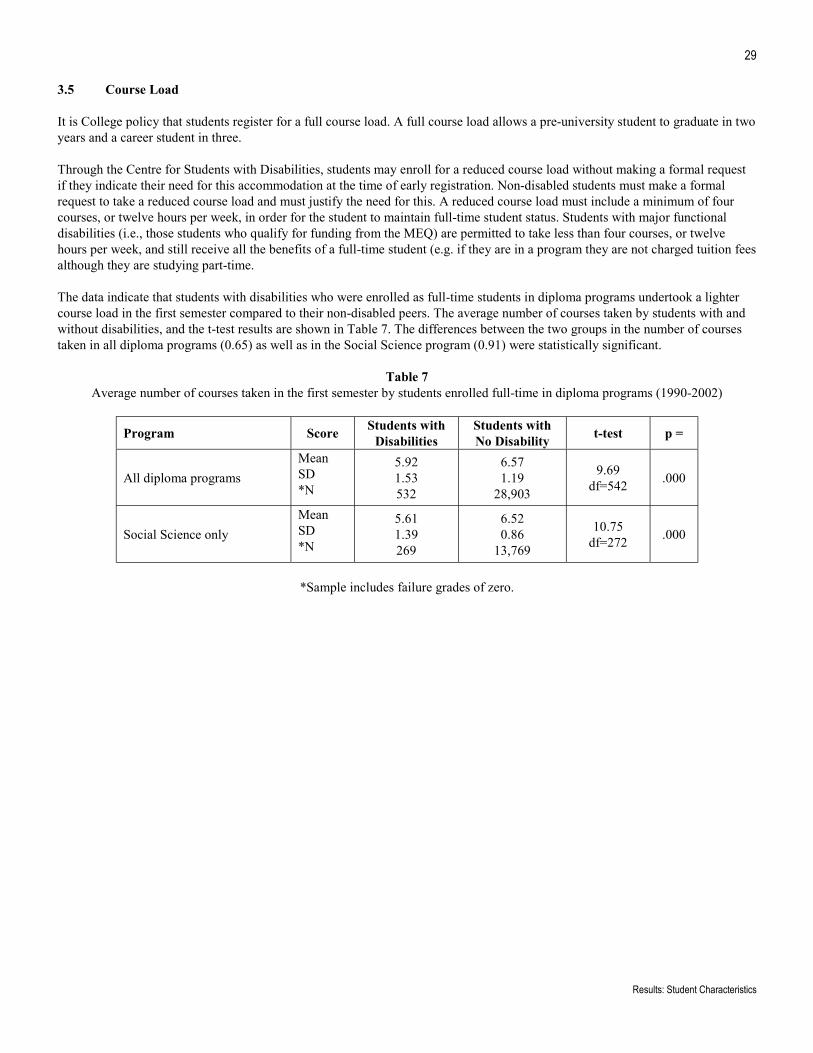
29
Results: Student Characteristics
3.5 Course Load
It is College policy that students register for a full course load. A full course load allows a pre-university student to graduate in twoyears and a career student in three.
Through the Centre for Students with Disabilities, students may enroll for a reduced course load without making a formal requestif they indicate their need for this accommodation at the time of early registration. Non-disabled students must make a formalrequest to take a reduced course load and must justify the need for this. A reduced course load must include a minimum of fourcourses, or twelve hours per week, in order for the student to maintain full-time student status. Students with major functionaldisabilities (i.e., those students who qualify for funding from the MEQ) are permitted to take less than four courses, or twelvehours per week, and still receive all the benefits of a full-time student (e.g. if they are in a program they are not charged tuition feesalthough they are studying part-time.
The data indicate that students with disabilities who were enrolled as full-time students in diploma programs undertook a lightercourse load in the first semester compared to their non-disabled peers. The average number of courses taken by students with andwithout disabilities, and the t-test results are shown in Table 7. The differences between the two groups in the number of coursestaken in all diploma programs (0.65) as well as in the Social Science program (0.91) were statistically significant.
Table 7Average number of courses taken in the first semester by students enrolled full-time in diploma programs (1990-2002)
Program Score Students withDisabilities
Students withNo Disability t-test p =
All diploma programsMeanSD*N
5.921.53532
6.571.19
28,903
9.69df=542 .000
Social Science onlyMeanSD*N
5.611.39269
6.520.86
13,769
10.75df=272 .000
*Sample includes failure grades of zero.

30
Students With Disabilities At Dawson College: Success And Outcomes
Results: Academic Success Indicators
3.6 Course Pass Rates – First Semester
Course pass rates were based on total grades (n=3385 for students with disabilities; n=210,037 for non-disabled students) and werecalculated by dividing the total number of first semester courses that were passed by the total number undertaken for each group ofstudents.
When all programs were considered, the difference in the pass rates between the two groups of students was not statisticallysignificant. When the analysis was undertaken by sector of enrollment, there was no significant difference between students withand without disabilities in either the career or pre-university sectors. However, when only students in the Social Science programwere considered, the percentage of courses passed for students with disabilities was significantly higher (80.5% vs 76.6%). Theanalysis undertaken excluded failure grades of zero. The results of the Chi-square tests used to compare the groups are shown inTable 8.
Table 8A comparison of the percentage of courses passed (excludes failure grades of zero).
Students withDisabilities
Studentswith No
Disability
Difference (a-b)
ChiSq(df=1) p
All StudentsTotal grades 3,385 210,037Number of Passing Grades 2,748 169,120% Passed 81.2% 80.5% +0.7 0.93 .334Social ScienceTotal grades 1466 84,639Number of passing grades 1180 64,874% Passed 80.5% 76.6% +3.9% 11.91 .001All pre-university programsTotal grades 2544 149,739Number of passing grades 2049 120,504% Passed 80.5% 80.5% 0.0% 0.01 .933All career programsTotal grades 511 31,882Number of passing grades 434 26,643% Passed 84.9% 83.6% +1.3% 0.68 .409
The results of the test including zero failure grades in the analysis would favor students with disabilities, as this group had a lowerproportion of failure grades (3.3%) compared to the non-disabled group (5.2%). Although not shown here, the results of theanalysis when failure grades of zero were included resulted in the same outcome.
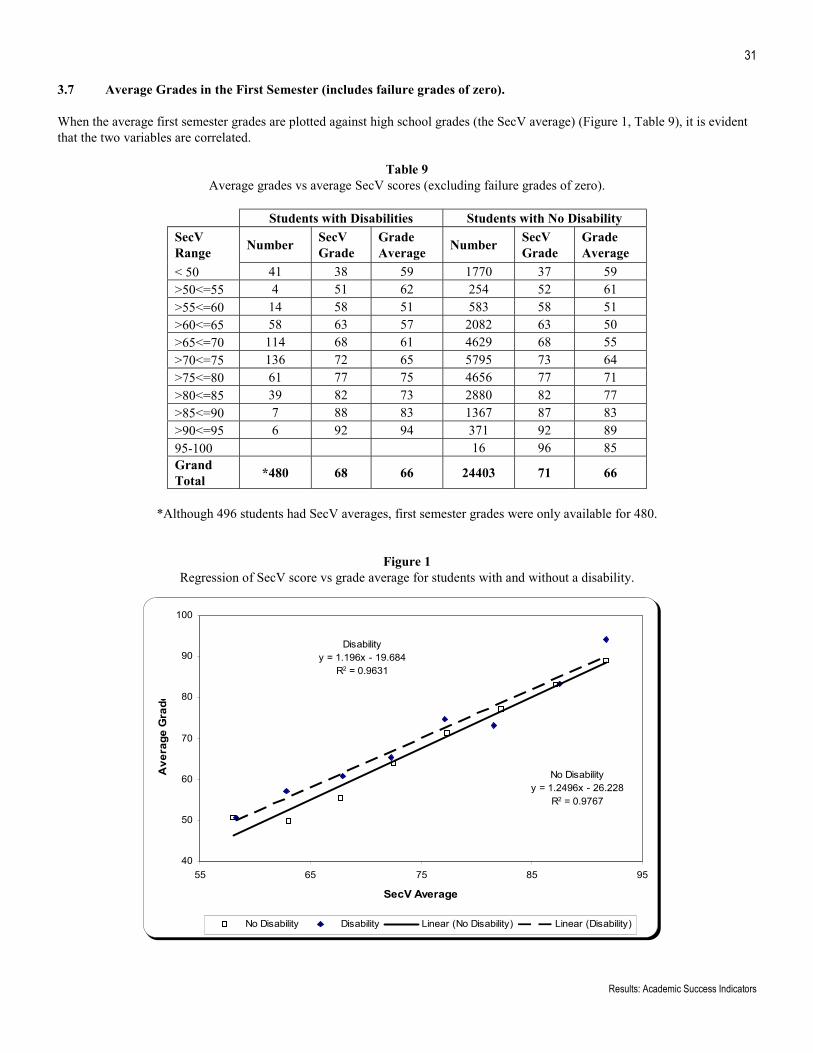
31
Results: Academic Success Indicators
3.7 Average Grades in the First Semester (includes failure grades of zero).
When the average first semester grades are plotted against high school grades (the SecV average) (Figure 1, Table 9), it is evidentthat the two variables are correlated.
Table 9Average grades vs average SecV scores (excluding failure grades of zero).
Students with Disabilities Students with No DisabilitySecVRange Number SecV
GradeGradeAverage Number SecV
GradeGradeAverage
< 50 41 38 59 1770 37 59>50<=55 4 51 62 254 52 61>55<=60 14 58 51 583 58 51>60<=65 58 63 57 2082 63 50>65<=70 114 68 61 4629 68 55>70<=75 136 72 65 5795 73 64>75<=80 61 77 75 4656 77 71>80<=85 39 82 73 2880 82 77>85<=90 7 88 83 1367 87 83>90<=95 6 92 94 371 92 8995-100 16 96 85GrandTotal *480 68 66 24403 71 66
*Although 496 students had SecV averages, first semester grades were only available for 480.
Figure 1Regression of SecV score vs grade average for students with and without a disability.
No Disabilityy = 1.2496x - 26.228
R2 = 0.9767
Disabilityy = 1.196x - 19.684
R2 = 0.9631
40
50
60
70
80
90
100
55 65 75 85 95
SecV Average
Ave
rage
Gra
de
No Disability Disability Linear (No Disability) Linear (Disability)
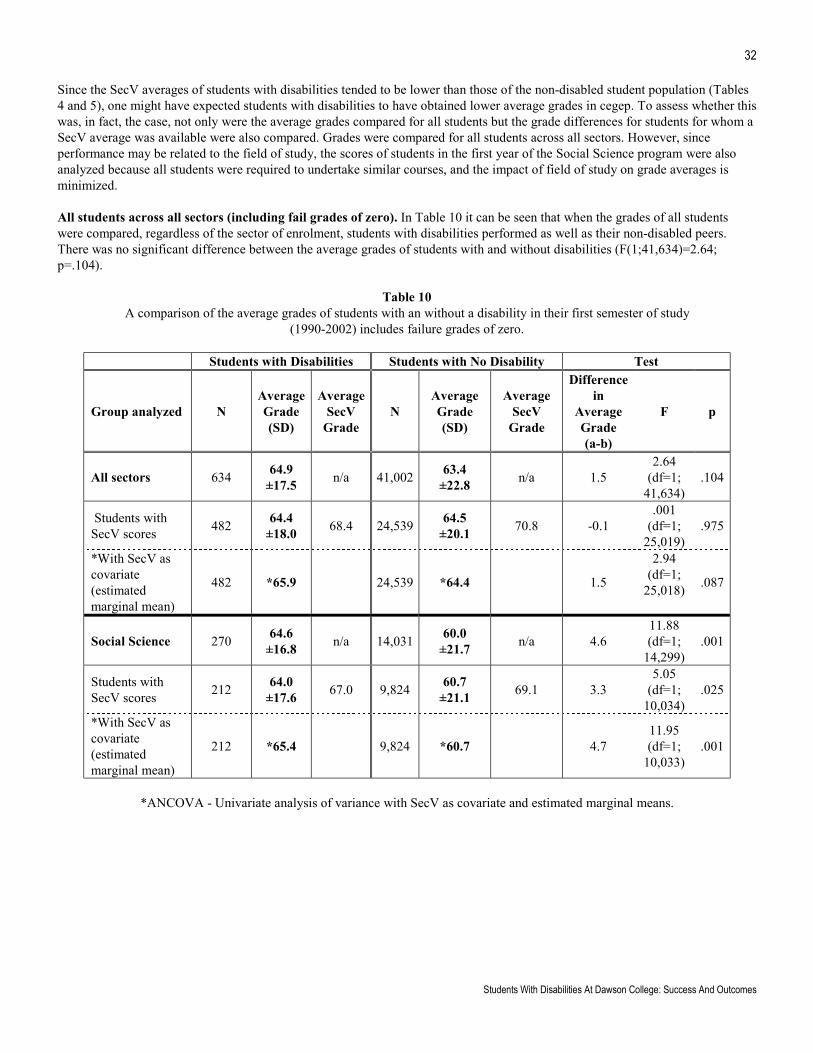
32
Students With Disabilities At Dawson College: Success And Outcomes
Since the SecV averages of students with disabilities tended to be lower than those of the non-disabled student population (Tables4 and 5), one might have expected students with disabilities to have obtained lower average grades in cegep. To assess whether thiswas, in fact, the case, not only were the average grades compared for all students but the grade differences for students for whom aSecV average was available were also compared. Grades were compared for all students across all sectors. However, sinceperformance may be related to the field of study, the scores of students in the first year of the Social Science program were alsoanalyzed because all students were required to undertake similar courses, and the impact of field of study on grade averages isminimized.
All students across all sectors (including fail grades of zero). In Table 10 it can be seen that when the grades of all studentswere compared, regardless of the sector of enrolment, students with disabilities performed as well as their non-disabled peers.There was no significant difference between the average grades of students with and without disabilities (F(1;41,634)=2.64;p=.104).
Table 10A comparison of the average grades of students with an without a disability in their first semester of study
(1990-2002) includes failure grades of zero.
Students with Disabilities Students with No Disability Test
Group analyzed NAverageGrade(SD)
AverageSecV
GradeN
AverageGrade(SD)
AverageSecV
Grade
Differencein
AverageGrade(a-b)
F p
All sectors 634 64.9±17.5 n/a 41,002 63.4
±22.8 n/a 1.52.64
(df=1;41,634)
.104
Students withSecV scores 482 64.4
±18.0 68.4 24,539 64.5±20.1 70.8 -0.1
.001(df=1;
25,019).975
*With SecV ascovariate(estimatedmarginal mean)
482 *65.9 24,539 *64.4 1.5
2.94(df=1;
25,018) .087
Social Science 270 64.6±16.8 n/a 14,031 60.0
±21.7 n/a 4.611.88(df=1;
14,299).001
Students withSecV scores 212 64.0
±17.6 67.0 9,824 60.7±21.1 69.1 3.3
5.05(df=1;
10,034).025
*With SecV ascovariate(estimatedmarginal mean)
212 *65.4 9,824 *60.7 4.711.95(df=1;
10,033).001
*ANCOVA - Univariate analysis of variance with SecV as covariate and estimated marginal means.

33
Results: Academic Success Indicators
An ANCOVA test with the SecV score used as a covariate showed no significant difference between the two groups of students(F(1;25,019)= 2.94; p=.087). However, it can be seen in Table 10 that the marginal mean was higher for the group with disabilitieswhen the covariate was taken into consideration, whereas the grades were nearly identical without correction for the covariate.
Social Science program (including failure grades of zero). When grades of the students with and without disabilities in theSocial Science program were compared, the group with disabilities had significantly higher average grades compared to non-disabled students, even if no correction was made for the SecV average as a covariate. The results were compared using ANOVAand ANCOVA, and the test statistics are shown in Table 10. Students with disabilities performed better than might have beenexpected given their lower SecV entry scores.
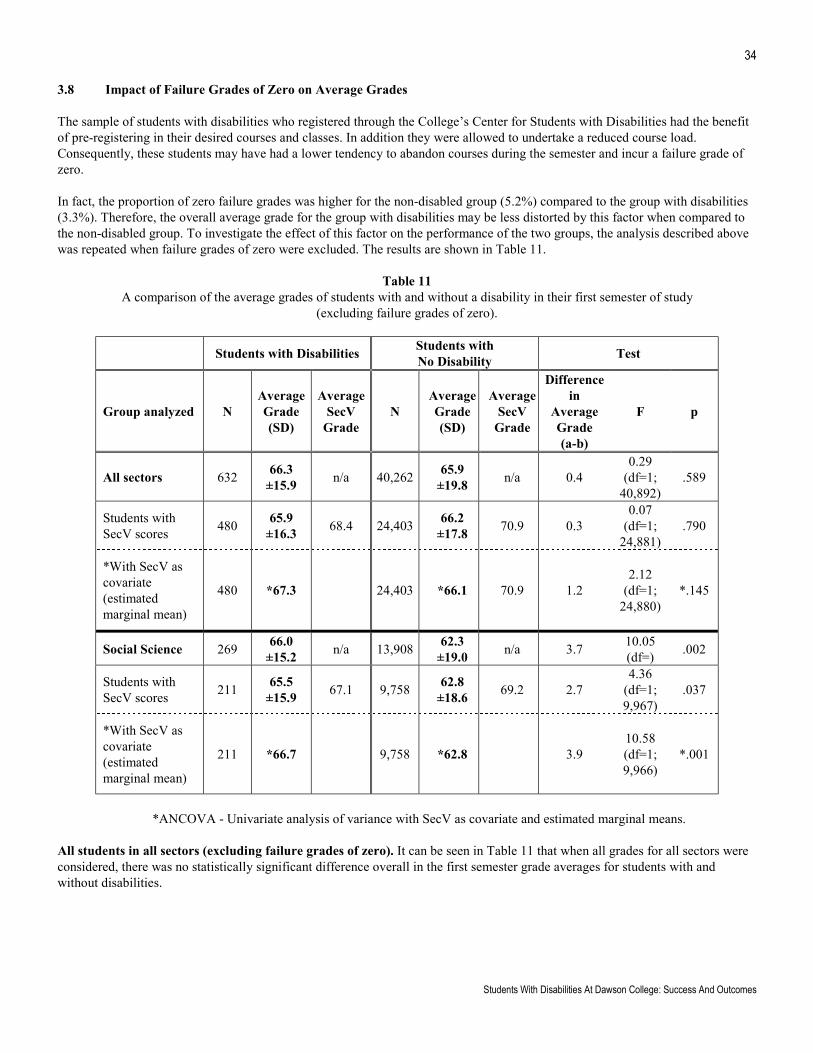
34
Students With Disabilities At Dawson College: Success And Outcomes
3.8 Impact of Failure Grades of Zero on Average Grades
The sample of students with disabilities who registered through the College’s Center for Students with Disabilities had the benefitof pre-registering in their desired courses and classes. In addition they were allowed to undertake a reduced course load.Consequently, these students may have had a lower tendency to abandon courses during the semester and incur a failure grade ofzero.
In fact, the proportion of zero failure grades was higher for the non-disabled group (5.2%) compared to the group with disabilities(3.3%). Therefore, the overall average grade for the group with disabilities may be less distorted by this factor when compared tothe non-disabled group. To investigate the effect of this factor on the performance of the two groups, the analysis described abovewas repeated when failure grades of zero were excluded. The results are shown in Table 11.
Table 11A comparison of the average grades of students with and without a disability in their first semester of study
(excluding failure grades of zero).
Students with Disabilities Students withNo Disability Test
Group analyzed NAverageGrade(SD)
AverageSecV
GradeN
AverageGrade(SD)
AverageSecV
Grade
Differencein
AverageGrade(a-b)
F p
All sectors 632 66.3±15.9 n/a 40,262 65.9
±19.8 n/a 0.40.29
(df=1;40,892)
.589
Students withSecV scores 480 65.9
±16.3 68.4 24,403 66.2±17.8 70.9 0.3
0.07(df=1;
24,881).790
*With SecV ascovariate(estimatedmarginal mean)
480 *67.3 24,403 *66.1 70.9 1.22.12
(df=1;24,880)
*.145
Social Science 269 66.0±15.2 n/a 13,908 62.3
±19.0 n/a 3.7 10.05(df=) .002
Students withSecV scores 211 65.5
±15.9 67.1 9,758 62.8±18.6 69.2 2.7
4.36(df=1;9,967)
.037
*With SecV ascovariate(estimatedmarginal mean)
211 *66.7 9,758 *62.8 3.910.58(df=1;9,966)
*.001
*ANCOVA - Univariate analysis of variance with SecV as covariate and estimated marginal means.
All students in all sectors (excluding failure grades of zero). It can be seen in Table 11 that when all grades for all sectors wereconsidered, there was no statistically significant difference overall in the first semester grade averages for students with andwithout disabilities.
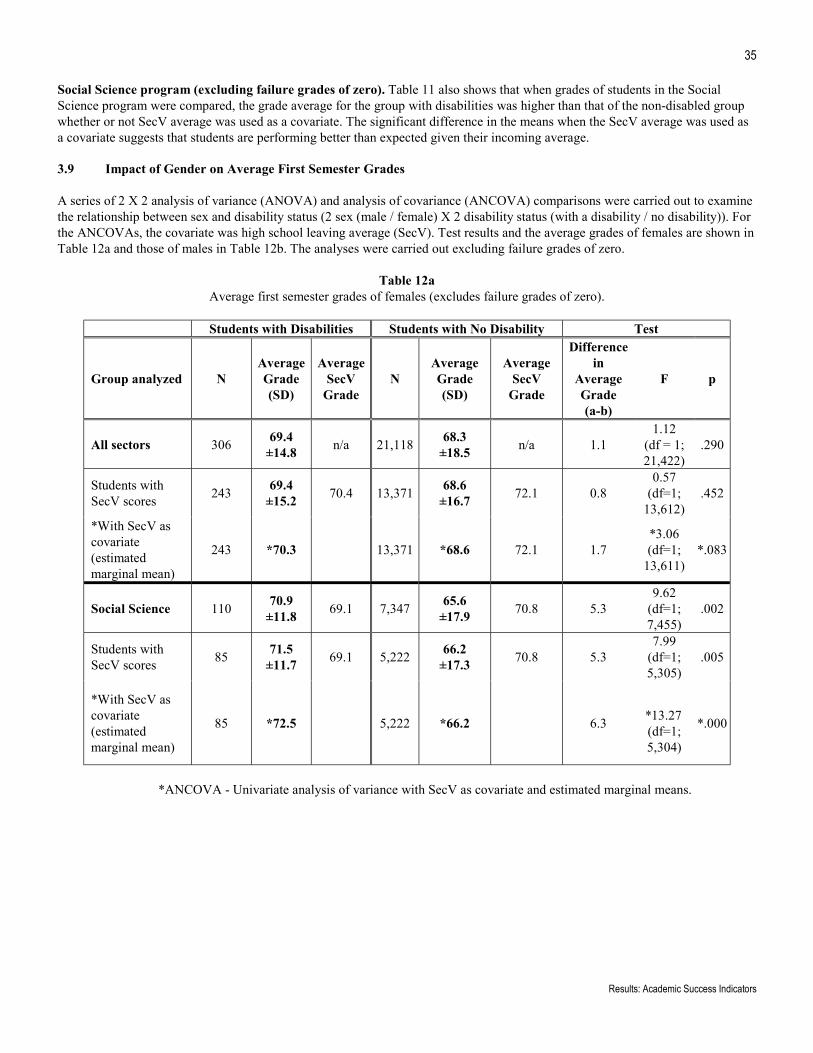
35
Results: Academic Success Indicators
Social Science program (excluding failure grades of zero). Table 11 also shows that when grades of students in the SocialScience program were compared, the grade average for the group with disabilities was higher than that of the non-disabled groupwhether or not SecV average was used as a covariate. The significant difference in the means when the SecV average was used asa covariate suggests that students are performing better than expected given their incoming average.
3.9 Impact of Gender on Average First Semester Grades
A series of 2 X 2 analysis of variance (ANOVA) and analysis of covariance (ANCOVA) comparisons were carried out to examinethe relationship between sex and disability status (2 sex (male / female) X 2 disability status (with a disability / no disability)). Forthe ANCOVAs, the covariate was high school leaving average (SecV). Test results and the average grades of females are shown inTable 12a and those of males in Table 12b. The analyses were carried out excluding failure grades of zero.
Table 12aAverage first semester grades of females (excludes failure grades of zero).
Students with Disabilities Students with No Disability Test
Group analyzed NAverageGrade(SD)
AverageSecV
GradeN
AverageGrade(SD)
AverageSecV
Grade
Differencein
AverageGrade(a-b)
F p
All sectors 306 69.4±14.8 n/a 21,118 68.3
±18.5 n/a 1.11.12
(df = 1;21,422)
.290
Students withSecV scores 243 69.4
±15.2 70.4 13,371 68.6±16.7 72.1 0.8
0.57(df=1;
13,612).452
*With SecV ascovariate(estimatedmarginal mean)
243 *70.3 13,371 *68.6 72.1 1.7*3.06(df=1;
13,611)*.083
Social Science 110 70.9±11.8 69.1 7,347 65.6
±17.9 70.8 5.39.62
(df=1;7,455)
.002
Students withSecV scores 85 71.5
±11.7 69.1 5,222 66.2±17.3 70.8 5.3
7.99(df=1;5,305)
.005
*With SecV ascovariate(estimatedmarginal mean)
85 *72.5 5,222 *66.2 6.3 *13.27(df=1;5,304)
*.000
*ANCOVA - Univariate analysis of variance with SecV as covariate and estimated marginal means.
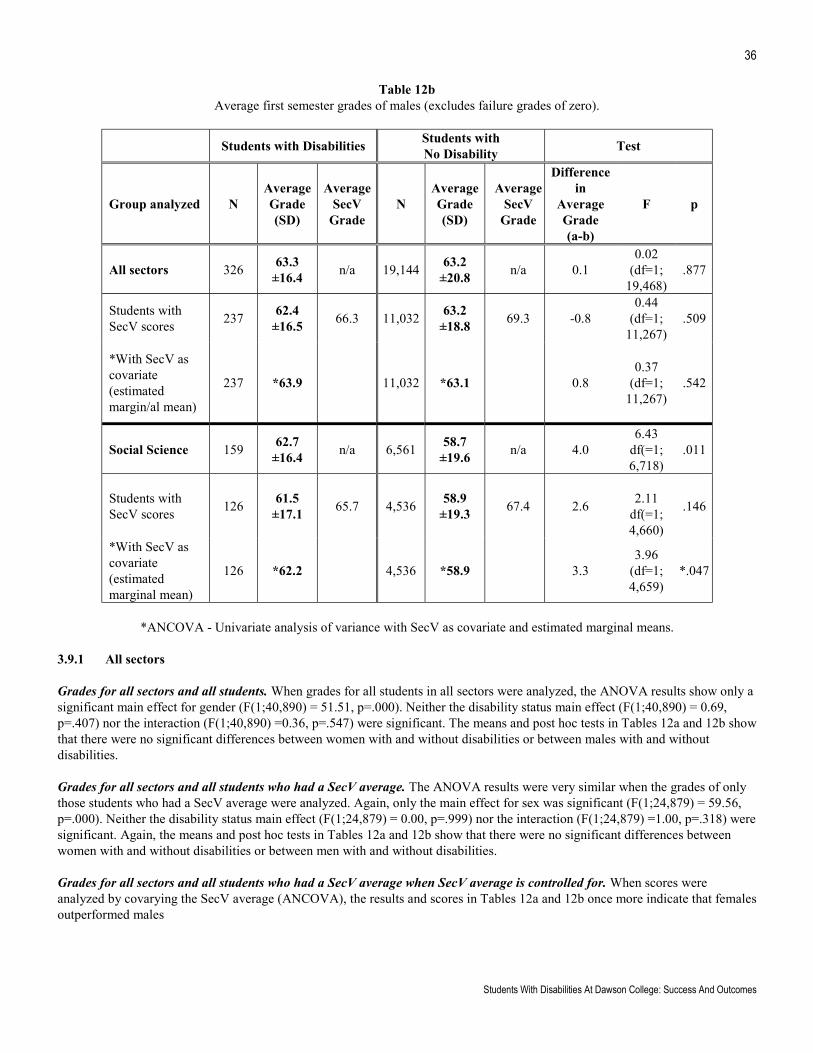
36
Students With Disabilities At Dawson College: Success And Outcomes
Table 12bAverage first semester grades of males (excludes failure grades of zero).
Students with Disabilities Students withNo Disability Test
Group analyzed NAverageGrade(SD)
AverageSecV
GradeN
AverageGrade(SD)
AverageSecV
Grade
Differencein
AverageGrade(a-b)
F p
All sectors 326 63.3±16.4 n/a 19,144 63.2
±20.8 n/a 0.10.02
(df=1;19,468)
.877
Students withSecV scores 237 62.4
±16.5 66.3 11,032 63.2±18.8 69.3 -0.8
0.44(df=1;
11,267).509
*With SecV ascovariate(estimatedmargin/al mean)
237 *63.9 11,032 *63.1 0.80.37
(df=1;11,267)
.542
Social Science 159 62.7±16.4 n/a 6,561 58.7
±19.6 n/a 4.06.43
df(=1;6,718)
.011
Students withSecV scores 126 61.5
±17.1 65.7 4,536 58.9±19.3 67.4 2.6 2.11
df(=1;4,660)
.146
*With SecV ascovariate(estimatedmarginal mean)
126 *62.2 4,536 *58.9 3.33.96
(df=1;4,659)
*.047
*ANCOVA - Univariate analysis of variance with SecV as covariate and estimated marginal means.
3.9.1 All sectors
Grades for all sectors and all students. When grades for all students in all sectors were analyzed, the ANOVA results show only asignificant main effect for gender (F(1;40,890) = 51.51, p=.000). Neither the disability status main effect (F(1;40,890) = 0.69,p=.407) nor the interaction (F(1;40,890) =0.36, p=.547) were significant. The means and post hoc tests in Tables 12a and 12b showthat there were no significant differences between women with and without disabilities or between males with and withoutdisabilities.
Grades for all sectors and all students who had a SecV average. The ANOVA results were very similar when the grades of onlythose students who had a SecV average were analyzed. Again, only the main effect for sex was significant (F(1;24,879) = 59.56,p=.000). Neither the disability status main effect (F(1;24,879) = 0.00, p=.999) nor the interaction (F(1;24,879) =1.00, p=.318) weresignificant. Again, the means and post hoc tests in Tables 12a and 12b show that there were no significant differences betweenwomen with and without disabilities or between men with and without disabilities.
Grades for all sectors and all students who had a SecV average when SecV average is controlled for. When scores wereanalyzed by covarying the SecV average (ANCOVA), the results and scores in Tables 12a and 12b once more indicate that femalesoutperformed males
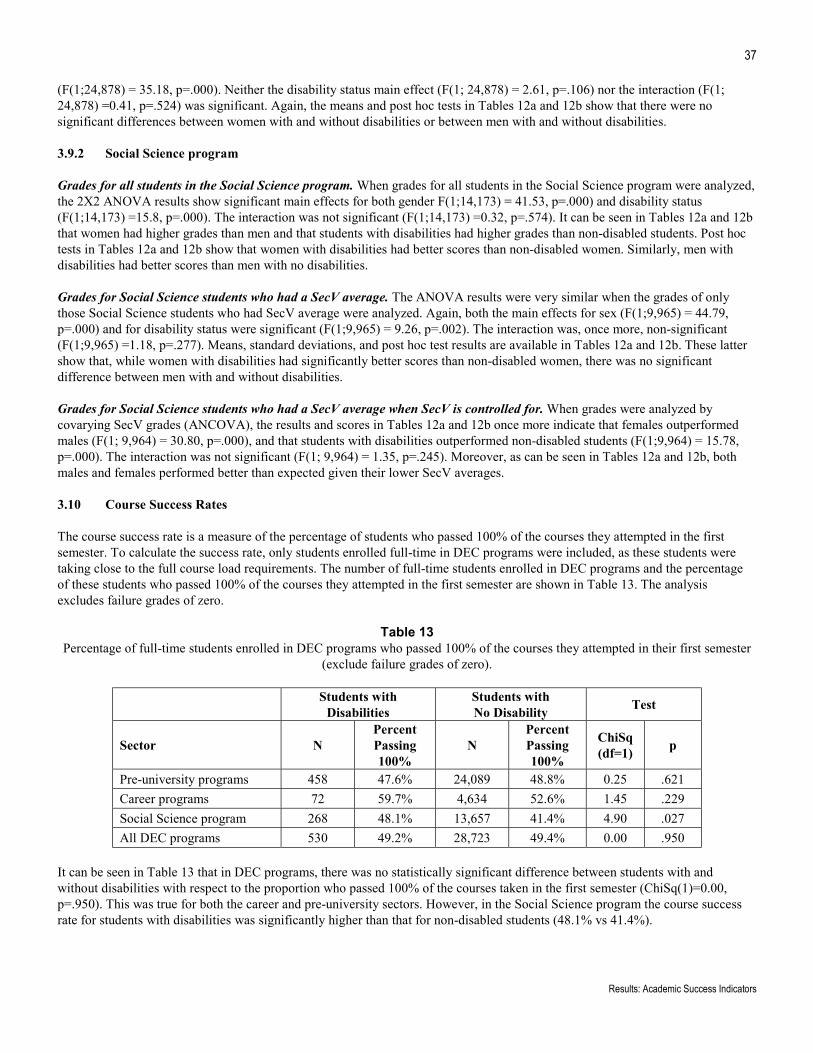
37
Results: Academic Success Indicators
(F(1;24,878) = 35.18, p=.000). Neither the disability status main effect (F(1; 24,878) = 2.61, p=.106) nor the interaction (F(1;24,878) =0.41, p=.524) was significant. Again, the means and post hoc tests in Tables 12a and 12b show that there were nosignificant differences between women with and without disabilities or between men with and without disabilities.
3.9.2 Social Science program
Grades for all students in the Social Science program. When grades for all students in the Social Science program were analyzed,the 2X2 ANOVA results show significant main effects for both gender F(1;14,173) = 41.53, p=.000) and disability status(F(1;14,173) =15.8, p=.000). The interaction was not significant (F(1;14,173) =0.32, p=.574). It can be seen in Tables 12a and 12bthat women had higher grades than men and that students with disabilities had higher grades than non-disabled students. Post hoctests in Tables 12a and 12b show that women with disabilities had better scores than non-disabled women. Similarly, men withdisabilities had better scores than men with no disabilities.
Grades for Social Science students who had a SecV average. The ANOVA results were very similar when the grades of onlythose Social Science students who had SecV average were analyzed. Again, both the main effects for sex (F(1;9,965) = 44.79,p=.000) and for disability status were significant (F(1;9,965) = 9.26, p=.002). The interaction was, once more, non-significant(F(1;9,965) =1.18, p=.277). Means, standard deviations, and post hoc test results are available in Tables 12a and 12b. These lattershow that, while women with disabilities had significantly better scores than non-disabled women, there was no significantdifference between men with and without disabilities.
Grades for Social Science students who had a SecV average when SecV is controlled for. When grades were analyzed bycovarying SecV grades (ANCOVA), the results and scores in Tables 12a and 12b once more indicate that females outperformedmales (F(1; 9,964) = 30.80, p=.000), and that students with disabilities outperformed non-disabled students (F(1;9,964) = 15.78,p=.000). The interaction was not significant (F(1; 9,964) = 1.35, p=.245). Moreover, as can be seen in Tables 12a and 12b, bothmales and females performed better than expected given their lower SecV averages.
3.10 Course Success Rates
The course success rate is a measure of the percentage of students who passed 100% of the courses they attempted in the firstsemester. To calculate the success rate, only students enrolled full-time in DEC programs were included, as these students weretaking close to the full course load requirements. The number of full-time students enrolled in DEC programs and the percentageof these students who passed 100% of the courses they attempted in the first semester are shown in Table 13. The analysisexcludes failure grades of zero.
Table 13Percentage of full-time students enrolled in DEC programs who passed 100% of the courses they attempted in their first semester
(exclude failure grades of zero).
Students withDisabilities
Students withNo Disability Test
Sector NPercentPassing100%
NPercentPassing100%
ChiSq(df=1) p
Pre-university programs 458 47.6% 24,089 48.8% 0.25 .621Career programs 72 59.7% 4,634 52.6% 1.45 .229Social Science program 268 48.1% 13,657 41.4% 4.90 .027All DEC programs 530 49.2% 28,723 49.4% 0.00 .950
It can be seen in Table 13 that in DEC programs, there was no statistically significant difference between students with andwithout disabilities with respect to the proportion who passed 100% of the courses taken in the first semester (ChiSq(1)=0.00,p=.950). This was true for both the career and pre-university sectors. However, in the Social Science program the course successrate for students with disabilities was significantly higher than that for non-disabled students (48.1% vs 41.4%).
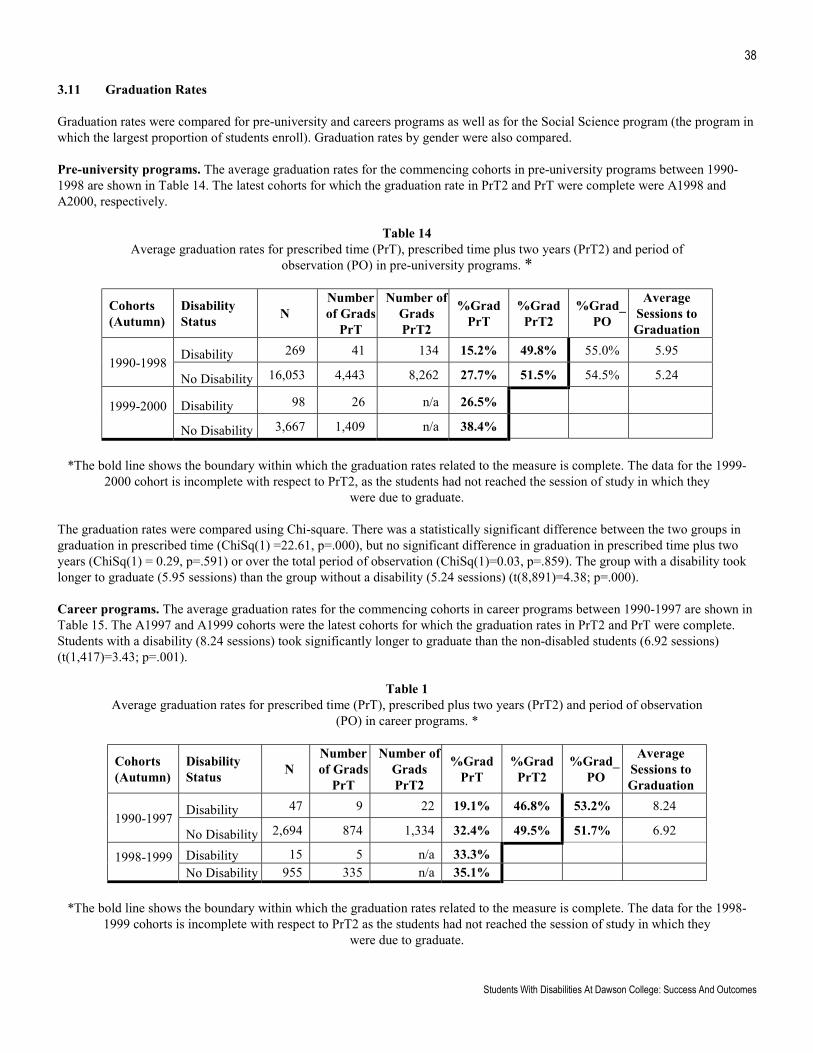
38
Students With Disabilities At Dawson College: Success And Outcomes
3.11 Graduation Rates
Graduation rates were compared for pre-university and careers programs as well as for the Social Science program (the program inwhich the largest proportion of students enroll). Graduation rates by gender were also compared.
Pre-university programs. The average graduation rates for the commencing cohorts in pre-university programs between 1990-1998 are shown in Table 14. The latest cohorts for which the graduation rate in PrT2 and PrT were complete were A1998 andA2000, respectively.
Table 14Average graduation rates for prescribed time (PrT), prescribed time plus two years (PrT2) and period of
observation (PO) in pre-university programs. *
Cohorts(Autumn)
DisabilityStatus N
Numberof Grads
PrT
Number ofGradsPrT2
%GradPrT
%GradPrT2
%Grad_PO
AverageSessions toGraduation
Disability 269 41 134 15.2% 49.8% 55.0% 5.951990-1998 No Disability 16,053 4,443 8,262 27.7% 51.5% 54.5% 5.24
Disability 98 26 n/a 26.5%1999-2000 No Disability 3,667 1,409 n/a 38.4%
*The bold line shows the boundary within which the graduation rates related to the measure is complete. The data for the 1999-2000 cohort is incomplete with respect to PrT2, as the students had not reached the session of study in which they
were due to graduate.
The graduation rates were compared using Chi-square. There was a statistically significant difference between the two groups ingraduation in prescribed time (ChiSq(1) =22.61, p=.000), but no significant difference in graduation in prescribed time plus twoyears (ChiSq(1) = 0.29, p=.591) or over the total period of observation (ChiSq(1)=0.03, p=.859). The group with a disability tooklonger to graduate (5.95 sessions) than the group without a disability (5.24 sessions) (t(8,891)=4.38; p=.000).
Career programs. The average graduation rates for the commencing cohorts in career programs between 1990-1997 are shown inTable 15. The A1997 and A1999 cohorts were the latest cohorts for which the graduation rates in PrT2 and PrT were complete.Students with a disability (8.24 sessions) took significantly longer to graduate than the non-disabled students (6.92 sessions)(t(1,417)=3.43; p=.001).
Table 1Average graduation rates for prescribed time (PrT), prescribed plus two years (PrT2) and period of observation
(PO) in career programs. *
Cohorts(Autumn)
DisabilityStatus N
Numberof Grads
PrT
Number ofGradsPrT2
%GradPrT
%GradPrT2
%Grad_PO
AverageSessions toGraduation
Disability 47 9 22 19.1% 46.8% 53.2% 8.241990-1997 No Disability 2,694 874 1,334 32.4% 49.5% 51.7% 6.92
Disability 15 5 n/a 33.3%1998-1999 No Disability 955 335 n/a 35.1%
*The bold line shows the boundary within which the graduation rates related to the measure is complete. The data for the 1998-1999 cohorts is incomplete with respect to PrT2 as the students had not reached the session of study in which they
were due to graduate.
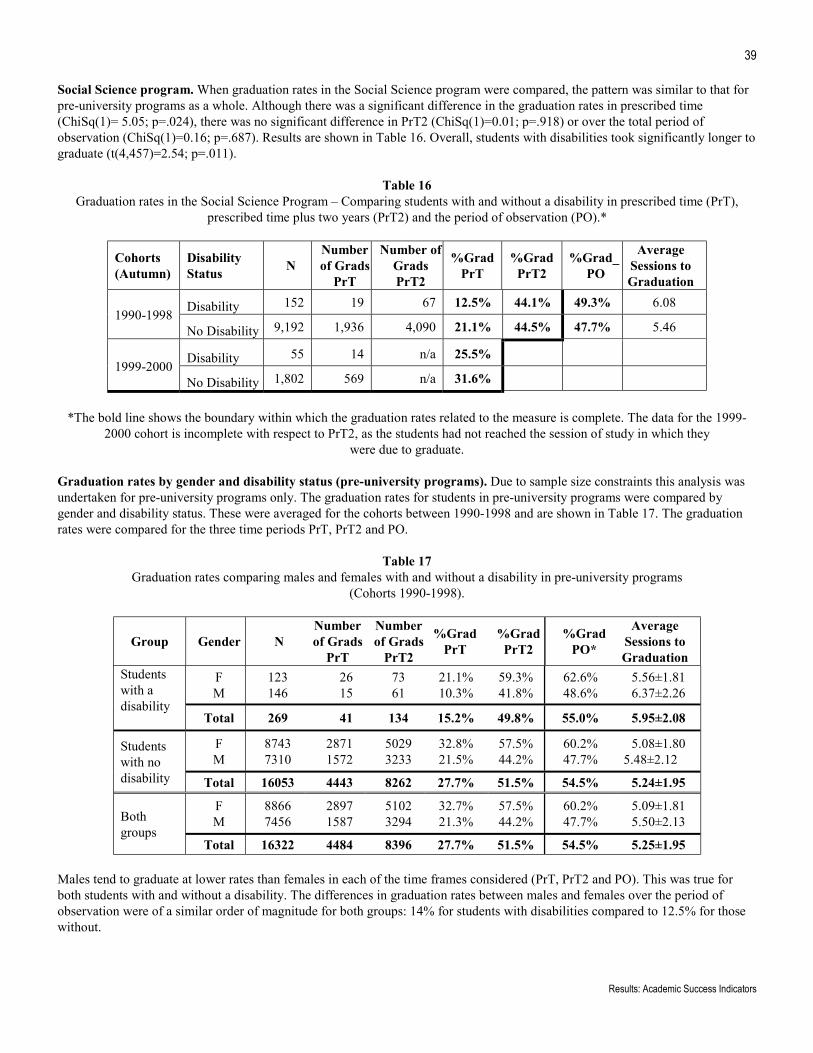
39
Results: Academic Success Indicators
Social Science program. When graduation rates in the Social Science program were compared, the pattern was similar to that forpre-university programs as a whole. Although there was a significant difference in the graduation rates in prescribed time(ChiSq(1)= 5.05; p=.024), there was no significant difference in PrT2 (ChiSq(1)=0.01; p=.918) or over the total period ofobservation (ChiSq(1)=0.16; p=.687). Results are shown in Table 16. Overall, students with disabilities took significantly longer tograduate (t(4,457)=2.54; p=.011).
Table 16Graduation rates in the Social Science Program – Comparing students with and without a disability in prescribed time (PrT),
prescribed time plus two years (PrT2) and the period of observation (PO).*
Cohorts(Autumn)
DisabilityStatus N
Numberof Grads
PrT
Number ofGradsPrT2
%GradPrT
%GradPrT2
%Grad_PO
AverageSessions toGraduation
Disability 152 19 67 12.5% 44.1% 49.3% 6.081990-1998 No Disability 9,192 1,936 4,090 21.1% 44.5% 47.7% 5.46
Disability 55 14 n/a 25.5%1999-2000 No Disability 1,802 569 n/a 31.6%
*The bold line shows the boundary within which the graduation rates related to the measure is complete. The data for the 1999-2000 cohort is incomplete with respect to PrT2, as the students had not reached the session of study in which they
were due to graduate.
Graduation rates by gender and disability status (pre-university programs). Due to sample size constraints this analysis wasundertaken for pre-university programs only. The graduation rates for students in pre-university programs were compared bygender and disability status. These were averaged for the cohorts between 1990-1998 and are shown in Table 17. The graduationrates were compared for the three time periods PrT, PrT2 and PO.
Table 17Graduation rates comparing males and females with and without a disability in pre-university programs
(Cohorts 1990-1998).
Group Gender NNumberof Grads
PrT
Numberof Grads
PrT2
%GradPrT
%GradPrT2
%GradPO*
AverageSessions toGraduation
FM
123146
2615
7361
21.1%10.3%
59.3%41.8%
62.6%48.6%
5.56±1.816.37±2.26
Studentswith adisability
Total 269 41 134 15.2% 49.8% 55.0% 5.95±2.08
FM
87437310
28711572
50293233
32.8%21.5%
57.5%44.2%
60.2%47.7%
5.08±1.805.48±2.12
Studentswith nodisability Total 16053 4443 8262 27.7% 51.5% 54.5% 5.24±1.95
FM
88667456
28971587
51023294
32.7%21.3%
57.5%44.2%
60.2%47.7%
5.09±1.815.50±2.13Both
groupsTotal 16322 4484 8396 27.7% 51.5% 54.5% 5.25±1.95
Males tend to graduate at lower rates than females in each of the time frames considered (PrT, PrT2 and PO). This was true forboth students with and without a disability. The differences in graduation rates between males and females over the period ofobservation were of a similar order of magnitude for both groups: 14% for students with disabilities compared to 12.5% for thosewithout.
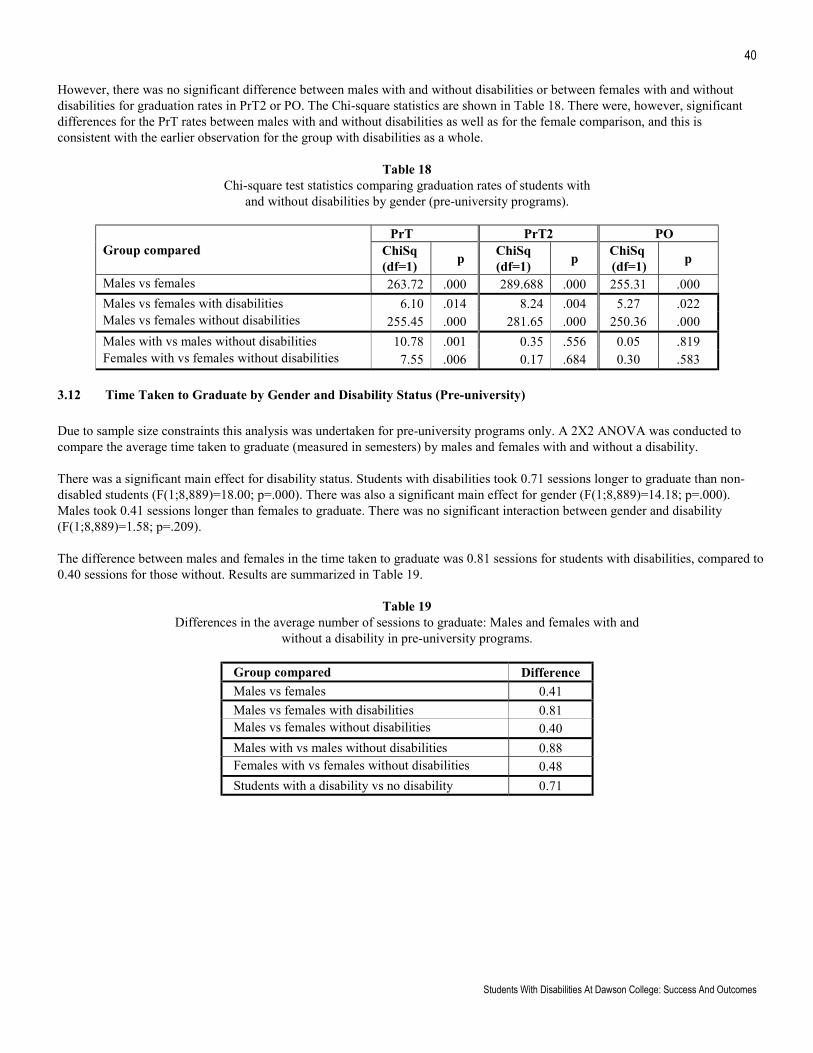
40
Students With Disabilities At Dawson College: Success And Outcomes
However, there was no significant difference between males with and without disabilities or between females with and withoutdisabilities for graduation rates in PrT2 or PO. The Chi-square statistics are shown in Table 18. There were, however, significantdifferences for the PrT rates between males with and without disabilities as well as for the female comparison, and this isconsistent with the earlier observation for the group with disabilities as a whole.
Table 18Chi-square test statistics comparing graduation rates of students with
and without disabilities by gender (pre-university programs).
PrT PrT2 POGroup compared ChiSq
(df=1) p ChiSq(df=1) p ChiSq
(df=1) p
Males vs females 263.72 .000 289.688 .000 255.31 .000Males vs females with disabilities 6.10 .014 8.24 .004 5.27 .022Males vs females without disabilities 255.45 .000 281.65 .000 250.36 .000Males with vs males without disabilities 10.78 .001 0.35 .556 0.05 .819Females with vs females without disabilities 7.55 .006 0.17 .684 0.30 .583
3.12 Time Taken to Graduate by Gender and Disability Status (Pre-university)
Due to sample size constraints this analysis was undertaken for pre-university programs only. A 2X2 ANOVA was conducted tocompare the average time taken to graduate (measured in semesters) by males and females with and without a disability.
There was a significant main effect for disability status. Students with disabilities took 0.71 sessions longer to graduate than non-disabled students (F(1;8,889)=18.00; p=.000). There was also a significant main effect for gender (F(1;8,889)=14.18; p=.000).Males took 0.41 sessions longer than females to graduate. There was no significant interaction between gender and disability(F(1;8,889)=1.58; p=.209).
The difference between males and females in the time taken to graduate was 0.81 sessions for students with disabilities, compared to0.40 sessions for those without. Results are summarized in Table 19.
Table 19Differences in the average number of sessions to graduate: Males and females with and
without a disability in pre-university programs.
Group compared DifferenceMales vs females 0.41Males vs females with disabilities 0.81Males vs females without disabilities 0.40Males with vs males without disabilities 0.88Females with vs females without disabilities 0.48Students with a disability vs no disability 0.71
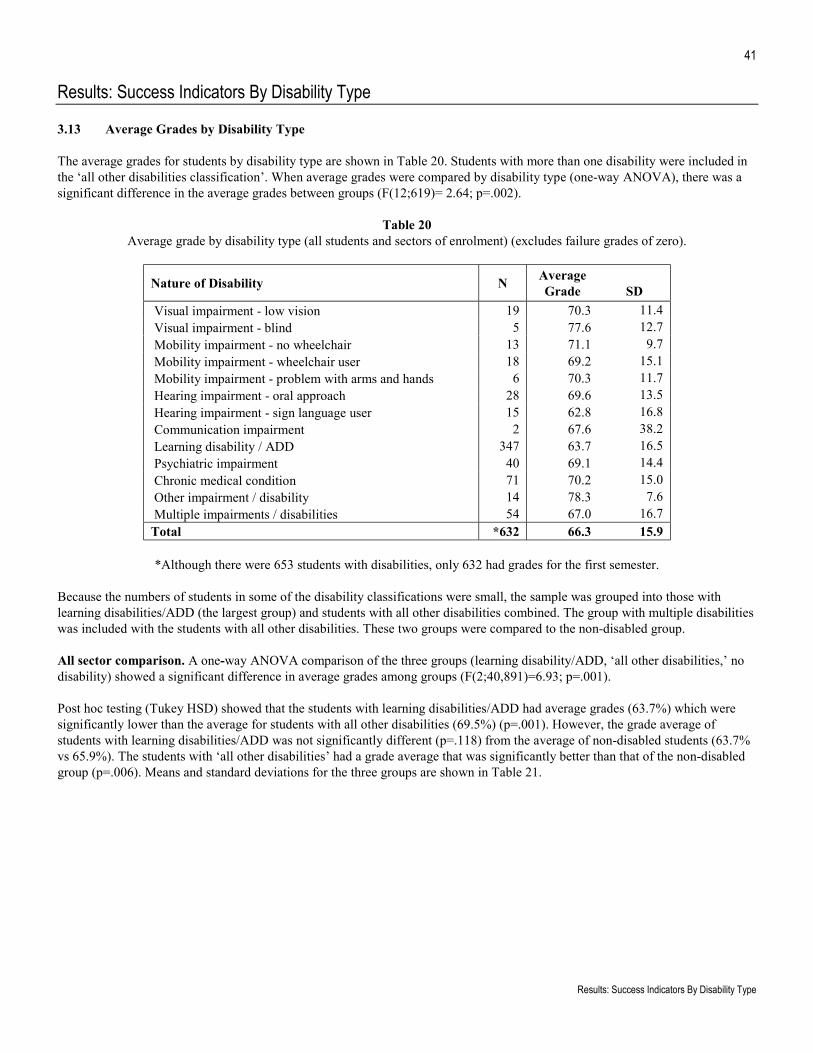
41
Results: Success Indicators By Disability Type
Results: Success Indicators By Disability Type
3.13 Average Grades by Disability Type
The average grades for students by disability type are shown in Table 20. Students with more than one disability were included inthe ‘all other disabilities classification’. When average grades were compared by disability type (one-way ANOVA), there was asignificant difference in the average grades between groups (F(12;619)= 2.64; p=.002).
Table 20Average grade by disability type (all students and sectors of enrolment) (excludes failure grades of zero).
Nature of Disability N AverageGrade SD
Visual impairment - low vision 19 70.3 11.4 Visual impairment - blind 5 77.6 12.7 Mobility impairment - no wheelchair 13 71.1 9.7 Mobility impairment - wheelchair user 18 69.2 15.1 Mobility impairment - problem with arms and hands 6 70.3 11.7 Hearing impairment - oral approach 28 69.6 13.5 Hearing impairment - sign language user 15 62.8 16.8 Communication impairment 2 67.6 38.2 Learning disability / ADD 347 63.7 16.5 Psychiatric impairment 40 69.1 14.4 Chronic medical condition 71 70.2 15.0 Other impairment / disability 14 78.3 7.6 Multiple impairments / disabilities 54 67.0 16.7Total *632 66.3 15.9
*Although there were 653 students with disabilities, only 632 had grades for the first semester.
Because the numbers of students in some of the disability classifications were small, the sample was grouped into those withlearning disabilities/ADD (the largest group) and students with all other disabilities combined. The group with multiple disabilitieswas included with the students with all other disabilities. These two groups were compared to the non-disabled group.
All sector comparison. A one-way ANOVA comparison of the three groups (learning disability/ADD, ‘all other disabilities,’ nodisability) showed a significant difference in average grades among groups (F(2;40,891)=6.93; p=.001).
Post hoc testing (Tukey HSD) showed that the students with learning disabilities/ADD had average grades (63.7%) which weresignificantly lower than the average for students with all other disabilities (69.5%) (p=.001). However, the grade average ofstudents with learning disabilities/ADD was not significantly different (p=.118) from the average of non-disabled students (63.7%vs 65.9%). The students with ‘all other disabilities’ had a grade average that was significantly better than that of the non-disabledgroup (p=.006). Means and standard deviations for the three groups are shown in Table 21.
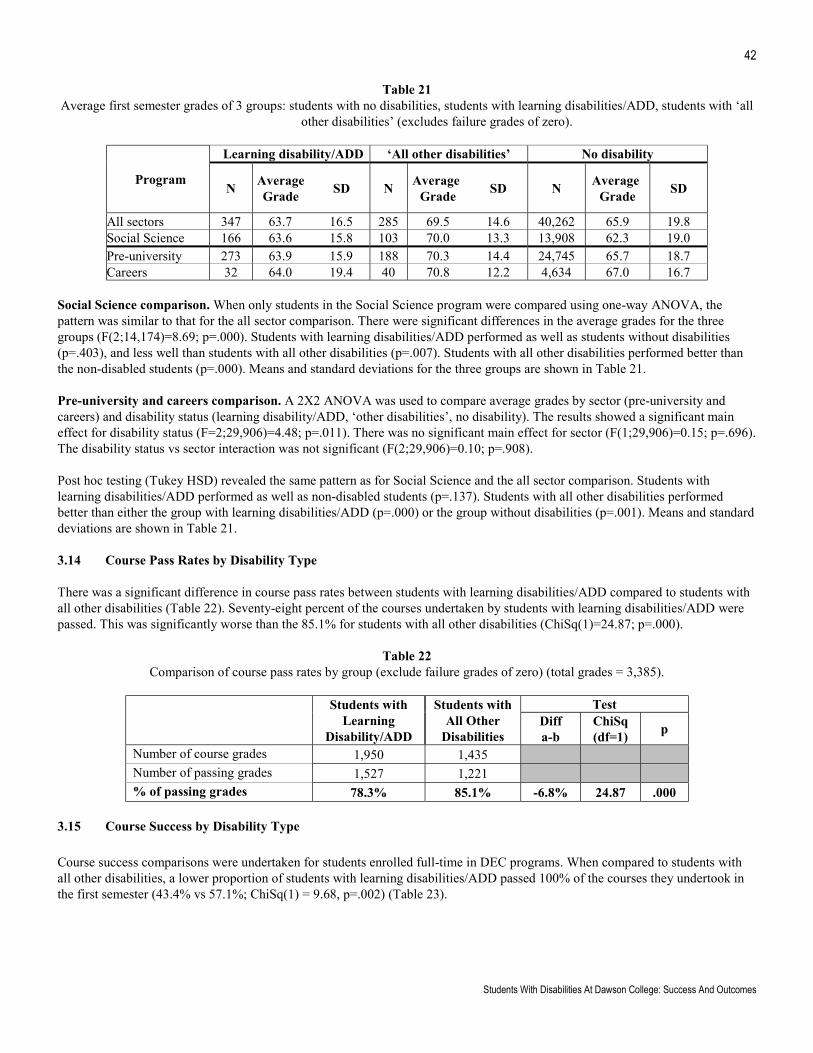
42
Students With Disabilities At Dawson College: Success And Outcomes
Table 21Average first semester grades of 3 groups: students with no disabilities, students with learning disabilities/ADD, students with ‘all
other disabilities’ (excludes failure grades of zero).
Learning disability/ADD ‘All other disabilities’ No disability
ProgramN Average
Grade SD N AverageGrade SD N Average
Grade SD
All sectors 347 63.7 16.5 285 69.5 14.6 40,262 65.9 19.8Social Science 166 63.6 15.8 103 70.0 13.3 13,908 62.3 19.0Pre-university 273 63.9 15.9 188 70.3 14.4 24,745 65.7 18.7Careers 32 64.0 19.4 40 70.8 12.2 4,634 67.0 16.7
Social Science comparison. When only students in the Social Science program were compared using one-way ANOVA, thepattern was similar to that for the all sector comparison. There were significant differences in the average grades for the threegroups (F(2;14,174)=8.69; p=.000). Students with learning disabilities/ADD performed as well as students without disabilities(p=.403), and less well than students with all other disabilities (p=.007). Students with all other disabilities performed better thanthe non-disabled students (p=.000). Means and standard deviations for the three groups are shown in Table 21.
Pre-university and careers comparison. A 2X2 ANOVA was used to compare average grades by sector (pre-university andcareers) and disability status (learning disability/ADD, ‘other disabilities’, no disability). The results showed a significant maineffect for disability status (F=2;29,906)=4.48; p=.011). There was no significant main effect for sector (F(1;29,906)=0.15; p=.696).The disability status vs sector interaction was not significant (F(2;29,906)=0.10; p=.908).
Post hoc testing (Tukey HSD) revealed the same pattern as for Social Science and the all sector comparison. Students withlearning disabilities/ADD performed as well as non-disabled students (p=.137). Students with all other disabilities performedbetter than either the group with learning disabilities/ADD (p=.000) or the group without disabilities (p=.001). Means and standarddeviations are shown in Table 21.
3.14 Course Pass Rates by Disability Type
There was a significant difference in course pass rates between students with learning disabilities/ADD compared to students withall other disabilities (Table 22). Seventy-eight percent of the courses undertaken by students with learning disabilities/ADD werepassed. This was significantly worse than the 85.1% for students with all other disabilities (ChiSq(1)=24.87; p=.000).
Table 22Comparison of course pass rates by group (exclude failure grades of zero) (total grades = 3,385).
TestStudents withLearning
Disability/ADD
Students withAll Other
DisabilitiesDiffa-b
ChiSq(df=1) p
Number of course grades 1,950 1,435Number of passing grades 1,527 1,221% of passing grades 78.3% 85.1% -6.8% 24.87 .000
3.15 Course Success by Disability Type
Course success comparisons were undertaken for students enrolled full-time in DEC programs. When compared to students withall other disabilities, a lower proportion of students with learning disabilities/ADD passed 100% of the courses they undertook inthe first semester (43.4% vs 57.1%; ChiSq(1) = 9.68, p=.002) (Table 23).
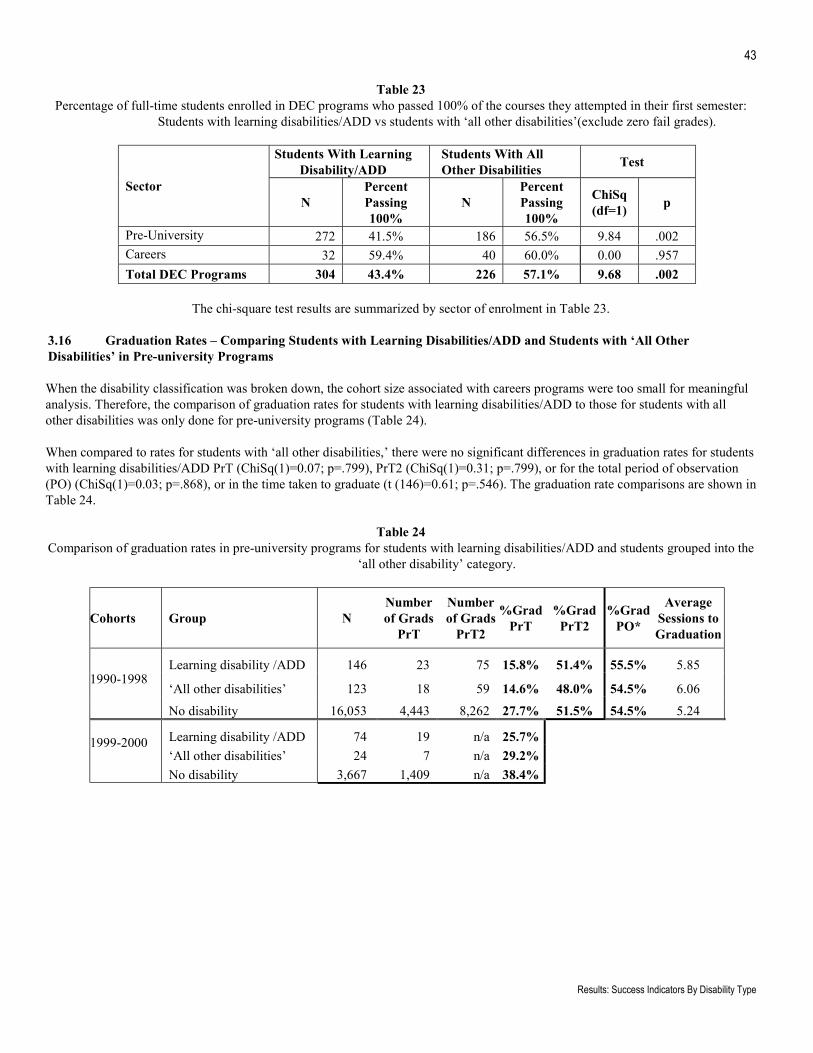
43
Results: Success Indicators By Disability Type
Table 23Percentage of full-time students enrolled in DEC programs who passed 100% of the courses they attempted in their first semester:
Students with learning disabilities/ADD vs students with ‘all other disabilities’(exclude zero fail grades).
Students With LearningDisability/ADD
Students With AllOther Disabilities Test
SectorN
PercentPassing100%
NPercentPassing100%
ChiSq(df=1) p
Pre-University 272 41.5% 186 56.5% 9.84 .002Careers 32 59.4% 40 60.0% 0.00 .957Total DEC Programs 304 43.4% 226 57.1% 9.68 .002
The chi-square test results are summarized by sector of enrolment in Table 23.
3.16 Graduation Rates – Comparing Students with Learning Disabilities/ADD and Students with ‘All OtherDisabilities’ in Pre-university Programs
When the disability classification was broken down, the cohort size associated with careers programs were too small for meaningfulanalysis. Therefore, the comparison of graduation rates for students with learning disabilities/ADD to those for students with allother disabilities was only done for pre-university programs (Table 24).
When compared to rates for students with ‘all other disabilities,’ there were no significant differences in graduation rates for studentswith learning disabilities/ADD PrT (ChiSq(1)=0.07; p=.799), PrT2 (ChiSq(1)=0.31; p=.799), or for the total period of observation(PO) (ChiSq(1)=0.03; p=.868), or in the time taken to graduate (t (146)=0.61; p=.546). The graduation rate comparisons are shown inTable 24.
Table 24Comparison of graduation rates in pre-university programs for students with learning disabilities/ADD and students grouped into the
‘all other disability’ category.
Cohorts Group NNumberof Grads
PrT
Numberof Grads
PrT2
%GradPrT
%GradPrT2
%GradPO*
AverageSessions toGraduation
Learning disability /ADD 146 23 75 15.8% 51.4% 55.5% 5.85
‘All other disabilities’ 123 18 59 14.6% 48.0% 54.5% 6.061990-1998
No disability 16,053 4,443 8,262 27.7% 51.5% 54.5% 5.24
Learning disability /ADD 74 19 n/a 25.7%‘All other disabilities’ 24 7 n/a 29.2%
1999-2000
No disability 3,667 1,409 n/a 38.4%
44
Students With Disabilities At Dawson College: Success And Outcomes
Summary and Discussion
4.1 Summary Of Findings On Academic Outcomes
Students with and without disabilities were compared on four outcome measures: graduation rates, average grades in the firstsemester, course pass rates, and course success rates. For some analyses, students with disabilities were divided into two groups –those with learning disabilities and/or attention deficit disorder (ADD) and those with all other disabilities.
Overview. The findings indicate that students with disabilities at Dawson College had graduation outcomes that were virtuallyidentical to those of non-disabled students. The main difference was that students with disabilities took, on average, approximatelyone semester longer to graduate. When average grades were examined, students with disabilities did at least as well as, and insome cases significantly better, than their non-disabled peers. When students with disabilities were divided into two groups,students with learning disabilities/ADD and students with all other disabilities, the overall trend was for students with learningdisabilities/ADD to have similar or slightly poorer academic outcomes than the non-disabled sample, and for students with allother disabilities to have slightly superior outcomes. Males had poorer results than females on all indicators. This was true for bothstudents with and without disabilities. All of these findings were incredibly robust, and remained consistent through a series ofdifferent evaluations of the constructs investigated.
Graduation rates. Overall, the findings indicate that students with disabilities at Dawson College had graduation outcomes thatwere virtually identical to those of non-disabled students. Although none of the comparisons were significant, in all instances theresults of students with disabilities were slightly higher than those of non-disabled students. The graduation rates for students withlearning disabilities/ADD were not significantly different from those of non-disabled students or those with all other disabilities.The only significant difference was that students with disabilities took, on average, approximately one semester longer to graduate.Females had better outcomes than males, regardless of disability status.
Average grades. When average grades were examined, students with disabilities did at least as well as, and in some casessignificantly better, than their non-disabled peers. The overall trend was for students with learning disabilities/ADD to have similaror slightly poorer academic outcomes than the non-disabled sample, and for students with all other disabilities to have slightlysuperior outcomes which were significant for several comparisons. Females had better grade averages than males. This was truefor both students with and without disabilities. Students with disabilities entered Dawson College with lower high school gradesthan students without disabilities; the analyses indicate that in some cases they performed better than would have been predicted bytheir incoming grades.
Course pass rates. Overall, all students passed approximately 80% of the courses for which they were registered in the firstsemester. Again, students with disabilities did at least as well as, and in some cases significantly better, than their non-disabledpeers. Here, too, the overall trend was for students with learning disabilities/ADD to have similar or slightly poorer academicoutcomes than the non-disabled sample, and for students with all other disabilities to have slightly superior outcomes which weresignificant for several comparisons.
Course success. The proportion of students enrolled in full-time diploma programs who passed 100% of their first semestercourses was approximately 50% for the whole sample. Here, too, students with disabilities did at least as well as, and in somecases significantly better, than their non-disabled peers. Once more, the overall trend was for students with learningdisabilities/ADD to have similar or slightly poorer academic outcomes than the non-disabled sample, and for students with allother disabilities to have slightly superior outcomes which were significant for several comparisons.
45
Summary and Discussion
4.2 Summary Of Findings On Sample Characteristics
Data from the Dawson College records contained information on aspects such as sex, mother tongue, place of birth, age, incominghigh school average and the program in which the student first enrolled. The data on these variables show both similarities anddifferences.
Demographics. There were several differences between the samples of students with and without disabilities. These include: (1) alarger proportion of the sample of students with disabilities was male while a larger proportion of non-disabled students wasfemale; (2) students with disabilities were more likely than their non-disabled peers to have English as their mother tongue and (3)to be born in Canada or the USA than was the case for the non-disabled sample. All of these differences were statisticallysignificant.
Academic preparation and choices. Students with disabilities entered Dawson College with significantly lower high schoolleaving averages (3% lower) than non-disabled students. They were more likely to enroll in pre-university and career diplomaprograms than non-disabled students, while the converse was true for continuing education. The most popular diploma program forthe majority of students with and without disabilities was the pre-university Social Science program. In diploma programs,students with disabilities took, on average, approximately one less course per semester than their non-disabled peers.
Age. The mean age of students entering Dawson College diploma programs was between 18 and 19. There was no significantdifference in the average age between students with and without disabilities in either pre-university studies or in career programs.Because students with disabilities were found to take approximately one additional semester to graduate, it is possible that theywere older than non-disabled students when they graduated.
Students entering continuing education were substantially older than those entering diploma programs: between 25 and 28. Therewere relatively few students with disabilities in continuing education compared to non-disabled students. The continuing educationstudents with disabilities were, however, significantly younger than the large number of non-disabled continuing educationstudents. This resulted in the finding that, overall, at the time of enrollment, students with disabilities at Dawson College weresomewhat younger than non-disabled students. This was due, primarily, to the larger proportion of older non-disabled studentsregistered in continuing education courses.
Types of disabilities. By far the largest proportion of students with disabilities had a learning disability and/or attention deficitdisorder (53%). This was followed, in rank order, by students with chronic medical conditions (14%), psychiatric (8%) andmobility impairments (8%), hearing impairments (7%), visual impairments (5%), difficulty using one’s arms and hands (3%), andcommunication impairments (1%). Approximately 8% of the sample had multiple impairments. This 8% is likely to be anunderestimation because it was the practice of the Center for Students with Disabilities to record only the “primary” disability orimpairment as defined by the need for accommodations.
46
Students With Disabilities At Dawson College: Success And Outcomes
4.3 Limitations Of The Investigation And Generalizability Of The Findings
Although the samples of students both with and without disabilities are large and represent a 12 year span, there are severallimitations of this investigation that must be considered in the interpretation and generalizability of the findings. Nevertheless, wedo not believe that the overall pattern of the findings is in any way compromised.
a. The data were obtained at one institution only: Dawson College.
Even though our data were obtained from only one college, data from other studies have shown similar results. Forexample, data from British Columbia’s public colleges and institutes show that the GPAs of students with and withoutdisabilities are virtually identical (2.94 vs 2.95, respectively), regardless of program attended (Outcomes Group, 1998).Reflective of our own findings, results from Gavilan College (2002) in the United States show that students with learningdisabilities performed at or below the level of non-disabled students, while students with all other disabilities hadsomewhat higher scores. Nevertheless, large scale British studies have shown that academic outcomes of students withand without disabilities are equivalent only when differences in background variables, such as poorer high school grades,are taken into account (Richardson, 2001; Richardson & Roy, 2002).
b. The number of students who registered with the Center for Students with Disabilities is likely to be only a fraction of thetotal sample of students with disabilities at Dawson (Fichten, Asuncion, Barile, Robillard, Fossey, & Lamb, 2003; Officeof Institutional Research, 2002).
Some students with disabilities do not identify themselves to the Center for Students with Disabilities and are, therefore,considered to be part of the sample of non-disabled students. Given the large size of the sample of students without adisability, the inclusion of these students in the non-disabled group is likely to have only a very minor impact.
c. Record keeping practices of the Center for Students with Disabilities probably underestimate the number of disabilitieseach student had (cf. Fichten, Asuncion, Barile, Fossey, & Robillard, 2001).
The underestimation of the number of students’ disabilities in no way influences the overall performance of the sample ofstudents with disabilities.
d. Given the retrospective, archival nature of the study, there are inevitably missing pieces of data.While this is true, this is true of both samples.
e. Except for graduation rates, we examined performance of students only in the first semester.
Although we examined the performance of students only in the first semester, the graduation rate data, which reflectoverall outcome across all semesters, shows results that are very similar to the other indices.
f. Students with and without disabilities were registered in different types of programs with different graduation rates andgrade averages. While students with disabilities were more likely to be enrolled in diploma programs than were non-disabled students, most students, both those with and without disabilities, were enrolled in the Social Science pre-university diploma program. In addition to analyzing the outcomes of all students, we also analyzed outcomes for thelarge subgroup of students who were enrolled Social Science. Because course requirements for these students weresimilar, differences due to discrepancies in field of study were not likely to influence the results. When we did this, theresults were more sharply focused to show the overall pattern, and many findings in favor of students with disabilities thatwere not evident when “all students in all programs” were considered became significant.
g. The graduation rates reported will underestimate the true rate at which students graduate from college, since the figuresdo not account for students who may have left Dawson and completed their studies at another cegep.
Although this is the case, there is no reason to assume that the proportions are different for students with and withoutdisabilities.

47
Summary and Discussion
Other indices which suggest that our results are valid include the following points.
In Hypothesis 1, we predicted that disability status will be an important variable when time taken to graduate is evaluated and that othersuccess criteria, such as grades, would not be affected by having a disability. The findings confirm the first part of this hypothesis; thedata show that it took, on average, approximately one semester longer for students with than students without disabilities to graduate.
The second premise of this hypothesis needs some clarification, however. We expected that students with and without disabilitieswould have similar success outcomes on most variables studied. Overall, this was, indeed, the case. When outcomes of all studentswith disabilities were evaluated, for the most part there was either no significant difference, or the difference was significant infavor of students with disabilities. The unexpected finding was that when we grouped students into those with learningdisabilities/ADD and those with all other disabilities, the latter group outperformed non-disabled students on many indices.
In Hypothesis 2 we predicted that there was reason to believe that students with learning disabilities/ADD may perform at a leveldifferent from students with other disabilities. We made no predictions about the direction of the difference. What our findingsshow is that students with learning disabilities/ADD had similar or slightly poorer outcomes than non-disabled students. Becausethey generally outperformed non-disabled students, students with disabilities other than learning disability/ADD also had betteroutcomes than students with learning disabilities/ADD.
Consistent with Hypothesis 3, individual factors that predict success for non-disabled students were found to be importantpredictors of success for students with disabilities as well. The same variables, such as sex and high school grades, which areknown to influence performance in college, did so for both groups. The correlation coefficients between high school and cegepgrades for the 2 groups (i.e.,.98 and.99) were virtually identical.
Similarly, consistent with Hypothesis 4, where we predicted that females would have better success outcomes than males,regardless of disability status, females outperformed males for both groups on all variables investigated. Consistent with findingsreported by Henderson (1999) for American students entering postsecondary education, in our study, too, there were more malestudents with disabilities than females entering cegep for the first time. The present study’s finding that women are more likely tograduate than men, regardless of disability status, is also consistent with findings of studies of graduates with disabilities from boththe US (Horn, Peter, & Rooney, 2002) and Canada (Paju, 2000; Taillon & Paju, 1999).
In Hypothesis 5 we predicted that students with disabilities would be over-represented in Social Sciences and in continuingeducation. The first part of this hypothesis was confirmed. The second part was not. Although the pre-university Social Scienceprogram was the most popular diploma program for all students, it was relatively more popular for students with disabilities thanfor students without disabilities.
Our findings also show that both students with and without disabilities were more likely to be enrolled in pre-university studiesthan in career programs. When only those students who chose diploma programs at Dawson were considered, there was nostatistically significant difference in the proportions of students with disabilities (13.5%) and without disabilities (15.7%) whochose to enroll in the careers sector. Studies from community colleges in Canada show that students with disabilities are morelikely to be enrolled in vocational rather than pre-university programs (Outcomes Group, 1999). The low proportion of DawsonCollege students in career programs (relative to pre-university) for both groups is likely to be a reflection of the program mix atDawson College, which is biased toward pre-university programs of study. In addition, there are numerous differences betweencareer programs in the cegep system and in many Canadian colleges. For example, in cegeps (1) vocational programs often havemore demanding entrance requirements than pre-university studies, (2) take a minimum of three years to complete (i.e., at least oneyear longer to complete than pre-university studies), and (3) are very difficult to complete if students do not take the fullcomplement of required courses each semester, in part because pre-requisite courses are often offered only in the fall semester.Also, (4) cegeps, which comprise the Québec public junior/community college system, are distinct from trade and vocationalschools where students can enroll to learn a trade in a year or less.
48
Students With Disabilities At Dawson College: Success And Outcomes
In the second part of Hypothesis 5 we predicted that students with disabilities would be over-represented in evening continuingeducation courses that do not lead to a diploma. The data do not support this hypothesis. In fact, the converse was the case. Wefound that non-disabled students were more likely to be enrolled in continuing education courses than students with disabilities.Nevertheless, students with disabilities were more likely to take a lighter course load than non-disabled students in the samediploma programs. The fact that students with disabilities tended to take a lighter course load is consistent with other investigationswhich have shown that students with disabilities are more likely to study part-time (e.g., Richardson, 2001).
Other aspects of the study also suggest that our findings are valid. First, in many cases the findings from our study were replicatedin the pre-university and the careers programs. Second, the proportion of students with different impairments resembles the overallNorth American pattern of the past decade (e.g., Horn & Berktold, 1999; Fichten, Asuncion, Barile, Fossey, & Robillard, 2001;Fichten, Asuncion, Barile, Fossey, Robillard, Judd, Wolforth, Senécal, Généreux, Guimont, Lamb, & Juhel, in press). Third,Dawson College's graduation rates are comparable to those of the public cegep network (Jorgensen, 2002). Fourth, findings onother aspects are consistent with the literature. For example, the present investigation shows that students with disabilities havepoorer high school grades than non-disabled students. This is consistent with findings reported both in American (e.g., Horn &Berktold, 1999) as well as British studies (e.g., Richardson, 2001; Richardson & Roy, 2002). Fifth, students in the presentinvestigation were more likely to be Canadian or US born and to have English as their mother tongue compared to non-disabledstudents. This too, is similar to findings showing that students with disabilities were less likely to be members of ethic minoritiesboth in the United Kingdom (e.g., Richardson, 2001) as well as in America (e.g., Horn & Berktold, 1999).
A key departure from our findings is that most investigations have found that students with disabilities are older than their non-disabled peers (e.g., Amsel, & Fichten, 1990; Fichten, Goodrick, Tagalakis, Amsel, & Libman, 1990; Horn & Berktold, 1999;Richardson & Roy, 2002; Richardson, 2001). However, most such studies evaluated the age of students currently enrolled, whilein the present investigation age data were collected at the time of initial enrollment. Since students in our sample typically tookapproximately one semester longer to complete their studies, they may have been older than their non-disabled peers had wesurveyed them part way through their studies.
4.4 Why Do Students With Disabilities Perform So Well At Dawson College?
The academic outcomes of students with disabilities were similar to and in some cases superior to those of non-disabled students.
The literature has a variety of findings suggesting either that students with disabilities do almost as well as non-disabled students(Horn & Berktold, 1999) or that they do equally well (e.g., Outcomes Group, 1999), especially when scores are corrected for lowerhigh school grades (Richardson, 2001; Richardson & Roy, 2002). We have only found one study which showed that students withdisabilities do better than non-disabled students (Gavilan College, 2002). There are several hypotheses about why our findingsshow that students with disabilities perform so well at Dawson College.
Students are enrolled in a junior/community college and not a university. Most studies have examined performance atuniversities, rather than at junior/community colleges. It is possible that the requirements of universities, with their moreacademically challenging courses and greater workload, yield different results. Another possibility is that most of the large studieswere conducted in England (e.g., Richardson, 2001, Richardson & Roy, 2002) and in the United States (Henderson, 1995, 1999,2001; Horn & Berktold, 1999), where the postsecondary educational system, the definitions of disabilities, as well as thelegislation governing accommodations for students with disabilities are different.
Only outstanding students apply to study at cegep. Another possibility is that only those students with disabilities who are verytalented, have great study skills, and are especially highly motivated enter cegeps. As noted earlier, Québec has a substantiallylower proportion of the postsecondary student body that is registered to receive disability related services than any other provincein Canada, and Québec’s rate is also considerably lower than that reported in most North American investigations (Fichten,Asuncion, Barile, Robillard, Fossey, & Lamb, 2003). Thus, the small number of students with disabilities in the overall samplesuggests that this, at least in part, be correct.
49
Summary and Discussion
The cegep environment, including the availability of disability related services, allows students to achieve at their potential.The “outstanding students” explanation above requires accounting for the lower high school entry grades of students withdisabilities. Thus, either students with disabilities were underachieving in high school and/or they were over achieving at DawsonCollege. Both are possible. Disability related accommodations in high school may not be at an adequate level to allow students toachieve at their potential. Also, students in high school must take certain courses, including mathematics: math courses posedifficulties for many students, especially for those with learning disabilities and visual impairments. In addition, attitudes of highschool students toward those who are different, including students with disabilities, are generally more negative than those ofcollege students (cf. Fichten, 1988).
Another possibility is that students at Dawson College are provided with disability related services that allow them to maximizetheir potential. For example, allowing students with disabilities to pre-register permits them to select courses which they wish totake and which often fill up quickly at registration. This may mean the most excellent professors, courses which allow students tobuild on their strengths, and the most suitable timetables (e.g., no very long days, appropriate breaks between courses). Suchfactors may facilitate better performance.
Students with disabilities, because of the assistance received with registration, may as a group have had a diminished tendency todrop courses which would incur a failure grade of zero. This would favorably influence their overall grade average relative to non-disabled students. The data show that students with disabilities, as a group, were, indeed, less likely to incur a failure grade of zero.Nevertheless, the results continued to hold even when failure grades of zero were eliminated from the analyses. This suggests thatthe good performance of students with disabilities is not simply due to their being less likely to drop courses after the course dropdeadline and incur failure grades of zero.
4.5 Conclusions, Recommendations, And Implications
The data do not permit us to choose among the alternatives above to explain the overall superiority of the academic outcomes ofstudents with disabilities despite having lower high school grades at entry to Dawson College. Additional research needs to becarried out. Future studies can evaluate academic outcomes at other cegeps and examine the extent to which the present results arereplicated. Also, students can be queried about the level and nature of disability related services that they received in high schooland surveyed to determine perceived facilitators and obstacles to success in cegeps. An evaluation can also be made of therelationship between graduation rates of students with disabilities in high school and the nature of disability related servicesavailable to them. It is possible that it is the lack of services and accommodations in the high schools that result in the lower highschool entry grades of students with disabilities.
The lower grades at entry to postsecondary education of students with disabilities was a feature of our sample as well as of mostother studies in the literature (e.g., Richardson, 2001, Richardson & Roy, 2002; Horn & Berktold, 1999).
Crosby, Iyer, Clayton, and Downing (2003) argue that the policy of affirmative action in higher education and employment hasmore benefits than costs, both in achieving diversity and in achieving merit. Affirmative action has been defined as, “voluntary andmandatory efforts undertaken by federal, state, and local governments; private employers; and schools to combat discriminationand to promote equal opportunity in education and employment for all” (American Psychological Association, 1996, p. 2).” Thegoal of affirmative action is to eliminate discrimination and to redress the effects of past discrimination (Kravitz et al., 1997). Thelower high school grades of the sample of students with disabilities in the present investigation, as well as in most publishedreports in the literature, suggests a case for affirmative action for students with disabilities in postsecondary education.
The sample we studied had access to disability related accommodations such as pre-registration, note taking services, interpreters,text and academic materials in alternate formats, additional time for exams if their disability warranted this, human assistants, aswell as access to adapted computer facilities. Would they have done as well if these services were not available to them? The datado not permit us to say.
What the data do show, however, is that students who are registered to receive disability related services from their college can anddo achieve good academic results. Should students with disabilities be encouraged to attend postsecondary education? Are thefunds spent on supporting them in college well spent? Absolutely!
50
Students With Disabilities At Dawson College: Success And Outcomes
References
Allen, M., Harris, S., & Butlin, G. (2003). Finding their way: A profile of young Canadian graduates. (Catalogue no. 81-595-MIE— No. 003). Ottawa, ON: Statistics Canada. Retrieved June 17, 2003, from http://www.statcan.ca/english/research/81-595-MIE/81-595-MIE2003003.pdf
Allie, R. & Hébert, A. (1998). État de situation de la thématique des services éducatifs et de la formation continue (Chapitre 7).Drummondville, QC: Office des personnes handicapées du Québec. Retrieved June 17, 2003, fromhttp://www.ophq.gouv.qc.ca/Thematiques/Bilan98/Bilan_Educatifs.htm#integration
American Psychological Association. (1996). Affirmative action: Whobenefits? Washington, DC: Author.Amsel, R., & Fichten, C.S. (1990). Interaction between disabled and nondisabled college students and their professors: A
comparison. Journal of Postsecondary Education and Disability, 8(1), 125-140.AQEHPS (Association Québécoise des Étudiants Handicapés au Postsecondaire). (1999, January). Les étudiants ayant des
incapacités, un regard statistique. Montreal, Quebec: Author.Association des paraplégiques du Québec. (1994, Janvier). La formation professionnelle des personnes handicapées: Intervention
urgente. Quebec: Auteur.Astin, A. (1993). What matters in college? Four critical years revisited. San Francisco: Jossey Bass.Barbeau, D. (1994). La motivation scolaire : Plans d'interventions et d'observation. Demande de subvention au Programme d'aide à
la recherche sur l'enseignement et l'apprentissage (PAREA). Québec: PAREA.Benoit, M. & Gauthier, J.B. (Eds.). (1985, octobre). Analyse de besoins en services éducatifs pour adultes ayant un handicap
physique et/ou sensoriel et plan d'action. Service de l'éducation des adultes, Bureau de la formation personnelle et sociale.Montréal : La commission scolaire des écoles catholiques de Montréal.
Bérubé, M., Deschênes, J-C., & Juhel, J-C. (1985). Guide pédagogique: Le handicap visuel postsecondaire. Québec: Collège deSainte-Foy. 86 pages.
Blackorby, J & Wagner, M. (1996). Longtitudinal postschool outcomes of youth with disabilities: Findings from the nationallongitudinal transition study. Exceptional Children, 62(5), 399-413.
Butlin, G. (1999). Determinants of postsecondary participation. Education Quarterly Review, 5(3), 9-35. Statistics Canada Cat. No.81-003.
Canadian Council on Social Development (CCSD). (2002). CCSD's Disability information sheet. Number 4. [Internet]. RetrievedJune 17, 2003, from http://www.ccsd.ca/drip/research/dis4/index.htm.
Cardyn, B., & Bégin, C. (1998, February 6). Troubles d'apprentissage: Rapport final. Montréal: Université du Québec à Montréal.Cartier, M. (2000). Québec 2005 : quel contexte pour l'enseignement à distance? Presentation at the annual Conference of the
Canadian Association for Distance Education (CADE), Québec, Québec. Abstracted in the Conference Program.Retrieved June 17, 2003 from http://www.ulaval.ca/aced2000cade/francais/resumes.htm
Clermont, B. (1995). Portrait historique de la clientèle sourde et malentendant de l'ordre collégial: Région ouest du Québec - 1982à 1994. Montréal: SAIDE, Cégep du Vieux Montréal.
Coallier, G., Leblanc, A., Leblanc, J., & Lemire, J. (1987). Vers un plan d’action de la Fédération des cégeps pour assurerl’intégration des étudiants(es) handicapés(es) dans le réseau collégial : rapport du Comité sur l’intégration desétudiants(es) handicapés(es). Fédération des cégeps.
Cokley, K. (2000). Perceived faculty encouragement and its influence on college students. Journal of College StudentDevelopment. 41(3), 348-352.
Comité sur la réussite du Cégep de Sainte-Foy. (2000). Le projet institutionnel sur la réussite des étudiants au Cégep de Sainte Foy: un projet rassembleur pour les cinq premières années 2000. Québec: Cégep de Sainte-Foy.
Conseil supérieur de l’éducation. (2000). Conditions for student success at the university level. Panorama, 5(2). Retrieved June 17,2003, from http://www.cse.gouv.qc.ca/e/pub/panorama/2000-05/Conditions.htm
Crosby, F.Y., Iyer, A., Clayton, S., & Downing, R.A. (2003). Affirmative action: Psychological data and the policy debates.American Psychologist, 58, 93–115.
D’Amours, Y. (1992). Une « cure de jeunesse » pour l’enseignement collégial. Avis. Conseil permanent de la jeunesse. (ISBN : 2-550-26798-2). Gouvernement du Québec : Ministère du conseil Exécutif.
Dawson College. (2000a). Student success action plan. Montréal: Dawson College. Retrieved June 17, 2003, fromhttps://dc7.dawsoncollege.qc.ca/dscgi/ds.py/Get/File-4243/SSAP1a.pdf
Dawson College. (2000b). Appendices: Student success action plan. Montréal: Dawson College.Dawson College. (undated). Mission statement. Retrieved June 20, 2003 from http://www.dawsoncollege.qc.ca/gead/mission.shtml
51
References
Denison, B. (2000).A statistical portrait of students entering selected programs at Dawson College in Fall 1999: Results of theCollege Student Inventory. (Technical Report). Montréal: Dawson College.
Direction des statistiques et des études quantitatives (Gouvernement du Québec, Ministère de l’Éducation). (1999). SchoolEnrolments in Québec and the OECD Countries in 1995–96. Education Statistics Bulletin, No 13, November 1999.Retrieved June 17, 2003, from http://www.meq.gouv.qc.ca/STAT/bulletin/bulletin_13an.pdf
Direction générale de l’enseignement collégial. (1989). Document de travail : l’intégration à l’enseignement collégiale des élèveshandicapés : problématique et mesures. Montréal : Direction générale de l’enseignement collégial.
Fawcett, G. (1996). Living with disability in Canada: An economic portrait. Hull, Quebec: Human Resources DevelopmentCanada, Office for Disability Issues.
Fédération des cégeps. (1988). L’intégration à l’enseignement collégial des étudiants handicapés : position de la Fédération descégeps sur le document de travail de la D.G.E.C. Fédération des cégeps. Montréal : Fédération des cégeps.
Fichten, C.S. (1988). Students with physical disabilities in higher education: Attitudes and beliefs that affect integration. In H.E.Yuker (Ed.), Attitudes toward persons with disabilities (pp.171-186). New York: Springer.
Fichten, C.S. (1995). Paradigms, partnerships, and the next generation of movers and shakers: College students with disabilities /Paradigmes, partenariats, et la prochaine génération d'acteurs dynamiques de changement: les étudiants handicapés descollèges. Canadian Journal of Rehabilitation, 9(1), 3-16.
Fichten, C.S., & Schipper, F. (1996). Preparing students with disabilities for the college experience. Applying Research to theClassroom, 14(3), 7-11.
Fichten, C.S., Asuncion, J., Barile, M., Fossey, M.E., & Robillard, C. (2001). Computer technologies for postsecondary studentswith disabilities I: Comparison of student and service provider perspectives. Journal of Postsecondary Education andDisability, 15(1), 28-58.
Fichten, C.S., Asuncion, J., Robillard, C., Fossey, M., Généreux, C., Guimont, J.P., & Lamb, D. (2001). What decision makersneed to know about the NTIC needs of postsecondary students with disabilities: The Adaptech research project.Proceedings / Actes du colloque Pour une technologie branchée sur la diversité, 166-172. Montréal, Canada: Comitéd'adaptation de la main-d'œuvre (CAMO) pour personnes handicapées.
Fichten, C.S., Asuncion, J.V., & Barile, M. with the Collaboration of: Robillard, C., Fossey, M.E., Judd, D., Guimont, J.P., Tam,R., & Lamb, D. and Partner Representatives: Généreux, C., Juhel, J.C., Senécal, J., & Wolforth, J. (2001). Computer andinformation technologies: Resources for the postsecondary education of students with disabilities. Final Report to theOffice of Learning Technologies. Hull, Québec: Office of Learning Technologies. Resources in Education and ERICDocument Reproduction Service (ED 458 733 and EC 308 679). Retrieved June 17, 2003, fromhttp://omega.dawsoncollege.qc.ca/adaptech/pubs/olt01pdf.exe. Abstracted in EDUCAUSE (ID Number CSD1700).
Fichten, C.S., Asuncion, J.V., Barile, M., Fossey, M.E., Robillard, C., Judd, D., Wolforth, J., Senécal, J., Généreux, C., Guimont,J.P., Lamb, D., & Juhel, J-C. (in press). Access to information and instructional technologies in higher education I:Disability service providers’ perspective. Journal of Postsecondary Education and Disability.
Fichten, C.S., Asuncion, J.V., Barile, M., Robillard, C., Fossey, M.E., & Lamb, D. (2003). Canadian postsecondary students withdisabilities: Where are they? Submitted for publication.
Fichten, C.S., Barile, M., & Asuncion, J.V. (1999). Learning technologies: Students with disabilities in postsecondary education /Projet Adaptech : L'Utilisation des technologies d'apprentissage par les étudiant(e)s handicapé(e)s au niveaupostsecondaire. Hull: Office of Learning Technologies. Eric Document Reproduction Service (ED 433625 EC 37369).Retrieved June 17, 2003, from http://www.cdc.qc.ca/Pages/Olt99fin.pdf
Fichten, C.S., Barile, M., Robillard, C., Fossey, M., Asuncion, J., Généreux, C., Judd, D., & Guimont, J.P. (2000). Access tocollege for all: ITAC Project - Computer and adaptive computer technologies in the cegeps for students with disabilities /L'accessibilité au cégep pour tous : Projet ITAC - informatique et technologies adaptées dans les cégeps pour les étudiantshandicapés (309 pages). Final report to PAREA (Programme d'aide à la recherche sur l'enseignement et l'apprentissage),July, 2000. Québec: Ministère de l'Éducation. Eric Document Reproduction Service (ED445457). Retrieved June 17,2003, from http://adaptech.dawsoncollege.qc.ca/pubs/itacallpdf.exe
Fichten, C.S., Bourdon, C.V., Creti, L., & Martos, J.G. (1987). Facilitation of teaching and learning: What professors, studentswith a physical disability and institutions of higher education can do. Natcon, 14, 45-69.
Fichten, C.S., Goodrick, G., Tagalakis, V., Amsel, R., & Libman, E. (1990). Getting along in college: Recommendations forstudents with disabilities and their professors. Rehabilitation Counseling Bulletin, 34(2), 103-125.
Flippo, R., & Cavalry, D. (2000). The handbook of college reading and study strategies. N.J.: Erlbaum.Freedman, B., & Havel, A. (1994). Students with disabilities at Dawson College. Montréal: Dawson College.
52
Students With Disabilities At Dawson College: Success And Outcomes
Gavilan College. (2002). Academic performance in math and English and award rates of disabled students. Retrieved June 17,2003, from http://www.gavilan.edu/research/reports/DSPS023.PDF
Généreux, C. (2001). Les étudiants ayant des incapacités, un regard statistique (2e édition). Montreal, Quebec: Author. Availablefrom [email protected]
Government of Canada. (1996, October). Equal citizenship for Canadians with disabilities: The will to act: Federal Task Force ondisability issues. Ottawa: Minister of Public Works and Government Services, Canada.
Government of Canada. (2002, July 25). Knowledge matters: Skills and learning for Canadians- Executive summary. [Internet].Retrieved June 17, 2003 from http://www.hrdc-drhc.gc.ca/sp-ps/sl-ca/doc/summary.shtml
Harris Interactive Inc. (2000). 2000 N.O.D./Harris survey of Americans with disabilities. N.Y.: Harris Interactive.Henderson, C. (1995). College freshmen with disabilities: A triennial statistical profile. Washington DC: HEATH Resource
Center.Henderson, C. (1999). College freshmen with disabilities: A biennial statistical profile (Statistical Year 1998). Washington DC:
HEATH Resource Center.Henderson, C. (2001). College freshmen with disabilities: A biennial statistical profile (Statistical Year 2000). Washington DC:
HEATH Resource Center. Retrieved June 17, 2003, from http://www.heath.gwu.edu/PDFs/collegefreshmen.pdfHERMES-Information stratégique. (1999). De l’exclusion à l’intégration - État de la situation des jeunes adultes handicapés en
matière de formation et d’emploi. Rapport final présenté au Comité d’adaptation de la main d’œuvre pour personneshandicapées (CAMO). CAMO: Montréal.
Hill, J.L. (1996). Speaking out: perceptions of students with disabilities at Canadian universities regarding institutional policies.Journal of Postsecondary Education and Disability, 11(1), 1-13.
Hill, J.L.(1992). Accessibility: Students with disabilities in universities in Canada. Canadian Journal of Higher Education, 22(1),48-83.
Horn, L., & Berktold, J. (1999). Students with disabilities in post-secondary education: A profile of preparation, participation andoutcomes. Washington DC: U.S. Department of Education - National Center for Education Statistics 1999-187. RetrievedJune 17, 2003, from http://nces.ed.gov/pubs99/1999187.pdf
Horn, L., Peter, K., & Rooney, K. (2002). Profile of undergraduates in U.S. postsecondary institutions: 1999 –2000. Statisticalanalysis report. (NCES 2002 –168). Washington, DC: U.S. Department of Education - National Center for EducationStatistics. Retrieved December 10, 2002 from http://nces.ed.gov/pubs2002/2002168.PDF
Horn, L., Peter, K., & Rooney, K. (2002). Profile of undergraduates in U.S. postsecondary institutions: 1999–2000 (NCES 2002–168). Washington, D.C.: U.S. Department of Education – National Center for Education Statistics. Retrieved June 7,2003, from www.nces.ed.gov/pubs2002/2002168.pdf
Hubka, D., & Killean, E. (1996). Employment opportunities for post-secondary students and graduates with disabilities: A nationalstudy. Ottawa: National Educational Association of Disabled Students.
Human Resources Development Canada. (2002, December). Advancing the inclusion of persons with disabilities. A Governmentof Canada report (Cat. No.: RH37-4/1-2002E). Ottawa: Authors. Retrieved June 17, 2003, from http://www.hrdc-drhc.gc.ca/hrib/sdd-dds/odi/documents/pdfs/fdr.pdf
Jackson, K., Morabito, S.M., Prezant, F.P., & Michaels, C.A. (2001, July). The current status of technology on campus for studentswith disabilities: The DSS perspective. Presentation at the Annual AHEAD (Association on Higher Education AndDisability) Conference, Portland, Oregon.
Jorgensen S. (2002). Dawson College Report on Key Performance Indicators: December, 2002. Montréal: Dawson College.Juhel, J.C. (2000). Un cégep à ma porte : Guide d'accès aux services adaptés. Sainte Foy, Québec: Cégep de Sainte-Foy.Kravitz, D. A., Harrison, D. A., Turner, M. E., Levine, E. L., Chaves, W., Brannick, M. T., et al. (1997). Affirmative action: A
review of psychological and behavioral research. Bowling Green, OH: Society for Industrial and OrganizationalPsychology.
Lavoie, H. (1986). Expérience d’intégration des personnes atteintes de déficience sensorielle profonde : rapport d’évaluation.(ISBN : 2-550-16891-7). Québec: Direction générale de l’enseignement collégial, Service des affaires étudiantes, MEQ.
Le Services aux étudiants handicapés. (undated). Étudiants handicapés du Cégep de Sainte-Foy. Statistiques : 1981-1997. Sainte-Foy, Québec : Le Services aux étudiants handicapés, Cégep de Sainte-Foy.
Leblanc, A. (1990, février). L'étudiant handicape a-t-il sa place au cegep? Cégepropos, 7-9.Leblanc, A. (1999). Integration of students with disabilities in the CEGEP network of Quebec: A historical overview and case
study. M.Ed. thesis, Faculty of Education, Université de Sherbrooke, Sherbrooke, Québec.Lefebvre, F. (2000). Taux de scolarisation de la population - Le Québec au rang des pays les plus avancés. Retrieved June 17,
2003, from http://www.meq.gouv.qc.ca/CPRESS/cprss2000/c000317.htm.
53
References
Loewen, G., & Tomassetti, V. (2002). Fostering independence through refreshable Braille. Presentation at the Developing Skillsfor the New Economy: International Conference on Technical and Vocational Education and Training, Manitoba.Abstract retrieved from http://www.umanitoba.ca/unevoc/2002conference/text/wp_loewen.shtml
Louis Harris & Associates. (1994). N.O.D./Harris survey of Americans with disabilities. N.Y.: Louis Harris & Associates.Maisonneuve, C., & DeCorwin, S. (1994). Employment and training: Quebec shows a significant delay. Paraquad, automne, 12-
13.Meunier, N. (1989). Étude sur l’orientation des services aux étudiants par rapport aux attentes du Cégep de Trois-Rivières.
Mémoire de maîtrise en éducation. Trois-Rivières, Québec: Université du Québec à Trois-Rivières.Ministère de l'éducation du Québec, Direction générale de l'aide financière aux étudiants. (1995). Aide financière aux étudiants -
Pour les personnes atteintes d'une déficience fonctionnelle / Student financial aid program - Students with functionaldisabilities. Québec: Ministère de l'éducation du Québec.
Ministère de l'éducation du Québec. (1998). Accessibilité au collégial des personnes handicapées, des autochtones, des membresdes communautés culturelles et des personnes participants au programme sport-études. Annexe F062 (No de CT:192640). Québec: MEQ.
Ministère de l'éducation du Québec. (2003). Indicateurs sur la diplomation au collégial (Version 2002). Retrieved June 15, 2003from www.meq.gouv.qc.ca/stat/chesco/Diplomation_type_form_public.htm
Ministère de l'Enseignement supérieur et de la science. (1990). Les personnes handicapées et la formation postsecondaire. Finepointe, 6(3), 1-5.
National Organization on Disability. (1999, Spring). Education and disability. Disability Agenda: A Quarterly Publication Of TheNational Organization On Disability, 3(4).
Nichols, F. (1998, June). L'après-cégep: Insertion professionnelle. Taux d'activité et de chômage en fonction des études post-secondaires et des incapacités. Presentation at rencontre de notre 10e année de rencontre avec les répondants. CégepVieux Montréal, Montréal, Québec.
Office of Institutional Research (2002). Outcomes of the Noel-Levitz Satisfaction Inventory. Montréal: Dawson College.OPHQ (Office des personnes handicapées du Québec). (1995). États généraux sur l'éducation - Mémoire. Drummondville: Office
des personnes handicapées du Québec. Abstract retrieved June 17, 2003, fromhttp://www.ophq.gouv.qc.ca/Position/D_Etatsmem.htm
OPHQ (Office des personnes handicapées du Québec). (1998). Le Québec et l’intégration sociale des personnes handicapées : étatde situation multisectorielle. (ISBN : 2-550-34278-X). Drummondville : OPHQ.
Ouellet, J., Delisle, D., Couture, J., & Gauthier, G. (2000). Les TIC et la réussite éducative au collégial. GRIE - Groupe derecherche et d’intervention en éducation. (ISBN : 2-2920781-22-7). Rapport final remis au PAREA. Québec: PAREA.
Outcomes Group. (1998). 1998 outcomes of former students with disabilities: BC college and insistitute student outcomes report.Retrieved June 17, 2003, from http://outcomes.ceiss.org/Publications/disabilities/Disabled.pdf
Paju, M. (1997). The class of 90 revisited: Report of the 1995 follow-up survey of 1990 graduates. Ottawa: Statistics Canada.Retrieved June 17, 2003, from http://www.hrdc-drhc.gc.ca/arb/publications/books/class90/report2.pdf
Paju, M. (2000). The class of '90 revisited: Report of the 1995 follow-up survey of 1990 graduates. Human ResourcesDevelopment Canada. Statistics Canada. Retrieved June 20, 2003, from http://www.hrdc-drhc.gc.ca/arb/publications/books/class90/report2.pdf
Pascarella, E., & Terenzini, P. (1994). How college affects students? San Francisco: Jossey Bass.Picard, L. (1986). Mémoire de l’Office des personnes handicapées de Québec traitant du lien de l’implication du ministère de
l’enseignement Supérieur et de la Science et de ses partenaires dans l’intégration sociale des personnes handicapés.Drummondville : OPHQ.
Pinto, V. (1993). Leaving college (2nd ed.). Chicago: University of Chicago Press.Richardson, J.T.E. (2001). The representation and attainment of students with a hearing loss in higher education. Studies in Higher
Education, 26, 184-204.Richardson, J.T.E., & Roy, A.W.N. (2002). The representation and attainment of students with a visual impairment in higher
education. The British Journal of Visual Impairment, 20, 37-49.Roessler, R.T., & Kirk, H.M. (1998). Improving technology training services in postsecondary education: Perspectives of recent
college graduates with disabilities. Journal of Postsecondary Education and Disability, 13(3), 48-59.Scott, S. (1997). Accommodating college students with learning disabilities: How much is enough? Innovative Higher Education,
22 (22). Retrieved June 17, 2003, from www.uu.edu/centers/faculty/resources/ article.cfm?ArticleID=116 - 40k
54
Students With Disabilities At Dawson College: Success And Outcomes
Senécal, J. N. (1998, June). Notre clientèle dévoile ses visages. Montréal: SAIDE, Cégep du Vieux MontréalStahlman, J. (2000, January 13). Students per capita in major cities. The Gazette, Montreal. P. A1. Graphic of unversity students
population as recorded in last census.Statistics Canada (Government of Canada). (2002b). Participation and Activity Limitation Survey: A profile of disability in
Canada. The Daily, December 3, 2002. Retrieved June 17, 2003, fromhttp://www.statcan.ca/Daily/English/021203/d021203a.htm
Statistics Canada. (1992). Full-time enrolment by level, province, institution, and sex, 1991-1992 (Universities: Enrolment andDegrees pp. 30 -41, Cat. No. 81-204). Ottawa, Ontario: Statistics Canada.
Statistics Canada. (1992, October 13). 1991 Health and activity limitation survey. The Daily. Cataglogue 11-001E. ISSN: 0827-0465. Available telephone number: 1-800-267-6677.
Statistics Canada. (2002a). A profile of disability in Canada, 2001: Participation and Activity Limitation Survey (PALS).Catalogue no. 89-577-XIE. Retrieved June 17, 2003 from http://www.statcan.ca/english/freepub/89-577-XIE/index.htm
Statistics Canada. (2003). Census of population: Labour force activity, occupation, industry, class of worker, place of work, modeof transportation, language of work and unpaid work. The Daily, February 11, 2003. Retrieved June 17, 2003 fromhttp://www.statcan.ca/Daily/English/030211/d030211a.htm
Stodden, R. A., & Dowrick, P.W. (2000). Postsecondary education and employment of adults with disabilities. AmericanRehabilitation, 22,19-23.
Taillon, J., & Paju, M. (1999). The class of '95: Report of the 1997 National Survey of 1995 Graduates. Ottawa: Statistics Canada.Retrieved June 17, 2003, from http://www.hrdc-drhc.gc.ca/arb/publications/books/class95/class95.pdf
Tousignant, J. (1995). La vie étudiante des personnes handicapées dans les etablissements d'enseignement universitaire Québécois(un bilan des années 1989 a 1995). Québec: Ministère de l'éducation: Direction générale des affaires universitaires etscientific.
Tremblay, R., & Charron, F. (1992). Conceptualisation et surdite. Quebec: Cégep du Vieux Montreal.Tremblay, R., Lacroix, J-G., Lacerte, L., Charron, F., & Noelting, G. (1994). Le texte argumentatif et les marqueurs de relation.
Montréal: Cégep de Vieux Montréal.Wolfe, D.A., & Gertler, M.S. (2001). The new economy: An overview. Report for the Social Sciences and Humanities Research
Council of Canada Toronto: Munk Centre for International Studies.Wolforth, J. (2000). Office for students with disabilities: Annual report 1999-2000. Montréal: McGill University.Young, W.A., & Zawilski, J. (1980, June). A guide to better living for the visually impaired: An information and resource
handbook to help visually handicapped persons integrate into the community. Montreal: Dawson College, Center forContinuing Education.
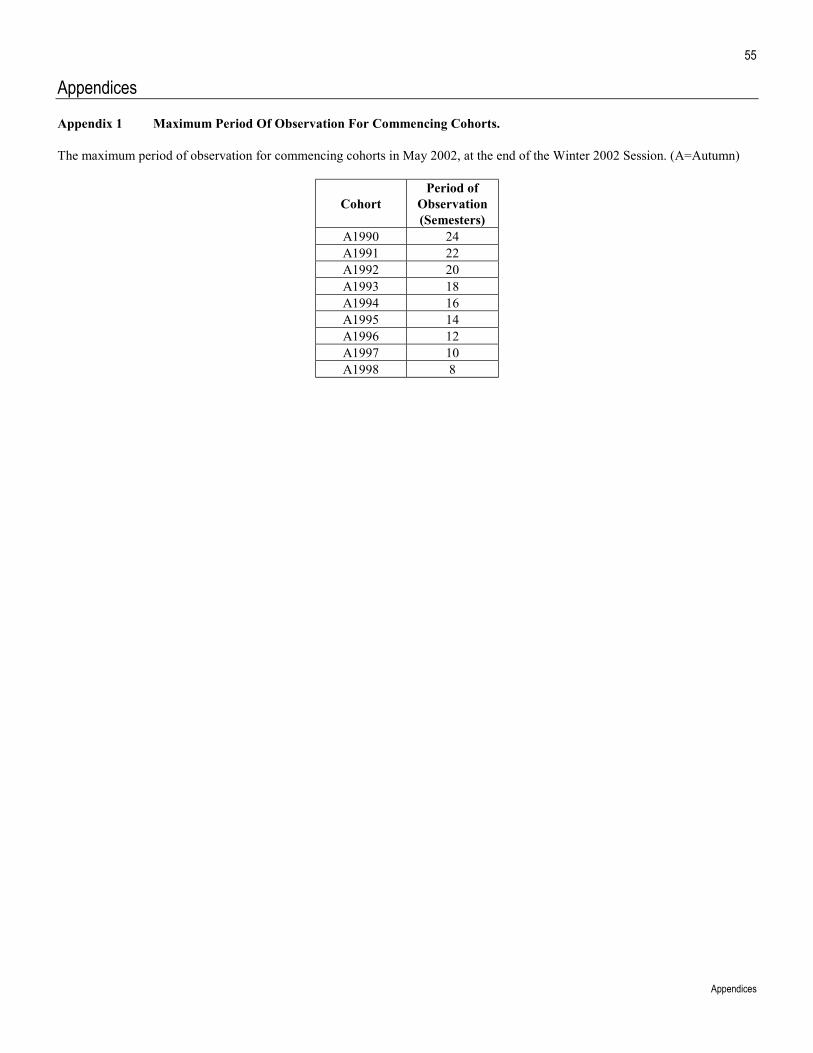
55
Appendices
Appendices
Appendix 1 Maximum Period Of Observation For Commencing Cohorts.
The maximum period of observation for commencing cohorts in May 2002, at the end of the Winter 2002 Session. (A=Autumn)
CohortPeriod of
Observation(Semesters)
A1990 24A1991 22A1992 20A1993 18A1994 16A1995 14A1996 12A1997 10A1998 8
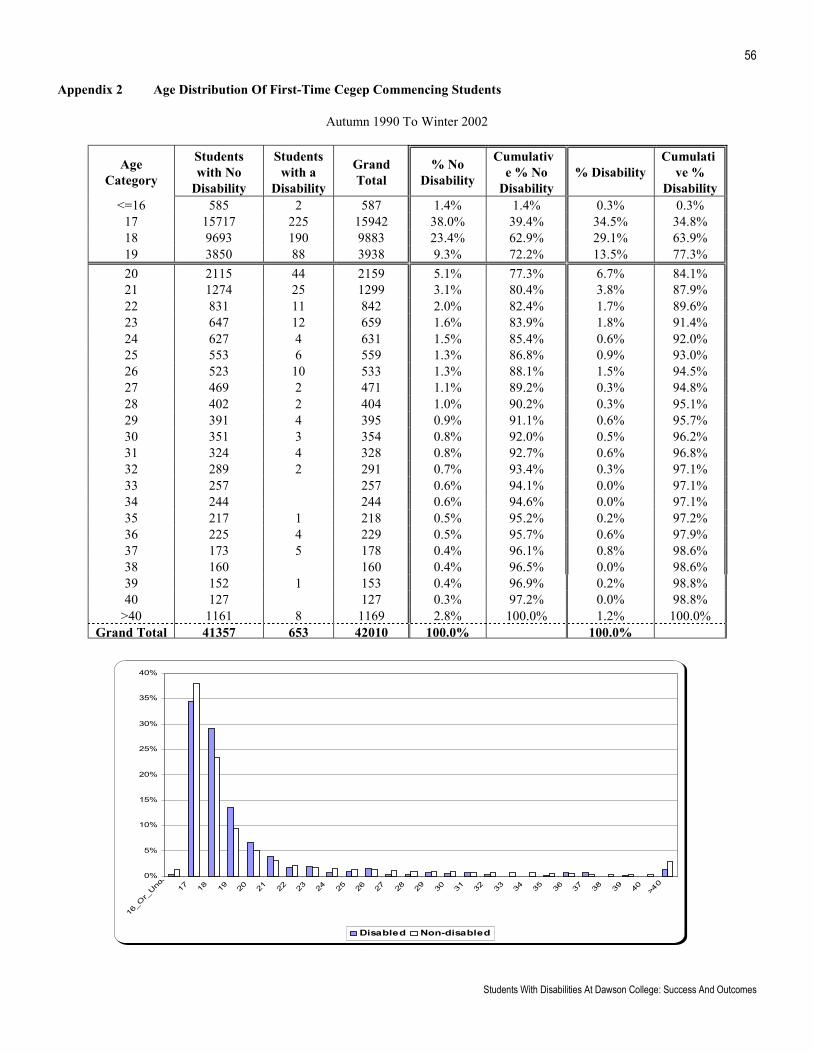
56
Students With Disabilities At Dawson College: Success And Outcomes
Appendix 2 Age Distribution Of First-Time Cegep Commencing Students
Autumn 1990 To Winter 2002
AgeCategory
Studentswith No
Disability
Studentswith a
Disability
GrandTotal
% NoDisability
Cumulative % No
Disability% Disability
Cumulative %
Disability<=16 585 2 587 1.4% 1.4% 0.3% 0.3%
17 15717 225 15942 38.0% 39.4% 34.5% 34.8%18 9693 190 9883 23.4% 62.9% 29.1% 63.9%19 3850 88 3938 9.3% 72.2% 13.5% 77.3%20 2115 44 2159 5.1% 77.3% 6.7% 84.1%21 1274 25 1299 3.1% 80.4% 3.8% 87.9%22 831 11 842 2.0% 82.4% 1.7% 89.6%23 647 12 659 1.6% 83.9% 1.8% 91.4%24 627 4 631 1.5% 85.4% 0.6% 92.0%25 553 6 559 1.3% 86.8% 0.9% 93.0%26 523 10 533 1.3% 88.1% 1.5% 94.5%27 469 2 471 1.1% 89.2% 0.3% 94.8%28 402 2 404 1.0% 90.2% 0.3% 95.1%29 391 4 395 0.9% 91.1% 0.6% 95.7%30 351 3 354 0.8% 92.0% 0.5% 96.2%31 324 4 328 0.8% 92.7% 0.6% 96.8%32 289 2 291 0.7% 93.4% 0.3% 97.1%33 257 257 0.6% 94.1% 0.0% 97.1%34 244 244 0.6% 94.6% 0.0% 97.1%35 217 1 218 0.5% 95.2% 0.2% 97.2%36 225 4 229 0.5% 95.7% 0.6% 97.9%37 173 5 178 0.4% 96.1% 0.8% 98.6%38 160 160 0.4% 96.5% 0.0% 98.6%39 152 1 153 0.4% 96.9% 0.2% 98.8%40 127 127 0.3% 97.2% 0.0% 98.8%
>40 1161 8 1169 2.8% 100.0% 1.2% 100.0%Grand Total 41357 653 42010 100.0% 100.0%
0%
5%
10%
15%
20%
25%
30%
35%
40%
16_O
r_Und
e17 18 19 20 21 22 23 24 25 26 27 28 29 30 31 32 33 34 35 36 37 38 39 40 >4
0
Disabled Non-disabled

57
Appendices
Appendix 3 Phone Call Script.
Hi, my name is _____________________
I'm working with Alice Havel from Dawson College's services for students with disabilities.
We are conducting a follow-up study and your name appears on a list of students who pre-registered for courses through theservice.
I would like to ask you two questions about your pre-registration, is that okay?
IF NO Thank you, Goodbye.
IF YES Did you pre-register through the service because you had a disability or special need?
IF NO Thank you, Goodbye.
IF YES From the list I'm going to read, please indicate which impairments or disabilities you had while at Dawson.
LIST
• Health / Medically related Impairments (e.g., diabetes)• Psychological / Psychiatric• learning disability / ADD• Wheelchair user• Mobility impairment• Difficulty using hands / arms• Deaf• Hearing impairment / partially sighted• Speech / Communication impairment• Totally blind• Visual impairment / partially sighted
Great! Thank you for your time, have a nice day.
QUESTIONS
Why do you want to know my disability?
• We're updating our files in order to be able to conduct some follow-up studies. We want to know the outcomes of studentswith disabilities so we're analyzing statistics and comparing course pass rates and graduation rates of students with disabilities.
If you need more information please do not hesitate to call Alice Havel at (514) 931-8731 ext. 1211.
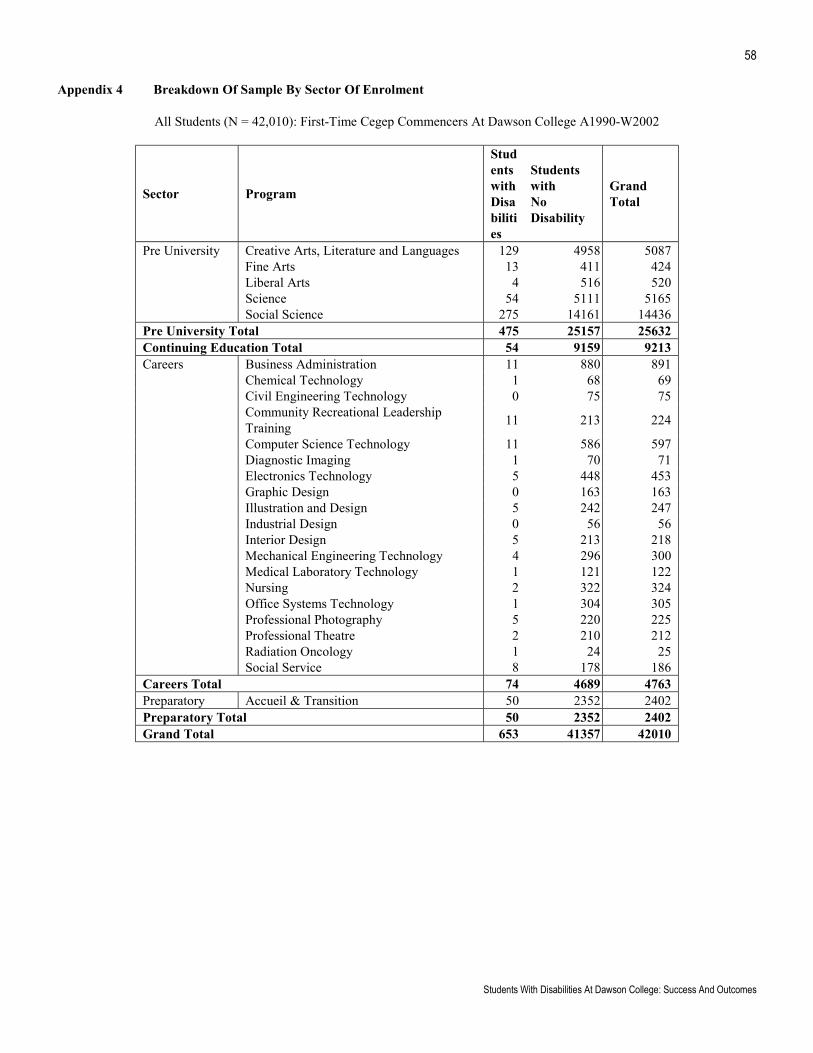
58
Students With Disabilities At Dawson College: Success And Outcomes
Appendix 4 Breakdown Of Sample By Sector Of Enrolment
All Students (N = 42,010): First-Time Cegep Commencers At Dawson College A1990-W2002
Sector Program
StudentswithDisabilities
StudentswithNoDisability
GrandTotal
Pre University Creative Arts, Literature and Languages 129 4958 5087 Fine Arts 13 411 424 Liberal Arts 4 516 520 Science 54 5111 5165 Social Science 275 14161 14436Pre University Total 475 25157 25632Continuing Education Total 54 9159 9213Careers Business Administration 11 880 891 Chemical Technology 1 68 69 Civil Engineering Technology 0 75 75
Community Recreational LeadershipTraining 11 213 224
Computer Science Technology 11 586 597 Diagnostic Imaging 1 70 71 Electronics Technology 5 448 453 Graphic Design 0 163 163 Illustration and Design 5 242 247 Industrial Design 0 56 56 Interior Design 5 213 218 Mechanical Engineering Technology 4 296 300 Medical Laboratory Technology 1 121 122 Nursing 2 322 324 Office Systems Technology 1 304 305 Professional Photography 5 220 225 Professional Theatre 2 210 212 Radiation Oncology 1 24 25 Social Service 8 178 186Careers Total 74 4689 4763Preparatory Accueil & Transition 50 2352 2402Preparatory Total 50 2352 2402Grand Total 653 41357 42010