students - edsight.ct.govedsight.ct.gov/output/district/highschool/1280011_201617.pdf ·...
TRANSCRIPT

1280011 - Simsbury School District Printed on 02/27/2018 - Page 1
Simsbury School District
Mr. Matthew Curtis, Superintendent • 860-651-3361 • www.simsbury.k12.ct.us
District InformationDistrict InformationGrade Range PK-12Number of Schools/Programs 8
Enrollment 4,161
Per Pupil Expenditures¹ $16,174
Total Expenditures¹ $70,035,318
¹Expenditure data reflect the 2015-16 year.
Community Information CERC Town Profiles provide summary demographic and
economic information for Connecticut's municipalities
Related Reports/Publications CT Reports (CMT/CAPT)
Special Education Annual Performance Reports
SAT®, AP®, PSAT® Report by High School (Class of 2017) (2017® The College Board)
Contents Students.......................................................................... 1 . Educators........................................................................ 2 . Instruction and Resources.............................................. 2 . Performance and Accountability.................................... 4 . Narratives....................................................................... 7 .
NotesUnless otherwise noted, all data are for 2016-17 andinclude all grades offered by the district.
In most tables, data are displayed only for the three majorrace/ethnicity categories. For additional race/ethnicitycategories, please visit edsight.ct.gov.State totals are not displayed as they are not comparableto district totals.
Special Education tables reflect only students for whomthe district is fiscally responsible.
* When an asterisk is displayed, data have beensuppressed to ensure student confidentiality.
N/A is displayed when a category is not applicable for adistrict or school.
StudentsOctober 1, 2016 Enrollment
District State
Count Percent of Total(%)
Percent of Total(%)
Female 2,003 48.1 48.4
Male 2,158 51.9 51.6
American Indian or Alaska Native * * 0.3
Asian 271 6.5 5.1
Black or African American 241 5.8 12.9
Hispanic or Latino 287 6.9 24.0
Pacific Islander * * 0.1
Two or More Races 108 2.6 2.9
White 3,251 78.1 54.8
English Learners 64 1.5 6.8
Eligible for Free or Reduced-Price Meals 397 9.5 35.9
Students with Disabilities¹ 560 13.5 14.3
¹Students in this category are students with Individualized Education Programs (IEPs) only. This categorydoes not include students with Section 504 Plans.
Chronic Absenteeism and Suspension/ExpulsionChronic Suspension/
Absenteeism² Expulsion³
Count Rate (%) Count Rate (%)
Female 113 5.7 27 1.3
Male 106 5.0 67 3.1
Black or African American 35 15.2 35 14.6
Hispanic or Latino 19 6.6 6 2.1
White 144 4.5 46 1.4
English Learners 6 9.0 0 0.0
Eligible for Free or Reduced-Price Meals 62 16.6 38 9.3
Students with Disabilities 72 12.7 31 4.9
District 219 5.3 94 2.3
State 9.9 6.7
Number of students in 2015-16 qualified as truant under state statute: 14
Number of school-based arrests: Fewer than 6
²A student is chronically absent if he/she misses ten percent or greater of the total number of days enrolled
in the school year for any reason. Pre-Kindergarten students are excluded from this calculation.
³The count and percentage of students who receive at least one in-school suspension, out-of-school
suspension or expulsion.

1280011 - Simsbury School District Printed on 02/27/2018 - Page 2
District Profile and Performance Report for School Year 2016-17Simsbury School District
Educators
Full-Time Equivalent (FTE)¹ Staff
FTE
General Education
Teachers and Instructors 269.7
Paraprofessional Instructional Assistants 37.0
Special Education
Teachers and Instructors 43.9
Paraprofessional Instructional Assistants 88.4
Administrators, Coordinators and Department Chairs
District Central Office 5.0
School Level 24.6
Library/Media
Specialists (Certified) 7.8
Support Staff 5.9
Instructional Specialists Who Support Teachers 19.5
Counselors, Social Workers and School Psychologists 25.5
School Nurses 10.2
Other Staff Providing Non-Instructional Services/Support 179.3
¹In the full-time equivalent count, staff members working part-time in the
school are counted as a fraction of full-time. For example, a teacher whoworks half-time in a school contributes 0.50 to the school’s staff count.
Educators by Race/Ethnicity
District State
Count Percent of Total(%)
Percent of Total(%)
American Indian orAlaska Native
0 0.0 0.1
Asian 5 1.2 1.0
Black or AfricanAmerican
3 0.7 3.6
Hispanic or Latino 2 0.5 3.6
Pacific Islander 0 0.0 0.0
Two or More Races 0 0.0 0.1
White 397 97.5 91.4
Classroom Teacher Attendance: 2015-16
District State
Average Number of FTE Days Absent Due to Illness or Personal Time 7.2 9.6
Instruction and Resources11th and 12th Graders Enrolled in
College-and-Career-Readiness Courses during High School ³11th 12th
Count Rate (%) Count Rate (%)
Black or African American * * 15 68.2
Hispanic or Latino 11 * * *
White 203 74.1 280 81.9
English Learners N/A N/A N/A N/A
Eligible for Free or Reduced-Price Meals 18 66.7 18 72.0
Students with Disabilities 18 43.9 26 32.9
District 249 74.6 321 80.0
State 63.6 77.5
³College-and-Career-Readiness Courses include Advanced Placement®(AP), International
Baccalaureate®(IB), Career and Technical Education(CTE), workplace experience and dualenrollment courses.
Students with Disabilities Who Spend 79.1 to
100 Percent of Time with Nondisabled Peers⁴Count Rate (%)
Autism 59 63.4
Emotional Disturbance 15 55.6
Intellectual Disability 8 28.6
Learning Disability 159 82.4
Other Health Impairment 128 85.3
Other Disabilities 6 *
Speech/Language Impairment 39 95.1
District 414 76.1
State 68.2
⁴Ages 6-21

1280011 - Simsbury School District Printed on 02/27/2018 - Page 3
District Profile and Performance Report for School Year 2016-17Simsbury School District
Students with Disabilities by Primary Disability¹District State
Count Rate (%) Rate (%)
Autism 99 2.4 1.7
Emotional Disturbance 27 0.6 1.0
Intellectual Disability 28 0.7 0.5
Learning Disability 193 4.6 4.9
Other Health Impairment 151 3.6 2.9
Other Disabilities 19 0.5 1.1
Speech/LanguageImpairment
43 1.0 1.8
All Disabilities 560 13.4 13.9
¹Grades K-12
Overall Expenditures:³ 2015-16
Per Pupil
Total ($) District ($) State ($)
Instructional Staff and Services 40,342,767 9,705 9,663
Instructional Supplies and Equipment 1,271,864 306 321
Improvement of Instruction and Educational Media Services 3,943,592 949 578
Student Support Services 4,916,675 1,183 1,103
Administration and Support Services 6,074,290 1,461 1,861
Plant Operation and Maintenance 7,283,468 1,752 1,637
Transportation 3,093,291 713 877
Costs of Students Tuitioned Out 2,364,010 N/A N/A
Other 745,361 179 201
Total 70,035,318 16,174 16,236
Additional Expenditures
Land, Buildings, and Debt Service 3,655,198 879 1,749
³Expenditures may be supported by local tax revenues, state grants, federal grants, municipal in-kind services, tuition and other sources.
Special Education Expenditures: 2015-16
District State
Total ($) Percent ofTotal (%)
Percent ofTotal (%)
Certified Personnel 5,458,789 36.7 34.6
Noncertified Personnel 3,383,226 22.7 14.6
Purchased Services 740,824 5.0 5.8
Tuition to Other Schools 2,080,739 14.0 21.8
Special Ed. Transportation 1,300,291 8.7 8.5
Other Expenditures 1,910,396 12.8 14.7
Total Expenditures 14,874,265 100.0 100.0
Expenditures by Revenue Source:⁴2015-16
Percent of Total (%)Including Excluding
School School
Construction Construction
Local 87.3 86.9
State 11.2 11.5
Federal 1.4 1.5
Tuition & Other 0.2 0.2
⁴Revenue sources do not include state-funded
Teachers’ Retirement Board contributions,vocational-technical school operations, SDE budgetedcosts for salaries and leadership activities and otherstate-funded school districts (e.g., Dept. of Childrenand Families and Dept. of Correction).

1280011 - Simsbury School District Printed on 02/27/2018 - Page 4
District Profile and Performance Report for School Year 2016-17Simsbury School District
Performance and Accountability
District Performance Index (DPI)A District Performance Index (DPI) is the average performance of students in a subject area (i.e., ELA, Mathematics or Science) on the state summative assessments.The DPIranges from 0-100. A DPI is reported for all students tested in a district and for students in each individual student group. Connecticut's ultimate target for a DPI is 75.
English Language Arts(ELA) Math Science
Count DPI Count DPI Count DPI
American Indian or Alaska Native 0 N/A 0 N/A 0 N/A
Asian 146 87.2 146 85.4 61 73.6
Black or African American 132 64.0 132 56.4 56 49.2
Hispanic or Latino 157 75.1 155 67.4 71 63.3
Native Hawaiian or Other Pacific Islander * * * * 0 N/A
Two or More Races 55 79.6 55 72.7 18 *
White 1674 82.1 1665 76.7 781 71.0
English Learners 59 67.8 59 65.0 26 55.3
Non-English Learners 2106 81.1 2095 75.5 961 69.7
Eligible for Free or Reduced-Price Meals 205 66.5 204 60.0 98 56.1
Not Eligible for Free or Reduced-Price Meals 1960 82.3 1950 76.8 889 70.8
Students with Disabilities 262 58.9 257 51.4 143 52.7
Students without Disabilities 1903 83.8 1897 78.5 844 72.2
High Needs 452 64.2 446 57.7 227 55.6
Non-High Needs 1713 85.1 1708 79.8 760 73.5
District 2165 80.8 2154 75.2 987 69.4
National Assessment of Educational
Progress (NAEP): Percent At or Above Proficient¹National Assessment of Educational
Progress (NAEP): Percent At or Above Proficient¹NAEP 2015 NAEP 2013
READING Grade 4 Grade 8 Grade 12
Connecticut 43% 43% 50%
National Public 35% 33% 36%
MATH Grade 4 Grade 8 Grade 12
Connecticut 41% 36% 32%
National Public 39% 32% 25%
¹NAEP is often called the "Nation's Report Card." It is sponsored by the
U.S. Department of Education. This table compares Connecticut’sperformance to that of national public school students. Performancestandards for state assessments and NAEP are set independently.Therefore, one should not expect performance results to be the sameacross Smarter Balanced and NAEP. Instead, NAEP results are meant tocomplement other state assessment data. To view student subgroupperformance on NAEP,click here.
Physical Fitness Tests: Students Reaching Health Standard²Physical Fitness Tests: Students Reaching Health Standard²Percent of Students by Grade³ (%) All Tested Grades
4 6 8 10 Count Rate (%)
Sit & Reach 81.6 87.0 81.8 89.1 1,247 84.8
Curl Up 85.1 89.8 92.3 94.5 1,247 90.5
Push Up 77.0 80.4 86.1 86.6 1,247 82.7
Mile Run/PACER 72.5 81.8 87.7 75.1 1,247 79.2
All Tests - District 49.2 63.5 63.0 64.7 1,247 60.1
All Tests - State 52.8 51.4 51.4 50.6 51.6
²The Connecticut Physical Fitness Assessment (CPFA) is administered to all students in
Grades 4, 6, 8 and 10. The health-related fitness scores gathered through the CPFA shouldbe used to educate and motivate children and their families to increase physical activityand develop lifetime fitness habits.
³Only students assessed in all four areas are included in this calculation.

1280011 - Simsbury School District Printed on 02/27/2018 - Page 5
District Profile and Performance Report for School Year 2016-17Simsbury School District
Cohort Graduation: Four-Year¹2015-16
Cohort Count² Rate (%)
Black or African American * *
Hispanic or Latino * *
English Learners * *
Eligible for Free or Reduced-Price Meals 39 94.9
Students with Disabilities 49 65.3
District 366 95.1
State 87.4
¹The four-year cohort graduation rate represents the percentage of first-time 9th graders who earn a standard high school
diploma within four years.
²Cohort count includes all students in the cohort as of the end of the 2015-16 school year.
11th and 12th Graders Meeting Benchmark on at Least One
College Readiness Exam⁵Participation⁶ Meeting Benchmark
Rate (%) Count Rate (%)
Female 95.5 272 75.8
Male 95.2 287 76.3
Black or African American 94.7 17 44.7
Hispanic or Latino 96.6 21 72.4
White 95.3 476 77.3
English Learners N/A N/A N/A
Eligible for Free orReduced-Price Meals
100.0 29 55.8
Students with Disabilities 72.5 29 24.2
District 95.4 559 76.1
State 96.1 43.5
³College readiness exams and benchmark scores are as follows:
• SAT® - meets benchmark score on SAT, Revised SAT or Connecticut School Day SAT • ACT® - meets benchmark score on 3 of 4 exams (benchmark score varies by subject)
• AP® - 3 or higher on any one AP® exam
• IB® - 4 or higher on any one IB® exam
• Smarter Balanced - Level 3 or higher on both ELA and math
⁴Participation Rate equals the number of test-takers in 11th and 12th grade divided by the
number of students enrolled in those grades, as a percent.Sources:
SAT® and AP® statistics derived from data provided by the College Board.
Copyright © 2017 The College Board. www.collegeboard.org
ACT® statistics derived from data provided by ACT, Inc.
Copyright © 2017 ACT, Inc. www.act.org
IB® statistics derived from data provided by the International Baccalaureate Organization.
Copyright © International Baccalaureate Organization 2017
College Entrance and Persistence
Class of 2016 Class of 2015
Entrance⁷ Persistence⁸Rate (%) Rate (%)
Female 93.6 96.7
Male 83.2 93.4
Black or African American * *
Hispanic or Latino * *
White 89.2 96.4
English Learners * *
Eligible for Free orReduced-Price Meals
83.8 85.2
Students with Disabilities 65.1 84.4
District 88.2 95.0
State 72.0 88.5
⁵College entrance refers to the percent of high school graduates from
the year who enrolled in college any time during the first year afterhigh school.
⁶College persistence refers to the percent of students who enrolled in
college the first year after high school and returned for a second year(Freshman to Sophomore persistence).
Source: National Student Clearinghouse
1280011 - Simsbury School District Printed on 02/27/2018 - Page 6
District Profile and Performance Report for School Year 2016-17Simsbury School District
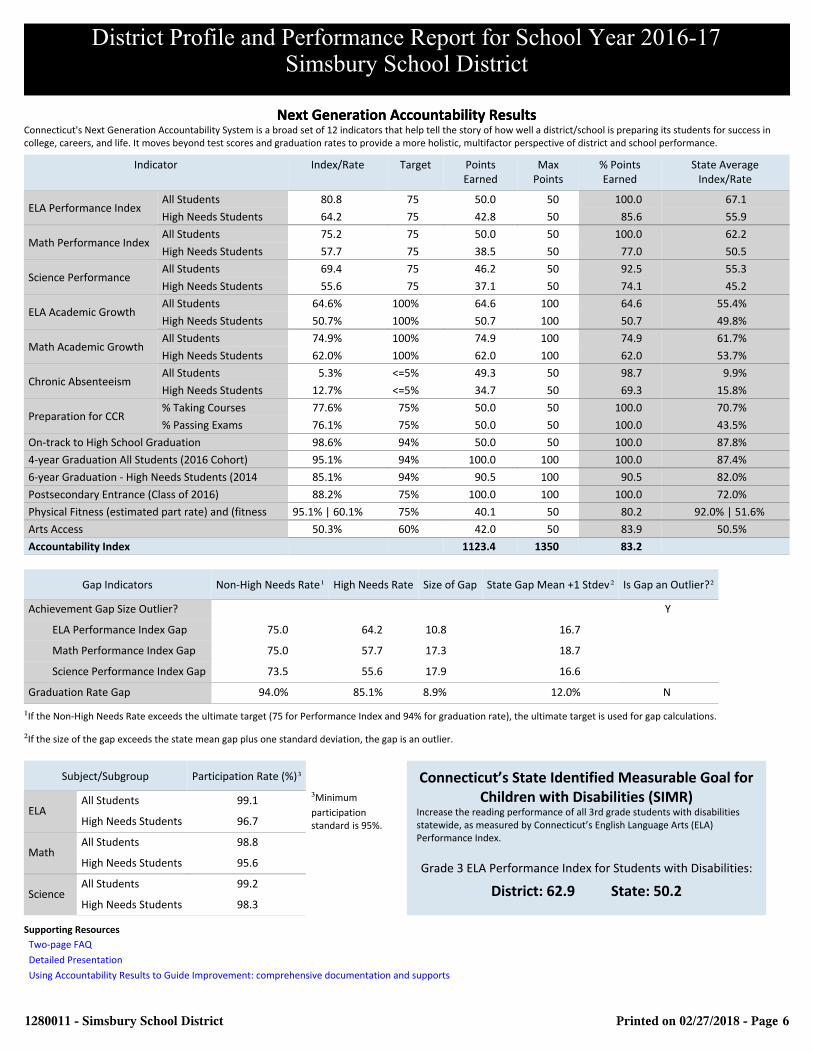
Next Generation Accountability ResultsNext Generation Accountability ResultsConnecticut's Next Generation Accountability System is a broad set of 12 indicators that help tell the story of how well a district/school is preparing its students for success incollege, careers, and life. It moves beyond test scores and graduation rates to provide a more holistic, multifactor perspective of district and school performance.
Indicator Index/Rate Target PointsEarned
MaxPoints
% PointsEarned
State AverageIndex/Rate
ELA Performance IndexAll Students 80.8 75 50.0 50 100.0 67.1
High Needs Students 64.2 75 42.8 50 85.6 55.9
Math Performance IndexAll Students 75.2 75 50.0 50 100.0 62.2
High Needs Students 57.7 75 38.5 50 77.0 50.5
Science PerformanceAll Students 69.4 75 46.2 50 92.5 55.3
High Needs Students 55.6 75 37.1 50 74.1 45.2
ELA Academic GrowthAll Students 64.6% 100% 64.6 100 64.6 55.4%
High Needs Students 50.7% 100% 50.7 100 50.7 49.8%
Math Academic GrowthAll Students 74.9% 100% 74.9 100 74.9 61.7%
High Needs Students 62.0% 100% 62.0 100 62.0 53.7%
Chronic AbsenteeismAll Students 5.3% <=5% 49.3 50 98.7 9.9%
High Needs Students 12.7% <=5% 34.7 50 69.3 15.8%
Preparation for CCR% Taking Courses 77.6% 75% 50.0 50 100.0 70.7%
% Passing Exams 76.1% 75% 50.0 50 100.0 43.5%
On-track to High School Graduation 98.6% 94% 50.0 50 100.0 87.8%
4-year Graduation All Students (2016 Cohort) 95.1% 94% 100.0 100 100.0 87.4%
6-year Graduation - High Needs Students (2014 85.1% 94% 90.5 100 90.5 82.0%
Postsecondary Entrance (Class of 2016) 88.2% 75% 100.0 100 100.0 72.0%
Physical Fitness (estimated part rate) and (fitness 95.1% | 60.1% 75% 40.1 50 80.2 92.0% | 51.6%
Arts Access 50.3% 60% 42.0 50 83.9 50.5%
Accountability Index 1123.4 1350 83.2
Gap Indicators Non-High Needs Rate¹ High Needs Rate Size of Gap State Gap Mean +1 Stdev ² Is Gap an Outlier?²Achievement Gap Size Outlier? Y
ELA Performance Index Gap 75.0 64.2 10.8 16.7
Math Performance Index Gap 75.0 57.7 17.3 18.7
Science Performance Index Gap 73.5 55.6 17.9 16.6
Graduation Rate Gap 94.0% 85.1% 8.9% 12.0% N
¹If the Non-High Needs Rate exceeds the ultimate target (75 for Performance Index and 94% for graduation rate), the ultimate target is used for gap calculations.
²If the size of the gap exceeds the state mean gap plus one standard deviation, the gap is an outlier.
Subject/Subgroup Participation Rate (%)³
ELAAll Students 99.1
High Needs Students 96.7
MathAll Students 98.8
High Needs Students 95.6
ScienceAll Students 99.2
High Needs Students 98.3
³Minimum
participationstandard is 95%.
Connecticut’s State Identified Measurable Goal forChildren with Disabilities (SIMR)
Increase the reading performance of all 3rd grade students with disabilitiesstatewide, as measured by Connecticut’s English Language Arts (ELA)Performance Index.
Grade 3 ELA Performance Index for Students with Disabilities:
District: 62.9 State: 50.2
Supporting Resources
Two-page FAQ
Detailed Presentation
Using Accountability Results to Guide Improvement: comprehensive documentation and supports

1280011 - Simsbury School District Printed on 02/27/2018 - Page 7
District Profile and Performance Report for School Year 2016-17Simsbury School District
Narratives
School District Improvement Plans and Parental Outreach Activities School District Improvement Plans and Parental Outreach ActivitiesOur commitment to excellence continues to be driven by our District Vision: “The Simsbury Public Schools cultivate the mind, body, & character of eachstudent. We engage students with a meaningful & rigorous academic foundation so that they can contribute to a global society with integrity,compassion, & resilience.” We achieve our goals for teaching & learning through a continuous improvement process to improve outcomes for students. The major components of this cycle include: aligning goals to the district-school vision, gathering data, analyzing the data, planning the work of the schoolto align with the vision, implementing the strategies & action steps outlined in the plan, and gathering data to measure the impact on student learning. Each school creates a plan based on analysis of data & student learning needs which relies on the principal working with stakeholders to set the plan forthe school. Teachers work in collaborative teams to assess student achievement, monitor student progress, and refine instructional practices. They usedata to determine needs, identify goals & strategies to meet those needs, and engage in a cycle of action & reflection that enable us to continuouslyimprove. Professional development (PD) is ongoing throughout the district over the course of the year to further support our improvement indicators. Our5-year focus is on a limited number of strategic initiatives: reading by end of gr. 3; performing on grade level in reading-writing-math by end of gr. 6;prepared for success in high school, demonstrated by grade level performance in reading-writing-math by end of gr. 8; prepared for college & careersuccess at end of gr. 12; demonstrating positive social choices at all levels; highly effective teaching in every classroom supported by highly effectiveleaders; stakeholders expressing satisfaction with the district's efforts related to safety & social emotional wellbeing; engaging stakeholders bycommunicating improvement efforts & providing opportunities to participate in the improvement process; and transparent & efficient budgeting thatsupports district goals. The special education department follows the same continuous improvement cycle in order to reduce the achievement gap of ourmost needy learners. PD is designed to improve programming and outcomes for students: improving teachers' skill in co-teaching andwriting & developing student goals & objectives to be measurable & aligned to our core curriculum. SPED teachers are part of general education teams,working to support the inclusion model so students with disabilities are receiving instruction in the classroom with limited pullout services. We have astrong partnership with parents & our home-school collaboration is a cornerstone for the success of our learners. Schools engage parents in theimprovement process through representation on school committees promoting feedback & conducting surveys, because we believe that partnerships withparents are essential to our success. Principals & the district communicate through weekly electronic messages & the district listserv, along with aCommunity Bulletin Board on our district website. In ensuring effective student attendance in our schools, we identify students who have theseissues & engage in dialogue with families, identifying preventative measures & supports to improve their attendance rate.
Efforts to Reduce Racial, Ethnic and Economic IsolationThe Simsbury Public Schools vision is to cultivate the mind, body, and character of each student. We strongly believe that our teaching and learningexperiences within our academic program must continually promote equity and respect among our student body. Our teachers provide learningopportunities for students toward reducing racial, ethnic, and economic isolation, so they can contribute to a global society with integrity, compassion,and resilience. Simsbury has been committed to the Open Choice Program since its inception, with close to 4% of our student body made up of Hartfordstudents attending our seven schools. Our district Choice Coordinator works with students, parents, teachers, and administrators to support a positive andseamless integration. A range of programs that highlight our commitment include, but are not limited to: inclusion of rich literature and picture booksacross the district related to various cultures, races and traditions; well-developed school Character Education Programs; PTO sponsored CulturalEnrichment programs focused on diversity; grades 1 and 4 participate in a Community Farm project with students and teachers from Hartford; SEEDprogram extends the school day for local and Choice students; the K-12 SS curriculum integrates themes and activities teaching about diverse cultures,instilling appreciation for diversity; WL (5-12) develops student awareness of the social and cultural values of foreign societies; gr. 7-12 studentsparticipate in a sister-school relationship with China; gr. 8 students attend a Holocaust survivor presentation; SHS students participate in the Model UNClub and Mock Trial competitions; and the town of Simsbury supports the ABC (A Better Chance) program, founded in 1963, which provides students ofcolor with the chance to attend college-prep private schools and public schools across the country. Students have opportunities to work with disabledpeers in athletics and the arts. The Multicultural Club, Gay Straight Alliance, and dance step team are active at SHS. In Simsbury, we believe that anunderstanding of and respect for diverse beliefs, cultures, backgrounds, abilities and perspectives enrich the lives and learning environments for all ourstudents.

1280011 - Simsbury School District Printed on 02/27/2018 - Page 8
District Profile and Performance Report for School Year 2016-17Simsbury School District
Equitable Allocation of Resources among District SchoolsEach year our administrators work collaboratively to develop an annual budget that addresses the needs of each school in support of the district goals.The annual cycle includes: administrators making requests to the superintendent which are then presented to the BOE. Once approved by the BOE thebudget is submitted to the town's BOS & BOF, presented at public meetings, and ends with a spring vote. Our annual budget process is designed to ensureequitable allocation of resources among our seven schools & various programs including consistent guidelines for class size at all levels; however, changesin student enrollment, BOE priorities, unfunded or under-funded federal and state mandates, increased special education needs, higher transportationand variable energy costs are main influences on resource allocation. During the budget process several school and community meetings are held by theSuperintendent and BOE members, including a local TV taping to discuss funding needs and gather feedback. Community input is welcomed throughpublic budget work sessions and through our interactive budget website.