student support services trio annual … › studentaffairs › trio › documents...student support...
TRANSCRIPT

STUDENT SUPPORT SERVICES TRIO
ANNUAL PERFORMANCE REPORT
SEPTEMBER 1, 2012- AUGUST 31, 2013
GRANT # P042A100879

2
Napa Valley Community College
Student Support Services TRiO
2012-2013 Annual Performance Report
EXECUTIVE SUMMARY
Student Support Services (SSS) TRiO is a federally funded grant program that began at Napa Valley College
in 1997. Since then we have served over 2,630 Napa Valley College students over the 16 years.
Student Support Services (SSS) TRiO Mission Statement
At Student Support Services (SSS) TRiO we are committed to providing services in an atmosphere where each student thrives and can obtain the necessary skills to reach their personal and academic goals. College success is created as a result of having an empowering support network, which we are committed to providing to each and every student. AUTHORIZATION
Title IV, Part A, Subpart 2, Section 402D of the Higher Education Act of 1965, as amended.
PROGRAM REGULATION 34 CFR part 646 Student Support Services Program
PURPOSE
The purpose of the Program is to increase the number of disadvantaged low-income college students, first-
generation college students and college students with disabilities in the United States who successfully
complete a program of study at the postsecondary level.
The program provides opportunities for academic development, assists students with basic college
requirements, and serves to motivate students toward the successful completion of their postsecondary
education.
The goal of SSS is to increase the college retention and graduation rates of its participants, facilitate their
transfer from two-year to four-year colleges and foster an institutional climate supportive of their
successes.
WHAT REGULATIONS APPLY
The following regulations apply to the Student Support Services Program:
(a) The Education Department General Administrative Regulations (EDGAR) in 34 CFR parts 74, 75. (b) 34 CFR part 646 Student Support Services Program (c) Higher Education Act (HEA) of 1965, as amended; Section 402D for SSS (d) OMB A-21

3
Student Support Services (SSS) TRiO: Mandated Services
Regulations: 34 CFR PART 646 STUDENT SUPPORT SERVICES PROGRAM
Academic Advising: An education plan leading to graduation and/or transfer will be created and updated with a qualified Student Specialist and Counselor.
Counseling: Academic and supportive counseling; early assistance for registration; follow-up on mid-semester progress reports.
Academic Mentoring: Tutorial services are a key component to the success of the program. SSS tutoring is
provided by peer tutors who are successful students and have undergone specialized NVC tutor training.
Financial Aid Advising: Assistance with filling out applications for FAFSA, grants, loans, and work study
employment. Help with scholarship searches and applications.
Financial & Economic Literacy: Participants that are new to SSS are given financial and economic literacy
information through the website CashCourse. The website covers various topics including how to
budget, preventing identity theft, saving money, understanding financial aid, and many other resources
and topics. In addition, a few of these topics are covered in the Counseling 97 course.
College Transfer Assistance: Individual planning for admission, application, and transition to four-year colleges, and universities. Academic trips to a four-year institution are provided by the program.
Social & Cultural Activities: Participation in theater, multicultural, and academic tours of four-year institutions.
Counseling Class: Every semester the SSS counselor, assisted by SSS staff, teach a 6 week course on College Success. This is a mandatory requirement of all new students who join the program.
Annual Performance Report (APR) All grantees funded under the SSS program must submit an annual performance report as a condition of the grant award. Two-year institutions must keep students’ records for a period of four (4) years. The report must include current and prior-year participants including prior-year participants no longer enrolled. The 2012-2013 APR report covers the academic time period of Fall 2012, Spring 2013, and Summer 2013. The purpose of the APR is to:
To determine the grantees’ compliance with requirements of the program To assess the extent to which grantees have met their approved goals and program’s objectives To calculate prior experience points which is included in this report To generate data on the SSS program as a whole for periodic publications and in response to the
Government Performance and Results Act (GPRA) and the Higher Education Opportunity Act (HEOA) Reports to Congress

4
Napa Valley Community College
Annual Performance Report
Student Support Services TRiO
September 1, 2012 to August 31, 2013
SECTION 1, PART 1: Project Identification / Characteristics
PR/Award Number: P042A100879 Project Director: Howard Willis
Type of Institution: Public 2-year Data Entry Person: Renee Coffin
Project Type: Regular Number of participants funded to serve: 180
Reporting Period: 09/01/2012 to 08/31/2013
Name of Grantee: Napa Valley Community College
Project Characteristics:
Has a Summer Bridge Program: No
Used Federal grant funds to provide grant aid: Yes
Required to provide matching grant funds: No
Received institutional or other non-federal funds: No
SECTION 1, PART 2: Project Required Services
This is a continuing new reporting requirement for all Student Support Services programs. Part 2 aims to
capture information on project’s provision of required services.
Required Service
Number / Percentage of
participants receiving service that
was provided by SSS
Number / Percentage of
participants referred to another
service provider
Academic Tutoring 13 7% 38 21%
Advice and assistance in
postsecondary course selection 176 98% 70 39%
Education/counseling to improve
financial and economic literacy 113 63% 82 46%
Information in applying for Federal
Student Aid 145 81% 155 86%
Assistance in completing and applying
for Federal Student Aid 122 68% 3 2%
Assisting in applying for admission to
4-year institutions and obtaining
Federal Student Aid
39 22% 23 13%
The “Number of participants receiving service that was provided by project” is defined as those participants that were
offered services by the project and subsequently receives services from the project. This figure does not include
participants that were offered services by the project by declined them.
The “Number of participants referred to another service provider” is defined as those participants that were offered
services by the project but were subsequently referred to another service provider. The Department is not asking
projects to report on whether participants actually received services from service provider or for projects to follow-up
with these participants to ensure services rendered.

5
Napa Valley Community College
Student Support Services TRiO
Annual Performance Report
September 1, 2012- August 31, 2013
Report on Number Funded to Serve and Prior Experience Standard Objectives for 2012-2013 Year
The following information reflects the approved funded number of participants to be served and the project
objectives for the project for this grant award cycle (2010-2015).
Number Funded to Serve:
In 2012-2013, this project is funded to serve 180 participants.
Sector of Grantee Institution:
C: Public 2-Year
Prior Experience Objective(s):
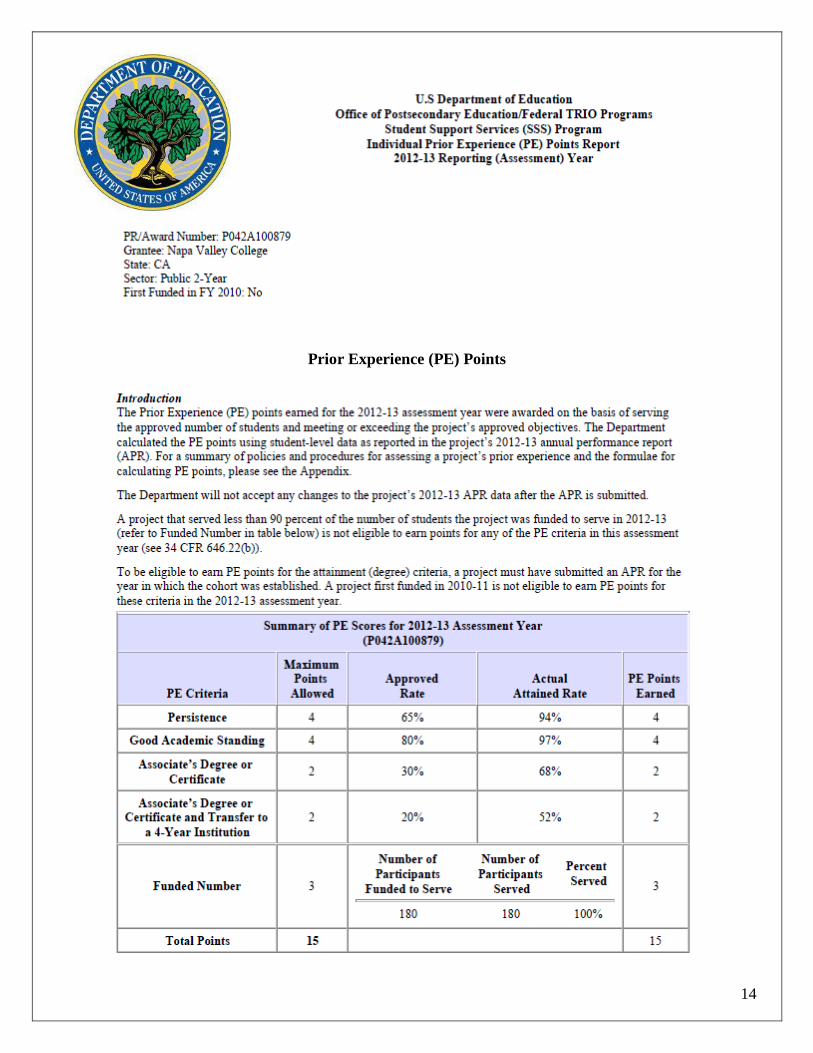
A. 2012-2013 Persistence Rate: 65% of all participants served by the SSS project will persist from
one academic year to the beginning of the next academic year or graduate and/or transfer from a 2-
year to a 4-year institution during the academic year.
B. 2012-2013 Good Academic Standing Rate: 80% of all enrolled participants served by the SSS
project will meet the performance level required to stay in good academic standing at the grantee
institution.
C. Graduation and Transfer Rates (2-year institutions only):
C1. 30% of 2009-2010 new participants served will graduate with an associate’s degree or
certificate within four (4) years.
AND
C2. 20% of 2009-2010 new participants served will transfer from a 2-year to a 4-year
institution with an associate’s degree or certificate within four (4) years.
.
Note: A new participant is an individual who was served by the SSS project for the first time in the
project year under consideration and who meets the definition of a participant as specified in
646.7(c) of the SSS program regulations.

6
2012-2013
43%
2010-2011
26%
2011-2012
31%
Napa Valley Community College
Student Support Services TRiO
Annual Performance Report
September 1, 2012- August 31, 2013
I. Demographic Profile of Project Participants
Participant Distribution by Gender
Gender Count Percentage
Male 60 33%
Female 120 67%
Total Number of Participants 180
Participants distributed by Eligibility
Participants with Disabilities 2012-2013
Refer/Receive Learning Services Count Percentage
SSS Referred for Learning Disability
Testing
44 24%
Students receiving Accommodations 35 19%
Students who are non-learning disabled 101 56%
Total Number of Participants 180 *The US Department of Education defines disabilities as a physical impairment. SSS TRiO at NVC serves students with learning disabilities,
though the U.S. Department of Education does not include learning disabilities in the definition and eligibility of disabilities.
Participants Served During the Reporting Period
Cohort Count Percentage
2010-2011 47 26%
2011-2012 56 31%
2012-2013 77 43%
Total Number of Participants 180
Eligibility Count Percentage
Low Income & First Generation 144 80%
Low Income Only 4 2%
First Generation Only 32 18%
Total Number of Participants 180
LI & FG
80%
LI
2%FG
18%
Female
67%
Male
33%
Non-LD
57%
LD Accom
19%
Referral to
LS
24%
Referral to LS
LD Accom
Non-LD

7
Participant Distribution by Ethnic Background
Project Participants (180) are asked to respond to a two-part question: whether the student identifies
themselves as Hispanic/Latino; second, what one or more race the student identifies themselves as.
Ethnicity Replied
‘Yes’
Replied
‘No’
Percentage
(180)
American Indian 1 179 1%
Asian 7 173 4%
African American 6 174 3%
Hispanic 151 28 84%
White 6 174 3%
Native Hawaiian or Pacific 2 178 1%
More than one race 7 173 4%
TOTAL 180
II. APR DATA SUMMARY
A. PARTICIPANT STATUS AND ACADEMIC STATUS
Participant Status
Participant means an individual who- 1) Is determined to be eligible to participate in the project
under 34 CFR 646.3; and 2) Received project services the grantee has determined to be sufficient to
increase the individual’s chances for success in a postsecondary education program.
Participant Status Count Percentage
New participant (2012-2013 cohort) 77 43%
Continuing participant 103 57%
Total number of participants 180
College Grade Level (entry into project)
College Grade Level (entry into project) provides information on the individual’s grade level at the
at the time the participant entered into academic year for all new and continuing participants still
enrolled at Napa Valley College.
College Grade Level (entry into project) Count Percentage
1st year, never attended before 94 52%
1st year, attended before 65 36%
2nd
year, Sophomore 21 12%
Total number of participants 180
New
43%
Continuing
57%
81%3%
1
7%
4%
3%
American Indian AsianAfrican American HispanicWhite PacificMore+
2nd year
12%
1st year,
attended
36%
1st year,
never 52%

8
First Service Enrollment Status
First Service Enrollment status provides information on participant’s enrollment status in the
academic year the participant was first served.
First Service Enrollment Status Count Percentage
Full-time (at least 24 credit hours) 113 63%
¾ time (at least 18 credit hours) 48 27%
½ time (at least 12 credit hours) 15 8%
Less than ½ time (less than 12 credit hours) 4 2%
Total number of participants 180
Enrollment Status (at end of the academic year)
Enrollment status provides information on participant’s annual progress toward graduation and
identifies groups of full-time and less than full-time students enrolled for a full academic year.
Enrollment Status (at end of academic year) Count Percentage
Full-time (at least 24 credit hours) 98 54%
¾ time (at least 18 credit hours) 52 29%
½ time (at least 12 credit hours) 20 11%
Less than ½ time (less than 12 credit hours) 10 6%
Total number of participants 180
Academic Standing
Academic Standing provides information on participant’s academic standing based on the
institution’s definition of good academic standing.
Academic Standing Count Percentage
Good Standing 174 97%
Not in Good Standing 6 3%
Total number of participants 180
Full Time
54%
3/4 Time
29%
<1/2 time
6%1/2 Time
11%
Full Time
63%
3/4 Time
27%
<1/2 time
2%
1/2 Time
8%
Good
Standing
96%
Not Good
Standing
4%

9
Cumulative Grade Point Average (GPA)
Cumulative GPA provides information on the participant’s grade point average at the end of the
2012-2013 academic year.
Cumulative GPA Count Percentage
3.50-4.00 GPA 48 27%
3.00-3.49 GPA 62 34%
2.60-2.99 GPA 36 20%
2.00-2.59 GPA 28 16%
Below 2.00 GPA 6 3%
Total number of participants 180
B. ACADEMIC PROGRESS / PERSISTENCE
Beginning Current Grade Level (beginning of academic year)
Beginning Current Grade Level provides information on the individual’s grade level at the beginning
of the academic year, 2012-2013.
Beginning Current Grade Level Count Percentage
1st year, never attended before 44 24%
1st year, attended before 54 30%
2nd
year, Sophomore 82 46%
Total number of participants 180
Current Grade Level (at end of the academic year)
Current Grade Level provides information on the individual’s grade level at the end of the academic
year, 2012-2013.
Current Grade Level (end of academic year) Count Percentage
1st year 47 26%
2nd
year, Sophomore 133 74%
Total number of participants 180
2nd year
46%
1st year,
attended
30%
1st year,
never 24%
2nd year
74%
1st year
26%
27
34
20
16
3
0
5
10
15
20
25
30
35
Pe
rce
nta
ge (
%)
3.5-4.0 3.0-3.5 2.6-3.0 2.0-2.5 2.0-0.0
GPA Range

10
Reason for Withdrawal / Not Returning
Reason for Withdrawal / Not Returning provides information on the reason why the participant
withdrew from Napa Valley College or did not return.
Transfer Status
Transfer provides information on participants who have transferred to another institution.
Undergraduate Degree / Certificate Completed
Undergraduate Degree / Certificate provides information on participants who have completed their
academic coursework to earn a degree and/or certificate at Napa Valley College.
Reason for Withdrawal / Not Returning Count Percentage
Withdrew / Academic Dismissal 0 0%
Withdrew / Did not return for personal
reasons
10 6%
Not applicable (military service) 1 1%
Not applicable (student still enrolled,
graduated or transferred)
169 94%
Total number of participants 180
Transfers Count Percentage
Transferred from 2-yr to another 2-yr
institution
1 1%
Transferred from 2-yr to 4-yr institution 38 21%
Not applicable (still enrolled or graduated
with degree or certificate but did not
transfer)
130 72%
Not applicable (not enrolled at NVC –
withdrew, military services, or deceased)
11 6%
Total number of participants 180
Undergraduate Degree / Certificate Count Percentage
Certificate only – Did not transfer 2 1%
Associate’s Degree only – Did not transfer 3 2%
Associate’s Degree AND Transfer to 4-yr 29 16%
Certificate AND Transfer to 4-yr 3 2%
No degree/certificate, still enrolled 126 70%
Transfer only (no degree, no certificate) 6 3%
No degree, not enrolled 11 6%
Total number of participants 180
21%
72%
1%6%
2yr to 2yr
2yr to 4yr
N/A (enrolled, or grad only)
N/A (withdrew, military or deceased)
6%
93%
1%
Withdrew (Personal)N/A (enrolled, Grad or Tran)Military
6%
70%
3%
2%
16%
1%
2%
Certif Only AA/AS OnlyAA/AS & TRAN Certif & TRANStill Enrolled Transfer onlyNot Enrolled

11
Field of Study Degree / Certificate Earned
Field of Study Degree / Certificate earned provides information on participants who have obtained
a degree or certificate and indicate the participants’ major field of study in which the degree/certificate was
attained. Note: * 2-year institutions who do not offer a degree/certificate in a specific field of study.
Persistence / Graduation Status
Persistence / Graduation Status (at the beginning of the 2013-2014 academic year) provides the
information needed to determine, on an annual basis, the extent to which the grantee has met its approved
persistence objective (i.e. prior experience points) for the academic year as well as to determine the
performance measures of freshmen participants who are enrolled at Napa Valley College.
Field of Study Degree / Certificate Count Percentage
General Studies / Transfer Degree* 17 9%
Business / Management 1 1%
Social / Behavioral Science 19 11%
Has not earned a degree/certificate 143 79%
Total number of participants 180
Persistence / Graduation Status Count Percentage
Graduated w/ degree or certificate
only; did not transfer
2 1%
Graduated w/ degree or certificate
AND transferred to 4-yr institution
31 17%
Transferred from 2 yr. to 4yr.
institution without earning degree or
certificate
6 3%
Not enrolled at NVC 11 6%
Still enrolled at NVC (no degree
completed)
130 72%
Total number of participants 180
73%
17%3%6% 1%
AA Degree or Certif. onlyDegree or Certif. AND TransTransfer onlyNot EnrolledStill enrolled
74%
1%5% 19%1%
General Studies/TransferBusinessBehavioral ScienceVocationalNo Degree/Certif yet

12
C. STUDENT FINANCIAL ASSISTANCE
Financial Aid Received
Financial Aid Received provides information on the amount of financial aid a participant received as
determined by the Financial Aid Office. This amount does not include the amount of the expected family
contribution or the amount of SSS Grant Aid.
Financial Aid Amount Received
Number of SSS students that received Financial Aid 161 / 180 89%
Average amount of Financial Aid a SSS student received $ 4,977.00
Total amount of Financial Aid received by 164 SSS students $ 801,363
Student Support Services (SSS) Grant Aid
SSS Grant Aid provides information on the amount of federal grant aid a program may award to a
project participant in their first two years of postsecondary education and who are receiving Federal Pell
Grants.
SSS Grant Aid Number
Number of SSS students that were awarded SSS Grant Aid 21/180 12%
Average amount of SSS Grant Aid student received $893.00
Total amount awarded in SSS Grant Aid for 2011-2012 year $18,755

13
III. Project Performance Objectives & Outcomes
Performance Criteria Objective Description 2012-2013 Outcomes
Persistence 65% of all participants served by the
SSS project will persist from one
academic year to the beginning of the
next academic year or graduate
and/or transfer from a 2-year to a 4-
year institution during the academic
year.
Enrolled for Fall 2013
Graduated and/or Transferred
94% (169) Persistence Rate
Good Academic
Standing
80% of all enrolled participants
served by the SSS project will meet
the performance level required to
stay in good academic standing at the
grantee institution and achieve a 2.6
GPA or higher.
GPA # %
4.0 - 3.5 48 (27%)
3.49- 3.0 62 (34%)
2.99- 2.6 36 (20%)
2.59- 2.0 28 (16%)
Below 2.0 6 (3%)
81% (146/180) achieved a 2.6 GPA
(or higher) for 2012-2013.
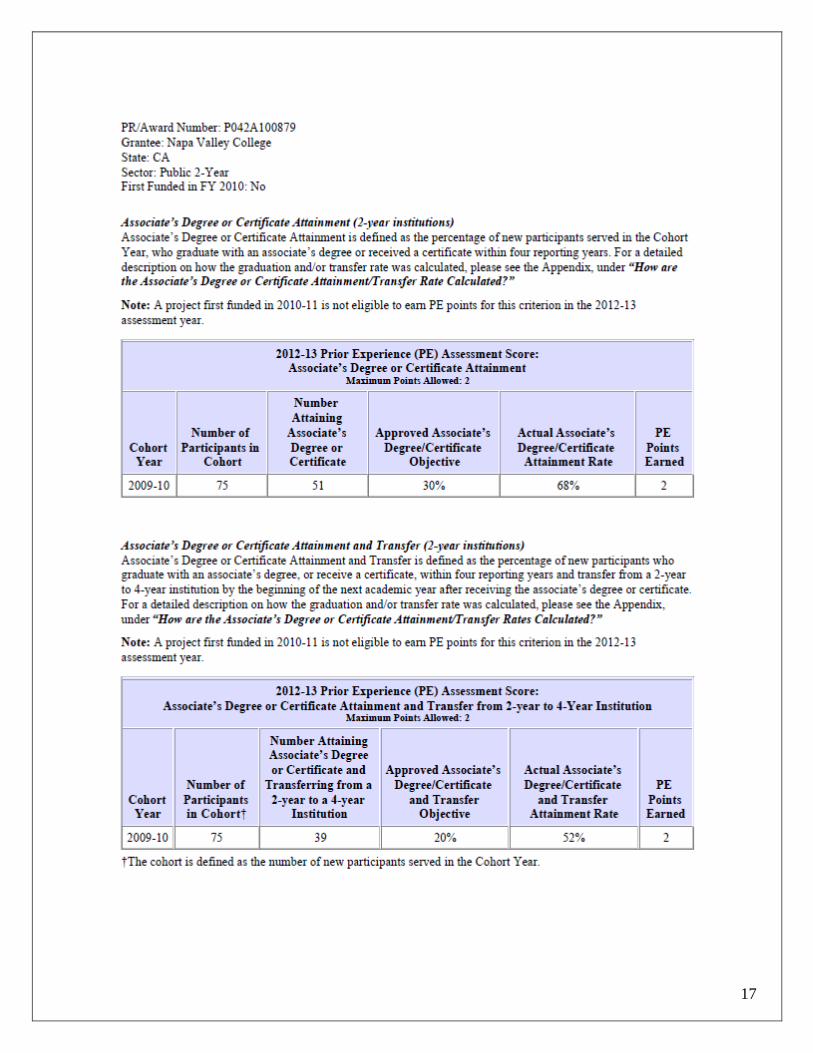
Graduation /
Transfer
30% of 2009-2010 new participants
served will graduate with an
associate’s degree or certificate
within four (4) years.
AND
20% of 2009-2010 new participants
served will transfer from a 2-year to
a 4-year institution with an
associate’s degree or certificate
within four (4) years.
75 Students in 2009-2010 Cohort
Associate’s Degree or Certificate
51/75 68%
Transfer 2yr-4yr with Degree or
Certificate 39/75 52%
Administration Each year, 100% (180) students of
the eligible participants will be
identified and selected for the
program.
2/3 (67%) will be first-generation
and low income or be disabled;
1/3 (33%) will be either LI or FG.
80% (144) Low Income, First-
Generation
18% (32) First-Generation only
2% (4) Low income only
100% (180) students served and
reported for 2012-2013
*The Student Support Services TRiO program at Napa Valley Community College has met and
exceeded all objectives and performance criteria for the 2012-2013 Annual Performance Report.
Report submitted 12/3/13 by SSS Secretary, Renee Coffin.
14
Prior Experience (PE) Points

15

16
17

18
STUDENT SUPPORT SERVICES (SSS) TRiO
STAFF
Napa Valley Community College
Student Support Services (SSS) TRiO
2277 Napa-Vallejo Highway, Napa, CA 94558
Office Phone: 707-256-7350 Fax: 707-256-7359
www.napavalley.edu/sss
Howard Willis
Director
Renee Coffin
Secretary
Roberto Alvarado
Student Specialist
Martin Olguin
Student Specialist