student success committee - academic support
TRANSCRIPT

STUDENT SUCCESS
COMMITTEE 2018-2019 ANNUAL REPORT

2
Table of Contents
Introduction 4
Committee Background and Charge 4
Executive Summary 6
2018-2019 Student Success Committee Members 8
Current Status of Missouri S&T Retention and Graduation Rates 9
Key Issues Addressed by the Committee 11
Under Represented Minority Students 12
Transfer Student Experience 14
Graduate Student Experience 17
Time to Degree/Credit Hours to Graduation 20
APPENDIX A- Cumulative Retention & Graduation Rates 31
Of First-Time, Full-Time Degree Seeking Freshmen
APPENDIX B- Retention Strategies and Tactics 34
APPENDIX C- Other Documents 37
APPENDIX D- 2018-2019 Meeting Minutes 129

3
Special thanks to the following offices as sources of information:
College of Arts, Sciences, and Business College of Engineering and Computing Enrollment Management Graduate Studies Student Affairs Academic Support

4
Introduction
The Student Success Committee serves as an advisory committee appointed by the Chancellor to
address key issues related to improving student retention and student academic success. During
the 2018-2019 academic year, the Student Success Committee met every other week under the
direction of two chairs: the Vice Provost for Academic Support and the acting Vice Provost and
Dean for Enrollment Management. This report includes a summary of the primary issues
addressed by the Student Success Committee, as reflected in the 2018-2019 meeting minutes.
Committee Background and Charge
The Student Success Committee is charged with investigating and recommending to the Provost
and the Chancellor specific programs, processes, and services that will serve and support all
Missouri S&T students in achieving their educational, professional, and personal life goals.
In completing these tasks the Student Success Committee will:
1. Focus on undergraduate and graduate student success within the context of the mission
and vision of Missouri S&T. The committee will emphasize in its work the S&T values of
life-long success, creativity, integrity, sustainability, partnerships, and inclusion.
2. Take into account the diverse nature of the students we serve at Missouri S&T, the
diverse nature of the majors and minor programs we offer, and the increasingly complex
blend of modalities in communications and delivery that are used in instruction, advising
and research.
3. Investigate best practices in serving a broad profile of students ranging from traditional
students (18 to 24 years of age), to adult/older students, transfer students, and diverse
populations that may include underrepresented minorities, international students, first-
generation students, low-income students, veterans, full- and part-time students, etc.
4. Keep the university community informed through publication of an annual report.
5. Research best practices in supporting all students so that they persist to graduation such
as the following:
Best practices in student transitions from high school or from another higher
educational institution to a university including, but not limited to, summer bridge
programs, incoming freshmen placement exam policies, advising, residential life
policies and programming, learning/living communities, freshmen and sophomore
seminars, honors programs, freshmen or university-wide common reading projects,
peer mentoring, at-risk student monitoring (i.e. student success mentoring), etc.

5
Best practices aimed at increasing retention of both new and returning students
including, but not limited to, intrusive advising, early warning systems, academic
mapping and planning tools, financial aid policies, etc.
The student success committee members are appointed by the Chancellor and will typically
include a broad range of representation including faculty, staff, and students from a wide range of
offices and disciplines at Missouri S&T.
The Student Success Committee meets every other week (during the academic year) to discuss
issues related to improving student retention and student academic success, and to implement
new programs and processes that impact student retention. In November, the Student Success
Committee presents its findings and recommendations to the Chancellor. A copy of the annual
report is available on the Academic Support website and upon request.

6
Executive Summary
Accomplishments from the November 2018 Recommendations
Revise language in our admittance letter for first year students.
Develop a website detailing entrance requirements for all majors.
Establish a central advising center.
A campus-level communication plan to address Graduate Research Assistant and Teaching
Assistant duties.
Conduct focus groups in an attempt to get feedback and gather qualitative data to begin
measuring the climate, social integration on campus, sense of belonging, and academic
success among URM students.
Recommendations by the Student Success Committee in November 2019
Continue focus groups of URM students.
Provide more resources to transfer students to help ensure their academic success and
retention.
Explore the preparedness of our transfer students and how we might improve the quality
of the incoming student.
Finalize the Discussion Guide for Graduate Students and Advisors and shared it with
graduate students and faculty advisors.
Develop a Graduate Student Success Guide with involvement by Global, Graduate Studies,
International Affairs, and the Colleges.
Create a Graduate Student Resource Center.
Revisit retention and time-to-degree, perhaps with the assistance of an upper-level
statistics or engineering management course.
Explore different funding/enrollment models to ensure student financial support and a
healthy work/life balance.
Launch a feasibility study/benchmarking to determine what comparator schools are doing
and what benefits and obstacles are involved in various models.
Add an International Affairs staff member to the Student Success Committee and the
Graduate Student Experience subcommittee
The Student Success Committee reviewed the following documents
Appendix A
Cumulative Retention & Graduation Rates of First-Time, Full-Time Degree Seeking
Freshmen.
Appendix B
Retention Strategies & Tactics.

7
Appendix C
Enrollment Management: Calculus Location Analysis
4th Week Enrollment Talking Points

8
2018-2019 Student Success Committee Members
Co-Chairs:
Dr. Jeff Cawlfield, Vice Provost for Academic Support
Brooke Durbin, Acting Vice Provost and Dean for Enrollment Management
Committee Members:
Bridgette Betz, Director, Student Financial Assistance
Christina Carrig, Student Council Representative
Tyrone Davidson, Co-Director, Advising Center
Dr. Patty Fleck, Director, Counseling Services John Gallagher, Director, Student Life
Dr. Shannon Fogg, Interim Dean, College of Arts, Sciences, and Business
John Gallagher, Director, Student Life
Dr. Eddie Grover-Bisker, Vice Chancellor of Student Affairs
Deanne Jackson, Registrar, Registrar’s Office Kayla Klossner-Thompson, Director, New Student Programs
Quentin Lee, Undergraduate Student Representative
Dr. Doug Ludlow, Co-Director, Advising Center
Rachel Morris, Assistant Vice Provost, Student Support
Dr. John Myers, Associate Dean, College of Engineering and Computing
Julia Morgan, Graduate Student Representative
Adrienne Neckermann, Assistant to the Vice Provost, Graduate Studies
Dorie Paine, Director, Residential Life
Dr. Stephen Raper, Associate Professor, Engineering Management & Systems Engineering
Dr. Dan Reardon, Assistant Professor, English and Technical Communications
Anitra Rivera, Director, Student Diversity Initiatives
Paul Runnion (Lecturer), Mathematics
Cathy Tipton, Interim Director, Admissions
Dr. Dave Westenberg, Associate Professor, Biological Sciences
Dr. Klaus Woelk, Associate Chair, Chemistry
William Zwikelmaier, Director, COER
Ex Officio
Joni Burch, Associate Director, Residential Life
Dr. Kate Drowne, Ph.D., Interim Vice Provost and Dean, College of Arts, Sciences, and Business
Erica Long, Senior Academic Advisor, Mechanical & Aerospace Engineering
Donna Luechtefeld, Executive Assistant, Enrollment Management
Dr. Caprice Moore, Interim Vice Provost for Global Learning
Dr. Stephen Roberts, Interim Provost
Katie Tucker, Degree Completion Advisor, Registrar
Dr. Costas Tsatsoulis, Vice Chancellor for Research and Dean of Graduate Studies
Dr. Richard Wlezien, Vice Provost and Dean, College of Engineering and Computing

9
Current Status of Missouri S&T Retention
In 2008, Missouri S&T achieved a record high first to second year retention rate of 88%. Since
2008 the figure has fluctuated irregularly between 81% and 87% (over the last 5 years, the median
first to second year retention rate is 83%). For the fall 2017 cohort, the first year retention rate
was 83%; this is 2% above the rate for the fall 2016 cohort. The current Missouri S&T strategic
plan goal is to achieve a first to second year retention of 85% by 2023.

10
As the Student Success Committee moves forward with its charge, the measurement of the
committee’s achievement of success will be this metric.
A full report of Cumulative Retention & Graduation Rates of First-Time, Full-Time Degree
Seeking Freshman, is included as Appendix A of this report. A complete list of Retention
Strategies and Tactics is included as Appendix B.

11
Key Issues Addressed by the Committee
In 2018-2019, the Student Success Committee focused on four priority goals deemed critical to
retention issues. The committee organized itself into four subcommittees to coordinate the
implementation of recommended actions. Action items were pursued as tactical planning items
where practical.
Subcommittee #1: Under Represented Minority Students
Members: Bridgette Betz, Jeff Cawlfield, Tyrone Davidson, Patti Fleck, Rachel Morris (chair), Adrienne
Neckermann
Subcommittee #2: Transfer Student Experience
Members: Erica Long (chair), Anitra Rivera, Katie Tucker, Dave Westenberg, Klaus Woelk
Subcommittee #3: Graduate Student Experience
Members: Patti Fleck, John Gallagher, Deanne Jackson, Adrienne Neckermann (chair), Caprice Moore,
John Myers
Subcommittee #4: Time to Degree/Credit Hours to Graduation
Members: Bridgette Betz, Caprice Moore, John Myers, Steve Raper (chair), Dan Reardon, Will
Zwikelmaier

12
Subcommittee #1: Under Represented Minority Students
Charge
This subcommittee was established to work with underrepresented minority students to identify
barriers and challenges to student success at Missouri S&T.
Summary
A survey was sent to 574 students identified at underrepresented minorities on campus in the
spring 2019 semester. Of the 574 students, 41 students responded to the survey. Of the 41 students, 16 were interested in being in a focus group for fall semester 2019. Three of those 16
students attended the first focus group meeting on August 22, 2019.
8-22-19 focus group discussion
How did you hear about Missouri S&T?
From Moberly, MO. Attended a summer camp
From Rolla. Cheapest option with scholarships and assistance
From Houston TX. Brother played football here and had a good experience.
One student found internships through NSBE. The companies he worked for do not come to
Missouri S&T’s career fair (Whirlpool, American Express)
Engineering Management student found internship by attending the Night to Network event
before the career fair. Said it is hard for an Engineering Management major to acquire internships
via career fair.
Where did you learn about available campus resources to help you?
LEAD sessions posted in syllabus
Writing Center was required by FE program
Classmates using the app “GROUPME”
OWeek mentor continued to be a resource after opening week
Library where students were studying
Word of mouth
Note: We asked and it was suggested that a central location/table of resources would be helpful
at the library. Another possibility would be minerbytes.
Concerns:
None of the 3 had personally experience stereotyping on campus but have had friends
who have experienced it. Said the African American students are underestimated in their
academic abilities. They are given “easier” parts of projects and their input is not valued.
They feel they have to prove themselves.
Sexual assault in organizations. Incidents being reported but not sure if it is taken care of.
Several orgs have several incidents.
Do not want the +/- system to be implemented
One faculty compiles all notes for class in an eBook and requires the students to purchase.
Would like to see all faculty have to post grades to canvas-require.
Midterm grades made available.

13
Lack of structure/organization of faculty
Multiple choice exams not helpful (statics, mechanics of materials). Many students have to
retake course.
Financial struggles: both academic and day to day financial.
Feel instructors care more about research than students/classes.
Would like to see more rewarding for student’s academic success (i.e. finishline
scholarship)
How do students feel about counseling services?
Nothing negative.
More diverse staff would be helpful.
Don’t hear enough about services.
Advice for freshmen
Speak to upper classmen
Take as many classes off campus (i.e. math/physics)-“weed out” classes
Read emails
Ideas:
More social activities for students (i.e. pep rally type events)
Provide food for all students as they are walking to class (i.e. breakfast burrito handouts)
When promoting events, use google calendar instead of emails. Students can accept the invite and it goes to their calendar and they receive reminders via text.
Use videos when promoting events.
The students liked the idea of continuing the focus group throughout the year and agreed to
promote the focus group to their friends.
Recommendations
The subcommittee is working to establish a productive working focus group as the students were
receptive to the idea of meeting throughout the year. Those meetings will give the subcommittee
more understanding of challenges students face as well as ideas to implement change to assist with
those challenges.

14
Subcommittee #2: Transfer Student Experience
Charge
This subcommittee was established to examine the academic success of Missouri S&T transfer
students as it relates to probation, deficiency, and withdrawals on campus.
Summary
Primary concerns arose from data presented by the department of mechanical and aerospace
engineering, showing a significant difference in the rate at which transfer students were placed on
probation or deficiency when compared to non-transfer (native) students within that department.
The decision was made to explore this data at the campus and college levels.
Analysis and Research
The committee began its work by requesting enrollment data for the campus, broken down by
transfer and non-transfer students as well as the same information for students who had been
placed on probation or deficiency during the most recent four terms. Data was also collected from the registrar office for students who had withdrawn from all courses via our retention
specialist (Note – this does not include students who simply did not return to campus).
While it was not analyzed for this report cycle, also included in the data were the students’
specific major, academic level, age, gender, and race.
Total Campus Data for Probation and Deficiencies
In three of the four semesters analyzed, a greater percentage of Missouri S&T transfer students
were placed on scholastic probation compared to non-transfer students. These differences are
consistent though they may not be significant. However, over this time period, both non-TRE and
TRE students show a similar percentage of students on deficiency.
Probation and Deficiencies by College
Differences among transfer students and non-transfer students were similar when compared at
the College level. For the College of Engineering and Computing, a comparable percentage of
transfer students were placed on scholastic probation as non-transfer students with the exception
of the two most recent semesters. In those semesters, the percentage of TRE students on
probation was as much as 1.42 percentage points higher than non-TRE students. A similar trend is
seen for CEC students placed on deficiency with similar percentages in two semesters but
differences as great as 0.62 percentage points.

15
In the College of Arts, Sciences, and Business, transfer students were placed on scholastic
probation as much as 2.31 percentage points higher than non-transfer students in three out of
four semesters. In addition, deficiencies among TRE students were as much as 1.5 percentage
points greater than among non-TRE students in two of four terms.
Overall, the two-year average percentage of deficiencies for transfer and non-transfer students
does not appear to be significant, with the only difference being 0.5 percentage points greater
deficiencies for CASB transfer students. The two-year average percentage of probationary status
for both colleges is higher for transfer students, but the significance of a 0.6 percentage point
difference is yet to be determined.
Withdrawals from all Courses
While the percentage of student withdrawals from courses may seem low, transfer students do so
at nearly twice the rate of non-transfer students. This is a difference the committee believes
should be explored further.

16
Recommendations
The undergraduate student population at Missouri S&T is comprised of approximately 20%
transfer students, yet they represent 30% of the students who have withdrawn from all classes in
the past four terms. These students as a group underperform, sometimes significantly, when
compared to non-transfer students. The committee believes that we, as a campus, could provide
more resources to transfer students to help ensure their academic success and retention.
Additionally, it could be beneficial to explore the preparedness of our transfer students and how
we might improve the quality of the incoming student.

17
Subcommittee #3: Graduate Student Experience
Charge
The subcommittee was established to examine how to improve graduate student experience at
Missouri S&T. This is the fourth year of this subcommittee. The subcommittee charge for 2019 is as
follows:
Examine quality of life issues (funding, housing, community, etc.) affecting graduate
students.
Examine the academic experiences of graduate students.
Explore how non-academic resources are provided to graduate students.
Make recommendations to improve graduate student experience
Summary
The Graduate Student Experience Subcommittee started in 2015 to address student success
issues at the graduate level. The first year, the subcommittee initiated its first Graduate Student
Experience Survey to gauge student satisfaction with Missouri University of Science and
Technology, including admission processes, funding, working conditions, developmental
opportunities, and other relevant topics. The committee planned to re-survey every three years.
In 2016, the subcommittee conducted its first graduate student focus group, which provided an in-
depth look at the educational experiences of graduate students. This first focus group was
comprised solely of graduate students from the College of Engineering and Computing (not by
design, simply by chance). In 2017, the subcommittee conducted a second focus group with
graduate students from the College of Arts, Sciences, and Business. Also in 2017, the
subcommittee assessed time-to-degree for doctoral students. In 2018, the subcommittee re-
administered the Graduate Student Experience Survey and conducted a focus group for distance
graduate students.
In 2019, the Graduate Student Experience Subcommittee had several new members, so the first
part of the year included bringing new members up to speed on the previous subcommittees’
work, including reviewing survey responses, focus group details, etc. This also provided an
opportunity for the subcommittee to reevaluate their charge and determine which next steps
were necessary. As a result of several discussions, the subcommittee:
1. Revisited data regarding retention and time-to-degree for graduate students. The data
available is very poor and the lack of firm, clear data makes obtaining baselines and tracking
students hard.
a. The subcommittee would suggest, as a starting point, to consider students with no
change of program or lapse in attendance (i.e. a student who starts as a master’s
student and does not add a certificate or switch to a doctoral program).
b. Consider tasking an engineering management or statistics course with normalizing
the data and looking more closely at time-to-degree and retention.
2. Reviewed a report provided by the Registrar’s Office that includes contacting students
who have not returned for a second semester and asking what barriers might prevent
their return. Unofficial report indicated students did not register because:

18
a. Holds (advising, cashier’s, grad studies, etc.)
b. Forgot
c. Intentionally waiting/still planning to enroll
d. Personal reasons (family, job conflicts, etc.)
3. Created a Discussion Guide for Graduate Students and Advisors
a. The intent of this document is to encourage faculty advisors and graduate student
advisees to clarify general expectations of an advisor/advisee relationship, including
deadlines, expected output, number of papers, expected degree progress, work/life
balance, funding, etc.
b. This would not replace face-to-face interaction or advising meetings, but would
supplement communication, clarify expectations, and provide a reference point for
the student and advisor throughout the student’s career at Missouri S&T.
4. Suggests creation of a Graduate Student “Success Guide”
a. This document would help graduate students navigate their career at Missouri S&T
and to answer frequently asked questions not listed in the Graduate Catalog and
are not obvious to students on how to navigate. Examples would include:
i. What happens if my research funding runs out?
ii. How do I change advisors?
iii. What do I do if my advisor leaves the university?
iv. Can I participate in an internship/co-op/study abroad semester?
v. Can I take distance courses if I am an on-campus student?
vi. How do I change from thesis to non-thesis (and vice-versa)?
vii. How do I handle a grievance?
viii. What if I am on a GRA but I want to gain teaching experience?
ix. How do I get involved in a graduate student support group?
b. This document would be a collaborative effort among the Office of Graduate
Studies, Global, International Affairs, and the Colleges.
c. This document could include links to important campus resources such as Equity &
Title IX, Student Involvement, Career Opportunities & Employer Relations,
Counseling Services, Wellness, etc.
d. A limited selection of frequently asked questions are available on each office’s
webpage. This would be an opportunity to collaborate and create an encompassing
document so that graduate students have access to all of this information in a
searchable, sortable document.
5. Suggests creation of a Graduate Student Resource Center
a. A Graduate Student Resource Center would be a place for graduate students to
access resources, participate in social and networking events, attend graduate-
specific workshops, and present defenses. This space could spur collaborative and
inter-disciplinary work and subsequently increase creativity and research.
Recommendations
1. Finalize the Discussion Guide for Graduate Students and Advisors and shared it with
graduate students and faculty advisors.
a. Sent to graduate students from the Office of Graduate Studies each semester

19
b. Sent to faculty from the College Deans each semester
c. Included as a checklist item in Starfish/S&T Connect
d. Included with CAFÉ resources
2. Develop a Graduate Student Success Guide with involvement by Global, Graduate Studies,
International Affairs, and the Colleges.
3. Create a Graduate Student Resource Center.
4. Revisit retention and time-to-degree, perhaps with the assistance of an upper-level
statistics or engineering management course.
5. Next year:
a. Explore different funding/enrollment models to ensure student financial support
and a healthy work/life balance. Launch a feasibility study/benchmarking to
determine what comparator schools are doing and what benefits and obstacles are
involved in various models.
a. Add an International Affairs staff member to the Student Success Committee and
the Graduate Student Experience subcommittee

20
Subcommittee #4: Time to Degree/Credit Hours to Graduation
Charge
Given the increased scrutiny of 4 year and 6 year graduation rates, this subcommittee basically
evaluated a more extensive data set (8 years versus 5) that was first conducted in 2015-2016, and
2016 - 2017. In the latter study, four separate required degree hours categories were used: 120
credit hour programs (BS and BA), 126 credit hour program (Technical Communications), 128
credits hours BS programs, and programs that included primary or secondary education that
would be well over 128 credit hours. Data sets for each category included First Time College
Students (FTC) and Transfer (TRE) Students. In addition, a deep inspection of degree audits for
the Engineering Management May 2019 graduating class was conducted, as well as responses to
written questions. A small number of CASB program students responded to a range of questions
and the May 2019 Computer Science graduates provided written responses to the same set of
questions. Additional insights are provided from a report of the CEC Academic Affairs
Committee with regard to courses in programs with identified high rates of F or D grades and Withdraws. A small number of articles and research studies were reviewed to find successful
programs or strategies to increase retention and graduation rates.
Summary
Original Motivation*
Average credit hours at graduation was discussed as an agenda item of the General Officers
meeting on July 8, 2015. For the 2013-2014 graduating class, the average number of credit hours
students graduate with at:
MU 134
UMKC 138
Missouri S&T 147
UMSL 141
System Average 137
Credit hour graduation requirements*
Bachelor of Arts (BA) and Bachelor of Science (BS) programs at Missouri S&T specify the required
and elective courses and set the minimum number of credit hours required for each degree
program. BA programs typically require a minimum of 120 credit hours but may be higher.
Biology, Business and Management Systems, Chemistry, Economics, English, History, Information
Science and Technology, Multidisciplinary Studies, and Philosophy require a minimum of 120 credit
hours. Programs that offer the secondary education emphasis require additional hours ranging
from 124-135 credit hours. Technical Communications requires a minimum of 126 credit hours.
BS programs typically require a minimum of 128 credit hours. However, Geology and Geophysics
requires a minimum of 127 credit hours. Mathematics requires a minimum of 128 credit hours,
however the minimum increases to 135 credit hours with the secondary education emphasis. All
engineering programs require a minimum of 128 credit hours with the exception of Chemical and
Petroleum Engineering, which require 129 credit hours.

21
Reasons minimum credit hours for graduation requirements may be exceeded*
There are a wide variety of known reasons the minimum credit hours for graduation can be
exceeded. These reasons cross the entire spectrum, positive, negative and neutral. Positive
reasons, or those which might be considered “value-adding” from the student’s perspective
include obtaining minors, dual majors or second BA/BS degrees. There are two examples that
could be considered negative that are actually a very positive outcome. The first is that students
change their majors. This means that they are persisting with the university but will subsequently
have more credit hours. The second example concerns students that start in a lower math
course. Because they are in the lower math course they will have to take more math courses to
be able to continue through their degree requirements. This may seem negative but in actuality
these students have a deeper understanding of the math needed for the engineering degrees.
Some students may consider starting in a prerequisite mathematics class or a change of major as a
negative due to attitude or perception. Those which might be considered more negative include
failing courses or not passing with a required grade, and readmit students who needed to increase
their GPA for readmission to the university or program. Neutral reasons may include transferring in courses taken during their high school years, through AP, Dual Enrollment, IB, or CLEP which
will not apply to their chosen degree program, and ROTC credit obtained after enrollment.
Transfer students may also transfer in credits which do not apply to their chosen program.
However for purposes of this study, transfer or TRE students are evaluated separately.
Reason for graduating in more than four years
A wide variety of reasons may contribute to graduating in more than 4 years. Student behaviors
which may include the following: Choose fewer hours per semester; Drop/WD quicker; Time
Management (commitment to engaged learning versus other things); Accept one or more Co-op
experiences; Working to pay the bills, including cost of education; Lack of funds (may not be a
choice); One or more minors; Dual majors; Not in a hurry. Other reasons might include:
Department or campus scheduling issues or capacity issues; Pass criteria of “x” or better;
Capacity or choke point courses; Not passing key prerequisite courses; Initial math placement;
Change of major; Excessive extracurricular involvement; Academic advising; Personal issues, and
“Academic difficulties”.
Reasons for graduating in four years
The stated reasons for graduating in four years came from student responses from the Student
Success Committee Student Panel, Engineering Management May 2019 graduates, a small number
of CASB students and the May 2019 Computer Science Responses. Those responses include:
Personal motivation (never crossed my mind to not do so, a known and expected construct);
Family expectations (mom and dad will pay if in 4 years, general expectation); Costs less overall
(additional living expenses, etc.); Leave with no debt; Get out and make money sooner; Good
planning and ease of scheduling; and sadly – cannot stand Rolla. How this was accomplished
includes bringing in credit from high school, summer classes, and classes while on co-op, and
minimal academic difficulties
Data used for this analysis*
The Academic Technology Support Team of the Missouri S&T IT group generated several data
sets for this analysis. The categories included, Technical Communications, programs which require 120 credit hours for graduation (BA), programs that require 128 or 129 credit hours for
22
graduation (BS), and programs that included secondary and elementary teacher certification (BA
and BS). The data sets included students who graduated during the 2010-2011, through 2017-2018
academic years. The data was separated for FTC and TRE students and specific tabulated
information was generated. Some additional data was generated for each academic year such as
gender and ethnicity. However, no subdivisions using those categories was undertaken in this
study. The major categories of data include the following:
• General
o Total Number of Graduates, Average Credit Hours, Median Credit Hours, Avg. GPA, Time to
Degree (TTD)
• Gender
o Number of Male, Number of Female
• Ethnicity
o URM and Non URM in various categories
• Graduated with 12X credit hours
o Number, TTD, Median Credit Hours, Average Credit Hours • Graduated with greater than 12X credit hours
o Number, TTD, Median Credit Hours, Average Credit Hours
• Graduated with greater than 12X Credit Hours with minor(s)
o Number, TTD, Median Credit Hours, Average Credit Hours
• Graduated with greater than 12X Credit Hours with dual major(s)
o Number, TTD, Median Credit Hours, Average Credit Hours
• Graduated with greater than 12X Credit Hours and changed major(s)
o Number, TTD, Median Credit Hours, Average Credit Hours
• Graduated with greater than 12X Credit Hours with co-op(s)
Number, TTD, Median Credit Hours, Average Credit Hours
• Graduated with greater than 12X Credit Hours not in other group
o Number, TTD, Median Credit Hours, Average Credit Hours
Data Statistics
Not all categories as shown above will be reported out as in past iterations.
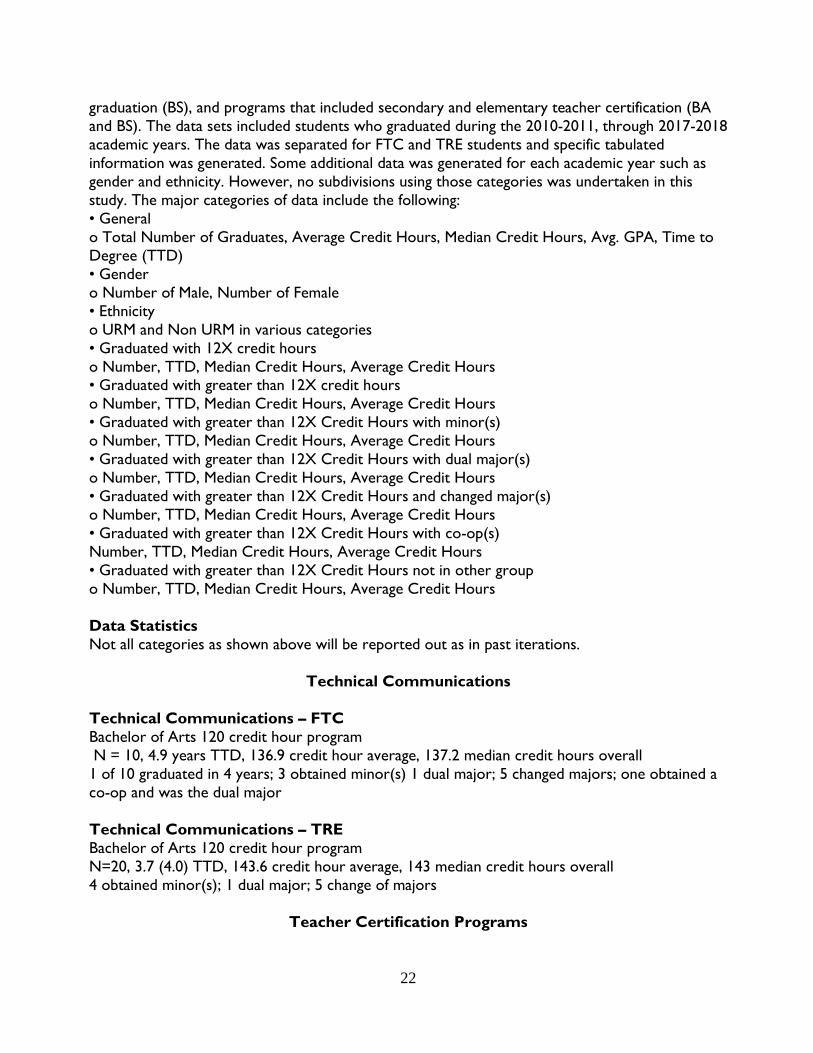
Technical Communications
Technical Communications – FTC
Bachelor of Arts 120 credit hour program
N = 10, 4.9 years TTD, 136.9 credit hour average, 137.2 median credit hours overall
1 of 10 graduated in 4 years; 3 obtained minor(s) 1 dual major; 5 changed majors; one obtained a
co-op and was the dual major
Technical Communications – TRE
Bachelor of Arts 120 credit hour program
N=20, 3.7 (4.0) TTD, 143.6 credit hour average, 143 median credit hours overall
4 obtained minor(s); 1 dual major; 5 change of majors
Teacher Certification Programs

23
Secondary, Elementary and Teaching Certification BS and BA students – FTC
Varied Graduation Credit Requirements
N=72, 5.2 TTD, 152.62 credit hour average, 147.59 median credit hours overall
34 obtained minor(s) (47.2%), 2 dual majors; 38 change of majors (52.8%); no co-ops
Secondary, Elementary and Teaching Certification BS and BA students - TRE
Varied Graduation Credit Requirements
N=33, 3.9 TTD, 155.5 credit hour average, 156.3 median credit hours overall
14 obtained minor(s) (42.4%), 0 dual majors, 5 change of majors (15%), no co-ops
Non-Engineering and Non-Education BS and BA Programs
Varied Graduation Requirements but the majority 120 credit hours – FTC
N=411, 4.95 TTD, 141 credit hour average, 139.3 median credit hours overall, 4.9% graduate with
the minimum credit hours 239 obtained minor(s) (58.3%), 98 dual majors (23.8%), 223 change of majors (54.2%), 47 co-ops
(11.4%)
Varied Graduation Requirements but the majority 120 credit hours – TRE
N=269, 3.3TTD, 184.35 credit hour average, 148.06 median credit hours overall
112 obtained minors(s) (41.6%), 84 dual majors (31.2%), 77 change of majors (28.6%), 6 co-ops
(2.2%)
Math and Engineering BS Programs
BS 128 or 129 credit hour programs (majority 128 credit hours) – FTC
N=4874, 5.0 TTD, 146.6 credit hour average, 143.5 median credit hours overall, 5.7 % graduate
with the minimum credit hours
1314 obtained minor(s) (26.9%), 537 dual majors (11%), 1534 change of majors (31.5%), 1099 co-
ops (22.5%)
BS 128 or 129 credit hour programs (majority 128 credit hours) - TRE
N=2036, 3.4 TTD, 155 credit hour average, 152.6 median hours overall
319 obtained minor(s) (15.7%), 172 dual majors (8.4%), 204 change of majors (10%), 282 co-ops
(13.8%)
Overall observations
Significant number of students engage in “value-added” opportunities such as minors, dual majors,
and co-ops.
Observable differences between FTC and TRE students as should be expected.
These statistics indicate that Missouri S&T is a “5 year to degree” institution on average.
An extremely small number of students graduate with the minimum required credit hours.
This study more or less verifies the last study reported in 2016-2017.
Themes for Graduating in XX years – May 2019 Engineering Management Graduates

24
1. 4 years (N=11): Personal motivation (never crossed my mind not to graduate in four
years); financial (mom and dad pay all if graduate in 4 years, leave with no debt, get out and
make money sooner); International Student (5 year requirement, regrets not seeking co-
op). Accomplished by bringing in Dual and AP, Summer courses, combination, and minimal
academic difficulties. Prime driver seems to be personal motivation. Credit hours per
semester varied, but if calculated, probably closer to 15/semester. 1 transfer student in
the group (2/2), and one dual major, two with co-op. GPA: 3.582, 3.911, 3.080, 3.191,
3.429, 3.972, 3.697, 3.595, 3.199, 3.453, 3.440.
2. 5 years (N = 17): Key influencers appear to be academic difficulty (not passing a
course(s)), placement in prerequisite math course(s). Additional influencers include co-op
(8), dual majors (5). Most brought in Dual and AP courses. Maintaining grades and
excessive extracurricular activities appear to be minimal contributors to the increased
time to graduation. Most take less than 16 credit hours per semester with some making
sure not to have a heavy load with known difficult courses. Summer courses at S&T and
elsewhere were present (many to catch up with math and engineering courses). Working
part-time or more is also a strong influencer. Some change of major present, but with the
General Option, Emgt can absorb and include other engineering courses as a part of the
degree. (This may be the group to try and understand and address more so than any other
category)
3. 6 years (N=11): Very similar to 5 year category with key influencers being academic
difficulty and placement in pre-math courses. A deeper look would likely indicate multiple
academic difficulties (repeat, repeat same course). Two dual majors and 5 with co-op
experience. Summer courses here or elsewhere. Some level of Dual or AP courses.
Group includes two transfer students. One student had two co-ops. One student
indicated taking lesser hours to maintain GPA. No serious indicators of too much
extracurricular activities. Some decisions on course loads were due to anticipated
difficulty level of courses.
4. 7+ years (N=8): Academic difficulties is the biggest issue which also led to breaks in
studies in more than one case. Co-ops was present and change of major. Initial math
placement had some impact but not as much as others. Dual and AP courses were
present. Summer courses and transfer courses are present. Balance of schedules and the
need to work were heavy influencers. Learning issues was also acknowledged in one case.
Excel Sheet – Emgt May 2019 – Appendix XX
Other Solicited Student Input
1 psychology graduate – 4 years (cost, expectations, family pressure)
4 history graduates – 3 in 4 years (cost, easy scheduling, 1 in 5 years (change of major)

25
3 biological science graduates – 2 in 4 years (good planning, summer classes), 1 in 5 years (transfer
student and change of major)
Overall, course loads usually less than 16; extracurricular activities did not influence time to
graduate; no noted structural barriers. Favorite quote of student who initially was a double major
and could have graduated in 3 years, in response to taking less than 16 credit hours per semester:
“It was the fact I couldn’t meet all my obligations, work, and pass my classes at the 17 I was
averaging before that. Girls gotta eat, and to eat one must earn money to work..”
Computer Science graduates for Spring 2019 – 65 total:
24 or 36.9% graduate in four years or less, citing personal motivation, wanting to get out
and earn money, and the cost if over four years, taking summer courses. One claimed a
coop as well. 4 of those graduated in 3 or 3 and ½ years.
36 or 55.4% graduate in 4.5 (10) or 26 (5) years, citing academic difficulties, change of
majors, minors and scheduling difficulties. 3 or 4% graduate in 6 years and 2 or 3% in 7 or more years. Reasons cited include dual
majors, change of majors, study abroad, no job, academic difficulties, personal situation and
work.
Overall, course loads (less than 16 were mentioned frequently, scheduling issues, need to work,
minor, dual majors impacting time to graduate. Most indicated extracurricular had no impact.
Grades (keep good grades) also seemed to occur multiple times.
CEC ACADEMIC Affairs Input
The CEC Academic Affairs Committee Study (available Fall 2019), is one part of efforts which
identified courses in both CASB and CEC programs that may be barriers or impediments to
graduation and which can increase the time to degree, particularly for students that are focused in
the STEM fields. The following content has been extracted from the CEC Academic Affairs
Report:
The following section reviews program by program courses and trends in DFW rates. In
evaluating the DFW data from the Registrar’s Office at Missouri S&T, courses that have a
combined letter grade of D + letter grade of F + Withdraws (DFW) at or above 15% were
investigated. While there exists no specific national data on what is or what is not an acceptable
DFW rate for students in engineering or STEM that the committee members were aware of 15%
was selected as a level where DFW rates above 15% were considered concerning. It should be
noted that at Missouri S&T, students may also drop a course prior to the sixth week of classes
without it appearing on their transcripts. It is important to note that the DFW data analyzed does
not include any drops and there is little ability to factor in the consideration of students that also
drop a course which would certainly be a factor affecting a student’s time to graduation.
First Year Engineering Experience and Core Engineering Courses
Among the College of Engineering and Computing (CEC) courses that are required during the
first two years for many engineering students in CEC programs, they include: FE 1100, CE 2200

26
and 2210 as well as Mechanical Engineering 1720 and 2350. Among this list of courses, data
collected of the last five years indicates that the following courses have the highest DFW trends as
shown in Table 1. FE 1100, CE 2200 and 2210, as well as ME 2360 exhibit the highest DFW rates
among courses taught in CEC.
Table 1: Five Year DFW Trends among CEC Engineering and Computing Required Core Courses
Subject and
Course No.
Course Name DFW Range [Low to
High]
(times > 10% DFW rate)
Average DFW
% over past 5
years
Mech Engr 1720 Intro to Engr Design** 0.8-3.3% (8 semesters) 2.4%
Mech Engr 2340 Statics and Dynamics** 0-9.8% (8 semesters) 4.4%
Mech Engr 2350 Engr Mechanics-
Dynamics
12.8-27.3% (7 semesters) 14.8%
Mech Engr 2360 Dynamics 15.7-21.3% (5 semesters) 20.1%
FE 1100 Study & Career in Engr 23.4-42.4% (4 semesters) 34.4%
CE 2200 Statics* 16.2-34.5% (10 semesters) 23.2%
CE 2210 Mechanics of Materials* 16.8-29.8% (10 semesters) 23.1%
* offered in Summer Semester 2015, 2016, 2017
** has not exceeded 10% in DFW
First Year CASB KEY STEM Courses
Among the College of Arts, Science and Business (CASB) courses that are required during the
first two years for most engineering in CEC programs and STEM students in CASB, they include:
Chemistry 1310, 1319, and 1320; Physics 1135, 2135; Math 1214, 1215, 2222, and 3304;
Mechanical Engineering 1720 and 2350. Among this list of courses, data collected of the last five
years indicates that the following courses have the highest DFW trends as shown in Table 2.
Table 2: Five Year DFW Trends among Key CASB STEM Core Courses
Subject and
Course No.
Course Name DFW Range [Low to
High] (times > 10%
DFW rate)
Average DFW
% over past 5
years
Chemistry 1310 General Chemistry I 25.7-49.0% (11 semesters) 35.4%
Chemistry 1319 General Chemistry Lab 12.7-30% (3 semesters) 8.2%
Chemistry 1320 General Chemistry II 15.4-54.5% (6 semesters) 12.9%
Math 1103 Fundamentals of
Algebra
41.6-57.7% (8 semesters) 49.8%
Math 1120 College Algebra 50.4-57.7% (9 semesters) 47.2%
Math 1214 Calc For Engrs I* 17.0-37.0% (11 semesters) 26.2%
Math 1215 Calc For Engrs II* 15.9-37.6% (11 semesters) 31.9%
Math 2222 Calc with Analy Geom
III*
11.9-27.4% (11 semesters) 19.6%
Math 3304 Elem Differen
Equations
11.9- 22.9% (7 semesters) 22.4%

27
Physics 1135 Engineering Physics I 11.2-28.0% (10 semesters) 19.0%
Physics 2135 Engineering Physics II 10.8-20.4% (7 semesters) 13.1%
* offered in Summer Semester 2015, 2016, 2017
** has not exceeded 10% in DFW
Observations from literature reviewed
Given the increased focus on retention and graduation rates across the country, a small number
of articles and research papers were read and reviewed to determine if any best practices could
be identified and moreover to observe if S&T was engaged in any observed.
An article titled “A Simple Method to Improve College Graduation Rates”, published in the
Stanford Social Innovation Review identified the following 4 areas to help students succeed and
graduate:
1. Stay on track to graduate – find a suitable major and understand requirements to graduate
2. Building their employability – part time jobs, resume writing, define a career path
3. Maintaining financial aid – scholarship renewal, smart financial decisions
4. Managing life – stay connected with people who care, positive attitude and resolve
problems
A research study titled “Strategies to Increase Enrollment Retention, and Graduate Rates,
published in the Journal of Developmental Education identified the engagement of “academic
leaders” in the development of goals, programs, strategies, etc., as the major driver. Tracking
systems and course design also has a positive impact on student success.
An article from the Chronical of Higher Education, titled “Fast Gainers: 4 Ways That Colleges
Have Raised Graduation Rates” emphasized focusing on likely dropouts, building up advising
services, involvement of diverse voices (faculty, students, administrators and community groups),
and making logistical changes (course timing, overlap, etc.) as key factors for student success.
A Google search provided success stories from several universities. The University of Texas
listed several strategies to include taking 15 hours per semester, taking online classes, enrolling in
summer school and transferring credits from another institution, implementation of first year
programs and groups, tracking tools, and paying for college in various ways. The same article
notes that one size does not fit all and references Texas A&M, a STEM focused school.
The same search refers to the University of Georgia and the success they have had in increasing
retention and graduation rates. Several items were identified including engaging in hands on
learning, small class sizes (significant faculty hiring initiative), personalized support (extensive
advising, use of digital tools for communication with students) and expansion of on-line course offerings, a summer experience program and predictive analytics.
An article from Educause Review titled “Using Big Data to Improve Retention and Graduation
Rates” which identified addressing 4 year graduation rates in the following areas: Student
acquisition (are we attracting the right type of students give our track record of successful 4-year
graduation profiles,….; personalized curriculums; Student Performance (monitor, intervene,
course correct); Student Retention (counselors/advisor, extracurricular, career opportunities);

28
Faculty Effectiveness (identify faculty, curriculum and/or other on-campus behaviors that predict
to graduation problems and dropouts…); This article also identified the potential costs ($300,000)
for two extra years of college and student debt load.
An article from the American Enterprise Institute titled “Completion Reforms That Work: How
Leading Colleges Are Improving Attainment of High-Value Degrees” focused on 4 year programs
and identified some initial lessons learned to include: There is no “plug and play” solution; New
programs help only as long as they are active; Holistic beats piecemeal; and investing in access and
success saves money. They also identified five promising returns identified as Practices.
1. Provide more seats for historically disadvantaged students at colleges with track records
of producing successful graduates.
2. Provide comprehensive support to all types of students, especially those facing financial or
academic challenges.
3. Provide Completion (or emergency) grants to juniors and seniors who need a little additional financial help reaching the finish line.
4. Using new data-gathering and analysis techniques to provide better and more useful
guidance to students.
5. Use evidence-based teaching methods to improve instruction.
Each practice also identified specific examples, outcomes, potential impact, costs and
implementation challenges.
A research article form the Journal of Science Education Technology titled “Hierarchical
Mentoring: A Transformative Strategy for Improving Diversity and Retention in Undergraduate
STEM Disciplines” emphasized the importance of integrating mentoring and strategic academic
interventions. The research model is presented as: Mentoring (combinatory faculty, staff, and
peer mentoring); Research (undergraduate research experiences); and Education (Academic
support infrastructure, including advising, interventions and individualized development plans).
An article from the Florida State University Student Success Team titled “Practical Steps to
Improving Retention and Graduation Rates” offers three critical elements to a successful
retention/graduation program and 10 elements important to a sustained approach to
retention/graduation.
The three critical elements are:
1. An individual, by status or personality, must drive the process.
2. A process based on detailed data must be developed, measured and monitored closely for
at least five years.
3. There must be a team of individuals from across campus who are committed to student
success and who meet weekly to assess progress.
The 10 elements include:
1. Develop a “map” of course schedules by term for every major with the critical
courses highlighted. Holds and advisor intervention is also discussed if a class is not met by a student.

29
2. Establish an automated contact system.
3. Move academic advisors to the students and develop a structure that fosters
professionalism and accountability among advisors.
4. Establish Freshman Interests Groups.
5. Pay attention to where students live.
6. Look at course grades. (courses with high percentages of Ds and Fs)
7. Survey students who choose to leave the university prior to graduation.
8. Do not neglect the full range of academic support services available to help engage and
retain students.
9. Be willing to intervene early.
10. Be willing to deploy new approaches.
The article also notes specific examples of implementation at Florida State to include: Expanded
academic advising services; A structured program to work with undecided (and also re-deciding)
students; Success coaching; Expanded tutoring services; Special programing for first generation and Pell grant recipient students; Expanded opportunities for high-achieving students.
Based on this limited review of information it appears that Missouri S&T is engaged in many, if not
all suggestions and best practices encountered. Perhaps two areas are somewhat lacking or
require greater focus on our part. The practice of data analytics, in particular to truly mine the
data to find out what is or is not happening is a challenge here due to no dedicated institution
research, and a thorough understanding of what drives students to excel and graduate in 4 years,
or 8 semesters with a co-op.
Recommendations
The original intent for this study was to run the basic data similar to the 2016-2017 student.
However, this iteration of the total study also added specific information from one degree
program (Engineering Management) and more limited information from Computer Science and a
few CASB May 2019 graduates. Also, a limited literature review, looking for possible best
practices, was added. Information on Ds, Fs, and WDs was requested from both colleges. This
information sought to identify courses that may be impediments toward graduation. Thus this
report provides a broader view of time to degree and total credit hour concerns.
As stated previously, the current data study basically replicates the prior data study. However,
this study includes 8 academic years of data versus 5. It basically indicates a small percentage of
students will graduate with the minimum number of credit hours for their programs. Average
credit hours for FTC students in the three primary categories showed little difference with BS
math and science programs averaging146.6 credit hours and 5.0 years TTD, Non engineering BS
and BA programs averaging 141credit hours and 4.95 years TTD, and Teacher Certification
programs averaging 152.6 credit hours and 5.2 years TTD. Although the same statistics are not
presented in this report, the full data files do indicate slight increases in credit hour averages and
TTD for value adding activities. The data also show some increasing trends in TTD, but basically
settling around 5.0 years and average credit hours appears to be stable.
The deep degree audit reviews along with solicited input from May 2019 Engineering Management graduates provided much richer information as to the reasons students graduated in 4 years or
30
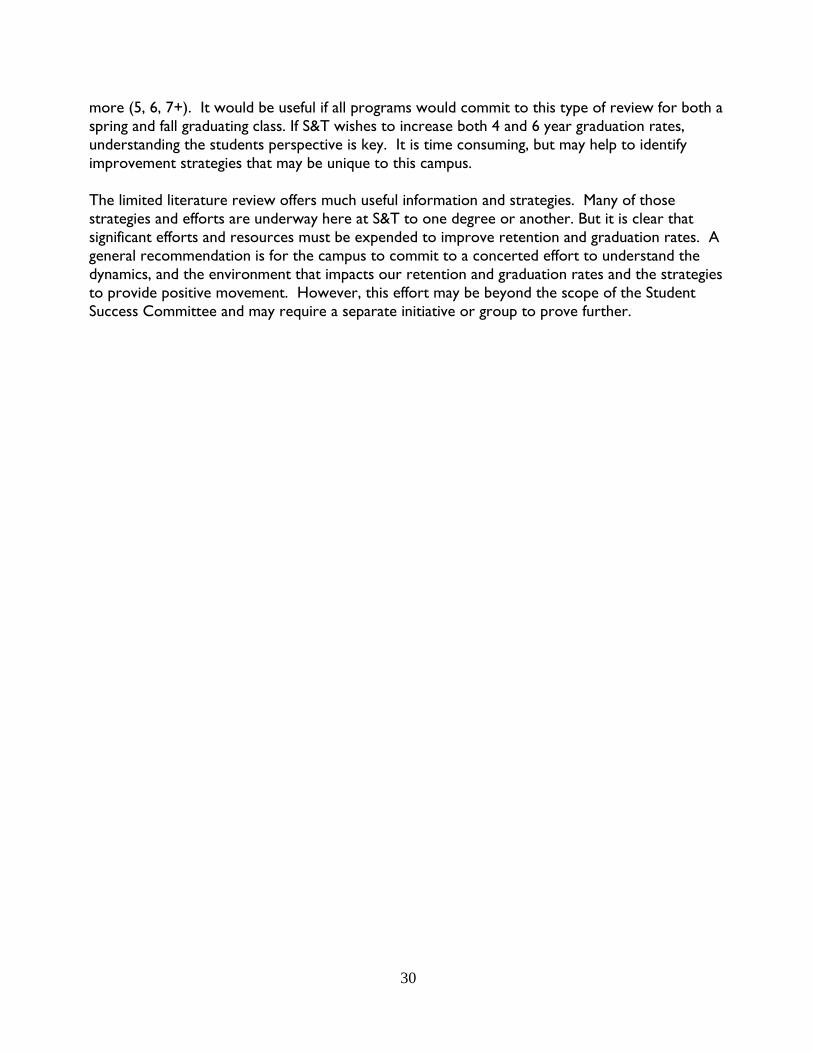
more (5, 6, 7+). It would be useful if all programs would commit to this type of review for both a
spring and fall graduating class. If S&T wishes to increase both 4 and 6 year graduation rates,
understanding the students perspective is key. It is time consuming, but may help to identify
improvement strategies that may be unique to this campus.
The limited literature review offers much useful information and strategies. Many of those
strategies and efforts are underway here at S&T to one degree or another. But it is clear that
significant efforts and resources must be expended to improve retention and graduation rates. A
general recommendation is for the campus to commit to a concerted effort to understand the
dynamics, and the environment that impacts our retention and graduation rates and the strategies
to provide positive movement. However, this effort may be beyond the scope of the Student
Success Committee and may require a separate initiative or group to prove further.

31
APPENDIX A
Cumulative Retention & Graduation Rates of
First-Time, Full-Time Degree Seeking Freshmen

32

33

34
APPENDIX B
Retention Strategies and Tactics
2001-2019

35
Retention Strategies and Tactics, 2001-2019
Assessment Enhancement
Created standardized retention and graduation reports by gender and ethnicity and began
measuring stop-out rate (students who withdraw and return), 2002
Began annual retention audit of academic (cognitive) and demographic factors, 2001
Instituted new-student survey in freshman Preview, Registration and Orientation (PRO
sessions), 2002
Re-instituted the Hogan Personality Index (HPI) assessment to track students by non-
cognitive factors, 2002
Revised withdraw surveys and interviews, 2002
Started follow-up telephone surveys of non-returning students, 2002
Began collection and campus-wide distribution of freshman academic profile, specifically
new-student survey data about expectations, social activities, GPA, ACT/SAT scores, 2002
Revised student satisfaction and engagement assessments, Cooperative Institution
Research Program and National Survey of Student Engagement, 2001
Identified classes with very low student success rates, grade of D, F or Withdraw, 2001
Revised and re-launched the faculty and student advising survey, 2012
Created graduate student focus groups and conducted interviews, 2016
Created URM student focus group, 2019
Programming: Advising, Tutoring, Learning Communities, Faculty Training and
Support
Learning Enhancement Across Disciplines (LEAD) tutoring program expanded beyond
physics classes, Fall 2002
Joint Academic Management (JAM) sessions established, 2004
Online tutor request program implemented, 2003
Opening Week activities restructured around a group project activity, 2002 and 2003
Expectations of student success addressed in all recruitment and orientation speeches, 2002
Group building (making friends) and study skills addressed in all orientation and Opening
Week activities, 2002–2003
A rapid response “Academic Alert System” initiated (2005) using an online student
communication system, “Success Chain,” 2005-2006
Advising program expanded with regular advisor training and awards, 2002
Learning Communities and First-Year Experience Programs to address student academic
skills development and social engagement through student life-oriented group events,
2002-2003
Expanded freshman pre-college “Hit the Ground Running” program to address student
academic expectations
Created the Center for Pre-College Programs (CPCP) to expand the K-12 student
workshops and science, technology, engineering, and mathematics (STEM) summer camps.

36
Created the Center for Educational Research and Teaching Innovation (CERTI) to address
improving the Missouri S&T learning environment and student learning outcomes through
collaborative learning, experiential learning, technology enhanced learning, and educational research practices (September 4, 2003).
Expanded experiential learning programs by promoting student engagement through
student design teams, undergraduate research (OURE expansion) and service learning
Implemented the Notification of Scholastic Probation Form, 2007
Established the Undergraduate Advising Office, 2007
Developed the On-Track Academic Success Program to assist probationary and
academically deficient students, 2007
Updated the online Missouri S&T Advising Handbook, 2011
Implemented Majors & Minors, 2012
Opened Burns and McDonnell Student Success Center, 2013
Implemented Student Success Mentor Program for probationary admits, 2013
Implemented Reconnection I & II, 2013
Implemented Sophomore Summit, 2014
Hired three professional staff advisors for FEP department, 2015
Implemented Half-Way to Graduation event, 2016
Hired Starfish staff member in Registrar’s office, 2016
In process of creating advising council based on current recommendations (2017)
Integrated Undergraduate Advising office and Freshmen Engineering office into one
Central Advising office and moved location to Library (2019)
Policy Changes
Incomplete grade time limit change, 2002
Repeat course GPA adjustment policy, 2002
Scholarship Reinstatement Policy, 2002
All BS degree programs reduced to fall between 124 and 128 hours, 2002–2003
Four degree programs most often requested by exiting students added: business,
information science and technology, technical communication, and architectural
engineering, 2002–2003
Academic Forgiveness Policy, 2011-2012
Financial Assistance
• $285,000 additional need-based funding for first-time college students, 2012 • $80,000 institutional work study grant, 2014 • Spirit of Success Scholarship for high ability minority students, $264,500 was spent in new
students and renewals, 2014-2015 • Secured $100,000 in funding for Hit the Ground Running and Institutional Work Study
based on a proposal submitted to the UM System Comprehensive Retention Initiative
(CRI), 2015-2016
• Finishline Scholarship, 2018

37
APPENDIX C
Other Documents

38

39

40

41

42

43

44

45

46
Enrollment Management: Calculus
Location Analysis
To:
Dr. Stephen Raper
From:
Zach Monroe, Chris Sheffield, Jonathan Stigge, Mark Shaw
5/7/2019

47
EXECUTIVE SUMMARY
The group chose to do their senior design project for the Enrollment Management Department
for Missouri University of Science and Technology. The department was looking for quantitative
data that would demonstrate the presence or absence of a correlation between the location of
where students took Calculus I and Calculus II and their subsequent grades in core engineering
classes. The core engineer classes are Civ 2210 (Mechanics of Materials), Civ 2200 (Statics),
Phys 2135 (Engineering Physics II). After meeting with the project champion and faculty
mentor, the group was able to develop a scope of work for the project and select statistical
analysis tools. Pivot tables and t-tests were the selected tools. The group decided to examine the
top ten reporting universities for Calculus I and Calculus II and then compare the average
success scores in each of the core engineering courses to the average success score in the core
engineering courses of students who took Calculus I and Calculus II at Missouri S&T. The
resulting t-test data shows the difference in average success scores. The higher to t-value, the
higher the difference. The range of t-values from the t-test were high due to the difference in
sample sizes. The group determined that more data needed to be collected before final decisions
were made on which school’s mathematical credits should be accepted. The group also
recommended that other factors should be examined to assist in building an optimization model.
The model would give each school a score and that score would be compared to the minimum
acceptable value that was generated from the optimization model. Developing a model would
allow for the Enrollment Management Department to determine which schools credit would be
accepted efficiently and quickly.
48
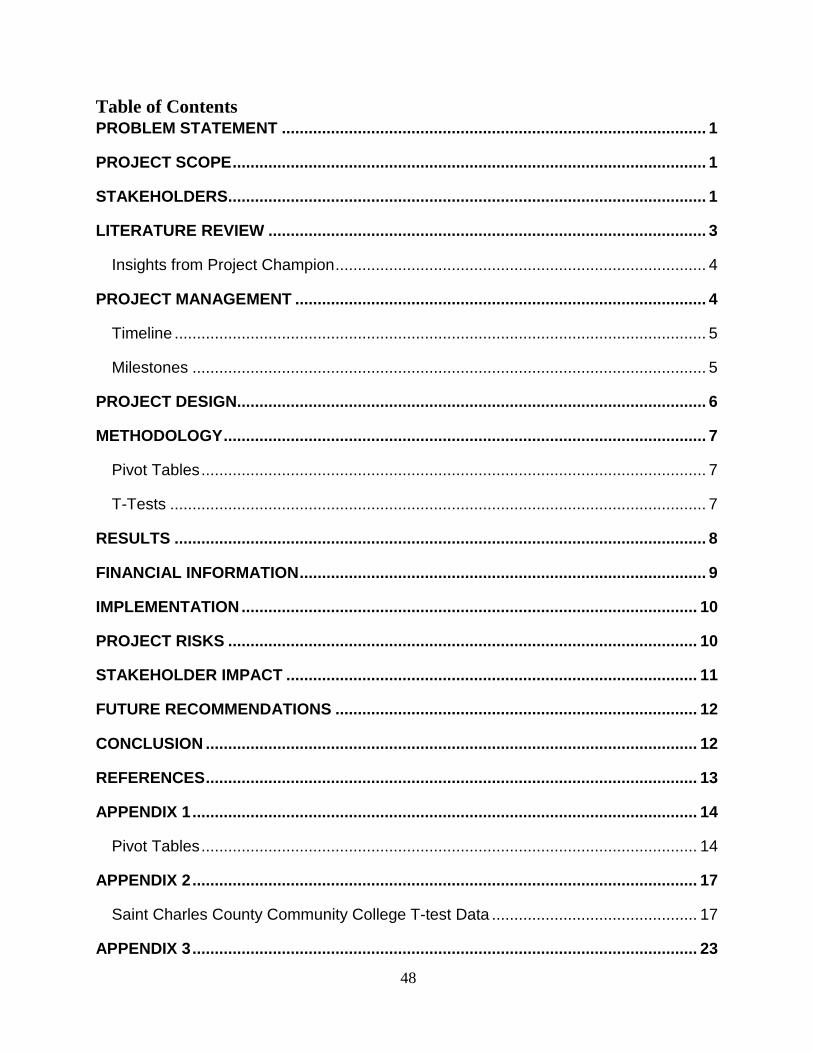
Table of Contents PROBLEM STATEMENT ............................................................................................... 1
PROJECT SCOPE .......................................................................................................... 1
STAKEHOLDERS........................................................................................................... 1
LITERATURE REVIEW .................................................................................................. 3
Insights from Project Champion ................................................................................... 4
PROJECT MANAGEMENT ............................................................................................ 4
Timeline ....................................................................................................................... 5
Milestones ................................................................................................................... 5
PROJECT DESIGN ......................................................................................................... 6
METHODOLOGY ............................................................................................................ 7
Pivot Tables ................................................................................................................. 7
T-Tests ........................................................................................................................ 7
RESULTS ....................................................................................................................... 8
FINANCIAL INFORMATION ........................................................................................... 9
IMPLEMENTATION ...................................................................................................... 10
PROJECT RISKS ......................................................................................................... 10
STAKEHOLDER IMPACT ............................................................................................ 11
FUTURE RECOMMENDATIONS ................................................................................. 12
CONCLUSION .............................................................................................................. 12
REFERENCES .............................................................................................................. 13
APPENDIX 1 ................................................................................................................. 14
Pivot Tables ............................................................................................................... 14
APPENDIX 2 ................................................................................................................. 17
Saint Charles County Community College T-test Data .............................................. 17
APPENDIX 3 ................................................................................................................. 23

49
University of Missouri – Kansas City T-test Data ....................................................... 23
APPENDIX 4 ................................................................................................................. 29
Columbia College T-test Data .................................................................................... 29
APPENDIX 5 ................................................................................................................. 35
Lincoln University T-test Data .................................................................................... 35
APPENDIX 6 ................................................................................................................. 41
University of Central Missouri T-test Data ................................................................. 41
APPENDIX 7 ................................................................................................................. 47
Southeastern Missouri State University T-test Data .................................................. 47
APPENDIX 8 ................................................................................................................. 53
St. Louis Community College – Florissant Valley T-test Data .................................... 53
APPENDIX 9 ................................................................................................................. 59
Saint Louis University T-test Data .............................................................................. 59
APPENDIX 10 ............................................................................................................... 62
University of Missouri – St. Louis T-test Data ............................................................ 62
APPENDIX 11 ............................................................................................................... 65
Jefferson College T-test Data .................................................................................... 65
APPENDIX 12 ............................................................................................................... 68
East Central College T-test Data ............................................................................... 68
APPENDIX 13 ............................................................................................................... 71
Ozark Technical College T-test Data ......................................................................... 71
APPENDIX 14 ............................................................................................................... 74
University of North Dakota – Main Campus T-test Data ............................................ 74

50
PROBLEM STATEMENT
Missouri University of Science and Technology is concerned with the success of students who
transfer in Calculus I and Calculus II from other universities in core engineering courses taken at
Missouri S&T. These core engineering classes are Engineering Physics II (PHYS 2135), Statics
(CE2200), and Mechanics of Materials (CE 2210). Mr. Albers, project champion, and the
Enrollment Management Department are looking to see a correlation between the success or lack
of success of transfer students and their scores in the core engineering classes. These correlations
will be compared to the scores of students who have taken Calculus I and Calculus II at Missouri
S&T. These issues and concerns were determined by the voice of the customer, Missouri
University of Science and Technology.
PROJECT SCOPE
The project scope was defined as showing and determining the statistical significance and
difference of students who took Calculus I and Calculus II at other universities and their resultant
scores in core engineering courses compared to student who took Calculus I and Calculus II at
Missouri S&T and their resultant scores in core engineering courses. The scope of work was
developed with the project champion, Tim Albers. Mr. Albers was pleased with the agreed upon
scope of work and believed it would give the Enrollment Management Department sufficient
data and direction for future studies.
STAKEHOLDERS
Below is the stakeholder registry. It discusses direct and indirect stakeholder and their
relationship to the project. The list is as comprehensive as needed in relation to this project.
There are other possible stakeholder that could be affected but the group developed this
registry based on who would be impacted the most.

51
Name of Stakeholder
Project Role Relationship to Project
Mark Shaw Project Team Lead In charge of the project team and communication between stakeholders Will help conduct research, analysis, and reporting of the project
Jonathan Stigge Project Team Member Will help conduct research, analysis, and reporting of the project
Zach Monroe Project Team Member Will help conduct research, analysis, and reporting of the project
Chris Sheffield Project Team Member Will help conduct research, analysis, and reporting of the project
Timothy Albers Project Champion, MS&T Vice Provost, Dean of MS&T Enrollment Management Office
Provides project data and assists with determining the project scope
Dr. Enke Project Mentor, Professor at MS&T
Provides guidance and assistance in statistical analysis
MS&T Enrollment Management Office
Project Organizational Sponsor
Helps the enrollment management office assist students with course placement in order to help them achieve success in future courses
MS&T Office of the Registrar
Indirect stakeholder Impacted by the outcome regarding more students taking courses at MS&T instead of transferring
Current Students Indirect stakeholder Could change transfer credit requirements from certain colleges thus changing where the students take their courses
Future Students Indirect stakeholder Could change transfer credit requirements and cause some students to repeat classes at MS&T Could ensure a better knowledge level for future students by ensuring the students are taking a certain standard of classes

52
MS&T Data source and comparison reference
May encourage more on-campus credits from students Allows for better student placement based on previous courses
Other Colleges Data source and comparison reference
May reduce the number of credits taken at the colleges May require some colleges to change the course requirements in order to stay as an accredited transfer program with MS&T
Table 1: This table shows the registry of stakeholders for the completed project.
LITERATURE REVIEW
Article One:
The group began researching our project by reviewing information and data provided to us from
a student created report titled “Missouri S&T Calculus Analysis” by Sam Hardy, Jon
Hudwalker, Jack Kirschbaum, Jasmine Kuehn, and Emily McClain. This report provided us
with valuable data and information regarding whether or not students should be required to take
Calculus I and Calculus II through the Missouri S&T mathematics department.
In their research, they looked into questionable assumptions made that a student who takes
calculus class elsewhere, that they will be unsuccessful in their future core engineering classes.
Their goal was to help demonstrate if students who take calculus courses at Missouri S&T are
more likely to be successful in core engineering classes than those who transferred classes in
said courses.
The researchers of the article, using a success course indicator, compared 4728 total students
from over 74 universities. They compared the success rate & score of the top 5 transfer
universities for each category. The categories were: Calculus I to Physics II, Calculus II to
Physics II, Calculus I to Statics, Calculus II to Statics, Calculus I to Mechanics of Materials, and
Calculus II to Mechanics of Materials.
From their results, the article gave four main recommendations due to their results. First, they
recommended more research into why students were taking courses

53
elsewhere. Second, more data points for universities where there few students transferring, as to
help find the root cause. Third, more information is needed in the students’ perception, to help
find trends that aren’t identifiable quantitatively. Lastly, hypothesis testing should be done to
determine if there is a statistical significance in the difference of success rates from those who
take Calculus at Missouri S&T and those who transfer it to S&T.
This article was useful it that it helped give the group a solid starting point into how we should
approach the project and the various areas of improvement.
Insights from Project Champion
The project champion was Mr. Tim Albers, the Vice Provost & Dean for Enrollment
Management. Mr. Albers had the group continue this project from the previous semester as to
help further improve with hypothesis testing to determine if claims of success that students
transferring calculus classes to Missouri S&T were truly valid. The Enrollment Management
Department wants to see hard data that will provide them with insight of which schools would or
would not be acceptable for students to transfer their calculus credits. In our meeting with Tim
Albers, the group and Mr. Albers discussed how the project should be continued, along with
suggestions from the group on how to further improve the project.
At the conclusion of the meeting, it was decided by Mr. Albers and the group, that the group
would perform a statistical analysis of the data acquired from the previous project and would do
hypothesis testing to help predict how successful a student would be if they were to transfer a
core mathematics class to Missouri S&T.
PROJECT MANAGEMENT
Once the group members were assigned to the team, meeting were scheduled with the project
champion to develop a scope of work and means of communication. With a scope of work
developed, the group was able to develop an approach to complete to the project. Bi-weekly
meetings for the group were determined would be the most effective with the busy schedules of
four graduating seniors. The group also utilized a Google Team Drive and the smartphone
application “GroupMe” to communicate. These

54
tools provided an online platform to work on the analysis and save project related documents.
Major tasks of the project were determined, and dates were assigned to keep the group on time.
Mr. Albers, project champion, and Dr. Enke, faculty mentor, were sent emails throughout the
process to keep them informed and to receive advice and input for guidance.
Timeline
The Gannt Chart below displays the timeline for the entire project. It should be noted that the
project and all subsequent tasks were completed on time. The milestones of the project will be
discussed below.
Figure 1: Gantt Chart for Calculus Location Analysis Project
Milestones
The milestones for the project are listed in the table below. Determining these milestones were
crucial to keeping the project on track to complete on time. Each task was completed on time.
Not completing these tasks would not have allowed the group to successfully complete the
project.

55
Task Assigned Completion
Date
Completed on Time
Project Kickoff Meeting 2/4/19 Yes
Meeting with Project
Champion
2/7/19 Yes
Meeting with Project
Faculty Mentor
2/15/19 Yes
Complete Preliminary
Research
3/11/19 Yes
Complete Statistical
Analysis
4/15/19 Yes
Complete Report 5/5/19 Yes
Complete Presentation 5/6/19 Yes
Table 2: This table shows the major milestones of the project
PROJECT DESIGN
After meeting with the project champion and faculty mentor, it was determined that the project
should be designed in a manner that would further the research from the previous semesters
project and allow for further data to be collected and added to the analysis performed during this
project. One of the potential issues that was brought to the group’s attention by Dr. Enke was the
small sample size reported by some of the
schools that were being examined and the effect it could have on the statistical analysis. The
group believes that the structure of the analysis and report will allow for a future group to add
new data to the analysis. The structure will allow for the effect of the small sample size to be
negated as new data is collected and added to the analysis. Once the sample sizes of the smaller
groups grow as more data is collected then conclusions could be developed about certain schools,
such as whether Missouri S&T should accept the transfer Calculus credit.

56
METHODOLOGY
The group was tasked to determine if there was a correlation between the location of Calculus I
and Calculus II and the resultant scores in core engineering classes. The group began by
validating the data analysis from the previous semester. This allowed for the group to move
forward knowing that the analysis was correct and could be used as part of the project. The
previous project organized the data well with Pivot tables.
They provided the group with a direction of where to explore further. The group decided to
examine the top ten universities by number of students reported for Calculus I and Calculus II.
Each group member was assigned five schools to perform analysis. Pivot tables and a two-
sample t-test in MiniTab were the tools the group chose to accomplish the task at hand. The
group felt that these tools would be the most effective in analyzing and presenting the data to the
Enrollment Management Department. These tools will be discussed in greater detail below.
Pivot Tables
Pivot Tables are a tool built in to the Microsoft Excel program. They are designed to help the
user organize and present data in an efficient manner. Having data covering thousands of
students, the group felt using this tool would be very effective. The resultant tables, show in the
appendices, break down the students by the location where they took their calculus course and
then by grade. These tables were broken down again to show the overall pass rate for Missouri
S&T students, the top five reporting transfer schools, and then transfer students overall. Seeing
the data broken down in this way, the group then decided that it would be more effective to
breakdown the students by each school. The group decided to use the top ten reporting schools
for Calculus I and Calculus II. Presenting the data by school will allow for a future project to
collect data in the same way and build the sample size for each school. Once a sample size for a
school is large enough, a decision can be made about the merit of a transfer credit from that
university.
T-Tests

57
The group chose to utilize the two-sample t-test. This test examines the averages of two data sets.
The average success scores in the core engineering courses of the students

58
who transferred Calculus I and or Calculus II credit were compared to the average success
scores in the core engineering courses of students who took Calculus I and Calculus II at
Missouri S&T. The resultant t-values and p-values tell the group which averages are similar.
The smaller the t-value, the more likely it is that the averages of the two groups of students will
be equal; meaning that a student from a given university did equally as well as the student from
Missouri S&T and the credit from the transfer university should be acceptable. It should be
noted that many of the universities reported very low sample sizes compared to the sample size
of Missouri S&T students. This has affected the resultant t-values. As more data is collected and
the sample sizes of the transfer schools increase, the t-values will be more accurate and
significant.
RESULTS
The resulting t-values and p-values are summarized in the tables below. The ranges for each
university are vastly different. As shown below, some of the t-values reach a magnitude of seven
and a significant number of the schools have a p-value of zero. The inconsistency of these values
can be explained by the small sample sizes of the transfer universities. The resultant analysis is not
enough to make a definitive choice of which schools Missouri S&T should not accept Calculus I
and Calculus II credit. More data will need to be collected and added to this project’s analysis.
Calculus I Location
Corresponding T-value Corresponding P-Value
Civ 2210
Civ 2200
Phys 2135
Civ 2210
Civ 2200
Phys 2135
SLU -2.59 -3.97 -4.61 0.013 0 0
UMSL 0.46 0.67 -2.99 0.648 0.506 0.005
SCCC 1.82 1.34 2.17 0.078 0.197 0.039
UMKC -1.49 -1.48 -1.38 0.164 0.16 0.178
Columbia College 3.39 5.06 6.66 0.002 0 0
Lincoln University
-0.85 -1.02 -2.23 0.413 0.318 0.034
UCM 0.53 -0.57 -3.55 0.617 0.001 0.579
Jefferson College -0.15 0.48 -0.34 0.885 0.738 0.641
SEMO -0.45 0.44 0.83 0.671 0.668 0.416
SLCC Flor. Vall. 1.21 3.47 4.51 0.313 0.003 0
Table 3: This table shows the Calculus I locations and analysis

59
Calculus II Location
Corresponding T-value Corresponding P-Value
Civ 2210
Civ 2200
Phys 2135
Civ 2210
Civ 2200
Phys 2135
ECC 0.99 1.65 1.66 0.333 0.241 0.125
OTC 1.05 1.6 2.91 0.297 0.138 0.011
SCCC -0.23 0.49 1.17 0.821 0.627 0.248
UMKC -0.87 -0.02 -1.43 0.447 0.983 0.195
Lincoln University
1.15 2.43 -1.37 0.269 0.032 0.201
UCM -3.9 -0.37 -0.53 0.011 0.747 0.613
UND 1.77 1.85 3.08 0.095 0.082 0.004
Columbia College 4.84 7.12 6.03 0 0 0
SEMO 0.38 0.29 -0.04 0.715 0.777 0.97
SLCC Flor. Vall. 1.17 3.85 4.86 0.253 0.001 0
Table 4: This table shows the Calculus II locations and analysis
FINANCIAL INFORMATION
The cost to implement the project is minimal. The research and data analysis has been done by
Engineering Management Senior Design Teams. The raw data was collected by Missouri S&T
employees. There is not a requirement to purchase a new statistical modeling software. The
current licenses the university has would be sufficient demonstrated by the fact that the analysis
thus far has been completed with the current software available to students.
The financial impact on Missouri S&T would be far greater. If decisions were made to not
accept credit for Calculus I and Calculus II from some of the universities that previously were,
Missouri S&T would lose on the revenue from tuition from these potential students. Students are
more likely to find another school that would accept their credits rather than retake their math
courses. Of the students analyzed throughout the project, 2,622 took their calculus courses
elsewhere. The university would not reject all of the schools that were analyzed. For each
student that would not be allowed, the university would lose $53,432 per student. This number is
based on the average cost to attend Missouri S&T for a Missouri resident for their junior and
senior year, assuming that each transfer student is on a four-year graduation plan.

60
IMPLEMENTATION
Implementing the project will take time and can’t happen immediately. The group has
demonstrated this by using previous data and analysis from a previous semester’s design team.
Recommendations can be made, but no immediate decisions can be made. More data needs to be
collected to make the analysis statistically significant. With more data, the results will hold more
weight and decisions can be made about actionable items. Even with increased sample sizes for
the transfer schools, decision will need to be made if excluding credit from a school can be
solely determined on the success scores of students in core engineering courses or if other factors
should be taken into account. For example, ACT scores, math placement scores, or grade point
average. Once sample sizes have increased to an appropriate size, a transition plan will need to
be developed to begin excluding schools credits. This is not a change that would be accepted
overnight. It will take time to inform students and universities. The change could take place over
the course of 4 years, the time it takes a class to graduate college.
PROJECT RISKS
The project presented three main risks: small sample sizes for transfer schools, hypothesis testing
with prediction analysis, and financial impact of loss of potential students.
Small sample sizes for transfer schools were a major risk the group faced. A large quantity of
data is needed to perform many of the tests the team needed to perform accurate predictions. To
perform many of the tests that the group would like to have reviewed, a vast quantity of data is
needed. For many of the tests in comparing the success scores to Missouri S&T students needed
many students to make an accurate theory. For example, of the 1,948 Physics II grades
analyzed, 360 students transferred in calculus I. Those transfer students made up 65 different
universities, of which 57 had less than 10 points of data. Due to the small sample sizes, many of
the tests the group wished to perform on various universities were not viable due to the lack of
data.

61
Hypothesis testing with prediction analysis was another major issue the group faced. Due to the
previously noted small sample sizes, predictions for the success of students transferring core
mathematics classes from other universities was limited. More data will need to be collected and
analyzed.
The loss of revenue from potential students was another risk for the project. Not accepting
credits from certain universities may steer students to a different school that will accept their
credit. Not allowing credit from schools could possibly limit the number of transfer students in
the future.
STAKEHOLDER IMPACT
Stakeholder impact will vary for direct and indirect stakeholders. The members of the group
will not be affected by the project except for the grade received which is needed to graduate.
The project champion and his office could be heavily affected. The decrease in transfer students
could affect the performance metrics for the Enrollment Management Department in a negative
way at first. Knowing which schools that provide transferable math credits could guide a student
to those schools with the intention to transfer or they could come directly to Missouri S&T
instead of transferring credit. This is a possibility for the future. It will not happen immediately.
Transfer student enrollment will likely suffer at first because not all students will have the
foresight to check if their mathematics credits will transfer.
Missouri S&T and the Office of the Registrar could also be heavily affected. Once again, it may
be negative initially and then get better with time. The university could lose potential students to
other universities if mathematics credits are no longer accepted from certain schools. The loss of
these potential students would result in lost revenue from tuition costs. In the future, potential
students could see the smaller list of acceptable transfer schools and choose to come to Missouri
S&T directly which would boost revenue from tuition costs.
Future students and other universities will be affected in the same manner. Students will have a
defined list of acceptable schools to transfer their mathematics credits and other

62
universities will know if they are on that list. Being on the list could boost their enrollment
revenues. Students could also be forced to go to a different transfer school before coming to
Missouri S&T which would adversely affect other schools. Students could also choose to
come directly to Missouri S&T which would help the university.
FUTURE RECOMMENDATIONS
With the project design and structure set up for continuation and future projects, the team
formulated recommendations based on the data analysis. Data must continue to be collected and
added to the analysis the group completed. Once a sample size of 100 per class for each
institution examined, a decision can be made on the merit of each school’s mathematics courses.
As more data is collected, other factors for each university can be examined. Factors include
acceptance ACT scores, acceptance GPA, and math placement exams. These factors be
indicators of future success for students from their program. If the school has higher acceptance
standards, then the students will be forced to work harder to succeed. As more data is collected
and more factors are examined, the group recommends using the relevant data and factors to
develop an optimization model to determine whether credits from a university are acceptable.
With a well-developed model with proper constraints, the Enrollment Management Department
would be able to determine which school’s mathematics credits should be accepted efficiently
and quickly.
CONCLUSION
The statistical tools that were utilized were successful. The data analysis that came from the
pivot tables and t-tests give some preliminary narratives for which universities should be
accepted for transfer credit and it shows that more data should be collected. It was defined in the
project design that the project would be set up for further research. The group accomplished this
successfully. Recommendations were able to be formulated and verified by the data analysis.
The project was a success.

63
REFERENCES
https://futurestudents.mst.edu/costs/cost-estimates/
https://www.statisticshowto.datasciencecentral.com/probability-and-statistics/t-test/
https://blog.minitab.com/blog/statistics-and-quality-data-analysis/what-are-t-values-and- p-
values-in-statistics

64
APPENDIX 1
Pivot Tables
Average of Success Score Success Course
Calc I Location CIV ENG 2200 CIV ENG 2210 PHYSICS 2135 Grand Total
S&T 2.751363141 2.782707622 2.784327323 2.774552193
Transfer 2.56281407 2.686956522 2.686507937 2.653351388
Grand Total 2.694296578 2.744841816 2.758992806 2.736585366 Table 5: This table shows the average success scores of the core engineering courses based on Calc I location of
Missouri S&T and transfer schools as a whole
Average of Success Score Success Course
Calc II Location CIV ENG 2200 CIV ENG 2210 PHYSICS 2135 Grand Total
S&T 2.784860558 2.814589666 2.82115869 2.809164571
Transfer 2.40192926 2.597430407 2.483240223 2.507922535
Grand Total 2.694296578 2.744841816 2.758992806 2.736585366 Table 6: This table shows the average success scores of the core engineering courses based on Calc II location of
Missouri S&T and transfer schools as a whole
Calc I Location A B C D F HR I Grand Total Sort Pass Rate
Univ of Missouri - Kansas City 10 10 5 2 27 1 93%
Saint Charles County Comm Coll 3 9 15 1 28 2 96%
Columbia College 1 3 18 8 1 31 3 71%
Univ of Missouri - Saint Louis 14 16 8 38 4 100%
Saint Louis Univ Main Campus 21 14 7 42 5 100%
Transfer 124 162 170 32 16 1 1 506 6 90%
Missouri S&T 355 546 445 58 35 3 1442 7 93% Table 7: This table shows the breakdown of grades in Phys 2135 and the overall pass rate of the transfer schools
Calc II Location A B C D F HR I Grand Total Sort Pass Rate
Ozarks Technical Community Col 7 4 2 3 16 7 69%
Saint Louis Comm Col Flor Vall 9 13 3 5 30 6 73%
Univ of North Dakota Main Camp 3 7 21 31 5 100%
Saint Charles County Comm Coll 5 21 13 2 1 42 4 93%
Columbia College 3 22 30 12 4 1 72 3 76%
Transfer 58 120 134 29 17 1 1 360 2 87%
Missouri S&T 421 588 481 61 34 3 1588 1 94%

65
Table 8: This table shows the breakdown of grades in Phys 2135 and the overall pass rate of the transfer schools

66
Calculus I Location A B C D F HR Grand Total Sort Pass Rate
Missouri State University 4 14 12 3 1 34 1 0.8823529412
Jefferson College 9 9 10 4 2 34 2 0.8235294118
Saint Charles County Comm Coll 7 10 11 4 2 34 3 0.8235294118
Saint Louis Univ Main Campus 15 15 6 1 37 4 0.972972973
Ozarks Technical Community Col 12 14 19 45 5 1
Transfer 156 174 176 47 22 1 576 6 0.8784722222
Missouri S&T 272 251 273 51 30 877 7 0.9076396807 Table 9: This table shows the breakdown of grades in Civ 2210 and the overall pass rate of the transfer schools
Calculus II Location A B C D F HR Grand Total Sort Pass Rate
Mineral Area College 6 4 3 13 1 1
Saint Louis Comm Col Flor Vall 6 5 10 3 24 2 0.875
East Central College 9 3 9 1 3 25 3 0.84
Ozarks Technical Community Col 13 16 25 1 1 56 4 0.9642857143
Saint Charles County Comm Coll 14 12 16 2 44 5 0.9545454545
Transfer 116 124 169 39 19 467 6 0.8758029979
Missouri S&T 314 301 280 59 33 1 988 7 0.9058704453 Table 10: This table shows the breakdown of grades in Civ 2210 and the overall pass rate of the transfer schools
Calc I Location A B C D F HR I Grand Total Sort Pass Rate
Saint Charles County Comm Coll 3 6 9 1 1 20 1 0.9
Univ of Missouri - Saint Louis 3 12 8 2 25 2 0.92
Lincoln University 7 9 9 25 3 1
Saint Louis Univ Main Campus 16 10 6 32 4 1
Columbia College 2 6 20 5 4 37 5 0.7567567568
Transfer 79 131 146 19 23 2 400 6 0.89
Missouri S&T 209 353 302 24 29 3 920 7 0.9391304348 Table 11: This table shows the breakdown of grades in Civ 2200 and the overall pass rate of the transfer schools

67
Calc II Location A B C D F HR I Grand Total sort Pass Rate
Lincoln University 5 7 12 1 1
Univ of North Dakota Main Camp 3 3 10 1 1 18 2 0.8888888889
Saint Louis Comm Col Flor Vall 1 5 12 2 3 23 3 0.7826086957
Saint Charles County Comm Coll 6 16 9 2 1 1 35 4 0.8857142857
Columbia College 2 16 37 7 9 71 5 0.7746478873
Transfer 47 100 121 17 26 1 1 313 6 0.8562300319
Missouri S&T 241 384 327 26 26 2 1 1007 7 0.9453823237 Table 12: This table shows the breakdown of grades in Civ 2200 and the overall pass rate of the transfer schools
Calc I Location Calc II Location Missouri S&T Transfer Missouri S&T Transfer
Physics 2135 90.78% 87.85% 93.84% 86.67%
Civil Eng 2200 93.91% 89.00% 94.54% 85.62%
Civil Eng 2210 90.78% 87.85% 90.59% 87.58% Table 13: This table shows the overall pass rates of Missouri S&T and transfer students based on their Calc
location

68
APPENDIX 2
Saint Charles County Community College T-test Data
Two-Sample T-Test and CI: MST - Civ
2210, SCC - Civ 2210
Method
μ₁: mean of MST - Civ 2210
µ₂: mean of SCC - Civ 2210
Difference: μ₁ - µ₂
Equal variances are not assumed for this analysis.
Descriptive Statistics
Sample
N
Mean
StDev
SE
Mean
MST - Civ 2210 779 2.83 1.05 0.038
SCC - Civ 2210 34 2.47 1.13 0.19
Estimation for Difference
Difference
95% CI for
Difference
0.36 (-0.042,
0.762)
Test
Null hypothesis H₀: μ₁ - µ₂ =
0
Alternative hypothesis H₁: μ₁ - µ₂ ≠
0
T-Value
DF
P-
Value
1.82 35 0.078
Table 14: The table shows the t-test results for SCCC Calc I and Civ 2210

69
Two-Sample T-Test and CI: MST- Civ
2200, SCC - Civ 2200
Method
μ₁: mean of MST- Civ 2200
µ₂: mean of SCC - Civ 2200
Difference: μ₁ - µ₂
Equal variances are not assumed for this analysis.
Descriptive Statistics
Sample
N
Mean
StDev
SE
Mean
MST- Civ 2200 917 2.751 0.941 0.031
SCC - Civ 2200 20 2.45 0.999 0.22
Estimation for Difference
Difference
95% CI for
Difference
0.301 (-0.171,
0.773)
Test
Null hypothesis H₀: μ₁ - µ₂ =
0
Alternative hypothesis H₁: μ₁ - µ₂ ≠
0
T-Value
DF
P-
Value
1.34 19 0.197
Table 15: The table shows the t-test results for SCCC Calc I and Civ 2200

70
Two-Sample T-Test and CI: MST - Physics
2, SCC - Physics 2
Method
μ₁: mean of MST - Physics 2
µ₂: mean of SCC - Physics 2
Difference: μ₁ - µ₂
Equal variances are not assumed for this analysis.
Descriptive Statistics
Sample
N
Mean
StDev
SE
Mean
MST - Physics 2 1442 2.784 0.943 0.025
SCC - Physics 2 29 2.483 0.738 0.14
Estimation for Difference
Difference
95% CI for
Difference
0.302 (0.017,
0.586)
Test
Null hypothesis H₀: μ₁ - µ₂ =
0
Alternative hypothesis H₁: μ₁ - µ₂ ≠
0
T-Value
DF
P-
Value
2.17 29 0.039
Table 16: The table shows the t-test results for SCCC Calc I and Phys 2135

71
Two-Sample T-Test and CI: MST - Civ
2210, SCCC - Civ 2210
Method
μ₁: mean of MST - Civ 2210
µ₂: mean of SCCC - Civ 2210
Difference: μ₁ - µ₂
Equal variances are not assumed for this analysis.
Descriptive Statistics
Sample
N
Mean
StDev
SE
Mean
MST - Civ 2210 779 2.83 1.05 0.038
SCCC - Civ 2210 44 2.864 0.93 0.14
Estimation for Difference
Difference
95% CI for
Difference
-0.033 (-0.325,
0.259)
Test
Null hypothesis H₀: μ₁ - µ₂ =
0
Alternative hypothesis H₁: μ₁ - µ₂ ≠
0
T-Value
DF
P-
Value
-0.23 49 0.821
Table 17: The table shows the t-test results for SCCC Calc II and Civ 2210

72
Two-Sample T-Test and CI: MST - Civ
2200, SCCC - Civ 2200
Method
μ₁: mean of MST - Civ 2200
µ₂: mean of SCCC - Civ 2200
Difference: μ₁ - µ₂
Equal variances are not assumed for this analysis.
Descriptive Statistics
Sample
N
Mean
StDev
SE
Mean
MST - Civ 2200 810 2.786 0.934 0.033
SCCC - Civ 2200 34 2.706 0.938 0.16
Estimation for Difference
Difference
95% CI for
Difference
0.081 (-0.253,
0.414)
Test
Null hypothesis H₀: μ₁ - µ₂ =
0
Alternative hypothesis H₁: μ₁ - µ₂ ≠
0
T-Value
DF
P-
Value
0.49 35 0.627
Table 18: The table shows the t-test results for SCCC Calc II and Civ 2200

73
Two-Sample T-Test and CI: MST - Phy 2,
SCCC - Phy 2
Method
μ₁: mean of MST - Phy 2
µ₂: mean of SCCC - Phy 2
Difference: μ₁ - µ₂
Equal variances are not assumed for this analysis.
Descriptive Statistics
Sample
N
Mean
StDev
SE
Mean
MST - Phy 2 1297 2.8 0.951 0.026
SCCC - Phy 2 42 2.643 0.85 0.13
Estimation for Difference
Difference
95% CI for
Difference
0.157 (-0.113,
0.426)
Test
Null hypothesis H₀: μ₁ - µ₂ =
0
Alternative hypothesis H₁: μ₁ - µ₂ ≠
0
T-Value
DF
P-
Value
1.17 44 0.248
Table 19: The table shows the t-test results for SCCC Calc II and Phys 2135

74
APPENDIX 3
University of Missouri – Kansas City T-test Data
Two-Sample T-Test and CI: MST - Civ
2210, UMKC - Civ 2210
Method
μ₁: mean of MST - Civ 2210
µ₂: mean of UMKC - Civ 2210
Difference: μ₁ - µ₂
Equal variances are not assumed for this analysis.
Descriptive Statistics
Sample
N
Mean
StDev
SE
Mean
MST - Civ 2210 779 2.83 1.05 0.038
UMKC - Civ 2210 12 3.25 0.965 0.28
Estimation for Difference
Difference
95% CI for
Difference
-0.419 (-1.038,
0.199)
Test
Null hypothesis H₀: μ₁ - µ₂ =
0
Alternative hypothesis H₁: μ₁ - µ₂ ≠
0
T-Value
DF
P-
Value
-1.49 11 0.164
Table 20: The table shows the t-test results for UMKC Calc I and Civ 2210

75
Two-Sample T-Test and CI: MST- Civ
2200, UMKC - Civ 2200
Method
μ₁: mean of MST- Civ 2200
µ₂: mean of UMKC - Civ 2200
Difference: μ₁ - µ₂
Equal variances are not assumed for this analysis.
Descriptive Statistics
Sample
N
Mean
StDev
SE
Mean
MST- Civ 2200 917 2.751 0.941 0.031
UMKC - Civ 2200 15 3.133 0.99 0.26
Estimation for Difference
Difference
95% CI for
Difference
-0.382 (-0.934,
0.171)
Test
Null hypothesis H₀: μ₁ - µ₂ =
0
Alternative hypothesis H₁: μ₁ - µ₂ ≠
0
T-Value
DF
P-
Value
-1.48 14 0.16
Table 21: The table shows the t-test results for UMKC Calc I and Civ 2200

76
Two-Sample T-Test and CI: MST - Physics
2, UMKC - Physics 2
Method
μ₁: mean of MST - Physics 2
µ₂: mean of UMKC - Physics 2
Difference: μ₁ - µ₂
Equal variances are not assumed for this analysis.
Descriptive Statistics
Sample
N
Mean
StDev
SE
Mean
MST - Physics 2 1442 2.784 0.943 0.025
UMKC - Physics 2 27 3.037 0.94 0.18
Estimation for Difference
Difference
95% CI for
Difference
-0.253 (-0.628,
0.123)
Test
Null hypothesis H₀: μ₁ - µ₂ =
0
Alternative hypothesis H₁: μ₁ - µ₂ ≠
0
T-Value
DF
P-
Value
-1.38 26 0.178
Table 22: The table shows the t-test results for UMKC Calc I and Phys 2135

77
Two-Sample T-Test and CI: MST - Civ
2210, UMKC - Civ 2210
Method
μ₁: mean of MST - Civ 2210
µ₂: mean of UMKC - Civ 2210
Difference: μ₁ - µ₂
Equal variances are not assumed for this analysis.
Descriptive Statistics
Sample
N
Mean
StDev
SE
Mean
MST - Civ 2210 779 2.83 1.05 0.038
UMKC - Civ 2210 4 3.25 0.957 0.48
Estimation for Difference
Difference
95% CI for
Difference
-0.419 (-1.948,
1.109)
Test
Null hypothesis H₀: μ₁ - µ₂ =
0
Alternative hypothesis H₁: μ₁ - µ₂ ≠
0
T-Value
DF
P-
Value
-0.87 3 0.447
Table 23: The table shows the t-test results for UMKC Calc II and Civ 2210

78
Two-Sample T-Test and CI: MST - Civ
2200, UMKC - Civ 2200
Method
μ₁: mean of MST - Civ 2200
µ₂: mean of UMKC - Civ 2200
Difference: μ₁ - µ₂
Equal variances are not assumed for this analysis.
Descriptive Statistics
Sample
N
Mean
StDev
SE
Mean
MST - Civ 2200 810 2.786 0.934 0.033
UMKC - Civ 2200 5 2.8 1.3 0.58
Estimation for Difference
Difference
95% CI for
Difference
-0.014 (-1.635,
1.608)
Test
Null hypothesis H₀: μ₁ - µ₂ =
0
Alternative hypothesis H₁: μ₁ - µ₂ ≠
0
T-Value
DF
P-
Value
-0.02 4 0.983
Table 24: The table shows the t-test results for UMKC Calc II and Civ 2200

79
Two-Sample T-Test and CI: MST - Phy 2,
UMKC - Phy 2
Method
μ₁: mean of MST - Phy 2
µ₂: mean of UMKC - Phy 2
Difference: μ₁ - µ₂
Equal variances are not assumed for this analysis.
Descriptive Statistics
Sample
N
Mean
StDev
SE
Mean
MST - Phy 2 1297 2.8 0.951 0.026
UMKC - Phy 2 8 3.25 0.886 0.31
Estimation for Difference
Difference
95% CI for
Difference
-0.45 (-1.194,
0.293)
Test
Null hypothesis H₀: μ₁ - µ₂ =
0
Alternative hypothesis H₁: μ₁ - µ₂ ≠
0
T-Value
DF
P-
Value
-1.43 7 0.195
Table 25: The table shows the t-test results for UMKC Calc II and Phys 2135

80
APPENDIX 4
Columbia College T-test Data
Two-Sample T-Test and CI: MST - Civ
2210, Columbia Col - Civ 2210
Method
μ₁: mean of MST - Civ 2210
µ₂: mean of Columbia Col - Civ 2210
Difference: μ₁ - µ₂
Equal variances are not assumed for this analysis.
Descriptive Statistics
Sample
N
Mean
StDev
SE
Mean
MST - Civ 2210 779 2.83 1.05 0.038
Columbia Col - Civ 2210 27 2.15 1.03 0.2
Estimation for Difference
Difference
95% CI for
Difference
0.682 (0.270,
1.095)
Test
Null hypothesis H₀: μ₁ - µ₂ =
0
Alternative hypothesis H₁: μ₁ - µ₂ ≠
0
T-Value
DF
P-
Value
3.39 27 0.002
Table 26: The table shows the t-test results for Columbia College Calc I and Civ 2210

81
Two-Sample T-Test and CI: MST- Civ
2200, Columbia Col - Civ 2200
Method
μ₁: mean of MST- Civ 2200
µ₂: mean of Columbia Col - Civ 2200
Difference: μ₁ - µ₂
Equal variances are not assumed for this analysis.
Descriptive Statistics
Sample
N
Mean
StDev
SE
Mean
MST- Civ 2200 917 2.751 0.941 0.031
Columbia Col - Civ 2200 37 1.919 0.983 0.16
Estimation for Difference
Difference
95% CI for
Difference
0.832 (0.499,
1.165)
Test
Null hypothesis H₀: μ₁ - µ₂ =
0
Alternative hypothesis H₁: μ₁ - µ₂ ≠
0
T-Value
DF
P-
Value
5.06 38 0
Table 27: The table shows the t-test results for Columbia College Calc I and Civ 2200

82
Two-Sample T-Test and CI: MST - Physics
2, Columbia Col - Physics 2
Method
μ₁: mean of MST - Physics 2
µ₂: mean of Columbia Col - Physics 2
Difference: μ₁ - µ₂
Equal variances are not assumed for this analysis.
Descriptive Statistics
Sample
N
Mean
StDev
SE
Mean
MST - Physics 2 1442 2.784 0.943 0.025
Columbia Col - Physics 2 31 1.839 0.779 0.14
Estimation for Difference
Difference
95% CI for
Difference
0.946 (0.656,
1.235)
Test
Null hypothesis H₀: μ₁ - µ₂ =
0
Alternative hypothesis H₁: μ₁ - µ₂ ≠
0
T-Value
DF
P-
Value
6.66 31 0
Table 28: The table shows the t-test results for Columbia College Calc I and Phys 2135

83
Two-Sample T-Test and CI: MST - Civ
2210, Columbia Col - Civ 2210
Method
μ₁: mean of MST - Civ 2210
µ₂: mean of Columbia Col - Civ 2210
Difference: μ₁ - µ₂
Equal variances are not assumed for this analysis.
Descriptive Statistics
Sample
N
Mean
StDev
SE
Mean
MST - Civ 2210 779 2.83 1.05 0.038
Columbia Col - Civ 2210 54 2.13 1.03 0.14
Estimation for Difference
Difference
95% CI for
Difference
0.701 (0.411,
0.991)
Test
Null hypothesis H₀: μ₁ - µ₂ =
0
Alternative hypothesis H₁: μ₁ - µ₂ ≠
0
T-Value
DF
P-
Value
4.84 60 0
Table 29: The table shows the t-test results for Columbia College Calc II and Civ 2210

84
Two-Sample T-Test and CI: MST - Civ
2200, Columbia Col - Civ 2200
Method
μ₁: mean of MST - Civ 2200
µ₂: mean of Columbia Col - Civ 2200
Difference: μ₁ - µ₂
Equal variances are not assumed for this analysis.
Descriptive Statistics
Sample
N
Mean
StDev
SE
Mean
MST - Civ 2200 810 2.786 0.934 0.033
Columbia Col - Civ 2200 71 1.93 0.976 0.12
Estimation for Difference
Difference
95% CI for
Difference
0.857 (0.617,
1.096)
Test
Null hypothesis H₀: μ₁ - µ₂ =
0
Alternative hypothesis H₁: μ₁ - µ₂ ≠
0
T-Value
DF
P-
Value
7.12 81 0
Table 30: The table shows the t-test results for Columbia College Calc II and Civ 2200

85
Two-Sample T-Test and CI: MST - Phy 2,
Columbia Col - Phy 2
Method
μ₁: mean of MST - Phy 2
µ₂: mean of Columbia Col - Phy 2
Difference: μ₁ - µ₂
Equal variances are not assumed for this analysis.
Descriptive Statistics
Sample
N
Mean
StDev
SE
Mean
MST - Phy 2 1297 2.8 0.951 0.026
Columbia Col - Phy 2 71 2.113 0.934 0.11
Estimation for Difference
Difference
95% CI for
Difference
0.687 (0.460,
0.914)
Test
Null hypothesis H₀: μ₁ - µ₂ =
0
Alternative hypothesis H₁: μ₁ - µ₂ ≠
0
T-Value
DF
P-
Value
6.03 78 0
Table 31: The table shows the t-test results for Columbia College Calc II and Phys 2135

86
APPENDIX 5
Lincoln University T-test Data
Two-Sample T-Test and CI: MST - Civ
2210, Lincoln - Civ 2210
Method
μ₁: mean of MST - Civ 2210
µ₂: mean of Lincoln - Civ 2210
Difference: μ₁ - µ₂
Equal variances are not assumed for this analysis.
Descriptive Statistics
Sample
N
Mean
StDev
SE
Mean
MST - Civ 2210 779 2.83 1.05 0.038
Lincoln - Civ 2210 13 3.08 1.04 0.29
Estimation for Difference
Difference
95% CI for
Difference
-0.246 (-0.879,
0.386)
Test
Null hypothesis H₀: μ₁ - µ₂ =
0
Alternative hypothesis H₁: μ₁ - µ₂ ≠
0
T-Value
DF
P-
Value
-0.85 12 0.413
Table 32: The table shows the t-test results for Lincoln University Calc I and Civ 2210
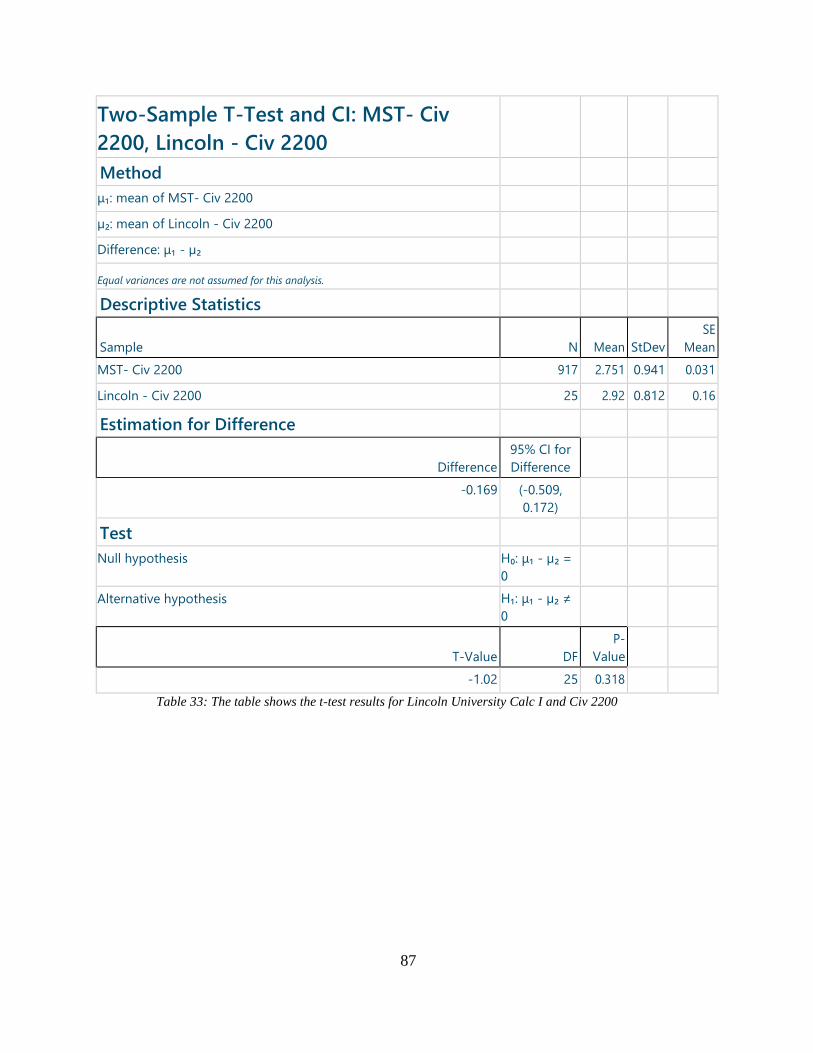
87
Two-Sample T-Test and CI: MST- Civ
2200, Lincoln - Civ 2200
Method
μ₁: mean of MST- Civ 2200
µ₂: mean of Lincoln - Civ 2200
Difference: μ₁ - µ₂
Equal variances are not assumed for this analysis.
Descriptive Statistics
Sample
N
Mean
StDev
SE
Mean
MST- Civ 2200 917 2.751 0.941 0.031
Lincoln - Civ 2200 25 2.92 0.812 0.16
Estimation for Difference
Difference
95% CI for
Difference
-0.169 (-0.509,
0.172)
Test
Null hypothesis H₀: μ₁ - µ₂ =
0
Alternative hypothesis H₁: μ₁ - µ₂ ≠
0
T-Value
DF
P-
Value
-1.02 25 0.318
Table 33: The table shows the t-test results for Lincoln University Calc I and Civ 2200

88
Two-Sample T-Test and CI: MST - Physics
2, Lincoln - Physics 2
Method
μ₁: mean of MST - Physics 2
µ₂: mean of Lincoln - Physics 2
Difference: μ₁ - µ₂
Equal variances are not assumed for this analysis.
Descriptive Statistics
Sample
N
Mean
StDev
SE
Mean
MST - Physics 2 1442 2.784 0.943 0.025
Lincoln - Physics 2 27 3.111 0.751 0.14
Estimation for Difference
Difference
95% CI for
Difference
-0.327 (-0.628, -
0.026)
Test
Null hypothesis H₀: μ₁ - µ₂ = 0
Alternative hypothesis H₁: μ₁ - µ₂ ≠ 0
T-Value
DF
P-
Value
-2.23 27 0.034
Table 34: The table shows the t-test results for Lincoln University Calc I and Phys 2135

89
Two-Sample T-Test and CI: MST - Civ
2210, Lincoln - Civ 2210
Method
μ₁: mean of MST - Civ 2210
µ₂: mean of Lincoln - Civ 2210
Difference: μ₁ - µ₂
Equal variances are not assumed for this analysis.
Descriptive Statistics
Sample
N
Mean
StDev
SE
Mean
MST - Civ 2210 779 2.83 1.05 0.038
Lincoln - Civ 2210 15 2.533 0.99 0.26
Estimation for Difference
Difference
95% CI for
Difference
0.297 (-0.257,
0.852)
Test
Null hypothesis H₀: μ₁ - µ₂ =
0
Alternative hypothesis H₁: μ₁ - µ₂ ≠
0
T-Value
DF
P-
Value
1.15 14 0.269
Table 35: The table shows the t-test results for Lincoln University Calc II and Civ 2210

90
Two-Sample T-Test and CI: MST - Civ
2200, Lincoln - Civ 2200
Method
μ₁: mean of MST - Civ 2200
µ₂: mean of Lincoln - Civ 2200
Difference: μ₁ - µ₂
Equal variances are not assumed for this analysis.
Descriptive Statistics
Sample
N
Mean
StDev
SE
Mean
MST - Civ 2200 810 2.786 0.934 0.033
Lincoln - Civ 2200 12 2.417 0.515 0.15
Estimation for Difference
Difference
95% CI for
Difference
0.37 (0.038,
0.701)
Test
Null hypothesis H₀: μ₁ - µ₂ =
0
Alternative hypothesis H₁: μ₁ - µ₂ ≠
0
T-Value
DF
P-
Value
2.43 12 0.032
Table 36: The table shows the t-test results for Lincoln University Calc II and Civ 2200
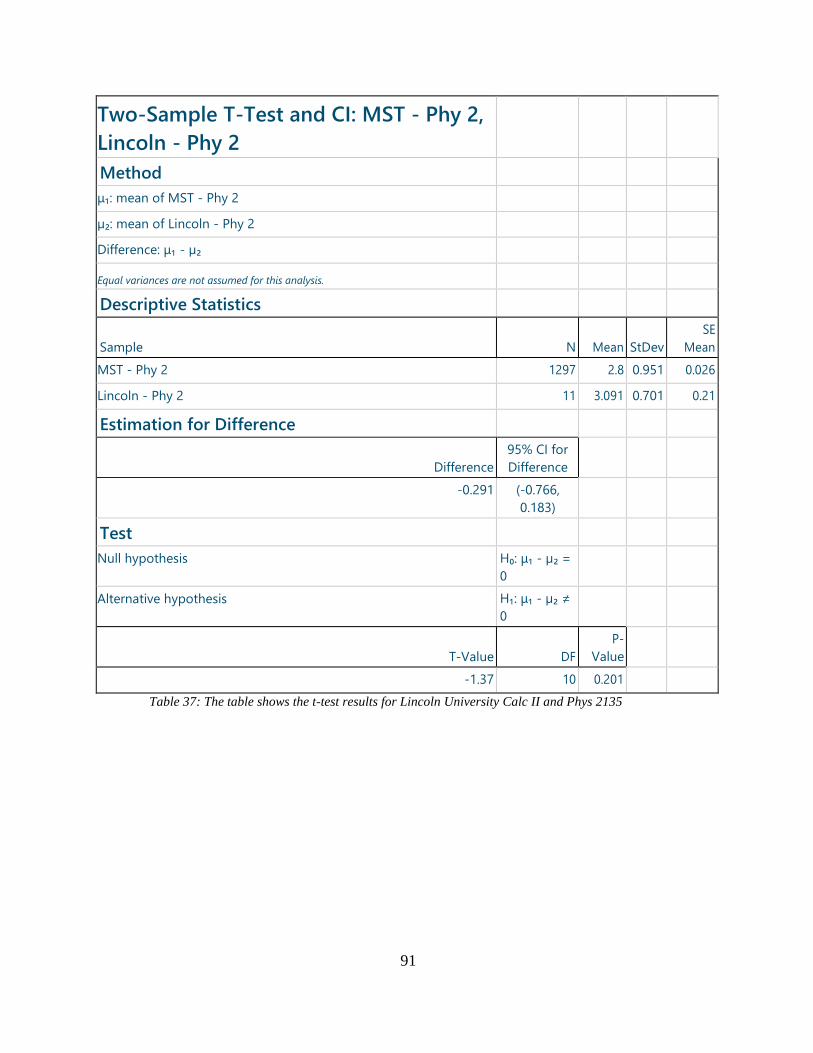
91
Two-Sample T-Test and CI: MST - Phy 2,
Lincoln - Phy 2
Method
μ₁: mean of MST - Phy 2
µ₂: mean of Lincoln - Phy 2
Difference: μ₁ - µ₂
Equal variances are not assumed for this analysis.
Descriptive Statistics
Sample
N
Mean
StDev
SE
Mean
MST - Phy 2 1297 2.8 0.951 0.026
Lincoln - Phy 2 11 3.091 0.701 0.21
Estimation for Difference
Difference
95% CI for
Difference
-0.291 (-0.766,
0.183)
Test
Null hypothesis H₀: μ₁ - µ₂ =
0
Alternative hypothesis H₁: μ₁ - µ₂ ≠
0
T-Value
DF
P-
Value
-1.37 10 0.201
Table 37: The table shows the t-test results for Lincoln University Calc II and Phys 2135

92
APPENDIX 6
University of Central Missouri T-test Data
Two-Sample T-Test and CI: MST - Civ
2210, Central MO - Civ 2210
Method
μ₁: mean of MST - Civ 2210
µ₂: mean of Central MO - Civ 2210
Difference: μ₁ - µ₂
Equal variances are not assumed for this analysis.
Descriptive Statistics
Sample
N
Mean
StDev
SE
Mean
MST - Civ 2210 779 2.83 1.05 0.038
Central MO - Civ 2210 6 2.5 1.52 0.62
Estimation for Difference
Difference
95% CI for
Difference
0.331 (-1.264,
1.925)
Test
Null hypothesis H₀: μ₁ - µ₂ =
0
Alternative hypothesis H₁: μ₁ - µ₂ ≠
0
T-Value
DF
P-
Value
0.53 5 0.617
Table 38: The table shows the t-test results for UCM Calc I and Civ 2210

93
Two-Sample T-Test and CI: MST- Civ
2200, Central MO - Civ 2200
Method
μ₁: mean of MST- Civ 2200
µ₂: mean of Central MO - Civ 2200
Difference: μ₁ - µ₂
Equal variances are not assumed for this analysis.
Descriptive Statistics
Sample
N
Mean
StDev
SE
Mean
MST- Civ 2200 917 2.751 0.941 0.031
Central MO - Civ 2200 12 2.917 0.996 0.29
Estimation for Difference
Difference
95% CI for
Difference
-0.165 (-0.802,
0.471)
Test
Null hypothesis H₀: μ₁ - µ₂ =
0
Alternative hypothesis H₁: μ₁ - µ₂ ≠
0
T-Value
DF
P-
Value
-0.57 11 0.579
Table 39: The table shows the t-test results for UCM Calc I and Civ 2200

94
Two-Sample T-Test and CI: MST - Physics
2, Central MO - Physics 2
Method
μ₁: mean of MST - Physics 2
µ₂: mean of Central MO - Physics 2
Difference: μ₁ - µ₂
Equal variances are not assumed for this analysis.
Descriptive Statistics
Sample
N
Mean
StDev
SE
Mean
MST - Physics 2 1442 2.784 0.943 0.025
Central MO - Physics 2 26 3.346 0.797 0.16
Estimation for Difference
Difference
95% CI for
Difference
-0.562 (-0.887, -
0.236)
Test
Null hypothesis H₀: μ₁ - µ₂ =
0
Alternative hypothesis H₁: μ₁ - µ₂ ≠
0
T-Value
DF
P-
Value
-3.55 26 0.001
Table 40: The table shows the t-test results for UCM Calc I and Phys 2135

95
Two-Sample T-Test and CI: MST - Civ
2210, Central MO - Civ 2210
Method
μ₁: mean of MST - Civ 2210
µ₂: mean of Central MO - Civ 2210
Difference: μ₁ - µ₂
Equal variances are not assumed for this analysis.
Descriptive Statistics
Sample
N
Mean
StDev
SE
Mean
MST - Civ 2210 779 2.83 1.05 0.038
Central MO - Civ 2210 6 3.667 0.516 0.21
Estimation for Difference
Difference
95% CI for
Difference
-0.836 (-1.387, -
0.286)
Test
Null hypothesis H₀: μ₁ - µ₂ =
0
Alternative hypothesis H₁: μ₁ - µ₂ ≠
0
T-Value
DF
P-
Value
-3.9 5 0.011
Table 41: The table shows the t-test results for UCM Calc II and Civ 2210

96
Two-Sample T-Test and CI: MST - Civ
2200, Central MO - 2200
Method
μ₁: mean of MST - Civ 2200
µ₂: mean of Central MO - 2200
Difference: μ₁ - µ₂
Equal variances are not assumed for this analysis.
Descriptive Statistics
Sample
N
Mean
StDev
SE
Mean
MST - Civ 2200 810 2.786 0.934 0.033
Central MO - 2200 3 3 1 0.58
Estimation for Difference
Difference
95% CI for
Difference
-0.214 (-2.702,
2.275)
Test
Null hypothesis H₀: μ₁ - µ₂ =
0
Alternative hypothesis H₁: μ₁ - µ₂ ≠
0
T-Value
DF
P-
Value
-0.37 2 0.747
Table 42: The table shows the t-test results for UCM Calc II and Civ 2200

97
Two-Sample T-Test and CI: MST - Phy 2,
Central MO - Phy 2
Method
μ₁: mean of MST - Phy 2
µ₂: mean of Central MO - Phy 2
Difference: μ₁ - µ₂
Equal variances are not assumed for this analysis.
Descriptive Statistics
Sample
N
Mean
StDev
SE
Mean
MST - Phy 2 1297 2.8 0.951 0.026
Central MO - Phy 2 8 3 1.07 0.38
Estimation for Difference
Difference
95% CI for
Difference
-0.2 (-1.096,
0.695)
Test
Null hypothesis H₀: μ₁ - µ₂ =
0
Alternative hypothesis H₁: μ₁ - µ₂ ≠
0
T-Value
DF
P-
Value
-0.53 7 0.613
Table 43: The table shows the t-test results for UCM Calc II and Phys 2135

98
APPENDIX 7
Southeastern Missouri State University T-test Data
Two-Sample T-Test and CI: MST - Civ
2210, SEMO - Civ 2210
Method
μ₁: mean of MST - Civ 2210
µ₂: mean of SEMO - Civ 2210
Difference: μ₁ - µ₂
Equal variances are not assumed for this analysis.
Descriptive Statistics
Sample
N
Mean
StDev
SE
Mean
MST - Civ 2210 779 2.83 1.05 0.038
SEMO - Civ 2210 7 3 1 0.38
Estimation for Difference
Difference
95% CI for
Difference
-0.169 (-1.099,
0.760)
Test
Null hypothesis H₀: μ₁ - µ₂ =
0
Alternative hypothesis H₁: μ₁ - µ₂ ≠
0
T-Value
DF
P-
Value
-0.45 6 0.671
Table 44: The table shows the t-test results for SEMO Calc I and Civ 2210

99
Two-Sample T-Test and CI: MST- Civ
2200, SEMO - Civ 2200
Method
μ₁: mean of MST- Civ 2200
µ₂: mean of SEMO - Civ 2200
Difference: μ₁ - µ₂
Equal variances are not assumed for this analysis.
Descriptive Statistics
Sample
N
Mean
StDev
SE
Mean
MST- Civ 2200 917 2.751 0.941 0.031
SEMO - Civ 2200 16 2.63 1.15 0.29
Estimation for Difference
Difference
95% CI for
Difference
0.126 (-0.489,
0.741)
Test
Null hypothesis H₀: μ₁ - µ₂ =
0
Alternative hypothesis H₁: μ₁ - µ₂ ≠
0
T-Value
DF
P-
Value
0.44 15 0.668
Table 45: The table shows the t-test results for SEMO Calc I and Civ 2200

100
Two-Sample T-Test and CI: MST - Physics
2, SEMO - Physics 2
Method
μ₁: mean of MST - Physics 2
µ₂: mean of SEMO - Physics 2
Difference: μ₁ - µ₂
Equal variances are not assumed for this analysis.
Descriptive Statistics
Sample
N
Mean
StDev
SE
Mean
MST - Physics 2 1442 2.784 0.943 0.025
SEMO - Physics 2 19 2.58 1.07 0.25
Estimation for Difference
Difference
95% CI for
Difference
0.205 (-0.313,
0.724)
Test
Null hypothesis H₀: μ₁ - µ₂ =
0
Alternative hypothesis H₁: μ₁ - µ₂ ≠
0
T-Value
DF
P-
Value
0.83 18 0.416
Table 46: The table shows the t-test results for SEMO Calc I and Phys 2135

101
Two-Sample T-Test and CI: MST - Civ
2210, SE Missouri - Civ 2210
Method
μ₁: mean of MST - Civ 2210
µ₂: mean of SE Missouri - Civ 2210
Difference: μ₁ - µ₂
Equal variances are not assumed for this analysis.
Descriptive Statistics
Sample
N
Mean
StDev
SE
Mean
MST - Civ 2210 779 2.83 1.05 0.038
SE Missouri - Civ 2210 11 2.727 0.905 0.27
Estimation for Difference
Difference
95% CI for
Difference
0.103 (-0.510,
0.717)
Test
Null hypothesis H₀: μ₁ - µ₂ =
0
Alternative hypothesis H₁: μ₁ - µ₂ ≠
0
T-Value
DF
P-
Value
0.38 10 0.715
Table 47: The table shows the t-test results for SEMO Calc II and Civ 2210

102
Two-Sample T-Test and CI: MST - Civ
2200, SE Missouri - Civ 2200
Method
μ₁: mean of MST - Civ 2200
µ₂: mean of SE Missouri - Civ 2200
Difference: μ₁ - µ₂
Equal variances are not assumed for this analysis.
Descriptive Statistics
Sample
N
Mean
StDev
SE
Mean
MST - Civ 2200 810 2.786 0.934 0.033
SE Missouri - Civ 2200 9 2.67 1.22 0.41
Estimation for Difference
Difference
95% CI for
Difference
0.12 (-0.825,
1.064)
Test
Null hypothesis H₀: μ₁ - µ₂ =
0
Alternative hypothesis H₁: μ₁ - µ₂ ≠
0
T-Value
DF
P-
Value
0.29 8 0.777
Table 48: The table shows the t-test results for SEMO Calc II and Civ 2200

103
Two-Sample T-Test and CI: MST - Phy 2,
SE Missouri - Phy 2
Method
μ₁: mean of MST - Phy 2
µ₂: mean of SE Missouri - Phy 2
Difference: μ₁ - µ₂
Equal variances are not assumed for this analysis.
Descriptive Statistics
Sample
N
Mean
StDev
SE
Mean
MST - Phy 2 1297 2.8 0.951 0.026
SE Missouri - Phy 2 11 2.82 1.6 0.48
Estimation for Difference
Difference
95% CI for
Difference
-0.019 (-1.096,
1.059)
Test
Null hypothesis H₀: μ₁ - µ₂ =
0
Alternative hypothesis H₁: μ₁ - µ₂ ≠
0
T-Value
DF
P-
Value
-0.04 10 0.97
Table 49: The table shows the t-test results for SEMO Calc II and Phys 2135

104
APPENDIX 8
St. Louis Community College – Florissant Valley T-test Data
Two-Sample T-Test and CI: MST - Civ 2210, STL
CC Flor Vall - Civ 2210
Method
μ₁: mean of MST - Civ 2210
µ₂: mean of STL CC Flor Vall - Civ 2210
Difference: μ₁ - µ₂
Equal variances are not assumed for this analysis.
Descriptive Statistics
Sample N Mean StDev
MST - Civ 2210 779 2.83 1.05
STL CC Flor Vall - Civ 2210 4 2.25 0.957
Estimation for Difference
Difference
95% CI for
Difference
0.581 (-0.948,
2.109)
Test
Null hypothesis H₀: μ₁ - µ₂ =
0
Alternative hypothesis H₁: μ₁ - µ₂ ≠
0
T-Value
DF
P-
Value
1.21 3 0.313
Table 50: The table shows the t-test results for STLCC-Flo Val Calc I and Civ 2210

105
Two-Sample T-Test and CI: MST- Civ
2200, STL CC Flor Vall - Civ 2200
Method
μ₁: mean of MST- Civ 2200
µ₂: mean of STL CC Flor Vall - Civ 2200
Difference: μ₁ - µ₂
Equal variances are not assumed for this analysis.
Descriptive Statistics
Sample
N
Mean
StDev
SE
Mean
MST- Civ 2200 917 2.751 0.941 0.031
STL CC Flor Vall - Civ 2200 16 1.938 0.929 0.23
Estimation for Difference
Difference
95% CI for
Difference
0.814 (0.315,
1.313)
Test
Null hypothesis H₀: μ₁ - µ₂ =
0
Alternative hypothesis H₁: μ₁ - µ₂ ≠
0
T-Value
DF
P-
Value
3.47 15 0.003
Table 51: The table shows the t-test results for STLCC-Flo Val Calc I and Civ 2200

106
Two-Sample T-Test and CI: MST - Physics
2, STL CC Flor Vall - Physics 2
Method
μ₁: mean of MST - Physics 2
µ₂: mean of STL CC Flor Vall - Physics 2
Difference: μ₁ - µ₂
Equal variances are not assumed for this analysis.
Descriptive Statistics
Sample
N
Mean
StDev
SE
Mean
MST - Physics 2 1442 2.784 0.943 0.025
STL CC Flor Vall - Physics 2 20 1.75 1.02 0.23
Estimation for Difference
Difference
95% CI for
Difference
1.034 (0.554,
1.514)
Test
Null hypothesis H₀: μ₁ - µ₂ =
0
Alternative hypothesis H₁: μ₁ - µ₂ ≠
0
T-Value
DF
P-
Value
4.51 19 0
Table 52: The table shows the t-test results for STLCC-Flo Val Calc I and Phys 2135

107
Two-Sample T-Test and CI: MST - Civ
2210, ST Louis CC - Civ 2210
Method
μ₁: mean of MST - Civ 2210
µ₂: mean of ST Louis CC - Civ 2210
Difference: μ₁ - µ₂
Equal variances are not assumed for this analysis.
Descriptive Statistics
Sample
N
Mean
StDev
SE
Mean
MST - Civ 2210 779 2.83 1.05 0.038
ST Louis CC - Civ 2210 24 2.58 1.02 0.21
Estimation for Difference
Difference
95% CI for
Difference
0.247 (-0.189,
0.683)
Test
Null hypothesis H₀: μ₁ - µ₂ =
0
Alternative hypothesis H₁: μ₁ - µ₂ ≠
0
T-Value
DF
P-
Value
1.17 24 0.253
Table 53: The table shows the t-test results for STLCC-Flo Val Calc II and Civ 2210

108
Two-Sample T-Test and CI: MST - Civ
2200, ST Louis CC - Civ 2200
Method
μ₁: mean of MST - Civ 2200
µ₂: mean of ST Louis CC - Civ 2200
Difference: μ₁ - µ₂
Equal variances are not assumed for this analysis.
Descriptive Statistics
Sample
N
Mean
StDev
SE
Mean
MST - Civ 2200 810 2.786 0.934 0.033
ST Louis CC - Civ 2200 23 1.96 1.02 0.21
Estimation for Difference
Difference
95% CI for
Difference
0.83 (0.384,
1.276)
Test
Null hypothesis H₀: μ₁ - µ₂ =
0
Alternative hypothesis H₁: μ₁ - µ₂ ≠
0
T-Value
DF
P-
Value
3.85 23 0.001
Table 54: The table shows the t-test results for STLCC-Flo Val Calc II and Civ 2200

109
Two-Sample T-Test and CI: MST - Phy 2,
ST Louis CC - Phy 2
Method
μ₁: mean of MST - Phy 2
µ₂: mean of ST Louis CC - Phy 2
Difference: μ₁ - µ₂
Equal variances are not assumed for this analysis.
Descriptive Statistics
Sample
N
Mean
StDev
SE
Mean
MST - Phy 2 1297 2.8 0.951 0.026
ST Louis CC - Phy 2 30 1.87 1.04 0.19
Estimation for Difference
Difference
95% CI for
Difference
0.933 (0.541,
1.325)
Test
Null hypothesis H₀: μ₁ - µ₂ =
0
Alternative hypothesis H₁: μ₁ - µ₂ ≠
0
T-Value
DF
P-
Value
4.86 30 0
Table 55: The table shows the t-test results for STLCC-Flo Val Calc II and Phys 2135

110
APPENDIX 9
Saint Louis University T-test Data
Two-Sample T-Test and CI: MST - Civ
2210, SLU - Civ 2210
Method
μ₁: mean of MST - Civ 2210
µ₂: mean of SLU - Civ 2210
Difference: μ₁ - µ₂
Equal variances are not assumed for this analysis.
Descriptive Statistics
Sample
N
Mean
StDev
SE
Mean
MST - Civ 2210 779 2.83 1.05 0.038
SLU - Civ 2210 37 3.189 0.811 0.13
Estimation for Difference
Difference
95% CI for
Difference
-0.359 (-0.638, -
0.079)
Test
Null hypothesis H₀: μ₁ - µ₂ =
0
Alternative hypothesis H₁: μ₁ - µ₂ ≠
0
T-Value
DF
P-
Value
-2.59 41 0.013
Table 56: The table shows the t-test results for SLU Calc I and Civ 2210

111
Two-Sample T-Test and CI: MST- Civ
2200, SLU - Civ 2200
Method
μ₁: mean of MST- Civ 2200
µ₂: mean of SLU - Civ 2200
Difference: μ₁ - µ₂
Equal variances are not assumed for this analysis.
Descriptive Statistics
Sample
N
Mean
StDev
SE
Mean
MST- Civ 2200 917 2.751 0.941 0.031
SLU - Civ 2200 32 3.313 0.78 0.14
Estimation for Difference
Difference
95% CI for
Difference
-0.561 (-0.848, -
0.274)
Test
Null hypothesis H₀: μ₁ - µ₂ =
0
Alternative hypothesis H₁: μ₁ - µ₂ ≠
0
T-Value
DF
P-
Value
-3.97 34 0
Table 57: The table shows the t-test results for SLU Calc I and Civ 2200

112
Two-Sample T-Test and CI: MST -
Physics 2, SLU - Physics 2
Method
μ₁: mean of MST - Physics 2
µ₂: mean of SLU - Physics 2
Difference: μ₁ - µ₂
Equal variances are not assumed for this analysis.
Descriptive Statistics
Sample
N
Mean
StDev
SE
Mean
MST - Physics 2 1442 2.784 0.943 0.025
SLU - Physics 2 42 3.333 0.754 0.12
Estimation for Difference
Difference
95% CI for
Difference
-0.549 (-0.789, -
0.309)
Test
Null hypothesis H₀: μ₁ - µ₂ =
0
Alternative hypothesis H₁: μ₁ - µ₂ ≠
0
T-Value
DF
P-
Value
-4.61 44 0
Table 58: The table shows the t-test results for SLU Calc I and Phys 2135

113
APPENDIX 10
University of Missouri – St. Louis T-test Data
Two-Sample T-Test and CI: MST - Civ
2210, UMSL- Civ 2210
Method
μ₁: mean of MST - Civ 2210
µ₂: mean of UMSL- Civ 2210
Difference: μ₁ - µ₂
Equal variances are not assumed for this analysis.
Descriptive Statistics
Sample
N
Mean
StDev
SE
Mean
MST - Civ 2210 779 2.83 1.05 0.038
UMSL- Civ 2210 22 2.73 1.03 0.22
Estimation for Difference
Difference
95% CI for
Difference
0.103 (-0.360,
0.566)
Test
Null hypothesis H₀: μ₁ - µ₂ =
0
Alternative hypothesis H₁: μ₁ - µ₂ ≠
0
T-Value
DF
P-
Value
0.46 22 0.648
Table 59: The table shows the t-test results for UMSL Calc I and Civ 2210

114
Two-Sample T-Test and CI: MST- Civ
2200, UMSL- Civ 2200
Method
μ₁: mean of MST- Civ 2200
µ₂: mean of UMSL- Civ 2200
Difference: μ₁ - µ₂
Equal variances are not assumed for this analysis.
Descriptive Statistics
Sample
N
Mean
StDev
SE
Mean
MST- Civ 2200 917 2.751 0.941 0.031
UMSL- Civ 2200 25 2.64 0.81 0.16
Estimation for Difference
Difference
95% CI for
Difference
0.111 (-0.229,
0.451)
Test
Null hypothesis H₀: μ₁ - µ₂ =
0
Alternative hypothesis H₁: μ₁ - µ₂ ≠
0
T-Value
DF
P-
Value
0.67 25 0.506
Table 60: The table shows the t-test results for UMSL Calc I and Civ 2200

115
Two-Sample T-Test and CI: MST -
Physics 2, UMSL - Physics 2
Method
μ₁: mean of MST - Physics 2
µ₂: mean of UMSL - Physics 2
Difference: μ₁ - µ₂
Equal variances are not assumed for this analysis.
Descriptive Statistics
Sample
N
Mean
StDev
SE
Mean
MST - Physics 2 1442 2.784 0.943 0.025
UMSL - Physics 2 38 3.158 0.754 0.12
Estimation for Difference
Difference
95% CI for
Difference
-0.374 (-0.626, -
0.121)
Test
Null hypothesis H₀: μ₁ - µ₂ =
0
Alternative hypothesis H₁: μ₁ - µ₂ ≠
0
T-Value
DF
P-
Value
-2.99 40 0.005
Table 61: The table shows the t-test results for UMSL Calc I and Phys 2135

116
APPENDIX 11
Jefferson College T-test Data
Two-Sample T-Test and CI: MST - Civ
2210, Jeff Col - Civ 2210
Method
μ₁: mean of MST - Civ 2210
µ₂: mean of Jeff Col - Civ 2210
Difference: μ₁ - µ₂
Equal variances are not assumed for this analysis.
Descriptive Statistics
Sample
N
Mean
StDev
SE
Mean
MST - Civ 2210 779 2.83 1.05 0.038
Jeff Col - Civ 2210 9 2.89 1.17 0.39
Estimation for Difference
Difference
95% CI for
Difference
-0.058 (-0.959,
0.843)
Test
Null hypothesis H₀: μ₁ - µ₂ =
0
Alternative hypothesis H₁: μ₁ - µ₂ ≠
0
T-Value
DF
P-
Value
-0.15 8 0.885
Table 62: The table shows the t-test results for JeffCo Calc I and Civ 2210

117
Two-Sample T-Test and CI: MST- Civ
2200, Jeff Col - Civ 2200
Method
μ₁: mean of MST- Civ 2200
µ₂: mean of Jeff Col - Civ 2200
Difference: μ₁ - µ₂
Equal variances are not assumed for this analysis.
Descriptive Statistics
Sample
N
Mean
StDev
SE
Mean
MST- Civ 2200 917 2.751 0.941 0.031
Jeff Col - Civ 2200 14 2.643 0.842 0.23
Estimation for Difference
Difference
95% CI for
Difference
0.109 (-0.382,
0.599)
Test
Null hypothesis H₀: μ₁ - µ₂ =
0
Alternative hypothesis H₁: μ₁ - µ₂ ≠
0
T-Value
DF
P-
Value
0.48 13 0.641
Table 63: The table shows the t-test results for JeffCo Calc I and Civ 2200
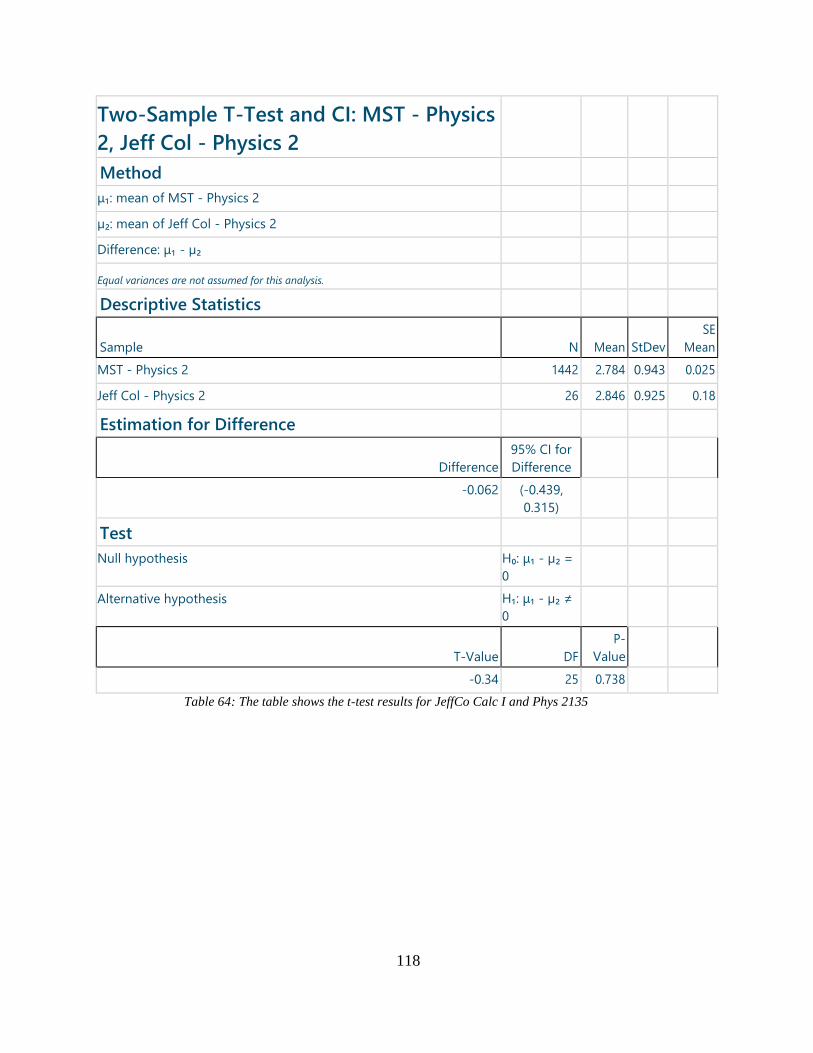
118
Two-Sample T-Test and CI: MST - Physics
2, Jeff Col - Physics 2
Method
μ₁: mean of MST - Physics 2
µ₂: mean of Jeff Col - Physics 2
Difference: μ₁ - µ₂
Equal variances are not assumed for this analysis.
Descriptive Statistics
Sample
N
Mean
StDev
SE
Mean
MST - Physics 2 1442 2.784 0.943 0.025
Jeff Col - Physics 2 26 2.846 0.925 0.18
Estimation for Difference
Difference
95% CI for
Difference
-0.062 (-0.439,
0.315)
Test
Null hypothesis H₀: μ₁ - µ₂ =
0
Alternative hypothesis H₁: μ₁ - µ₂ ≠
0
T-Value
DF
P-
Value
-0.34 25 0.738
Table 64: The table shows the t-test results for JeffCo Calc I and Phys 2135

119
APPENDIX 12
East Central College T-test Data
Two-Sample T-Test and CI: MST - Civ
2210, ECC - Civ 2210
Method
μ₁: mean of MST - Civ 2210
µ₂: mean of ECC - Civ 2210
Difference: μ₁ - µ₂
Equal variances are not assumed for this analysis.
Descriptive Statistics
Sample
N
Mean
StDev
SE
Mean
MST - Civ 2210 779 2.83 1.05 0.038
ECC - Civ 2210 25 2.56 1.36 0.27
Estimation for Difference
Difference
95% CI for
Difference
0.271 (-0.295,
0.836)
Test
Null hypothesis H₀: μ₁ - µ₂ =
0
Alternative hypothesis H₁: μ₁ - µ₂ ≠
0
T-Value
DF
P-
Value
0.99 24 0.333
Table 65: The table shows the t-test results for ECC Calc II and Civ 2210

120
Two-Sample T-Test and CI: MST - Civ
2200, ECC - Civ 2200
Method
μ₁: mean of MST - Civ 2200
µ₂: mean of ECC - Civ 2200
Difference: μ₁ - µ₂
Equal variances are not assumed for this analysis.
Descriptive Statistics
Sample
N
Mean
StDev
SE
Mean
MST - Civ 2200 810 2.786 0.934 0.033
ECC - Civ 2200 3 1.33 1.53 0.88
Estimation for Difference
Difference
95% CI for
Difference
1.453 (-2.344,
5.250)
Test
Null hypothesis H₀: μ₁ - µ₂ =
0
Alternative hypothesis H₁: μ₁ - µ₂ ≠
0
T-Value
DF
P-
Value
1.65 2 0.241
Table 66: The table shows the t-test results for ECC Calc II and Civ 2200

121
Two-Sample T-Test and CI: MST - Phy 2,
ECC - Phy 2
Method
μ₁: mean of MST - Phy 2
µ₂: mean of ECC - Phy 2
Difference: μ₁ - µ₂
Equal variances are not assumed for this analysis.
Descriptive Statistics
Sample
N
Mean
StDev
SE
Mean
MST - Phy 2 1297 2.8 0.951 0.026
ECC - Phy 2 12 2.417 0.793 0.23
Estimation for Difference
Difference
95% CI for
Difference
0.383 (-0.124,
0.890)
Test
Null hypothesis H₀: μ₁ - µ₂ = 0
Alternative hypothesis H₁: μ₁ - µ₂ ≠ 0
T-Value
DF
P-
Value
1.66 11 0.125
Table 67: The table shows the t-test results for ECC Calc II and Phys 2135

122
APPENDIX 13
Ozark Technical College T-test Data
Two-Sample T-Test and CI: MST - Civ
2210, OTC - Civ 2210
Method
μ₁: mean of MST - Civ 2210
µ₂: mean of OTC - Civ 2210
Difference: μ₁ - µ₂
Equal variances are not assumed for this analysis.
Descriptive Statistics
Sample
N
Mean
StDev
SE
Mean
MST - Civ 2210 779 2.83 1.05 0.038
OTC - Civ 2210 56 2.696 0.913 0.12
Estimation for Difference
Difference
95% CI for
Difference
0.134 (-0.121,
0.389)
Test
Null hypothesis H₀: μ₁ - µ₂ =
0
Alternative hypothesis H₁: μ₁ - µ₂ ≠
0
T-Value
DF
P-
Value
1.05 65 0.297
Table 68: The table shows the t-test results for OTC Calc II and Civ 2210

123
Two-Sample T-Test and CI: MST - Civ
2200, OTC - Civ 2200
Method
μ₁: mean of MST - Civ 2200
µ₂: mean of OTC - Civ 2200
Difference: μ₁ - µ₂
Equal variances are not assumed for this analysis.
Descriptive Statistics
Sample
N
Mean
StDev
SE
Mean
MST - Civ 2200 810 2.786 0.934 0.033
OTC - Civ 2200 12 2.417 0.793 0.23
Estimation for Difference
Difference
95% CI for
Difference
0.37 (-0.139,
0.879)
Test
Null hypothesis H₀: μ₁ - µ₂ =
0
Alternative hypothesis H₁: μ₁ - µ₂ ≠
0
T-Value
DF
P-
Value
1.6 11 0.138
Table 69: The table shows the t-test results for OTC Calc II and Civ 2200

124
Two-Sample T-Test and CI: MST - Phy 2,
OTC - Phy 2
Method
μ₁: mean of MST - Phy 2
µ₂: mean of OTC - Phy 2
Difference: μ₁ - µ₂
Equal variances are not assumed for this analysis.
Descriptive Statistics
Sample
N
Mean
StDev
SE
Mean
MST - Phy 2 1297 2.8 0.951 0.026
OTC - Phy 2 16 1.94 1.18 0.3
Estimation for Difference
Difference
95% CI for
Difference
0.862 (0.230,
1.494)
Test
Null hypothesis H₀: μ₁ - µ₂ =
0
Alternative hypothesis H₁: μ₁ - µ₂ ≠
0
T-Value
DF
P-
Value
2.91 15 0.011
Table 70: The table shows the t-test results for OTC Calc II and Phys 2135

125
APPENDIX 14
University of North Dakota – Main Campus T-test Data
Two-Sample T-Test and CI: MST - Civ
2210, North Dakota - Civ 2210
Method
μ₁: mean of MST - Civ 2210
µ₂: mean of North Dakota - Civ 2210
Difference: μ₁ - µ₂
Equal variances are not assumed for this analysis.
Descriptive Statistics
Sample
N
Mean
StDev
SE
Mean
MST - Civ 2210 779 2.83 1.05 0.038
North Dakota - Civ 2210 16 2.5 0.73 0.18
Estimation for Difference
Difference
95% CI for
Difference
0.331 (-0.065,
0.726)
Test
Null hypothesis H₀: μ₁ - µ₂ =
0
Alternative hypothesis H₁: μ₁ - µ₂ ≠
0
T-Value
DF
P-
Value
1.77 16 0.095
Table 71: The table shows the t-test results for UND Calc II and Civ 2210

126
Two-Sample T-Test and CI: MST - Civ
2200, North Dakota - Civ 2200
Method
μ₁: mean of MST - Civ 2200
µ₂: mean of North Dakota - Civ 2200
Difference: μ₁ - µ₂
Equal variances are not assumed for this analysis.
Descriptive Statistics
Sample
N
Mean
StDev
SE
Mean
MST - Civ 2200 810 2.786 0.934 0.033
North Dakota - Civ 2200 18 2.33 1.03 0.24
Estimation for Difference
Difference
95% CI for
Difference
0.453 (-0.063,
0.969)
Test
Null hypothesis H₀: μ₁ - µ₂ =
0
Alternative hypothesis H₁: μ₁ - µ₂ ≠
0
T-Value
DF
P-
Value
1.85 17 0.082
Table 72: The table shows the t-test results for UND Calc II and Civ 2200

Two-Sample T-Test and CI: MST - Phy 2,
North Dakota - Phy 2
Method
μ₁: mean of MST - Phy 2
µ₂: mean of North Dakota - Phy 2
Difference: μ₁ - µ₂
Equal variances are not assumed for this analysis.
Descriptive Statistics
Sample
N
Mean
StDev
SE
Mean
MST - Phy 2 1297 2.8 0.951 0.026
North Dakota - Phy 2 31 2.419 0.672 0.12
Estimation for Difference
Difference
95% CI for
Difference
0.38 (0.129,
0.632)
Test
Null hypothesis H₀: μ₁ - µ₂ =
0
Alternative hypothesis H₁: μ₁ - µ₂ ≠
0
T-Value
DF
P-
Value
3.08 32 0.004
Table 73: The table shows the t-test results for UND Calc II and Phys 2135

128

129
APPENDIX D
2018-2019 Meeting Minutes
Meeting Schedule
The Retention Committee meets every other Thursday, from 8:15-9:15 AM
in the Silver & Gold room of the Havener Center.
December 13, 2018
Winter Break
February 7, 2019
February 21, 2019
March 7, 2019
April 4, 2019
April 18, 2019
May 2, 2019
June 13, 2019
August 1, 2019
August 29, 2019
September 12, 2019
September 26, 2019
October 10, 2019
November 14, 2018-2019 Presentation to Chancellor Dehghani

130
December 13, 2018
8:15 am – 9:15 am
Havener Center, Silver & Gold Room
Members:
Those whose names are grayed out below were absent.
Tim Albers, Bridgette Betz, Jeff Cawlfield, Tyrone Davidson, Kate Drowne, John Easter, John Gallagher,
Eddie Grover-Bisker, Deanne Jackson, Kayla Klossner-Thompson, Douglas Ludlow, Rachel Morris, John
Myers, Adrienne Neckermann, Dorie Paine, Stephen Raper, Dan Reardon, Anitra Rivera, Paul Runnion,
Lynn Stichnote, Dave Westenberg, Klaus Woelk, Will Zwikelmaier
Ex Officio Members:
Those whose names are grayed out below were absent.
Joni Burch, Erica Long, Donna Luechtefeld, Robert Marley, Caprice Moore, Stephen Roberts, Katie
Tucker, Richard Wlezien
Guest:
Amy McMillen
I. Debrief Presentation to the Chancellor.
a. There was good conversation and positive feedback from the chancellor.
b. Will schedule two hours for the 2019 presentation if possible.
II. Subcommittees for the 2019 Presentation
a. Graduate Student Experience will continue. Adrienne Neckermann will chair.
b. First Year Experience ad hoc committee may continue work as a subcommittee. Chairperson
needed.
c. Student Intake subcommittee will continue with a focus on communications with admitted freshman
students. Tim Albers and Brooke Durbin will co-chair.
d. Time to Degree / Credit Hours to Graduation. Chairperson needed.
e. Transfer Student Experience will examine data gathered during the 2018 presentation cycle. Erica
Long will chair.
f. Under Represented Minority Students will continue. Chairperson needed,
III. Announcements
a. Dave Westenberg – An open forum on editing our evolution will be held at 6:30 pm tonight at the
Kaleidoscope Discovery Center. Everyone is welcome. Refreshments will be provided.
b. Dave Westenberg – The microbiology lunch will be held today at noon in 110 Schrenk Hall.
c. Tim Albers – The Advising Council approved last year will begin soon. Tim will work with Provost
Marley to determine membership. Those selected will be notified via email.
d. Jeff Cawlfield – Commencement is this Saturday.
IV. Next Meeting (Subcommittee Work Session) – January 24, 2019
8:15 am – 9:15 am, Carver Turner Room, Havener Center
Missouri S&T Student Success Committee Meeting MINUTES

131
Missouri S&T Student Success Committee Meeting MINUTES
January 24, 2019
8:15 am – 9:15 am
Havener Center, Carver Turner Room
Members:
Those whose names are grayed out below were absent.
Tim Albers, Bridgette Betz, Jeff Cawlfield, Tyrone Davidson, Kate Drowne, Brooke Durbin, John
Easter, Patti Fleck, John Gallagher, Eddie Grover-Bisker, Deanne Jackson, Kayla Klossner-Thompson,
Douglas Ludlow, Rachel Morris, John Myers, Adrienne Neckermann, Dorie Paine, Stephen Raper, Dan
Reardon, Anitra Rivera, Paul Runnion, Lynn Stichnote, Dave Westenberg, Klaus Woelk, Will
Zwikelmaier
Ex Officio Members:
Those whose names are grayed out below were absent.
Joni Burch, Erica Long, Donna Luechtefeld, Robert Marley, Caprice Moore, Stephen Roberts, Katie
Tucker, Richard Wlezien
Guest:
Amy McMillen
V. Review and Approval of Minutes
a. Minutes were approved.
VI. Announcements
a. Jeff Cawlfield – Submit nominations to fill student seat vacated by Alex Cristea.
b. Jeff Cawlfield – Career Fair is February 19.
c. Patti Fleck – Counseling Services is piloting walk-in hours this semester on Monday, Wednesday, and
Friday from 10 am-11 am and on Tuesday and Thursday from 2 pm-3pm.
d. Lynn Stichnote – The Open House on February 18 overlaps with Show Me S&T, an event for out of
state students. We will also host students from the Atlanta University Center, a consortium dual
degree engineering program with Morehouse, Spellman, and Clark Atlanta.
e. John Myers – Engineers Week begins February 18. Activities will include a guest speaker each day.
f. Adrienne Neckermann – Three Minute Thesis registration closes the end of the week.
Presentations will be given to non-specialist audiences. The final competition is open to the public
and will be held Thursday, February 7, at 4 pm in the Carver Turner Room.
g. John Gallagher – Student Body President elections are coming soon. Prior student government
experience is not required. Candidates must have 45 credit hours and a 2.75 cumulative GPA.
h. Will Zwikelmaier – Skip the Line is a new feature at Career Fair. Students can apply on line to gain
access to a secret entrance and bypass the check-in process.
i. Tyrone Davidson – The restructuring and merger of Undergraduate Advising and Freshman
Engineering Program is underway. The new name is S&T Advising Center.
j. Anitra Rivera – Dinner to Jazz is scheduled for February 23.
k. Kayla Klossner-Thompson – The first PRO Day is February 23. The first three PRO dates are full.

132
VII. Finalize Subcommittees and Chairs for the 2019 Presentation
a. Graduate Student Experience. Adrienne Neckermann will chair.
b. First Year Experience will not continue work as a subcommittee this presentation cycle.
c. Student Intake subcommittee. Tim Albers and Brooke Durbin will co-chair.
d. Time to Degree / Credit Hours to Graduation. Steve Raper will chair.
e. Transfer Student Experience. Erica Long will chair.
f. Under Represented Minority Students. Rachel Morris will chair.
VIII. Subcommittee Report Out – Focus for 2019 Presentation Cycle
a. Graduate Student Experience – Adrienne Neckermann.
i. Complete and post advisor-advisee expectation documents.
ii. Contact PhD students who have dropped to learn more about their reasons.
iii. Training for new members of the Graduate Studies team for enrollment data, time to degree
data.
b. Student Intake subcommittee – Tim Albers.
i. Collect communications from all units on campus sent to freshmen from time of admission to
enrollment.
ii. Evaluate communications for timeliness and appropriate messaging consistent with university
branding standards.
c. Time to Degree / Credit Hours to Graduation – Steve Raper.
i. We desire a new 5-year (last 5 academic years (FS 17-18 then back 4 more)) data set and
possibly see if we can add first generation info to that.
ii. Seek to have degree programs review degree audit (DARS) information as it provides much
richer and meaningful data to add to the numbers.
iii. Possible small focus groups of current graduating seniors asking why it took “X” long to
graduate.
iv. Alumni survey was discussed, also to get answers to the above question.
d. Transfer Student Experience – Erica Long.
i. Focus on transfer students who are placed on academic probation or have a deficiency.
ii. Focus on students who leave the university before graduating.
e. Under Represented Minority Students – Rachel Morris.
i. Conduct focus groups within the URM community.
ii. Hold meetings, send questions, conduct surveys.
IX. Next Meeting – February 7, 2019
8:15 am – 9:15 am, Silver and Gold Room, Havener Center

133
February 7, 2019
8:15 am – 9:15 am
Havener Center, Carver Turner Room
Members:
Those whose names are grayed out below were absent.
Tim Albers, Bridgette Betz, Jeff Cawlfield, Tyrone Davidson, Kate Drowne, Brooke Durbin, John
Easter, Patti Fleck, John Gallagher, Eddie Grover-Bisker, Deanne Jackson, Kayla Klossner-Thompson,
Douglas Ludlow, Rachel Morris, John Myers, Adrienne Neckermann, Dorie Paine, Stephen Raper, Dan
Reardon, Anitra Rivera, Paul Runnion, Lynn Stichnote, Dave Westenberg, Klaus Woelk, Lauren
Hatfield for Will Zwikelmaier
Ex Officio Members:
Those whose names are grayed out below were absent.
Joni Burch, Erica Long, Donna Luechtefeld, Robert Marley, Caprice Moore, Stephen Roberts, Katie
Tucker, Richard Wlezien
Guest:
Becky Boggs, Amy McMillen
X. Review and Approval of Minutes
a. Minutes were approved.
XI. Student Panel
a. Jeff Cawlfield – Seeking nominations for the annual Student Panel on March 7. Send nominations to
Donna Luechtefeld.
XII. Announcements
a. Lynn Stichnote – The Open House on February 18 overlaps with Show Me S&T, an event for out of
state students. We will also host students from the Atlanta University Center, a consortium dual
degree engineering program with Morehouse, Spellman, and Clark Atlanta.
b. Tyrone Davidson – S&T is hosting the next Academic Advisor Summit on March 15. Details are
nearly final. Registration will open soon.
c. Tyrone Davidson – Krista Morris-Lehman and Barb Prewitt will present at the Academic Advising
Conference on February 11. The topic is comprehensive care.
d. John Gallagher – Miner Challenge is holding a pancake breakfast fundraiser on February 16 at the
First United Methodist Church from 10 am- 2 pm. Proceeds will support the Alternative Break
Program.
e. Tim Albers – SEM Works consultants will be on campus February 13-15 to begin a comprehensive
review of recruitment efforts of undergraduate, graduate, and online students. First
recommendations are expected early summer.
XIII. Registration and Financial Aid 101
a. Becky Boggs and Katie Tucker presented information about registration and student financial
assistance processes and regulations and how changes in registration can affect financial aid eligibility.
Missouri S&T Student Success Committee Meeting MINUTES

134
XIV. Subcommittee Updates - None
a. Graduate Student Experience.
b. Student Intake subcommittee.
c. Time to Degree / Credit Hours to Graduation.
d. Transfer Student Experience.
e. Under Represented Minority Students.
XV. Next Meeting – February 21, 2019
8:15 am – 9:15 am, Silver and Gold Room, Havener Center

135
February 21, 2019
8:15 am – 9:15 am
Havener Center, Carver Turner Room
Members:
Those whose names are grayed out below were absent.
Tim Albers, Bridgette Betz, Jeff Cawlfield, Tyrone Davidson, Kate Drowne, Brooke Durbin, John
Easter, Patti Fleck, John Gallagher, Eddie Grover-Bisker, Deanne Jackson, Kayla Klossner-Thompson,
Douglas Ludlow, Rachel Morris, John Myers, Adrienne Neckermann, Dorie Paine, Stephen Raper, Dan
Reardon, Anitra Rivera, Paul Runnion, Lynn Stichnote, Dave Westenberg, Klaus Woelk, Lauren
Hatfield for Will Zwikelmaier
Ex Officio Members:
Those whose names are grayed out below were absent.
Joni Burch, Erica Long, Donna Luechtefeld, Robert Marley, Caprice Moore, Stephen Roberts, Katie
Tucker, Richard Wlezien
Guest:
Amy McMillen
XVI. Review and Approval of Minutes
a. Minutes were approved.
XVII. Student Representatives
a. Jeff Cawlfield introduced new student members Quentin Lee and Julia Morgan.
XVIII. Enrollment Update – Tim Albers
a. Enrollment for spring semester is down 3% overall.
b. Fall-to-spring freshman retention rate is 92.3%.
c. Highly dependent on in-state for enrollment; however, in-state demographics are shrinking.
d. In-state Hispanic population growing faster than other populations.
e. Budget limits out-of-state recruitment.
f. 34-40% of out-of-state students become Missouri residents within two-three years. This creates a
revenue issue.
g. Spring enrollment of international students is down 4-5% nationally.
XIX. Subcommittee Updates Subcommittee Updates
a. Graduate Student Experience.
b. Student Intake subcommittee.
c. Time to Degree / Credit Hours to Graduation – Steve Raper
i. Accessed seven years of data via Jerry Hammons’ files.
ii. Manually mined degree audits for 48 students.
iii. Received good response rate to student survey.
1. Eleven students graduated in four years. Attribute to personal motivation.
Missouri S&T Student Success Committee Meeting MINUTES
136
2. Most students had dual enrollment, AP courses, or summer courses.
3. Some students took co-op or internships and classes at the same time.
4. Students who graduated in five-seven years usually experienced some sort of difficulty.
5. Students who graduated in more than seven years usually had one or more stop-outs.
d. Transfer Student Experience – Katie Tucker
i. Retention data has been compiled for review.
e. Under Represented Minority Students – Rachel Morris
i. Gathering a list of students to form a cohort to survey.
XX. Announcements
a. Will Zwikelmaier – Career Fair was a success. Attendance was down approximately 10%.
Employers are still on campus conducting interviews.
b. Jeff Cawlfield – The Student Panel will be held March 7.
c. Kayla Klossner-Thompson – The first PRO will be held Saturday. 170 students expected.
d. Kayla Klossner-Thompson – Family Guide Books are available at pro.mst.edu
e. Dave Westenberg – Biological Sciences will host a public exhibit March 1-17 at the Centre show
casing the 1918 Spanish Flu outbreak.
f. Adrienne Neckermann – Faculty judges are need for a poster session that will be held in the rotunda
February 24-25.
g. Eddie Grover-Bisker – Applications are open for commencement student speakers. Please
encourage students to apply.
h. Anitra Rivera – Black History Celebration will be held on Friday. Dinner to Jazz, CAC AARR
meeting and a PCI event will be held Saturday.
i. Tyrone Davidson – S&T is hosting the next Academic Advisor Summit on March 15. Registration is
open.
j. Tim Albers – Junior Science and Humanities Symposium (JSHS) will be held next week at Havener.
k. Lynn Stichnote – The Open House on February 18 overlaps with Show Me S&T, an event for out of
state students. We will also host students from the Atlanta University Center, a consortium dual
degree engineering program with Morehouse, Spellman, and Clark Atlanta.
l. Patti Fleck – Next week is Mental Health Awareness Week. Counseling will offer “checkups from
the neck up.”
XXI. Next Meeting – March 7, 2019 – Student Panel
8:15 am – 9:45 am, Carver Turner Room, Havener Center

137
March 7, 2019
8:15 am – 9:15 am
Havener Center, Carver Turner Room
Members:
Those whose names are grayed out below were absent.
Tim Albers, Bridgette Betz, Jeff Cawlfield, Tyrone Davidson, Kate Drowne, Brooke Durbin, John
Easter, Patti Fleck, John Gallagher, Eddie Grover-Bisker, Deanne Jackson, Kayla Klossner-Thompson,
Douglas Ludlow, Julia Morgan, Rachel Morris, John Myers, Adrienne Neckermann, Dorie Paine,
Stephen Raper, Dan Reardon, Anitra Rivera, Paul Runnion, Lynn Stichnote, Dave Westenberg, Klaus
Woelk, Lauren Hatfield for Will Zwikelmaier
Ex Officio Members:
Those whose names are grayed out below were absent.
Joni Burch, Erica Long, Donna Luechtefeld, Robert Marley, Caprice Moore, Stephen Roberts, Katie
Tucker, Richard Wlezien
Guest:
Amy McMillen
XXII. Review and Approval of Minutes
a. Minutes were approved.
XXIII. Student Panel
a. Six students attended the student panel and answered questions asked by committee members.
Students will be referred to by their initials.
i. BB – Junior in English literature, transfer student, and works in Office of Vice Chancellor of
Research.
ii. AK – Senior in Engineering Management, minor in psychology. Member of Delta Sigma Phi and
Innovation Class through ICOR, Opening Week mentor.
iii. JM – Junior in IST/Business, minor in Computer Science, transfer student. TA for Dr. Bates.
iv. KK – Junior in chemical engineering and engineering management. Resident assistant last year
and PRA this year. Student council vice president, running for president.
v. AN – Junior in IST. PRO leader.
vi. AS – Majoring in IST and technical communication, participates in track and field, student
ambassador, and member of Chi Omega.
vii. JW – Majoring in chemical engineering, senior resident assistant, and track tream.
b. Tim Albers – What is your experience with COER?
i. AK – I accepted a position with Microsoft through LinkedIn, not on-campus events. I went to
COER only my freshmen year, and they assisted me with my resume and some interview
questions. I went to career fair each semester.
c. Tim Albers – Have you done co-ops?
Missouri S&T Student Success Committee Meeting MINUTES

138
i. JW – I obtained a co-op at Exxon Mobil through NSBE. I used COER.
d. Steve Raper – There is a focus on increasing the four-six year graduation rate. How long do you
plan to take to graduate and what factors affect that?
i. AK – It is a mental construct. I always thought of college as a four-year experience. I never
thought about extending beyond four years. I planned my entire four years my first semester. I
had credit coming in. There was no reason to justify extending, even for another minor.
ii. JM – I started school and then went in the military. Now I am a transfer student. Some credits
transferred and some did not. I expect to graduate in the five-year range. I do not feel
pressured to rush.
iii. BB – I attended community college for a time. I went a few semesters before attending full time.
I changed majors from computer science to English literature.
iv. AN – I changed majors from computer science to IST. I will graduate in 4 ½ years. I could
graduate in 4 years if I took 18 hours/semester.
v. AK – I heard of people extending an additional semester to get one more internship or co-op.
vi. JW – I’m considering extending to five years to get another co-op or internship.
vii. KK – I will finish in 5 ½ years. I have a double major and I have done a co-op.
e. Lynn Stichnote – Do you have financial concerns about extending your time to graduation?
i. JW – I have friends who want to go on co-op but would have to drop a sport. Scholarships
come into play, also.
ii. AN – Earnings from an internship will help with expenses. Will offset the need for a loan.
iii. KK – I am lucky. I received scholarships through my high school, S&T, and private applications.
My dad received a promotion and will be able to help me more.
iv. AS – Taking loans doesn’t make me particularly nervous because I will be able to repay them.
v. BB – Paid internships for English majors are not abundant. I enjoy my current student job on
campus working on the department website, newsletters, etc, but it is not what I want to do the
rest of my life.
f. Tyrone Davidson – If you are a CASB major, do you feel a sense of belonging among your peers?
i. AN – Sometimes people say, “Oh, well, you’re not an engineer,” but this doesn’t happen often.
ii. BB – Someone wanted to start an art club, and the response was, “Oh, you’re at an engineering
school.” Having an interest in art doesn’t mean quantitative science has to be pushed aside.
g. Caprice Moore – What was your introduction to Missouri S&T?
i. AS – My brother played football for S&T.
ii. AK – My brother and dad both attended S&T. I toured, saw the resources, and I received the
Chancellor’s Scholarship, which is amazing. I saw this school as an investment.
iii. JW – I came from Texas to run track. I was super hesitant and didn’t really like it, but my mom
pushed me. Now I love it! I was determined to meet people, so I joined organizations, took
leadership positions, and got involved to meet people.
iv. BB – I lived in Philadelphia and attended online community college. I have family in Springfield,
MO and looked at MSU. Coming to Rolla from a big city was a huge adjustment. I did not enjoy
my first semester as a computer science major, and I was dubious of an English department on
an engineering campus. The English faculty are great.
v. JM – I lived in Waynesville, and wanted a four-year degree. S&T is the only college in the area
that offers that degree.
h. Deanne Jackson – What kind of roadblocks have you encountered?
139
i. AK – A friend and I wanted to participate in a study abroad program not offered through S&T.
We wanted to go to Italy and do something non-engineering to augment the humanities. I was
going to blow glass, and my friend was going to sketch. We were told that if we leave we would
have to forfeit our scholarship and reapply for admission. If S&T wants to be a high caliber
institution, they must be more supportive of these types of opportunities. I got a position at
Microsoft because of my psychology minor, which has helped me develop an ability to read
people.
ii. AN – Some people think you just have to be smart. They don’t appreciate the need to be well-
rounded.
i. Donna Luechtefeld – I recently spoke to an alum who was in his late 70s who was on campus for a
fraternity event. He told me a story about “weed out courses” during his time as a student here.
Do these types of comments and stories from alums, fraternity members, friends, and relatives make
an impression on you?
i. Panel members chuckled and murmured, yes, a lot.
ii. JW – There is a stigma about the difficulty, but that motivated me to get lots of help.
iii. AN – Some see it as a challenge. Others back off. I was personally scared to change majors, but
found it to be easy. The IST professors are very helpful. The idea of “weed out classes” could
be mitigated by promoting options and other majors. Students aren’t stuck in one major.
iv. KK – Fear is one impact, but worse is not knowing where you are going to end up. This is
where career development/advising and identifying your skills can help build confidence.
v. AS – Many students who were at the top of their high school class are average here. Students
need to learn how to reach out to others.
vi. AK – I learned how to form a study group and work hard. The level of discipline required here
is unique. Students need to develop discipline.
vii. BB – I wonder what it says about the campus culture when fear is such a big motivator
compared to curiosity and passion for learning.
j. Amy McMillen – Would it be beneficial for your advisor to reach out to you after your PRO day and
before you arrive for Opening Week?
i. KK – Yes, it would show you care.
ii. AS – For example, JW came not knowing anyone and made a conscious effort to meet people.
It would especially help students whom are not go-getters make that first connection.
k. Amy McMillen – What is the best way to contact you?
i. AN – Email is hard because the school account may not be set up yet. Letters home are
probably good. I would have liked someone to reach out before I arrived because I was not sure
what I wanted and didn’t know what options I had.
l. Lynn Stichnote – What are some barriers and issues for those not academically successful?
i. AS – Some students are afraid to talk to employers during career fair. Interaction with other
students can be a real struggle.
ii. KK – An activity during PRO day where failure is a likely outcome to help students learn
when/how to seek help.
iii. AN – My roommate dropped out of school. I think the financial and social struggles were too
much. I think she just felt lost. It is hard to reach out to these students because it is hard to
identify them. Maybe a resource that says, “If you don’t know what’s wrong, go here” would
help.

140
iv. BB – Counseling Services was helpful when I changed majors, but the stigma around counseling
prevents many people from seeking assistance.
v. BB – Most classes require internet to access reading material and assignments, but many
students don’t have a laptop.
vi. AS – Students could go to a CLC, but that is not convenient.
vii. JW – Students need to engage early on. I took some sort of personality test in one my English
classes. It came with a booklet that told me what I am good at (Strong Campbell?). I thought
that was really useful.
m. Kayla Klossner-Thompson – What changes or additions would you make to Opening Week?
i. AN – I don’t like personality tests because they put you in a box, but I would like a test that
shows my learning style and study style.
ii. BB – Teach students how to learn. There was so much memorization in high school.
iii. JW – O-week was about making friends. Maybe a deeper connection with your advisor earlier
on would be helpful.
iv. KK – Making connections is important during O-week.
v. JW – The Student Diversity Scholarship class was a blow-off. It could be really effective if they
were serious about it. Focus on psychology, study/learning styles, and soft skills.
n. Erica Long – What is the best way to deliver the right kind of programs and services at the right
time to the students who need them? How do we find these students?
i. AN – Talk to students like us because we have better luck of finding them. Reach out to your
regular attendees at meetings and semi-incentivize with things like “bring a friend in order to
enter a raffle.”
ii. BB – Email fatigue is a factor. Counter that with students reaching out to other students. There
must be an element of camaraderie – things are not well received if perceived to be pushed
down from administration.
iii. AK – Students don’t attend things when it seems like the same 50 students run everything. I
often just chat with Dr. Raper in his office. Need to trick students into being counseled. If it
seems official, sometimes it is just awkward. I call the professors I like to talk to “bro-fessors.”
Student who are doing well and enjoy their experience can name their professors. Students
who are struggling often don’t know their professors’ names.
iv. JW – Maybe have an industry-type focus. When I was on co-op, I had a mentor/guide from day
one.
o. Kayla Klossner-Thompson – As a non-traditional student, what was your experience like with
support systems?
i. JM – There are different services available to non-traditional, former-military students. I don’t
pay a lot of attention to the traditional student stuff.
p. Tyrone Davidson – Describe your experience with advising.
i. JM – The Diversity House is a welcoming place. Many students come there from different
backgrounds including poverty and first generation, but I see a lot of programs for minority
students.
ii. JW – I hesitated about coming to S&T because I didn’t see people who look like me. That’s why
I joined lots of organizations. My sophomore year it was really about academic support,
boosting morale and comradery among URMs. I think it is better, but I want to create/continue

141
that legacy. My freshman year, there were no upper classmen to guide us, mentor us, or
represent us. I see progress and appreciate the efforts of others.
iii. AS – I had the same advisor as my brother. He was more helpful for my brother than for me.
He always asks me, “Are you sure? You can think about this.” I am sure. I know what I want.
iv. AK – I emailed Dr. Raper that I wanted to switch from chemical engineering to engineering
management. In twelve minutes Dr. Raper ran my degree audit and told me which courses
would transfer/count for engineering management. He cut through the red tape.
v. AK – I heard that people think engineers can’t communicate, so I joined Toastmasters. Some
students need to understand that college is not just about getting a job. It is helpful if the advisor
can help identify what skills you have and what kind of work you want to do. We need to be
able to articulate that to employers. Some students cannot connect the dots.
q. Katie Tucker – How do we find or reach students who need help identifying their own skill set or
developing professional skills such as public speaking or joining Toastmasters?
i. AN – Students are required to visit their advisor, so we could ask them to take on a more
comprehensive role. They could ask about non-academic aspects of a student’s life.
ii. AS – Help people realize that it takes time to develop skills.
iii. AK – Still, the best way to reach students is through other students.
r. Katie Tucker – Is there an undue burden placed on students if we rely on them to help us reach
other students?
i. JW – I can make the leadership role authentic, let students know I’ve been there, struggled, and
sought assistance.
ii. AS – Perhaps if more students learned more soft skills, they could help other students connect
and reach out to each other earlier on.
iii. AK – I don’t think it is a burden. Sometimes I feel guilty that I made it but I’m not sure I know
how to help others.
XXIV. Announcements
a. John Gallagher – Miner Challenge will host a Trivia Night fundraiser on March 8.
b. Brooke Durbin – FIRST Robotics competition will be held Saturday at Gale Bullman Student
Recreation Center.
XXV. Next Meeting – April 4, 2019
8:15 am – 9:15 am, Silver and Gold Room, Havener Center

142
April 4, 2019
8:15 am – 9:15 am
Havener Center, Silver and Gold Room
Members:
Those whose names are grayed out below were absent.
Tim Albers, Bridgette Betz, Jeff Cawlfield, Tyrone Davidson, Kate Drowne, Brooke Durbin, John
Easter, Patti Fleck, John Gallagher, Eddie Grover-Bisker, Deanne Jackson, Kayla Klossner-Thompson,
Douglas Ludlow, Rachel Morris, John Myers, Julia Morgan, Adrienne Neckermann, Dorie Paine,
Stephen Raper, Dan Reardon, Anitra Rivera, Paul Runnion, Lynn Stichnote, Dave Westenberg, Klaus
Woelk, Will Zwikelmaier
Ex Officio Members:
Those whose names are grayed out below were absent.
Joni Burch, Erica Long, Donna Luechtefeld, Robert Marley, Caprice Moore, Stephen Roberts, Katie
Tucker, Richard Wlezien
Guest:
Amy McMillen
XXVI. Review and Approval of Minutes
a. Minutes were approved.
XXVII. Debrief Student Panel – Comments and Suggestions to Improve Future Panels.
a. Katie Tucker – Would like to hear more from students who are struggling.
b. Lynn Stichnote – Perhaps we could invite only students who are struggling.
c. Kayla Klossner-Thompson – Release the questions prior to the event so the students would have
time to prepare.
d. Tim Albers – We may need to guide questions in a particular direction.
e. Donna Luechtefeld – We could focus the questions on the subcommittee topics.
f. Dan Reardon – Prepared questions are a good idea. It may be difficult to reach struggling students.
It seems like we already know the answers to the questions we ask.
g. Donna Luechtefeld – Consider if there is a better time of year to hold the student panel.
h. Donna Luechtefeld – Consider other room arrangements that may feel less intimidating. For
example, circle seating without tables or a closed square instead of a separate table for the panel.
i. Donna Luechtefeld – Consider seating the student committee members with the student panel.
j. John Gallagher – Consider holding panel discussions within each subcommittee as opposed to one
panel in front of the entire committee.
k. Dan Reardon – Seek nominations through departments.
l. Dorie Paine – We need to decide in advance what we want to know, what information we want to
gather from the students.
Missouri S&T Student Success Committee Meeting MINUTES

143
m. Unknown – Consider rephrasing the questions to move the focus from the student panel member
to a friend or someone they know.
n. Unknown – Consider rephrasing the questions to shift the focus to S&T. For example, how well
does S&T deliver a particular service?
XXVIII. SEM Works Overview
a. Tim Albers gave an overview of the SEM Works recruitment and enrollment analysis currently in
progress.
b. Four strategic opportunities were identified and teams were formed with representation from a
variety of units campus-wide.
i. Slate Lead Generation. Brooke Durbin is the team lead.
ii. Website Enhancement. Cheryl McKay is the team lead.
iii. Diversified Enrollment Porfolio. Bill Elliott is the team lead.
iv. Performance Management. Lynn Stichnote is the team lead.
XXIX. Committee Timeline – Donna Luechtefeld
a. Summer meeting dates are set for June 13, July 11, and August 1.
b. Regular semester meetings resume August 29.
XXX. Subcommittee Updates Subcommittee Updates
a. Graduate Student Experience – No update.
b. Student Intake subcommittee – No update.
c. Time to Degree / Credit Hours to Graduation – Steve Raper
i. IT will calculate data on degree audits.
ii. Will ask CEC and CASB deans to contact graduating students about how they completed their
degree in four years.
iii. Conducting literature search for strategies, etc, but have not found anything we are not
currently doing.
d. Transfer Student Experience – No update.
e. Under Represented Minority Students – Bridgette Betz
i. Subcommittee has a list of 500 students. Plan to send a short survey and invitation to a focus
group before the end of the semester.
ii. Subcommittee has a list of students not currently enrolled. Plan to contact them for information
about their experience.
XXXI. Announcements
a. Quentin Lee – S&T took fourth place in disc golf championships.
b. Tim Albers – 125 students are registered for Open House on Friday.
c. Dan Reardon – There are still tickets available for Newsies. There are three more performances.
d. Lynn Stichnote – There will not be an Open House on Good Friday this year.
XXXII. Next Meeting – April 18, 2019
8:15 am – 9:15 am, Silver and Gold Room, Havener Center

144
April 18, 2019
8:15 am – 9:15 am
Havener Center, Silver and Gold Room
Members:
Those whose names are grayed out below were absent.
Tim Albers, Bridgette Betz, Jeff Cawlfield, Tyrone Davidson, Kate Drowne, Brooke Durbin, John
Easter, Patti Fleck, John Gallagher, Eddie Grover-Bisker, Deanne Jackson, Mike Pleimann for Kayla
Klossner-Thompson, Douglas Ludlow, Rachel Morris, John Myers, Julia Morgan, Adrienne Neckermann,
Dorie Paine, Stephen Raper, Dan Reardon, Anitra Rivera, Paul Runnion, Lynn Stichnote, Dave
Westenberg, Klaus Woelk, Lauren Hatfield for Will Zwikelmaier
Ex Officio Members:
Those whose names are grayed out below were absent.
Joni Burch, Erica Long, Donna Luechtefeld, Robert Marley, Caprice Moore, Stephen Roberts, Katie
Tucker, Richard Wlezien
Guest:
Amy McMillen
XXXIII. Review and Approval of Minutes
a. Approval of April 4 Minutes Postponed to May 2.
XXXIV. Debrief HLC Meeting.
a. Jeff Cawlfield attended sessions on student success.
i. Annie McKee gave the keynote address. She spoke about happiness and what makes staff and
students happy at work and school. First generation students are particularly susceptible to
happiness traps.
ii. Military veterans and dependents have special issues.
iii. Provost at IUPUI presented data on first to second year retention.
1. Controlling for all other factors, students employed on campus experience a 7% increase in
retention.
2. Students with unmet financial need often decline subsidized student loans and take jobs off
campus instead, especially first generation students, whose families are afraid of loans and
debt.
b. Caprice Moore attended sessions on distance learning, recruitment, instruction, and evaluation.
i. Students want to connect with their instructors, and this connection is a main avenue of student
success.
ii. The admissions scandal at USC impacts higher education in general in that it provides an
opportunity for all institutions to review their practices.
iii. Economic and political impact of transitions in higher education.
1. Are free tuition models sustainable?
Missouri S&T Student Success Committee Meeting MINUTES

145
2. Greater numbers of students are taking advantage of trade schools and certificate
programs.
XXXV. Housing Update
a. Dorie Paine reviewed changes to housing requirements policy.
i. Student must complete 60 hours post high school graduation to be exempt from the residency
requirement. The former policy stated 60 hours of college coursework, which could have
included hours completed prior to high school graduation.
ii. The number of hours to qualify for an academic exception has increased from 30 to 32 hours of
full-time academic work over two consecutive semesters. The criteria are set to accommodate
exemplary students, and are intended to be an exception.
iii. Quentin Lee expressed concern that the academic exception requirements are nearly impossible
to achieve thereby creating a financial hardship for students.
iv. Klaus Woelk – The two-year requirement is intended to ensure students get connected and
engaged.
v. Amy McMillen – Are students grandfathered in under the old policy?
vi. Dorie Paine – Students may be grandfathered in on a case-by-case basis.
vii. Klaus Woelk – Does research support the benefits of on-campus housing?
viii. Dorie Paine – There is very strong research to support first year residency requirements both at
S&T and nationally.
ix. Jeff Cawlfield – Students were on the committee to review and revise the campus housing
requirements.
x. Julia Morgan – Expressed concern that committee members were brushing over or dismissing
the comments.
xi. John Myers – Policies are created with students’ best interest in mind.
XXXVI. Opening Week 2019 Update – Mike Pleimann
a. Academic workshops sessions will begin Monday morning. This will allow for better processing of
test results, and should improve the student experience.
b. A national speaker has been invited to augment the Miner Values program that will be presented
Monday afternoon.
c. Math study sessions will be hosted by LEAD will be held at various locations across campus.
XXXVII. Subcommittee Updates Subcommittee Updates
a. Graduate Student Experience – Steve Raper
i. Met with IT staff.
ii. Reports are nearly complete.
b. Student Intake subcommittee – Tim Albers
i. This committee has suspended their work due to duplication of efforts with the SEM Works
project. There will be no report for the 2019 Presentation to the Chancellor.
c. Time to Degree / Credit Hours to Graduation – No update.
d. Transfer Student Experience – Erica Long
i. Data has been collected and is ready for subcommittee review.
e. Under Represented Minority Students – Rachel Morris
i. Developed survey questions to focus on factors of student success.
ii. Will send survey before end of semester.
iii. Plan to hold focus group at the beginning of the fall semester.

146
XXXVIII. Announcements
a. Lynn Stichnote – Distributed a schedule of Special Events and Open House dates for 2019-2010.
b. Lynn Stichnote – Provost Marley approved a one-year contract with Platform Q to help Admissions
develop and produce live webcasts. Other campus groups may also use this service to create
webcasts for their events.
c. Jeff Cawlfield – There will be three commencement ceremonies in May.
d. Tim Albers – There are 125 students registered for Discover Day tomorrow.
e. Jeff Cawlfield – Transfer Advising Day is today.
f. Deanne Jackson – Fall registration is down 3% overall. Summer registration is up 0.7%.
g. Deanne Jackson – The civics exam will be required for new freshmen and transfer students with the
Fall 2019 catalog year. Students may complete the exam through Canvas after July 1.
h. Deanne Jackson – The waitlist process has change and will be fully automated. Students will be
skipped if a waitlisted class does not fit their schedule, but will remain on the waitlist. Students will
be notified electronically that some action is required.
i. Julia Morgan – How will students be notified of the change in process? Will this be published
somewhere?
j. Deanne Jackson – The Student Council president will distribute information and the information on
the website will be updated.
XXXIX. Next Meeting – May 2, 2019
8:15 am – 9:15 am, Silver and Gold Room, Havener Center

147
May 2, 2019
8:15 am – 9:15 am
Havener Center, Silver and Gold Room
Members:
Those whose names are grayed out below were absent.
Tim Albers, Bridgette Betz, Jeff Cawlfield, Tyrone Davidson, Kate Drowne, Brooke Durbin, John
Easter, Patti Fleck, John Gallagher, Eddie Grover-Bisker, Deanne Jackson, Kayla Klossner-Thompson,
Douglas Ludlow, Rachel Morris, John Myers, Julia Morgan, Adrienne Neckermann, Dorie Paine,
Stephen Raper, Dan Reardon, Anitra Rivera, Paul Runnion, Lynn Stichnote, Dave Westenberg, Klaus
Woelk, Will Zwikelmaier
Ex Officio Members: Those whose names are grayed out below were absent.
Joni Burch, Erica Long, Donna Luechtefeld, Robert Marley, Caprice Moore, Stephen Roberts, Katie
Tucker, Richard Wlezien
Guest:
Amy McMillen
XL. Review and Approval of Minutes
a. April 4 and April 18 minutes were approved.
XLI. FYRE Showcase
a. Committee members visited the First Year Research Experience showcase in the Havener Atrium.
XLII. Subcommittee Updates Subcommittee Updates
a. Graduate Student Experience – Adrienne Neckermann
i. Subcommittee is reviewing materials.
b. Student Intake subcommittee – Suspended for 2019 presentation cycle.
c. Time to Degree / Credit Hours to Graduation – Steve Raper
i. Received replicates of files from last study from IT.
ii. Receiving feedback from survey sent from department to May 2019 graduating seniors who
completed their degree in four years.
iii. Would like to conduct a more sophisticated literature review.
d. Transfer Student Experience – Erica Long
i. Data has been collected and is ready for subcommittee review.
e. Under Represented Minority Students – Rachel Morris
i. Survey is almost ready to disburse.
ii. Final survey item is an invitation to participate in a focus group to be held at the beginning of the
fall semester.
XLIII. Announcements
Missouri S&T Student Success Committee Meeting MINUTES

148
a. Will Zwikelmaier – COER will host a new event on the Puck Mall the night before the fall career
fair. The concept is a reverse career fair. Employers will visit with students at tables featuring their
team or organization. 500-700 employer representatives are expected.
b. Kayla Klossner-Thompson – There will be only three PRO days in June. The June 28th PRO day is
cancelled due to low registration.
c. Bridgette Betz – Student Financial Assistance is working on summer aid awards.
d. John Gallagher – Fraternity and sorority leaders have mandated anti-hazing training for all students
joining a chapter next fall
e. John Gallagher – Registration is open for a table at Miner Rama.
XLIV. General Items – Provost Marley
a. Provost Marley thanked members for their work on this committee. It is important work, and
decisions must be data driven.
b. A proposal to rebuild the IR function is in development. Focus is analytics assessment.
c. The incoming freshman class is the strongest ever, but the retention and graduation rates are similar
to those of an open admission institution.
d. President Choi is focused heavily on the strategic plan. It will be important to reflect on what we
are doing structurally to support students to improve retention and graduation rates. President
Choi will want S&T to reach the retention and graduation rate goals.
e. We need to be upfront about the need for change, which led to the difficult decision for change in
Enrollment Management. We need to change how we are doing business and will talk more with
Enrollment Management staff about this.
f. Will recommend Paul Orscheln continue the Advising Council.
g. Many issues appear to revolve around a lack of coordination. Many groups on campus are working
on things, but not together.
h. Staff at UM System read the strategic plan daily and believe in the one-solution fix for the retention
and graduation rates problem.
i. Jeff Cawlfield thanked the provost and chancellor for their support of this committee.
XLV. Next Meeting – TBD
8:15 am – 9:15 am, Silver and Gold Room, Havener Center

149
June 13, 2019
8:15 am – 9:15 am
Havener Center, Silver and Gold Room
Members:
Those whose names are grayed out below were absent.
Bridgette Betz, Jeff Cawlfield, Tyrone Davidson, Kate Drowne, Brooke Durbin, John Easter, Patti Fleck,
John Gallagher, Eddie Grover-Bisker, Deanne Jackson, Kayla Klossner-Thompson, Quentin Lee,
Douglas Ludlow, Rachel Morris, John Myers, Julia Morgan, Adrienne Neckermann, Dorie Paine,
Stephen Raper, Dan Reardon, Anitra Rivera, Paul Runnion, Dave Westenberg, Klaus Woelk, Will
Zwikelmaier
Ex Officio Members:
Those whose names are grayed out below were absent.
Joni Burch, Erica Long, Donna Luechtefeld, Robert Marley, Caprice Moore, Stephen Roberts, Katie
Tucker, Richard Wlezien
Guest:
Amy McMillen
XLVI. Review and Approval of Minutes
a. Minutes were approved.
XLVII. Announcements
a. Brooke Durbin – Will assist as co-chair of the Student Success Committee for the foreseeable
future as Acting Vice Provost for Enrollment Management.
b. Kayla Klossner-Thompson – 112 students are expected for PRO Day on June 14 and 35 students
are expected for PRO Day on June 21.
c. Brooke Durbin – Articulation agreements were signed with the St. Louis College of Pharmacy for
3+4 and 4+4 agreements.
d. Will Zwikelmaier – COER tested a new process for Career Fair that will get 300 students checked
in every five minutes compared to 35 students every five minutes with the previous process. This
will reduce the number of volunteers needed from 100+ to approximately 40.
e. Adrienne Neckermann – Will offer 4 separate 2-hour sessions for Graduate Student Orientation
followed by a reception.
f. Bridgette Betz – The 2019-2010 Cost of Attendance has been approved and released.
XLVIII. Subcommittee Updates Subcommittee Updates
a. Graduate Student Experience – Adrienne Neckermann
i. Subcommittee is meeting regularly.
b. Student Intake subcommittee – Suspended for 2019 presentation cycle.
c. Time to Degree / Credit Hours to Graduation – Donna Luechtefeld for Steve Raper
i. Waiting for one more set of reports from IT.
Missouri S&T Student Success Committee Meeting MINUTES

150
ii. Conducting a literature review.
iii. Almost ready to begin writing report.
iv. John Myers - 65 graduating undergraduate CEC students completed a short survey at the end of
spring semester. 24 students graduated in four years or less, 36 students graduated in 4.5 or 5
years, 3 students graduated in 6 years and 2 students graduated in 7 years. Plan to survey all
graduating undergraduate students in the fall.
d. Transfer Student Experience – Erica Long
i. Brief review of data did not show expected results. Will discuss and review further with
subcommittee.
e. Under Represented Minority Students – Donna Luechtefeld for Rachel Morris
i. Received good results from survey.
ii. Enough students expressed interest in participating in a focus group, so will conduct one at the
beginning of the fall semester.
XLIX. Announcements
a. Will Zwikelmaier – COER will host a new event on the Puck Mall the night before the fall career
fair. The concept is a reverse career fair. Employers will visit with students at tables featuring their
team or organization. 500-700 employer representatives are expected.
b. Kayla Klossner-Thompson – There will be only three PRO days in June. The June 28th PRO day is
cancelled due to low registration.
c. Bridgette Betz – Student Financial Assistance is working on summer aid awards.
d. John Gallagher – Fraternity and sorority leaders have mandated anti-hazing training for all students
joining a chapter next fall
e. John Gallagher – Registration is open for a table at Miner Rama.
L. Next Meeting August 1, 2019
8:15 am – 9:15 am, Silver and Gold Room, Havener Center

151
August 1, 2019
8:15 am – 9:15 am
Havener Center, Silver and Gold Room
Members:
Those whose names are grayed out below were absent.
Bridgette Betz, Jeff Cawlfield, Tyrone Davidson, Brooke Durbin, John Easter, Patti Fleck, Shannon Fogg,
John Gallagher, Eddie Grover-Bisker, Deanne Jackson, Kayla Klossner-Thompson, Quentin Lee,
Douglas Ludlow, Rachel Morris, John Myers, Julia Morgan, Adrienne Neckermann, Dorie Paine,
Stephen Raper, Dan Reardon, Anitra Rivera, Paul Runnion, Cathy Tipton, Dave Westenberg, Klaus
Woelk, Will Zwikelmaier
Ex Officio Members:
Those whose names are grayed out below were absent.
Joni Burch, Kate Drowne, Erica Long, Donna Luechtefeld, Beth Cudney for Caprice Moore, Stephen
Roberts, Katie Tucker, Richard Wlezien
LI. Review and Approval of Minutes
a. Minutes were approved.
LII. Update on APLU Tech Cluster Initiative – Jeff Cawlfield
a. APLU’s Powered by Publics initiative is comprised of 130 institutions organized into 16
Transformation Clusters focused on improving access, retention, and graduation.
b. S&T belongs to the Tech Cluster. Other members in this cluster are Michigan Technological
University, New Jersey Institute of Technology, University of Alabama in Huntsville.
c. The Tech Cluster focus is on holistic advising. Members meet monthly via Zoom to exchange ideas
and best practices and to develop new strategies.
d. https://www.aplu.org/members/councils/presidents/presidentsdocuments/11-2018/Final-
Clusters.pdf
e. https://www.aplu.org/projects-and-initiatives/center-for-public-university-
transformation/powered-by-publics/index.html
f. Steve Roberts made the following comments regarding student success.
i. S&T’s graduation and retention rates are similar to national averages but not to similar cohorts
at other universities.
ii. There is a strong focus at UM System, nationally and in the press regarding student success
rates. Two articles of interest can be found at
https://www.chronicle.com/interactives/20190726-dropout-scandal?cid=wsinglestory_hp_1 and
https://www.insidehighered.com/news/2019/08/01/author-discusses-his-book-college-dropout-
scandal
iii. S&T will look at DFW rates per course to identify courses people believe are a problem, but are
actually fine and problematic courses that people believe are fine.
Missouri S&T Student Success Committee Meeting MINUTES

152
iv. Anticipate many projects and/or studies related to Student Success over the next year to
improve success rates. This committee will participate.
v. Need to identify/develop new strategies to improve student success such as a lecture capture
process like the one CASB recently made available to all students.
vi. UM System to release a data set for retention and graduation rates by department.
g. Subcommittee reports and the Strategic Plan – Jeff Cawlfield
i. It will be important to reference the Strategic Plan in subcommittee reports where possible.
Work for the next cycle will need to be based on the Plan.
ii. Donna Luechtefeld suggested reviewing the Strategic Plan during a committee meeting.
Members agreed this will be useful.
LIII. Committee Timeline – Rachel Morris
September 30 Subcommittee Reports and Power Point Slides to Rachel
October 4 Rachel to Send Draft Report to Committee
October 10 Subcommittee Presentations to the Committee
October 17 Edits Due to Rachel
October 24 Subcommittee Presentations to the Committee
October 24 Final Report Complete
November 7 Presentation to the Chancellor LIV. Subcommittee Updates Subcommittee Updates
a. Graduate Student Experience – Adrienne Neckermann
i. Creating an Advisor-Advisee guide to cover things such as faculty and student roles.
ii. Creating a Graduate Student Success guide to cover things such as housing, what to do if your
advisor leaves, what to do if funding runs out.
b. Student Intake subcommittee – Suspended for 2019 presentation cycle.
c. Time to Degree / Credit Hours to Graduation – Steve Raper
i. Subcommittee report is nearly complete.
ii. Time to degree is 5 years on average. Students consider S&T a “5-year university”.
iii. CASB students have 140 hours on average at graduation. CEC students have 145-146 hours on
average at graduation.
iv. Small literature review highlighted the importance of data analytics.
v. Retention/Graduation Rates may need to be a stand-alone committee separate from the Student
Success Committee.
vi. Missing data piece may be what students think or feel. An example from the most recent
Student Panel: A student said, “College is four years. I never considered anything else.”
vii. Steve Roberts made the following comments.
1. The Teacher Education Program received intense scrutiny from MDHE for the number of
hours to certification. MDHE likely to review more programs. Anticipate they will question
how other STEM programs graduate students in 120-125 hours compared to 140-145 hours
at S&T.
2. S&T will set up an IR platform.
d. Transfer Student Experience – Erica Long
i. Data did not show expected results. Transfer student success rates are similar to overall
campus rates. Will review data by college, department, major, etc.
e. Under Represented Minority Students – Rachel Morris

153
i. 15 students expressed interest in participating in a focus group.
ii. In process of scheduling that event.
LV. Announcements
a. Jeff Cawlfield – The Academic Affairs Retreat will be held August 7-8. Agenda includes barriers,
challenges and strategies to student success. Please send comments or suggestions for consideration
during the retreat to Donna Luechtefeld.
b. Deanne Jackson – Changes have been made to the refund policy and the add/drop policy.
c. Will Zwikelmaier – UMKC will allow S&T business, engineering, and computing students to attend
their career fair. Mizzou will allow S&T biological science students to attend their career fair. Only
S&T students will be allowed to attend the S&T career fair, per agreements with employers.
d. Doug Ludlow – S&T Advising is moving to G-6 library today.
e. Kayla Klossner-Thompson – 1,172 freshman are expected. This includes the August PRO.
f. John Gallagher – Reserve your table for Miner Rama.
g. John Gallagher – Miner Challenge advisor application is open now.
LVI. Next Meeting – August 29, 2019
8:15 am – 9:15 am, Silver and Gold Room, Havener Center

154
August 29, 2019
8:15 am – 9:15 am
Havener Center, Silver and Gold Room
Members:
Those whose names are grayed out below were absent.
Bridgette Betz, Jeff Cawlfield, Tyrone Davidson, Brooke Durbin, Patti Fleck, Shannon Fogg, John
Gallagher, Eddie Grover-Bisker, Deanne Jackson, Kayla Klossner-Thompson, Quentin Lee, Douglas
Ludlow, Rachel Morris, John Myers, Julia Morgan, Adrienne Neckermann, Dorie Paine, Stephen Raper,
Dan Reardon, Anitra Rivera, Paul Runnion, Cathy Tipton, Dave Westenberg, Klaus Woelk, Will
Zwikelmaier
Ex Officio Members:
Those whose names are grayed out below were absent.
Joni Burch, Kate Drowne, Erica Long, Donna Luechtefeld, Caprice Moore, Richard Brow for Stephen
Roberts, Katie Tucker, Richard Wlezien
LVII. Review and Approval of Minutes
a. Minutes were approved.
LVIII. Enrollment Update – Brooke Durbin
a. A Trends Report is generated at the end of each week of class until fourth week when numbers are
official.
b. Record enrollment was set for Asian-Americans, Hispanic-Americans, total minority, non-Caucasian,
and under-represented minority students.
c. Total enrollment is down 5.1%.
d. Undergraduate enrollment is down 5.4%.
e. Graduate enrollment is down 4.2%
f. Female enrollment is down 5.2%.
g. On-campus enrollment is down 6%.
h. Off-campus enrollment is up 3.4%.
i. First time college is down 13.9%.
j. Transfer enrollment is down 10%.
k. CASB enrollment is 18.8% compared to 17.4% last year.
l. CEC enrollment is 81.2% compared to 82.6% last year.
m. Record high average high school GPA of 3.95.
n. Record high average ACT score of 28.8.
LIX. EAB Update – Brooke Durbin
a. Three-year contract to assist with recruiting efforts. Will work with Marketing and
Communications, Recruitment Marketing & Enrollment Development, and Admissions.
b. EAB will conduct a communications campaign to increase the number of applications beginning with
the Fall 2020 class via a quick application unique to S&T called the Groundbreaker Application.
Missouri S&T Student Success Committee Meeting MINUTES

155
c. EAB will assist with communications to increase brand awareness among high school sophomores
and juniors. The campaign phrase/tagline is “Cultivate your curiosity. Choose a college that
expands your mind.”
d. EAB will deliver scholarship optimization services previously provided by Ruffalo Noel Levitz.
e. Site visits will be held to identify ways to optimize strategies.
LX. Student Success Compact of the Strategic Plan
a. Jeff Cawlfield reviewed key points in the student success compact of the strategic plan.
LXI. Subcommittee Updates Subcommittee Updates
a. Graduate Student Experience – Adrienne Neckermann
i. Rough draft of report is complete.
ii. Draft of Advisor-Advisee Guiding Principles is complete.
b. Student Intake subcommittee – Suspended for 2019 presentation cycle.
c. Time to Degree / Credit Hours to Graduation – No update.
d. Transfer Student Experience – Erica Long
i. Working on report.
e. Under Represented Minority Students – Rachel Morris
i. Three students participated in the focus group.
ii. Students would like to meet on a regular basis.
iii. Plan to send focus group questions to students who expressed interest but did not attend.
LXII. Announcements
a. Jeff Cawlfield – Welcomed Christina Carrig to the Student Success Committee as the Student
Council representative. She is currently the Student Council vice president of external affairs and
serves as an On-Track Mentor for Academic Advising.
b. Doug Ludlow – Student Advising moved to G-6 Library. Approximately 80-90 students and many
staff visited during open house which was held Tuesday and Wednesday.
c. John Gallagher – Thank you to Dave Westenberg for video content used to promote Miner
Challenge. Please submit an application to serve as faculty/staff advisor if interested. The application
closes soon.
d. Will Zwikelmaier – There is a wait list for employers to attend career fair. Miner Mingle is a new
event set to take place the night before. It will be followed by Night to Network.
e. Will Zwikelmaier – A top employer of S&T students is including a clause in the offer of employment
indicating an employee can be dismissed due to parent complaints regarding work schedule/work
load.
f. Kayla Klossner-Thompson – Thank you to everyone who participated in Opening Week activities.
g. Erica Long – A new advisor started on Monday. She will focus on the Missouri State Co-Op
Program with approximate 25 students and ABET assessment items.
h. Anitra Rivera – All are welcome to attend the What’s Cookin’ for Breakfast event at the SDI House
on September 4 from 8:30-11:00 am.
i. Adrienne Neckermann – Number of attendees at Graduate Student Orientation was higher than last
year. Events included a graduate student research fair and a graduate-faculty social.
j. Adrienne Neckermann – Graduate Students and Global Learning will trade spaces in Norwood and
Centennial next week.

156
k. Bridgette Betz – There will be changes to the Fall 2020 scholarships due to the transition from
Ruffalo Noel Levitz to EAB. Will roll our simpler, easier to advertise scholarships connected to the
Groundbreaker application.
LXIII. Next Meeting – September 12, 2019
8:15 am – 9:15 am, Silver and Gold Room, Havener Center
157
September 12, 2019
8:15 am – 9:15 am
Havener Center, Silver and Gold Room
Members:
Those whose names are grayed out below were absent.
Bridgette Betz, Christina Carrig, Jeff Cawlfield, Tyrone Davidson, Brooke Durbin, Patti Fleck, Shannon
Fogg, John Gallagher, Eddie Grover-Bisker, Deanne Jackson, Kayla Klossner-Thompson, Quentin Lee,
Douglas Ludlow, Rachel Morris, John Myers, Julia Morgan, Adrienne Neckermann, Dorie Paine,
Stephen Raper, Dan Reardon, Anitra Rivera, Paul Runnion, Cathy Tipton, Dave Westenberg, Klaus
Woelk, Will Zwikelmaier
Ex Officio Members:
Those whose names are grayed out below were absent.
Joni Burch, Kate Drowne, Erica Long, Donna Luechtefeld, Caprice Moore, Stephen Roberts, Katie
Tucker, Costas Tsatsoulis, Richard Wlezien
LXIV. Review and Approval of Minutes
a. Minutes were approved.
LXV. Academic Care Teams
a. Krista Morris-Lehman introduced new care coordinators Jocelyn Gutowski based in the Student
Health Center and Brittney Miller based in Residential Life.
b. The S&T care coordinator worked with 808 students last year, many for mainly academic reasons
such as absenteeism, unresponsive to email, low motivation, unaware of how or where to seek help,
etc.
c. Missouri State University (MSU) implemented an Academic Care Team to coordinate interventions
and support for students with primarily academic concerns.
d. The S&T care coordinators would like to explore interest in implementing an Academic Care Team
at Missouri S&T to help coordinate the efforts of many people working with the same student.
e. Jeff Cawlfield will contact the Academic Care Team leader at MSU for more information about their
program and report to the committee.
LXVI. Student Emergency Fund
a. Krista Morris-Lehman provided an update on the Student Emergency Fund.
b. Counseling Services established the fund three years ago.
c. There is a 93% retention rate for students who receive funding.
d. Provides one-time funding of $25-$500 to students in dire need. Funds do not have to be repaid.
e. It is funded solely through donations and fundraisers. Go to giving.mst.edu or contact Krista Morris-
Lehman to make a donation.
f. Students can be referred to the Emergency Fund by calling Counseling Services at 341-4211, emailing
[email protected] or online at https://counseling.mst.edu/emergency-fund/
Missouri S&T Student Success Committee Meeting MINUTES

158
g. Deanne Jackson said there will be a Fudge Off and Sweet Treats competition on November 5 from
11 am – 2 pm to benefit the fund.
LXVII. Subcommittee Updates Subcommittee Updates
a. Graduate Student Experience – Patti Fleck
i. Drafting a Discussion Guide for graduate students and advisors to have a conversation about
expectations.
ii. Generating a plan of when, how, and to whom to disseminate.
iii. Working on our report.
b. Student Intake subcommittee – Suspended for 2019 presentation cycle.
c. Time to Degree / Credit Hours to Graduation – Donna Luechtefeld for Steve Raper
i. Finishing subcommittee report and working on PPT slides.
d. Transfer Student Experience – No update.
e. Under Represented Minority Students – Rachel Morris
i. Writing subcommittee report.
ii. Students in focus group would like to meet on a regular basis. Looking for a date.
LXVIII. Announcements
a. Patti Fleck – Counseling Services with feedback from several student groups created refrigerator
magnets with contact information for mental health and well-being resources. Distributing magnets
through Residential Life, Greek Life, and “Let’s Talk” tables in various locations such as Havener and
the library.
b. Dave Westenberg – The volleyball team was undefeated last weekend. There is a football game on
Saturday at 7 pm. Chancellor Dehghani and his family will be introduced at halftime. Admission is
free for all faculty and staff. The All Star game will be next weekend.
c. Brooke Durbin – Final enrollment for Fall semester will be reported next Tuesday.
d. Christina Carrig – Student Council will host an open forum to discuss academic advising on
November 6. All are welcome to attend.
e. Patti Fleck – Tuesday was World Suicide Prevention Day. Ask Listen Refer is a suicide prevention
training program available at http://www.asklistenrefer.org/mst. It takes approximately 30 minutes
to complete.
LXIX. Next Meeting – September 26, 2019
8:15 am – 9:15 am, Silver and Gold Room, Havener Center

159
September 26, 2019
8:15 am – 9:15 am
Havener Center, Silver and Gold Room
Members:
Those whose names are grayed out below were absent.
Bridgette Betz, Christina Carrig, Jeff Cawlfield, Tyrone Davidson, Brooke Durbin, Patti Fleck, Shannon
Fogg, John Gallagher, Eddie Grover-Bisker, Deanne Jackson, Kayla Klossner-Thompson, Quentin Lee,
Douglas Ludlow, Rachel Morris, John Myers, Julia Morgan, Adrienne Neckermann, Dorie Paine,
Stephen Raper, Dan Reardon, Anitra Rivera, Paul Runnion, Cathy Tipton, Dave Westenberg, Klaus
Woelk, Will Zwikelmaier
Ex Officio Members: Those whose names are grayed out below were absent.
Joni Burch, Kate Drowne, Erica Long, Donna Luechtefeld, Caprice Moore, Stephen Roberts, Costas
Tsatsoulis, Katie Tucker, Richard Wlezien
Guest:
Amy McMillen
LXX. Review and Approval of Minutes
a. Minutes were approved.
LXXI. Overview of Fourth Week Enrollment Numbers
a. Brooke Durbin presented enrollment data.
b. Total enrollment is 8,096, down 5.9% from 2018.
c. Record enrollment set for the following minority groups: 318 Asian students, 341 Hispanic students,
774 under-represented minority students, 1,200 total minority students.
d. International student enrollment is 791, down 11% from 2018.
e. The largest number of students are from Missouri, Illinois, Texas, California, Kansas, and Oklahoma.
f. The largest number of Missouri students come from the St. Louis area, Jackson County, Phelps
County, and Greene County.
g. The largest number of freshmen come from the St. Louis area and Kansas City area and Illinois.
h. The Competitor Chart is updated annually by running the Admitted Not Enrolled survey data against
the National Student Clearing House. Mizzou is still our top competitor.
LXXII. Retention and Graduation Numbers as Related to U.S. News and World Report Rankings
a. Jeff Cawlfield reviewed criteria considered in rankings.
b. Retention and graduation rates affect rankings. We can improve S&T’s rank by changing the culture
of pride in low graduation rates.
c. 6-year graduation rates of 63-64% need to be increased to 70% to reach goal range.
d. Pell 6-year graduation rates of 50-59% need to be increased to 60% or greater to reach the goal
range.
Missouri S&T Student Success Committee Meeting MINUTES

160
e. There is an inverse relationship between acceptance rates school rankings. Lower acceptance rates
result in higher rankings.
LXXIII. APLU Technical Cluster Stretch Goals for S&T
a. Jeff Cawlfield presented the draft stretch goals for S&T.
b. Increase the number of BA and BS degrees awarded.
c. Increase total undergraduate enrollment to 7,250.
d. Increase total URM enrollment to 1,000.
e. Increase 6-year graduation rate to 70% for general student body.
f. Increase 6-year graduation rate to 60% for URM students.
LXXIV. S&T Retention Plan
a. Chancellor Dehghani has requested a retention plan. Jeff Cawlfield is creating a draft and will submit
it to Provost Roberts for review.
LXXV. Subcommittee Updates Subcommittee Updates
a. Graduate Student Experience – Adrienne Neckermann
i. The subcommittee is meeting this afternoon.
b. Student Intake subcommittee – Suspended for 2019 presentation cycle.
c. Time to Degree / Credit Hours to Graduation – Steve Raper
i. Working on PPT slides.
d. Transfer Student Experience – Erica Long
i. Drafting the report with subcommittee.
e. Under Represented Minority Students – Rachel Morris
i. Will send report to subcommittee next week.
LXXVI. Announcements
a. Will Zwikelmaier – 3,500 students attended Career Fair. There were a record number of
employers. Received good feedback on the Miner Mingle event. Career Fair dates are now included
on the Academic Calendar.
b. Doug Ludlow – 504 students moved to their degree major as of Monday, September 23.
c. Klaus Woelk – The Teaching and Technology Conference will be held in St. Louis today and
tomorrow. There is no fee to attend.
d. Brooke Durbin – S&T has partnered with EdSights in a one-year pilot program aimed at improving
freshman to sophomore retention rates. The initial survey focusing on academics, engagement,
financial concerns, and wellness received a 60% response rate. 92% of respondents opted in to
receive text messages. Only 6 students opted out after the text messages began.
e. Dorie Paine - Interventions are launched based on survey responses.
f. Tyrone Davidson – The Advising Office staff will contact 21 students identified as high risk.
g. Completing the initial round of reporting. There is a 60% response rate on the survey.
h. Jeff Cawlfield – Provost Roberts will purchase the Predictive Analytics module of Starfish.
LXXVII. Next Meeting – October 10, 2019
8:15 am – 9:15 am, Silver and Gold Room, Havener Center

161
October 10, 2019
8:15 am – 9:15 am
Havener Center, Silver and Gold Room
Members:
Those whose names are grayed out below were absent.
Bridgette Betz, Christina Carrig, Jeff Cawlfield, Tyrone Davidson, Brooke Durbin, Patti Fleck, Shannon
Fogg, John Gallagher, Eddie Grover-Bisker, Deanne Jackson, Kayla Klossner-Thompson, Quentin Lee,
Douglas Ludlow, Rachel Morris, John Myers, Julia Morgan, Adrienne Neckermann, Dorie Paine,
Stephen Raper, Dan Reardon, Anitra Rivera, Paul Runnion, Shobi Sivadasan, Cathy Tipton, Dave
Westenberg, Klaus Woelk, Will Zwikelmaier
Ex Officio Members:
Those whose names are grayed out below were absent.
Joni Burch, Kate Drowne, Erica Long, Donna Luechtefeld, Caprice Moore, Stephen Roberts, Costas
Tsatsoulis, Katie Tucker, Richard Wlezien
Guest:
Amy McMillen
LXXVIII. Review and Approval of Minutes
a. Minutes were approved.
LXXIX. Shobi Sivadasan and Committee Introductions
a. Shobi Sivadasan, the new Vice Provost for Enrollment Management, began her duties on October 1.
She and committee members introduced themselves.
LXXX. Transfer Student Engagement Subcommittee Presentation
a. Erica Long presented the subcommittee report.
LXXXI. Time to Degree / Credit Hours to Graduation
a. John Myers presented the subcommittee report for Steve Raper.
LXXXII. Announcements
a. Brooke Durbin for Jeff Cawlfield – Provost Roberts announced formation of the Retention and
Graduation Rate Performance taskforce. Membership will be primarily faculty.
b. John Gallagher – Miner Challenge cookie dough sales are underway. Orders are due October 24.
Delivery will be before Thanksgiving.
c. Dave Westenberg – There is a volley ball game tonight, and the Pink Out game is Saturday at 3 pm.
d. Patti Fleck – Beginning October 14, new walk-in hours for the Counseling Center will be Monday-
Friday from 10:00 am until noon and from 2:00 pm until 4:00 pm.
e. Dan Reardon – Fine Linen Theater is presenting Charley’s Aunt. Performances will be held tonight
through Saturday.
LXXXIII. Next Meeting – October 24, 2019
8:15 am – 9:15 am, Silver and Gold Room, Havener Center
Missouri S&T Student Success Committee Meeting MINUTES Missouri S&T Student Success Committee Meeting MINUTES

162
Missouri S&T Student Success Committee Meeting MINUTES