student perceptions of their biology teacher's - repositories
TRANSCRIPT

STUDENT PERCEPTIONS OF THEIR BIOLOGY TEACHER'S INTERPERSONAL
TEACHING BEHAVIORS AND STUDENT ACHIEVEMENT
AND AFFECTIVE LEARNING OUTCOMES
by
WADE CLAY SMITH, JR., B.S.Ed., M.Ed.
A DISSERTATION
IN
CURRICULUM AND INSTRUCTION
Submitted to the Graduate Faculty of Texas Tech University in
Partial Fulfillment of the Requirements for
the Degree of
DOCTOR OF EDUCATION
Approved
Accepted
August, 1998

ACKNOWLEDGMENTS
The assistance Drs. Skoog and Lan have been instrumental in the
research, development and completion of this dissertation. Dr. Skoog was
always there to help me develop a clearer understanding of the concepts central
to my dissertation. In the best Socratic tradition he helped me sharpen my
thought processes. Dr. Lan's assistance was critical to me. Without his help, I
would not have developed a good theory based understanding of quantitative
methodologies.
I also want to acknowledge the critical discussions I had with Ms. Chih-
Ling Hseih, and Dr. Chi-Chau Lin, fellow doctoral students. Each of these fine
friends acted as sounding boards to help me develop a dearer understanding of
the central ideas of my dissertation and how I should present them at public
meetings. I also want to thank Dr. Jung who as helped me broaden my
understanding of what it means to be a professional educator. Lastly, but by no
means last, I am deeply indebted to my wife, Esther Smith. Without her support
and love I would never of been able to complete my doctoral program.

TABLE OF CONTENTS
ACKNOWLEDGEMENTS ii
ABSTRACT vii
LIST OF TABLES ix
CHAPTER
I. THE PROBLEM 1
Introduction and Background of the Study 1
Theoretical Framework: Interpersonal Teaching Behaviors
Theory 5
Statement of the Problem 7
Delimitations of the Study 7
Limitations of the Study 8
Purpose of the Study 8
Hypotheses 9
Importance of the Study 9
Organization of the Dissertation 10
II. LITERATURE REVIEW 11 Analytical Observations of Teacher Overt Behaviors and Competencies: Styles, Skills and Techniques and Effective Teaching 11
Direct versus Indirect Teaching Styles 15

Deployment of Key Teaching Competencies and Teacher Effectiveness 27
Holistic Communication Analysis and Teacher Effectiveness: Interpersonal Teaching Behaviors and Pupil achievement 30
Theoretical Frameworks 30
Leary's Communication Theory 30
Watzlawick, Beavin and Jackson's human communication theory 31
Interpersonal Teacher Behaviors 31
Summary: Interpersonal Teaching Behaviors Theory 42
Bloom's Taxonomy of Educational Objectives 43
RESEARCH DESIGN AND METHODOLOGY 51
Introduction 51
Purpose 52
Hypotheses 53
Methodology 53
Participants 53
Instrumentation 54
Questionnaire on Teacher Interaction (QTI) 54
Biology End-of-Course Examination (Spring 1996 ver.) 57
Biology Student Affective Instrument (BSAI) 60 Procedure 62
Data Analysis 62
iv

IV. RESULTS 65
Hypotheses 66
Descriptive Statistics 66
Assumptions Concerning the use of Multiple Regression 68
Statistical Analysis 70
Summary 86
V. DISCUSSIONS, CONCLUSIONS, AND RECOMMENDATIONS 89
Summary of Study 89
Limitations 95
Implications 95
Influence of Student Perceptions of their Biology Teacher on Student Achievement Levels 95
Influence of Student Perceptions of their Biology Teacher on Student Affective Outcomes 100
Theoretical Contributions 104
Educational Practice 107
Suggestions for Future Research 108
REFERENCES 111
APPENDIX
A: QUESTIONNAIRE ON TEACHER INTERACTION 117
B: BIOLOGY STUDENT AFFECTIVE INSTRUMENT, FACTOR ANALYSIS, AND RELIABILITIES 120
C: BIOLOGY END OF COURSE EXAMINATION 125

D: CORRELATION OF ALL VARIABLES 147
VI

ABSTRACT
The primary goals of this dissertation were to determine the relationships
between interpersonal teaching behaviors and student achievement and affective
learning outcomes. The instrument used to collect student perceptions of teacher
interpersonal teaching behaviors was the Questionnaire on Teacher Interactions
(QTI). The instrument used to assess student affective learning outcomes was
the Biology Student Affective Instrument (BSAI) The interpersonal teaching
behavior data were collected using students as the observers. 111 students in an
urban influenced, rural high school answered the QTI and BSAI in September of
1997 and again in April 1998. At the same time students were pre and post
tested using the Biology End of Course Examination (BECE).
The QTI has been used primarily in European and Oceanic areas. The
instrument was also primarily used in educational stratified environments. This
was the first time the BSAI was used to assess student affective leaming
outcomes. The BECE is a Texas normed cognitive assessment test and it is
used by Texas schools districts as the end of course examination in biology. The
interpersonal teaching behaviors model was tested to ascertain if it was
predictive of student achievement and affective learning outcomes in a Texan
non-stratified educational environment. Findings indicate that the QTI is not an
adequate predictor of student achievement in biology. Nor is an adequate
predictor of student affective learning outcomes In biology. This study's results
were not congruent with the non-USA results, this indicates that the QTI is also a
VII

society/culturally sensitive instrument and the instrument needs to be normed to
a particular society/culture and its predictive power established before It is used
to affect teachers' and students' educational environments.
VIII

LIST OF TABLES
1. Descriptive Statistics of all independent and dependent variables 67
2. Descriptive Statistics of all retained criteria variables for sub-hypothesis 1.1 71
3. ANOVA Test for model/data fit for sub-hypothesis 1.1 71
4. Standardized Beta Coefficient of retained independent variables for Dependent Post-Test, High Level (Sub-hypothesis 1.1) 73
5. Descriptive Statistics of all retained criteria variables for sub-hypothesis 1.2 74
6. ANOVA Test for model/data fit for sub-hypothesis 1.2 75
7. Standardized Beta Coefficient of retained independent variables for Dependent Post-Test, Low Level (Sub-hypothesis 1.2) 76
8. Descriptive Statistics of all retained criteria variables for sub-hypothesis 1.3 77
9. ANOVA Test for model/data fit for sub-hypothesis 1.3 78
10. Standardized Beta Coefficient of retained independent variables for Dependent Post-Test, Overall Level (Sub-hypothesis 1.3) 79
11. Descriptive Statistics of all retained criteria variables for Sub-hypothesis 2.1 (Factor 1) 80
12. ANOVA Test for model/data fit for sub-hypothesis 2.1 (Factor 1) 81
13. Standardized Beta Coefficient of retained independent variables for BSAI, Factor 1 (Sub-hypothesis 2.1) 82
14. Descriptive Statistics of all retained criteria variables for Sub-hypothesis 2.2 (Factor 2) 83
15. ANOVA Test for model/data fit for sub-hypothesis 2.2 (Factor 2) 84
IX

16. Standardized Beta Coefficient of retained independent variables for BSAI, Factor 2 (Sub-hypothesis 2.2) 86
17. Resultant Factors firom Principal Component Analysis Factor Analysis 121
18. Reliability analysis, Cronbach Alpha scale, Factor 1, BSAI (Opinions) 122
19. Reliability analysis, Cronbach Alpha scale. Factor 2, BSAI (Feelings) 123
20. Correlation of all variables 148

CHAPTER I
THE PROBLEM
Introduction and Background of the Study
Since the 1950's, researchers have been attempting to quantify the impact
of teacher characteristics and styles on their pupils' learning outcomes. There
has been a recognized need to understand the basis for effective teaching in the
9-12 grade setting. Effective teaching style is defined by this researcher as those
actions, interactions and communications of the teacher with her/his students
which are associated with positive achievement and/or affective student
outcomes. While the common definition of an effective teacher is moderately
stable, the methods used to operationally define the theoretical construct of
effective teacher styles have not been stable in the literature (see Bennett, 1976;
Brophy, 1973; Flanders, 1960, 1964, 1965, 1970 1970a; Good, Biddle & Brophy
1975; Haige & Schmidt, 1956; Medley, 1977, 1979; Ostlund, 1956; Rosenshine,
1970; Stalling 1976; Soar, 1968; Tuckman, 1970; Veldman & Brophy, 1974;
Wispe, 1951). The varying scales used in the aforementioned studies to assess
the effective teacher construct were bipolar and linear in nature. Since 1985 the
primary method used to operationally define the theoretical construct of effective
teaching styles has focused on the interpersonal teaching behavior model (see
Brekelmans, 1989; Brekelmans, Wubbels, & Creton, 1990; Creton, Wubbels, &
Hooymayers, 1993; Fisher, 1995; Fraser, 1986; Henderson, Fisher, & Fraser,
1995; Wubbels, Brekelmans, Creton, & Hooymayers, 1989; Wubbels,
1

Brekelmans, & Hooymayers, 1991; Wubbels, Creton, & Holvast, 1988; Wubbels,
Creton, & Hooymayers, 1985; Wubbels, Creton & Hooymayers, 1987; Wubbels,
Creton, & Hooymayers, 1992; Wubbels, Creton, Levy, & Hooymayers, 1993;
Wubbels, & Levy, 1989). Two confounding variables that impact on the stability
of interpersonal teaching behaviors are experience and age of the teachers
under study (Brekelmans, Holvast, & van Tartwijk, 1992). This study found that
teacher interepersonal teaching behaviors underwent three major changes
during a teacher's career. These changes occurred during the 5^ year and 15^
year of experience. Teachers generally exhibited more leadership traits and less
uncertainty and strictness traits at the 5* year and they exhibited more strictness
traits at the 15* year of experience. Age was also related to differing
interpersonal teaching behaviors with the more elderiy teacher exhibiting more
leadership and less uncertainty traits (Brekelmans et al., 1992). Brekelmans et
al.'s study is supportive of Veldman and Brophy's (1974) study which found that
Rosenshine's (1970) study was flawed because he did not account for teacher
experience in his study. Teachers change their interpersonal teaching behaviors
as they gain experience and age, and there is evidence that the Questionnaire
on Teacher Interaction is reliable enough to detect changes in teacher's
interpersonal teaching behaviors.
The scales that have been used to attempt to assess teacher
styles/behaviors were labeled Authoritarian-Democratic -Lassez Faire (Anderson,
1959), Progressive-Traditional (Bennett, 1976), Direct versus Open Questions
(Rosenshine, 1976), Positive reinforcement model versus Open structure model

(Stalling, 1976), Directive-Permissive (Haige & Schmidt, 1956), and Direct-
Indirect (Flanders, 1960, 1964, 1965, 1970a, 1970b; Soar, 1968; Tuckman, 1970,
1976). These prior studies used differing operational definitions of teacher
style/behavior and their results were mixed and contradictory (see Bennett, 1976;
Soar, 1968; Stallings, 1976). The interpersonal teaching behavior theory will be
used to bring clarity to the theoretical construct of teacher effectiveness/styles
and the associated research field. To assist in the development of clarity, this
study will use the interpersonal teaching behaviors model perspective to evaluate
the seminal teacher effectiveness literature and bring partial coherence to this
literature.
The current interpersonal teaching behaviors research is focused on
correlation studies between teachers' interpersonal teaching behaviors and
students cognitive and affective outcomes (Brekelmans, 1990; Fisher, 1995;
Henderson, Fisher & Fraser, 1995; Tuckman, 1980; Wubbels, Brekelmans,
Creton & Hooymayers, 1989; Wubbels, Brekelmans & Hooymayers, 1991;
Wubbels, Creton & Holvast, 1988; Wubbels, Creton & Hooymayers, 1985, 1987;
Wubbels, Creton, Levy & Hooymayers, 1993; Wubbels & Levy 1989). Using the
interpersonal teaching behaviors model, the teacher is viewed as an integrated
whole educator interacting with the students in his/her classes. Student
perceptions of their teacher's interpersonal teaching behaviors are instrumental
in effecting student cognitive and affective learning outcomes.
The eariier investigations were identifiable by a number of key correlation
studies with the central question of, "is there a correlation or association between

certain teacher behaviors and students' cognitive or affective learning outcomes
or both?" The Flanders (1960, 1964, 1965, 1970, 1970a), Soar (1968), Stalling
(1976), and Tuckman (1970) models proposed a positive correlation between
indirect teaching styles and cognitive achievement. The Bennett (1976) model
proposed a positive correlation between traditional teaching styles and cognitive
achievement at the lower levels of complexity (see also Brophy, 1973; Good,
Biddle & Brophy 1975; Haige & Schmidt, 1956; Medley. 1977, 1979; Ostlund,
1956; Rosenshine, 1970; Veldman & Brophy, 1974; Wispe, 1951).
Anderson (1959) in his review of the literature, proposed that the teaching
styles were arranged on a continuum from authoritarian on one end through
democratic to laissaz faire on the other end, and reported positive correlation
between democratic teaching methods and cognitive and affective achievements.
The Soar model (1968) used a continuum with direct and indirect teaching styles
on the extremes and a mixed style in the middle. The Soar model proposed that
the relationship between teaching styles and student outcomes would be
curvilinear for the lower cognitive levels with both direct and indirect styles
correlated with lower cognitive learning outcomes and the mixed teaching style
correlated with higher cognitive learning outcomes. The model also proposed
that the relationship would be linear for the higher cognitive levels. The Bennett
(1976) model was a non-continuous model with various teaching typologies
ranging fi-om completely progressive to completely traditional with other discrete
categories between the extremes. In the Flanders (1960) model, the teaching
styles were determined by a numerical score that originates from a series of

observations by trained observers. The Flanders Interaction Analysis Categories
(FIAC) system describes the teacher as indirect if the indirect score to direct
score ratio was more than one. If it was less than one the teacher was identified
as a direct style teacher.
In the Tuckman (1970) model, the teaching styles were based on student
observations. The scale used in the Tuckman model was continuous from a
score of 1 to 9. With a score of 1 the teacher was identified as completely direct
and a score of 9 as completely indirect.
Research by Flanders (1965), Tuckman (1970) and others which depicted
teacher behaviors on a single continuum led to the study of teacher
competencies, the proper utilization of those competencies and how these two
factors impacted on teacher effectiveness. There was an attempt to develop an
understanding of teacher styles by identifying critical skills/techniques. Teachers
were then assessed by their ability to display the appropriate skills/techniques in
the proper context. Teachers' competence was viewed as collections of skills
and techniques and teaching was perceived as a mechanistic procedure.
Theoretical Framework: Interpersonal Teaching Behaviors Theory
The interpersonal teaching behavior model (Brekelmans, Wubbels &
Creton, 1990; Tuckman, 1976, 1995; Wubbels, Creton, & Hooymayers, 1985;
Wubbels, Creton, Levy, & Hooymayers, 1993) is predicated on the
communication theories of Leary (1957) and Watzlawick, Beavin and Jackson

(1967). Leary's book Interpersonal Diagnosis of Personality was written in the
1950's and became the basis for treatment of various psychological infirmities.
Watzlawick et al. (1967) adapted Leary's theory in their book, Pragmatics of
Human Communication: A Study of Interpersonal Patterns. Pathologies, and
Paradoxes, and this adaptation became and continues to be the basis for family
and group counseling and therapies. In the 1980's Wubbels, Creton and
Hooymayers used Leary's theory as modified by Watzlawick and his colleagues'
human communication theory as the basis for their model on interpersonal
teaching behavior from which they constructed the Questionnaire on Teacher
Interaction (QTI).
In Brekelmans, Wubbels, and Creton (1990), Wubbels, Creton, and
Hooymayers (1985) and Wubbels, Creton, Levy, and Hooymayers (1993) the
researchers depicted the interactional teacher behavior by arranging the
behaviors on a grid with dominance or submission on the 'Y' axis and opposition
or cooperation on the X axis. The 'Y' axis is identified as the "influence axis"
and it is read from the origin to top and bottom. The 'X' axis is labeled as the
"proximity axis" and it is read from the origin to the left and to the right. This
resulted in four quadrants that are further divided into two sections each, for a
total of eight sections. These eight sections which represent distinctive teacher
behaviors, as perceived by students, are then correlated to achievement, in the
cognitive domain, and affective outcomes of the students.

statement of the Problem
The problems investigated in this study were:
1. What are the degrees and directions of the relationship between
student perceptions of their biology teacher's interpersonal teaching behaviors
and student achievement outcomes?
2. What are the degrees and directions of the relationship between
student perceptions of their biology teacher's interpersonal teaching behaviors
and student affective outcomes?
Delimitations of the Study
The data of this study were collected in an urban-influenced rural school
district in western Texas. The study was specifically limited to the interpersonal
teaching behaviors occurring between students and teachers in biology classes.
The study was further limited in that the data were recorded from the perspective
of the students only. Previous research has shown that students produce data
that are more reliable and valid than teacher self-report data (Wubbels, Creton,
Levy, & Hooymayers, 1993). Other research (Tuckman, 1976) has shown that
the perceptions of students and external observers are highly correlated with a
value near .80.

Limitations of the Study
Several limitations of this study are acknowledged:
1. This study included only those achievement and affective outcomes that
were measurable in group setting with paper and pencil test forms.
2. Only high school freshmen in biology classes in the school year 1997-
1998 from one moderate sized, urban influenced rural school district were
involved in the testing.
3. The generalization of this study to other populations is restricted by the
type of sample (convenience) and it is further restricted to populations which are
demographically congruent to the sample used in this study.
Purpose of the Study
The purpose of the study was to answer the following research questions:
1. What are the directions and degrees of the relationship between
student perceptions of their biology teacher's interpersonal teaching behaviors
and student overall, higher and lower level cognitive outcomes?
2. What are the directions and degrees of the relationship between
student perceptions of their biology teacher's interpersonal teaching behaviors
and student affective outcomes?
8
Hypotheses
The following hypotheses were tested In this study:
HOI: None of the eight scales of the QTI are significantly related to
student achievement outcomes.
Sub-hypothesis 1.1: None of the eight scales of the QTI are
significantly related to student higher achievement
outcomes.
Sub-hypothesis 1.2: None of the eight scales of the QTI are
significantly related to student lower achievement outcomes.
Sub-hypothesis 1.3: None of the eight scales of the QTI are
significantly related to student overall achievement
outcomes.
H02 : None of the eight scales of the QTI are significantly related to
student affective outcomes.
Sub-hypothesis 2.1: None of the eight scales of the QTI are
significantly related to student feelings about biology.
Sub-hypothesis 2.2 : None of the eight scales of the QTI are
significantly related to student opinions about biology.
Importance of the Study
This study was designed to determine the directions and degrees of the
relationships between student perceptions of their biology teacher's interpersonal
teaching behaviors and student learning outcomes. Student learning outcomes

were measured in the cognitive and affective domains. The clarification of the
relationships studied In this research endeavor will be helpful in considering how
to improve student outcomes in both domains. As a result of this study, the
relationship between student perceptions of their biology teacher's interpersonal
teaching behaviors as it related to student cognitive and affective outcomes was
determined and this will provide an useful guide to the teacher in the selection of
appropriate interpersonal teaching behaviors to maximize student outcomes.
Organization of the Dissertation
This study is comprised of five chapters. Chapter I provided an
introduction of the problems existing in the teacher effectiveness research area
and the need for developing a clearer understanding of the relationship between
student perceptions of their teacher's interpersonal teaching behaviors and
student achievement and affective learning Chapter II provided a review of the
related literature on the assessment and description of teacher effectiveness and
its relationship to the teacher's interpersonal teaching behaviors. The
relationships between interpersonal teaching behaviors and cognitive and
affective outcomes were also reviewed. Chapter III detailed the research design
methodology selected to address the research problems described in the first two
chapters. Chapter IV presented the findings of this study's data collection and
analysis, and Chapter V presented the conclusions of this study based only on
the data collection and their implications, and suggestions for further research in
the study's area.
10

CHAPTER II
REVIEW OF THE LITERATURE
Analytical Observations of Teacher Overt Behaviors Competencies: Teaching Styles. Skills and
Technigues and Effective Teaching
The literature prior to 1985 was primarily concerned with investigating
teacher styles and its relationship to student outcomes and the identification of
teaching skills and techniques. This information was then used to develop an
understanding of what teaching behaviors were present and the behaviors/styles
impact on student learning outcomes. After 1985 the literature is focused on
interpersonal teaching behaviors and student perceptions of their learning
environments.
The skills and techniques were predicated on the linear teaching models
developed by many researchers (see Bennett, 1976; Burkman, Tate, Snyder, &
Beditz, 1981; Flanders, 1960, 1964, 1965, 1970 1970a; Haige & Schmidt, 1956;
Ostlund, 1956; Stalling 1976; Soar, 1968; Tuckman, 1970; Wispe, 1951). A
plethora of continuum labels were used by these researchers such as;
Progressive-Traditional (Bennett, 1976), Positive reinforcement model versus
Open structure model (Stalling, 1976), Directive-Permissive (Haige & Schmidt,
1956; Ostlund, 1956; Wispe, 1951), Direct-Indirect (Flanders, 1960, 1964, 1965,
1970a, 1970b; Soar, 1968), and Direct-Indirect {from the students' perceptions}
(Tuckman, 1970, 1976, 1995). All of these contlnua were based on a linear bi
polar model of teaching with one attribute on an extreme and its opposite on the
11

other extreme. All of these linear models used the pupils' achievement as one of
the criteria for determining teacher effectiveness, but the models, except
Tuckman, used expert observers. They did not recognize nor use pupil
perceptions of teacher behaviors/styles. Since there is limited agreement
concerning the concept of teacher style/behaviors, this research will discuss the
seminal researchers in the literature through the perspective of interpersonal
teaching behaviors.
Bennett (1976) identified teaching styles on a continuum with traditional on
one pole and progressive on the other pole, with intermediate styles located in
between these poles. Traditional/Progressive was operationally defined by
Bennett by using a continuum with eleven descriptors which were bipolar in
nature.
The eleven descriptors for the traditional pole are; 1) separate subject matter, 2) teacher as distributor of knowledge, 3) passive pupil role, 4) pupils have no say in curriculum planning, 5) accent on memory, practice, and rote, 6) external rewards used, 7) concerned with academic standards, 8) regular testing, 9) accent on competition, 10) teaching confined to classroom base, and 11) little emphasis on creative expression. The eleven descriptors for the progressive pole are: 1) integrated subject matter, 2) teacher as guide to educational experience, 3) active pupil role, 4) pupil participate in curriculum planning, 5) leaming primarily by discovery techniques, 6) intrinsic motivation, 7) not too concerned with conventional academic standards, 8) little testing, 9) accent on cooperative group work, 10) teaching not confined to classroom base, and 11) accent on creative expression. (Bennett, 1976, p. 38)
The traditional descriptors: (1) separate subject matter, (2) teacher as
distributor of knowledge, (3) passive pupil role, and (4) pupils not being involved
in curriculum planning are congruent with the descriptors for the leadership scale
12

on the interpersonal teaching behavior model. The descriptors: (1) accent on
memory, practice, and rote, (2) using external rewards, (3) being concerned with
academic standards, (4) regular testing, (5) accent on competition, (6) teaching
confined to the classroom, and (7) little emphasis on creative expression fall
within the parameters of the strict scale on the interpersonal teaching behavior
model. The progressive descriptors: (1) integrated subject matter. (2) teacher as
guide to educational experience, (3) active pupil role, and (4) pupils are involved
in curriculum planning are similar to the descriptors for the student
responsibility/fi"eedom scale on the interpersonal teaching behavior model. The
descriptors: (1) learning primarily by discovery techniques, (2) Intrinsic
motivation, (3) not too concerned with conventional academic standards, (4) little
testing, (5) accent on cooperative group work, (6) teaching not confined to
classroom base, and (7) accent on creative expression fall within the parameters
of the uncertain and student responsibility/freedom scales on the interpersonal
teaching behavior model. This linear bi-polar continuum is restricted and does
not enable the researcher to assess all the interpersonal teaching behaviors
which are correlated to student achievement, such as admonishing, dissatisfied,
helpful-friendly and understanding behaviors.
In the Bennett (1976), study the students were pretested and post-tested
In the areas of mathematics, reading and English. The tests focused on
assessing students' mastery of materials on the lower levels of Bloom's
taxonomy in the areas of knowledge, comprehension, and application. In the
reading area, Bennett found that the students taught under a traditional teaching
13

style achieved .5 standard deviations above their predicted scores, which were
determined by their pre-test. The mixed or intermediate teaching style was
associated with student outcomes of a 1.0 standard deviation above their
predicted scores. The students taught under the progressive teaching style
under performed by -1.5 standard deviations when compared to their predicted
score.
In the area of mathematics, the students taught under the traditional
teaching style resulted in an achievement of 2.0 standard deviation above their
predicted scores. The students that were taught under the progressive and
mixed achieved at -1.5 and -1.0 standard deviations respectively below their
predicted scores.
In the area of English the results were similar, the traditionally taught
students exceeded their predicted scores by 1.5 standard deviation. Students
taught under progressive and mixed teaching styles under achieved by -1.2 and
.-3 standard deviations below their predicted scores.
Bennett's study also assessed student achievement at the creative
(synthesis) or higher cognitive realm and found no significant differences
between the pupils' achievement scores in the three differing teaching groups.
Bennett (1976) concluded that the traditional teaching style was more effective at
the lower cognitive levels, as the pupils taught under the traditional style teacher
out performed their progressively taught colleagues.
14

Direct versus Indirect Teaching Style
In Rosenshine's (1976) review of the research, he identified the
characteristics of the direct teaching model.
In the direct instruction, the lessons and workbook activities are supervised by the teacher, and there is little free time or unsupervised desk work. The teacher is the dominant leader of the activities, decides what activities will take place, and directs without giving reasons. Teacher questions tend to be narrow, pupils are expected to know rather than to guess the answer, and the teacher immediately reinforces and answers as right or wrong. The learning is organized around questions posed by the teacher or materials provided by the teacher, and it is approached in a direct and business manner. (Rosenshine, 1976, p. 365)
Because direct and indirect teaching are bi-polar, indirect teaching can be
operationally defined as occurring when the lessons and workbook activities are
controlled or directed by the students, and there is a great amount of free time or
unsupervised desk work. The teacher is not the dominant leader of the activities,
s/he does not decide what activities will take place, and directs only after giving
reasons for his/her decision. The teacher's questions tend to be broad, pupils
are expected to try to find the answer, and the teacher does not immediately
reinforce nor does the teacher identify an answer as right or wrong. The learning
is organized around questions posed by the students, and is approached in an
indirect and discovery oriented manner (Rosenshine, 1976).
Wispe (1951) found that there was not an overall difference in student
achievements in the directive and permissive teaching styles classrooms. Wispe
described the directive teacher section as,"... material-centered and highly
structured. The instructor defined the problem areas frequently, he asked many
15

drill-type specific questions, and lectured at long length on course-related
materials"(p. 168). These descriptors fall within the interpersonal teaching
behavior model scales identified as leadership and strict. Wispe also identified
the permissive section as, "...student-centered and activity-centered. The
representative permissive instructor asked many wide-open and reflective-type
questions" (p. 168). These behaviors identified by Wispe fall within the student
responsibility/fi'eedom scale of the interpersonal teacher behavior model. These
types of teaching styles were ftjrther classified as a type of teacher-centered or
student-centered teaching style continuum (Anderson, 1959). The type of
classes utilized in the Wispe study were introductory college courses on social
relations. Wispe analyzed two independent variables, the first administration of
pre-test and the SAT scores were compared to the dependent variable of the
second administration of the pre-test, now the post-test. The finding of the Wispe
study was," When analyzed in this way none of the F ratios were significanf (p.
170). Wispe then divided the students into high and low ability groups and he
reanalyzed the post-test. From this analysis Wispe was able to determine, "that
although teaching methods make no significant difference in the final
examination scores of the brighter students, the scores on the post-test of the
poorer students were significantly raised by directive-type instruction" (p. 170).
Similar findings were found in operational replicates of the Wispe study. The type
of teaching style was not significantly correlated to the students' outcome as it
was measured by achievement (Haige & Schmidt, 1956). Ostlund (1956) found
16

that the lower ability or the lessor prepared student seemed to benefit ft"om direct
teaching.
The instrument Flanders (1960) developed to assess the Direct or Indirect
styles of the observed teacher was the Flanders Interaction Analysis Category
(FIAC). This was one of the first attempts to quantify the operational definition of
the terms direct and indirect teaching styles using expert outside observers.
Flanders asserted that teachers' teaching styles could be arranged on a
continuum with indirect on one end and direct on the other end. He further
contended that teaching style could be operationally defined by a set of
characteristic verbal behaviors and that these behaviors could be manipulated
into a ratio of direct scores to indirect scores. The indirect score is obtained by
counting the frequency of occurrences in categories 1, 2, 3 and 4, the direct
scores are obtained by counting the fi'equency of occurrences in categories 5, 6
and 7 in the FIAC (Flanders, 1960). Flanders (1960) "...assumed that different
types of statement will either increase or decrease the number of alternative
actions available to the student" (1960, p.11). This led to his identification of
indirect teaching styles as the indirect value divided by the direct value and if that
ratio was greater than one, then the teacher was described as using an indirect
teaching style, conversely if the number was under one the teacher was
identified as using a direct teaching style. This led to Flanders identifying direct
and indirect teaching styles as direct and indirect influence. Flanders defined
direct influence as "...a teacher restricts the fi-eedom of action of a student by
setting restraints or focusing his attention on an idea" (1960, p. 12). This
17

definition is similar to the descriptors in the leadership scale of the interpersonal
teacher behavior model. Flanders (1960) defined indirect influence," a teacher
increases the freedom of action of a student by reducing restraints or
encouraging participation" (p. 12). This definition comparable to the descriptors in
the student responsibility/freedom scale of the interpersonal teacher behavior
model. Flanders (1964) used the FIAC in New Zealand and found that the
indirect teaching style was associated with higher student scores in the two types
of classes in the study, 7th grade social studies and 8th grade science classes.
Contrary to Wispe (1951), Flanders' findings supported the conclusion that the
indirect teaching style is more effective than the direct teaching style and that
there is a linear relationship between teaching style and pupil outcomes.
This conclusion was contradicted partially by the findings in the Soar
(1968) study and completely by Bennett's (1976) findings. Soar (1968) found
evidence of a curvilinear relationship between teaching styles and lower cognitive
pupil outcomes, with both extreme indirect and direct teaching styles being
related with lower cognitive outcomes, but the mixed teaching style was related
with higher cognitive outcomes. There was also evidence of a linear relationship
between indirect teaching style and higher level cognition in the students. There
was a modest relationship (exact statistic was not reported by Soar) between
indirect teachers and students with low anxiety levels, for any other type of
student there was not a significant relationship between teaching style and
student achievement (Soar, 1968). Soar utilized Flanders Interaction Analysis
18

instrument to operationally define the terms direct and indirect teaching styles.
According to Soar,
What appears to be clear is that when the objective is the learning of concrete material such as spelling, the multiplication table, or foreign language vocabulary, the teacher should be quite direct and highly structured in his presentation; but when the objective is an abstract one, such as the concept of conservation in children, or new math, or creative writing on older pupils the teacher should be highly indirect. The effective teacher must be able to shift style as he shifts objectives. (1968, p. 279)
Both of these studies used the FIAC as the basis for assessing teacher
verbal behaviors in the classroom. Because the FIAC uses only two scales
(leadership and helpful/fiiendly) of the model of interpersonal teacher (QTI)
behaviors to assess teacher verbal behaviors as ascertained by outside expert
observers, it is inefficient in ascertaining the depth and breath of the
interpersonal behaviors occurring in the classroom as perceived by students.
This could account for the contradictory results between Flanders' (1964) and
Soar's (1968) studies. The lack of agreement between the Bennett (1976) and
Flanders and Soar studies is an expected result since there were differing
operational definitions of teacher behaviors/styles in these studies. This is
another indicator of the need for using the interpersonal teching behaviors model
which is bi-directional to establish a framework for the study of teacher
interpersonal teaching behaviors/styles.
Tuckman (1970) developed an instrument designed to assess the
directness or indirectness of teaching styles. This instrument was a radical
departure fi'om the aforementioned approaches to assessing the teacher's style
19

in that the observers were the teacher's students and not outside professional
observer(s) or outside professional educator(s).
The Tuckman (1970) study consisted of twenty-two eleventh and twelfth
grade teachers from a vocational high school. One-half of the teachers taught
vocational subjects and the other half taught traditional academic courses. All of
the teachers had at least five years teaching experience. This factor eliminated
one of the identified confounding variables of previous research, inexperienced
versus experienced teachers. The reliability of the Students Perception of
Teacher Style (SPOTS) was established by comparing the mean SPOTS score
of each item with the grand mean SPOTS score of each teacher. Each item was
a statement that was concerned with student perceptions of the directness of the
teachers actions. Student perceptions of each item statement was assessed on
a 1-9 Likert scale. Students responded by assigning a score of 1 to 9 for each
item statement that was reflective of their perceptions. All 22 student responses
were added together and that sum was divided by 22. The lowest score possible
was 1 and the highest score possible was 9. Then all student responses were
added together and divided by that classes 'n' number to obtain a class SPOTS
means. A score of one on the SPOTS was reflective of totally indirect teaching
behaviors in the opinion of that teacher's student raters. A score of nine on the
SPOTS was reflective of totally direct teaching behaviors in the opinion of that
teacher's student raters. Twenty-five of the thirty-two items were found to be
highly significantly related and they were retained to form the final version of the
SPOTS instrument. Deviations are rated by their distance from the class mean
20

SPOTS score. The first deviation is the closest individual SPOTS score to the
class SPOTS mean, the second deviation is the second closest individual
SPOTS score to the class SPOTS mean. The inter-rater reliability ranged ft-om
an r of .98 for the first deviation to an r of .69 for the tenth deviation. This
established that the instrument would produce approximately the same result
without regard to the individual student conducting the assessment. This
instrument provided the basis for a new operational definition of the variable
direct and indirect teaching style. The nearer the teachers' scores are to the
value of one, the more indirect the teachers are in their teaching styles.
Conversely, the higher the score, the nearer to the maximum score of 9 a
teacher is the more direct the teaching style.
The major deficiency of the SPOTS scale is that it is a linear model for one
teacher trait, directness or indirectness of teaching style. Tuckman's (1970)
study introduced the instrument, but Tuckman does not relate the teacher's
teaching style to students' academic outcomes. The major accomplishment of
this study was that it validated the usage of student observers instead of expert
outside observers. In doing so this study was foundational in introducing student
perceptions into the educational research arena.
The Rothman (1969) study was an investigation into the preparation of the
teacher in his/her field and its correlation to the students' learning outcomes.
Here the author identified student outcomes by cognitive and affective attributes.
The findings in the cognitive realm of investigation indicated a significant
correlation between the teacher's preparation and the pupils' cognitive outcomes.
21

This relationship was found to be significant without regard to the type of
teaching style utilized by the teacher. The primary importance of the Rothman
study was the finding of the significant overall relationship between teacher
background and students' learning variables. Students' Physics Aptitude Test
(PAT) was significantly correlated to teachers' number of semester hours of
college physics. The students' scores on the Academic Interest Measure,
Physical Science (AIM PS) were significantly correlated with teachers' semester
hours of college level physics classes. Teachers' number of college math
semester hours were significantly correlated with students' scores on the Test On
Understanding Science (TOUS) and the PAT. The teachers' number of math
courses was also positively correlated with the students' AIM PS scores.
Teachers' scores on the Test of Selected Topics in Physics (TSTP) were
negatively correlated with the students' feeling of "Physics: Interesting." The
TSTP was positively correlated with the students' scores on the TOUS. Lastly
teachers' physics teaching experience was correlated to the students' PAT. This
study indicated that teachers' semesters of preparation and years experience
could be confounding variables in teacher interpersonal teaching behavior
studies and their relationship to student outcomes.
In the affective realm, Rothman (1969) found that teachers' attitudes were
a significant predictor of changes in students' attitudes. The relationship is
positive and reflective. If the teacher projects the attitude that physics is
important and easy to learn, students will project the same attitude toward
physics. The teacher's projection that physics is understandable is significantly
22

correlated to students finding that physics is easy. Rothman (1969) concluded,
"In general the results indicate that students acquire more knowledge about
physics when taught by teachers with more extensive preparation in physics,
physics education, and mathematics with greater knowledge of physics and
longer physics teaching experience" (p. 347). This led to the conclusion that two
other variables which impact on teacher effectiveness would be the teachers'
academic preparation in their field and their experience level in that particular
subject. These factors have to be controlled in order to clarify the relationship
between teaching behaviors that are occurring in the classroom and cognitive
and affective student leaming outcomes.
While Soar (1968), Bennett (1976), and Tuckman (1970) conducted
research on the linear model of teaching methodology, Flanders and Brophy
were concurrently working on the stability of the teachers' behavior. If the
teacher's teaching behavior Is not stable over a sufficient time frame then the
linear model would not be able to explain the learning outcomes of the students
(Brophy, 1973; Flanders, 1970). In the Flanders (1970) study data, from New
Zealand and Minnesota provided evidence to support the hypothesis that, "once
the teacher has established a pattern of direct or indirect teaching this pattern will
be stable the following year with completely different students" (p. 223).
Brophy (1973) investigated the question, 'Are there any stable teacher
behaviors?' The study used ordinary teachers in their classrooms without an
experimental intervention. The teachers' behaviors were identified and then
used to sort teachers into categories. Brophy used the Metropolitan
23

Achievement Test (MAT) to identify the students' achievement with the 1st grade
as the baseline, and the scores fi^om the 2" , 3"*, and 4^ grades for comparative
purposes. The students' achievement scores were used as an indicator of the
teacher's effectiveness. The baseline score was then used as a covariant and
from that point the other grade scores were converted to Grade Equivalent
Levels (GEL) and the residual scores were calculated. Brophy found that the
teacher's behaviors and effectiveness were stable across the three years this
study was being conducted. Both Brophy (1973) and Flanders (1970) studies
established that there were specific, identifiable teacher behaviors, which were
stable In the time frame of multiple school years.
Veldman and Brophy (1974) investigated the predictive value of a series
of variables on the criterion variable, pupil achievement. The selected predictor
variables were: (1) gender, (2) pre-tests, (3) teacher behaviors and (4) SES. The
pupils' genders were found to be an extremely weak predictor although Veldman
and Brophy observed that giris significantly outperformed the boys in both grade
levels. The pretest was the most powerful indicator of success with the teacher's
behavior the second most powerful indicator of pupil success in the classroom.
The pupil's SES status was not significantly con elated with student success.
Veldman and Brophy also contradicted the Rosenshine (1970) study,
which found that there were not any stable teacher behaviors. Rosenshine's
teacher sample included teachers who were in their first year of teaching and
teachers who were in the first year of teaching a new grade level. Veldman and
Brophy argued that the inclusion of these types of teachers into the Rosenshine
24

study resulted in the skewing of the data and caused Rosenshine to erroneously
conclude that teacher behaviors are inherently unstable. Veldman and Brophy
found, "...that reasonable stable estimates of teacher influence can be obtained
from standardized achievement measures when the sample selection procedures
eliminate new teachers and teachers who have recently switched grades (1974,
p. 323). Brekelmans, Holvast, and van Tartwijk, (1992) also found that teacher
experience and age were possible confounding variables, when researchers
were attempting to obtain stable estimates of teacher interpersonal teaching
behaviors and their effects on student cognitive and affective learning outcomes.
In the Good, Biddle, and Brophy (1975) work, Teacher's Make a
Difference, the authors argued that the use of transformed pretest scores as a
covariant was preferable to using the students' raw pretest scores. The raw
pretest scores were transformed into z-scores and then used as a covariant.
These raw scores would be subject to the moderating variable of the amount of
potential gain (A. Oliveraz, personal communication, June 1996). This
moderating variable, which represents the amount of potential gain, occurs
because the students who scored near the top end of the scale on the pre-test,
do not have the same opportunity of achievement as a student who scored at the
mean or less on the pre-test (A. Olivarez, personal communication, June 1996).
This is supportive of the recommendation of Good and his colleagues to utilize
pretest/posttest or repeated measures design. According to Good et al., "The
usage of the repeated measures model will eliminate the problems of raw scores
25

and gain scores, because the students' pre-tests will be used as a covariant" (p.
41).
Stallings (1976) study was another attempt to determine which types of
teaching methodologies were more efficient, direct or indirect teaching. The
Stalling's paper was a study of the 22 Follow Through educational programs;
seven were identified for fijrther study. In this study, the term follow through
group is analogous with the term longitudinal treatment group. Two of the seven
programs were identified as following the direct teaching or positive
reinforcement models and the other five programs were identified as indirect or
open structure models. A total of 136 first-grade and 137 third-grade classrooms
were observed in 36 different cities and towns. The comparison group, non-
follow through (non-treatment) classes, was identified and one class in each of
24 different locations was included in the study. Stallings found, "classroom
instructional processes predicted as much or more of the outcome score
variances than did entering school test scores of children" (p. 47). From these
findings Stallings developed the conclusion that, "...what occurs within the
classroom does contribute to achievement in basic skills, good attendance and
desired child behavior" (p. 47).
Stallings' (1976) findings in the area of comparative efficiency were a
mixed set of results. In the areas of reading and math achievement, the students
that were taught by teachers using the direct or positive reinforcement models
scored significantly higher than all of the indirect or open structure models. The
positive reinforcement model's student scores were also statistically significantly
26

higher than the comparison group's student scores. In the area of nonverbal
problem solving, the students that were taught under the open structure models
scored significantly higher than the students that were instructed in the positive
reinforcement models. These findings reinforced Soar's (1968) conclusion in
which he proposed that there was a curvilinear relationship between the lower
levels of cognition and the indirectness or directness of the teacher's teaching
style. Soar also proposed that the seemingly linear relationship between higher
order learning and Indirect teaching was because the teacher was not yet at the
optimal indirect teaching level for the higher cognitive level. Stallings (1976)
provided evidence that there is a linear relationship between the higher cognitive
levels and the teacher's indirect or open structure teaching style. Whether the
relationship is actuality curvilinear is still an unanswered hypothesis.
Deployment of Key Teaching Competencies and Teacher Effectiveness
The identification of certain teacher behaviors as stable and as
significantly correlated to student outcome led to the identification of key teacher
competencies. This was the area Medley (1977) investigated.
Medley (1977), investigated the central question, "How does the behavior
of effective teacher differ from that of Ineffective teacher?" (p. 5). Medley
reviewed 289 studies to ascertain the "relationship between how a teacher
behaves and how much the pupils learn fi^om him or her, commonly called
process-product relationship" (p. 5). Medley's basis for understanding the
27

concept of teacher competencies was to utilize the measurement of teacher
effectiveness as an indicator of teacher competence. According to Medley, "...we
shall use the measure of effectiveness as an indicator of teacher competence,
inferring that teachers who are effective are more competent on the average than
teachers who are ineffective" (p. 6). Medley further distinguished between
teacher competency and teacher effectiveness by identifying, "competence has
to do with how a teacher teaches and is measured in terms of the teacher's
behavior; how effective a teacher is is measured in terms of pupil learning" (pp.
6-7). This led Medley to "...view the behavior of the teacher as an effect rattier
tfian a cause" (p. 7). This led to the conclusion that a competency is a behavior
which is strongly associated with teacher effectiveness (Medley. 1977).
The Texas Education Agency used general teacher competencies as a
basis for the evaluation rubric assessing teaching professionals. These
competencies are divided into five categories: (1) learner-centered knowledge,
(2) learner-centered instruction, (3) equity in excellence for all learners, (4)
learner-centered communication and (5) learner-centered professional
development (Texas Education Agency, 1995). First, learner-centered
knowledge is predicated on teachers being well grounded in the subjects taught
and on the ability of the teachers to facilitate the learners' development of
patterns of studying. Second, leamer-centered instruction is based on the
teachers being able to manage their classrooms from the perspectives of the
individual leamers, groups of learners and physical material necessary for
learning to occur. These first two competencies reflect the works of Kratz (1894),
28
Charters and Waples (1929), Barr and Emans, (1930), Soar, (1968), and
Flanders (1970).
The next competency, equity in excellence for all learners, is a relatively
new factor grounded in the premise that all students can learn. Predicated on
this premise is the assertion that all students will be given the opportunity to learn
and excel in the school system. The fourth competency is related to eariier
research (Banr & Emans, 1930; Charters & Waples, 1929) in the area of effective
communication between the teachers, and the families, fellow professionals and
the public. The reflective portion of this competency, "because the teacher is a
compelling communicator, students begin to appreciate the important of
expressing their views cleariy" (TEA, 1995, p. 7), is itself reflective of Kratz's
(1894) finding, that "... children are highly susceptible to such impressions of
taste and neatness..." (p. 416) Kratz concluded that, "...pupils are generally more
appreciative of the earnest and intelligent efforts of their teacher to training and
develop them..." (p. 415). Both of these conclusions are supportive of the Texas
Education Agency's utilization of learner-centered communication. The last
competency, leamer-centered professional development, places teachers in the
status of learners as they further develop the knowledge of their subject matters
and various teaching methodologies.
29

Holistic Communication Analysis and Teacher Effectiveness: Interpersonal Teaching
Behaviors and Pupil Achievement
In the late 1970's the emphasis on research into teacher effectiveness
changed toward the quest to develop an understanding of the impact of the
teacher's interpersonal teaching behaviors on pupil achievement. At the same
time, the understanding that the student was an active participant in his/her
learning was incorporated into the interpersonal teaching behaviors model. The
interpersonal teaching behavior model rests on two theoretical frameworks,
Leary's communication theory (1957) and Watzlawick, Beavin and Jackson's
human communication theory (1967).
Theoretical Frameworks
Leary's Communication Theory
The Leary (1957) model was developed to describe and measure specific
interpersonal behaviors, primarily In a therapeutic setting. The Leary model was
developed to measure both normal and abnormal behavior on the same scale,
and it therefore can be applied both inside and outside the clinic (Wubbels,
Creton, Levy. & Hooymayers, 1993). The Leary model identifies personality as
the controlling factor in interpersonal behavior. In addition to the informative
functions of communication, the Leary model recognizes that people use
language or other forms of communication to accomplish two affective goals.
The first goal is to avoid anxiety and the second goal is to feel good about
themselves. The model further recognized that different persons will use
30

different methods to achieve the two goals. The methods available are as
numerous as the human personality; a person could use dominance or
submission and/or cooperation or opposition behaviors to obtain his/her goals.
Watzlawick. Beavin and Jackson's human communication theorv
Watzlawick and his colleagues (1967) adapted Leary's (1957)
communication theory to the field of family and marriage therapy. The premise
remained the same, that persons communicate in the manner that lets them feel
good about themselves and lowers their anxiety level. The primary difference
between Leary's model and Watzlawick et al.'s model is the level of focus. In
Leary's model, the focus is individual to individual communications in an isolate
setting, whereas in Watzlawick et al.'s model the focus is on individual or multiple
communications in a group/family setting.
Interpersonal Teacher Behaviors
Using the Leary model as a template Wubbels, Creton, and Hooymayers
(1985) developed a model for interpersonal teacher behavior. The term
interactional aspect of teacher behavior, which is synonymous with the term
interpersonal teacher behavior, was operationally defined as,"... behavior that
refer to the relationship between the teacher and his students and which is
expressed in the interaction between the personal communication in the
classroom" (Wubbels et al., 1985, p. 3).
31

Wubbels et al.'s model for interpersonal teacher behavior directly adopted
the two-dimensional plane with 'Influence' on the vertical axis and 'Proximity' on
the horizontal axis.
The model maps interpersonal behavior with help of an influence-dimension (Dominance-Submission) and a proximity-dimension (Cooperation-Opposition). These dimensions are equally divided into eight sectors. Every instance of interactional teacher-behavior can be placed within the system of axes. The closer the instances of behavior are placed in the chart, the closer they resemble each other (and the more similar are their effects on the students). (Wubbels et al., 1985, p. 3)
OD: Strict DC:Leadership
OD: Admonishing CD:Helpful/Friendly
OS: Dissatisfied CS: Understanding
SO:Uncertain SC:Student responsibility/freedom
Figure 1.
Model For Interpersonal Teaching Behavior
This adaptation of the Leary (1957) model resulted In the eight sections,
two in each quadrant in upper right; dominance-cooperation and cooperation-
dominance, lower right; cooperation-submission and submission-cooperation
32

and, lower left; submission-opposition and opposition-submission and the upper
left; opposition-dominance and dominance-opposition. Each of these sections in
the model are identified by a specific teacher characteristic, these names are as
follows: leadership, helping/friendly, understanding, student
responsibility/fireedom, uncertain, dissatisfied, admonishing and strict.
The Wubbels's (1985) model on interpersonal teaching behavior was not
predicated on the assertion that one teacher behavior was the cause of student
achievement. This was a break from the previous literature which attempted to
place all teacher behaviors on a bi-polar, linear continuum (see Flanders, 1960,
1964. 1965, 1970 1970a; Haige & Schmidt, 1956; Stalling 1976; Soar, 1968;
Tuckman, 1970). Instead, the Wubbels's model recognized that the teacher
behavior will consist of all of the aforementioned characteristics identified by the
learners. The linear models were inefficient in assessing all the behaviors
present in a student-teacher interpersonal interaction. In addition, Wubbels's
model recognized as important the teacher trait of stability as identified by
Brekelmans (1989). Prior research (Brophy, 1973; Veldman & Brophy, 1974)
also had established that quantifiable teacher traits were stable across years and
grades. Except for the first few weeks of the school year, a teacher's
interpersonal teaching style is stable across years and classes. Wubbels (1992)
challenged the assertion of teacher stability but because this study is a
correlation study teacher stability is not of paramount Importance.
These findings led Wubbels and his colleagues to develop the
Questionnaire on Teacher Interaction (QTI) to assess student perceptions of their
33

teacher's interpersonal teaching behaviors. Each of these model sections have a
number of items statements on the Questionnaire on Teacher Interaction (QTI)
associated with it. Students respond to the item statements of the instrument on
an A-E Likert scale, an A is scored as a 4 and it signifies strong agreement with
the Item and an E is scored as a 0 and it signifies strong disagreement with the
item. Scale scores are then constructed by adding all the item scores for a scale
and dividing by the number of item statement, this results in a ratio score
between 0.00 to 1.00. "The higher the score in a sector the more significantiy or
frequently the behavior of the sector Is displayed" (Wubbels et al., 1985, p.5).
Several studies were conducted to ascertain the validity and reliability of the QTI.
These studies were conducted in The Netheriands, in Singapore and in Australia.
As a result of these studies, Brekelmans (1989) calculated an item internal
consistency of greater than .70 on the individual level and an item internal
consistency of greater than .80 on the class level. A determination of its
reliability was calculated using Cronbach's alpha using student answers as
repeated measures with a result of .92 (Brekelmans, 1989). In her study
Brekelman used a test-retest procedure to ascertain if the QTI was reliable. The
result of a repeated measures coefficient of .92 Is also evidence that student
perceptions of teacher interpersonal teaching behaviors are stable across time.
A value of .80 or higher is considered adequate for internal validity. Brekelmans'
(1989) research also ascertained that the two factors, influence and proximity,
accounted for approximately 80% of the variance on all the scales. The QTI can
be completed by the students as an evaluation of teacher behavior, or the QTI
34

can be used by the teachers to self-report their behavior or identify their 'ideal'
teaching behaviors. "Using this instrument, interactional teacher-behavior can be
examined empirically. It is also suitable for giving feedback to teachers regarding
their behavior" (Wubbels et al., 1985, p. 5).
Wubbels and Levy (1989) conducted a comparative study of the Dutch
version and the derived American version of the QTI. Both the Dutch and
American version utilized students to measure aspects of the learning
environment. The QTI was translated from the Dutch to English with an added
precaution that, "the translation of the items were checked with a back-
translation by an independent second translator" (Wubbels & Levy, 1989, p. 4).
The original American version contained one hundred items from the original
seventy-seven items in the Dutch original version. This increase in items was
caused by more than one possible translation fi^om several Dutch items. The
American version was then inspected by Wubbels and Levy to ascertain if it was
still in accordance with the original Leary (1957) model. According to the Leary
model, "an item should correlate highest with the scale to which it belongs and
lowest with the opposite sector"(Wubbels & Levy, 1989, p. 4).
Thirty-three items were removed from the original one hundred American
Items because they did not correspond to the parameters of the assumptions of
the Leary model. The second version was field-tested and two more items were
eliminated due to the same psychometric concerns. The final American
instrument consisted of sixty-five items. Of these items, fifty-nine were direct
translations of their respective Dutch items. A series of item analyses were
35

conducted to ascertain the American instrument's reliability. Seven of the eight
section's reliabilities were above .90 and the other section's reliability was
calculated to be .86. These values far exceed the minimal value of .60, which
has historically been identified as the value at which the researcher does not
attempt further improvement in the research instrument (Wubbels & Levy, 1989).
These values also exceed the threshold for utilization in tests that will influence
decisions about individuals (Wubbels & Levy, 1989). In a factor analysis the
variation accounted for by the two factors, influence and proximity, was
calculated to be 88.3% (Wubbels & Levy, 1989). From this data and analysis, "it
can be concluded that the reliability of the American QTI is good and that there is
some confirming evidence about the validity of the new instrument" (Wubbels &
Levy, 1989, p. 8).
Brekelmans, Wubbels, and Creton (1990) used the Questionnaire of
Teacher Interaction (QTI) to investigate the question, "is there a correlation
between student perception of teacher behavior and cognitive and affective
outcomes In the context of a physics curriculum?" There were two types of
physics curriculum in The Netheriands, the traditional curriculum and the PLON
curriculum. PLON is a Dutch acronym for, Dutch Physics Curriculum
Development. The traditional curriculum was designed for students who were
going to complete physics in their college. The content was reflective of a
simplified and dated university physics course. The course did not emphasize
the practical aspects of physics and the students were not required to conduct
any laboratory exercises (Brekelmans, Wubbels and Creton, 1990). The newer
36
curriculum PLON was developed to, "create curriculum materials that stimulate
activity learning, reality learning and participation learning" (Brekelmans et al.,
1990, p. 338).
Cognitive outcomes were measured with a standardized and
internationally developed test for physics subject matter. The researchers did not
delineate the standardized test used in this research by cognitive nor affective
levels of complexity. The test's validity was established by a high correlation
between the teachers' in-class students' grades and the students' scores on the
standardized physics test. The Dutch secondary educational school system is
stratified into three academic levels. The MAVO school type is the general
secondary educational situation at the intermediate level. The HAVO school type
is the general secondary education situation at the higher level and the WVO
school type is secondary level education in preparation for university studies
(Brekelmans et al., 1990). "Further corroboration of the validity is obtained fi'om
the fact that the levels of the students abilities of the three school types are
represented in the test scores (on a scale 0-100): MAVO 70, HAVO, 76, VWO
81" (Brekelmans et al., 1990, p. 339).
The student's affective outcomes were ascertained by utilization of a
questionnaire that targeted five areas of interest. These areas were represented
by five scales: "appreciation of lessons, instructiveness, easiness, structuredness
of lessons and subject matter and motivation for physics" (Brekelmans et al.,
1990, pp. 340-341). The affective instrument is still in the Dutch language and
has not been translated using the procedures discussed eariier. The researchers
37

discovered that there was no significant difference between the two groups
(PLON and revised PLON) in regard to the students' cognitive and affective
learning outcomes. There was a significant difference found between student
perceptions of their teachers as assessed by the QTI interpersonal teaching
behavior scales and student cognitive and affective learning outcomes.
In the cognitive domain, the teacher's interpersonal teaching behavior, for
the section dominant-opposition was significantiy correlated to cognitive
achievement at +.39 and the submission-opposition section was significantiy
correlated to cognitive achievement at -.38. The other six teacher interpersonal
teaching characteristics were not significantiy correlated with student cognitive
outcomes. The cognitive domain was not divided by cognition levels and the
study did not address possible differences in significance and correlation as it
pertains to the various cognition levels.
When the data in the Brekelmans et al. (1990) study were examined to
ascertain which of the stimuli, interpersonal teaching behavior or type of
curriculum utilized in the classrooms were more closely correlated with students'
cognitive outcomes, the conclusion supported by the data was that Interpersonal
teaching behaviors were significantly correlated with cognitive outcome. The
same study found the differing types of curricula were not significantiy associated
with the students' cognitive outcomes.
In the affective domain, the teacher's interpersonal teaching behavior was
significantiy correlated with the multiple affective outcomes, appreciation of
lessons, instructiveness, structuredness, and motivation for physics. In the
38

section dominant-cooperation, this type of interpersonal teaching behavior was
positively correlated with appreciation of lessons (AP), instructiveness (IN),
structuredness of lessons and subject matter (ST) and motivation for physics
(MO). These con-elations were found to be significant. In the section
cooperation-dominant, this type of interpersonal teaching behavior was again
significantly positively correlated with appreciation of lessons (AP),
Instructiveness (IN), structuredness of lessons and subject matter (ST) and
motivation for physics (MO). In the section cooperation-submission, this type of
interpersonal teaching behavior once again was significantiy positively correlated
with appreciation of lessons (AP), instructiveness (IN), structuredness of lessons
and subject matter (ST) and motivation for physics (MO). The next section
submission-cooperation, exhibited a type of interpersonal teaching behavior that
was significantiy positively correlated with only appreciation of lessons (AP), and
easiness. The other three types of affective outcomes, instructiveness (IN),
structuredness of lessons and subject matter (ST) and motivation for physics
(MO) were not significantly correlated toward a submissive-cooperative
interpersonal teaching style. The section of interpersonal teaching style
identified as submission-opposition was not significantiy correlated to any of the
students' affective outcomes. The sixth section under consideration, opposition-
submission interpersonal teaching behavior was significantly negatively
correlated with all the affective student outcomes. The section identified as the
opposition-dominant interpersonal teaching style was significantiy negatively
correlated with appreciation of lessons (AP), instructiveness (IN), and
39

structuredness of lessons and subject matter (ST). The last section dominant-
opposition was negatively significantiy correlated with easiness, but all other
student affective outcomes were not significantiy correlated. These findings led
to a general observation that a teacher's interpersonal behavior, which falls to the
right of the Influence factor, will be correlated with positive affective student
outcomes and those interpersonal teaching behaviors which fall to the left of the
influence factor will be negatively with positive affective student outcomes. While
the line of effectiveness for the cognitive realm is rotated 45 degrees counter
clockwise of the "y" axis that has been identified as the dominant-submission
axis. This leads to a dilemma for the teacher because the most effective areas of
interpersonal teaching behaviors for the cognitive and affective domain are mildly
contradictory. The way out of this dilemma might be found through the
comparison of the teachers' ideal teacher and the students' best teacher. The
interpersonal patterns on the two-way matrix are very similar. Perhaps, the
students value the cognitive outcomes more than their affective outcomes.
These data from the Brekelmans, Wubbels, and Creton, (1990) study led
to the conclusion that the teacher leadership is positively correlated to positive
cognitive outcomes. The dominant-cooperation (DC) section was also positively
correlated to increases in four affective sets which are Appreciation of Lessons,
Instructiveness, Structuredness of Lessons and Subject Matter and Motivation.
The other affective set was not significantiy correlated. The other section related
to DC the cooperation-dominant (CD) section was significant in all the same
affective sets as was the DC section but, CD was found not to be significant with
40

cognitive outcomes. The next quadrant, cooperation-submission (CS) and
submission-cooperation (SC) were not significantly correlated with cognitive
outcomes. The CS section was significantiy correlated with the affective sets of
AP, IN, ST and MO. The SC section was significantiy conrelated with the affective
sets of AP and EA, all other pairs were insignificant. The next quadrant
submission-opposition (SO) was correlated with a negative cognitive outcome
while the opposition-submission (OS) set was not significantiy correlated to
cognitive outcome. The SO set was not significantiy correlated with any of the
affective sets, while the OS significantiy negatively correlated with all the
affective sets. In the last quadrant, opposition-dominant (OD) was not
significantiy correlated with cognitive outcomes while the dominant-opposition
(DO) set was positively correlated with cognitive outcomes. The OD section was
significantiy correlated with the affective sets of AP, IN and ST in a negative
manner. The DO section was significantly correlated with only EA and that is a
negative manner.
After closer examination of the results of the correlations of the teachers'
interpersonal teaching behaviors and the cognitive and affective learning
outcomes, it is apparent that
if the teacher's aim is to promote both student achievement [Cognitive] and attitudes [Affective], they are pulled in opposite directions by the conflicting demands of the sectors DO and SC. In order to promote higher achievement, teachers have to be stricter but, to promote better attitudes, they have to be less strict. (Wubbels et al., 1993, p.7)
This problem of contradicting needs of the students has been identified in
the literature but, a solution has not been offered.
41

Summarv: Interpersonal Teaching BehaviorsTheorv
The interpersonal teaching behavior model (Brekelmans, Wubbels &
Creton, 1990; Tuckman, 1976, 1995; Wubbels, Creton, & Hooymayers, 1985;
Wubbels, Creton, Levy, & Hooymayers, 1993) is predicated on the idea that
students perceive their teachers to exhibit certain behaviors through their
communication patterns of physical actions. Perceived Interpersonal teaching
behaviors are associated with student achievement. These perceptions are
individual in nature and each student acts on his/her perceptions. Student
perceptions of teacher leadership, strictness, helpful/friend and understanding
behaviors are related to positive student achievement. Student perceptions of
teacher increasing student responsibility/freedom, uncertainty, dissatisfaction,
and admonishing behaviors are related to negative student achievement.
Perceived Interpersonal teaching behaviors are also associated with
student affective learning outcomes. These perceptions are also individual in
nature and each student acts on their perceptions. Student perceptions of
teacher leadership, helpful/friend, understanding, and increased student
responsibility/fi'eedom behaviors are related to positive student affective learning
outcomes. Student perceptions of uncertainty, dissatisfaction, admonishing, and
strictness teachers behaviors are related to negative student affective learning
outcomes. Because the interpersonal teaching behaviors model is the basis for
42

the QTI, the QTI should be predictive of student achievement and affective
learning outcomes.
Bloom's Taxonomv of Educational Obiectives
Arguably, one of the most influential educational monographs of the past
half century is Bloom's (1956) Taxonomv of Educational Obiectives. The
Classification of Educational Goals. Handbook I: Cognitive Domain. Neariy forty
years after its publication in 1956 the volume remains a standard reference for
discussions of testing and evaluation, curriculum development, and teaching and
teacher evaluation (Anderson & Sosniak, 1994, vii). Bloom's taxonomy can best
be visualized as a pyramid. At the first level is knowledge, the second level is
comprehension, the third level is application, the fourth level is analysis, the fifth
level is synthesis and the sixth level is evaluation. The levels are also divided
into lower and higher levels. The low level consists of the first three levels,
knowledge, comprehension, and application. The high level consists of the level
four through six, analysis, synthesis, and evaluation.
Bloom's Taxonomy has been increasingly used by educators to classify
educational objectives since being introduced to the educational worid in 1956.
According to Bloom (1956),"... any objective which describes an intended
behavior should be classifiable in this system" (p. 14). Because the Taxonomy
and the objectives are congruent in their natures, they are both based on,"... the
classification of intended behaviors" (Bloom, 1956, p.13), the central question
becomes, 'Is the Taxonomy an internally consistent hierarchical stnjcture?' The
43

answer to that question Is a qualified yes (see Hill & McGrew , 1981; Hill, 1984;
and Kropp and Stoker, 1966).
First, the Taxonomy was examined philosophically to ascertain if it is
reflective of a particular theory of education or learning. As Bloom (1994)
acknowledged, he and the other authors were unable to identify a unifying theory
which would account for all the behaviors represented in the classifiable
educational objectives under study. This does not eliminate the Taxonomy from
consideration, as currently there is not a unifying theory that explains how
learning occurs in an educational setting. The disjointed nature of learning
theory Is reflected in the differences In the basic tenets that support the theories
of information processing, constructivism, and direct instruction. The first major
tenet of the information processing theory is that each student will process input
(information) from the teacher and build pathways to elaboratively place the
input in long term memory. The second tenet is that there is an objective reality
and student learning can be assessed using that reality. The first major tenet of
constructivism is that each student will process input (information) from the
teacher and build schemata to accomadate the information. The second tenet is
that there is not an objective reality and student learning can not be assessed
using that reality. The first major tenet of direct instruction is that each student
will absorb the information presented to him/her and the information will be
placed in memory without any elaboration or modification. The second tenet is
that there is an objective reality and student learning can be assessed using that
reality. Another consideration is the philosophical analysis of the Taxonomy. As
44

Furst (1994) noted, the taxonomy's claim to being value fi-ee is not considered
possible from a philosophical perspective. "Classifications tend to throw
emphasis on certain qualities and, in turn, to diminish the apparent significance
of other qualities" (Furst, 1994, p. 28). While this assertion has merit, it is not
critical to the use of Bloom's Taxonomy, because the authors of the taxonomy
expected each teacher to use the taxonomy to assess their students' abilities via
a series of intended learning outcomes. The use of a rigid, all-inclusive test
would be detrimental to education since the educator would be unable to
emphasize one objective over another objective. The educator would then either
have to construct enormous tests, which covered every type of objective or
develop a series of smaller more specific tests. The use of the latter option
would operationally recreate Bloom's taxonomy. It is the teacher's prerogative to
emphasize those objectives that he/she believes are the most valuable. Just as
It is the local/state educational establishment's duty to emphasize certain
objectives in their criterion tests. Another perceived philosophical deficiency is
the assertion of linearity of the various levels in Bloom's Taxonomy. The linear
assumption was attacked by the assertion that certain lower level objectives
could be more difficult to achieve than higher level objectives. This situation
could occur, but it is acknowledged that the difficulty of an item is not directiy
related to an item's cognitive level (see Bloom, 1956, 1994; Bloom, Hastings, &
Madaus, 1971; Furst, 1994; Kroop & Stoker, 1966; Madaus, Woods, & Nuttall,
1973).
45

The last area of examination is a empirical examination of the correlations
between the various levels of Bloom's Taxonomy. The most extensive analysis
of the hierarchical structure of Bloom's Taxonomy was reported by Kropp and
Stoker In 1966. All of the other statistical analyses of Bloom's Taxonomy have
consisted of the reanalysis of Kropp and Stoker's data.
Inherent in Bloom's (1956) Taxonomy hierarchy is that the levels proceed
from simple to complex, from knowledge to evaluation. As Bloom (1994) stated,
"... the hierarchical relations amoung the categories would enable users of the
taxomony to understand more cleariy the place of a particular objective in
relationship to other objectives" (p. 4). From this perspective each higher level
contains the lower cognitive levels in its functioning. Kropp and Stoker (1966)
found that the first four levels of Bloom's taxonomy were cumulative and
hierarchical in nature but that the constructs of synthesis and evaluation did not
perform as predicted. In two of the four tests used by Kropp and Stoker, the
synthesis and evaluation constructs were found in the area predicted by Bloom's
taxonomy. In the other two tests, the synthesis and evaluation questions were
found to be located between knowledge and comprehension in one test and in
the other test the synthesis questions were found in between knowledge and
comprehension (Kropp & Stoker, 1966).
Kropp and Stoker (1966) were concemed with the items that were present
in the tests to measure the constructs of synthesis and evaluation. They
believed that lack of clarity in the items were responsible for tiie mixed results.
The incorrect identification of items' hierarchical levels is a confounding variable,
46

which is addressed in this study. Since Kroop and Stoker (1966) confirmed the
relative placement of the first four levels of Bloom's taxonomy, knowledge
through analysis they concluded, "The evidence is more conforming than
disconfirming of the hypothesis" ( p. 84). Kropp and Stoker also noted that there
was not a statistical test, which could be used to support a clear decision as to
the hierarchical nature of Bloom's Taxonomy.
A series of researchers reanalyzed Kropp and Stoker's data using more
advanced and powerful statistical formula. Madaus, Woods, and Nuttral (1973)
reanalyzed the data using pathway analysis and they found that if general ability
is held constant, statistically Bloom's Taxonomy was hierarchical in nature. But,
the structijre was "Y" shaped with Knowledge and Comprehension forming the
base of the "Y". The structure then branches with Application and Synthesis on
one branch and Analysis on the other branch. The Evaluation level was not
supported in this model.
Hill and McGrew (1981) reanalyzed the data using the LISREL statistical
package. They found that the six level hierarchy proposed by Bloom was not
supported by their analysis, but if the knowledge level was removed the resultant
five level hierarchy was supported by the data. This is supportive of Bloom's
Taxonomy, which separated the knowledge level from the other five levels. Hill
(1984) later re-analyzed the data and inserted general ability into the model, but
using the LISREL analysis he found that general ability did not fit the data and he
rejected it as part of the hierarchy.
47

The last two categories synthesis and evaluation were found in differing
relationships with each other in Bloom's taxonomy but they were found to be at a
higher hierarchical level than the other four levels (Hill & McGrew, 1981; Hill,
1984). The synthesis and evaluation categories were found to be distinctive from
the lower levels of cognition, knowledge, comprehension and application. These
findings are supportive of this researcher's Intent to divide Bloom's taxonomy into
two categories, low and high. The theoretical reason for dividing the objectives
into higher and lower domain objectives was grounded in prior research (see
Bennett, 1976; Soar, 1968; Stalling, 1976; Wispe. 1951). Bennett (1976) found
differing achievement levels in his study that were related to teacher
behaviors/styles and the level of the objectives in the assessment instrument.
Soar's (1968) study found that the relationship between teaching styles and
student outcomes would be curvilinear for the lower cognitive levels with both
direct and indirect styles con-elated with lower cognitive learning outcomes and
the mixed teaching style correlated with higher cognitive learning outcomes.
Stalling's (1976) study found that in the areas of reading and math achievement,
the students that were taught by teachers using the direct or positive
reinforcement models scored significantiy higher than all of the indirect or open
structure models. In the area of nonveriDal problem solving, the students that
were taught under the open structure models scored significantiy higher than the
students that were instructed in the positive reinforcement models. These results
are further supportive of the conclusion that teaching styles are differentially
impacting student achievement outcomes at different levels. Because student
48

learning outcomes are used to ascertain the effects of interpersonal teaching
behaviors, the confounding variable higher versus lower cognitive domains must
be controlled in order to clarify the relationship between interpersonal teaching
behaviors and student learning outcomes. Wispe's (1951) study found that there
was a difference in student scores in the direct teaching groups when the
students were divided into high and low ability groups in that the low level ability
students benefited from direct teaching to a greater degree than high level ability
students. This type of effect can also be ascertained by using an assessment
instrument which is divided into lower and higher cognitive level objectives.
Bloom's taxonomy was used to classify the objectives of the Biology End
of Course (BECE), Spring 96 version into the general levels of lower and higher
cognitive levels. These objectives are based on observable behaviors, thus if
students exhibit these behaviors it will be taken as evidence of student mastery
of that objective. Since the BECE objectives are based on observable behaviors,
these objectives should be classifiable using the Bloomian Taxonomy of
Cognitive Objectives.
Lastiy, the relationship between achievement and affect must be
explored. Affect is "the feelings and emotions that an individual brings to bear on
a task" (Ormrod, 1995, p. 420). The student's affective attitude toward a subject
will impact on the values attached to the subject under study. This led Ormrod
(1995) to conclude, "affect Is cleariy a factor in learning and cognition" (p.423).
This led to the conclusion that if student affect can be positively increased there
should be a corresponding increase in achievement.
49

The literature of teaching styles research has traveled through three
distinctive phases. The first phase was a series of investigations into various
teaching style continua, which were predicated in a linear, bi-polar teacher style
model. Once teacher styles were identified various methodologies were
identified and the researchers then used those data sets and frameworks to
develop teacher skills, techniques and competencies. This research area was
commonly identified by a series of investigations of process-product processes.
The utilization of process-product processes is evident in the development of the
teacher assessment instruments, such as the Texas Teacher Assessment
System (TTAS). Currently, researchers (Brekelmans, Wubbels, & Creton, 1990,
Brekelmans, Holvast, & van Tartwijk, 1992; Fraser, 1986; Fisher, 1995,
Henderson, Fisher, & Fraser, 1995; Wubbels, Brekelmans, Creton, &
Hooymayers, 1989; Wubbels, Brekelmans, & Hooymayers, 1991; Wubbels,
Creton, & Holvast, 1988; Wubbels, Creton, & Hooymayers, 1985, 1987, 1992;
Wubbels, Creton, Levy, & Hooymayers, 1993; Wubbels, & Levy, 1989) are trying
to identify interpersonal teaching styles of teachers and ascertain the styles'
effects on student cognitive and affective outcomes. This area has been
pioneered by the research of Professor Dr. Wubbels in The Netheriands, Dr.
Levy In the USA and Dr. Fraser in Australia as well as their colleagues. This
literature review has established that the correlations between interpersonal
teaching behaviors and student cognitive and affective outcomes at the higher
and lower levels of Bloom's taxonomy in American biology classes have not been
investigated. This researcher will attempt to fill the identified gap in the literature.
50

CHAPTER III
RESEARCH DESIGN AND METHODOLOGY
Introduction
This study is grounded in the educational and interpersonal
communication literature. The review of this literature revealed a rich educational
literature as it related to the effectiveness of teachers' instruction (see Bennett,
1976; Brophy, 1973; Flanders, 1960, 1964, 1965, 1970 1970a; Good, Biddle &
Brophy 1975; Haige & Schmidt, 1956; Medley. 1977, 1979; Ostiund, 1956;
Rosenshine, 1970; Stalling 1976; Soar, 1968; Tuckman, 1970; Veldman &
Brophy, 1974; Wispe, 1951). This review also revealed a rich literature
concerned with the usage of interpersonal communication theory to quantify a
segment of the phenomenon known as teacher effectiveness (see Brekelmans,
Wubbels, & Creton, 1990, Brekelmans, Holvast, & van Tartwijk, 1992; Fraser,
1986; Fisher, 1995, Henderson, Fisher, & Fraser, 1995; Wubbels, Brekelmans,
Creton, & Hooymayers, 1989; Wubbels, Brekelmans, & Hooymayers, 1991;
Wubbels, Creton, & Holvast, 1988; Wubbels, Creton, & Hooymayers, 1985,
1987, 1992; Wubbels, Creton, Levy, & Hooymayers, 1993; Wubbels, &
Levy, 1989). The term teacher effectiveness is used to reflect the reality that the
classroom environment is more complicated than teacher-student instructional
couplet. It Is a more global term than the term effectiveness of teachers'
instruction. While there are studies concerning the relationship between
interpersonal teacher behaviors and student cognitive and affective outcomes,
51

these studies were primarily conducted outside of the USA and involved
educationally stratified student populations. In the Brekelmans, Wubbels and
Creton (1990) study student perceptions of their teacher's interpersonal teaching
behaviors were correlated with student cognitive and affective outcomes. Their
study used ability stratified student samples that eliminated the communication
intercourse between students of differing abilities. This stratification resulted in
an artificial homogenized sample and thereby reduced the found external validity.
Furthermore, the studies in this area, (Brekelmans et al., 1990; Fisher,
Henderson, Fraser, 1995; Henderson, 1995) did not account for the various
levels of cognitive outcomes of students. This study will explore those two areas
and add to the growing understanding of teacher effectiveness as it relates to
communication theory and the interpersonal teacher behavior model.
Purpose
The purpose of the study was to answer the following research questions:
1. What are the directions and degrees of the relationships of student
perceptions of their biology teachers' interpersonal teaching behaviors and
student overall, higher and lower level achievement outcomes?
2. What are the direction and degree of the relationships of student
perceptions of their biology teachers' interpersonal teaching behaviors and
student affective outcomes?
52

Hypotheses
The following hypotheses were tested:
HOI: None of the eight scales of the QTI are significantly related to
student achievement outcomes.
Sub-hypothesis 1.1: None of the eight scales of the QTI are
significantiy related to student higher achievement
outcomes.
Sub-hypothesis 1.2: None of tiie eight scales of the QTI are
significantiy related to student lower achievement outcomes.
Sub-hypothesis 1.3: None of the eight scales of the QTI are
significantiy related to student overall achievement
outcomes.
H02: None of the eight scales of the QTI are significantiy related to
student affective outcomes.
Sub-hypothesis 2.1: None of the eight scales of the QTI are
significantly related to student opinions about biology.
Sub-hypothesis 2.2: None of the eight scales of the QTI are
significantly related to student feelings about biology.
Methodology
Participants
A total of 111 participants in this study were members of the freshman
(9th) grade biology classes at a medium high school in a medium sized western
53

Texas school district. The students' age range was 14-17 years of age. The
participant group's gender composition was 52.2% male (n=58) and 47.8%
female (n=53). The ethnic composition of the participants was 75.1% majority
(n=83) and 24.9% minority (n=28). The participants' at-risk statuses were 72.1%
not at-risk (n=80) and 29.9% at-risk (n=31). All participants who entered this
study were responding to the author's presentation soliciting participants and all
participants were assured of the confidentiality of their responses and
assessment scores.
Instrumentation
The data collected to ascertain student perceptions of biology teachers
were collected using the Questionnaire on Teacher Interaction (QTI). The data
on student achievement and affective outcomes were collected using two
instruments, the Biology End of Course Examination (BESE) and the Biology
Student Affective Instrument (BSAI).
Questionnaire on Teacher Interaction (QTI)
The QTI is a 64-item instrument that assesses student perceptions of their
teachers' interpersonal behaviors on eight scales. Each scale assesses a
particular facet of the teachers' interpersonal behaviors (see Figure 1, p 32). The
scales are identified as leadership (DC), Helpful/fi iendly (CD), Understanding
(CS), Student responsibility/freedom (SC), Uncertain (SO), Dissatisfied (OS),
Admonishing (OD), and Strict (DO) (Wubbels, Creton, & Hooymayers, 1985).
54

The letters in parenthesis are the code assigned to each section by its
relationship to the underiying dominant-submissive /opposition-cooperation two
way matrix. The instrument's eight scales have been found to have reliability
coefficients at the student level of; leadership, .80; helpful/fi-iendly, .88;
understanding, .88; student responsibility/freedom, .76; uncertain, .79;
dissatisfied, .83; admonishing, .84, and strict, .80 (Wubbels, Creton, Levy, &
Hooymayers, 1993). A scale with a found alpha equal to or above .80 is
considered very reliable. Because the alpha values of two scales (uncertain and
dissatisfied) are less that .80, data collected using the two scales should be
Interpreted with caution.
Each scale was operationally defined by a series of words, which are
descriptions of the variable's that scale assesses. The DC (Leadership) scale
was composed of the descriptions of: notice what's happening, lead, organize,
give orders, set tasks, determine procedure, structure the classroom situation,
explain, and hold attention. The CD (Helpful/Friendly) scale was composed of
the descriptions: assist, show interest, behaves in a friendly or considerate
manner, be able to take a joke, inspire confidence and trust. The CS
(Understanding) scale was composed of the descriptions of: listen with interest,
empathize, show confidence and understanding, accept apologies, look for ways
to settle differences, be patient and open. The SC (Student
Responsibility/Freedom) scale was composed of the descriptions of: give
opportunity for independent work, wait for class to let off stream, give freedom
and responsibility, and approve of something. The SO (Uncertain) scale was
55

composed of the descriptions of: keep a low profile, apologize, wait and see how
the wind blows, and admit one is in the wrong. The OS (Dissatisfied) scale was
composed of the descriptions of: wait for silence, consider pros and cons, keep
quite, show dissatisfaction, look glum, question, and criticize. The OD
(Admonishing) scale was composed of the descriptions of: get angry, take pupils
to task, express irritation and anger, forbid, correct and punish. The DO (Strict)
scale was composed of the descriptions of: keep reins tight, check, judge, get
class silent, maintain silence, be strict, exact norms, and set rules.
Each scale of the QTI produced a ratio score which was indicative of the
degree that interpersonal teaching behavior is perceived to be present by
students. All the scales were measured using a 5-point ( 0 - 4 pt) Likert scale.
The items in a scale were counted and that number was multiplied by 4. This
number became the denominator In a ratio. A student's responses on those
same items were added together and that number became the numerator in the
ratio. The ratio was then converted to a number, which was between 0.0 and
1.0. 0.0 means that teacher behavior was not perceived by that student to be
present and 1.0 means that behaviors was perceived by the student to always be
present. For example, in the DC (Leadership) scale there are seven items. The
denominator would be 7X4, which equals 28. A student's responses to the
seven items were added and for this example that number was 22. The found
ratio is 22/28 and it is converted into .786. These calculations were repeated for
each scale of each student's QTI response sheet. These calculations resulted in
eight scale values for each student in the study.
56

Biology End-of-Course Examination, Spring 1996 version (BECE)
The reliability coefficients for this examination (BECE) was found to range
from .75 to .94, with most of the values being in the high .80 to low .90 range
(Technical Work Group, Texas Education Agency, National Computer Systems,
The Psychological Corp. & Measurement Incorporated, 1995). The procedure
used to determine the instrument's alpha was the KR-20 formula for dichotomous
choices.
The BECE is a 42-item multiple choice instrument developed for the
Texas Educational Agency which assessed students' mastery of nine objectives
in the area of biology. These objective are: (1) the student will demonstrate an
understanding of concepts In heredity and biological change over time, (2) the
student will demonstrate an understanding of concepts in patterns of living
systems, (3) the student will demonstrate an understanding of concepts in
ecology, (4) the student will demonstrate the ability to apply laboratory
techniques and use equipment in a biology context, (5) the student will
demonstrate the use of skills in acquiring and organizing data, (6) the student will
demonstrate the ability to interpret and communicate scientific data and/or
information, (7) the student will demonstrate skills in drawing logical inferences,
predicting outcomes, and forming generalized statements, (8) the student will
design and conduct biological experiments and activities, and (9) the student will
demonstrate an understanding of the application of science in daily life.
57

The theoretical reason for dividing the objectives into higher and lower
domain objectives is grounded in prior research (see Bennett, 1976; Soar, 1968;
Stalling, 1976; Wispe, 1951). Bennett (1976) found differing achievement levels
in his study that was related to teacher behaviors/styles and the level of the
objectives in the assessment instrument. Soar's (1968) study found that the
relationship between teaching styles and student outcomes would be curvilinear
for the lower cognitive levels with both direct and indirect styles correlated with
lower cognitive learning outcomes and the mixed teaching style correlated with
higher cognitive learning outcomes. Stalling's (1976) study found that in the
areas of reading and math achievement, the students that were taught by
teachers using the direct or positive reinforcement models scored significantly
higher than all of the indirect or open structure models. In the area of nonverbal
problem solving, the students that were taught under the open structure models
scored significantiy higher than the students that were instructed in the positive
reinforcement models. These findings are supportive of this researcher's intent to
divide Bloom's taxonomy into two categories, low and high.
Bennett's (1976), Soar's (1968), Stallings's (1976), and Wispe's (1951)
results are further supportive of the conclusion that teaching styles are
differentially impacting student achievement outcomes at different levels. Since
student learning outcomes are used to ascertain the effects of Interpersonal
teaching behaviors, the confounding variable higher versus lower cognitive
domains must be controlled in order to clarify the relationship between
interpersonal teaching behaviors and student learning outcomes.
58

Each of the BECE objectives were classified by a Professor of Curriculum
and Instruction (Elementary Mathematics) Dr. Cooper, and two Curriculum and
Instruction doctoral students, Ms. Peters, and the researcher using key word
analysis into either low or high levels of learning. Keyword analysis is based on
the association of certain words/phases with certain levels of Bloom's taxonomy
(Bloom, 1956). In this research the three lower levels of Bloom's taxonomy,
knowledge, comprehension, and application were identified as the low level of
cognition. Conversely, the three higher levels of Bloom's taxonomy, analysis,
synthesis, and evaluation were identified as the high level of cognition.
Objectives 1-3 in the BECE all begin with the root, 'The student will demonstrate
an understanding of concepts...'. This is indicative of a lower cognitive level
usually identified as comprehension. Objectives 4 and 5 in the BECE are also
identified as members of the lower cognitive domain due to their root descriptors.
In objectives 4 and 5 the students are required to apply their conceptualization of
laboratory techniques (objective 4) and data collection skills (objective 5). This is
clearly at the application level, which is included in the lower cognitive domain.
Objectives 6-8 in the BECE are all in the higher cognitive domain. This is
evidenced by the key words in their sentence roots, such as interpret and
communicate (objective 6), drawing logical inferences, predicting outcomes, and
forming generalized statement (objective 7), design and conduct biological
experiments (objective 8). In objective 9 students are required to demonstrate
their understanding of the applications of science in daily life, this activity is
identified as an application activity and it is assigned to that level. This
59

identification process by Dr. Cooper, Mr. Smith and Ms. Peters resulted in
Objectives 1-5 being assigned to the lower cognitive level in Bloom's Taxonomy
and Objectives 6-8 were assigned to the higher cognitive level. The agreement
in rating between Dr. Cooper, Mr. Smith and Ms. Peters was 89%, with
agreement on objectives 1-8 and disagreement on objective 9. On objective 9,
Ms. Peters identified it as an application objective, Mr. Smith identified it as an
analysis objective, and Dr. Cooper thought the objective was too broad to be
categorized. After consultation the objective was placed In the lower cognitive
area. This resulted in 31 items of BECE measuring the lower level of learning
and 11 items of BECE measuring the higher level of learning.
The variables produced by this instrument were pre-test and post-test
overall scores, pre-test and post-test lower cognitive level scores, and pre-test
and post-test higher cognitive level scores. Pretest scores were used to
ascertain the extent of student knowledge of biology prior to the year's instruction
of biology. The posttest scores were used to ascertain the extent of student
learning outcomes after a year of instruction of biology. The overall, low, and
high scores were determined by percentage correctiy answered items measuring
low level, high level, and total knowledge of biology, ranging between 0 and 100.
Biology Student Affective Instrument (BSAI)
The BSAI Is a 9-item Likert scale instrument that recorded students'
feelings and opinions about biology. This instrument was a modification of
Talese and Ollvarez's (1993) instrument that assessed students' feelings and
60

opinions about mathematics. Construct validity of BSAI was not well established
by the insignificant relationship between attitudes toward biology and student
pre-test scores. The researcher examining the item statements established face
validity. Item statements 1. 4, 5, 6, and 7 are examples of opinion statements.
The items In this instrument were clustered into two factors, an opinion
factor and a feeling factor. Item 1,4,5, 6, and 7 belonged to the opinion factor.
Sample items were 'There were always rules..." and "Biology is mostiy
memorizing." The factor loading coefficients were .376, .467, .685, .836, and .495
for items 1, 4, 5, 6, and 7, respectively. The opinion factor had a Cronbach alpha
of .52. Item 2, 8, 9, and 10 belonged to the feeling factor. Sample items were
"Biology is interesting" and "Biology is fun." Factor loading coefficients were
.849, .700, .698, and .812 for the four items, respectively. The Cronbach alpha
was .77 for the feeling factor. Students responded to the items of the instrument
on a 5-point Likert scale, with 0 signifying a strong disagreement with an item
and 4 signifying a strong agreement with an item. Because the items in the
opinion factor were negatively stated and items in the feeling factor were
positively stated, low scores meant positive opinions but negative feeling about
biology whereas high scores meant negative opinions but positive feeling about
biology. The two factors were negatively related with a weak correlation
coefficient, p = -.26, p < .01.
The feelings about biology were positive statements and all the opinions
about biology were negative statements. This is reflected in the negative
correlation between BSAI factor 1, opinions about biology, and BSAI factor 2,
61

feelings about biology. The variables produced by this instrument were pre-test
and post-test affective scores for the opinions factor and for the feelings factor.
Pretest scores were used to ascertain initial student opinions and feelings about
biology at the beginning of the academic year. The posttest scores were used to
ascertain flnal student opinions and feelings concerning biology at the end of the
academic year. The meaning attached to the Factor 1, opinions about biology,
scores was the lower the score the more positive the student's opinions about
biology. The meaning attached to the Factor 2, feelings about biology, scores
were the higher the score the more positive the student's feelings about biology.
Procedure
Data were collected in the students' regular classroom setting during their
normal 80-minute block schedule. Data were collected on September 22 and 23,
1997 and again on April 2 and 3,1998. All data collections were conducted by
either this researcher or his associate. Teachers were not involved in the data
collection processes. Prior to each data collection event, all students were
informed that their responses were confidential and would not affect their biology
grades. They were further assured that their teachers would never see any of
their responses or individual scores.
Data Analysis
The research questions involved variables at the individual student level
set In a classroom context. To measure these variables data were collected
62

using the QTI, BSAI, and BECE. The individual student was the appropriate
level of analysis because it was the individual student's perceptions of his/her
teacher's interpersonal teaching behaviors, which were assessed by the QTI.
The basis for the QTI Is Leary's communication theory concerning the interaction
between individuals. The communication patterns, which develop are contingent
on the personalities of everyone who are interacting (Wubbels, Creton, Levy &
Hooymayers, 1993). While student perceptions are formed in the context of a
classroom, each student have their own individual perception of the teacher's
interpersonal teaching behaviors. As Creton, Wubbels and Hooymayers (1993)
stated, "Teacher-student relationships are not deduced from psychosocial
backgrounds, but are seen as outcomes of a classroom system in which both
teacher and students take part" (p. 2). Reliability coefficients for student level
analysis were found to range from .76 to .88, while class level analysis was
associated with reliability coefficients ranging from .86 to .95 (Wubbels et al.,
1993). These scores indicate scale internal consistency. While class level
analysis was used by Wubbels et al. (1985) to insure credibility the student level
analysis was not considered inappropriate. Wubbels et al. preference for class
level analysis was in the context of providing teachers feedback from their
classes, which was not one of the concerns of this study.
Because the data collected were interval in nature, the proposed
hypotheses were tested using step-wise multiple regression. For hypothesis one
all retained variables were used as predictors and student posttest scores on the
BECE were used as criteria variables. All retained variables were used as
63

predictors and student posttest scores on the BSAI were used as criteria
variables. In a step-wise multiple regression equation, all variables were
assessed to ascertain if they met the parameters of p value for inclusion in the
step-wise multiple regression equation. All variables had to have a p of .05 or
less to initially enter the equation and a p of .10 or more to leave the equation.
The demographic data (i.e., gender, ethnicity, and student at-risk status) were
coded using dummy variables (0 and 1) to convert the data and allow its
inclusion into the step-wise multiple regression analysis. The dummy values were
coded in the following manner. Female was coded 0 and male 1, majority was
coded 0 and minority 1, and not at risk was coded 0 and at risk 1. The
participants provided all demographic data when they signed their consent forms.
All demographic data were then examined using step-wise multiple regression
modeling. The correlations between scales of the QTI were also examined to
determine if multi-linearity was a concern in this research study. For hypothesis
one all retained variables were used to generate predicted BECE post-test
scores. The pretest BECE scores were used as indicators of student prior
knowledge concerning biology. The same procedure was used to generate
predicted BSAI post-test scores for hypothesis 2. The pretest BSAI scores were
used as indicators of student initial feelings and opinions about biology.
64
CHAPTER IV
RESULTS
The purpose of this was to investigate the effects of student perceptions of
their biology teacher's interpersonal teaching behaviors on student achievement
and affective learning outcomes. This study also investigated whether student
perceptions of their biology teacher's interpersonal teaching behaviors as
measured by the QTI scales were significant predictors of student achievement
and affective learning outcomes.
Analyses were conducted in order to investigate the effects of differing
student perceptions of their biology teacher's interpersonal teaching behaviors as
measured by the QTI scales on post-test student achievements and post-test
affective learning outcomes. Four main dependent variables (post-test, overall,
post-test, high level; post-test, low level; and post-test affective learning
outcome) were used to measure the effects of student perceptions of their
biology teacher's Interpersonal teaching behaviors as measured by the eight QTI
scales.
This chapter presents the descriptive statistics for this sample and
discusses the hypothesis testing for each of the research hypothesis. The
SPSS-PC system was used to analyze the data
65

Hypotheses
The following hypotheses were tested:
HOI: None of the eight scales of the QTI are significantiy related to
student achievement outcomes.
Sub-hypothesis 1.1: None of the eight scales of the QTI are
significantly related to higher student achievement outcomes.
Sub-hypothesis 1.2: None of the eight scales of the QTI are
significantiy related to lower student achievement outcomes.
Sub-hypothesis 1.3: None of the eight scales of the QTI are
significantiy related to overall student achievement outcomes.
H02: None of the eight scales of the QTI are significantiy related to
student affective outcomes.
Sub-hypothesis 2.1: None of the eight scales of the QTI are
significantly related to student opinions about biology.
Sub-hypothesis 1.2: None of the eight scales of the QTI are
significantly related to student feelings about biology.
Descriptive statistics
Descriptive statistics for all independent and dependent variables used in
this study were calculated and presented in Table 1. The following abbreviations
were used in this dissertation: (1) QTI scales; Admon=Admonishing,
Dissat=Dissatisfied, Helpful=Helpful/friendly, Leader=Leadership, Strict=Strict,
Uncer=Uncertain, and Stu_resp=Student responsibility/freedom:
66

(2) Demographics; At_risk= At risk to fail, Ethnlcity=Ethnicty, Gender=Gender:
(3) BSAI scales; BSAI_F1=Spring data Factor 1, BSAIF1F=Fall data Factor 1,
BSAI_F2=Spring data Factor 2, BSAIF2F=Fall data Factor 2: (4) Pre and Post
test scores: POSTTH=Post test high level, POSTTTL=post test low level,
POSTTT=Post test overall level, PRETTH= Pre-test high level, PRETTL=Pre-test
low level, PRETTT=Pre-test overall level.
Table 1: Descriptive Statistics for independent and dependent variable
Variables N
Admon 1' Dissat 1' Helpful 1' Leader 1' Strict 1' Uncer 1' Stu-resp 1' At_risk 1' Ethnicity 1' Gender 1' BSAI F1 1' BSAIF1F 1' BSAI F2 1' BSAIF2F 1' POSTTH 1' POSTTL 1' POSTTT 1' PRETTH 1' PRETTL 1' PRETTT 1' Valid N 1' (listwise)
Mean
11 .22325 11 .19094 11 .81982 11 .77413 11 .41066 11 .18211 11 .46425 11 .28 11 .27 11 .50 11 .41126 11 .6288 11 .57207 11 .5507 11 .76383 11 .75051 11 .75581 11 .69813 11 .63888 11 .65359
Std. Dev.
.14264
.12642
.13204
.13707
.13149
.15167
.13509
.45
.45
.50
.17885
.1429
.23328
.2445
.20512
.15291
.15519
.22738
.15225
.16083
Var.
.0203
.0160
.0174
.0188
.0173
.0230
.0183
.203
.199
.252
.0312
.0204
.0544
.0598 .0421 .0234 .0241 .0517 .0232 .0259
Skewness
1.107 1.145 -.822 -.611 .280
1.499 .159 .997
1.049 .018 .854
-.364 -.289 -.333 -.985 -.793 -.862 -.432 -.116 -.247
Kurtosis
1.976 2.348
.459 .014 -.162 3.152 -.449
-1.024 -.917
- 2.037 1.216 -.326 -.640 -.228 .313 .068 .162
-.960 -.964 -.765
67

Univariate analyses for all variables were conducted only after preliminary
analyses were preformed to examine the assumptions of univariate analysis to
insure the appropriateness of this procedure. First, near normal distributions of
most dependent and independent variables were shown. While variables QTI
scales admonish, dissatisfied, and uncertain were positively skewed ranging from
1.049 to 1.499, they were not extreme enough to violate the univariate
assumption of normal distribution. Even if it was extreme enough to cause a
concern that the assumption was violated. Glass, Peckham, and Sanders (1972)
found that skewness has only a slight effect (generally only a few hundredths) on
the level of significance or power. Second, the assumption of homogeneity of
variance was assessed by univariate methods of Cochran's-C test and Bariett
Box F test. The null hypothesis of homogeneity of variance was retained.
Assumptions Concerning the Use of Multiple Regression Modeling
The basic assumptions of the multiple regression model are: (1) all
variables must be measured at the interval level and without error (measurement
error), (2) each independent variable's mean error value is zero (intercept error),
(3) each set of independent variables' error variances are constant
(heteroscedasticity), (4) for any two sets of independent variables there is no
auto-correlation (heteroscedasticity), (5) each independent variable is
uncorrelated with the error term (specification error), (6) perfect colllnarity is not
present (perfect linear relationship), and (7) each independent variable is
68

normally distributed (statistical significance). These assumption are related to
the population under study and not the sample taken from that population. But,
because the sample is representative of the population it was drawn from, the
assumptions of the multiple regression model can be determined from the
samples descriptive statistics with moderate certainty. All variables except three
demographic variables were measured at the Interval level and with minimal
error. The demographic variables were converted using dummy variables and
they were inserted into the multiple regression models. Using residual versus
predicted values from the post-test high level resulted in an error plot was oval in
nature and with an approximate error value of zero. This was also true for the
other four multiple regression models used for variables, post-test, low level;
post-test, overall level, opinions about biology, and feelings about biology. The
equality of variances were plotted and found to be congruent in each of the
multiple regression models used in this study. The models' Durbin-Watson
statistics ranged from 1.535 to 2.040 which is indicative of the presence of minor
positive auto-correlation to extremely minor negative auto-correlation. Because
error values were found to be approximately zero and error variances were found
to be congruent, the effect of auto-correlation is minimal. It was found that each
independent variable was found to be uncorrelated with the error term in each
multiple regression model. While the independent variables were correlated to
each other none of the variables were perfectiy correlated. Each independent
variable was found to be normally distributed with the presence of minor
skewness in the data.
69

statistical Analysis
First, a step-wise multiple regression equation was used to ascertain
which of the independent variables were significant predictors of the dependent
variable, post-test, high level scores. The independent variables that were
entered into the equation were: (1) BECE pre-test overall scores, (2) QTI scales
(except understanding), (3) BSAI factor 1 and 2 (pre-test and posttest data), and
(4) student demographic values; at-risk, ethnicity, and gender. The BECE
pretest high and low scores were eliminated due to their high correlations to each
other (r=.723, p=.01). Both pretest high and low levels were significantiy
correlated to the pretest overall scores (respectively: r=.884 and r=.960, p=.01).
The variable pretest, overall scores was retained because it was more closely
correlated to post-test high level than were pretest high and low level scores.
QTI scale understanding was eliminated due to its high correlation to QTI scale
helpful/friendly (r=.795, p=.01). Helpful/friendly was retained because it was
more closely correlated to all five dependent variables than was understanding.
The elimination of these three variables removed the threat of multi-linearity to
each multiple regression model.
Sub-hypothesis 1.1 stated that none of the eight QTI scales are
significantiy related to student high level achievement outcomes. The multiple
regression model used to test hypothesis 1.1 consisted of a dependent variable,
post-test at high level and Independent variables pretest overall score, QTI scale
uncertain, ethnicity, and QTI scale leadership. The descriptive statistics of the
predictor variables are reported In Table 2.
70

Table 2: Descriptive Statistics of retained predictor variables for sub-hypothesis 1.1
Variables
PRETTT Uncer Ethnicity Leader Valid N (listwise)
N
111 111 111 111
Mean
.65359
.18211
.27
.77413
Std. Dev.
.16083
.15167
.45
.13707
Var.
.0287
.0230 .199 .0188
Skewness
-.247 1.499 1.049 -.611
Kurtosis
-.765 3.152 -.917 .014
An ANOVA was conducted (see Table 3) to ascertain how well the data fit
the model. The results of the ANOVA revealed that the model fit the data with a
L(4, 106) = 24.852, E<.001.
Table 3: ANOVA test for model/data fit of sub-hypothesis 1.1
Model
A. Regression Residual
Total B. Regression
Residual Total
C. Regression Residual
Total D. Regression
Residual Total
SS
1.793 2.835 4.628 2.017 2.611 4.628 2.150 2.478 4.628 2.240 2.388 4.628
Df
1 109 110
2 108 110
3 107 110
4 106 110
Mean Sq.
1.793 .026012
1.008 .024182
.717
.02316
.560
.02253
F
68.936
41.709
30.952
24.852
Sig.
.001
.001
.001
.001
A: Predictors: PRETTT B: Predictors: PRETTT, Uncertain C: Predictors: PRETTT, Uncertain, Ethnicity D: Predictors: PRETTT, Uncertain, Ethnicity, Leadership
Students pretest overall score was selected to enter the regression model.
A significant portion of the post-test, high level learning variance was explained
71

by the pretest, R-square = .387, F_(1, 109) = 68.936, p < .001. The QTI scale
uncertain entered the equation and explained 4.8% of additional variance of high
level post-test scores, R-square = .435, F (2, 108) = 41.709, p < .001. The
relationship between QTI scale uncertain and achievement were negatively
correlated with a B-value of -.302, that is, with an increase of uncertainty in
teacher behavior, students' academic achievement decreases. Ethnicity
explained an additional 2.9% of the variance, R-square = .464, F (3, 107), p <
.001. The relationship was also negative with a B-value of -.083, which indicated
that majority students achieved higher in the post-test high level of biology than
minority students. The last significant predictor for the high level post-test score
was QTI scale leadership which explained an additional 1.9% of the variance of
the dependent variable, R-square = .483, F (4, 106), p < .001. The relationship
between leadership in teaching behaviors and student achievement was negative
with a B-value of-.236, that is, the stronger the leadership a teacher manifested
in his/her teaching behaviors, the lower his/her students achievement in biology
class. Other independent variables were excluded from the regression equation
because their insignificant relationships with the high level post-test scores B-
values, beta values and tests for significance are presented in Table 4.
72

Table 4: Standardized beta coefficients of the retained independent variables for sub-hypothesis 1.1 model
Model
A PRETTT B PREI11
Uncer C PRETTT
Uncer Ethnicity
D PRETTT Uncer Ethnicity Leader
Unstandard Coefficient B
.794
.744 -.302 .664 -.298 -.08336 .627 -.394 -.07565 -.236
Std. Error
.096
.094
.099
.098
.097
.035
.098
.107
.034
.119
Standard Coefficient Beta
.622
.584 -.223 .521 -.220 -.181 .491 -.291 -.165 -.156
t
8.303 7.951 -3.043 6.807 -3.067 -2.400 6.393 -3.673 -2.194 -1.993
Sig.
.001
.001
.003
.001
.003
.018
.001
.001
.030
.049
The multiple regression model the represents sub-hypothesis 1.1 is
Post-test high = .491 (Pretest, overall) + (-.291)(Uncertain) +
(-.165)(Ethniclty) + (-.156)(Leadership). (1)
Second, a step-wise multiple regression equation was used to ascertain
which of the independent variables were significant predictors of the dependent
variable, post-test, low level scores. The independent variables that were
entered into the equation were: (1) BECE pre-test overall scores, (2) QTI scales
(except understanding), (3) BSAI factor 1 and 2 (pre-test and posttest data), and
(4) student demographic values; at-risk, ethnicity, and gender. The BECE
pretest high and low scores were eliminated due to their high correlations to each
other (r=.723, p=.01). Both pretest high and low levels were significantiy
73

correlated to the pretest overall scores (respectively: r=.884 and r=.960, p=.01).
The variable pretest, overall scores was retained because it was more closely
correlated to post-test high level than were pretest high and low level scores.
QTI scale understanding was eliminated due to its high con-elation to QTI scale
helpful/friendly (r=.795, 2=.01). Helpful/friendly was retained because it was
more closely correlated to all five dependent variables than was understanding.
The elimination of these three variables removed the threat of multi-linearity to
each multiple regression model.
Sub-hypothesis 1.2 stated that none of the eight QTI scales are
significantiy related to student low level achievement outcomes. The multiple
regression model used to test hypothesis 1.2 consisted of a dependent variable,
post-test at low level and Independent variables pretest overall score, and QTI
scale uncertain. The descriptive statistics of the predictor variables are reported
In Table 5.
Table 5: Descriptive Statistics of retained predictor variables for sub-hypothesis 1.2
Variables
PRETTT Uncer Valid N (listwise)
N
111 111 111
Mean
.65359
.18211
Std. Dev.
.16083
.15167
Var.
.0287
.0230
Skewness
-.247 1.499
Kurtosis
-.765 3.152
74

An ANOVA was conducted (see Table 6) to ascertain how well the data fit
the model. The results of the ANOVA revealed that the model fit the data with a
L(2, 108) = 44.956, e<.001.
Table 6: ANOVA test for model/data fit of sub-hypothesis 1.1
Model
A. Regression Residual
Total B. Regression
Residual Total
SS
1.052 1.519 2.572 1.168 1.404 2.672
Df
1 109 110
2 108 110
Mean Sq.
1.052 .01394
.584
.01300
F
75.499
44.956
Sig.
.001
.001
A: Predictors: PRETTT B: Predictors: PRETTT, Uncertain
Students pretest overall score was selected to enter the regression model.
A significant portion of the post-test, high level learning variance was explained
by the pretest, R-square = .409, F (1, 109) = 75.499, p < .001. The QTI scale
uncertain entered the equation and explained 4.5% of additional variance of high
level post-test scores, R-square = .454, F (2, 108) = 44.956, p < .001. The
relationship between QTI scale uncertain and achievement were negatively
correlated with a B-value of-.217, that is, with an increase of uncertainty in
teacher behavior, students' academic achievement decreases. Other
independent variables were excluded from the regression equation because their
insignificant relationships with the high level post-test scores B-values, beta
values and tests for significance are presented in Table 7.
75

Table 7: Standardized beta coefficients of the retained independent variables for sub-hypothesis 1.2 model.
Model
A PRETTT B PRETTT
Uncer
Unstandard Coefficient B
.608
.573 -.217
Std. Error
.070
.069
.073
Standard Coefficient Beta
.640
.602 -.216
t
8.689 8.342 -2.987
Sig.
.001
.001
.003
The multiple regression model the represents sub-hypothesis 1.1 is
Post-test low = .602 (Pretest, overall) + (-.216)(Uncertain). (2)
Third, a step-wise multiple regression equation was used to ascertain
which of the independent variables were significant predictors of the dependent
variable, post-test, overall level scores. The independent variables that were
entered into the equation were: (1) BECE pre-test overall scores, (2) QTI scales
(except understanding), (3) BSAI factor 1 and 2 (pre-test and posttest data), and
(4) student demographic values; at-risk, ethnicity, and gender. The BECE
pretest high and low scores were eliminated due to their high correlations to each
other (r=.723, Qr.O^). Both pretest high and low levels were significantly
correlated to the pretest overall scores (respectively: r=.884 and r=.960, p=.01).
The variable pretest, overall scores was retained because it was more closely
correlated to post-test high level than were pretest high and low level scores.
QTI scale understanding was eliminated due to its high correlation to QTI scale
helpful/friendly (r=.795, p=.01). Helpful/friendly was retained because it was
76

more closely correlated to all five dependent variables than was understanding.
The elimination of these three variables removed the threat of multi-linearity to
each multiple regression model.
Sub-hypothesis 1.3 stated that none of the eight QTI scales are
significantiy related to student overall level achievement outcomes. The multiple
regression model used to test hypothesis 1.3 consisted of a dependent variable,
post-test at low level and independent variables pretest overall score, and QTI
scale uncertain. The descriptive statistics of the predictor variables are reported
in Table 8.
Table 8: Descriptive Statistics of retained predictor variables for sub-hypothesis 1.2
Variables
PRETTT Uncer Valid N (listwise)
N
111 111 111
Mean
.65359
.18211
Std. Dev.
.16083
.15167
Var.
.0287
.0230
Skewness
-.247 1.499
Kurtosis
-.765 3.152
An ANOVA was conducted (see Table 9) to ascertain how well the data fit
the model. The results of the ANOVA revealed that the model fit the data with a
F_(2, 108) = 56.890, p<.001.
77

Table 9: ANOVA test for model/data fit of sub-hypothesis 1.1
Model
A. Regression Residual
Total B. Regression
Residual Total
SS
1.217 1.432 2.649 1.359 1.290 2.649
Df
1 109 110
2 108 110
Mean Sq.
1.217 .01314
.680
.01195
F
92.611
56.890
Sig.
.001
.001
A: Predictors: PRETTT
B: Predictors: PRETTT, Uncertain
Students pretest overall score was selected to enter the regression model.
A significant portion of the post-test, high level learning variance was explained
by the pretest, R-square = .459, L (1 . 109) = 92.611, p < .001. The QTI scale
uncertain entered the equation and explained 5.4% of additional variance of high
level post-test scores, R-square = .513, F (2, 108) = 56.890, p < .001. The
relationship between QTI scale uncertain and achievement were negatively
correlated with a B-value of-.241, that is, with an increase of uncertainty In
teacher behavior, students' academic achievement decreases. Other
independent variables were excluded from the regression equation because their
insignificant relationships with the high level post-test scores B-values, beta
values and tests for significance are presented in Table 10.
78

Table 10: Standardized beta coefficients of the retained independent variables for sub-hypothesis 1.3 model
Model
A PRETTT B PRETTT
Uncer
Unstandard Coefficient B
.654
.614 -.241
Std. Error
.068
.066
.070
Standard Coefficient Beta
.678
.637 -.235
t
9.623 9.339 -3.450
Sig.
.001
.001
.003
The multiple regression model the represents sub-hypothesis 1.1 is
Post-test low = .637 (Pretest, overall) + (-.235)(Uncertain). (3)
Fourth, a step-wise multiple regression equation was used to ascertain
which of the independent variables were significant predictors of the dependent
variable, BSAI Factor 1 (opinions about biology) scores. The independent
variables that were entered into the equation were: (1) BECE pre-test overall
scores, (2) QTI scales (except understanding), (3) BSAI factor 1 and 2 (pre-test
and posttest data), and (4) student demographic values; at-risk, ethnicity, and
gender. The BECE pretest high and low scores were eliminated due to their high
correlations to each other (r=.723, p=.01). Both pretest high and low levels were
significantiy correlated to the pretest overall scores (respectively: r=.884 and
r=.960, p=.01). The variable pretest, overall scores was retained because It was
more closely correlated to post-test high level than were pretest high and low
level scores. QTI scale understanding was eliminated due to its high correlation
to QTI scale helpful/friendly (r=.795, p=.01). Helpful/friendly was retained
79
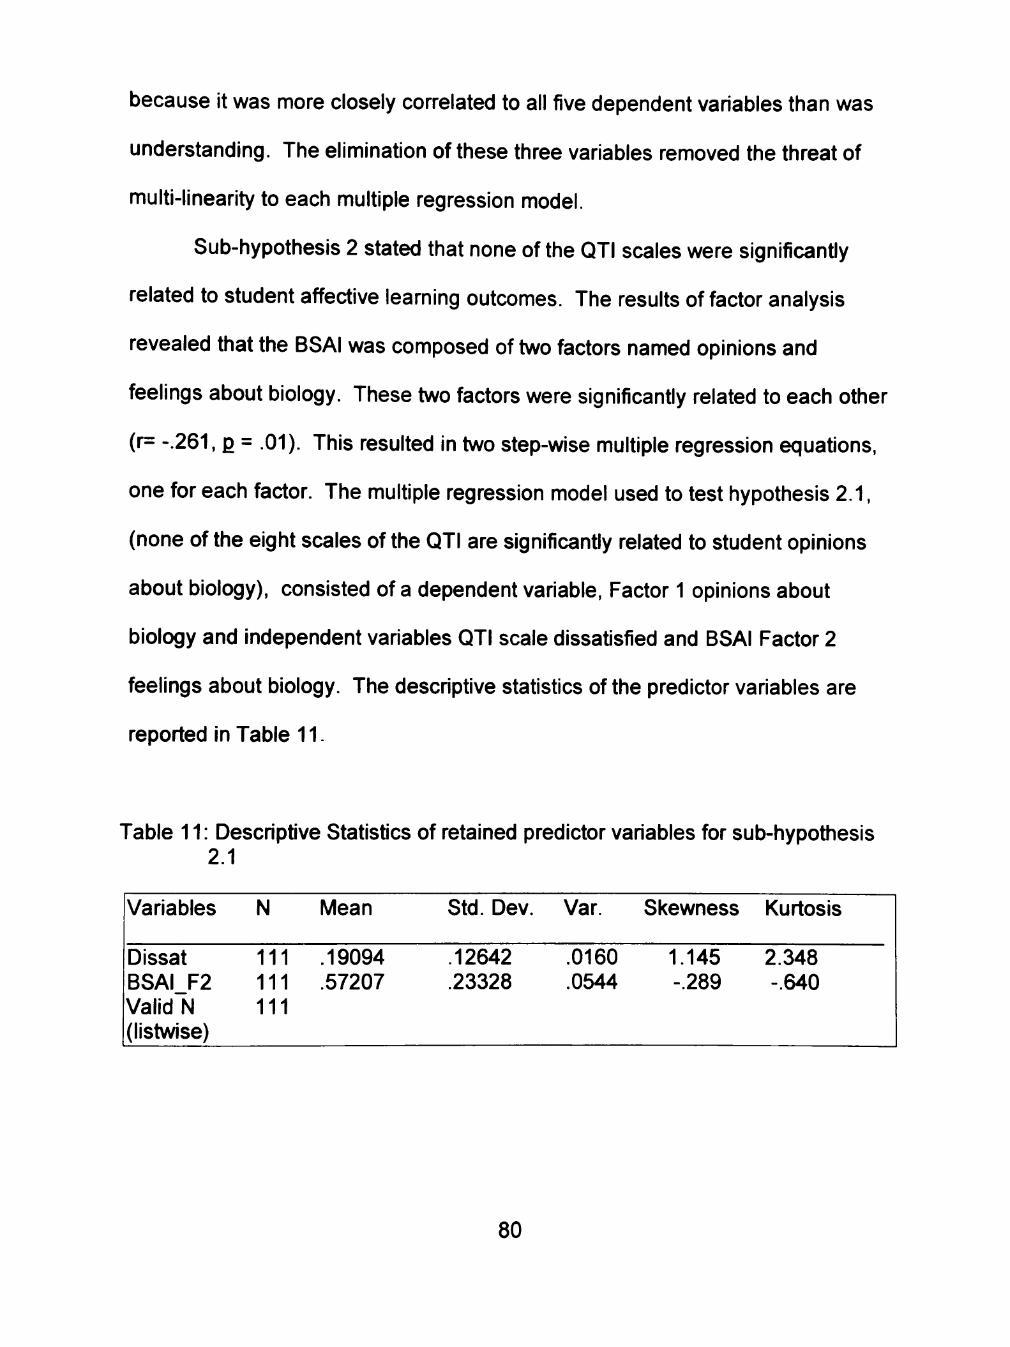
because it was more closely correlated to all five dependent variables than was
understanding. The elimination of these three variables removed the threat of
multi-linearity to each multiple regression model.
Sub-hypothesis 2 stated that none of the QTI scales were significantiy
related to student affective learning outcomes. The results of factor analysis
revealed that the BSAI was composed of two factors named opinions and
feelings about biology. These two factors were significantiy related to each other
(r= -.261, p = .01). This resulted in two step-wise multiple regression equations,
one for each factor. The multiple regression model used to test hypothesis 2.1,
(none of the eight scales of the QTI are significantly related to student opinions
about biology), consisted of a dependent variable. Factor 1 opinions about
biology and independent variables QTI scale dissatisfied and BSAI Factor 2
feelings about biology. The descriptive statistics of the predictor variables are
reported In Table 11.
Table 11: Descriptive Statistics of retained predictor variables for sub-hypothesis 2.1
Variables
Dissat BSAI F2 Valid N (listwise)
N
111 111 111
Mean
.19094
.57207
Std. Dev.
.12642
.23328
Var.
.0160
.0544
Skewness
1.145 -.289
Kurtosis
2.348 -.640
80

An ANOVA was conducted (see Table 12) to ascertain how well the data
fit the model. The results of the ANOVA revealed that the model fit the data with
aL(2 , 108) = 14.029, p<.001.
Table 12: ANOVA test for model/data fit of sub-hypothesis 2.1
Model
A. Regression Residual
Total B. Regression
Residual Total
SS
.477 3.042 3.518
.726 2.793 3.518
Df
1 109 110
2 108 110
Mean Sq.
.477
.02791
.363
.02586
Li.
17.086
14.029
Sig.
.001
.001
A: Predictors: Dissatisfied B: Predictors: Dissatisfied, BSAI F2
Students pretest overall score was selected to enter the regression model.
A significant portion of the student opinions about biology variance was explained
by QTI scale dissatisfied, R-square = .136, F (1, 109) = 17.086, p < .001. BSAI
Factor 2 (feelings about biology) entered the equation and explained .071 of
additional variance of students feelings about biology scores, R-square = .207, F
(2, 108) = 14.029, p < .001. The relationship between QTI scale dissatisfied and
student opinions about biology scores were positively corelated with a B-value of
.452, that is, with an increase of dissatisfaction in teacher behavior, students'
opinions about biology increased. The relationship between BSAI Factor 2
(feelings) and student opinions about biology, BSAI Factor 1, were negatively
correlated with a B-value of -.207, that is, with an increase of student feelings
81

about biology, students' opinions about biology decreased. Other independent
variables were excluded from the regression equation because their Insignificant
relationships with the high level post-test scores B-values, beta values and tests
for significance are presented in Table 13.
Table 13: Standardized beta coefficients of the retained independent variables for sub-hypothesis 2.1 model
Model
A Dissat B Dissat
BSAI F2
Unstandard Coefficient B
.521
.452 -.207
Std. Error
.126
.123
.067
Standard Coefficient Beta
.368
.319 -.270
t
4.133 3.662 -3.102
Sig.
.001
.001
.003
The multiple regression model the represents sub-hypothesis 2.1 is
BSAI Factor 1 = .368 (Dissatisfied) + (-.270)(BSAI Factor 2, post-test). (4)
Sub-hypothesis 2.2 stated that none of the eight scales of the QTI are
significantly related to student feelings about biology. The multiple regression
model used to test hypothesis 2.2 consisted of a dependent variable, feelings
about biology and independent variables QTI scale helpful, BSAIF2F, BSAI_F1,
ethnicity, and QTI scale dissatisfied. The descriptive statistics of the predictor
variables are reported in Table 14.
82

Table 14: Descriptive Statistics of retained predictor variables for sub-hypothesis 2.2
Variables N
Helpful 1' BSAIF2F 1' BSAIF1F 1' Ethnicity 1' Dissat 1' Valid N 1' (listwise)
Mean
11 .81982 11 .5507 11 .6288 11 .27 11 .19094
Std. Dev.
.13204
.2445
.1429 -45 .12642
Var.
.0174
.5977 .0204 .199 .0160
Skewness
-.822 -.333 -.364 1.049 1.145
Kurtosis
.459 -.228 -.326 -.917 2.348
An ANOVA was conducted (see Table 15) to ascertain how well the data
fit the model. The results of the ANOVA revealed that the model fit the data with
aL(5 , 105) = 17.857, p< .001.
83

Table 15: ANOVA test for model/data fit of sub-hypothesis 2.2
Model
A. Regression Residual
Total B. Regression
Residual Total
C. Regression Residual
Total D. Regression
Residual Total
E. Regression Residual
Total
SS
1.644 4.342 5.986 2.148 3.838 5.986 2.412 3.574 5.986 2.607 3.379 5.986 2.751 3.235 5.986
Df
1 109 110
2 108 110
3 107 110
4 106 110
5 105 110
Mean Sq.
1.644 .03984
1.074 .03554
.804
.03341
.652
.03187
.550
.03081
F
41.256
30.221
24.064
20.451
17.857
Sig.
.001
.001
.001
.001
.001
A: Predictors: HelpfijI/friendly B: Predictors: Helpful/friendly, C: Predictors: Helpful/friendly, D: Predictors: Helpful/friendly, E: Predictors: Helpful/friendly,
BSAIF2F BSAIF2F, BSAI_F1 BSAIF2F, BSAI_F1, Ethnicity BSAIF2F, BSAI_F1, Ethnicity. Dissatisfied
QTI scale helpful/friendly was selected to enter the regression model. A
significant portion of the student opinions about biology variance was explained
by QTI scale helpful/fiiendly, R-square = .275, F_(1. 109) = 41.256, p < .001. The
relationship between QTI scale helpful/friendly and student feelings about biology
scores were positively correlated with a B-value of .934, that is, with an increase
of helpfulness/friendly actions in teacher behavior, students' feelings about
biology increased. BSAI Factor 2 (pre-test data, feelings about biology) entered
the equation and explained .124 of additional variance of students feelings about
biology scores, R-square = .399, F (2,108) = 30.221, p < .001. The relationship
between BSAI Factor 2 (pre-test data, feelings about biology) and student
84

feelings about biology scores were positively correlated with a B-value of .265,
that is, the more prior positive feelings about biology the student has the higher
his/her post-test feelings about biology. BSAI Factor 1 (post-test data, opinions
about biology) entered the equation and explained .094 of additional variance of
students feelings about biology scores, R-square = .493, F (3, 108) = 24.064, p <
.001. The relationship between BSAI Factor 1 (post-test data, opinions about
biology) and student feelings about biology scores were negatively correlated
with a B-value of-.345, that is, the more negative opinions about biology the
student has the lower his/her post-test feelings about biology. Ethnicity entered
the equation and explained .062 of additional variance of students feelings about
biology scores, R-square = .555, F (4,108) = 20.451, p < .001. The relationship
was positive with a B-value of .09561, that is, minority students had more positive
feelings about biology than did majority students. Lastiy, QTI scale dissatisfied
entered the equation and explained .009 of additional variance of students
feelings about biology scores, R-square = .564, F (5, 108) = 17.857, p < .001.
The relationship between QTI scale dissatisfied and student feelings about
biology scores were positively correlated with a B-value of .341, that is, with an
increase of dissatisfied actions in teacher behavior, students' feelings about
biology increased. Other independent variables were excluded from the
regression equation because their insignificant relationships with the high level
post-test scores B-values, beta values and tests for significance are presented in
Table 16.
85

Table 16: Standardized beta coefficients of the retained independent variables for sub-hypothesis 2.1 model
Model
A Helpful B Helpful
BSAIF2F C Helpful
BSAIF2F BSAI F1
D Helpful BSAIF2F BSAI_F1 Ethnicity
E Helpful BSAIF2F BSAI_F1 Ethnicity Dissat
Unstandard Coefficient B
.926
.890
.278
.788
.286 -.284
.800
.260 -.283
.095632
.934
.265 -.345
.09561
.341
Std. Error
.144
.136
.074
.137
.072
.101
.134
.071
.099
.038
.146
.069
.101
.038
.158
Standard Coefficient Beta
.524
.504
.291
.446
.300 -.218 .453 .273 -.217 .183 .529 .278 -.265 .183 .185
t
6.423 6.519 3.767 5.745 3.996
-2.809 5.964 3.684
-2.863 2.478 6.407 3.816
-3.409 2.520 2.158
Sig.
.001
.001
.001
.001
.001
.001
.001
.001
.005
.015
.001
.001
.001
.013
.033
The multiple regression model the represents sub-hypothesis 2.2 is
BSAI Factor 2 = .529(Helpful) + .278(BSAIF2F) + (-.265)(BSAI_F1)
+ .183(Ethnicity) + .185(Dissatisfied). (5)
Summarv
This chapter presented the statistical analysis procedures used in this
research and the data obtained from those analyses.
Using step-wise multiple regression techniques, the null hypothesis of
student perceptions as measured by the QTI effects on student high level
achievement was rejected. Students who perceived their biology teacher to be
uncertain or a leader scored significantiy lower than students who did not
86

perceive their biology teacher to be uncertain or a leader. Student ethnicity was
also significantiy negatively related to student high level achievement.
Using step-wise multiple regression techniques, the null hypothesis of
student perceptions as measured by the QTI effects on student low level
achievement was rejected. Students who perceived their biology teacher to be
uncertain scored significantiy lower than students who did not perceive their
biology teacher to be uncertain or a leader.
Using step-wise multiple regression techniques, the null hypothesis of
student perceptions as measured by the QTI effects on student overall level
achievement was rejected. Students who perceived their biology teacher to be
uncertain scored significantly lower than students who did not perceive their
biology teacher to be uncertain or a leader. In all three cognitive sub-hypotheses
prior knowledge as measured by pretest overall scores was the leading predictor
of scores as measured by the post-test high, low, and overall levels of
achievement. Plus, in all three cognitive sub-hypotheses QTI scale uncertain as
measured by the QTI was the second leading predictor of post-test scores as
measured by the post-test high, low, and overall levels of achievement.
Using step-wise multiple regression techniques, the null hypothesis of
student perceptions as measured by the QTI effects on student affective learning
outcomes as assessed by the BSAI Factor 1 (opinions about biology) was
rejected. Students who perceived their teacher to be dissatisfied scored higher
on the post-test BSAI Factor 1. Conversely, students who have positive feelings
about biology scored lower on the post-test BSAI Factor 1.
87

Using step-wise multiple regression techniques, the null hypothesis of
student perceptions as measured by the QTI effects on student affective learning
outcomes as assessed by the BSAI Factor 2 (feelings about biology) was
rejected. Students who perceived their teacher to be helpful scored higher on
the post-test BSAI Factor 2. Also students who had prior positive feelings about
biology scored higher on the post-test BSAI Factor 2. Students with poor
opinions about biology scored lower on the post-test BSAI Factor 2. Minority
students scored higher on the post-test BSAI Factor 2 and students that
perceived their biology teacher to be dissatisfied scored higher on the post-test
BSAI Factor 2.
88

CHAPTER V
DISCUSSIONS, CONCLUSIONS, AND
RECOMMEDATIONS
Summarv of Studv
The researcher's primary goal in this study was to investigate the
predictive power and effect of student perceptions of their biology teacher's
interpersonal teaching behaviors as measured by the QTI on student
achievement and affective learning outcomes. Student achievement
outcomes were assessed at three levels, high, low and overall.
Research indicated that students with differing perceptions of their
teacher's interpersonal teaching behaviors would differ in academic
achievement and in affective learning outcomes (see Brekelmans, 1990;
Fisher, 1995; Henderson, Fisher & Fraser, 1995; Tuckman, 1980; Wubbels,
Brekelmans, Creton & Hooymayers, 1989; Wubbels, Brekelmans &
Hooymayers, 1991; Wubbels, Creton & Holvast, 1988; Wubbels, Creton &
Hooymayers, 1985, 1987; Wubbels, Creton, Levy & Hooymayers, 1993;
Wubbels & Levy 1989).
For example, Brekelmans, Wubbels, and Creton (1990) found that
there was a significant different effect for differing types of Interpersonal
teaching behavior scales students perceived to be present in regard to both
cognitive and affective learning outcomes. Specifically the Brekelmans et al.
(1990) study found that students who perceived their teacher to be a leader
89

achieved higher cognitive outcomes than students who did not perceive their
teachers to be leaders. In this study, student outcomes were measured with
a standardized and internationally developed test for physics subject matter.
Conversely, Fisher, (1995) and Henderson, Fishers, and Fraser, (1995) found
that students who perceived their biology teacher to be uncertain scored
significantiy lower in cognitive outcomes than students who did not perceive
their teacher to be uncertain.
Based on previous research (see Wubbels, Brekelmans, Creton &
Hooymayers, 1989; Wubbels, Brekelmans & Hooymayers, 1991; Wubbels,
Creton & Holvast, 1988; Wubbels, Creton & Hooymayers, 1985,1987;
Wubbels & Levy 1989) and the interpersonal teaching behaviors model, it
was expected that students that perceived tiieir teacher to be strict, a strong
leader, to be helpful/friendly in nature, and to be understanding would have
significantly higher academic achievement outcomes than students that did
not perceive their teacher in the same manner. These same students will
also have higher affective learning outcomes if they perceive their teacher to
be a leader, helpful, understanding and giving students responsibility and
freedom to control tiieir learning activities.
The predictions of this study were partially supported by the data.
Sub-hypotheses 1.1, was rejected because the relationship between
uncertainty and high level achievement scores was negatively correlated, that
is, with the increase of uncertainty In teacher's behavior, students' high level
achievement scores decreased. QTI scale uncertainty was the second most
90

powerful predictor found in the step-wise multiple regression model (see
equation 1) which was developed to explain the relationship between
dependent variable post-test, high level and its independent predictor
variables. QTI scales entered the high level achievement regression equation
and explained 4.8% of the variance in the post-test scores.
Sub-hypothesis 1.1 was also rejected because there was a significant
relationship between teacher leadership behaviors and student high level
achievement scores. This relationship was also negative in nature as an
increase in teacher leadership behaviors was associated with decreased
student high level achievement scores. These findings conti-adict the
research that reports leadership teacher behaviors are associated with higher
students achievement scores (see Brekelmans, Wubbels, & Creton, 1990;
Fisher, 1995; Henderson, Fisher, & Fraser, 1995; Wubbels, Brekelmans,
Creton, & Hooymayers, 1989Wubbels, Creton, & Hooymayers, 1985;
Wubbels, Creton, Levy, & Hooymayers, 1993). The number of participants in
these reference studies greatiy exceeded the number of participants in this
study. The leadership scale Cronbach alphas found in the previous research
ranged from .80 to .89, while in this study the leadership Cronbach alpha was
.69. These data cast doubt on the predictive power of QTI scale leadership
within tiie parameters of this study.
Sub-hypotheses 1.2 was rejected because the relationship between
uncertainty and low level achievement scores was negatively correlated, tiiat
is, with an increase of uncertainty in teacher's behavior, students' low level
91

achievement scores decreased. QTI scale uncertainty was the second most
powerful predictor found in the step-wise multiple regression model (see
equation 2) which was developed to explain the relationship between
dependent variable post-test, low level and its independent predictor
variables. QTI scales entered the low level achievement regression equation
and explained 4.5% of the variance in the post-test scores.
Sub-hypotheses 1.3 was rejected because the relationship between
uncertainty and overall level achievement scores was negatively correlated,
that is, with an increase of uncertainty in teacher's behavior, students' overall
level achievement scores decreased. QTI scale uncertain was the second
most powerful predictor found in the step-wise multiple regression model (see
equation 3) which was developed to explain the relationship between
dependent variable post-test, overall level and its independent predictor
variables. QTI scales entered the low level achievement regression equation
and explained 5.4% of the variance in the post-test scores.
These findings which led to the rejection of sub-hypotheses 1.1, 1.2,
and 1.3 support the research that reports that uncertain teacher behaviors are
associated with lower student achievement scores (see Brekelmans,
Wubbels, & Creton, 1990; Fisher, 1995; Henderson, Fisher, & Fraser, 1995;
Wubbels, Brekelmans, Creton, & Hooymayers, 1989; Wubbels, Creton, &
Hooymayers, 1985; Wubbels, Creton, Levy, & Hooymayers, 1993).
Sub-hypotheses 2.1 was rejected because the relationship between
QTI scale dissatisfied and higher negative opinions about biology was
92

positively correlated, that is, with an increase of dissatisfaction in teacher's
behavior, students' negative opinions about biology increased. QTI scale
dissatisfied was the most powerful predictor found in the step-wise multiple
regression model (see equation 4) which was developed to explain the
relationship between dependent variable post-test, opinions about biology
and its independent predictor variables. QTI scale dissatisfied entered the
regression equation and explained 13.6% of the variance in the post-test
opinions scores.
Sub-hypotheses 2.2 was rejected because the relationship between
QTI scales helpful/friendly and dissatisfied and higher positive feelings about
biology was positively correlated, that Is, with an increase of
helpfulness/friendly behavior or dissatisfaction in teacher's behavior, students'
positive feelings about biology increased. QTI scale helpful/friendly was the
most powerful predictor found In the step-wise multiple regression model (see
equation 5) which was developed to explain the relationship between
dependent variable post-test, feelings about biology and Its independent
predictor variables. QTI scale helpful/friendly entered the regression equation
and explained 27.5% of the variance In the post-test opinions scores. QTI
scale dissatisfied entered the regression equation and explained .9% of the
variance In the post-test opinions scores.
The findings which led to the rejection of sub-hypotheses 2.1 support
the research that reports that dissatisfied teacher behaviors are associated
with lower students achievement scores (see Brekelmans, Wubbels, &
93

Creton, 1990; Wubbels, Brekelmans, Creton, & Hooymayers, 1989; Wubbels,
Creton, & Hooymayers, 1985; Wubbels, Creton, Levy, & Hooymayers, 1993).
The findings which led to the rejection of sub-hypotheses 2.2 support the
research that reports that helpful/fi lendly teacher behaviors are associated
with higher students achievement scores (see Brekelmans, Wubbels, &
Creton, 1990; Wubbels, Brekelmans, Creton, & Hooymayers, 1989; Wubbels,
Creton, & Hooymayers, 1985; Wubbels, Creton, Levy, & Hooymayers, 1993).
But, the presence of QTI scale dissatisfied in both equation 4 and 5 is not
supportive of the interpersonal teaching behaviors research (see Brekelmans,
Wubbels, & Creton, 1990; Wubbels, Brekelmans, Creton, & Hooymayers,
1989; Wubbels, Creton, & Hooymayers, 1985; Wubbels, Creton, Levy, &
Hooymayers, 1993). Probable factors which have impacted the predictive
power In this research setting is the number of participants (n = 111) and the
QTI scale dissatisfied Cronbach alpha of .79. The most probable factor that
have impacted the predictive power of this research was the lack of variability
of teacher behaviors among the participant teachers. These factors led to the
probability that QTI scale dissatisfied Is not predictive of affective learning
outcomes in the study's setting.
The demographic variable ethnicity was a significant predictor in
equations 1 and 5. In the case of equation 1 (sub-hypothesis 1.1), ethnicity
has a negative standardized beta coefficient which indicates that persons of
minority ethnicity have lower predicted achievement high level scores than
persons of majority ethnicity. In the case of equation 5 (hypothesis 2.2),
94

ethnicity has a positive standardized beta coefficient, which indicates that
persons of minority ethnicity have higher predicted affective scores in the
area of feelings about biology. This is indicative of more positive affect
toward biology.
Limitations
After the completion of this study, the following limitations have been
acknowledged.
1. The sample of this study was from a rural, urban influenced west
Texas school; results of this study cannot be generalized to
urbanized or completely rural settings.
2. The BSAI was derived from a mathematics affective instrument.
The BSAI was found to be composed of two factors. Factor 1,
(opinions about biology) has a Cronbach alpha .52 and Factor 2,
(feelings about biology) has a Cronbach alpha of .77. These
reliabilities are particular to this sample under study.
Implications
Influence of student perceptions of their biology teacher on student achievement levels
A significant difference was found when the predictive power and
effects of the QTI scales on student achievement levels were tested.
Students that perceived their biology teacher to be uncertain scored lowered
on their BECE post-test at all three levels of assessment. The keywords used
95

to describe uncertain behaviors are; keep a low profile, apologized, wait and
see how the wind blows, admit one is in the wrong. The presence of this QTI
scale uncertainty in all three achievement assessments and Its negative
impact on all three scores led to the clear recommendation that all biology
teachers refrain form modeling behaviors associated with the uncertainty
scale keywords (see Brekelmans, Wubbels, & Creton, 1990; Wubbels,
Brekelmans, Creton, & Hooymayers, 1989; Wubbels, Creton, & Hooymayers,
1985; Wubbels, Creton, Levy, & Hooymayers, 1993). At the post-test, high
level of assessment the effect of student perceptions of teacher uncertainty
had a standardized beta coefficient of -.291. This means that if a student's
perceptions was one standard deviation above the mean group perception
then that student's predicted scores was .291 standard deviation below the
group's mean score for post-test, high level. In this study the predicted
student score would be reduced from 76.383% to 70.416% or approximately
one-half of a standard letter grade.
A significant difference was found when the predictive power and
effects of prior knowledge about biology on student achievement levels was
tested. Students' prior knowledge, as assessed by the pre-test overall score,
was the most powerful predictor on all three levels of the BECE post-test.
Prior knowledge accounted for 38.7% of the variance in student high level
achievement scores. It accounted for 40.9% and 45.9% of the variances in
student low and overall achievement scores, respectively. These findings are
supportive of research which found student prior knowledge (Burkham, Lee, &
96

Smerdon, 1997; Stallings, 1976), or cognitive entry behaviors (Bloom, 1976)
are the best indicator of student achievement. Cognitive entry behaviors are
defined as"... those prerequisite types of knowledge, skills, and
competencies which are essential to the learning of a particular new task or
set of tasks" (Bloom, 1976, p. 42). Burkham et al. (1997) found that
achievement disadvantage by gender was a stable variable, those students
that did pooriy in 8* grade physical science classes did pooriy in 10 ^ grade
classes. While females were disadvantaged as a group both genders prior
scores were predictive of their future scores. Stated another way if a student
had a poor achievement record in the 8* grade science class he/she will
probably have a poor achievement level in 10* grade science class.
In this study the more prior knowledge about biology students
possessed, the higher their predicted scores on all three levels of assessment
were. Students that scored higher on the pre-test, overall scored higher on all
three post-test assessments. The presence of prior knowledge in all three
levels of assessment leads to the recommendation that science be vertically
Integrated K-12 by a scope and sequence document. This recommendation
is supported by research on the National Educational Longitudinal Study-
1988 data base. At the post-test, high level of assessment the effect of
student prior knowledge variable has a standardized beta coefficient of .491.
This means that if a student scores one standard deviation above the mean,
that student's predicted scores will be .491 standard deviation above the
group's mean score for post-test, high level. In this study the predicted
97

student score would be raised from 76.383% to 86.434% or approximately
one standard letter grade.
Another significant difference found during the sub-hypothesis 1.1
testing was the discovery of the predictive power of QTI scale leadership.
Students that perceived their biology teacher to be a leader also scored lower
on their BECE post-test at the high level of assessment. The keywords used
to describe leadership behaviors are; notice what is happening, lead,
organize, give orders, set tasks, determine procedure, structure the
classroom-situation, explain, hold attention. These findings contradict the
research that reports leadership teacher behaviors are associated with higher
students achievement scores (see Brekelmans, Wubbels, & Creton, 1990;
Fisher, 1995; Henderson, Fisher, & Fraser, 1995; Wubbels, Brekelmans,
Creton, & Hooymayers, 1989; Wubbels, Creton, & Hooymayers, 1985;
Wubbels, Creton, Levy, & Hooymayers, 1993). The number of participants in
these research studies greatiy exceeded the number of participants in this
study. The leadership scale Cronbach alphas found in the previous research
ranged from .80 to .89, while In this study the leadership Cronbach alpha was
.69. Both of these findings cast doubt on the predictive power of QTI scale
leadership in this study.
Another significant difference found during the sub-hypothesis 1.1
testing was the discovery of the predictive power of ethnicity. Students
belonging to an ethnic minority scored lower on their BECE post-test at the
high level of assessment. The two minority groups present In the sample
98

used were Hispanic and African-American (n=1). The presence of ethnicity in
the high level achievement assessments leads to the following
recommendations; (1) all biology teachers should examine their interactions
with the differing ethnic groups and determine if there is disparate treatment,
and (2) all biology teachers should become aware of the tenets of multi
cultural teaching techniques. At the post-test, high level of assessment the
effect of student of minority ethnicity variable had a standardized beta
coefficient of -.165. This means that if a student belonged to an ethnic
minority that student's predicted score was .165 standard deviation below the
group's mean score for post-test, high level. In this study the predicted
student score would be reduced from 76.383% to 72.999% or approximately
one-quarter of a standard letter grade.
At the post-test, low level of assessment the effect of student
perceptions of teacher uncertainty had a standardized beta coefficient of -
.216. This means that if a student perceptions of his/her teacher's uncertainty
was one standard deviation below the mean group perception that student's
scores was lowered .216 standard deviation below the group's mean score
for post-test, low level. In this study the predicted student score would be
reduced from lowered from 75.051% to 71.748% or approximately one-third
of a standard letter grade. At the post-test, low level of assessment the effect
of student prior knowledge variable has a standardized beta coefficient of
.602. This means that If a student scores one standard deviation above the
mean, that student's predicted scores will be .602 standard deviation above
99

the group's mean score for post-test, low level. In this study the predicted
student score would be raised from 75.051% to 84.256% or approximately
one standard letter grade.
At the post-test, overall score level of assessment the effect of student
perceptions of teacher uncertainty had a standardized beta coefficient of
-.235. This means that if a student perceptions was one standard deviation
above the mean group perception that student's score was lowered .235
standard deviation below the group's mean score for post-test, overall level.
In this study the predicted student score would be reduced from lowered from
75.584% to 71.934% or approximately one-third of a standard letter grade. At
the post-test, overall level of assessment the effect of student prior knowledge
variable has a standardized beta coefficient of .637. This means that If a
student scores one standard deviation above the mean, that student's
predicted scores will be .637 standard deviation above the group's mean
score for post-test, overall level. In this study the predicted student score
would be raised from 75.051% to 85.470% or approximately one standard
letter grade.
Influence of student perceptions of their biology teacher on student affective outcomes
A significant difference was found when the predictive power and
effects of the QTI scales on student opinions about biology, BSAI, Factor 1,
affective learning outcomes was tested. Students that perceived their teacher
100

to be dissatisfied scored higher on Factor 1 of the BSAI. Item statements that
loaded on to Factor 1 were: item 1) Learning biology is mostiy memorizing,
item 4) There are always rules to use In solving a biology problem, item 5)
there are not many new discoveries in biology, item 6) biology is mostiy about
classifications and not about ideas, and item 7) in biology, it is more important
to understand why an answer is correct than it Is to know a lot of facts. The
presence of this QTI scale dissatisfied in both equation 4 and 5 contradicts
the interpersonal teaching behaviors literature (see Brekelmans, Wubbels, &
Creton, 1990; Wubbels, Brekelmans, Creton, & Hooymayers, 1989; Wubbels,
Creton, & Hooymayers, 1985; Wubbels, Creton, Levy. & Hooymayers, 1993).
Probable factors which have impacted the predictive power of QTI scale
dissatisfied in this research setting is the number of participants (n = 111) and
the QTI scale dissatisfied Cronbach alpha of .79. This leads to the probability
that QTI scale dissatisfied is not predictive of affective (opinions) learning
outcomes within the parameters of this study.
A significant difference was found when the predictive power and
effects of BSAI, Factor 2, feelings about biology, on BSAI, Factor 1, opinions
about biology, affective learning outcomes was tested. Students that had a
positive affect toward their feelings about biology scored lower on Factor 1 of
the BSAI. Item statements that loaded on to Factor 2 were: item 2) biology is
interesting, item 8) biology is useful in everyday life, item 9) I would like to
have a job where I could use the things I have learned in biology, and item
10) biology is fun. Factor 2 represented positive feelings about biology. The
101

strength of the predictive power of BSAI, Factor 2 is reflected in its
standardized beta coefficient of -.270. This means that if a student has
positive feelings about biology which are one standard deviation above the
mean group's perception that student's scores was lowered .270 standard
deviation below the group's mean score on BSAI, Factor 1 opinions about
biology. In this study the predicted student score would be decreased from
.41126 to .36303. Because Factor 1, opinions about biology is a negative
factor the lower a student scores the more he/she has developed a positive
affect toward biology.
A significant difference was found when the predictive power of the
QTI scales on student feelings about biology, BSAI, Factor 2, affective
learning outcomes was tested. Students that perceived their teacher to be
helpful scored higher on Factor 2 of the BSAI. This factor represents positive
feelings about biology. The strength of the predictive power of QTI scale
helpfulness is reflected in its standardized beta coefficient of .529. This
means that if a student's perceptions of his/her teacher's helpfulness was one
standard deviation above the mean group perception that student's scores
was raised .529 standard deviation above the group's mean score on Factor
2 of the BSAI. In this study the predicted student score would be raised from
.57207 to .69548. This is representative of the development of a major
increase In positive affect toward biology. As discussed in the previous
section, the presence of QTI scale dissatisfied as a predictor of positive
feelings about biology is an indicator that the dissatisfied scale is not
102

predictive in the study. The presence of QTI scale dissatisfied also indicates
that the BSAI is in need of further refinement to increase its reliability and
validity. Because the QTI scale is not predictive in this study, predicted
student scores can not be generated.
Another significant difference was found when the predictive power
and effects of the pre-test BSAI, Factor 2, (feelings about biology), on post-
test BSAI, Factor 2, student feelings about biology, affective learning
outcomes were tested. Students that pre-tested for a positive affect toward
their feelings about biology scored higher on post-test BSAI, Factor 2. The
strength of the predictive power pre-test BSAI, Factor 2 is reflected in its
standardized beta coefficient of .278. This means that if a student's pre-test
positive feelings about biology were one standard deviation above the mean
group's perception that student's scores was raised .278 standard deviation
above the group's mean score on the post-test BSAI, Factor 2. In this study
the predicted student score would be increased from .57207 to .63692. This
is representative of the development of a more positive affect toward biology.
A significant difference was found when the predictive power of the
post-test, BSAI, Factor 1, opinions about biology, on BSAI, Factor 1, student
feelings about biology, affective learning outcomes was tested. Students that
had a negative affect toward their opinions about biology scored lower on
BSAI, Factor 2. The strength of the predictive power of BSAI, Factor 1 is
reflected in its standardized beta coefficient of -.265. This means that if a
student has negative opinions about biology which are one standard deviation
103

above the mean group's perception that student's scores was lowered .265
standard deviation below the group's mean score for Factor 2 of the BSAI. In
this study the predicted student score would be decreased from .57207 to
.51025. This is representative of the development of a more negative affect
toward biology.
Lastiy, another significant difference found was the significance of
ethnicity. Students that belong to an ethnic minority scored higher on Factor
2, BSAI affective assessment. The two minority groups present in the sample
were Hispanic and African-American (n=1). At the Factor 2, BSAI
assessment the effect of student of minority ethnicity variable had a
standardized beta coefficient of .183. This means that a minority student's
predicted score was .183 standard deviation above the group's mean score
for Factor 2, BSAI. In this study the predicted student score would be
increased from .57207 to .61476. This is representative of the development
of a more positive affect toward biology.
Theoretical Contributions
Research has not compared the influence of student perceptions of
American biology teachers and student academic achievement and affective
learning outcomes. Previous research was concentrated in other countries
which operated academically stratified educational systems (see Brekelmans,
1990; Fisher, 1995; Henderson, Fisher & Fraser, 1995; Wubbels,
Brekelmans, Creton & Hooymayers, 1989; Wubbels, Brekelmans &
104

Hooymayers, 1991; Wubbels, Creton & Holvast, 1988; Wubbels, Creton &
Hooymayers, 1985, 1987; Wubbels, Creton, Levy & Hooymayers, 1993;
Wubbels & Levy 1989). In this study, the researcher established the
predictive power of QTI scale uncertain on academic achievement outcomes.
The data on QTI scale leadership were suspect because they were not
supportive of the interpersonal teaching behaviors literature (see Brekelmans,
1990; Fisher, 1995; Henderson, Fisher & Fraser, 1995; Wubbels,
Brekelmans, Creton & Hooymayers, 1989; Wubbels, Brekelmans &
Hooymayers, 1991; Wubbels, Creton & Holvast, 1988; Wubbels, Creton &
Hooymayers, 1985, 1987; Wubbels, Creton, Levy & Hooymayers, 1993;
Wubbels & Levy 1989). The other six scales were not significantiy related to
student achievement. Because seven of the eight QTI scales were either
insignificant or suspect, the predictive power of the QTI on student
achievement in a West Texas 9th grade setting was not been established.
This research also established the predictive power of QTI scale
helpful/friendly and BSAI Factors on student affective learning outcomes. The
data on QTI scale dissatisfied were suspect because they did not support the
interpersonal teaching behaviors literature (see Brekelmans, 1990; Fisher,
1995; Henderson, Fisher & Fraser, 1995; Wubbels, Brekelmans, Creton &
Hooymayers, 1989; Wubbels, Brekelmans & Hooymayers, 1991; Wubbels,
Creton & Holvast, 1988; Wubbels, Creton & Hooymayers, 1985,1987;
Wubbels, Creton, Levy & Hooymayers, 1993; Wubbels & Levy 1989), and
because It was a positive predictor for both opinions and feelings about
105

biology. Because these two constructs are negatively correlated, a QTI scale
could predict one construct or the other, but not both constructs. The other
six scales were not significantiy related to student affective learning
outcomes. Because seven of the eight QTI scales were either insignificant or
suspect, the predictive power of the QTI on student affective learning
outcomes in a West Texas 9 '' grade setting was not established.
Using a sample from the Texan population of ninth grade biology
students, the results of this study were not consistent with the findings of
research from other countries (see Brekelmans, 1990; Fisher, Henderson, &
Fraser, 1995; Henderson, 1995; Wubbels, Brekelmans, Creton &
Hooymayers, 1989; Wubbels, Brekelmans & Hooymayers, 1991; Wubbels,
Creton & Holvast, 1988; Wubbels, Creton & Hooymayers, 1985,1987;
Wubbels, Creton, Levy & Hooymayers, 1993; Wubbels & Levy 1989). While
the interpersonal teaching behavior model does function as a predictor in
senior secondary grades (American equivalent 10-12 grades) as indicated by
the literature the exact composition of significant predictive QTI scales varied
with the nationality and grade of the sample. This also occurred in another
study concerning student perceptions of their biology teacher's interpersonal
teaching behaviors in the People's Republic of China and in the USA (Bilica &
Smith, 1998).
106

Educational Practice
The results of this study support the widely held assertion that
education and educational activities operate within a social/cultural context.
The findings of this research is not consistent with previous studies conducted
by Wubbels and associates (see Brekelmans, 1990; Fisher, 1995;
Henderson, Fisher & Fraser, 1995; Tuckman, 1980; Wubbels, Brekelmans,
Creton & Hooymayers, 1989; Wubbels, Brekelmans & Hooymayers, 1991;
Wubbels, Creton & Holvast, 1988; Wubbels, Creton & Hooymayers, 1985,
1987; Wubbels, Creton, Levy & Hooymayers, 1993; Wubbels & Levy 1989).
Interpersonal teacher behavior theory asserts that students' perceptions of
their teacher will be significantiy associated with student academic
achievement and affective learning outcomes. Before the model that is
derived from the interpersonal teacher behavior theory can be used, its
predictive power must be established in American educational settings. The
model also needs to be normed to that particular culture's or society's
students and teachers.
From the results of this study, it is not clear that interpersonal teacher
behavior model and theory offer Important avenues to effect student
academic achievement and affective learning outcomes in a West Texan
educational setting. Students who perceive their teachers not to be uncertain
scored significantiy higher on all post-test academic achievement
measurements than did students who perceived their teachers to be
uncertain. All other QTI scales were either not significant or suspect.
107
student ethnic status also was a negative indicator of success for
students assessed by tiie post-test, high level. Because ethnicity was a
significant predictor of lessened success at the post-test high level, biology
teachers should examine their interactions with their students and ascertain if
there are any disparate treatments occurring In their classroom and teachers
should become aware of the aspects of a multi-culturally based educational
system. Also, the school district should examine its policies to assure the
funding of schools Is not being administered In a manner that negatively
impacts minority students. Also school officials should insure that Hispanic
students are sufficientiy fluent in English to insure that the lack of
comprehension is not impeding their academic progress.
Lastly, this research supported Bloom's (1976), Burkham, Lee and
Smerdon (1997), and Stalling's (1976) studies that prior knowledge is a major
predictor of future academic achievement. These leads to the final
recommendation that all teachers should use various methods of
preassessment to determine the knowledge student bring to specific tasks
and areas of study. This will enable teachers to organize their classes in
such a manner as to insure that students with greater prior knowledge are
grouped with students with lessor amounts of prior knowledge.
Suggestions for Future Research
Based on the results of this study, future research is needed to
examine several questions. Some of these include the following.
108

1. The effect of student perceptions of their teacher's interpersonal
teaching behaviors on student academic achievement should be
investigated in a single subject setting within the context of one
grade with at least 20 teachers as participants.
2. The effect of student perceptions of their teacher's interpersonal
teaching behaviors on student academic achievement should be
investigated in an across subjects setting within the context of one
grade with at least 20 teachers as participants.
3. The effect of student perceptions of their teacher's interpersonal
teaching behaviors on student affective learning should be
investigated in an across subjects setting within the context of one
grade.
4. The effect of student perceptions of their teacher's interpersonal
teaching behaviors on student academic achievement should be
investigated in an across grades (9-12) and across subjects
context.
5. The effect of student perceptions of their teacher's interpersonal
teaching behaviors on student affective learning should be
investigated in an across subject setting within the context of one
grade.
6. The effect of student perceptions of their teacher's interpersonal
teaching behaviors on student affective learning should be
109

investigated in an across grades (9-12) and across subjects
context.
7. The effect of locality (uriDan, rural, rural but urban influenced) on
student perceptions of their teacher's interpersonal teaching
behaviors in an across subjects setting with the context of a single
grade.
8. The effect of locality (urban, rural, rural but urban influenced) on
student perceptions of their teacher's interpersonal teaching
behaviors in an across subjects setting with the context of the 9-12
grade setting.
110

REFERENCES
Anderson, C. (1959). Learning in discussions: A resume of the authoritarian-democratic studies. Harvard Educational Review. 29. 201-215.
Anderson, L. W., & Sosniak, L. A. (1994). Preface. In L. W. Anderson & L. A. Sosniak (Eds.). Bloom's Taxonomv: A Forty-Year Retrospective (pp. vii-viii). Chicago: The University of Chicago Press.
Barr, A. S. & Emans, L. E. (1930). What qualities are prerequisites to success in teaching? The Nation's School. 6(3). 60-64.
Bennett, N. (1976). Teaching Styles and Pupils Progress. Cambridge, MA: Harvard University Press.
Bilica, K. & Smith, W. (1998). Using Sociocultural Perspective to Compare Chinese and American High School Biology Students' Perspectives of Teachers' Interpersonal Teaching Behaviors. Paper delivered at the meetings of the Sino-American Conference, New Orieans, LA.
Bloom, B. S. (Ed.) (1956). Taxonomv of Educational Obiectives: The Classification of Educational Goals. Volume 1: Cognitive Domain. New York: McKay.
Bloom, B. S. (1976). Human Characteristics and School Leaming. New York: McGraw-Hill Book Company.
Bloom, B. S. (1994). Reflections on the development and use of the taxonomy. In L. W. Anderson & L. A. Sosniak (Eds.). Bloom's Taxonomv: A Fortv-Year Retrospective (pp. 1-8). Chicago: The University of Chicago Press.
Bloom, B., Hastings, T. & Madaus, G. (1971). Handbook on Formative and Summative Evaluation of Student Learning. New York: McGraw-Hill.
Brekelmans, M. (1989). Interpersonal Teacher Behavior in the Classroom. Utrecht, The Netheriands: W.C.C.
Brekelmans, M., Holvast, A., & van Tartwijk, J. (1992). Changes in teacher's communication styles during the professional career. Journal of Classroom Interaction. 24(1). 13-22.
Brekelmans, M., Levy, J. & Rodriguez, R. (1993). A typology of teacher communication style. In Th. Wubbels & J. Levy (Eds.). Do You Know What You Look Like? (pp. 46-55). London: The Falmer Press.
111

Brekelmans, M., Wubbels, T. & Creton, H. (1990). A study of student perceptions of physics teacher behavior. Journal of Research in Science Teaching, 27(4), 335-350.
Brophy, J. E. (1973). Stability of teacher effectiveness. American Educational Research Journal. 10(3). 245-252.
Burkham, D. T., Lee, V. E. & Smerdon, B. A. (1997). Gender and science learning eariy in high school: subject matter and laboratory experiences. American Educational Research Journal. 34(2). 297-331.
Burkman, E., Tate, R. L., Snyder, W. R. & Beditz, J. (1981). Effects of academic ability, time allowed for study and teacher directness on achievement in a high school science course (ISIS). Journal of Research in Science Teaching. 18(6). 563-576.
Burnett, R. W. (1957). Teaching Science in the Secondarv School. New York: Rinehart and Co.
Burton, W. H. (1952). The Guidance of Learning Activities. (2nd ed.). New York: Appleton-Century-Crofts.
Charter, W. W. & Waples, D. (1929). The Commonwealth Teacher-Training Study. Chicago: University of Chicago Press.
Corey, S. M. (1940). The teachers out-talk the pupils. The School Review. 48. 745-752.
Creton, H, Wubbels, T., & Hooymayers, H. (1993). A systems perspective on classroom communication. In Th. Wubbels & J. Levy (Eds.), Do You Know What You Look Like? (pp. 13-28). London: The Falmer Press.
Cronbach, L. J. (1954). Educational Psychology. New York: Harcourt, Brace and Co.
Deming, W. E. (1984). The New Economics for Industry. Government. Education. Cambridge, MA: Massachusetts Institute of Technology, Center for Advanced Engineering Study.
Fisher, D. (1995). Interpersonal behavior in senior high school biology classes. Research in Science Education. 25(2). 125-133.
112

Flanders, N. A. (1960). Teacher Influence. Pupil Attitudes, and Achievement; Final Report. Cooperative Research Monograph No. 397. Washington, DC: Office of Education, U.S. Department of Health, Education and Welfare.
Flanders, N. A. (1964). Interaction Analvsis in the Classroom: A Manual for Observers (Rev. Ed.). Ann Arbor, Ml: School of Education, University of Minnesota.
Flanders, N. A. (1965). Teacher Influence. Pupil Attitudes, and Achievement. Cooperative Research Monograph No. 12. Washington, DC: Office of Education, U.S. Department of Health, Education and Welfare.
Flanders, N. A. (1970). Analyzing Teaching Behavior. Reading, MA: Addison-Wesley Pub. Co.
Flanders, N. A. (1970). Some relationships among teacher influence, pupil attitudes and achievement. In E. J. Amidon & J. B. Hough (Eds.), Interaction analvsis: Theorv. research and applications, (pp. 217-242). Reading, MA: Addison-Wesley.
Fraser, B. J. (1986). Two decades of research on perceptions of classroom environment. The Studv of Learning Environments, (pp. 1-33). Salem, MA: Assessment Research.
Furst, E. J. (1994), Bloom's taxonomy: Philosophical and educational issues. In L. W. Anderson & L. A. Sosniak (Eds.). Bloom's Taxonomv: A Fortv-Year Retrospective (pp. 28-40). Chicago; The University of Chicago Press.
Good, T. L., Biddle, B. J. & Brophy, J. E. (1975). Teacher's Make a Difference. New York: Holt, Rinehart & Winston.
Haige, G. V. & Schmidt, W. (1956). The learning of subject matter in teacher centered and student centered classes. Journal of Educational Psychology. 47. 295-301.
Hart, F. W. (1934). Teachers and Teaching: By Ten Thousand High School Seniors. New York: Macmillan Co.
Henderson, D., Fisher, D. & Fraser, B. (1995, April). Associations Between Learning Environments and Student Outcomes in Biology. Paper delivered at the meetings of the American Educational Research Association, San Francisco, CA.
113

Hill, P. W. (1984). Testing hierarchy in educational taxonomies: A theoretical and empirical investigation. Evaluation in Education. 8. 179-278.
Hill, P. W., & McGrew, B. (1981). Testing the simplex assumption underiying Bloom's taxonomy. American Educational Research Journal. 18. 93-101.
Kelly, G. A. (1955). The Psychology of Personal Constructs. New York: Norton.
Kratz, H. E. (1896). Characteristics of the best teachers as recognized by children. Pedagogical Seminary. 3. 413-418.
Kropp, R. P. & Stoker, H. W. (1966, February) The Construction and Validation of Tests of the Cognitive Processes as Described in the Taxonomv of Educational Obiectives. Research report, Institute of Human Learning, Tallahassee, FL: Florida State University (ED 010 044).
Leary, T. (1957). Interpersonal Diagnosis of Personality. New York: The Ronald Press Company.
Madaus, G. F., Woods, E. M., & Nuttall, R. L. (1973). A causal model analysis of Bloom's taxonomy. American Educational Research Journal. 10(4). 253-262.
Medley, D. M. (1977). Teacher Competence and Teacher Effectiveness: A Review of Process-Product Research. New York: American Association of Colleges for Teacher Education.
Medley, D. M. (1979). The effectiveness of teachers. In P. L. Peterson & H. J. Walberg (Eds.), Research on Teaching: Concepts. Findings and Implications, (pp. 11-27). Berkeley. CA: McCutchan Publishing Company.
Ormrod, J. E. (1995). Human Learning. (2nd ed.). Englewood Cliffs, NJ: Merrill.
Ostiund, L. A.(1956). An experimental study in case-discussion method. Journal of Experimental Education. 25. 81-89.
Rosenshine, B. (1970). Teaching Behaviors and Student Achievement. Slough, England: National Foundation for Educational Research in England and Wales.
Rosenshine, B. (1976). The Psychology of Teaching Methods. In The 75th Yearbook of the National Society for the Studv of Education (pp. 335-371). Chicago: The University of Chicago Press.
114

Rothman, A. I. (1969). Teacher characteristics and student learning. Journal of Research in Science Teaching. 6. 340-348.
Stalling, J. A. (1976). How instructional processes related to child outcomes in a national study of follow through. Journal of Teacher Education. 27(1). 43-47.
Soar, R. S. (1968). Optimum Teacher-Pupil Interaction for Pupil Growth. Educational Leadership. 26. (Research Supplement, 2 of 3), 275-280.
Talese, J & Olivarez, 0. (1995, Jan.). Psychometric Properties of High School Student's Views About Mathematics Learning and Instruction Instrument. Paper delivered at the Annual Meetings of the Southwestern Educational Research Association, Austin, TX.
Technical Work Group, Texas Education Agency, National Computer Systems, The Psychological Corp. & Measurement Incorporated. (1995). Texas Student Assessment Program: Technical Digest for the Academic Year 1993-1994. Austin, TX: Texas Education Agency.
Texas Education Agency. (1995). Learner-Centered Schools For Texas: A Vision of Texas Educators (TEA Publication GE6 710 01). Austin, TX.
Tuckman, B. W. (1970). A techniques for the assessment of teacher directness. The Journal of Educational Research. 63(9). 395-400.
Tuckman, B. W. (1976). New instrument: The tuckman teacher feedback form. Journal of Educational Measurement. 13(3). 233-237.
Tuckman, B. W. (1995). The interpersonal teacher model. The Educational Forum. 59(2). 177-185.
Tuckman, B. W. & Yates, D. (1980). Evaluating the student feedback strategy for changing teacher behavior. Journal of Education Research. 74(2). 74-77.
Veldman, D. J. & Brophy, J. E. (1974). Measuring teacher effects on pupil achievement. Journal of Educational Psychology. 66(3). 319-324.
Watzlawick, P., Beavin, J. H., & Jackson, D. D. (1967). Pragmatics of Human Communication: A Study of Interpersonal Patterns. Pathologies, and Paradoxes. New York: W. W. Norton & Company, Inc.
Wispe, L. G. (1951). Evaluating section teaching methods. Journal of Educational Research. 45. 161-186.
115

Wubbels, Th., Brekelmans, M., Creton, H. A. & Hooymayers, H. P. (1989). Teacher behavior style and learning environments. In Ch. Ellet & H. Waxman (Eds.), The Study of Learning Environments. 4. (pp. 1-12) Houston, College of Education.
Wubbels, Th., Brekelmans, M. & Hooymayers. (1991). In B. J. Fraser & H. J. Walberg (Eds.), Educational Environments: Evaluation. Assessment and Conseguences. pp. 141-160 Oxford, England: Pergamen Press.
Wubbels, Th., Creton, H. A. & Holvast, A. (1988). Undesirable classroom situations: A systems communication perspective. Interchange. 19(2). 25-40.
Wubbels, Th., Creton, H. A. & Hooymayers, H. P. (1985, March- April). Discipline Problems of Beginning Teacher. Interaction Teacher Behavior Mapped Out. Paper delivered at the meetings of the American Educational Research Association, New York, NY.
Wubbels, Th., Creton, H. A. & Hooymayers, H. P. (1987). A school based teacher induction programme. European Journal of Teacher Education. 10,(1), 811-91.
Wubbels, Th., Creton, H. A. & Hooymayers, H. P. (1992). Reviews of research on teacher communication styles with use of Leary's model. Journal of Classroom Interaction. 27(1). 1-11.
Wubbels, Th., Creton, H., Levy, J. & Hooymayers, H. (1993). The model for interpersonal teacher behavior. In Th. Wubbels & J. Levy (Eds.), Do You Know What You Look Like? (pp. 13-28). London: The Falmer Press.
Wubbels, Th. & Levy. J. (1989, March). A Comparison of Dutch and American Interpersonal Teaching Behavior. Paper delivered at the meetings of the American Educational Research Association, San Francisco, CA.
116

APPENDIX A
QUESTIONNAIRE ON TEACHER INTERACTION
117

QUESTIONN.AIRI ON TE.\CHER ENTER-\CTION
Last Six Digits of SS.\ Thus questionnaire asks you to describe your teacher's behavior. Your cooperation can help your teacher improve his.lier instruction. DO NOT WTUTE YOUR NAME, for your responses are coniidential. Thjs is NOT a test, " 'our teacher \\-ill NOT read your answers and they will NOT affect your grade. They will only recei% e the average results of the classes, NOT individual student scores.
For each sentence on the questionnaire, circle the lener which you think most applies to the teacher of your class. Please use only a pen. For example:
The teacher expresses himsel&Tierself clearly Alwa\s A ' B
Never D E
If \ou thirJ< that \-our teacher always expresses himself'herself clearly, circle lener .A.. If \ou think \our teacher never expresses himsclf^erself clearlv-, circle lener E. You can also choose leners B, C or D, which are in between. Thank you for your cooperation.
.AJwavs Never
The teacher is strict. We have to be silent in the teacher's class. The teacher talks enthusiastically about his/her subject. Tlie teacher trusts us.
A A A A
B B B B
C C C C
D D D D
E E E E
5. The teacher is concemed when we have not understood hinvher. 6. If we don't agree with him/her we can talk about it. 7. The teacher threatens to punish us. 8. We can decide some things in his/her class.
A A A A
B B B B
C C C C
D D D D
E E E E
9. The teacher is demanding. 10. The teacher thinks we cheat on assignments. 11. The teacher is willing to explain things again. 12. Tne teacher thinks we don't know anvthins.
A A A A
B B B B
C C c c
D D D D
E E E E
13. If we want som.ething he/she is willing to cooperate. 14. The teacher's tests are hard. 15. The teacher helps us with our work. 16. The teacher gets angrv- unexpectedly'.
A A A A
B B B B
C C c c
D D D D
E E E E
17 If we have something to say he/she will listen. 18. The teacher svmpathizes with us. 19. The teacher tries to make us look foolish. 20. The teacher's standards are ver\- hieh.
A A A A
B B B B
C C c c
D D D D
E E E E
21 22. 23. 24.
We can influence hinVher. we need his/her permission before we speak. The teacher seems uncertain. The teacher looks down on us.
A A A A
B B B B
C c c c
D D D D
E E E E
25. We have Lhe opportunity- to choose assignments which are most mteresting to us.
26. The teacher is urihappy. 27 The teacher lets us fool around in class. 28. The teacher puts us down.
A
. \
A A
B
B B B
C C
c
D
D D D
E E E
118

29. The teacher ta-kes a personal interest m us. 30. The teacher thinks we can't do things well. 31 . The teacher explains things clearly. 32. The teacher realizes when we don't understand.
A B A B A B A B
C D E
C D E C D E C D E
33. The teacher lets us get away with a lot in class. 34. The teacher is hesitant. 35. The teacher is friendly. 36. We learn a lot from him/her.
A B A B A B A B
C D E C D E C D E C D E
37. The teacher is someone we can depend on. 38. The teacher gets angrv' quickly.
39. The teacher acts as if he/she does not know what to do. 40. The teacher holds our attention.
A B A B A B A B
C D E C D E C D E C D E
41 . The teacher's too quick to correct us when we break a rule. A B D
42. The teacher lets us boss himher around. 43. The teacher is impatient. 44. The teacher's not sure what to do when we fool around.
A B A B A B
C D E C D E C D E
45. The teacher knows even.thing that goes on in the classroom. 46. It's easv- to make a fool out of him/her. 47. The teacher has a sense of humor. 48. The teacher allows us a lot of choice in what we studv.
A B A B A B A B
C D E C D E C D E C D E
49. The teacher gives us a lot of free time in class. 50. The teacher can take a joke. 5 1. The teacher has a bad temper. 52. The teacher is a eood leader.
A B A B A B A B
C D E C D E C D E C D E
53. If we are not prepared, we're scared to go to his/her class. 54. The teacher seems dissatisfied. 55. The teacher is timid. 56. The teacher is patient.
A B A B A B A B
C D E C D E C D E C D E
57. The teacher is severe when marking papers. 58. The teacher is suspicious. 59. It is easy to pick an argument with him/her. 60. The teacher's class is pleasant.
A B A B A B A B
C D E C D E C D E C D E
61. We are afraid of him/her. 62. TTie teacher acts confidentlv'. 63. The teacher is sarcastic. 64. The teacher is lenient.
A B A B A B A B
C D E C D E C D E C D E
THA^K YOU!
Modified bv- Wade Smith, From: Wubbels. Th., Creton, H. A. & Hoo.vmayers, H. P. (1985, March-.\pnl). Discipline Proble-s of Begmr.ir.g Teacher. Interaction Teacher Behavior Mapped Out. Paper delivered at the meetings of Lhe American Educational Research .Association, New York, NY'
119

APPENDIX B
BIOLOGY STUDENT AFFECTIVE INSTRUMENT
FACTOR ANALYSIS
RELIABILITIES
120

Table 17: Resultant Factors from Principal Component Analysis
SB01S SB02S SB04S SB05S SB06S SB07S SB08S SB09S SB10S
Factor 1
-.205 .775 -.510 -.369 -.575 -.257 .705 .616 .710
Factor Analysis Factor
2 .399 .352 .02452 .663 .583 .382 .09403 .321 .332
Extraction Method: Principal Component Analysis.
121

Table 18: Reliability analysis, Cronbach Alpha scale, Factor 1, BSAI (Opinions)
1. 2. 3. 4. 5.
SBOIS SB04S SB05S SB06S SB07S
SBOIS SB04S SB05S SB06S SB07S
Mean
2.1351 1.3874 .7117
1.5495 2.4414
Correlation Matrix
SBOIS
1.0000 -.0990 .1910 .2244 .0372
N of Cases =
Statistics for Scale
Mean 8.2252
Item-total Statistics
SBOIS SB04S SB05S SB06S SB07S
Scale Mean if Item Deleted
6.0901 6.8378 7.5135 6.6757 5.7838
Reliability Coefficients
Alpha .5120
SB04S
1.0000 .1002 .2943 .1683
111.0
Variance 12.7943
Scale Variance if Item Deleted
10.3009 9.8826 9.3248 7.1666 9.2619
5 items
Standardized
Std Dev
1.2022 1.2073 1.0820 1.3399 1.2981
SB05S
1.0000 .4301 .1044
Cases
111.0 111.0 111.0 111.0 111.0
SB06S SB07S
1.0000 .2617 1.0000
N of Std Dev Variables 3.5769
Corrected Item-Total
Correlation
.1358
.1916
.3479
.5342
.2338
item alpha =
5
Squared Multiple
Correlation
.0901
.1236
.1945
.3101
.0777
.5082
Alpha if Item Deleted
.5426
.5108
.4206
.2619
.4885
122

Table 19: ReliabilitY analvsis. Cronbach Aloha
1. 2 . 3 . 4 .
SB02S SB08S SB09S SBIOS
SB02S SB08S SB09S SBIOS
Mean
2.7477 2.2252 1.3694 2.8108
C o r r e l a t i o n Mat r ix
SB02S
1.0000 .4642 .4356 .6450
N of Cases =
S t a t i s t i c s fo r Mean S c a l e 9.1532
I t e m - t o t a l S t a t i s t i c s
SB02S SB08S SB09S SBIOS
I
S c a l e Mean
Lf I tem Deleted
6.4054 6.9279 7.7838 6.3423
R e l i a b i l i t y C o e f f i c i e n t s
Alpha .7546
SB08S
1.0000 .3498 .3843
111.0
Var i ance 13.9309
Sca l e Var i ance
i f I tem De le t ed
8.4069 8.3584 8.3892 8.7545
4 i t ems
S t a n d a r d i z e d
Std Dev
1.1157 1.3395 1.3344 1.1079
SB09S
1.0000 .4105
scale, Factor 2, Cases
111.0 111.0 111.0 111.0
SBIOS
1.0000
N of Std Dev V a r i a b l e s
3.7324 4
C o r r e c t e d I t em-T o t a l
C o r r e l a t i o n
.6614
.4878
.4866
.6023
i t em a lpha =
Squared M u l t i p l e
C o r r e l a t i o n
.4898
.2490
.2400
.4417
.7647
BSAI (Feelings)
Alpha i f I tem De le t ed
.6431
.7368
.7371
.6742
123

Biology Student Affective Instrument Last Six Digits of SSN.
This questionnaire asks you to describe your feelings and opinions about biology. Your cooperation can help develop an understanding about the relationship between a student's feelings and leaming outcomes. DO NOT WRITE YOUR NAME, for your responses are confidential. This is NOT a test. Your teachers will NOT read your answers and they will NOT affect your grade. They will only receive the average results of the classes, NOT individual student scores.
For each sentence on the questionnaire, circle the letter which you think best describes your feeling or opinion about each statement. Please use only a pencil. For example:
Agree Disagree Learning science is mostly memorizing A B C D E
If you agree that leaming science is mostly memorizing, circle the letter A. If you disagree that leaming science is mostly memorizing, circle the letter E. You can also choose letter B, which mean slightly agree, letter C, which means no opinion, or letter D, which means slight disagreement. Thank you for your cooperation.
Agree
A
A
B
B
C
c
D
D
Disagree
E
E
1. Learning biology is mostly memorizing.
2. Biology is interesting.
3. Guessing is OK to use in developing a solution to
a biology problem. A B C D E
4. There are always rules to use in solving a biology
problem. A B C D E
5. There are not many new discoveries in biology. A B C D E
6. Biology is mostly about classifications and not
about ideas. A B C D E
7. In biology, it is more important to understand why
an answer is correct than to know a lot of facts. A B C D E
8. Biology is useful in everyday life. A B C D E
9. I would like to have a job where I could use the
things I have learned in biology. A B C D E
10. Biology is fun. A B C D E
Thank You! Modified by Wade Smith, From: Telese, J. A. & Olivarez, A. (1997, January). Psychometric Properties of High School Student's Views about Mathematics Leaming and Instruction. Paper delivered at the meetings of the Southwest Educational Research Association, Austin, TX.
124

APPENDIX C
BIOLOGY END OF COURSE EXAMINATION
125

BIOLOGY I
126

DIRECTIONS
Read each quest ion and choose the best answer. Then .fill in the correct answer below and on your ajxsw^er documenL
SAMPLE A
Biology is the study of —
A atoms
B energy
C life
D stars
SAMPLE A
© © © ®
SAMPLE B
F Acuit
G Egg
H Lan^a
J P-ca
Listed above are some stages in the development of a butterfly. The first stage is G. It has been marked for you. In the box provided below and on your answer docjjz:en:, rsark the correct order for the other stages.
Youngest
Oldest
nrst
Second
Third
Fourth
©
©
©
©
•
®
®
®
©
©
©
©
o
0
o
o
127

CeUs
A
Organs
B
Tissues
C
Systems
D
Sequence the levels of organization &X)m LEAST complex to MOST complex. The least complex level is A. It has been marked for you. Mark the correct order for the other levels in the box below and on your answer document.
Least
'^^r Most
•
®
® (A:
®
d'
(§)
d;'
©
©
©
(Di
(D)
(D)
®
128

® ® ® (D
5X 7X 5X 10X
2 Which of the following shows the correct order of the developing organism?
A Z, X, Y, W
B W, X, Y, Z
C W, Z, Y, X
D Y, Z, W, X
129

Control GrouD
Experimental Group
Before Incubation After Inc'joation
3 According to the resul ts of the experiment above, which antibiotic is MOST effecrive in controlling this bacteria?
F A
G B -
H C
J D
100 Senses Used to Identify Foods
o 5 en c < o o o O c o u a C
Smell
4 The graph shows the results of an experjnerLt requiring people to use only one sense to idenufy foods. According to this mformancn. which sense was most accurate for idenrj~.."Lng foods?
A Touch
B Taste
C Sight
D SrneU
130

5 A student would like to investigate careers in biology. Which summer job would offer the suident the LEAST relevant experience?
F Nursing-home aide
G Flag person for a construction crew
H Lab assistant for a biomechanical engineering firm
J Proofreader of advertisements for a pharmaceutical company
Key
•Maje wTth
OFen:aie witfi Tive lingers
Male wiCi I SIX fingers
I Female wi;^ sixrincers
Ccn
o o a u Pa-; an DecDie Ken Mary AJics Juan
D D O O Ann George Jerl Pa.-.c-/ Sa,-an Jane Mana
6 According to the pedigree shown above, the parents of Sarah and Jane are —
A Anita and Don
B Mar;/ Alice and Juan
C Debbie and Ken
D Paul and Jaji
7 The map shows the ranges of four different species of snakes. Which species would probably have the MOST genetic varianon?
F W
G X
H Y
J Z
131

Order Diptera Order Hymenoptera
8 Insects in the order Hv"menoptera diner from those in the order Diptera by the presence of —
A two pairs of wings
B antennae
C trajisparent wmgs
D three pairs of legs
9 Hair is constantly being cut or broken vrithout causing pain. What is the BEST hv'pothesis for this observation?
F Hair is used for warmth.
G Hair is made of ver>' small cells.
H Hair contains small capillaries.
J Hair contains no nerv'e endings.
132
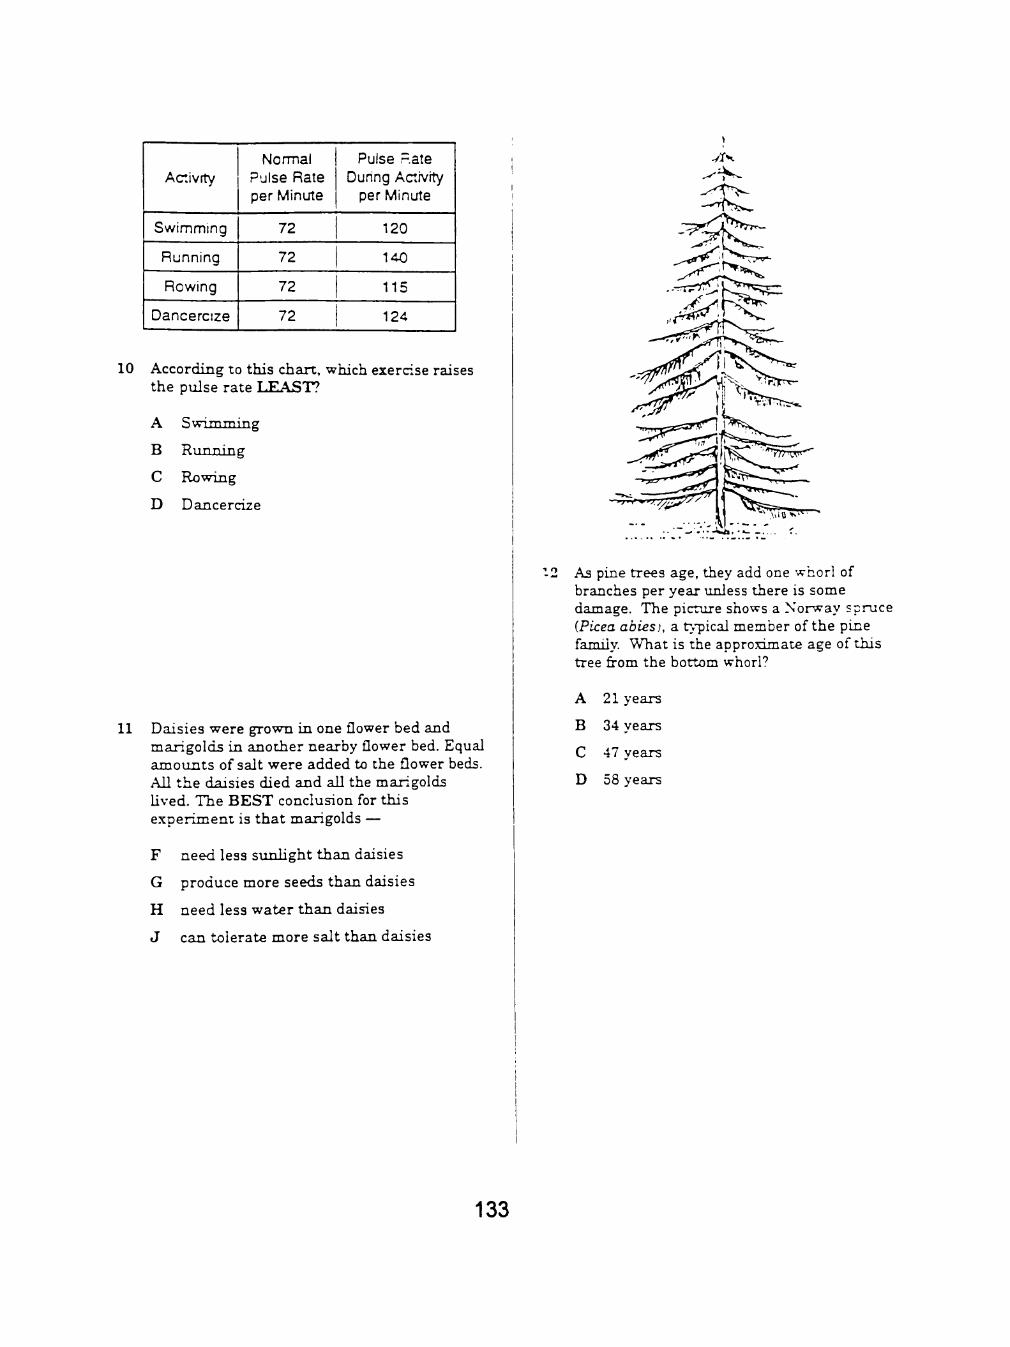
Ac.ivrty
Swimming
Running
Rowing
Dancercize
Normal Pulse Rate per Minute
72
72
72
72
Pulse Rate During Aaivity
per Minute
120
140
115
124
vXv
10 According to this chart, which exercise raises the pulse rate LEAST?
A Swimming
B Running
C Rowing
D Dancercize
11 Daisies were grown in one flower bed and marigolds in another nearby flower bed. Equal announts of salt were added to the flower beds. All the daisies died and all the marigolds lived. The BEST conclusion for this experiment is that marigolds —
F need less sunlight than daisies
G produce more seeds than daisies
H need less water than daisies
J can tolerate more salt than daisies
•• o
" . r ^ ^
As pine trees age, they add one whorl of branches per year unless there is some damage. The picture shows a Norway spruce (Picea abies), a t y-pical member of the pine family. What is the approximate age of this tree from the bottom whorl?
A 21 years
B 34 years
C 47 years
D 58 years
133

People in one culture often eat foods that people in other cultures do not eat. For example, squid is an Italian delicacy but not frequendy foimd in American cooking. Barbara has decided to cry some squid if it is inexpensive and nutrinous. The statements following the key were made by some of Barbara's friends. Use the key below to classify each statement in questions 13 and 14.
W This factual statement, Lf correct, would support her decision to trv* some squid.
X This factual statement, if correct, would NOT support her decision to try some squid.
Y This factual statement, if correct, would have no value in making a decision for or against trymg some sqmd.
Z This statement cannot be proven because it is a value judgment or opinion.
15 A new process has been deveIof>ed that helps keep fruits and vegetables fresh. Water loss is reduced by spraying the fruits and vegetables with a chemical obtained from fat. A panel of scientists will decide whether the product is safe for use on hiiman foods. Which question is most important in making this decision?
F Wdl using the product result in increased food cost?
G Does the product change the color or taste of the food?
H V^Tiat are the long-term side effects of consiiming this product?
J Can this product reduce water loss in other foods or manufactured items!*
13 "Barbara, you are allergic to sq'Jid."
F W
G X
H Y
J Z
14 "Crabs are a source of food for squid.
A W
B X
C Y
D Z
134

Thermometer
Holes in can
Holes in can
Glass tube
Sample
A
B
C
D
Mass of
Sample
Temperature of Water ('C)
Before Burning
After Euming
16 The picture shows a calorimeter used to measure the number of calories in a food sample. The chart shows the basic types of measurements that should be recorded. Which improvement to the apparatus would probably allow more accurate and precise measurements?
A Extend the glass tube by attaching a rubber hose.
B Replace the water with mineral oil.
C Insulate the can instead of leaving it open.
D L'se a metal container for the water instead of a flask.
135

17 The pictures below show wings of different animals. Which animal does NOT share a recent common ancestor with the others?
->^
H
Use the chart below to answer questions 18 and 19.
A Study of Hatching Success of Wood Frog Eggs
Under Different Conditions
Number of Trials
18
18
18
15
5
Number pH of of Eggs j Pond Water
Mean Hatcr.ing Success (^o)
500 1 7.00 1 90
490 4.00 85
490 1 3.75 1 25
100 3.50 1 less tr.an 1
100 ! 3.25 none
18 According to the chart, which conclusion is MOST valid?
A Increases in pH are caused by increases in the number of wood frogs.
B The number of tnais controls the n-jmhe.'" of wood frog eggs tested.
C The hatching success in wood frog eggs decreases as the pH decreases.
D Decreasing the number of wood frog eggs in the pond water increases the hatching success rates.
19 NMiich variable seemed to influence the mean hatching success rate of the wood frog eggs^
F The amount of water
G The number of trials
H The number of eggs
J The pH of pond water
136

^ : ^ > . )
\\v^^ Miilipece
Cer.ticeda
20 Both of these animals have numerous legs. Wnat advantage does this provide?
A Scares other animals
B Confjses predators
C Increases pushing power
D Captures prey
C' R r 1
RR Rr
i '
Rr rr
21 The P'jnnett square above shows a cross between two heteroz^'gous long-haired g^ome: pigs. Virliat is the chance of any of the offspring ha%'ing short hair^
F
G
H
J
0%
25 Tc
50^c
75~<r
137

\ 1 | . . >UI
Area
A ^
>^j!tiljl;'V:fl,;:/.'^."':viV.i:r.:',':,'.'iii,r'iii'-j:''v/p^'i,'-''-, i ' i , r ' i i i - j :"i^p^' ' , ' - ' ' , i ' ;. - W f . - '
A.:
->iiii I,, .J ^ . „
Area II
22 Lightning struck and ignited a tree in both Area I and Area II. More trees were killed or damaged in Area I because of the —
A population densit>'
B amount of water available
C tree size
D tree r.^ie
138

Use the graph below to answer questions 23 and 24.
Populations of Long-tailed Mealybugs and Mealvbua Predators on Citrus Trees
7001 '-
600
500 V)
5 400 .a i 300 2
200 100
0 M
1 i 1 ' A ' MeaiyDUyS 1 / i \ i MealvbuQ i / ; \ 1 Hreaatcrs
/ • \ • . . •
' / ' \ ' / ' / ' \ | S I
/ ''' ' iV '\ 1 ^ .' 1 ^ N . . I l l -^ ' ' ^^' ' - . « « . , as Apr May Jun Jul Aug Sep Oct Nov 0 SC
23 Which conclusion is best supported by the graph?
F Mealybugs and thefr predators deposit eggs in the winter months.
G Mealybug populations are smaller than their predator populations.
H Mealybug predators are more tolerant of warm temperatures than mealybugs.
J Mealybug predator populations are affected by the number of mealybugs.
24 According to this graph, which of these is M O S T dependent on the time of the year?
A The number of mealybugs
B The kind of mealybugs
C The size of the mealybugs
D The kind of mealybug predators
25 Which of these is the advanLage of using the low power objective over using the high power objective of a microscope?
F More detailed structures can be seen.
G More area can be seen at one time.
H Smaller organisms can be seen.
J Shorter depth of field can be produced.
Lignt 6C°2 * 6H2O chloropnyli* C^^'205 ^ 6O2?
26 The equation shows the reaction for photosvTithesis. According to the equation, one PRODUCT of photos\Tithesis is —
A carbon dioxide
B chlorophyll
C water
D ox>-gen
27 Organisms labeled as "pathogenic" should be handled with care because they —
F take oxygen from the air
G produce alcohol
H release explosive gases
J cause diseases
139

28 An entomologist wants to determine whether cold temperature triggers hihemation in insects. Which of these variables is LEAST important to control in this experiment?
A The temperature of the air in the insect cages
B The length of time the insects are e.tposed to each temperature
C The r-npe of insects used in the experiment
D The type of cages in which the insects are placed
29 Each of the following graphs represents the human population in a different country. Which of these populations has the largest number of people over the age of 60?
H
es* « 75-34
5 60-74
C 45-59
§, z:>-i^
Maies
'
1 1
1 1 1
1
-err^es
1
I
"^ 15-23 1 1
0-14 i l l 1 1 1 1 1
as. 1/1 75-&4
i 60-74 C 4 ^ : 9
CT 3 0 - U
'^ 15-29
.Majes
Poputauon
I 1 > ' 1
Females
1
0-14 , ' 1 1 1 ( . 1
es* ^ 75-54
= 60-74
C -15-59 o - - . ,
" 15-29 0-14 ,
8 5 *
>n 75-34 = 6C^74
C 45-59 i i 3C -t4
" 15-291
Males
, i
1 1
MaJes
r" 1
0 Po;ui ; luon
1
1
1
i 1
1 1
Popu
r
1330
1
Females
1
'
1
n
Fema:es
1
1
1 1
0-14 1 1 1 1 1 1 ' 1 1
— Poou
1
laoon
140

30 The s tructure of a ceil is most closely related to its —
A age
B fiincnon
C size
D color
31 The name "carbohydrates' indicates that comoounds contain all of the following E X C E P T —
F carbon
G oxygen
H hydrogen
J phosphorus
220
2B0
iftn
2
!c ' * u
Q 1»
a 2 100
LU
1 " £>
1 60 2r
40
20
; \
:^ \ :A \
I •
•
— SunaaPi^ Hoooao Pas
I A / \
J
- • \
2 4 6 8 10 12 14 :6 18 20 Z2 24 25 28 30 32
TriaJs
32 These data were obtained during an experiment in which guinea pigs and hooded rats were trained to run a maze. Which conclusion is best supported by these data?
A Hooded rats leam faster than guinea pigs.
B Guinea pigs learned more than hooded rats.
C Guinea pigs remember longer than hooded rats do.
D Hooded rats make more errors than guinea pigs.
141

33 ^ l i i ch of these will correctly complete the missing bases of DNA?
F CGA
G G€T
H TAG
J TCG
34 I>ry sand should be kept in the laix)rator>' to be used to —
A absorb harmful gases
B e.Ttinguish small fires
C prevent rust
D kill bacteria
Crayfish — > - Raccoon 4 I Snake
Dragonfly A nymph ^ ^ ^
k Frog Clam
Beetle ^
/ / Mosqu
\ Algae
ito
\
Bird 4
Dragonfly
35 If all of the frogs in an area were killed, there would probably be a sudden DECREASE m the number of —
F snakes
G raccoons
H birds
J dragonflies
36 .\ grocer wanted to conduct a controlled experiment to determine the effect of storage temperature on the rate at which mWV spoils, ^"hich of these factors would be the LEAST important consideration when planning the experiment?
A The range of temperatures at which the milk is stored
B The length of time the rr.-ik is held at each temperature
C The tv-pe of refrigerator used
D The age of the milk prior to testing
142

37 Which bird would most hkelv eat seeds?
143

38 V»"nat :s the average length of these organisms?
A 1.0 mm
B 0.1 mm
C 0.2 mm
D 0.5 mm
^/^/C^/^ Nutrition Facts Serving Size: 1 can (3£5 ml)
Vnojni Pef Safvina
CaJones 0 *i Car* va!ue'
Total Fat Oo Soaium 35.0a Total Camonvcrate 0.8a Sucars Go Protein Og
'v1ta;nin A 1.8% • Vltaniin C 1.8% r.i>>oSavin 1.3% • CaJaum 1.3% -
0°'o 1.75°o 001 "'o
0% 0%
• Niacn 1.8% TT-jamine 1 £°'o
'^cara.'ne (Aspamc Acd • Phenylalanine • V,e;nyi • Es;er)« Potassium Ber.zoa!e (Preservatrvei
' Psrcant Oilfy Viiue'.ara Cis«a on j 2000 caiona d)eL Your Caily Value n-jv oe nigner or lov¥«f. oeoencmg on your caiona n^^ai.
39 .According to this soft drink label, which of these contains phenylalanine?
F Riboflavin
G Niacin
H Potassium Benzoate
J Aspartame
144

40 Which of tnese MUST a 10-meter-tail terresrrtai plant have m order to rLirvive?
A Rapid seed dispersal
B A broad canopy of leaves
C Colorful flowers
D An extensive vascular svstem
Number of Lent and Darx Moths CciIec:eo in a Feres:
100 A . . ^ ^ ^
Pe.-rent of
Mct.^.s
• - - • .
Key
—— Oarx McTs
Years Cc.lecteo
41 If the trends shown in this grach ccnn. forest will have —
F mostiy dark moths
G mostly Light moths
H a smaller total number of mcths
lue, t:
145

42 The animal above is a t>-pical bfrd of prey, ^"hich characteristic may be used to idennr.' this bird as a predator?
A The length of the wings
B The shape of the feet
C The size of the eyes
D The width of the tail
146

APPENDIX D
CORRELATION OF ALL VARIABLES
147

• —
<. r s
Lm
' - J • ^
1 ih
i
v5 c o E u <,
" •J'.
f~^
^ --» ^ ^ ' J
•^ — —
^ < — (5
--) —
rs
H
All
;/:
•y^
H
V
£-L
;; , • ^
)7
- r
-w
'/", «
1
-» - T • ^
t" • »
•» yr,
<^\ ,'
* r s rsi
i
* •
«/ r^i 1
r*-
O O
l '
. ; n j
—L
«
-» r j
'*", "
r^J
1
• T
T
rsi
;£
r*-',
1
N T
* • N T
«/", _ l "
* oo «»
1
« •
-«-o r j
1
r*-O o . r
« •
« — s ^
1
r j
« •
f S - 1 -o
1
' • * " ,
OO
O*
1
r i
« •
* sC
>/", ,
1*
•» - T r 4
f"
* • N C
'^ r^,
' • * !
• — •
'-r * * T
'^
* n-i
•«> O r--o
^ sT
1
•/".
r*-,
r s i
' • * ' .
sO
o
r^
(=)
* r j o
1
•» « •
- r o
r
r ^ O
1
" r r
1
-•
* o — —
D C
1
• . _ . .
r r
1
O^ r^.
• ^
^^ c ;
: r^,
\ * •
* '' . ~
r -»/ .^
1
* KT.
—^ ^
f " ^ ,
1
•
^ V ,
—
1
•-»\
»/". —
-—
w ^
r*~:
r-~ —
r--N C
'--* • »
^ r-
1
or. - T
1
* — • ^
(-Nl
ly".
1
•» - T - T
,
o o o
o o
«-n r J
>y~. rsi
1 - ^
T
rs»
• ^
r-r ^
(
^ V H
1
r j
r j 1
'~* , — —
i ^ ,
r---
so o
« * < N
r^, r s
ur, r*-,
•» ^^ OO
1
^ ' ' ^ i
I
* r j C^ - r
rsi
t^i ^r.
—' • ^
- - ^ v
'^^
O m — r^ r J
O
^ i ^ o
1
r*"
•""' 1
r^j rs i r ^
r^j so
1
> 1 ^
1
^
r^
^ — •
— : ,: O
OC t ^
^
- T
« — '
- r r*",
OC
'J^ oc
^ M H -
. ,
0^ v^ O
>r-,
1
sO OC
^.
—
»r-. v~. • — ;
'—'
O
O
—
r*-, »y.
"" , —
r n
l y ,
« • »
1 ^
r s
« • rs j r-
i '
- - V
• T
• »
* ( N
— sC
* * • ^
•;2
•M-
r*~
^
• — •
— • — •
• y * OC
o
—
CM
o •
r^r. •n-r*",
« « •
r*",
•» •» r*^, or.
^
ty", T
KT,
C^ t ^
OC
9
.^
_ sC
"~ r*~
, —
sT
* sT • ^
> N C
i ^
r j
o CM
r-~ r-. n
^ . , ; r
'/-. T
"~" <i
O
1 W-,
r*-,
*
• »
•
^ rt
>/",
• — .
1
o : , o
r j T
^ ^ CM
'' ,
* "~ r* , sC
« » I - -
^
O O
"—'
sC
''. ^ ^ '•
OC
« CJ
• T -
^C
;^ - --^.
—
1 r^ r^ r^
o o
* N C OC •y .
'. ^ .^ : ;. __
^ >c ^ ^ r j
o
-'
3 ' _« . r j . __
:=t —
o
-
CO
CO
'^ >
"TO
o
</) •4—'
c 0) o 0 o o c o
O
o
ro H
<
;/:
< v :
^ H [ —
L . ' V
^ •
f -t— U J
oi.
-^m
H H LLl (Y C-t _
f -
V ?
/ ^ a .
I—
r~-OC r^
C_
;— > — c/ ^ £
—
1^1
_,
—
3C
C
CC ni
:—•
—
» • r-1 n ^
* •
^ r-~ •y*,
* * vO O u-i
•
^ sC 3C
• •
r-~ O r-
; -r
^
r i
•y-, r^
r* , 3C
« •
o - r
• • r i
^ vO
•
« r s | r ^ V-)
«-CM
> ^
o ^ ^
>;
OC
—.
5C
>-
l y .
* * OC 1 ^ sC
« •
''' ; •T->r.
• •
^ — sC
: ^ ^ —
i
r**. OC
- T rsr
(
r^ —
* * T OC OC
• •
'' , r^j r-
:;3; o ;C^
P
r-
—
r j t / - ,
— 1
r,_ ,:
* * •
O s ^
c^
,'"' o o
- v '
OC r^i
OC r^,
»
r*-OC
^ c^ : •
' * •
r N
OC OJ r*
O
*
<
sC •T
5^
O
<
^ • — ;
<
r\i
< y.
• _ *
'J
1 Ic
lplii
lncs
s ^
SIM
R
IS
r.f)
.:;
1 liu
lcrs
tan >-.
- J
-z •J
Zh
Ad
mo
nis
h
1 th
nic
ity 1 ^
CM . — rN "Tj
> •_<
'J >
•J —
148