student enrollment forms enrollment of cte … gov't & pub. admin. health science...
TRANSCRIPT

Amended Performance Data Date of Filing Amended Data: _______________________
Number of Adult Students
Number of Secondary Tech Prep Students
1 GRAND TOTAL 23 Male 4 Female 56 American Indian or Alaskan Native7 Asian or Pacific Islander8 Black (not Hispanic)9 Hispanic10 White11 Unknown1213 American Indian or Alaska Native14 Asian15 Black or African American16 Hispanic/Latino17 Native Hawaiian or Other Pacific Islander18 White19 Two or More Races20 Unknown (Postsecondary Only)2122 Individuals With Disabilities (ADA)23 Disability Status (ESEA/IDEA) (Secondary Only)24 Economically Disadvantaged25 Single Parents26 Displaced Homemakers27 Limited English Proficient28 Migrant Status29 Nontraditional Enrollees
Number of Postsecondary
Tech Prep Students
SPECIAL POPULATION AND OTHER STUDENT CATEGORIES
RACE/ETHNICITY* (1977 Standards)
GENDER
RACE/ETHNICITY* (1997 Revised Standards)
Student Enrollment Forms
PROGRAM YEARSTATE
ENROLLMENT OF CTE PARTICIPANTS
Line PopulationNumber of
Postsecondary Students
Number of Secondary Students
*See "Definition of Terms" for guidance with reporting the Race and Ethnicity Categories.
Additional Information:
Table 1 of 2

Amended Performance Data Date of Filing Amended Data: _______________________
Agri. Food & Nat. Resources
Architecture & Const.
Arts, A/V Tech. & Comm.
Bus., Mgt. & Admin.
Education & Training
Finance Gov't & Pub. Admin.
Health Science
Hospitality & Tourism
Human Services
Info. Tech. Law, Pub. Safety & Security
Manufac. Mkt. Sales & Serv.
Sci., Tech, Engin. &
Math.
Transp., Distrib. & Logistics
12 Female3 Male4 Total56 Female7 Male8 Total910 Female11 Male12 Total
13GRAND TOTAL (Lines 4+8+12)
Student Enrollment FormsENROLLMENT OF CTE CONCENTRATORS
STATE
Additional Information:
POSTSECONDARY
ADULT
PROGRAM YEAR
SECONDARY
Line Population
Table 2 of 2

Amended Performance Data Date of Filing Amended Data: _______________________
1 GRAND TOTALPre-populated from
the FAUPL23 Male 4 Female 56 American Indian or Alaskan Native7 Asian or Pacific Islander8 Black (not Hispanic)9 Hispanic10 White11 Unknown1213 American Indian or Alaska Native14 Asian15 Black or African American16 Hispanic/Latino17 Native Hawaii or Other Pacific Islander18 White 19 Two or More Races2021 Individuals With Disabilities (ADA)22 Disability Status (ESEA/IDEA)23 Economically Disadvantaged24 Single Parents25 Displaced Homemakers26 Limited English Proficient27 Migrant Students28 Nontraditional Enrollees29 Tech Prep
Additional Information:
RACE/ETHNICITY* (1997 Revised Standards)
SPECIAL POPULATIONS AND OTHER STUDENT CATEGORIES
Line Population
*See "Definition of Terms" for guidance with reporting the Race and Ethnicity Categories.
Number of Students in the Denominator
Number of Students in the
Numerator
State Adjusted Level of
Performance
Actual Level of Performance
Adjusted vs. Actual Level of Performance
Met 90% of AdjustedLevel of
Performance (Y,N)
RACE/ETHNICITY* (1977 Standards)
GENDER
Student Accountability Forms for the Section 113 Core Indicators of Performance (Title I) SECONDARY LEVEL
1S1: ATTAINMENT OF ACADEMIC SKILLS - READING/LANGUAGE ARTS
STATEPROGRAM YEAR
Table 1 of 22

Amended Performance Data Date of Filing Amended Data: _______________________
1 GRAND TOTALPre-populated from
the FAUPL2 GENDER3 Male 4 Female 56 American Indian or Alaskan Native7 Asian or Pacific Islander8 Black (not Hispanic)9 Hispanic10 White11 Unknown1213 American Indian or Alaska Native14 Asian or Pacific Islander15 Black or African American16 Hispanic/Latino17 Native Hawaiian or Other Pacific Islander18 White 19 Two or More Races2021 Individuals With Disabilities (ADA)22 Disability Status (ESEA/IDEA)23 Economically Disadvantaged24 Single Parents25 Displaced Homemakers26 Limited English Proficient27 Migrant Students28 Nontraditional Enrollees29 Tech Prep
Student Accountability Forms for the Section 113 Core Indicators of Performance (Title I) SECONDARY LEVEL
1S2: ATTAINMENT OF ACADEMIC SKILLS - MATHEMATICS
STATEPROGRAM YEAR
Line PopulationNumber of
Students in the Numerator
Number of Students in the Denominator
State Adjusted Level of
Performance
Actual Level of Performance
Adjusted vs. Actual Level of Performance
Met 90% of Adjusted Level of Performance (Y,N)
RACE/ETHNICITY* (1997 Revised Standards)
RACE/ETHNICITY* (1977 Standards)
SPECIAL POPULATIONS AND OTHER STUDENT CATEGORIES
*See "Definition of Terms" for guidance with reporting the Race and Ethnicity Categories.
Additional Information:
Table 2 of 22

Amended Performance Data Date of Filing Amended Data: _______________________
1 GRAND TOTAL Pre-populated from the FAUPL
23 Male 4 Female 56 American Indian or Alaskan Native7 Asian or Pacific Islander8 Black (not Hispanic)9 Hispanic10 White11 Unknown1213 American Indian or Alaska Native14 Asian15 Black or African American16 Hispanic/Latino17 Native Hawaiian or Other Pacific Islander18 White19 Two or More Races2021 Individuals With Disabilities (ADA)22 Disability Status (ESEA/IDEA)23 Economically Disadvantaged24 Single Parents25 Displaced Homemakers26 Limited English Proficient27 Migrant Students28 Nontraditional Enrollees29 Tech Prep
Student Accountability Forms for the Section 113 Core Indicators of Performance (Title I) SECONDARY LEVEL
2S1: TECHNICAL SKILL ATTAINMENT
STATEPROGRAM YEAR
Line PopulationMet 90% of Adjusted
Level of Performance (Y,N)
Adjusted vs. Actual Level of Performance
Actual Level of Performance
State Adjusted Level of
Performance
Number of Students in the Denominator
Number of Students in the
Numerator
*See "Definition of Terms" for guidance with reporting the Race and Ethnicity Categories.
Additional Information:
RACE/ETHNICITY* (1977 Standards)
RACE/ETHNICITY* (1997 Revised Standards)
SPECIAL POPULATIONS AND OTHER STUDENT CATEGORIES
GENDER
Table 3 of 22

Amended Performance Data Date of Filing Amended Data: _______________________
1 GRAND TOTAL Pre-populated from the FAUPL
23 Male 4 Female 56 American Indian or Alaskan Native7 Asian or Pacific Islander8 Black (not Hispanic)9 Hispanic10 White11 Unknown1213 American Indian or Alaska Native14 Asian15 Black or African American16 Hispanic/Latino17 Native Hawaii or Other Pacific Islander18 White19 Two or More Races2021 Individuals With Disabilities (ADA)22 Disability Status (ESEA/IDEA)23 Economically Disadvantaged24 Single Parents25 Displaced Homemakers26 Limited English Proficient27 Migrant Students28 Nontraditional Enrollees29 Tech Prep3031 General Education Development (GED)32 Diploma33 Certificate
Number of Students in the
Numerator
Student Accountability Forms for the Section 113 Core Indicators of Performance (Title I) SECONDARY LEVEL
3S1: SCHOOL COMPLETION
STATEPROGRAM YEAR
SUBINDICATORS
*See "Definition of Terms" for guidance with reporting the Race and Ethnicity Categories.
Line PopulationMet 90% of Adjusted Level of Performance
(Y,N)
Adjusted vs. Actual Level of Performance
Actual Level of Performance
State Adjusted Level of
Performance
Number of Students in the Denominator
Additional Information:
GENDER
RACE/ETHNICITY* (1977 Standards)
RACE/ETHNICITY* (1997 Revised Standards)
SPECIAL POPULATIONS AND OTHER STUDENT CATEGORIES
Table 4 of 22

Amended Performance Data Date of Filing Amended Data: _______________________
1 GRAND TOTAL Pre-populated from the FAUPL
23 Male 4 Female 56 American Indian or Alaskan Native7 Asian or Pacific Islander8 Black (not Hispanic)9 Hispanic10 White11 Unknown1213 American Indian or Alaska Native14 Asian15 Black or African American16 Hispanic/Latino17 Native Hawaii or Other Pacific Islander18 White19 Two or More Races2021 Individuals With Disabilities (ADA)22 Disability Status (ESEA/IDEA)23 Economically Disadvantaged24 Single Parents25 Displaced Homemakers26 Limited English Proficient27 Migrant Students28 Nontraditional Enrollees29 Tech Prep
Student Accountability Forms for the Section 113 Core Indicators of Performance (Title I) SECONDARY LEVEL
4S1: STUDENT GRADUATION RATES
STATEPROGRAM YEAR
Line PopulationNumber of
Students in the Denominator
Number of Students in the
Numerator
*See "Definition of Terms" for guidance with reoprting the Race and Ethnicity Categories.
Additional Information:
RACE/ETHNICITY* (1997 Revised Standards)
SPECIAL POPULATIONS AND OTHER STUDENT CATEGORIES
Met 90% of Adjusted Level of
Performance (Y,N)
Adjusted vs. Actual Level of Performance
Actual Level of Performance
State Adjusted Level of
Performance
GENDER
RACE/ETHNICITY* (1977 Standards)
Table 5 of 22

Amended Performance Data Date of Filing Amended Data: _______________________
1 GRAND TOTAL Pre-populated from FAUPL
23 Male 4 Female 56 American Indian or Alaskan Native7 Asian or Pacific Islander8 Black (not Hispanic)9 Hispanic
10 White11 Unknown1213 American Indian or Alaska Native14 Asian15 Black or African American16 Hispanic/Latino17 Native Hawaiian or Other Pacific Islander18 White19 Two or More Races2021 Individuals With Disabilities (ADA)22 Disability Status (ESEA/IDEA)23 Economically Disadvantaged24 Single Parents25 Displaced Homemakers26 Limited English Proficient27 Migrant Students28 Nontraditional Enrollees29 Tech Prep3031 Advanced Training32 Employment33 Military34 Postsecondary Education
Student Accountability Forms for the Section 113 Core Indicators of Performance (Title I) SECONDARY LEVEL
5S1: PLACEMENT
STATEPROGRAM YEAR
SUBINDICATORS
Line PopulationMet 90% of
Adjusted Level of Performance (Y,N)
Adjusted vs. Actual Level of Performance
Actual Level of Performance
State Adjusted Level of
Performance
Number of Students in the Denominator
Number of Students in the
Numerator
*See "Definition of Terms" for guidance with reporting the Race and Ethnicity Categories.
Additional Information:
GENDER
RACE/ETHNICITY* (1977 Standards)
RACE/ETHNICITY* (1997 Revised Standards)
SPECIAL POPULATIONS AND OTHER STUDENT CATEGORIES
Table 6 of 22

Amended Performance Data Date of Filing Amended Data: _______________________
1 GRAND TOTAL Pre-populated from FAUPL
23 Male4 Female56 American Indian or Alaskan Native7 Asian or Pacific Islander8 Black (not Hispanic)9 Hispanic10 White11 Unknown (For Postsecondary Only)1213 American Indian or Alaska Native14 Asian15 Black or African American16 Hispanic/Latino17 Native Hawaiian or Other Pacific Islander18 White19 Two or More Races2021 Individuals With Disabilities (ADA)22 Disability Status (ESEA/IDEA)23 Economically Disadvantaged24 Single Parents25 Displaced Homemakers26 Limited English Proficient27 Migrant Students28 Tech Prep
Student Accountability Forms for the Section 113 Core Indicators of Performance (Title I) SECONDARY LEVEL
6S1: NONTRADITIONAL PARTICIPATION
STATEPROGRAM YEAR
Line PopulationMet 90% of Adjusted
Level of Performance (Y,N)
Adjusted vs. Actual Level of Performance
Actual Level of Performance
State Adjusted Level of
Performance
Number of Students in the Denominator
Number of Students in the
Numerator
*See "Definition of Terms" for guidance with reporting the Race and Ethinicity Categories.
Additional Information:
GENDER
RACE/ETHNICITY* (1977 Standards)
SPECIAL POPULATIONS AND OTHER STUDENT CATEGORIES
RACE/ETHNICITY* (1997 Revised Standards)
Table 7 of 22

Amended Performance Data Date of Filing Amended Data: _______________________
1 GRAND TOTAL Pre-populated from FAUPL
23 Male 4 Female 56 American Indian or Alaskan Native7 Asian or Pacific Islander8 Black (not Hispanic)9 Hispanic10 White11 Unknown1213 American Indian or Alaska Native14 Asian15 Black or African American16 Hispanic/Latino17 Native Hawaiian or Other Pacific Islander18 White19 Two or More Races2021 Individuals With Disabilities (ADA)22 Disability Status (ESEA/IDEA)23 Economically Disadvantaged24 Single Parents25 Displaced Homemakers26 Limited English Proficient27 Migrant Students28 Tech Prep
*See "Definition of Terms" for guidance with reporting the Race and Ethinicity Categories.
State Adjusted Level of
Performance
Actual Level of Performance
Adjusted vs. Actual Level of Performance
Met 90% of Adjusted Level of
Performance (Y,N)
Student Accountability Forms for the Section 113 Core Indicators of Performance (Title I) SECONDARY LEVEL
6S2: NONTRADITIONAL COMPLETION
STATEPROGRAM YEAR
Line PopulationNumber of
Students in the Numerator
Number of Students in the Denominator
GENDER
RACE/ETHNICITY* (1977 Standards)
RACE/ETHNICITY* (1997 Revised Standards)
SPECIAL POPULATIONS AND OTHER STUDENT CATEGORIES
Additional Information:
Table 8 of 22

Amended Performance Data Date of Filing Amended Data: _______________________
1 GRAND TOTAL Pre-populated from FAUPL
23 Male 4 Female 56 American Indian or Alaskan Native7 Asian or Pacific Islander8 Black (not Hispanic)9 Hispanic10 White11 Unknown1213 American Indian or Alaska Native14 Asian15 Black or African American16 Hispanic/Latino17 Native Hawaiian or Other Pacific Islander18 White19 Two or More Races20 Unknown2122 Individuals With Disabilities (ADA)23 Economically Disadvantaged24 Single Parents25 Displaced Homemakers26 Limited English Proficient27 Nontraditional Enrollees28 Tech Prep
*See "Definition of Terms" for guidance with reporting the Race and Ethinicity Categories.
Met 90% of Adjusted Level of
Performance (Y,N)
Adjusted vs. Actual Level of Performance
Actual Level of Performance
State Adjusted Level of
Performance
Student Accountability Forms for the Section 113 Core Indicators of Performance (Title I) POSTSECONDARY LEVEL
1P1: TECHNICAL SKILL ATTAINMENT
STATEPROGRAM YEAR
Line PopulationNumber of
Students in the Denominator
Number of Students in the
Numerator
GENDER
RACE/ETHNICITY* (1977 Standards)
RACE/ETHNICITY* (1997 Revised Standards)
SPECIAL POPULATIONS AND OTHER STUDENT CATEGORIES
Additional Information:
Table 9 of 22

Amended Performance Data Date of Filing Amended Data: _______________________
1 GRAND TOTAL Pre-populated from the FAUPL
23 Male 4 Female 56 American Indian or Alaskan Native7 Asian or Pacific Islander8 Black (not Hispanic)9 Hispanic10 White11 Unknown1213 American Indian or Alaska Native14 Asian15 Black or African American16 Hispanic/Latino17 Native Hawaiian or Other Pacific Islander18 White19 Two or More Races20 Unknown2122 Individuals With Disabilities (ADA)23 Economically Disadvantaged24 Single Parents25 Displaced Homemakers26 Limited English Proficient27 Nontraditional Enrollees28 Tech Prep2930 Credential31 Certificate32 Degree
*See "Definition of Terms" for guidance with reporting the Race and Ethinicity Categories.
State Adjusted Level of
Performance
Actual Level of Performance
Adjusted vs. Actual Level of Performance
Met 90% of Adjusted Level of
Performance (Y,N)
Student Accountability Forms for the Section 113 Core Indicators of Performance (Title I) POSTSECONDARY LEVEL
2P1: CREDENTIAL, CERTIFICATE, OR DEGREE
STATEPROGRAM YEAR
Line PopulationNumber of
Students in the Numerator
Number of Students in the Denominator
GENDER
RACE/ETHNICITY* (1997 Revised Standards)
SPECIAL POPULATIONS AND OTHER STUDENT CATEGORIES
RACE/ETHNICITY* (1977 Standards)
SUBINDICATORS
Additional Information:
Table 10 of 22

Amended Performance Data Date of Filing Amended Data: _______________________
1 GRAND TOTAL Pre-populated from FAUPL
23 Male 4 Female 56 American Indian or Alaskan Native7 Asian or Pacific Islander8 Black (not Hispanic)9 Hispanic10 White11 Unknown1213 American Indian or Alaska Native14 Asian15 Black or African American16 Hispanic/Latino17 Native Hawaiian or Other Pacific Islander18 White19 Two or More Races20 Unknown2122 Individuals With Disabilities (ADA)23 Economically Disadvantaged24 Single Parents25 Displaced Homemakers26 Limited English Proficient27 Nontraditional Enrollees28 Tech Prep2030 Retention31 Transfer
*See "Definition of Terms" for guidance with reporting the Race and Ethinicity Categories.
Student Accountability Forms for the Section 113 Core Indicators of Performance (Title I) POSTSECONDARY LEVEL
3P1: STUDENT RETENTION OR TRANSFER
STATEPROGRAM YEAR
State Adjusted Level of
Performance
Actual Level of Performance
Adjusted vs. Actual Level of Performance
Met 90% of Adjusted Level of
Performance (Y,N)Line Population
Number of Students in the
Numerator
Number of Students in the Denominator
Additional Information:
SUBINDICATORS
SPECIAL POPULATIONS AND OTHER STUDENT CATEGORIES
RACE/ETHNICITY* (1997 Revised Standards)
RACE/ETHNICITY* (1977 Standards)
GENDER
Table 11 of 22
Amended Performance Data Date of Filing Amended Data: _______________________
1 GRAND TOTAL Pre-populated from FAUPL
23 Male 4 Female 56 American Indian or Alaskan Native7 Asian or Pacific Islander8 Black (not Hispanic)9 Hispanic10 White11 Unknown1213 American Indian or Alaska Native14 Asian15 Black or African American16 Hispanic/Latino17 Native Hawaiian or Other Pacific Islander18 White19 Two or More Races20 Unknown2122 Individuals With Disabilities (ADA)23 Economically Disadvantaged4 Single Parents25 Displaced Homemakers26 Limited English Proficient27 Nontraditional Enrollees28 Tech Prep2930 Apprenticeship31 Employment32 Military33 Retention
*See "Definition of Terms" for guidance with reporting the Race and Ethinicity Categories.
SUBINDICATORS
Actual Level of Performance
GENDER
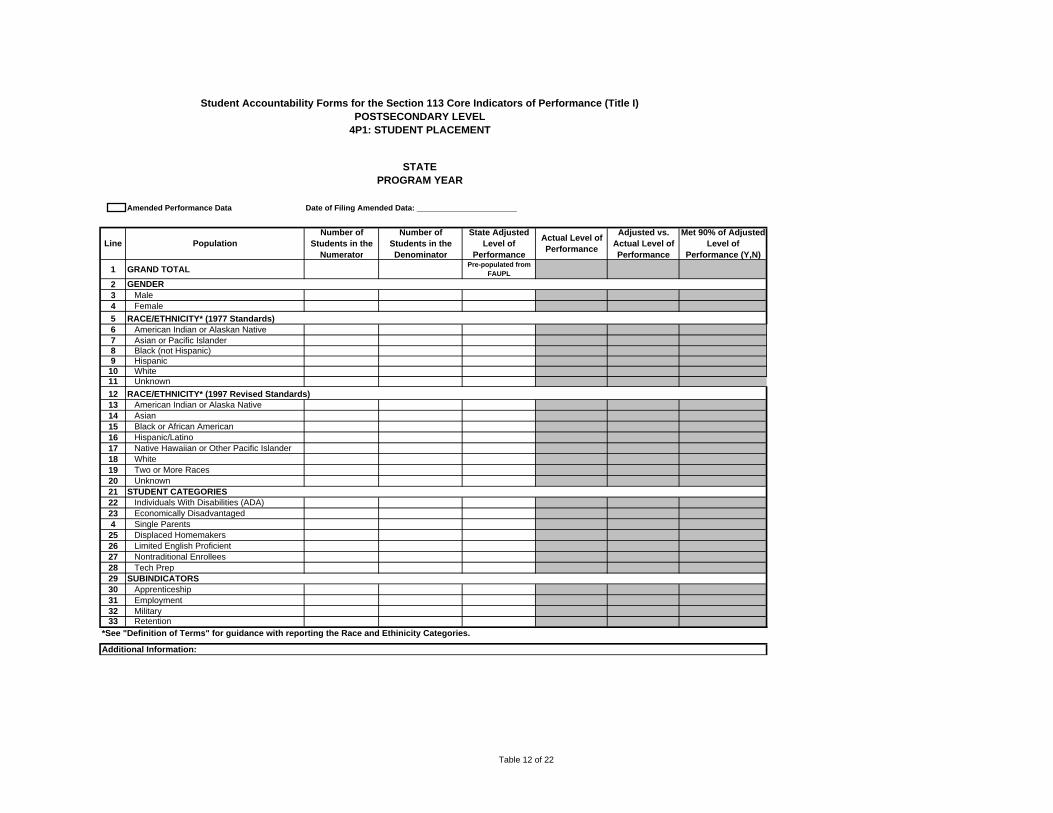
Student Accountability Forms for the Section 113 Core Indicators of Performance (Title I) POSTSECONDARY LEVEL
4P1: STUDENT PLACEMENT
STATEPROGRAM YEAR
Line Population
Additional Information:
RACE/ETHNICITY* (1977 Standards)
RACE/ETHNICITY* (1997 Revised Standards)
STUDENT CATEGORIES
Adjusted vs. Actual Level of Performance
Met 90% of Adjusted Level of
Performance (Y,N)
State Adjusted Level of
Performance
Number of Students in the
Numerator
Number of Students in the Denominator
Table 12 of 22

Amended Performance Data Date of Filing Amended Data: _______________________
1 GRAND TOTAL Pre-populated from FAUPL
23 Male 4 Female 5 GRAND TOTAL56 American Indian or Alaskan Native7 Asian or Pacific Islander8 Black (not Hispanic)9 Hispanic10 White11 Unknown1213 American Indian or Alaska Native14 Asian15 Black or African American16 Hispanic/Latino17 Native Hawaiian or Other Pacific Islander18 White19 Two or More Races20 Unknown2122 Individuals With Disabilities (ADA)23 Economically Disadvantaged24 Single Parents25 Displaced Homemakers26 Limited English Proficient27 Tech Prep
*See "Definition of Terms" for guidance with reporting the Race and Ethinicity Categories.
Student Accountability Forms for the Section 113 Core Indicators of Performance (Title I) POSTSECONDARY LEVEL
5P1: NONTRADITIONAL PARTICIPATION
STATEPROGRAM YEAR
Line PopulationNumber of
Students in the Numerator
Number of Students in the Denominator
GENDER
RACE/ETHNICITY* (1977 Standards)
RACE/ETHNICITY* (1997 Revised Standards)
SPECIAL POPULATIONS AND OTHER STUDENT CATEGORIES
Additional Information:
State Adjusted Level of
Performance
Actual Level of Performance
Adjusted vs. Actual Level of Performance
Met 90% of Adjusted Level of
Performance (Y,N)
Table 13 of 22

Amended Performance Data Date of Filing Amended Data: _______________________
1 GRAND TOTAL Pre-populated from the FAUPL
23 Male 4 Female 56 American Indian or Alaskan Native7 Asian or Pacific Islander8 Black (not Hispanic)9 Hispanic10 White11 Unknown1213 American Indian or Alaska Native14 Asian15 Black or African American16 Hispanic/Latino17 Native Hawaiian or Other Pacific Islander18 White19 Two or More Races20 Unknown2122 Individuals With Disabilities (ADA)23 Economically Disadvantaged24 Single Parents25 Displaced Homemakers26 Limited English Proficient27 Tech Prep
*See "Definition of Terms" for guidance with reporting the Race and Ethinicity Categories.
Student Accountability Forms for the Section 113 Core Indicators of Performance (Title I) POSTSECONDARY LEVEL
5P2: NONTRADITIONAL COMPLETION
STATEPROGRAM YEAR
Line PopulationNumber of
Students in the Numerator
Number of Students in the Denominator
GENDER
RACE/ETHNICITY* (1997 Revised Standards)
SPECIAL POPULATIONS AND OTHER STUDENT CATEGORIES
RACE/ETHNICITY* (1977 Standards)
Additional Information:
State Adjusted Level of
Performance
Actual Level of Performance
Adjusted vs. Actual Level of Performance
Met 90% of Adjusted Level of
Performance (Y,N)
Table 14 of 22

Amended Performance Data Date of Filing Amended Data: _______________________
1 GRAND TOTAL Pre-populated from the FAUPL
23 Male 4 Female 56 American Indian or Alaskan Native7 Asian or Pacific Islander8 Black (not Hispanic)9 Hispanic10 White11 Unknown1213 American Indian or Alaska Native14 Asian15 Black or African American16 Hispanic/Latino17 Native Hawaiian or Other Pacific Islander18 White18 Two or More Races20 Unknown2122 Individuals With Disabilities (ADA)23 Economically Disadvantaged24 Single Parents25 Displaced Homemakers26 Limited English Proficient27 Nontraditional Enrollees28 Tech Prep
*See "Definition of Terms" for guidance with reporting the Race and Ethinicity Categories.
Line PopulationNumber of
Students in the Numerator
Number of Students in the Denominator
State Adjusted Level of
Performance
SPECIAL POPULATIONS AND OTHER STUDENT CATEGORIES
RACE/ETHNICITY* (1997 Revised Standards)
RACE/ETHNICITY* (1977 Standards)
GENDER
Student Accountability Forms for the Section 113 Core Indicators of Performance (Title I) ADULT LEVEL
1A1: TECHNICAL SKILL ATTAINMENT
STATEPROGRAM YEAR
Met 90% of Adjusted Level of
Performance (Y,N)
Adjusted vs. Actual Level of Performance
Actual Level of Performance
Additional Information:
Table 15 of 22

Amended Performance Data Date of Filing Amended Data: _______________________
1 GRAND TOTAL Pre-populated from the FAUPL
23 Male 4 Female 56 American Indian or Alaskan Native7 Asian or Pacific Islander8 Black (not Hispanic)9 Hispanic10 White11 Unknown1213 American Indian or Alaska Native14 Asian15 Black or African American16 Hispanic/Latino17 Native Hawaiian or Other Pacific Islander18 White19 Two or More Races20 Unknown2122 Individuals With Disabilities (ADA)23 Economically Disadvantaged24 Single Parents25 Displaced Homemakers26 Limited English Proficient27 Nontraditional Enrollees28 Tech Prep2930 Credential31 Certificate32 Degree
*See "Definition of Terms" for guidance with reporting the Race and Ethinicity Categories.
State Adjusted Level of
Performance
Adjusted vs. Actual Level of Performance
Met 90% of Adjusted Level of
Performance (Y,N)Line Population
Number of Students in the
Numerator
Number of Students in the Denominator
Student Accountability Forms for the Section 113 Core Indicators of Performance (Title I) ADULT LEVEL
2A1: CREDENTIAL, CERTIFICATE, OR DEGREE
STATEPROGRAM YEAR
Additional Information:
GENDER
Actual Level of Performance
RACE/ETHNICITY* (1977 Standards)
RACE/ETHNICITY* (1997 Revised Standards)
SPECIAL POPULATIONS AND OTHER STUDENT CATEGORIES
SUBINDICATORS
Table 16 of 22

Amended Performance Data Date of Filing Amended Data: _______________________
1 GRAND TOTAL Pre-populated from the FAUPL
23 Male 4 Female 56 American Indian or Alaskan Native7 Asian or Pacific Islander8 Black (not Hispanic)9 Hispanic10 White11 Unknown1213 American Indian or Alaska Native14 Asian15 Black or African American16 Hispanic/Latino17 Native Hawaiian or Other Pacific Islander18 White19 Two or More Races20 Unknown2122 Individuals With Disabilities (ADA)23 Economically Disadvantaged24 Single Parents25 Displaced Homemakers26 Limited English Proficient27 Nontraditional Enrollees28 Tech Prep2930 Retention31 Transfer
*See "Definition of Terms" for guidance with reporting the Race and Ethinicity Categories.
Line Population
Additional Information:
Met 90% of Adjusted Level of
Performance (Y,N)
Adjusted vs. Actual Level of Performance
Actual Level of Performance
State Adjusted Level of
Performance
SUBINDICATORS
Student Accountability Forms for the Section 113 Core Indicators of Performance (Title I) ADULT LEVEL
3A1: STUDENT RETENTION OR TRANSFER
STATEPROGRAM YEAR
Number of Students in the Denominator
Number of Students in the
Numerator
GENDER
RACE/ETHNICITY* (1997 Revised Standards)
RACE/ETHNICITY* (1977 Standards)
SPECIAL POPULATIONS AND OTHER STUDENT CATEGORIES
Table 17 of 22

Amended Performance Data Date of Filing Amended Data: _______________________
1 GRAND TOTAL Pre-populated from FAUPL
2 GENDER3 Male 4 Female 56 American Indian or Alaskan Native7 Asian or Pacific Islander8 Black (not Hispanic)9 Hispanic10 White11 Unknown1213 American Indian or Alaska Native14 Asian15 Black or African American16 Hispanic/Latino17 Native Hawaii or Other Pacific Islander18 White19 Two or More Races20 Unknown2122 Individuals With Disabilities (ADA)23 Economically Disadvantaged24 Single Parents25 Displaced Homemakers26 Limited English Proficient27 Nontraditional Enrollees28 Tech Prep2930 Apprenticeship31 Employment32 Military33 Retention
*See "Definition of Terms" for guidance with reporting the Race and Ethinicity Categories.
Line PopulationNumber of
Students in the Numerator
Number of Students in the Denominator
Met 90% of Adjusted Level of
Performance (Y,N)
Adjusted vs. Actual Level of Performance
Actual Level of Performance
State Adjusted Level of
Performance
Student Accountability Forms for the Section 113 Core Indicators of Performance (Title I) ADULT LEVEL
4A1: STUDENT PLACEMENT
STATEPROGRAM YEAR
SPECIAL POPULATIONS AND OTHER STUDENT CATEGORIES
RACE/ETHNICITY* (1997 Revised Standards)
RACE/ETHNICITY* (1977 Standards)
Additional Information:
SUBINDICATORS
Table 18 0f 22

Amended Performance Data Date of Filing Amended Data: _______________________
1 GRAND TOTAL Pre-populated from FAUPL
23 Male 4 Female 56 American Indian or Alaskan Native7 Asian or Pacific Islander8 Black (not Hispanic)9 Hispanic10 White11 Unknown1213 American Indian or Alaska Native14 Asian15 Black or African American16 Hispanic/Latino17 Native Hawaiian or Other Pacific Islander18 White19 Two or More Races20 Unknown2122 Individuals With Disabilities (ADA)23 Economically Disadvantaged24 Single Parents25 Displaced Homemakers26 Limited English Proficient27 Tech Prep
*See "Definition of Terms" for guidance with reporting the Race and Ethinicity Categories.
SPECIAL POPULATIONS AND OTHER STUDENT CATEGORIES
RACE/ETHNICITY* (1997 Revised Standards)
RACE/ETHNICITY* (1977 Standards)
GENDER
Additional Information:
Student Accountability Forms for the Section 113 Core Indicators of Performance (Title I) ADULT LEVEL
5A1: NONTRADITIONAL PARTICIPATION
STATEPROGRAM YEAR
LineAdjusted vs.
Actual Level of Performance
Met 90% of Adjusted Level of
Performance (Y,N)
Actual Level of Performance
State Adjusted Level of
Performance
Number of Students in the Denominator
Number of Students in the
NumeratorPopulation
Table 19 of 22

Amended Performance Data Date of Filing Amended Data: _______________________
1 GRAND TOTAL Pre-populated from FAUPL
12 Male 3 Female 4 GRAND TOTAL56 American Indian or Alaskan Native7 Asian or Pacific Islander8 Black (not Hispanic)9 Hispanic10 White11 Unknown1213 American Indian or Alaska Native14 Asian15 Black or African American16 Hispanic/Latino17 Native Hawaiian or Other Pacific Islander18 White19 Two or More Races20 Unknown2122 Individuals With Disabilities23 Economically Disadvantaged24 Single Parents25 Displaced Homemakers26 Limited English Proficient27 Tech Prep
*See "Definition of Terms" for guidance with reporting the Race and Ethinicity Categories.
Number of Students in the
Numerator
Number of Students in the Denominator
State Adjusted Level of
Performance
Actual Level of Performance
Adjusted vs. Actual Level of Performance
Met 90% of Adjusted Level of
Performance (Y,N)
GENDER
RACE/ETHNICITY* (1977 Standards)
RACE/ETHNICITY* (1997 Revised Standards)
SPECIAL POPULATIONS AND OTHER STUDENT CATEGORIES
Student Accountability Forms for the Section 113 Core Indicators of Performance (Title I) ADULT LEVEL
5A2: NONTRADITIONAL COMPLETION
STATEPROGRAM YEAR
Line Population
Additional Information:
Table 20 of 22

Amended Performance Data Date of Filing Amended Data: __________________
1 1STP1 Enroll in postsecondary education
2 1STP2 Enroll in postsecondary in the same field or major
3 1STP3 Complete a State or industry-recognized certification or licensure
4 1STP4 Complete courses that award postsecondary credit
5 1STP5 Enroll in remedial mathematics, writing, or reading courses
Number of Students in the
NumeratorLine
Student Accountability Forms for the Section 203 Indicators of Performance (Title II) SECONDARY LEVEL
PROGRAM YEARSTATE
Indicator Number Performance Indicator
Additional Information:
Percent of Students
Number of Students in the Denominator
Table 21 of 22

Amended Performance Data Date of Filing Amended Data: __________________
1 1PTP1 Enployment after graduation
2 1PTP2 Complete a State or industry-recognized certificate or licensure
3 1PTP3 Complete a 2-year degree or certificate
4 1PTP4 Complete a baccalaureate degree program
Student Accountability Forms for the Section 203 Indicators of Performance (Title II) POSTSECONDARY LEVEL
STATEPROGRAM YEAR
Line Percent of Students
Indicator Number Performance Indicators
Number of Students in the
Numerator
Number of Students in the Denominator
Additional Information:
Table 22 of 22