student edition - cypress hscypress.auhsd.us/view/36063.pdf · student edition volume 2...
TRANSCRIPT
© 2
012
Car
negi
e Le
arni
ng
Carnegie LearningIntegrated Math I
Student Edition Volume 2
8043_FM_Vol2.indd 1 08/05/12 11:20 AM

© 2
012
Car
negi
e Le
arni
ng
437 Grant St., Suite 918Pittsburgh, PA 15219 Phone 412.690.2442 Customer Service Phone 877.401.2527 Fax 412.690.2444
www.carnegielearning.com
Chapter 1 © istockphoto.com/Gorfer;Chapter 2 © istockphoto.com/Dane Wirtzfeld;Chapter 3 © istockphoto.com/gaffera;Chapter 4 © istockphoto.com/cosmin4000;Chapter 5 © istockphoto.com/adisa;Chapter 6 © istockphoto.com/Kris Hanke;Chapter 7 © istockphoto.com/moutainberryphoto;Chapter 8 © istockphoto.com/melhi;Chapter 9 © istockphoto.com/Joselito BrionesChapter 10 © istockphoto.com/pafe;Chapter 11 © istockphoto.com/Aydin Mutlu;Chapter 12 © istockphoto.com/karinclaus;Chapter 13 © istockphoto.com/IngenuiChapter 14 © istockphoto.com/TommLChapter 15 © istockphoto.com/AlexMaxChapter 16 © istockphoto.com/stuartbur
Copyright © 2012 by Carnegie Learning, Inc. All rights reserved. Carnegie Learning, Cognitive Tutor, SchoolCare, and Learning by Doing are all registered marks of Carnegie Learning, Inc. All other company and product names mentioned are used for identification purposes only and may be trademarks of their respective owners. Permission is granted for photocopying rights within licensed sites only. Any other usage or reproduction in any form is prohibited without the expressed consent of the publisher.
978-1-60972-157-2Student Edition, Volume 2
Printed in the United States of America1-05/2012 HPS
8043_FM_Vol2.indd 2 09/05/12 10:35 AM

© 2
012
Car
negi
e Le
arni
ng
Dear Student,
You are about to begin an exciting endeavor using mathematics! To be successful, you will need the right tools. This book is one of the most important tools you will use this year. Throughout this book there is space for note-taking, sketching, and calculating. You will be given opportunities to think and reason about various mathematical concepts and use tools such as tables, graphs, and graphing calculators.
This year you will face many new challenges both in and outside of the classroom. While some challenges may seem difficult, it is important to remember that effort matters. You must realize that it may take hard work and perseverance to succeed—and your hard work will pay off!
Connections in mathematics are important. Throughout this text, you will build new knowledge based upon your prior knowledge. It is our goal that you see mathematics as relevant because it provides a common and useful language for discussing and solving real-world problems.
Don’t worry—you will not be working alone. Working with others is a skill that you will need throughout your life. When you begin your career, you will most likely work with all sorts of people, from shy to outgoing, from leaders to supporters, from innovators to problem solvers—and many more types of people! Throughout this book, you will have many opportunities to work with your classmates. You will be able to discuss your ideas and predictions to different problem situations; present your calculations and solutions to questions; and analyze, critique and suggest, or support your classmates’ answers to problem situations.
Today’s workplace demands teamwork and self-confidence. At Carnegie Learning, our goal is to provide you with opportunities to be successful in your math course. Enjoy the year and have fun Learning by Doing(TM)!
—The Carnegie Learning Curriculum Development Team
I bet the folks at home
would like to know what we’re going to do
this year!
8043_FM_Vol2.indd 3 08/05/12 11:20 AM

© 2
012
Car
negi
e Le
arni
ng
iv Acknowledgments
Ack
now
led
gm
ents
Acknowledgments
Carnegie Learning Authoring Team
• Sandy Bartle • David Dengler
Senior Academic Officer Director, Curriculum Development
• Joshua Fisher • Jen Dilla
Math Editor Editorial Assistant
• David “Augie” Rivera • Lezlee Ross
Math Editor Curriculum Developer
Contributing Authors
• Jaclyn Snyder • Dr. Mary Lou Metz
Vendors
• Cenveo Publisher Services • Mind Over Media
• Mathematical Expressions • Lapiz
• Hess Print Solutions • eInstruction
• Bradford & Bigelow
Special Thanks
• Carnegie Learning Managers of School Partnerships for their review of design
and content.
• Teacher reviewers and students for their input and review of lesson content.
• Carnegie Learning Software Development Team for their contributions to
research and content.
• William S. Hadley for being a mentor to the development team, his leadership,
and his pedagogical pioneering in mathematics education.
• Amy Jones Lewis for her review of content.
8043_FM_Vol2.indd 4 08/05/12 11:20 AM

© 2
012
Car
negi
e Le
arni
ng
v
8043_FM_Vol2.indd 5 08/05/12 11:20 AM

© 2
012
Car
negi
e Le
arni
ng
vi Table of Contents
8 Analyzing Data Sets for One Variable 453
8.1 Start Your Day the Right WayGraphically Representing Data . . . . . . . . . . . . . . . . . . . . . . . . . . . . . . . . . . . . . . 455
8.2 Which Measure Is Better?Determining the Best Measure of Center for a Data Set . . . . . . . . . . . . . . . . . . 469
8.3 You Are Too Far Away!Calculating IQR and Identifying Outliers . . . . . . . . . . . . . . . . . . . . . . . . . . . . . . . 479
8.4 Whose Scores Are Better?Calculating and Interpreting Standard Deviation . . . . . . . . . . . . . . . . . . . . . . . . 489
8.5 Putting the Pieces TogetherAnalyzing and Interpreting Data . . . . . . . . . . . . . . . . . . . . . . . . . . . . . . . . . . . . . 505
Chapter 8 Summary . . . . . . . . . . . . . . . . . . . . . . . . . . . . . . . . . . . . . . . . . . 513
9 Correlation and Residuals 521
9.1 Like a GloveLeast Squares Regression . . . . . . . . . . . . . . . . . . . . . . . . . . . . . . . . . . . . . . . . . 523
9.2 Gotta Keep It Correlatin’Correlation . . . . . . . . . . . . . . . . . . . . . . . . . . . . . . . . . . . . . . . . . . . . . . . . . . . . . 533
9.3 The Residual EffectCreating Residual Plots . . . . . . . . . . . . . . . . . . . . . . . . . . . . . . . . . . . . . . . . . . . . 541
9.4 To Fit or Not To Fit? That Is The Question!Using Residual Plots . . . . . . . . . . . . . . . . . . . . . . . . . . . . . . . . . . . . . . . . . . . . . . 553
9.5 Who Are You? Who? Who?Causation vs. Correlation . . . . . . . . . . . . . . . . . . . . . . . . . . . . . . . . . . . . . . . . . . 563
Chapter 9 Summary . . . . . . . . . . . . . . . . . . . . . . . . . . . . . . . . . . . . . . . . . . 569
Tab
le o
f C
onte
nts
Table of Contents
8043_FM_Vol2.indd 6 08/05/12 11:20 AM

© 2
012
Car
negi
e Le
arni
ng
Table of Contents vii
10 Analyzing Data Sets for Two Categorical Variables 577
10.1 Could You Participate in Our Survey?Interpreting Frequency Distributions . . . . . . . . . . . . . . . . . . . . . . . . . . . . . . . . . . 579
10.2 It’s So Hot Outside!Relative Frequency Distribution . . . . . . . . . . . . . . . . . . . . . . . . . . . . . . . . . . . . . 589
10.3 She Blinded Me with Science!Relative Frequency Conditional Distribution . . . . . . . . . . . . . . . . . . . . . . . . . . . . 595
10.4 Oh! Switch the Station!Drawing Conclusions from Data . . . . . . . . . . . . . . . . . . . . . . . . . . . . . . . . . . . . . 601
Chapter 10 Summary . . . . . . . . . . . . . . . . . . . . . . . . . . . . . . . . . . . . . . . . . 609
11 Mathematical Modeling 615
11.1 Let’s Take a Little TripEvery Graph Tells a Story . . . . . . . . . . . . . . . . . . . . . . . . . . . . . . . . . . . . . . . . . . 617
11.2 Whodunit? The Function Family Line-UpModeling Data with Curves of Best Fit . . . . . . . . . . . . . . . . . . . . . . . . . . . . . . . . 625
11.3 People, Tea, and Carbon DioxideModeling Using Exponential Functions . . . . . . . . . . . . . . . . . . . . . . . . . . . . . . . 631
11.4 BAC Is BAD NewsChoosing the Best Function to Model Data . . . . . . . . . . . . . . . . . . . . . . . . . . . . 639
Chapter 11 Summary . . . . . . . . . . . . . . . . . . . . . . . . . . . . . . . . . . . . . . . . . 645
Tab
le of Con
tents
8043_FM_Vol2.indd 7 08/05/12 11:20 AM

© 2
012
Car
negi
e Le
arni
ng
viii Table of Contents
12 Geometry on the Coordinate Plane 649
12.1 Let’s Move!Translating and Constructing Line Segments . . . . . . . . . . . . . . . . . . . . . . . . . . . 651
12.2 Treasure HuntMidpoints and Bisectors . . . . . . . . . . . . . . . . . . . . . . . . . . . . . . . . . . . . . . . . . . . 667
12.3 It’s All About AnglesTranslating and Constructing Angles and Angle Bisectors . . . . . . . . . . . . . . . . . 681
12.4 Did You Find a Parking Space?Parallel and Perpendicular Lines on the Coordinate Plane . . . . . . . . . . . . . . . . . 689
12.5 Making Copies—Just as Perfect as the Original!Constructing Perpendicular Lines, Parallel Lines, and Polygons . . . . . . . . . . . . 699
Chapter 12 Summary . . . . . . . . . . . . . . . . . . . . . . . . . . . . . . . . . . . . . . . . . 709
13 Congruence Through Transformations 719
13.1 Slide, Flip, Turn: The Latest Dance Craze?Translating, Rotating, and Reflecting Geometric Figures . . . . . . . . . . . . . . . . . . 721
13.2 All the Same to YouCongruent Triangles . . . . . . . . . . . . . . . . . . . . . . . . . . . . . . . . . . . . . . . . . . . . . . 743
13.3 Side-Side-SideSSS Congruence Theorem . . . . . . . . . . . . . . . . . . . . . . . . . . . . . . . . . . . . . . . . . 751
13.4 Side-Angle-SideSAS Congruence Theorem . . . . . . . . . . . . . . . . . . . . . . . . . . . . . . . . . . . . . . . . . 759
13.5 You Shouldn’t Make AssumptionsAngle-Side-Angle Congruence Theorem . . . . . . . . . . . . . . . . . . . . . . . . . . . . . . 769
13.6 Ahhhhh…We’re Sorry We Didn’t Include You!Angle-Angle-Side Congruence Theorem . . . . . . . . . . . . . . . . . . . . . . . . . . . . . . 775
Chapter 13 Summary . . . . . . . . . . . . . . . . . . . . . . . . . . . . . . . . . . . . . . . . . 785
Tab
le o
f C
onte
nts
8043_FM_Vol2.indd 8 08/05/12 11:20 AM

© 2
012
Car
negi
e Le
arni
ng
Table of Contents ix
14 Perimeter and Area of Geometric Figures on the Coordinate Plane 793
14.1 Transforming to a New Level!Using Transformations to Determine Perimeter and Area . . . . . . . . . . . . . . . . . 795
14.2 Looking at Something Familiar in a New WayArea and Perimeter of Triangles on the Coordinate Plane . . . . . . . . . . . . . . . . . 805
14.3 One Figure, Many NamesArea and Perimeter of Parallelograms on the Coordinate Plane . . . . . . . . . . . . 823
14.4 Let’s Go Halfsies!Determining the Perimeter and Area of Trapezoids
and Composite Figures . . . . . . . . . . . . . . . . . . . . . . . . . . . . . . . . . . . . . . . . . . . . 833
Chapter 14 Summary . . . . . . . . . . . . . . . . . . . . . . . . . . . . . . . . . . . . . . . . . 843
15 Connecting Algebra and Geometry with Polygons 853
15.1 Name That Triangle!Classifying Triangles on the Coordinate Plane . . . . . . . . . . . . . . . . . . . . . . . . . . 855
15.2 Name That Quadrilateral!Classifying Quadrilaterals on the Coordinate Plane . . . . . . . . . . . . . . . . . . . . . . 863
15.3 Is That Point on the Circle?Determining Points on a Circle . . . . . . . . . . . . . . . . . . . . . . . . . . . . . . . . . . . . . . 871
15.4 Name That Point on the CircleCircles and Points on the Coordinate Plane . . . . . . . . . . . . . . . . . . . . . . . . . . . . 879
Chapter 15 Summary . . . . . . . . . . . . . . . . . . . . . . . . . . . . . . . . . . . . . . . . . 889
Tab
le of Con
tents
8043_FM_Vol2.indd 9 08/05/12 11:20 AM

© 2
012
Car
negi
e Le
arni
ng
x Table of Contents
16 Logic 899
16.1 A Little Dash of LogicTwo Methods of Logical Reasoning . . . . . . . . . . . . . . . . . . . . . . . . . . . . . . . . . . 901
16.2 What’s Your Conclusion?Understanding Conditional Statements, Arguments, and Truth Tables . . . . . . . 909
16.3 Proofs Aren’t Just for GeometryIntroduction to Direct and Indirect Proof with the Properties of Numbers . . . . . 925
16.4 Your Oldest Likes Spinach?Using Logic to Solve Problems, Part 1 . . . . . . . . . . . . . . . . . . . . . . . . . . . . . . . . 931
16.5 Shoes and Math Scores?Using Logic to Solve Problems, Part 2 . . . . . . . . . . . . . . . . . . . . . . . . . . . . . . . . 939
Chapter 16 Summary . . . . . . . . . . . . . . . . . . . . . . . . . . . . . . . . . . . . . . . . . 947
Tab
le o
f C
onte
nts
8043_FM_Vol2.indd 10 08/05/12 11:20 AM

© 2
012
Car
negi
e Le
arni
ng
The Crew xi
Th
e Crew
The Crew is here to help you throughout this text. Sometimes they will remind you about things you have already learned. Sometimes they will ask you questions to help you think about different strategies. Sometimes they will share fun facts. They are members of your group—someone you can rely on!
The Crew
Teacher aides will guide you along your way. They will help you make connections and remind you to think about the details.
8043_FM_Vol2.indd 11 08/05/12 11:20 AM

© 2
012
Car
negi
e Le
arni
ng
Mathematical Representations
Introduction
During this course, you will solve problems and work with many different representations of mathematical concepts, ideas, and processes to better understand the world. Each lesson will provide you with opportunities to discuss your ideas, work within groups, and share your solutions and methods with your class. These process icons are placed throughout the text.
Discuss to Understand
• Read the problem carefully.
• What is the context of the problem? Do we understand it?
• What is the question that we are being asked? Does it make sense?
• Is this problem similar to some other problem we know?
Think for Yourself
• Do I need any additional information to answer the question?
• Is this problem similar to some other problem that I know?
• How can I represent the problem using a picture, a diagram, symbols, or some other representation?
Work with Your Partner
• How did you do the problem?
• Show me your representation.
• This is the way I thought about the problem—how did you think about it?
• What else do we need to solve the problem?
• Does our reasoning and our answer make sense to each other?
• How will we explain our solution to the class?
Share with the Class
• Here is our solution and the methods we used.
• Are we communicating our strategies clearly?
• We could only get this far with our solution. How can we finish?
• Could we have used a different strategy to solve the problem?
xii Representations
Rep
rese
enta
tion
s
8043_FM_Vol2.indd 12 08/05/12 11:20 AM

© 2
012
Car
negi
e Le
arni
ng
Academic Glossary xiii
Acad
emic G
lossary
Key Terms of the Course
There are important terms you will encounter throughout this book. It is important that you have an understanding of these words as you get started through the mathematical concepts. Knowing what is meant by these terms and using these terms will help you think, reason, and communicate your ideas. The Graphic Organizers shown display a definition for a key term, related words, sample questions, and examples.
Academic Glossary
My folks are always
trying to get me to be organized!
You will create graphic
organizers like these as your own references of key mathematical ideas.
8043_FM_Vol2.indd 13 08/05/12 11:20 AM

© 2
012
Car
negi
e Le
arni
ng
xiv Academic Glossary
Aca
dem
ic G
loss
ary
DefinitionTo study or look closely for patterns.
Analyzing can involve examining or breaking a concept down into smaller parts to gain a better understanding of it.
Related Words
• examine • investigate
• evaluate • what do you notice?
• determine • what do you think?
• observe • sort and match
• consider • identify
Ask Yourself
• Do I see any patterns?
• Have I seen something like this before?
• What happens if the shape, representation, or numbers change?
• What is the question asking me to accomplish?
• What is the context?
• What does the solution mean in terms of this problem situation?
Example
Analyze
© 2
012
Car
negi
e Le
arni
ng
2
b. At least how many boxes would Alan have to sell to be able to choose his own prize?
Problem 3 Reversing the Sign
Alan’s camping troop hikes down from their campsite at an elevation of 4800 feet to the bottom of the mountain. They hike down at a rate of 20 feet per minute.
1. Write a function, h(m), to show the troop’s elevation as a function of time in minutes.
h(m) 5 220m 1 4800
2. Analyze the function.
a. Identify the independent and dependent quantities and their units.
The independent quantity is the number of minutes hiked, and the dependent quantity is the elevation in feet.
b. Identify the rate of change and explain what it means in terms of this problem situation.
The rate of change is 220. This represents a decrease of 20 feet every minute.
c. Identify the y-intercept and explain what it means in terms of this problem situation.
The y-intercept is 4800. This shows that the troop started their hike at an elevation of 4800 feet.
d. What is the x-intercept and explain what it means in terms of this problem situation?
0 5 220m 1 4800
24800 5 220m
24800 _______
220 5 220m ______ 220m
240 5 m
The x-intercept is (240, 0). The hikers will be at the bottom of the mountain in 240 minutes, or 4 hours.
2.3 Modeling Linear Inequalities 107
8043_Ch02.indd 107 03/05/12 11:09 AM
8043_FM_Vol2.indd 14 08/05/12 11:20 AM

© 2
012
Car
negi
e Le
arni
ng
Ask Yourself
• How should I organize my thoughts?
• Is my explanation logical?
• Does my reasoning make sense?
• How can I justify my answer to others?
• Did I use complete sentences in my answer?
Academic Glossary xv
Acad
emic G
lossary
DefinitionTo give details or describe how to determine an answer or solution.
Explaining your reasoning helps justify conclusions.
Related Words
• show your work
• explain your calculation
• justify
• why or why not?
Example
Explain Your Reasoning
© 2
012
Car
negi
e Le
arni
ng
74 Chapter 2 Graphs, Equations, and Inequalities
2
Problem 1 Analyzing Tables
A 747 airliner has an initial climb rate of 1800 feet per minute until it reaches a height of 10,000 feet.
1. Identify the independent and dependent quantities in this problem situation. Explain your reasoning.
The height of the airplane depends on the time, so height is the dependent quantity and time is the independent quantity.
2. Describe the units of measure for:
a. the independent quantity (the input values).
The independent quantity of time is measured in minutes.
b. the dependent quantity (the output values).
The dependent quantity of height is measured in feet.
3. Which function family do you think best represents this situation? Explain your reasoning.
Answers will vary.
The situation shows a linear function because the rate the plane ascends is constant. So, this situation belongs to the linear function family.
4. Draw and label two axes with the independent and dependent quantities and their units of measure. Then sketch a simple graph of the function represented by the situation.
When you sketch a graph,
include the axes’ labels and the general graphical
behavior. Be sure to consider any intercepts.
8043_Ch02.indd 74 03/05/12 11:08 AM
Don’t forget to
check your answers!
8043_FM_Vol2.indd 15 08/05/12 11:20 AM
© 2
012
Car
negi
e Le
arni
ng
xvi Academic Glossary
Aca
dem
ic G
loss
ary
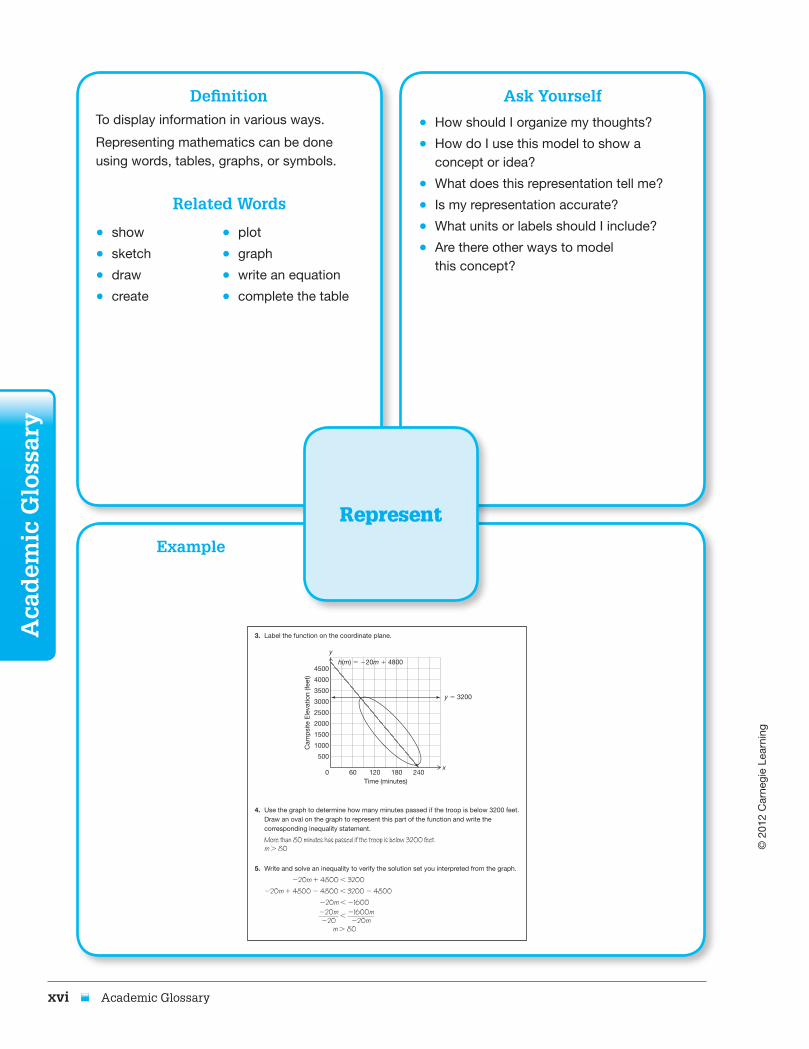
DefinitionTo display information in various ways.
Representing mathematics can be done using words, tables, graphs, or symbols.
Related Words
• show • plot
• sketch • graph
• draw • write an equation
• create • complete the table
Ask Yourself
• How should I organize my thoughts?
• How do I use this model to show a concept or idea?
• What does this representation tell me?
• Is my representation accurate?
• What units or labels should I include?
• Are there other ways to model this concept?
Example
Represent
© 2
012
Car
negi
e Le
arni
ng
108 Chapter 2 Graphs, Equations, and Inequalities
2
3. Label the function on the coordinate plane.
4500
4000
3500
3000
2500
2000
1500
1000
500
0 60 120 180 240Time (minutes)
Cam
psi
te E
leva
tion
(feet
)
x
y
h(m) 5 220m 1 4800
y 5 3200
4. Use the graph to determine how many minutes passed if the troop is below 3200 feet. Draw an oval on the graph to represent this part of the function and write the corresponding inequality statement.
More than 80 minutes has passed if the troop is below 3200 feet. m . 80
5. Write and solve an inequality to verify the solution set you interpreted from the graph.
220m 1 4800 , 3200
220m 1 4800 2 4800 , 3200 2 4800
220m , 21600
220m ______ 220
, 21600m ________ 220m
m . 80
6. Compare and contrast your solution sets using the graph and the function. What do you notice?
8043_Ch02.indd 108 03/05/12 11:42 AM
8043_FM_Vol2.indd 16 08/05/12 11:20 AM

© 2
012
Car
negi
e Le
arni
ng
Ask Yourself
• Does my reasoning make sense?
• Is my solution close to my estimation?
• What do I know about this problem situation?
• What predictions can I make from this problem situation?
Estimating gets you in the neighborhood,
calculating gets you the address.
Academic Glossary xvii
Acad
emic G
lossary
DefinitionTo make an educated guess based on the analysis of given data.
Estimating first helps inform reasoning.
Related Words
• predict • expect
• approximate • about how much?
Example
© 2
012
Car
negi
e Le
arni
ng
2
2.6 Understanding Non-Linear Graphs and Inequalities 139
3. Use the data from the table to create a graph of the problem situation on the coordinate plane.
4. Consider a total bill of $13.45.
a. Estimate the amount of ground beef purchased.
The graph of y 5 13.45 crosses the original graph at about 2, so I predict that 2 pounds of ground meat were purchased.
b. Determine the exact amount of ground meat purchased.
Using the intersection function on my graphing calculator, I determined the exact amount to be 2.2 pounds of ground meat.
5. Based on the number of people coming to the cookout, you decide to buy 6 pounds of ground meat for the hamburgers.
a. If your budget for the food is $25.00, do you have enough money? Why or why not?
b. If you have enough money, how much money do you have left over? If you do not have enough money, how much more will you need?
y 5 13.45
18
16
14
12
10
8
6
4
2
0Amount of Ground Meat (pounds)
Tota
l Cos
t (d
olla
rs)
x
y
1.0 2.0 3.0 4.0
8043_Ch02.indd 139 03/05/12 11:43 AM
Estimate
8043_FM_Vol2.indd 17 08/05/12 11:20 AM
© 2
012
Car
negi
e Le
arni
ng
xviii Academic Glossary
Aca
dem
ic G
loss
ary
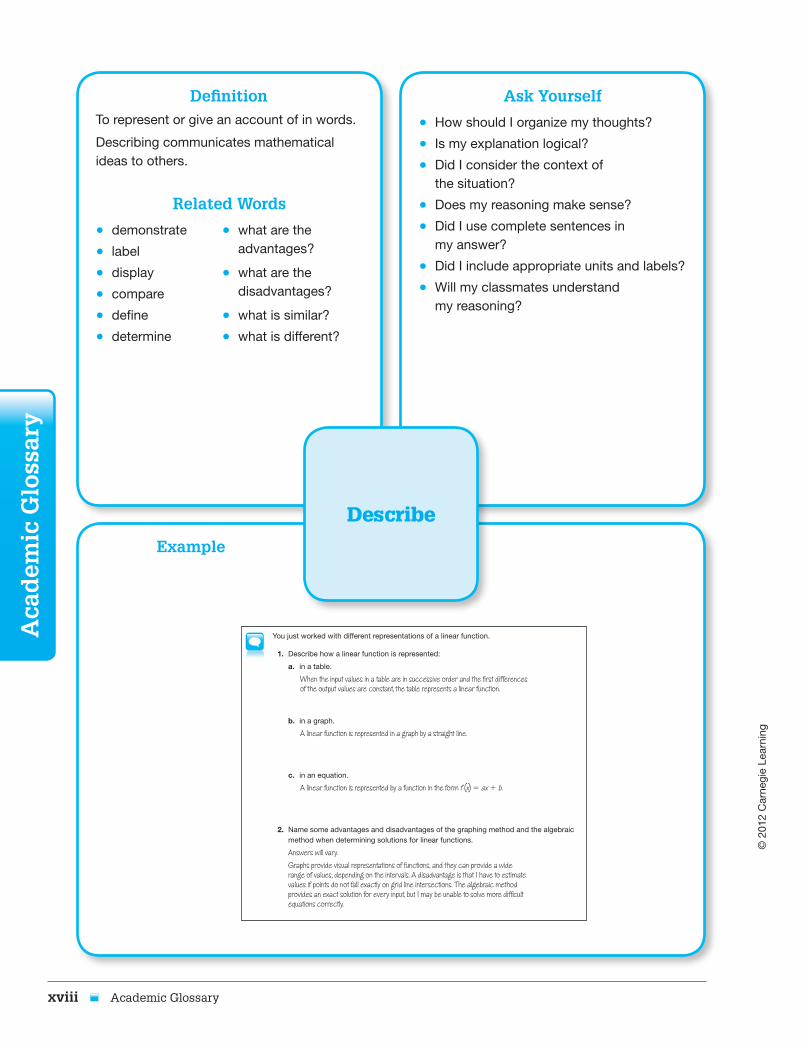
DefinitionTo represent or give an account of in words.
Describing communicates mathematical ideas to others.
Related Words
• demonstrate • what are the
• label advantages?
• display • what are the
• compare disadvantages?
• define • what is similar?
• determine • what is different?
Ask Yourself
• How should I organize my thoughts?
• Is my explanation logical?
• Did I consider the context of the situation?
• Does my reasoning make sense?
• Did I use complete sentences in my answer?
• Did I include appropriate units and labels?
• Will my classmates understand my reasoning?
Example
Describe
© 2
012
Car
negi
e Le
arni
ng
84 Chapter 2 Graphs, Equations, and Inequalities
2
Talk the Talk
You just worked with different representations of a linear function.
1. Describe how a linear function is represented:
a. in a table.
When the input values in a table are in successive order and the first differences of the output values are constant, the table represents a linear function.
b. in a graph.
A linear function is represented in a graph by a straight line.
c. in an equation.
A linear function is represented by a function in the form f (x) 5 ax 1 b.
2. Name some advantages and disadvantages of the graphing method and the algebraic method when determining solutions for linear functions.
Answers will vary.
Graphs provide visual representations of functions, and they can provide a wide range of values, depending on the intervals. A disadvantage is that I have to estimate values if points do not fall exactly on grid line intersections. The algebraic method provides an exact solution for every input, but I may be unable to solve more difficult equations correctly.
3. Do you think the graphing method for determining solutions will work for any function?
8043_Ch02.indd 84 03/05/12 11:09 AM
8043_FM_Vol2.indd 18 08/05/12 11:20 AM

© 2
012
Car
negi
e Le
arni
ng
Problem Types xix
Prob
lem T
ypes
Problem Types You Will See
Worked Example
© 2
012
Car
negi
e Le
arni
ng
4
Consider the sequence shown.
1, 2, 4, 8, . . .
The pattern is to multiply each term by the same number, 2, to determine the next term.
Sequence: 1 , 2 , 4 , 8 , . . .
This sequence is geometric and the common ratio r is 2.
multiply by 2
multiply by 2
multiply by 2
4.2 Arithmetic and Geometric Sequences 231
A geometric sequence is a sequence of numbers in which the ratio between any two consecutive terms is a constant. In other words, it is a sequence of numbers in which you multiply each term by a constant to determine the next term. This integer or fraction constant is called the common ratio. The common ratio is represented by the variable r.
3. Suppose a sequence has the same starting number as the sequence in the worked example, but its common ratio is 3.
a. How would the pattern change?
The sequence would still increase, but the terms would be different. The sequence would increase more rapidly.
b. Is the sequence still geometric? Explain your reasoning.
Yes. The sequence is still geometric because the ratio between any two consecutive terms is constant.
c. If possible, write the first 5 terms for the new sequence.
1, 3, 9, 27, 81
Think of the constant you
multiply each term by to produce the next term. This will
tell you whether r is an integer or a fraction.
8043_Ch04.indd 231 03/05/12 11:17 AM
• Take your time to read through it, • Question your own understanding, and• Think about the connections between steps.
WHEN YOU SEE A WORKED ExAMPLE ASK YOURSELF
• What is the main idea?• How would this work if I changed
the numbers?• Have I used these strategies before?
8043_FM_Vol2.indd 19 08/05/12 11:20 AM

© 2
012
Car
negi
e Le
arni
ng
Ack
now
led
gm
ents
© 2
012
Car
negi
e Le
arni
ng
422 Chapter 7 Systems of Inequalities
7
c. Identify three different solutions of the system of linear inequalities you graphed. What do the solutions represent in terms of the problem situation?
d. Determine one combination of adults and children that is not a solution for this system of linear inequalities. Explain your reasoning.
5. Analyze the solution set of the system of linear inequalities shown.
x 1 y . 1
2x 1 y # 3
a. Graph the system of linear inequalities.
22
24
26
28
86
4
6
8
42x0
y
22242628
Notice the inequality
symbols. How do you think this will affect
your graph?
8043_Ch07.indd 422 03/05/12 11:40 AM
© 2
012
Car
negi
e Le
arni
ng
7
7.2 Systems of Linear Inequalities 423
b. Choose a point in each shaded region of the graph. Determine whether each point is a solution of the system. Then describe how the shaded region represents the solution.
Point x 1 y . 1 2x 1 y # 3 Description of location
(28, 2) 28 1 2 . 126 . 1 ✗
2(28) 1 2 # 310 # 3 ✗
The point is not a solution to either inequality and it is located in the region that is not shaded by either inequality.
c. Alan makes the statement shown.
Alan
The intersection point is always an algebraic solution to a system of inequalities because that is where the two lines meet.
Explain why Alan’s statement is incorrect. Use the intersection point of this system to explain your reasoning.
(21, 2)
21 1 2 . 1 2(21) 1 2 # 3
1 . 1 3 # 3
Alan is incorrect because the intersection point is not always a solution to the system of linear inequalities. The intersection point for this system only works for one of the inequalities, not both which means it is not a solution. If the inequality symbols are not both “or equal to” then the intersection point is not a solution.
8043_Ch07.indd 423 03/05/12 3:44 PM
Pro
ble
m T
ypes
Thumbs Down
• Take your time to read through the incorrect solution.
• Think about what error was made.
WHEN YOU SEE A THUMBS DOWN ICON ASK YOURSELF
• Where is the error?• Why is it an error?• How can I correct it?
xx Problem Types
8067_FM_Vol2.indd 20 5/8/12 1:43 PM

© 2
012
Car
negi
e Le
arni
ng
Problem Types xxi
Prob
lem T
ypes
© 2
012
Car
negi
e Le
arni
ng
350 Chapter 5 Exponential Functions
5
8. Pat and George each wrote a function to represent the number of rice grains for any square number using different methods.
Pat
I compared the exponents of the power to the square number in the table. Each exponent is 1 less than the square number.
f (s) = 2s –1
George
I know this is an exponential function with a common base of 2. If I extend the pattern back on the graph I get the y-intercept of
(0, 1 __ 2
), so a = 1 __ 2
.
f (s) = 1 __ 2
(2)s
Use properties of exponents to verify that 2s21 and 1 __ 2
(2)s are equivalent.
2s21 5 (2s)(221) 1 __ 2
(2)s 5 (2)21(2)s
5 (2s) ( 1 __ 2
) 5 2211s
5 ( 1 __ 2
) (2s) 5 2s21
9. Use the intersection feature of a graphing calculator to answer each question. Write each answer as an equation or compound inequality. Explain how you determined your answer.
a. Which square on the chessboard contains 262,144 rice grains?
b. Which square on the chessboard contains 32,768 rice grains?
Make sure you adjust the
settings for your graph window so that you can answer
each question!
8043_Ch05.indd 350 03/05/12 11:23 AM
Thumbs Up
• Take your time to read through the correct solution.
• Think about the connections between steps.
WHEN YOU SEE A THUMBS UP ICON ASK YOURSELF
• Why is this method correct?• Have I used this method before?
8067_FM_Vol2.indd 21 5/8/12 1:43 PM

© 2
012
Car
negi
e Le
arni
ng
xxii Problem Types
Pro
ble
m T
ypes
© 2
012
Car
negi
e Le
arni
ng
190 Chapter 3 Linear Functions
3
? 8. Carlos and Mikala do not like working with fractions. They rewrite their equation so that it does not have fractions. Their work is shown.
CarlosF 5 9 _ 5 C 1 32
(5)F 5 5 ( 9 _ 5 C 1 32 ) 5F 5 9C 1 160
5F 2 9C 5 160
Mikala
C 5 5 __ 9 (F 2 32)
(9)C 5 (9) 5 __ 9 (F 2 32)
9C 5 5(F 2 32)
9C 5 5F 2 160
9C 2 5F 5 2160
Carlos and Mikala got two different equations. Who is correct?
Both Carlos and Mikala are correct. If they divide either equation by 21 they will get the other equation.
9. In the original equations, the coefficients 9 __ 5
and 5 __ 9
as well as the constant 32 had
meaning based on temperature. What do the coefficients, 9 and 5 and the constant
160 represent in Carlos’s and Mikala’s equations?
The values 9, 5, and 160 represent nothing in terms of temperature.
8043_Ch03.indd 190 03/05/12 11:14 AM
Who’s Correct?
• Take your time to read through the situation.• Question the strategy or reason given.• Determine which solution is correct and which is
not correct.
WHEN YOU SEE A WHO’S CORRECT? ICON ASK YOURSELF
• Does the reasoning make sense?• If the reasoning makes sense, what is
the justification?• If the reasoning does not make sense,
what error was made?
8043_FM_Vol2.indd 22 08/05/12 11:21 AM

© 2
012
Car
negi
e Le
arni
ng
Habits of Mind xxiii
Hab
its of Min
d
The Standards for Mathematical Practice
Effective communication and collaboration are essential skills of a successful learner. With practice, you can develop the habits of mind of a productive mathematical thinker.
Make sense of problems and persevere in solving them.
I can:
• explain what a problem “means”
in my own words.
• analyze and organize information.
• keep track of my plan and
change it if necessary
• always ask myself, “does this
make sense?”
Attend to precision.
I can:
• calculate accurately and efficiently.
• use clear definitions when I talk
with my classmates, my teacher,
and others.
• specify units of measure and
label diagrams and other
figures appropriately to clarify
the meaning of different
representations.
Reasoning and Explaining
Reason abstractly and quantitatively.
I can:
• create an understandable
representation of a
problem situation.
• consider the units of measure
involved in a problem.
• understand and use properties
of operations.
Construct viable arguments and critique the reasoning
of others.
I can:
• use definitions and previously
established results in
constructing arguments.
• communicate and defend my
own mathematical reasoning
using examples, drawings, or
diagrams.
• distinguish correct reasoning
from reasoning that is flawed.
• listen to or read the conclusions
of others and decide whether
they make sense.
• ask useful questions in an
attempt to understand other
ideas and conclusions.
8043_FM_Vol2.indd 23 08/05/12 11:21 AM

© 2
012
Car
negi
e Le
arni
ng
Hab
its
of M
ind
xxiv Habits of Mind
Modeling and Using Tools
Model with mathematics.
I can:
• identify important relationships
in a problem situation and
represent them using tools such
as, diagrams, tables, graphs, and
formulas.
• apply mathematics to solve
problems that occur in
everyday life.
• interpret mathematical results
in the contexts of a variety of
problem situations.
• reflect on whether my results
make sense, improving the model
I used if it is not appropriate for
the situation.
Use appropriate tools strategically.
I can:
• use a variety of different tools
that I have to solve problems.
• use a graphing calculator to
explore mathematical concepts.
• recognize when a tool that I
have to solve problems might
be helpful and also when it
has limitations.
Seeing Structure and Generalizing
Look for and make use of structure.
I can:
• look closely to see a pattern or
a structure in a mathematical
argument.
• can see complicated things
as single objects or as being
composed of several objects.
• can step back for an overview
and can shift my perspective.
Look for and express regularity in repeated reasoning.
I can:
• notice if calculations
are repeated.
• look for general methods
and more efficient methods to
solve problems.
• evaluate the reasonableness of
intermediate results.
• make generalizations based
on results.
8043_FM_Vol2.indd 24 08/05/12 11:21 AM

© 2
012
Car
negi
e Le
arni
ngH
abits of M
ind
Habits of Mind xxv
Each lesson provides opportunities for you to think, reason, and communicate mathematical understanding. Here are a few examples of how you will develop expertise using the Standards for Mathematical Practice throughout this text.
© 2
012
Car
negi
e Le
arni
ng
88 Chapter 2 Graphs, Equations, and Inequalities
Problem 1 As We Make Our Final Descent
At 36,000 feet, the crew aboard the 747 airplane begins making preparations to land. The plane descends at a rate of 1500 feet per minute until it lands.
1. Compare this problem situation to the problem situation in Lesson 2.1, The Plane! How are the situations the same? How are they different?
2. Complete the table to represent this problem situation.
Independent Quantity Dependent Quantity
Quantity
Units
0
2
4
6
18,000
6000
Expression t
3. Write a function, g(t), to represent this problem situation.
8043_Ch02.indd 88 07/05/12 2:12 PM
Look for and make use of structure.
You will look for patterns in your calculations and
use those to write formal expressions and
equations.
Reason abstractly and quantitatively.
You will move from a real-life context to the mathematics and
back to the context throughout problems.
Model with mathematics.
You will identify relationships and
represent them using diagrams, tables,
graphs, and formulas.
8043_FM_Vol2.indd 25 08/05/12 11:21 AM
© 2
012
Car
negi
e Le
arni
ng
Hab
its
of M
ind
xxvi Habits of Mind
© 2
012
Car
negi
e Le
arni
ng
2.2 Analyzing Linear Functions 89
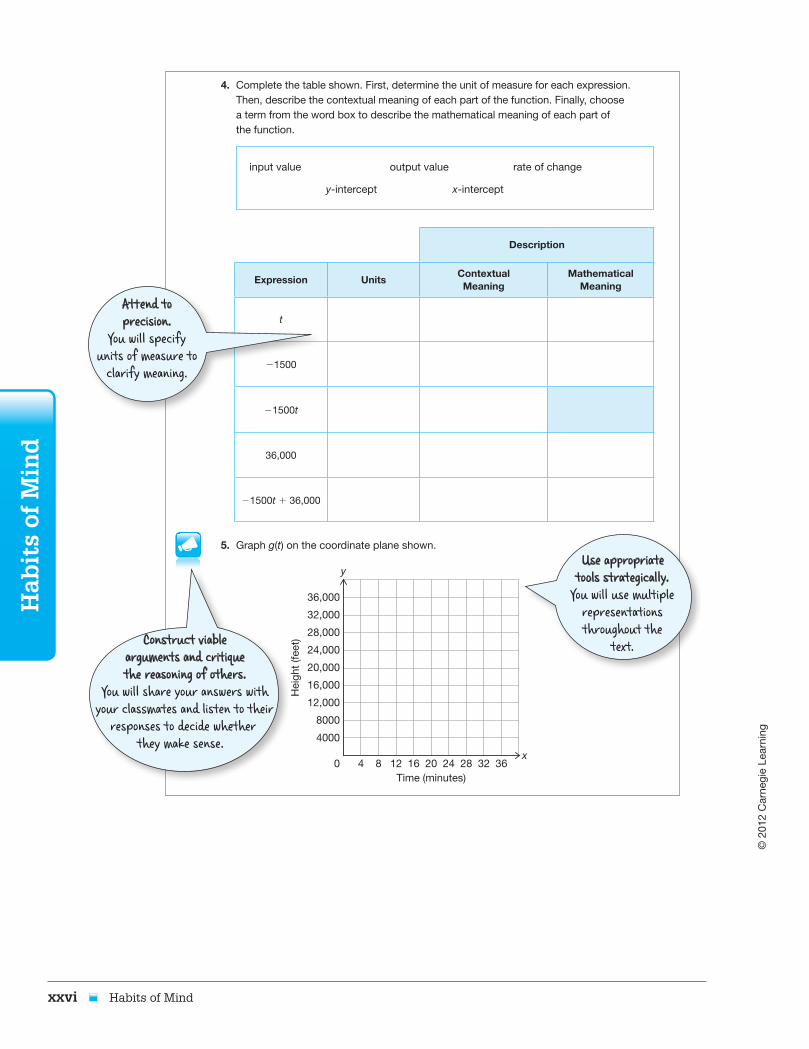
4. Complete the table shown. First, determine the unit of measure for each expression. Then, describe the contextual meaning of each part of the function. Finally, choose a term from the word box to describe the mathematical meaning of each part of the function.
input value output value rate of change
y-intercept x-intercept
Description
Expression UnitsContextualMeaning
MathematicalMeaning
t
21500
21500t
36,000
21500t 1 36,000
5. Graph g(t) on the coordinate plane shown.
36,000
32,000
28,000
24,000
20,000
16,000
12,000
8000
4000
0 4 8 12 16 20 24 28 32 36Time (minutes)
Hei
ght
(feet
)
x
y
8043_Ch02.indd 89 07/05/12 2:12 PM
Construct viable arguments and critique the reasoning of others.
You will share your answers with your classmates and listen to their
responses to decide whether they make sense.
Attend to precision.
You will specify units of measure to
clarify meaning.
Use appropriate tools strategically.
You will use multiple representations throughout the
text.
8043_FM_Vol2.indd 26 08/05/12 11:21 AM