student data book - ojc.edu · table of contents page where our students come from 3 ojc student...
TRANSCRIPT

Student Data Book

Table of Contents Page
Where Our Students Come From 3
OJC Student Ethnicity 4
OJC Student Gender 5
ACT Scores 6
Enrollment by Academic Term 7
Enrollment by Age 8
FTE Enrollment by Academic Term 9
FTE Enrollment by Age 10
Successful Course Completion 11
Degrees and Honors Awarded 12
Retention Rates 13
Retention Rates by Gender 14
Retention Rates by Ethnicity 15
Graduation Rates 16
Graduation Rates by Gender 17
Graduation Rates by Ethnicity 18
Transfer Rates 19
Top Ten Receiving Four-Year Institutions 20
Cost of Attendance 21
Mission Statement 22
Otero Junior College Student Data Book Page 2 of 22

2009-2010 2010-2011 2011-2012 2012-2013 2013-2014 2014-2015 2015-2016 2016-2017 2017-2018
Otero County 50.1% 51.6% 51.5% 53.9% 57.3% 55.4% 51.5% 47.8% 46.4%
Bent & Crowley Counties 14.6% 14.9% 15.4% 16.0% 14.1% 18.2% 18.5% 16.3% 17.7%
Other Colorado 25.6% 25.1% 24.3% 22.6% 22.5% 21.3% 24.3% 27.6% 26.4%
Out of State or Unknown 9.7% 8.4% 8.8% 7.5% 6.1% 5.1% 5.7% 8.2% 9.4%
Where Our Students Come From . . .
Otero Junior College Student Data Book Page 3 of 22

Race & Ethnicity 2009-2010 2010-2011 2011-2012 2012-2013 2013-2014 2014-2015 2015-2016 2016-2017 2017-2018
American Indian or Alaskan Native 1.1% 0.8% 0.5% 0.7% 1.1% 1.2% 1.1% 0.7% 0.9%
Asian 0.5% 0.3% 0.5% 0.7% 0.7% 0.7% 0.4% 0.6% 0.7%
Black or African American 2.4% 2.8% 2.4% 1.8% 2.8% 2.8% 3.7% 4.0% 4.7%
Hispanic 29.3% 30.7% 31.8% 29.8% 30.6% 28.3% 28.0% 30.5% 32.9%
Native Hawaiian and Other Pacific Islander 0.2% 0.2% 0.3% 0.3% 0.4% 0.3% 0.2% 0.1% 0.1%
White 54.0% 51.9% 53.9% 57.0% 54.2% 57.1% 56.1% 53.1% 48.9%
Multiple Races 1.2% 1.9% 1.9% 2.4% 2.9% 3.1% 3.5% 2.6% 2.5%Non-Resident Alien (International) 1.3% 1.5% 2.1% 2.1% 2.9% 3.1% 2.9% 4.5% 4.3%
Unknown / Not Reported 10.0% 9.9% 6.7% 5.2% 4.3% 3.3% 4.1% 3.8% 5.1%
OJC Student Race & Ethnicity
Otero Junior College Student Data Book Page 4 of 22

Gender 2009-2010 2010-2011 2011-2012 2012-2013 2013-2014 2014-2015 2015-2016 2016-2017 2017-2018
Female 62.6% 59.1% 60.0% 61.1% 58.3% 61.5% 56.4% 54.4% 54.8%Male 37.4% 40.9% 40.0% 38.9% 41.7% 38.5% 43.6% 45.6% 45.2%
OJC Student Gender
Otero Junior College Student Data Book Page 5 of 22

Average ACT Composite Scores 2012 2013 2014 2015 2016*
OJC Incoming Students 19.6 19.2 20.1 20.3 19.6
Colorado High Schools 20.6 20.4 20.6 20.7 20.6
National High Schools 21.1 20.9 21.0 21.0 20.8
Otero County High Schools 18.2 19.1 19.9 19.4 18.7
Crowley County High Schools 16.5 19.7 19.7 20.4 20.0Bent County High Schools 18.1 18.6 18.6 18.0 17.2
ACT Scores
*In 2017, Colorado switched to the SAT.
Sources: ACT Profile Reports -- National and State (www.act.org);
Colorado High School data (www.cde.state.co.us/assessment/coact)
OJC data compiled from in-house data (CCCS ODS via Cognos)
Otero Junior College Student Data Book Page 6 of 22

1,4491,572
1,434 1,4971,410 1,370
1,4641,306 1,329
0
200
400
600
800
1,000
1,200
1,400
1,600
1,800
Fall2013
Spring2014
Fall2014
Spring2015
Fall2015
Spring2016
Fall2016
Spring2017
Fall2017
He
adco
un
t
OJC Enrollment by Academic Term
Otero Junior College Student Data Book Page 7 of 22
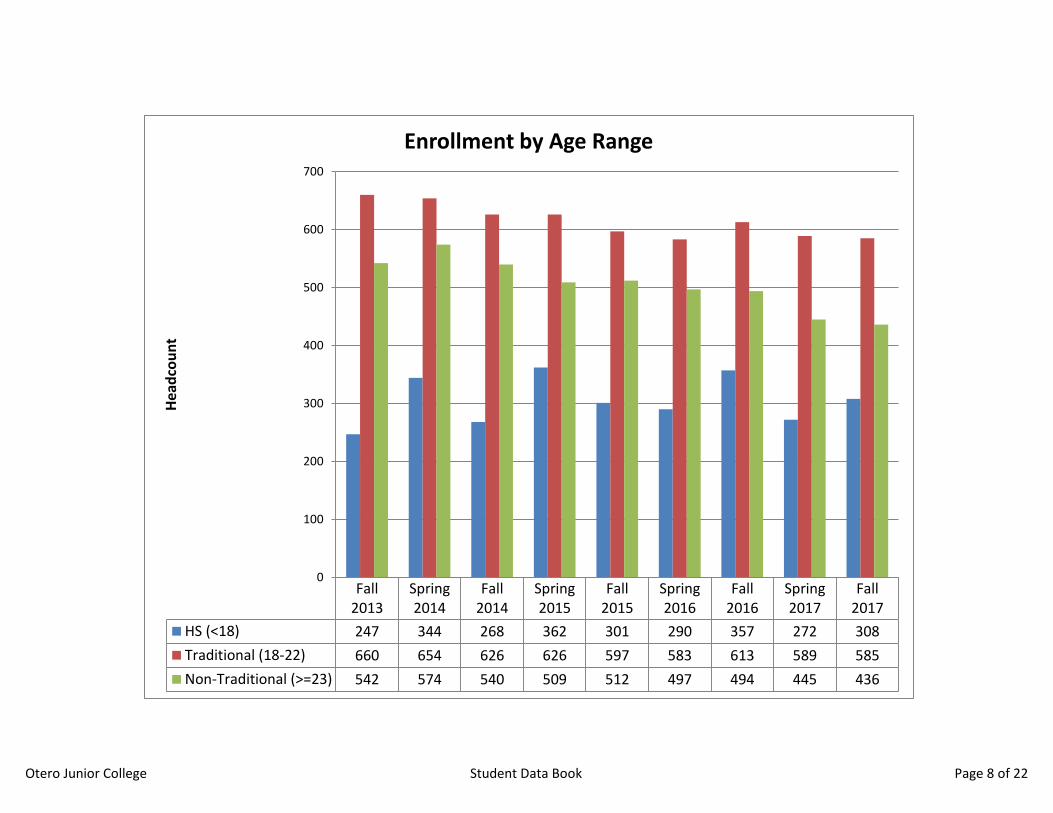
Fall2013
Spring2014
Fall2014
Spring2015
Fall2015
Spring2016
Fall2016
Spring2017
Fall2017
HS (<18) 247 344 268 362 301 290 357 272 308
Traditional (18-22) 660 654 626 626 597 583 613 589 585
Non-Traditional (>=23) 542 574 540 509 512 497 494 445 436
0
100
200
300
400
500
600
700H
ead
cou
nt
Enrollment by Age Range
Otero Junior College Student Data Book Page 8 of 22

* FTE is a function of credit hours that the State uses to determine enrollment. For example, the amount of credit hours earned by all students in
Fall 2016 (FTE 483.17) is the same as if a little over 483 students took a full 30 credit hours during a school year.
501
532
488 487
463 456
483
437452
0
100
200
300
400
500
600
Fall2013
Spring2014
Fall2014
Spring2015
Fall2015
Spring2016
Fall2016
Spring2017
Fall2017
FTE
FTE by Academic Term
Otero Junior College Student Data Book Page 9 of 22

* FTE is a function of credit hours that the State uses to determine enrollment. For example, the amount of credit hours
earned by all students in Fall 2016 (FTE 483.17) is the same as if a little over 483 students took a full 30 credit hours during a
school year.
Fall2013
Spring2014
Fall2014
Spring2015
Fall2015
Spring2016
Fall2016
Spring2017
Fall2017
HS (<18) 44.63 75.00 51.83 75.48 52.85 54.88 66.22 49.95 56.45
Traditional (18-22) 292.23 285.47 291.28 267.48 277.55 256.2 282.13 254.05 268.42
Non-Traditional (>=23) 164.55 171.68 144.83 144.25 132.45 144.42 134.82 132.80 127.03
0
50
100
150
200
250
300
350
FTE
FTE Enrollment by Age Range
Otero Junior College Student Data Book Page 10 of 22

83.3%86.5%
84.4%87.0% 85.1% 86.7%
83.1%87.4%
83.9%
78.7%82.8%
79.3%82.9%
79.6%82.6%
77.8%
86.4%
80.0%
0%
20%
40%
60%
80%
100%
Fall2013
Spring2014
Fall2014
Spring2015
Fall2015
Spring2016
Fall2016
Spring2017
Fall2017
% o
f Su
cce
ssfu
l Co
urs
e C
om
ple
tio
n
Successful Course Completion* in-house data; student received A,B,C,S,S/A,S/B,S/C; All students, not including withdrawals
or drops
OJC
Hispanic
Otero Junior College Student Data Book Page 11 of 22

Degrees 2009-2010 2010-2011 2011-2012 2012-2013 2013-2014 2014-2015 2015-2016 2016-2017
AA 104 100 100 98 94 77 73 95
AS 53 56 65 53 62 51 59 50
AAS 59 69 58 61 67 40 47 51
AGS 12 13 15 13 6 6 6 12
Certificates 310 291 320 310 301 292 315 279
# of Degrees Earned 538 529 514 538 531 466 500 487# of Summa Cum Laude
(GPA of 4.0)13 10 10 9 9 11 12 19
# of Magna Cum Laude
(GPA of 3.75-3.99)23 22 13 16 10 16 16 21
# of Cum Laude
(GPA of 3.5-3.749)26 26 37 26 34 28 30 29
Degrees and Honors Awarded
Otero Junior College Student Data Book Page 12 of 22

Rate Year
2010
Fall 2009
Cohort
2011
Fall 2010
Cohort
2012
Fall 2011
Cohort
2013
Fall 2012
Cohort
2014
Fall 2013
Cohort
2015
Fall 2014
Cohort
2016
Fall 2015
Cohort
Entering Cohort 262 283 227 260 211 200 216
Retained the following Fall 149 130 125 144 114 99 105
Retention Rate
(Fall to Fall)56.9% 45.9% 55.1% 55.4% 54.0% 50.0% 49.0%
OJC Full-Time Retention Rates*
*New full-time degree-seeking SURDS cohort (12 hours or more). Includes certificates. Cohort retained
the following Fall OR graduated within first year.
Source: SURDS (http://highered.colorado.gov/i3/reports.aspx)
Otero Junior College Student Data Book Page 13 of 22

Rate Year Gender
2010
Fall 2009
Cohort
2011
Fall 2010
Cohort
2012
Fall 2011
Cohort
2013
Fall 2012
Cohort
2014
Fall 2013
Cohort
2015
Fall 2014
Cohort
2016
Fall 2015
Cohort
Female 141 113 100 139 92 107 95
Male 121 170 126 121 118 93 120
Unknown 0 0 1 0 1 0 0
Female 84 50 57 85 55 60 50
Male 65 80 67 59 59 39 54
Unknown 0 0 1 0 0 0 0
Female 59.6% 44.2% 57.0% 61.2% 59.8% 55.0% 53.0%
Male 53.7% 47.1% 53.2% 48.8% 50.0% 57.0% 45.0%
Unknown 0.0% 0.0% 100.0% 0.0% 0.0% 0.0% 0.0%
OJC Full-Time Retention Rates by Gender*
Entering Cohort
Retained the following Fall
Retention Rate
(Fall to Fall)
*New full-time degree-seeking SURDS cohort (12 hours or more). Includes certificates. Cohort retained the
following Fall OR graduated within first year.
Source: SURDS (http://highered.colorado.gov/i3/reports.aspx
Otero Junior College Student Data Book Page 14 of 22

Ethnicity Rate Year
2010
Fall 2009
Cohort
2011
Fall 2010
Cohort
2012
Fall 2011
Cohort
2013
Fall 2012
Cohort
2014
Fall 2013
Cohort
2015
Fall 2014
Cohort
2016
Fall 2015
Cohort
OJC Full-Time Retention Rates by Ethnicity*
Asian
Entering Cohort 5 1 3 3 1 0 0Retained the following Fall 4 0 3 3 0 0 0
Retention Rate
(Fall to Fall)80.0% 0 100.0% 100.0% 0.0% 0.0% 0.0%
Black or African American
Entering Cohort 14 17 13 12 18 13 17Retained the following Fall 7 7 3 7 7 6 7
Retention Rate
(Fall to Fall)50.0% 41.2% 23.1% 58.3% 38.9% 46.0% 41.0%
Hawaiian or Pacific Islander
Entering Cohort 0 3 2 3 4 2 0Retained the following Fall 0 1 0 1 3 1 0
Retention Rate
(Fall to Fall)0.0% 33.3% 0.0% 0.0% 0.0% 50.0% 0.0%
Hispanic
Entering Cohort 71 77 75 60 57 55 48Retained the following Fall 43 37 40 33 32 23 24
Retention Rate
(Fall to Fall)60.6% 48.1% 53.3% 55.0% 56.1% 42.0% 50.0%
Native American or Alaskan Native
Entering Cohort 7 3 1 2 2 1 5Retained the following Fall 3 2 0 2 1 1 0
Retention Rate
(Fall to Fall)42.9% 66.7% 0.0% 100.0% 50.0% 100.0% 0.0%
White, non-Hispanic
Entering Cohort 139 135 99 144 81 89 109Retained the following Fall 83 61 62 79 45 50 58
Retention Rate
(Fall to Fall)59.7% 45.2% 62.6% 54.9% 55.6% 56.0% 53.0%
More than One Race/Ethnicity
(non-hispanic)
Entering Cohort 0 6 11 11 14 10 11Retained the following Fall 0 1 6 6 6 5 7
Retention Rate
(Fall to Fall)0.00% 16.7% 0.0% 0.0% 0.0% 50.0% 64.0%
Non-Resident Alien
Entering Cohort 9 9 3 10 21 22 18Retained the following Fall 2 2 1 2 15 9
50.0%
6Retention Rate
(Fall to Fall)22.2% 22.2% 0.0% 0.0% 0.0% 41.0% 33.0%
38.0%
*New full-time degree-seeking SURDS cohort (12 hours or more). Includes certificates. Cohort retained the following Fall OR graduated within
first year.
Source: SURDS (http://highered.colorado.gov/i3/reports.aspx)
Unknown Ethnicity
Entering Cohort 17 32 20 15 13 8 8Retained the following Fall 7 19 10 11 5 4 3
Retention Rate
(Fall to Fall)41.2% 59.4% 50.0% 73.3% 38.5%
Otero Junior College Student Data Book Page 15 of 22
Rate Year2010
Fall 2007
Cohort
2011Fall 2008
Cohort
2012Fall 2009
Cohort
2013Fall 2010
Cohort
2014Fall 2011
Cohort
2015Fall 2012
Cohort
2016Fall 2013
Cohort
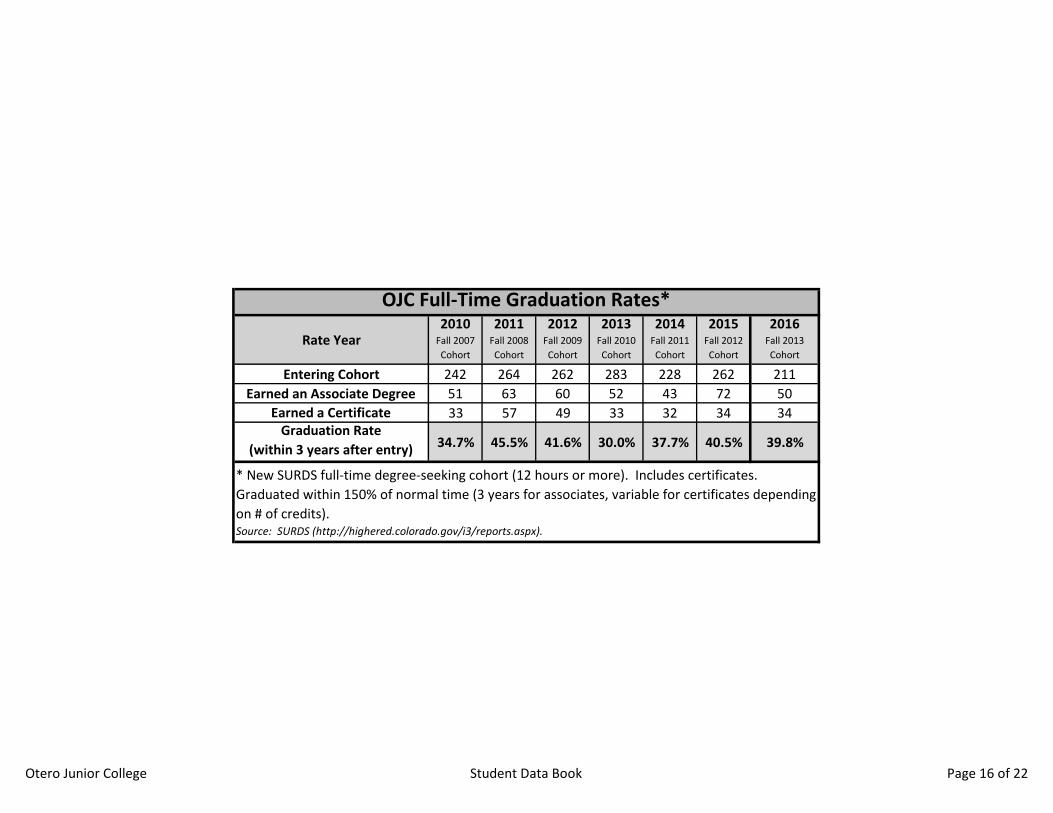
Entering Cohort 242 264 262 283 228 262 211
Earned an Associate Degree 51 63 60 52 43 72 50
Earned a Certificate 33 57 49 33 32 34 34Graduation Rate
(within 3 years after entry) 34.7% 45.5% 41.6% 30.0% 37.7% 40.5% 39.8%
OJC Full-Time Graduation Rates*
* New SURDS full-time degree-seeking cohort (12 hours or more). Includes certificates.
Graduated within 150% of normal time (3 years for associates, variable for certificates depending
on # of credits).Source: SURDS (http://highered.colorado.gov/i3/reports.aspx).
Otero Junior College Student Data Book Page 16 of 22

Rate Year Gender2010
Fall 2007
Cohort
2011
Fall 2008
Cohort
2012
Fall 2009
Cohort
2013
Fall 2010
Cohort
2014
Fall 2011
Cohort
2015
Fall 2012
Cohort
2016
Fall 2013
Cohort
Female 115 116 141 113 101 139 113
Male 127 148 121 170 127 123 170Female 27 34 41 31 26 47 31
Male 24 29 19 21 28 25 21
Female 13 25 24 11 13 17 12
Male 20 32 25 22 19 17 24
Female 34.8% 50.9% 46.1% 37.2% 38.6% 46.0% 38.1%
Male 34.6% 41.2% 36.4% 25.3% 37.0% 34.1% 26.5%
* New SURDS full-time degree-seeking cohort (12 hours or more). Includes certificates. Graduated within 150% of
normal time (3 years for associates, variable for certificates depending on # of credits).
Source: SURDS (http://highered.colorado.gov/i3/reports.aspx).
OJC Full-Time Graduation Rates by Gender*
Entering Cohort
Earned an Associate Degree
Earned a Certificate
Graduation Rate
(within 3 years after entry)
Otero Junior College Student Data Book Page 17 of 22
Ethnicity Rate Year
2010
Fall 2007
Cohort
2011
Fall 2008
Cohort
2012
Fall 2009
Cohort
2013
Fall 2010
Cohort
2014
Fall 2011
Cohort
2015
Fall 2012
Cohort
2016
Fall 2013
Cohort
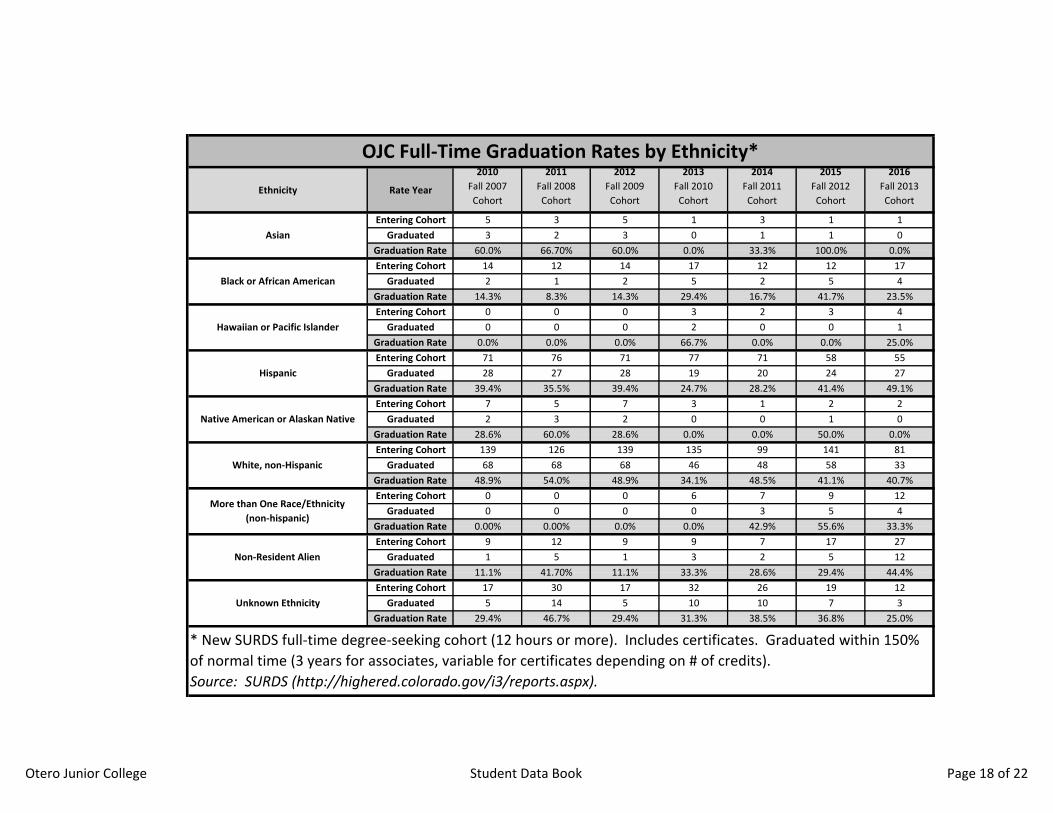
OJC Full-Time Graduation Rates by Ethnicity*
Asian
Entering Cohort 5 3 5 1 3 1 1
Graduated 3 2 3 0 1 1 0
Graduation Rate 60.0% 66.70% 60.0% 0.0% 33.3% 100.0% 0.0%
Black or African American
Entering Cohort 14 12 14 17 12 12 17
Graduated 2 1 2 5 2 5 4
Graduation Rate 14.3% 8.3% 14.3% 29.4% 16.7% 41.7% 23.5%
Hawaiian or Pacific Islander
Entering Cohort 0 0 0 3 2 3 4
Graduated 0 0 0 2 0 0 1
Graduation Rate 0.0% 0.0% 0.0% 66.7% 0.0% 0.0% 25.0%
Hispanic
Entering Cohort 71 76 71 77 71 58 55
Graduated 28 27 28 19 20 24 27
Graduation Rate 39.4% 35.5% 39.4% 24.7% 28.2% 41.4% 49.1%
Native American or Alaskan Native
Entering Cohort 7 5 7 3 1 2 2
Graduated 2 3 2 0 0 1 0
Graduation Rate 28.6% 60.0% 28.6% 0.0% 0.0% 50.0% 0.0%
White, non-Hispanic
Entering Cohort 139 126 139 135 99 141 81
Graduated 68 68 68 46 48 58 33
Graduation Rate 48.9% 54.0% 48.9% 34.1% 48.5% 41.1% 40.7%
More than One Race/Ethnicity
(non-hispanic)
Entering Cohort 0 0 0 6 7 9 12
Graduated 0 0 0 0 3 5 4
Graduation Rate 0.00% 0.00% 0.0% 0.0% 42.9% 55.6% 33.3%
Non-Resident Alien
Entering Cohort 9 12 9 9 7 17 27
Graduated 1 5 1 3 2 5
36.8%
12
Graduation Rate 11.1% 41.70% 11.1% 33.3% 28.6% 29.4% 44.4%
25.0%
* New SURDS full-time degree-seeking cohort (12 hours or more). Includes certificates. Graduated within 150%
of normal time (3 years for associates, variable for certificates depending on # of credits).
Source: SURDS (http://highered.colorado.gov/i3/reports.aspx).
Unknown Ethnicity
Entering Cohort 17 30 17 32 26 19 12
Graduated 5 14 5 10 10 7 3
Graduation Rate 29.4% 46.7% 29.4% 31.3% 38.5%
Otero Junior College Student Data Book Page 18 of 22

Rate Year
2010
Fall 2007
Cohort
2011
Fall 2008
Cohort
2012
Fall 2009
Cohort
2013
Fall 2010
Cohort
2014
Fall 2011
Cohort
2015
Fall 2012
Cohort
2016
Fall 2013
Cohort
2017
Fall 2014
Cohort
# Enrolled in Cohort 242 264 262 283 228 262 211 200
# Transferred to 4-yr School 45 87 90 88 56 96 75 61
Three-Year Transfer Rates 18.6% 33.0% 34.4% 31.1% 24.6% 36.6% 35.5% 30.5%
OJC Three-Year Transfer Rates*
* New full-time degree-seeking SURDS cohort (12 hours or more). Includes certificates. Cohort transferred to 4-year
institution (in-state, out-of state, public or private). This includes all transfers, whether or not they graduated from
OJC prior to transferring.
Data Source: National Student Clearinghouse
Otero Junior College Student Data Book Page 19 of 22
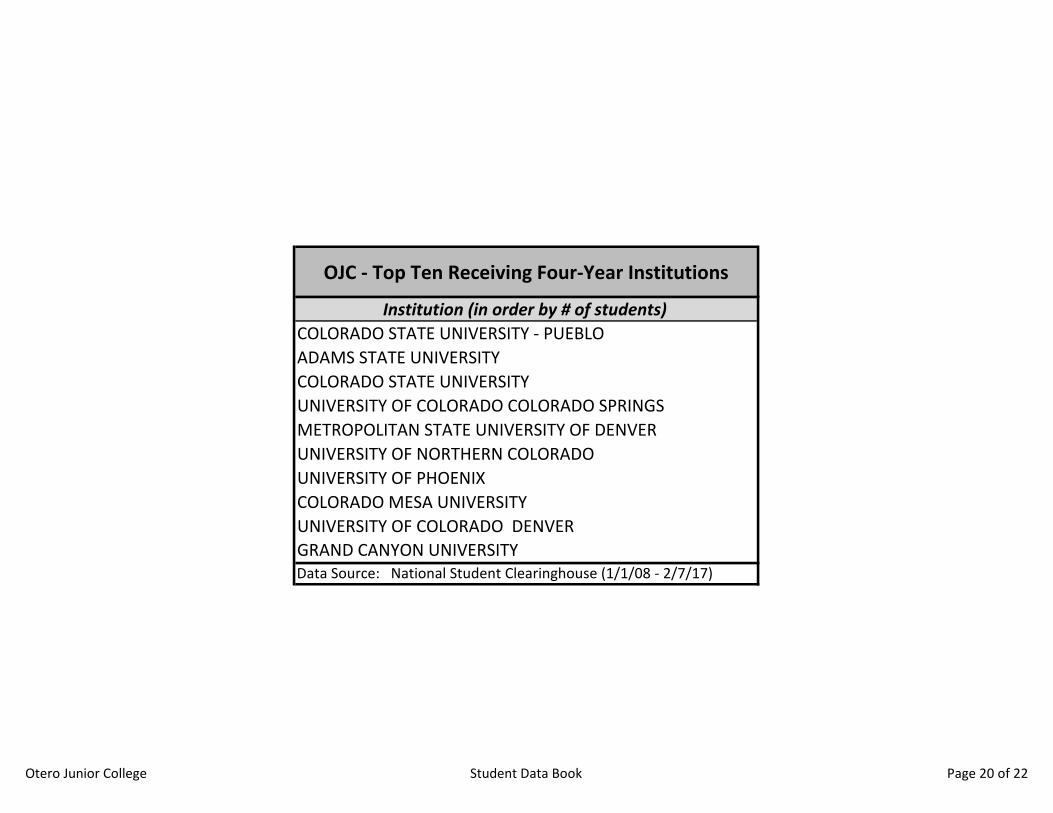
OJC - Top Ten Receiving Four-Year Institutions
Institution (in order by # of students)
COLORADO STATE UNIVERSITY - PUEBLO
ADAMS STATE UNIVERSITY
COLORADO STATE UNIVERSITY
UNIVERSITY OF COLORADO COLORADO SPRINGS
METROPOLITAN STATE UNIVERSITY OF DENVER
UNIVERSITY OF NORTHERN COLORADO
UNIVERSITY OF PHOENIX
COLORADO MESA UNIVERSITY
UNIVERSITY OF COLORADO DENVER
GRAND CANYON UNIVERSITYData Source: National Student Clearinghouse (1/1/08 - 2/7/17)
Otero Junior College Student Data Book Page 20 of 22

2012-2013 2013-2014 2014-2015 2015-2016 2016-2017 2017-2018
In-State Tuition & Fees 3,658 3,860 4,033 3,412 3,569 3,856
Books and Supplies 1,749 1,800 1,800 1,800 1,800 1,800
On-Campus Room and Board 5,536 5,758 6,122 6,306 6,330 6,578
Total 10,943 11,418 11,955 11,518 11,699 12,234
CSU-Ft Collins CU-Boulder UNC-Greeley Colo. Mesa Univ. of WY
Total 24,569 27,884 21,876 20,669 16,737
Data Source: NCES College Navigator Site (IPEDS) https://nces.ed.gov/collegenavigator
Comparison Costs 2017-2018(based on 24 credit hours per academic year)
Data Source: NCES College Navigator Site (IPEDS) https://nces.ed.gov/collegenavigator
Otero Junior College
Cost of Attendance(based on 24 credit hours per academic year)
Otero Junior College Student Data Book Page 21 of 22

Otero Junior College
Mission Statement
OJC's mission is "to provide quality higher education that is accessible, transforms lives, expands
employment opportunities, enriches our communities, promotes individual and global cultural diversity,
and fosters economic development."
Otero Junior College Student Data Book Page 22 of 22