student characteristics district-wide fall 2012 - 2016 characteristics district-wide fall 2012 -...
TRANSCRIPT
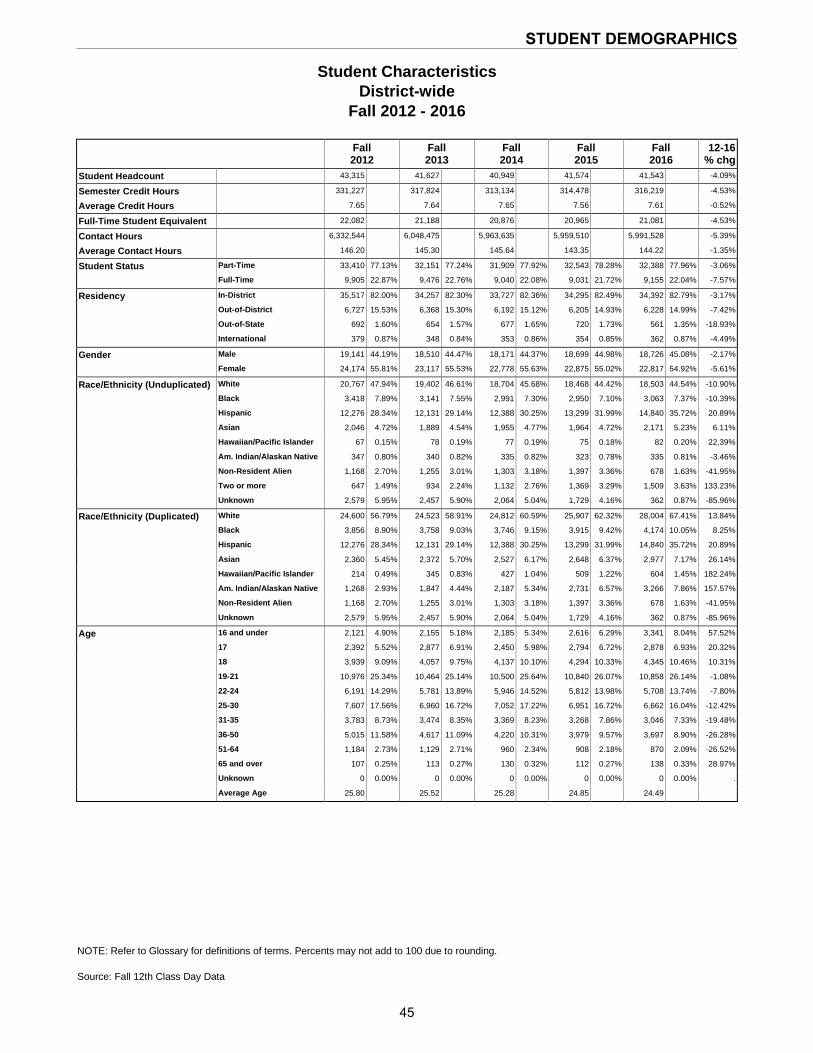
Student Characteristics District-wide
Fall 2012 - 2016
NOTE: Refer to Glossary for definitions of terms. Percents may not add to 100 due to rounding. Source: Fall 12th Class Day Data
Fall 2012
Fall 2013
Fall 2014
Fall 2015
Fall 2016
12-16 % chg
Student Headcount 43,315 41,627 40,949 41,574 41,543 -4.09%
Semester Credit Hours 331,227 317,824 313,134 314,478 316,219 -4.53%
Average Credit Hours 7.65 7.64 7.65 7.56 7.61 -0.52%
Full-Time Student Equivalent 22,082 21,188 20,876 20,965 21,081 -4.53%
Contact Hours 6,332,544 6,048,475 5,963,635 5,959,510 5,991,528 -5.39%
Average Contact Hours 146.20 145.30 145.64 143.35 144.22 -1.35%
Student Status Part-Time 33,410 77.13% 32,151 77.24% 31,909 77.92% 32,543 78.28% 32,388 77.96% -3.06%
Full-Time 9,905 22.87% 9,476 22.76% 9,040 22.08% 9,031 21.72% 9,155 22.04% -7.57%
Residency In-District 35,517 82.00% 34,257 82.30% 33,727 82.36% 34,295 82.49% 34,392 82.79% -3.17%
Out-of-District 6,727 15.53% 6,368 15.30% 6,192 15.12% 6,205 14.93% 6,228 14.99% -7.42%
Out-of-State 692 1.60% 654 1.57% 677 1.65% 720 1.73% 561 1.35% -18.93%
International 379 0.87% 348 0.84% 353 0.86% 354 0.85% 362 0.87% -4.49%
Gender Male 19,141 44.19% 18,510 44.47% 18,171 44.37% 18,699 44.98% 18,726 45.08% -2.17%
Female 24,174 55.81% 23,117 55.53% 22,778 55.63% 22,875 55.02% 22,817 54.92% -5.61%
Race/Ethnicity (Unduplicated) White 20,767 47.94% 19,402 46.61% 18,704 45.68% 18,468 44.42% 18,503 44.54% -10.90%
Black 3,418 7.89% 3,141 7.55% 2,991 7.30% 2,950 7.10% 3,063 7.37% -10.39%
Hispanic 12,276 28.34% 12,131 29.14% 12,388 30.25% 13,299 31.99% 14,840 35.72% 20.89%
Asian 2,046 4.72% 1,889 4.54% 1,955 4.77% 1,964 4.72% 2,171 5.23% 6.11%
Hawaiian/Pacific Islander 67 0.15% 78 0.19% 77 0.19% 75 0.18% 82 0.20% 22.39%
Am. Indian/Alaskan Native 347 0.80% 340 0.82% 335 0.82% 323 0.78% 335 0.81% -3.46%
Non-Resident Alien 1,168 2.70% 1,255 3.01% 1,303 3.18% 1,397 3.36% 678 1.63% -41.95%
Two or more 647 1.49% 934 2.24% 1,132 2.76% 1,369 3.29% 1,509 3.63% 133.23%
Unknown 2,579 5.95% 2,457 5.90% 2,064 5.04% 1,729 4.16% 362 0.87% -85.96%
Race/Ethnicity (Duplicated) White 24,600 56.79% 24,523 58.91% 24,812 60.59% 25,907 62.32% 28,004 67.41% 13.84%
Black 3,856 8.90% 3,758 9.03% 3,746 9.15% 3,915 9.42% 4,174 10.05% 8.25%
Hispanic 12,276 28.34% 12,131 29.14% 12,388 30.25% 13,299 31.99% 14,840 35.72% 20.89%
Asian 2,360 5.45% 2,372 5.70% 2,527 6.17% 2,648 6.37% 2,977 7.17% 26.14%
Hawaiian/Pacific Islander 214 0.49% 345 0.83% 427 1.04% 509 1.22% 604 1.45% 182.24%
Am. Indian/Alaskan Native 1,268 2.93% 1,847 4.44% 2,187 5.34% 2,731 6.57% 3,266 7.86% 157.57%
Non-Resident Alien 1,168 2.70% 1,255 3.01% 1,303 3.18% 1,397 3.36% 678 1.63% -41.95%
Unknown 2,579 5.95% 2,457 5.90% 2,064 5.04% 1,729 4.16% 362 0.87% -85.96%
Age 16 and under 2,121 4.90% 2,155 5.18% 2,185 5.34% 2,616 6.29% 3,341 8.04% 57.52%
17 2,392 5.52% 2,877 6.91% 2,450 5.98% 2,794 6.72% 2,878 6.93% 20.32%
18 3,939 9.09% 4,057 9.75% 4,137 10.10% 4,294 10.33% 4,345 10.46% 10.31%
19-21 10,976 25.34% 10,464 25.14% 10,500 25.64% 10,840 26.07% 10,858 26.14% -1.08%
22-24 6,191 14.29% 5,781 13.89% 5,946 14.52% 5,812 13.98% 5,708 13.74% -7.80%
25-30 7,607 17.56% 6,960 16.72% 7,052 17.22% 6,951 16.72% 6,662 16.04% -12.42%
31-35 3,783 8.73% 3,474 8.35% 3,369 8.23% 3,268 7.86% 3,046 7.33% -19.48%
36-50 5,015 11.58% 4,617 11.09% 4,220 10.31% 3,979 9.57% 3,697 8.90% -26.28%
51-64 1,184 2.73% 1,129 2.71% 960 2.34% 908 2.18% 870 2.09% -26.52%
65 and over 107 0.25% 113 0.27% 130 0.32% 112 0.27% 138 0.33% 28.97%
Unknown 0 0.00% 0 0.00% 0 0.00% 0 0.00% 0 0.00% .
Average Age 25.80 25.52 25.28 24.85 24.49
45
STUDENT DEMOGRAPHICS

Student Characteristics Full-Time Student Equivalent (FTSE)
Fall 2012 - 2016
NOTE: Refer to Glossary for definitions of terms. Percents may not add to 100 due to rounding. Source: Fall 12th Class Day Data
Fall 2012
Fall 2013
Fall 2014
Fall 2015
Fall 2016
12-16 % chg
Student Headcount 22,082 21,188 20,876 20,965 21,081 -4.53%
Student Status Part-Time 13,495 61.11% 12,958 61.16% 13,022 62.38% 13,149 62.72% 13,139 62.33% -2.64%
Full-Time 8,586 38.88% 8,230 38.84% 7,854 37.62% 7,816 37.28% 7,942 37.67% -7.50%
Residency In-District 18,110 82.01% 17,465 82.43% 17,130 82.06% 17,205 82.07% 17,472 82.88% -3.52%
Out-of-District 3,272 14.82% 3,078 14.53% 3,069 14.70% 3,059 14.59% 3,016 14.31% -7.82%
Out-of-State 395 1.79% 369 1.74% 393 1.88% 414 1.97% 314 1.49% -20.51%
International 305 1.38% 276 1.30% 284 1.36% 287 1.37% 280 1.33% -8.20%
Gender Male 10,270 46.51% 9,885 46.65% 9,751 46.71% 9,900 47.22% 9,945 47.18% -3.16%
Female 11,812 53.49% 11,303 53.35% 11,125 53.29% 11,066 52.78% 11,137 52.83% -5.71%
Race/Ethnicity (Unduplicated) White 10,695 48.43% 9,889 46.67% 9,477 45.40% 9,321 44.46% 9,371 44.45% -12.38%
Black 1,696 7.68% 1,555 7.34% 1,483 7.10% 1,436 6.85% 1,516 7.19% -10.61%
Hispanic 6,113 27.68% 6,093 28.76% 6,209 29.74% 6,615 31.55% 7,488 35.52% 22.49%
Asian 1,066 4.83% 988 4.66% 990 4.74% 970 4.63% 1,077 5.11% 1.03%
Hawaiian/Pacific Islander 38 0.17% 41 0.19% 43 0.21% 41 0.20% 42 0.20% 10.53%
Am. Indian/Alaskan Native 183 0.83% 170 0.80% 170 0.81% 164 0.78% 173 0.82% -5.46%
Non-Resident Alien 665 3.01% 715 3.37% 767 3.67% 801 3.82% 435 2.06% -34.59%
Two or more 361 1.63% 495 2.34% 606 2.90% 710 3.39% 803 3.81% 122.44%
Unknown 1,264 5.72% 1,243 5.87% 1,130 5.41% 907 4.33% 175 0.83% -86.16%
Race/Ethnicity (Duplicated) White 12,715 57.58% 12,611 59.52% 12,748 61.07% 13,226 63.09% 14,363 68.13% 12.96%
Black 1,936 8.77% 1,876 8.85% 1,875 8.98% 1,936 9.23% 2,101 9.97% 8.52%
Hispanic 6,113 27.68% 6,093 28.76% 6,209 29.74% 6,615 31.55% 7,488 35.52% 22.49%
Asian 1,241 5.62% 1,246 5.88% 1,299 6.22% 1,337 6.38% 1,507 7.15% 21.43%
Hawaiian/Pacific Islander 122 0.55% 181 0.85% 235 1.13% 273 1.30% 317 1.50% 159.84%
Am. Indian/Alaskan Native 664 3.01% 930 4.39% 1,106 5.30% 1,379 6.58% 1,689 8.01% 154.37%
Non-Resident Alien 665 3.01% 715 3.37% 767 3.67% 801 3.82% 435 2.06% -34.59%
Unknown 1,264 5.72% 1,243 5.87% 1,130 5.41% 907 4.33% 175 0.83% -86.16%
Age 16 and under 641 2.90% 694 3.28% 760 3.64% 903 4.31% 1,186 5.63% 85.02%
17 783 3.55% 969 4.57% 887 4.25% 986 4.70% 1,099 5.21% 40.36%
18 2,532 11.47% 2,654 12.53% 2,695 12.91% 2,794 13.33% 2,879 13.66% 13.70%
19-21 6,442 29.17% 6,113 28.85% 6,111 29.27% 6,258 29.85% 6,391 30.32% -0.79%
22-24 3,295 14.92% 3,034 14.32% 3,035 14.54% 2,958 14.11% 2,870 13.61% -12.90%
25-30 3,857 17.47% 3,540 16.71% 3,566 17.08% 3,439 16.40% 3,293 15.62% -14.62%
31-35 1,806 8.18% 1,663 7.85% 1,598 7.65% 1,531 7.30% 1,426 6.76% -21.04%
36-50 2,223 10.07% 2,017 9.52% 1,821 8.72% 1,724 8.22% 1,565 7.42% -29.60%
51-64 473 2.14% 470 2.22% 364 1.74% 340 1.62% 331 1.57% -30.02%
65 and over 31 0.14% 34 0.16% 39 0.19% 32 0.15% 40 0.19% 29.03%
Unknown 0 0.00% 0 0.00% 0 0.00% 0 0.00% 0 0.00% .
46
ACC 2016-2017 FACT BOOK
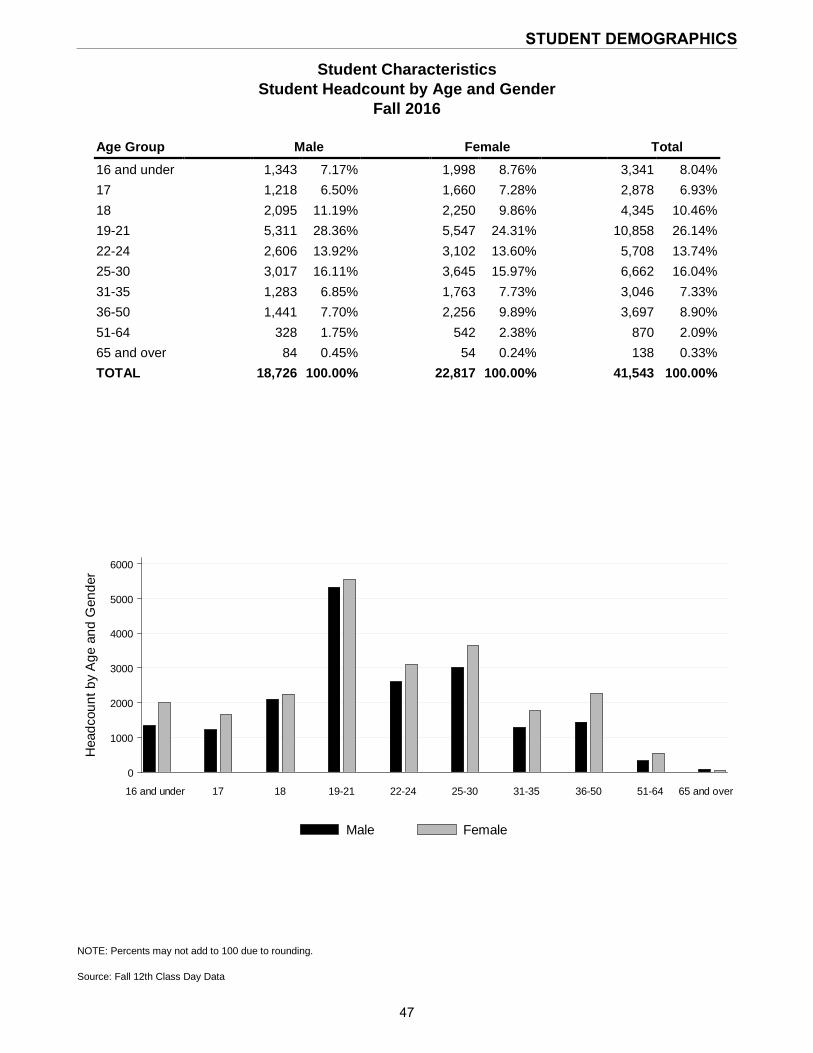
Student Characteristics Student Headcount by Age and Gender
Fall 2016
NOTE: Percents may not add to 100 due to rounding. Source: Fall 12th Class Day Data
Age Group Male Female Total 16 and under 1,343 7.17% 1,998 8.76% 3,341 8.04% 17 1,218 6.50% 1,660 7.28% 2,878 6.93% 18 2,095 11.19% 2,250 9.86% 4,345 10.46% 19-21 5,311 28.36% 5,547 24.31% 10,858 26.14% 22-24 2,606 13.92% 3,102 13.60% 5,708 13.74% 25-30 3,017 16.11% 3,645 15.97% 6,662 16.04% 31-35 1,283 6.85% 1,763 7.73% 3,046 7.33% 36-50 1,441 7.70% 2,256 9.89% 3,697 8.90% 51-64 328 1.75% 542 2.38% 870 2.09% 65 and over 84 0.45% 54 0.24% 138 0.33% TOTAL 18,726 100.00% 22,817 100.00% 41,543 100.00%
Male Female
Hea
dcou
nt b
y A
ge a
nd G
ende
r
0
1000
2000
3000
4000
5000
6000
16 and under 17 18 19-21 22-24 25-30 31-35 36-50 51-64 65 and over
47
STUDENT DEMOGRAPHICS
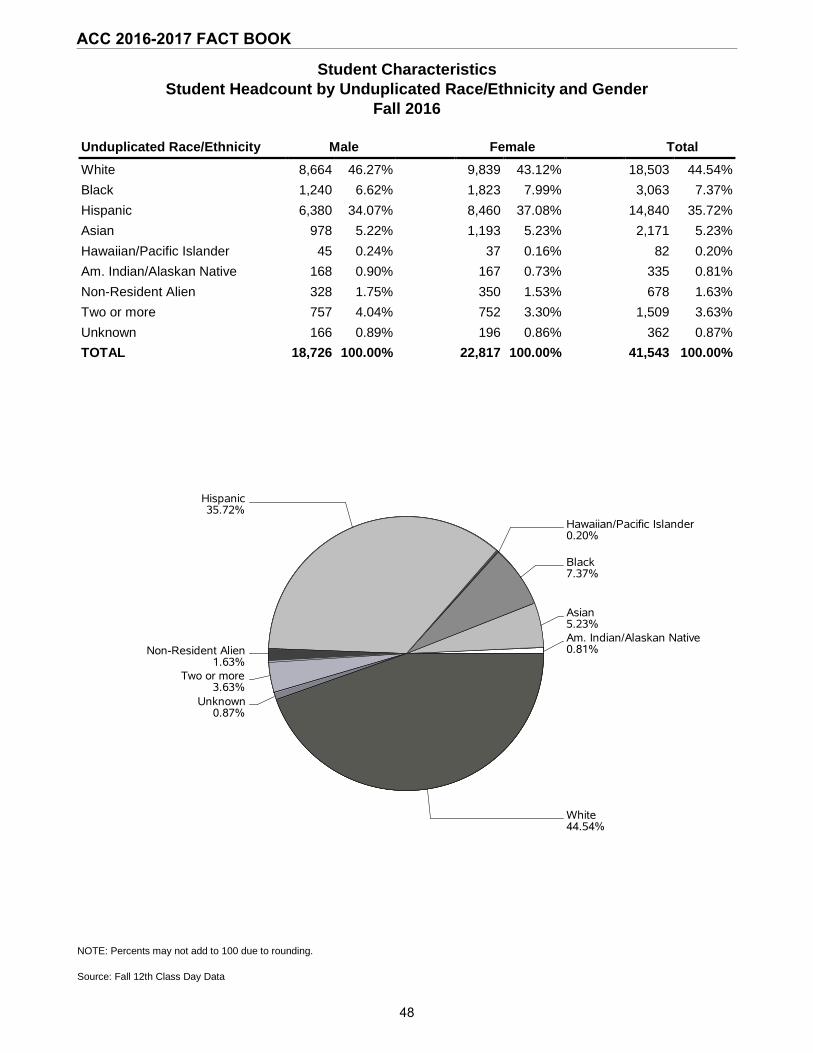
Student Characteristics Student Headcount by Unduplicated Race/Ethnicity and Gender
Fall 2016
NOTE: Percents may not add to 100 due to rounding. Source: Fall 12th Class Day Data
Unduplicated Race/Ethnicity Male Female Total White 8,664 46.27% 9,839 43.12% 18,503 44.54% Black 1,240 6.62% 1,823 7.99% 3,063 7.37% Hispanic 6,380 34.07% 8,460 37.08% 14,840 35.72% Asian 978 5.22% 1,193 5.23% 2,171 5.23% Hawaiian/Pacific Islander 45 0.24% 37 0.16% 82 0.20% Am. Indian/Alaskan Native 168 0.90% 167 0.73% 335 0.81% Non-Resident Alien 328 1.75% 350 1.53% 678 1.63% Two or more 757 4.04% 752 3.30% 1,509 3.63% Unknown 166 0.89% 196 0.86% 362 0.87% TOTAL 18,726 100.00% 22,817 100.00% 41,543 100.00%
Am. Indian/Alaskan Native0.81%
Asian5.23%
Black7.37%
Hawaiian/Pacific Islander0.20%
Hispanic35.72%
Non-Resident Alien1.63%
Two or more3.63%
Unknown0.87%
White44.54%
48
ACC 2016-2017 FACT BOOK

Student Characteristics Student Headcount by Gender and Full/Part-time Status
Fall 2016
NOTE: Percents may not add to 100 due to rounding. Source: Fall 12th Class Day Data
Gender Full-Time Part-Time Total Male 4,836 52.82% 13,890 42.89% 18,726 45.08% Female 4,319 47.18% 18,498 57.11% 22,817 54.92% TOTAL 9,155 100.00% 32,388 100.00% 41,543 100.00%
Student Characteristics Student Headcount by Unduplicated Race/Ethnicity
and Full/Part-time Status Fall 2016
Unduplicated Race/Ethnicity Full-Time Part-Time Total White 4,123 45.04% 14,380 44.40% 18,503 44.54% Black 605 6.61% 2,458 7.59% 3,063 7.37% Hispanic 3,037 33.17% 11,803 36.44% 14,840 35.72% Asian 485 5.30% 1,686 5.21% 2,171 5.23% Hawaiian/Pacific Islander 21 0.23% 61 0.19% 82 0.20% Am. Indian/Alaskan Native 88 0.96% 247 0.76% 335 0.81% Non-Resident Alien 347 3.79% 331 1.02% 678 1.63% Two or more 392 4.28% 1,117 3.45% 1,509 3.63% Unknown 57 0.62% 305 0.94% 362 0.87% TOTAL 9,155 100.00% 32,388 100.00% 41,543 100.00%
49
STUDENT DEMOGRAPHICS
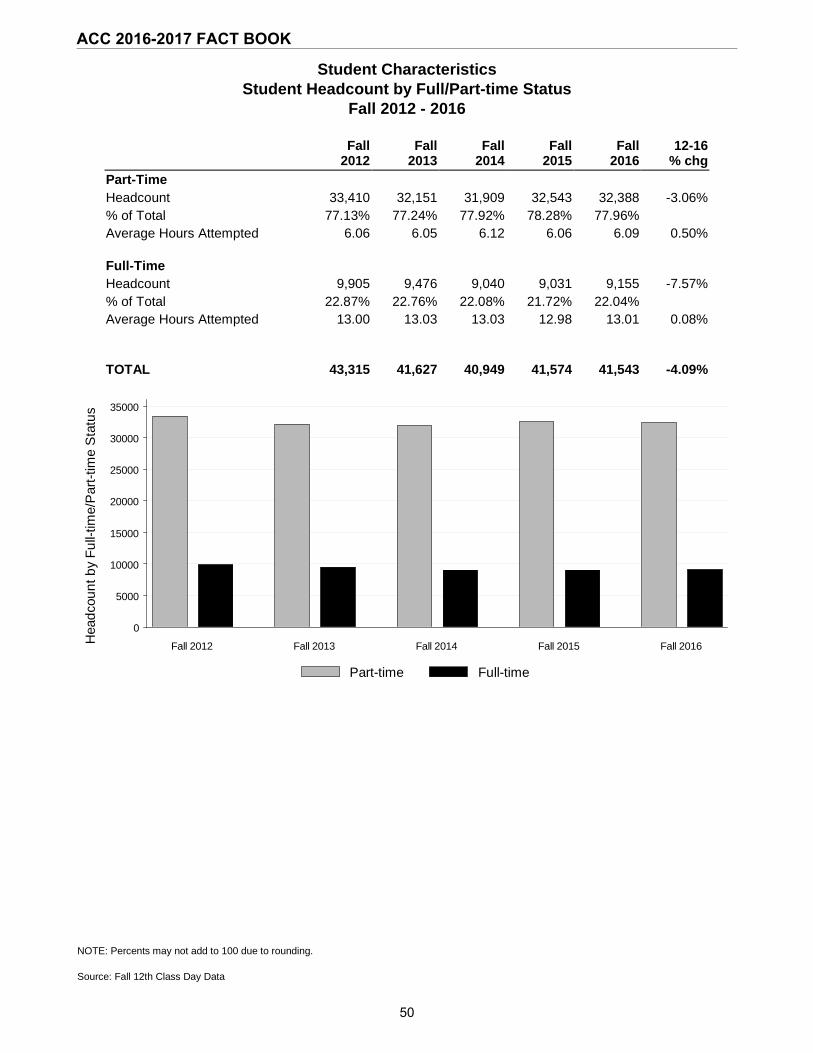
Student Characteristics Student Headcount by Full/Part-time Status
Fall 2012 - 2016
NOTE: Percents may not add to 100 due to rounding. Source: Fall 12th Class Day Data
Fall
2012 Fall
2013 Fall
2014 Fall
2015 Fall
2016 12-16 % chg
Part-Time Headcount 33,410 32,151 31,909 32,543 32,388 -3.06% % of Total 77.13% 77.24% 77.92% 78.28% 77.96% Average Hours Attempted 6.06 6.05 6.12 6.06 6.09 0.50%
Full-Time Headcount 9,905 9,476 9,040 9,031 9,155 -7.57% % of Total 22.87% 22.76% 22.08% 21.72% 22.04% Average Hours Attempted 13.00 13.03 13.03 12.98 13.01 0.08%
TOTAL 43,315 41,627 40,949 41,574 41,543 -4.09%
Part-time Full-time
Hea
dcou
nt b
y Fu
ll-tim
e/P
art-t
ime
Sta
tus
0
5000
10000
15000
20000
25000
30000
35000
Fall 2012 Fall 2013 Fall 2014 Fall 2015 Fall 2016
50
ACC 2016-2017 FACT BOOK
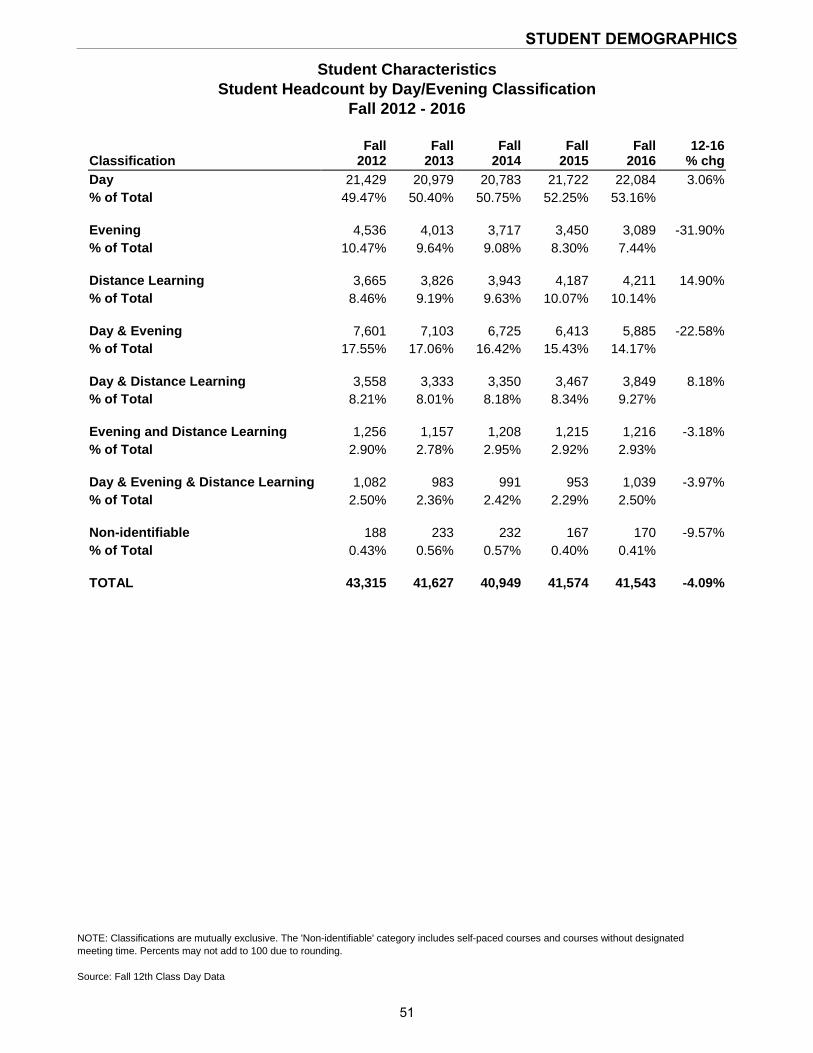
Student Characteristics Student Headcount by Day/Evening Classification
Fall 2012 - 2016
NOTE: Classifications are mutually exclusive. The 'Non-identifiable' category includes self-paced courses and courses without designated meeting time. Percents may not add to 100 due to rounding. Source: Fall 12th Class Day Data
Classification Fall
2012 Fall
2013 Fall
2014 Fall
2015 Fall
2016 12-16
% chg Day 21,429 20,979 20,783 21,722 22,084 3.06% % of Total 49.47% 50.40% 50.75% 52.25% 53.16%
Evening 4,536 4,013 3,717 3,450 3,089 -31.90% % of Total 10.47% 9.64% 9.08% 8.30% 7.44%
Distance Learning 3,665 3,826 3,943 4,187 4,211 14.90% % of Total 8.46% 9.19% 9.63% 10.07% 10.14%
Day & Evening 7,601 7,103 6,725 6,413 5,885 -22.58% % of Total 17.55% 17.06% 16.42% 15.43% 14.17%
Day & Distance Learning 3,558 3,333 3,350 3,467 3,849 8.18% % of Total 8.21% 8.01% 8.18% 8.34% 9.27%
Evening and Distance Learning 1,256 1,157 1,208 1,215 1,216 -3.18% % of Total 2.90% 2.78% 2.95% 2.92% 2.93%
Day & Evening & Distance Learning 1,082 983 991 953 1,039 -3.97% % of Total 2.50% 2.36% 2.42% 2.29% 2.50%
Non-identifiable 188 233 232 167 170 -9.57% % of Total 0.43% 0.56% 0.57% 0.40% 0.41%
TOTAL 43,315 41,627 40,949 41,574 41,543 -4.09%
51
STUDENT DEMOGRAPHICS
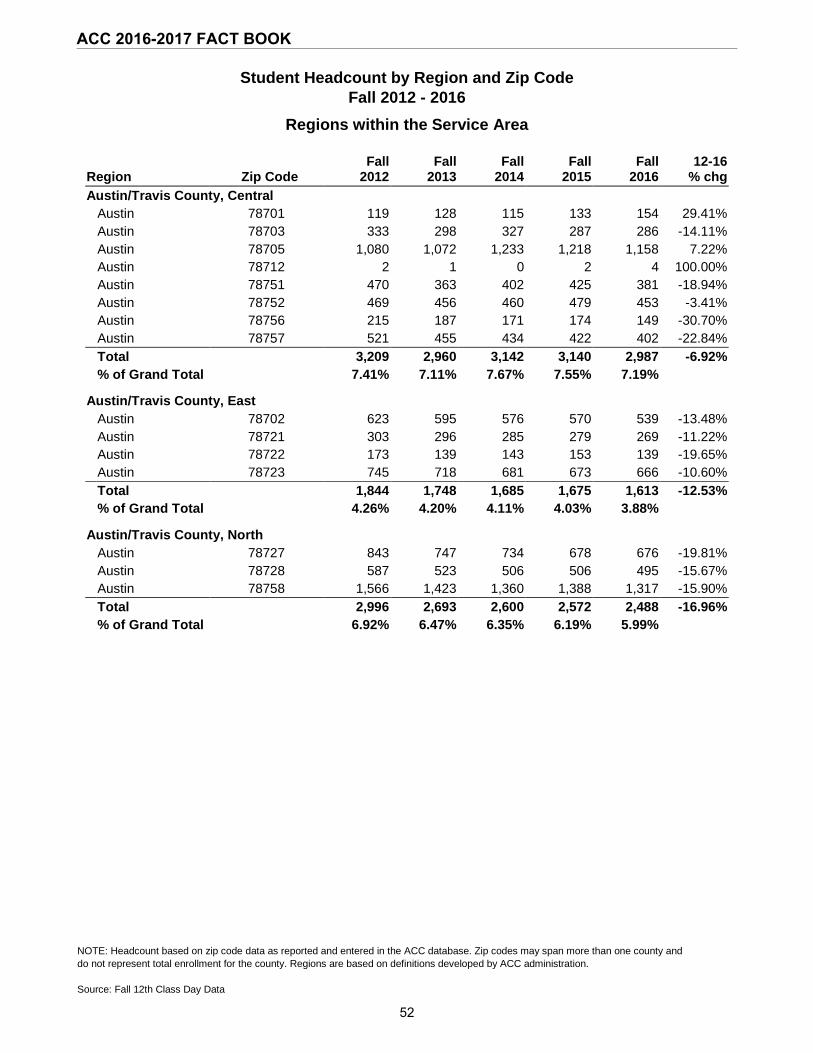
Student Headcount by Region and Zip Code
Fall 2012 - 2016
Regions within the Service Area
NOTE: Headcount based on zip code data as reported and entered in the ACC database. Zip codes may span more than one county and do not represent total enrollment for the county. Regions are based on definitions developed by ACC administration. Source: Fall 12th Class Day Data
Region Zip Code Fall 2012
Fall 2013
Fall 2014
Fall 2015
Fall 2016
12-16 % chg
Austin/Travis County, Central Austin 78701 119 128 115 133 154 29.41% Austin 78703 333 298 327 287 286 -14.11% Austin 78705 1,080 1,072 1,233 1,218 1,158 7.22% Austin 78712 2 1 0 2 4 100.00% Austin 78751 470 363 402 425 381 -18.94% Austin 78752 469 456 460 479 453 -3.41% Austin 78756 215 187 171 174 149 -30.70% Austin 78757 521 455 434 422 402 -22.84% Total 3,209 2,960 3,142 3,140 2,987 -6.92% % of Grand Total 7.41% 7.11% 7.67% 7.55% 7.19%
Austin/Travis County, East Austin 78702 623 595 576 570 539 -13.48% Austin 78721 303 296 285 279 269 -11.22% Austin 78722 173 139 143 153 139 -19.65% Austin 78723 745 718 681 673 666 -10.60% Total 1,844 1,748 1,685 1,675 1,613 -12.53% % of Grand Total 4.26% 4.20% 4.11% 4.03% 3.88%
Austin/Travis County, North Austin 78727 843 747 734 678 676 -19.81% Austin 78728 587 523 506 506 495 -15.67% Austin 78758 1,566 1,423 1,360 1,388 1,317 -15.90% Total 2,996 2,693 2,600 2,572 2,488 -16.96% % of Grand Total 6.92% 6.47% 6.35% 6.19% 5.99%
52
ACC 2016-2017 FACT BOOK
Student Headcount by Region and Zip Code
Fall 2012 - 2016
Regions within the Service Area
NOTE: Headcount based on zip code data as reported and entered in the ACC database. Zip codes may span more than one county and do not represent total enrollment for the county. Regions are based on definitions developed by ACC administration. Source: Fall 12th Class Day Data
Region Zip Code Fall 2012
Fall 2013
Fall 2014
Fall 2015
Fall 2016
12-16 % chg
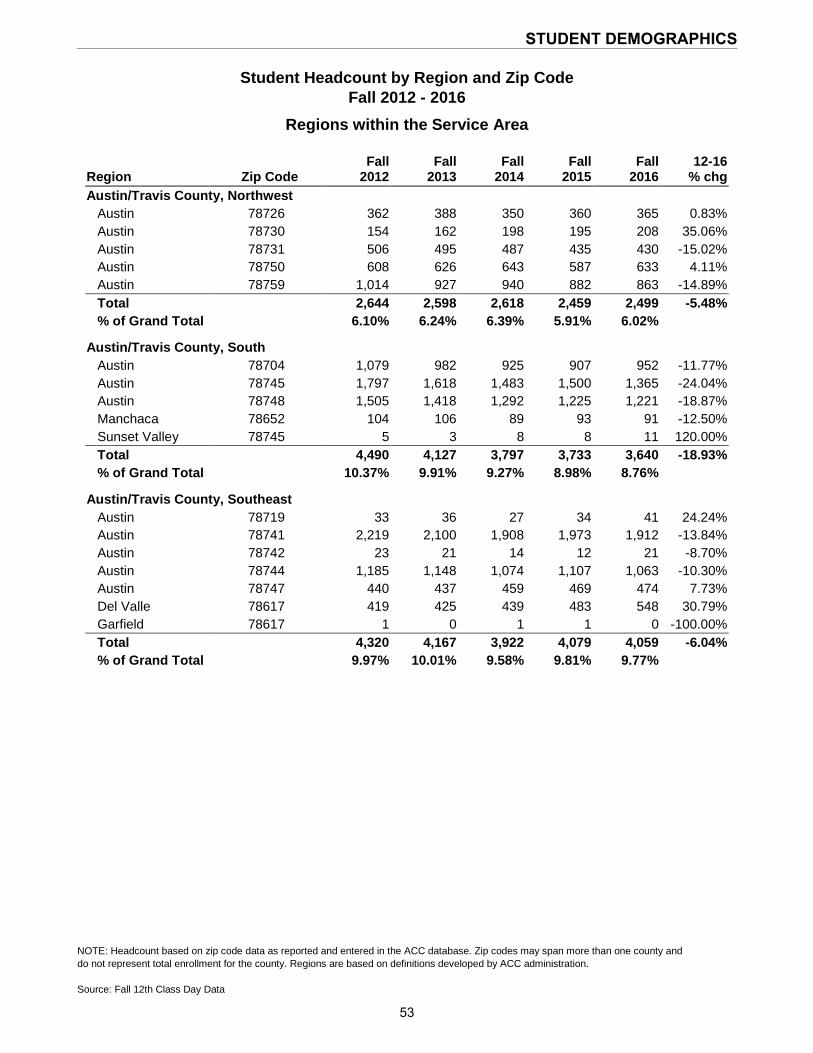
Austin/Travis County, Northwest Austin 78726 362 388 350 360 365 0.83% Austin 78730 154 162 198 195 208 35.06% Austin 78731 506 495 487 435 430 -15.02% Austin 78750 608 626 643 587 633 4.11% Austin 78759 1,014 927 940 882 863 -14.89% Total 2,644 2,598 2,618 2,459 2,499 -5.48% % of Grand Total 6.10% 6.24% 6.39% 5.91% 6.02%
Austin/Travis County, South Austin 78704 1,079 982 925 907 952 -11.77% Austin 78745 1,797 1,618 1,483 1,500 1,365 -24.04% Austin 78748 1,505 1,418 1,292 1,225 1,221 -18.87% Manchaca 78652 104 106 89 93 91 -12.50% Sunset Valley 78745 5 3 8 8 11 120.00% Total 4,490 4,127 3,797 3,733 3,640 -18.93% % of Grand Total 10.37% 9.91% 9.27% 8.98% 8.76%
Austin/Travis County, Southeast Austin 78719 33 36 27 34 41 24.24% Austin 78741 2,219 2,100 1,908 1,973 1,912 -13.84% Austin 78742 23 21 14 12 21 -8.70% Austin 78744 1,185 1,148 1,074 1,107 1,063 -10.30% Austin 78747 440 437 459 469 474 7.73% Del Valle 78617 419 425 439 483 548 30.79% Garfield 78617 1 0 1 1 0 -100.00% Total 4,320 4,167 3,922 4,079 4,059 -6.04% % of Grand Total 9.97% 10.01% 9.58% 9.81% 9.77%
53
STUDENT DEMOGRAPHICS
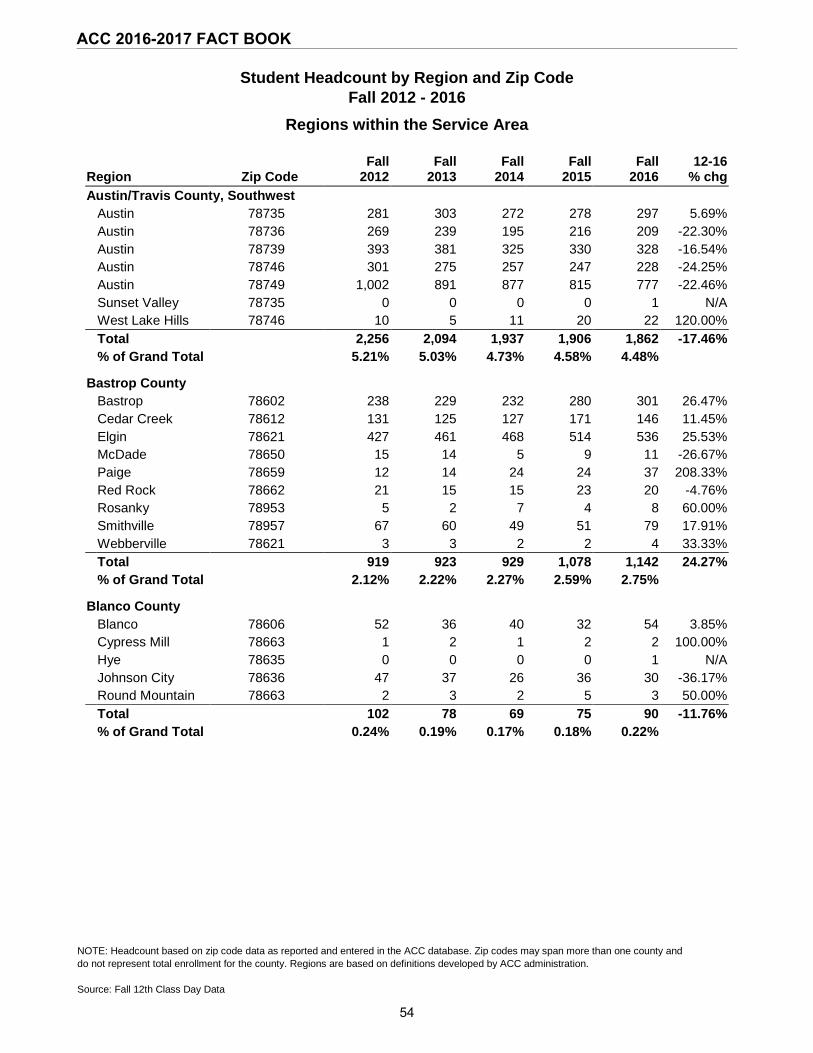
Student Headcount by Region and Zip Code
Fall 2012 - 2016
Regions within the Service Area
NOTE: Headcount based on zip code data as reported and entered in the ACC database. Zip codes may span more than one county and do not represent total enrollment for the county. Regions are based on definitions developed by ACC administration. Source: Fall 12th Class Day Data
Region Zip Code Fall 2012
Fall 2013
Fall 2014
Fall 2015
Fall 2016
12-16 % chg
Austin/Travis County, Southwest Austin 78735 281 303 272 278 297 5.69% Austin 78736 269 239 195 216 209 -22.30% Austin 78739 393 381 325 330 328 -16.54% Austin 78746 301 275 257 247 228 -24.25% Austin 78749 1,002 891 877 815 777 -22.46% Sunset Valley 78735 0 0 0 0 1 N/A West Lake Hills 78746 10 5 11 20 22 120.00% Total 2,256 2,094 1,937 1,906 1,862 -17.46% % of Grand Total 5.21% 5.03% 4.73% 4.58% 4.48%
Bastrop County Bastrop 78602 238 229 232 280 301 26.47% Cedar Creek 78612 131 125 127 171 146 11.45% Elgin 78621 427 461 468 514 536 25.53% McDade 78650 15 14 5 9 11 -26.67% Paige 78659 12 14 24 24 37 208.33% Red Rock 78662 21 15 15 23 20 -4.76% Rosanky 78953 5 2 7 4 8 60.00% Smithville 78957 67 60 49 51 79 17.91% Webberville 78621 3 3 2 2 4 33.33% Total 919 923 929 1,078 1,142 24.27% % of Grand Total 2.12% 2.22% 2.27% 2.59% 2.75%
Blanco County Blanco 78606 52 36 40 32 54 3.85% Cypress Mill 78663 1 2 1 2 2 100.00% Hye 78635 0 0 0 0 1 N/A Johnson City 78636 47 37 26 36 30 -36.17% Round Mountain 78663 2 3 2 5 3 50.00% Total 102 78 69 75 90 -11.76% % of Grand Total 0.24% 0.19% 0.17% 0.18% 0.22%
54
ACC 2016-2017 FACT BOOK
Student Headcount by Region and Zip Code
Fall 2012 - 2016
Regions within the Service Area
NOTE: Headcount based on zip code data as reported and entered in the ACC database. Zip codes may span more than one county and do not represent total enrollment for the county. Regions are based on definitions developed by ACC administration. Source: Fall 12th Class Day Data
Region Zip Code Fall 2012
Fall 2013
Fall 2014
Fall 2015
Fall 2016
12-16 % chg
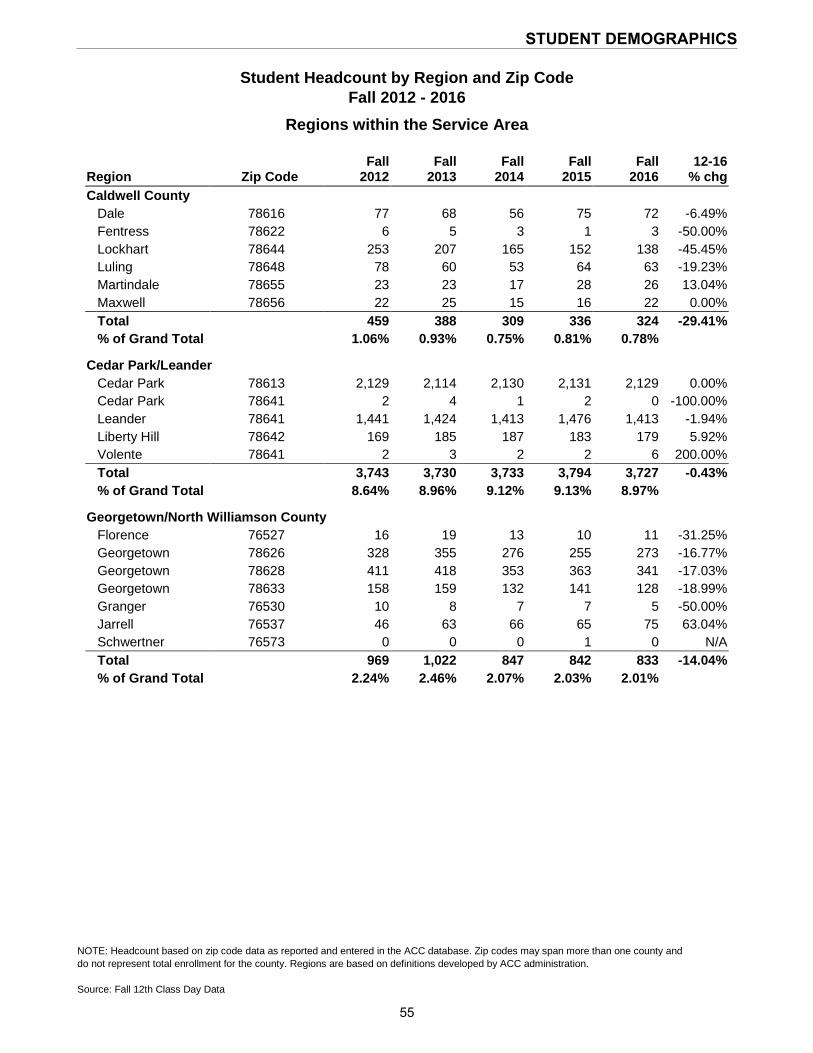
Caldwell County Dale 78616 77 68 56 75 72 -6.49% Fentress 78622 6 5 3 1 3 -50.00% Lockhart 78644 253 207 165 152 138 -45.45% Luling 78648 78 60 53 64 63 -19.23% Martindale 78655 23 23 17 28 26 13.04% Maxwell 78656 22 25 15 16 22 0.00% Total 459 388 309 336 324 -29.41% % of Grand Total 1.06% 0.93% 0.75% 0.81% 0.78%
Cedar Park/Leander Cedar Park 78613 2,129 2,114 2,130 2,131 2,129 0.00% Cedar Park 78641 2 4 1 2 0 -100.00% Leander 78641 1,441 1,424 1,413 1,476 1,413 -1.94% Liberty Hill 78642 169 185 187 183 179 5.92% Volente 78641 2 3 2 2 6 200.00% Total 3,743 3,730 3,733 3,794 3,727 -0.43% % of Grand Total 8.64% 8.96% 9.12% 9.13% 8.97%
Georgetown/North Williamson County Florence 76527 16 19 13 10 11 -31.25% Georgetown 78626 328 355 276 255 273 -16.77% Georgetown 78628 411 418 353 363 341 -17.03% Georgetown 78633 158 159 132 141 128 -18.99% Granger 76530 10 8 7 7 5 -50.00% Jarrell 76537 46 63 66 65 75 63.04% Schwertner 76573 0 0 0 1 0 N/A Total 969 1,022 847 842 833 -14.04% % of Grand Total 2.24% 2.46% 2.07% 2.03% 2.01%
55
STUDENT DEMOGRAPHICS
Student Headcount by Region and Zip Code
Fall 2012 - 2016
Regions within the Service Area
NOTE: Headcount based on zip code data as reported and entered in the ACC database. Zip codes may span more than one county and do not represent total enrollment for the county. Regions are based on definitions developed by ACC administration. Source: Fall 12th Class Day Data
Region Zip Code Fall 2012
Fall 2013
Fall 2014
Fall 2015
Fall 2016
12-16 % chg
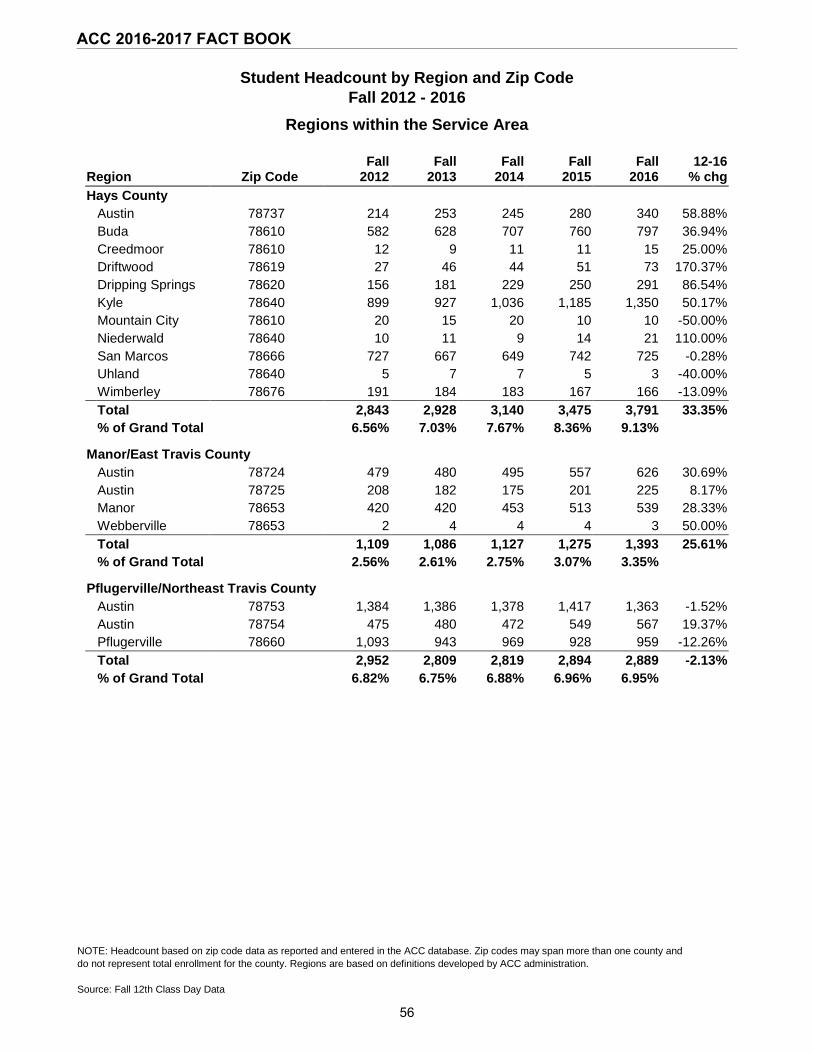
Hays County Austin 78737 214 253 245 280 340 58.88% Buda 78610 582 628 707 760 797 36.94% Creedmoor 78610 12 9 11 11 15 25.00% Driftwood 78619 27 46 44 51 73 170.37% Dripping Springs 78620 156 181 229 250 291 86.54% Kyle 78640 899 927 1,036 1,185 1,350 50.17% Mountain City 78610 20 15 20 10 10 -50.00% Niederwald 78640 10 11 9 14 21 110.00% San Marcos 78666 727 667 649 742 725 -0.28% Uhland 78640 5 7 7 5 3 -40.00% Wimberley 78676 191 184 183 167 166 -13.09% Total 2,843 2,928 3,140 3,475 3,791 33.35% % of Grand Total 6.56% 7.03% 7.67% 8.36% 9.13%
Manor/East Travis County Austin 78724 479 480 495 557 626 30.69% Austin 78725 208 182 175 201 225 8.17% Manor 78653 420 420 453 513 539 28.33% Webberville 78653 2 4 4 4 3 50.00% Total 1,109 1,086 1,127 1,275 1,393 25.61% % of Grand Total 2.56% 2.61% 2.75% 3.07% 3.35%
Pflugerville/Northeast Travis County Austin 78753 1,384 1,386 1,378 1,417 1,363 -1.52% Austin 78754 475 480 472 549 567 19.37% Pflugerville 78660 1,093 943 969 928 959 -12.26% Total 2,952 2,809 2,819 2,894 2,889 -2.13% % of Grand Total 6.82% 6.75% 6.88% 6.96% 6.95%
56
ACC 2016-2017 FACT BOOK
Student Headcount by Region and Zip Code
Fall 2012 - 2016
Regions within the Service Area
NOTE: Headcount based on zip code data as reported and entered in the ACC database. Zip codes may span more than one county and do not represent total enrollment for the county. Regions are based on definitions developed by ACC administration. Source: Fall 12th Class Day Data
Region Zip Code Fall 2012
Fall 2013
Fall 2014
Fall 2015
Fall 2016
12-16 % chg
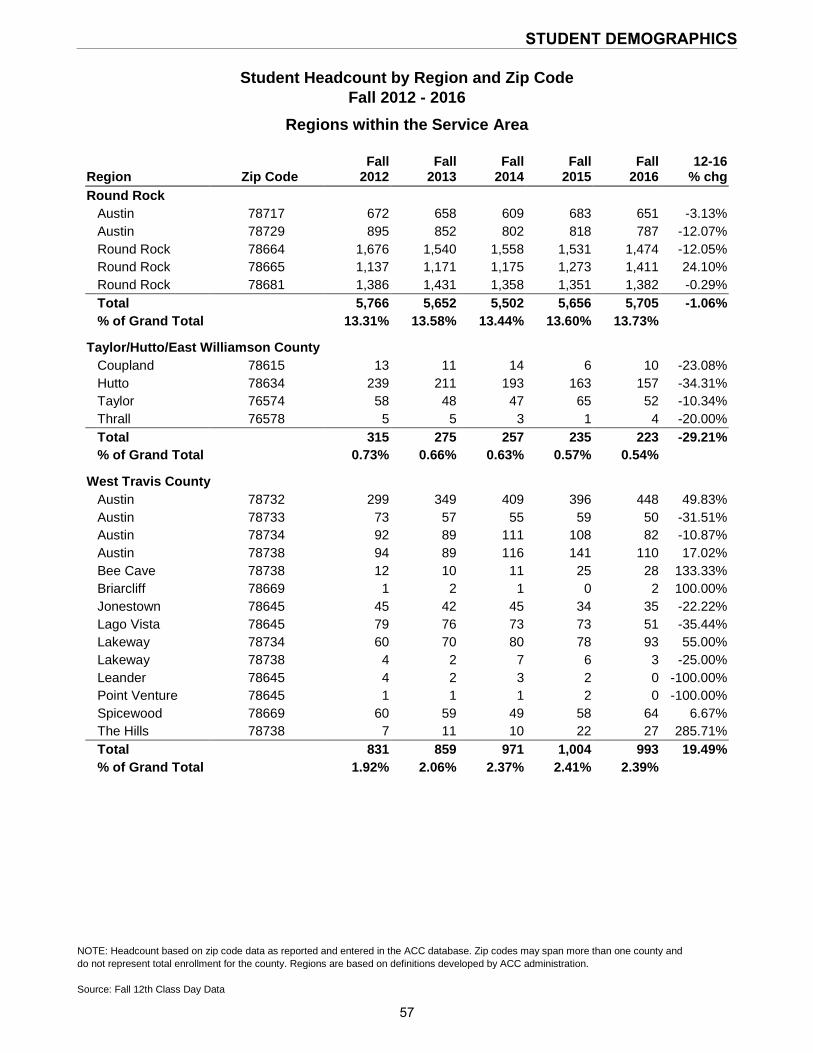
Round Rock Austin 78717 672 658 609 683 651 -3.13% Austin 78729 895 852 802 818 787 -12.07% Round Rock 78664 1,676 1,540 1,558 1,531 1,474 -12.05% Round Rock 78665 1,137 1,171 1,175 1,273 1,411 24.10% Round Rock 78681 1,386 1,431 1,358 1,351 1,382 -0.29% Total 5,766 5,652 5,502 5,656 5,705 -1.06% % of Grand Total 13.31% 13.58% 13.44% 13.60% 13.73%
Taylor/Hutto/East Williamson County Coupland 78615 13 11 14 6 10 -23.08% Hutto 78634 239 211 193 163 157 -34.31% Taylor 76574 58 48 47 65 52 -10.34% Thrall 76578 5 5 3 1 4 -20.00% Total 315 275 257 235 223 -29.21% % of Grand Total 0.73% 0.66% 0.63% 0.57% 0.54%
West Travis County Austin 78732 299 349 409 396 448 49.83% Austin 78733 73 57 55 59 50 -31.51% Austin 78734 92 89 111 108 82 -10.87% Austin 78738 94 89 116 141 110 17.02% Bee Cave 78738 12 10 11 25 28 133.33% Briarcliff 78669 1 2 1 0 2 100.00% Jonestown 78645 45 42 45 34 35 -22.22% Lago Vista 78645 79 76 73 73 51 -35.44% Lakeway 78734 60 70 80 78 93 55.00% Lakeway 78738 4 2 7 6 3 -25.00% Leander 78645 4 2 3 2 0 -100.00% Point Venture 78645 1 1 1 2 0 -100.00% Spicewood 78669 60 59 49 58 64 6.67% The Hills 78738 7 11 10 22 27 285.71% Total 831 859 971 1,004 993 19.49% % of Grand Total 1.92% 2.06% 2.37% 2.41% 2.39%
57
STUDENT DEMOGRAPHICS

Student Headcount by Region and Zip Code Fall 2012 - 2016
Regions outside the Service Area1
1Regions outside the Service Area include students from any region within the state of Texas that have 25 or more students. 2Other/Unknown includes students from regions with less than 25 students and students that live outside the state of Texas. NOTE: Headcount based on zip code data as reported and entered in the ACC database. Zip codes may span more than one county and do not represent total enrollment for the county. Regions are based on definitions developed by ACC administration. Source: Fall 12th Class Day Data
Region Fall 2012
Fall 2013
Fall 2014
Fall 2015
Fall 2016
12-16 % chg
Bell County Total 73 70 63 88 103 41.10% % of Grand Total 0.17% 0.17% 0.15% 0.21% 0.25%
Bexar County Total 54 72 70 80 97 79.63% % of Grand Total 0.12% 0.17% 0.17% 0.19% 0.23%
Burnet County Total 45 57 56 47 51 13.33% % of Grand Total 0.10% 0.14% 0.14% 0.11% 0.12%
Collin County Total 48 44 33 35 34 -29.17% % of Grand Total 0.11% 0.11% 0.08% 0.08% 0.08%
Comal County Total 101 110 109 124 139 37.62% % of Grand Total 0.23% 0.26% 0.27% 0.30% 0.33%
Dallas County Total 51 51 70 45 38 -25.49% % of Grand Total 0.12% 0.12% 0.17% 0.11% 0.09%
Denton County Total 25 34 39 30 28 12.00% % of Grand Total 0.06% 0.08% 0.10% 0.07% 0.07%
Fort Bend County Total 29 23 42 41 33 13.79% % of Grand Total 0.07% 0.06% 0.10% 0.10% 0.08%
Guadalupe County Total 40 42 52 42 54 35.00% % of Grand Total 0.09% 0.10% 0.13% 0.10% 0.13%
Harris County Total 113 126 156 126 117 3.54% % of Grand Total 0.26% 0.30% 0.38% 0.30% 0.28%
58
ACC 2016-2017 FACT BOOK
Student Headcount by Region and Zip Code Fall 2012 - 2016
Regions outside the Service Area1
1Regions outside the Service Area include students from any region within the state of Texas that have 25 or more students. 2Other/Unknown includes students from regions with less than 25 students and students that live outside the state of Texas. NOTE: Headcount based on zip code data as reported and entered in the ACC database. Zip codes may span more than one county and do not represent total enrollment for the county. Regions are based on definitions developed by ACC administration. Source: Fall 12th Class Day Data
Region Fall 2012
Fall 2013
Fall 2014
Fall 2015
Fall 2016
12-16 % chg
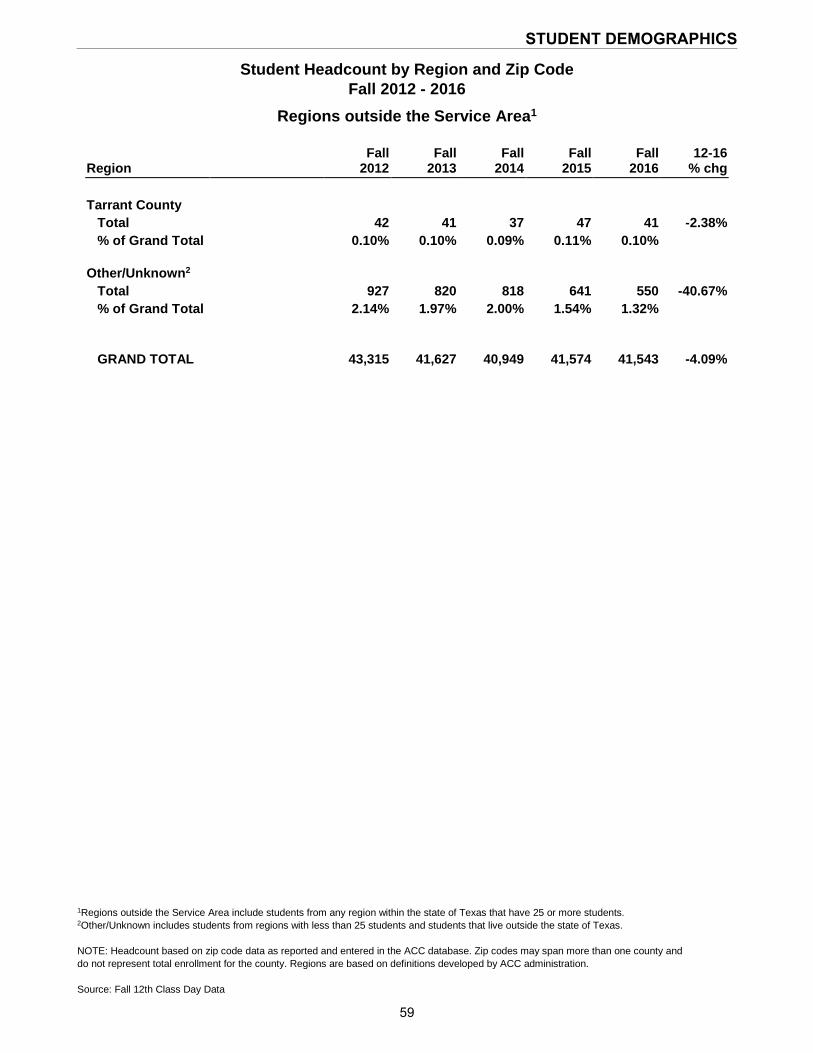
Tarrant County Total 42 41 37 47 41 -2.38% % of Grand Total 0.10% 0.10% 0.09% 0.11% 0.10%
Other/Unknown2 Total 927 820 818 641 550 -40.67% % of Grand Total 2.14% 1.97% 2.00% 1.54% 1.32%
GRAND TOTAL 43,315 41,627 40,949 41,574 41,543 -4.09%
59
STUDENT DEMOGRAPHICS
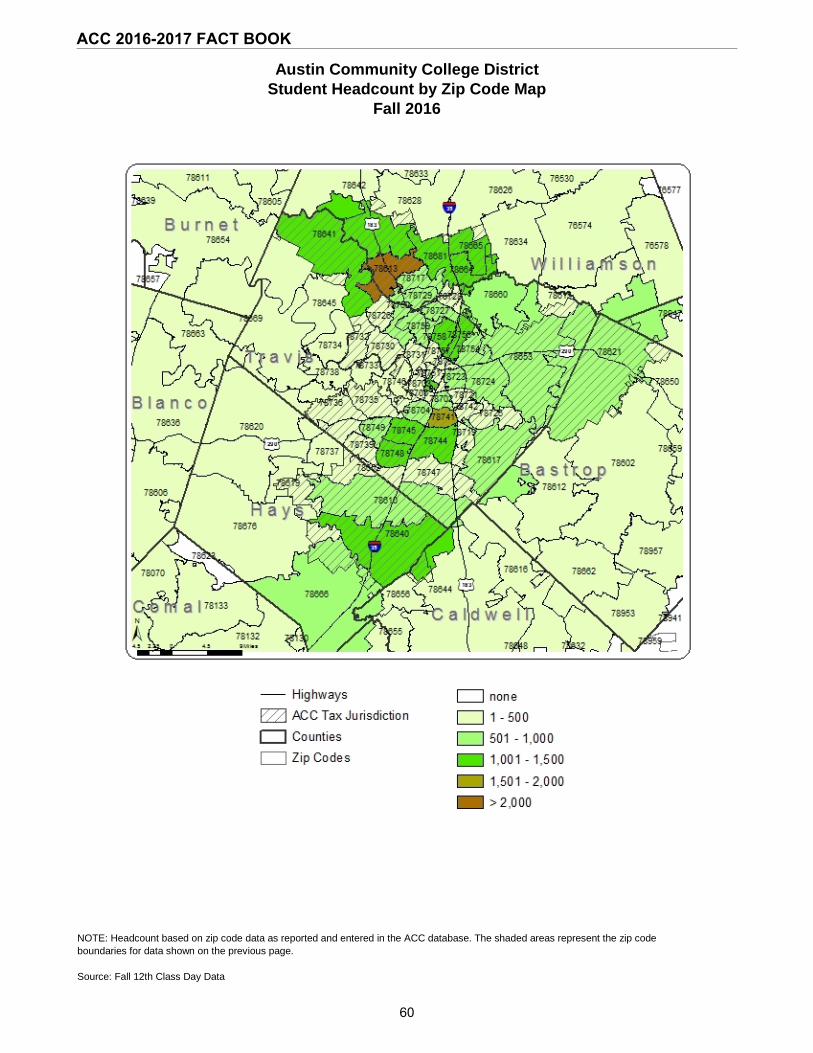
Austin Community College District Student Headcount by Zip Code Map
Fall 2016
NOTE: Headcount based on zip code data as reported and entered in the ACC database. The shaded areas represent the zip code boundaries for data shown on the previous page. Source: Fall 12th Class Day Data
60
ACC 2016-2017 FACT BOOK
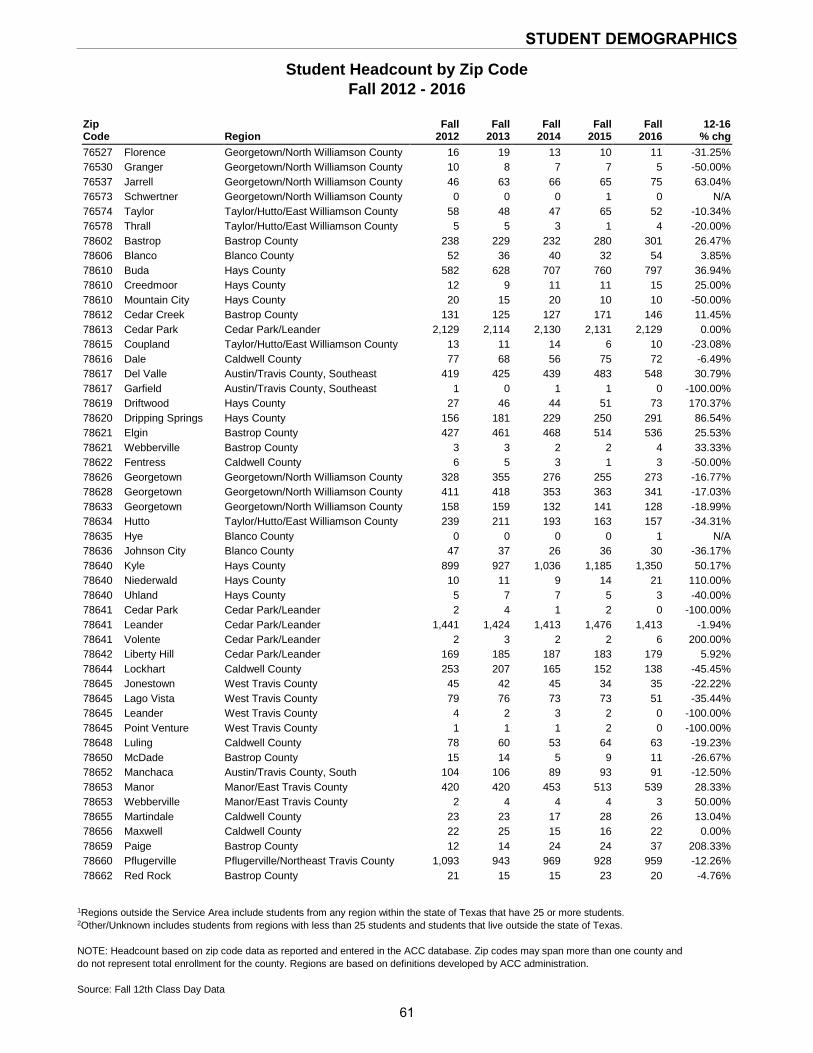
Student Headcount by Zip Code Fall 2012 - 2016
1Regions outside the Service Area include students from any region within the state of Texas that have 25 or more students. 2Other/Unknown includes students from regions with less than 25 students and students that live outside the state of Texas. NOTE: Headcount based on zip code data as reported and entered in the ACC database. Zip codes may span more than one county and do not represent total enrollment for the county. Regions are based on definitions developed by ACC administration. Source: Fall 12th Class Day Data
Zip Code Region
Fall 2012
Fall 2013
Fall 2014
Fall 2015
Fall 2016
12-16 % chg
76527 Florence Georgetown/North Williamson County 16 19 13 10 11 -31.25% 76530 Granger Georgetown/North Williamson County 10 8 7 7 5 -50.00% 76537 Jarrell Georgetown/North Williamson County 46 63 66 65 75 63.04% 76573 Schwertner Georgetown/North Williamson County 0 0 0 1 0 N/A 76574 Taylor Taylor/Hutto/East Williamson County 58 48 47 65 52 -10.34% 76578 Thrall Taylor/Hutto/East Williamson County 5 5 3 1 4 -20.00% 78602 Bastrop Bastrop County 238 229 232 280 301 26.47% 78606 Blanco Blanco County 52 36 40 32 54 3.85% 78610 Buda Hays County 582 628 707 760 797 36.94% 78610 Creedmoor Hays County 12 9 11 11 15 25.00% 78610 Mountain City Hays County 20 15 20 10 10 -50.00% 78612 Cedar Creek Bastrop County 131 125 127 171 146 11.45% 78613 Cedar Park Cedar Park/Leander 2,129 2,114 2,130 2,131 2,129 0.00% 78615 Coupland Taylor/Hutto/East Williamson County 13 11 14 6 10 -23.08% 78616 Dale Caldwell County 77 68 56 75 72 -6.49% 78617 Del Valle Austin/Travis County, Southeast 419 425 439 483 548 30.79% 78617 Garfield Austin/Travis County, Southeast 1 0 1 1 0 -100.00% 78619 Driftwood Hays County 27 46 44 51 73 170.37% 78620 Dripping Springs Hays County 156 181 229 250 291 86.54% 78621 Elgin Bastrop County 427 461 468 514 536 25.53% 78621 Webberville Bastrop County 3 3 2 2 4 33.33% 78622 Fentress Caldwell County 6 5 3 1 3 -50.00% 78626 Georgetown Georgetown/North Williamson County 328 355 276 255 273 -16.77% 78628 Georgetown Georgetown/North Williamson County 411 418 353 363 341 -17.03% 78633 Georgetown Georgetown/North Williamson County 158 159 132 141 128 -18.99% 78634 Hutto Taylor/Hutto/East Williamson County 239 211 193 163 157 -34.31% 78635 Hye Blanco County 0 0 0 0 1 N/A 78636 Johnson City Blanco County 47 37 26 36 30 -36.17% 78640 Kyle Hays County 899 927 1,036 1,185 1,350 50.17% 78640 Niederwald Hays County 10 11 9 14 21 110.00% 78640 Uhland Hays County 5 7 7 5 3 -40.00% 78641 Cedar Park Cedar Park/Leander 2 4 1 2 0 -100.00% 78641 Leander Cedar Park/Leander 1,441 1,424 1,413 1,476 1,413 -1.94% 78641 Volente Cedar Park/Leander 2 3 2 2 6 200.00% 78642 Liberty Hill Cedar Park/Leander 169 185 187 183 179 5.92% 78644 Lockhart Caldwell County 253 207 165 152 138 -45.45% 78645 Jonestown West Travis County 45 42 45 34 35 -22.22% 78645 Lago Vista West Travis County 79 76 73 73 51 -35.44% 78645 Leander West Travis County 4 2 3 2 0 -100.00% 78645 Point Venture West Travis County 1 1 1 2 0 -100.00% 78648 Luling Caldwell County 78 60 53 64 63 -19.23% 78650 McDade Bastrop County 15 14 5 9 11 -26.67% 78652 Manchaca Austin/Travis County, South 104 106 89 93 91 -12.50% 78653 Manor Manor/East Travis County 420 420 453 513 539 28.33% 78653 Webberville Manor/East Travis County 2 4 4 4 3 50.00% 78655 Martindale Caldwell County 23 23 17 28 26 13.04% 78656 Maxwell Caldwell County 22 25 15 16 22 0.00% 78659 Paige Bastrop County 12 14 24 24 37 208.33% 78660 Pflugerville Pflugerville/Northeast Travis County 1,093 943 969 928 959 -12.26% 78662 Red Rock Bastrop County 21 15 15 23 20 -4.76%
61
STUDENT DEMOGRAPHICS
Student Headcount by Zip Code Fall 2012 - 2016
1Regions outside the Service Area include students from any region within the state of Texas that have 25 or more students. 2Other/Unknown includes students from regions with less than 25 students and students that live outside the state of Texas. NOTE: Headcount based on zip code data as reported and entered in the ACC database. Zip codes may span more than one county and do not represent total enrollment for the county. Regions are based on definitions developed by ACC administration. Source: Fall 12th Class Day Data
Zip Code Region
Fall 2012
Fall 2013
Fall 2014
Fall 2015
Fall 2016
12-16 % chg
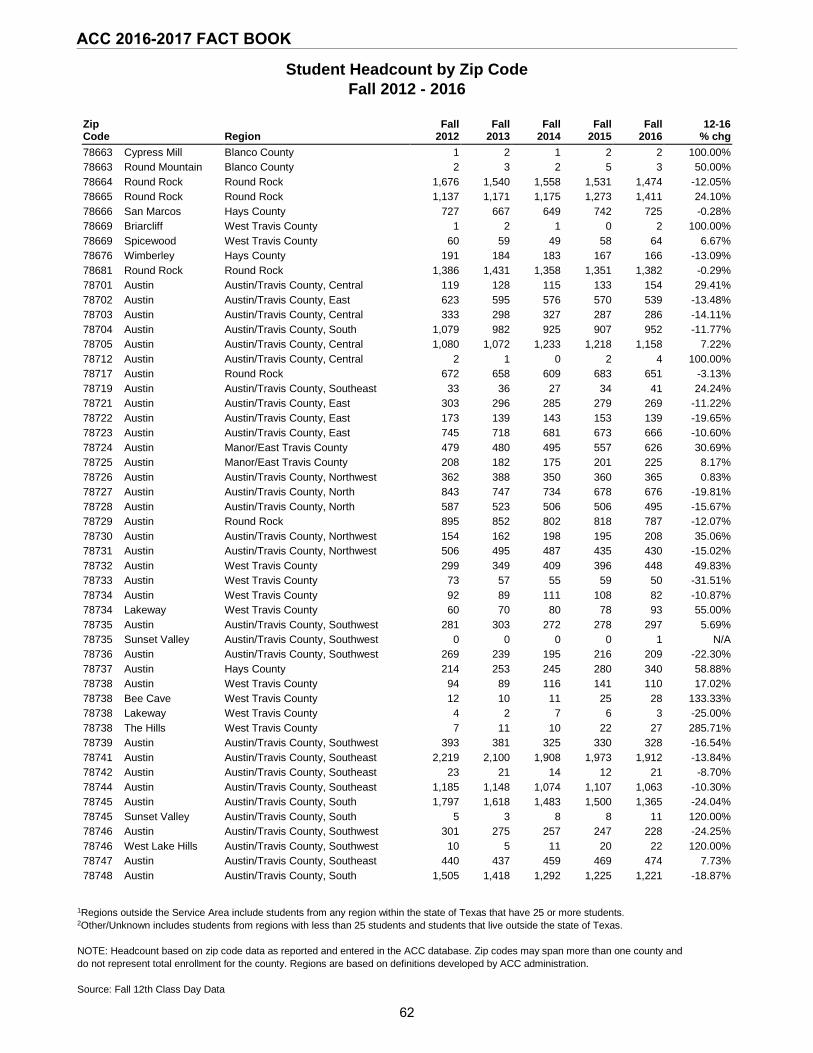
78663 Cypress Mill Blanco County 1 2 1 2 2 100.00% 78663 Round Mountain Blanco County 2 3 2 5 3 50.00% 78664 Round Rock Round Rock 1,676 1,540 1,558 1,531 1,474 -12.05% 78665 Round Rock Round Rock 1,137 1,171 1,175 1,273 1,411 24.10% 78666 San Marcos Hays County 727 667 649 742 725 -0.28% 78669 Briarcliff West Travis County 1 2 1 0 2 100.00% 78669 Spicewood West Travis County 60 59 49 58 64 6.67% 78676 Wimberley Hays County 191 184 183 167 166 -13.09% 78681 Round Rock Round Rock 1,386 1,431 1,358 1,351 1,382 -0.29% 78701 Austin Austin/Travis County, Central 119 128 115 133 154 29.41% 78702 Austin Austin/Travis County, East 623 595 576 570 539 -13.48% 78703 Austin Austin/Travis County, Central 333 298 327 287 286 -14.11% 78704 Austin Austin/Travis County, South 1,079 982 925 907 952 -11.77% 78705 Austin Austin/Travis County, Central 1,080 1,072 1,233 1,218 1,158 7.22% 78712 Austin Austin/Travis County, Central 2 1 0 2 4 100.00% 78717 Austin Round Rock 672 658 609 683 651 -3.13% 78719 Austin Austin/Travis County, Southeast 33 36 27 34 41 24.24% 78721 Austin Austin/Travis County, East 303 296 285 279 269 -11.22% 78722 Austin Austin/Travis County, East 173 139 143 153 139 -19.65% 78723 Austin Austin/Travis County, East 745 718 681 673 666 -10.60% 78724 Austin Manor/East Travis County 479 480 495 557 626 30.69% 78725 Austin Manor/East Travis County 208 182 175 201 225 8.17% 78726 Austin Austin/Travis County, Northwest 362 388 350 360 365 0.83% 78727 Austin Austin/Travis County, North 843 747 734 678 676 -19.81% 78728 Austin Austin/Travis County, North 587 523 506 506 495 -15.67% 78729 Austin Round Rock 895 852 802 818 787 -12.07% 78730 Austin Austin/Travis County, Northwest 154 162 198 195 208 35.06% 78731 Austin Austin/Travis County, Northwest 506 495 487 435 430 -15.02% 78732 Austin West Travis County 299 349 409 396 448 49.83% 78733 Austin West Travis County 73 57 55 59 50 -31.51% 78734 Austin West Travis County 92 89 111 108 82 -10.87% 78734 Lakeway West Travis County 60 70 80 78 93 55.00% 78735 Austin Austin/Travis County, Southwest 281 303 272 278 297 5.69% 78735 Sunset Valley Austin/Travis County, Southwest 0 0 0 0 1 N/A 78736 Austin Austin/Travis County, Southwest 269 239 195 216 209 -22.30% 78737 Austin Hays County 214 253 245 280 340 58.88% 78738 Austin West Travis County 94 89 116 141 110 17.02% 78738 Bee Cave West Travis County 12 10 11 25 28 133.33% 78738 Lakeway West Travis County 4 2 7 6 3 -25.00% 78738 The Hills West Travis County 7 11 10 22 27 285.71% 78739 Austin Austin/Travis County, Southwest 393 381 325 330 328 -16.54% 78741 Austin Austin/Travis County, Southeast 2,219 2,100 1,908 1,973 1,912 -13.84% 78742 Austin Austin/Travis County, Southeast 23 21 14 12 21 -8.70% 78744 Austin Austin/Travis County, Southeast 1,185 1,148 1,074 1,107 1,063 -10.30% 78745 Austin Austin/Travis County, South 1,797 1,618 1,483 1,500 1,365 -24.04% 78745 Sunset Valley Austin/Travis County, South 5 3 8 8 11 120.00% 78746 Austin Austin/Travis County, Southwest 301 275 257 247 228 -24.25% 78746 West Lake Hills Austin/Travis County, Southwest 10 5 11 20 22 120.00% 78747 Austin Austin/Travis County, Southeast 440 437 459 469 474 7.73% 78748 Austin Austin/Travis County, South 1,505 1,418 1,292 1,225 1,221 -18.87%
62
ACC 2016-2017 FACT BOOK
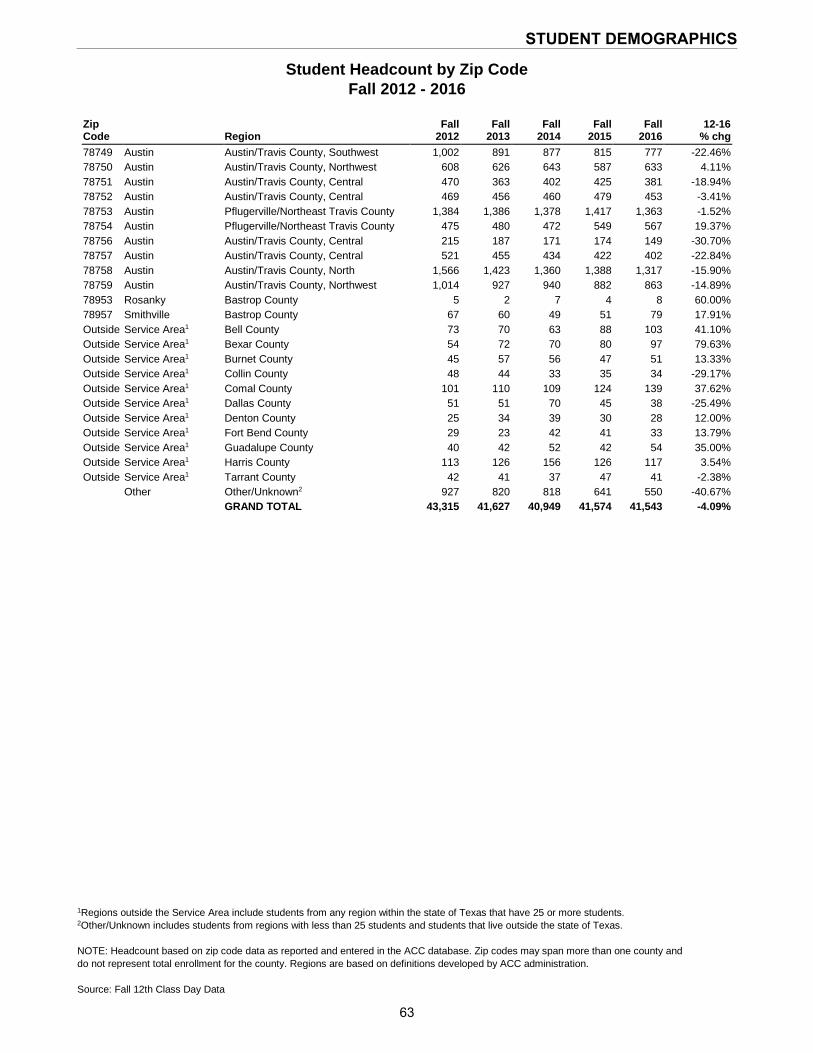
Student Headcount by Zip Code Fall 2012 - 2016
1Regions outside the Service Area include students from any region within the state of Texas that have 25 or more students. 2Other/Unknown includes students from regions with less than 25 students and students that live outside the state of Texas. NOTE: Headcount based on zip code data as reported and entered in the ACC database. Zip codes may span more than one county and do not represent total enrollment for the county. Regions are based on definitions developed by ACC administration. Source: Fall 12th Class Day Data
Zip Code Region
Fall 2012
Fall 2013
Fall 2014
Fall 2015
Fall 2016
12-16 % chg
78749 Austin Austin/Travis County, Southwest 1,002 891 877 815 777 -22.46% 78750 Austin Austin/Travis County, Northwest 608 626 643 587 633 4.11% 78751 Austin Austin/Travis County, Central 470 363 402 425 381 -18.94% 78752 Austin Austin/Travis County, Central 469 456 460 479 453 -3.41% 78753 Austin Pflugerville/Northeast Travis County 1,384 1,386 1,378 1,417 1,363 -1.52% 78754 Austin Pflugerville/Northeast Travis County 475 480 472 549 567 19.37% 78756 Austin Austin/Travis County, Central 215 187 171 174 149 -30.70% 78757 Austin Austin/Travis County, Central 521 455 434 422 402 -22.84% 78758 Austin Austin/Travis County, North 1,566 1,423 1,360 1,388 1,317 -15.90% 78759 Austin Austin/Travis County, Northwest 1,014 927 940 882 863 -14.89% 78953 Rosanky Bastrop County 5 2 7 4 8 60.00% 78957 Smithville Bastrop County 67 60 49 51 79 17.91% Outside Service Area1 Bell County 73 70 63 88 103 41.10% Outside Service Area1 Bexar County 54 72 70 80 97 79.63% Outside Service Area1 Burnet County 45 57 56 47 51 13.33% Outside Service Area1 Collin County 48 44 33 35 34 -29.17% Outside Service Area1 Comal County 101 110 109 124 139 37.62% Outside Service Area1 Dallas County 51 51 70 45 38 -25.49% Outside Service Area1 Denton County 25 34 39 30 28 12.00% Outside Service Area1 Fort Bend County 29 23 42 41 33 13.79% Outside Service Area1 Guadalupe County 40 42 52 42 54 35.00% Outside Service Area1 Harris County 113 126 156 126 117 3.54% Outside Service Area1 Tarrant County 42 41 37 47 41 -2.38%
Other Other/Unknown2 927 820 818 641 550 -40.67% GRAND TOTAL 43,315 41,627 40,949 41,574 41,543 -4.09%
63
STUDENT DEMOGRAPHICS
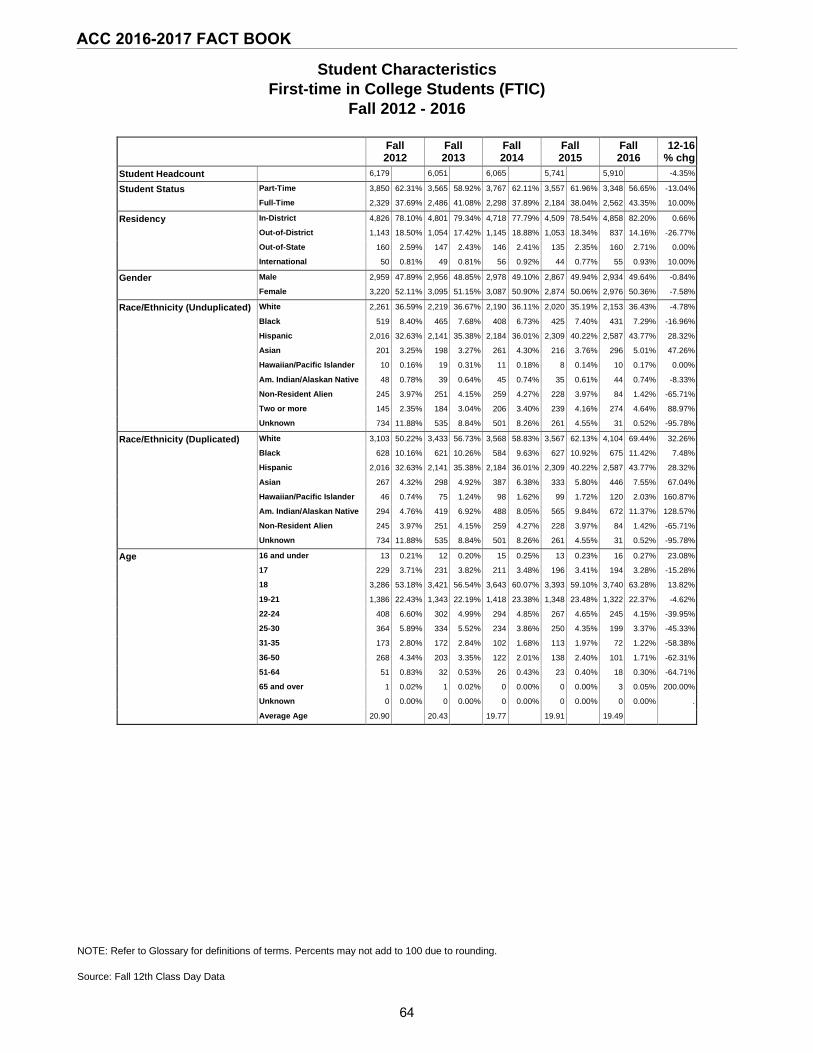
Student Characteristics First-time in College Students (FTIC)
Fall 2012 - 2016
NOTE: Refer to Glossary for definitions of terms. Percents may not add to 100 due to rounding. Source: Fall 12th Class Day Data
Fall 2012
Fall 2013
Fall 2014
Fall 2015
Fall 2016
12-16 % chg
Student Headcount 6,179 6,051 6,065 5,741 5,910 -4.35%
Student Status Part-Time 3,850 62.31% 3,565 58.92% 3,767 62.11% 3,557 61.96% 3,348 56.65% -13.04%
Full-Time 2,329 37.69% 2,486 41.08% 2,298 37.89% 2,184 38.04% 2,562 43.35% 10.00%
Residency In-District 4,826 78.10% 4,801 79.34% 4,718 77.79% 4,509 78.54% 4,858 82.20% 0.66%
Out-of-District 1,143 18.50% 1,054 17.42% 1,145 18.88% 1,053 18.34% 837 14.16% -26.77%
Out-of-State 160 2.59% 147 2.43% 146 2.41% 135 2.35% 160 2.71% 0.00%
International 50 0.81% 49 0.81% 56 0.92% 44 0.77% 55 0.93% 10.00%
Gender Male 2,959 47.89% 2,956 48.85% 2,978 49.10% 2,867 49.94% 2,934 49.64% -0.84%
Female 3,220 52.11% 3,095 51.15% 3,087 50.90% 2,874 50.06% 2,976 50.36% -7.58%
Race/Ethnicity (Unduplicated) White 2,261 36.59% 2,219 36.67% 2,190 36.11% 2,020 35.19% 2,153 36.43% -4.78%
Black 519 8.40% 465 7.68% 408 6.73% 425 7.40% 431 7.29% -16.96%
Hispanic 2,016 32.63% 2,141 35.38% 2,184 36.01% 2,309 40.22% 2,587 43.77% 28.32%
Asian 201 3.25% 198 3.27% 261 4.30% 216 3.76% 296 5.01% 47.26%
Hawaiian/Pacific Islander 10 0.16% 19 0.31% 11 0.18% 8 0.14% 10 0.17% 0.00%
Am. Indian/Alaskan Native 48 0.78% 39 0.64% 45 0.74% 35 0.61% 44 0.74% -8.33%
Non-Resident Alien 245 3.97% 251 4.15% 259 4.27% 228 3.97% 84 1.42% -65.71%
Two or more 145 2.35% 184 3.04% 206 3.40% 239 4.16% 274 4.64% 88.97%
Unknown 734 11.88% 535 8.84% 501 8.26% 261 4.55% 31 0.52% -95.78%
Race/Ethnicity (Duplicated) White 3,103 50.22% 3,433 56.73% 3,568 58.83% 3,567 62.13% 4,104 69.44% 32.26%
Black 628 10.16% 621 10.26% 584 9.63% 627 10.92% 675 11.42% 7.48%
Hispanic 2,016 32.63% 2,141 35.38% 2,184 36.01% 2,309 40.22% 2,587 43.77% 28.32%
Asian 267 4.32% 298 4.92% 387 6.38% 333 5.80% 446 7.55% 67.04%
Hawaiian/Pacific Islander 46 0.74% 75 1.24% 98 1.62% 99 1.72% 120 2.03% 160.87%
Am. Indian/Alaskan Native 294 4.76% 419 6.92% 488 8.05% 565 9.84% 672 11.37% 128.57%
Non-Resident Alien 245 3.97% 251 4.15% 259 4.27% 228 3.97% 84 1.42% -65.71%
Unknown 734 11.88% 535 8.84% 501 8.26% 261 4.55% 31 0.52% -95.78%
Age 16 and under 13 0.21% 12 0.20% 15 0.25% 13 0.23% 16 0.27% 23.08%
17 229 3.71% 231 3.82% 211 3.48% 196 3.41% 194 3.28% -15.28%
18 3,286 53.18% 3,421 56.54% 3,643 60.07% 3,393 59.10% 3,740 63.28% 13.82%
19-21 1,386 22.43% 1,343 22.19% 1,418 23.38% 1,348 23.48% 1,322 22.37% -4.62%
22-24 408 6.60% 302 4.99% 294 4.85% 267 4.65% 245 4.15% -39.95%
25-30 364 5.89% 334 5.52% 234 3.86% 250 4.35% 199 3.37% -45.33%
31-35 173 2.80% 172 2.84% 102 1.68% 113 1.97% 72 1.22% -58.38%
36-50 268 4.34% 203 3.35% 122 2.01% 138 2.40% 101 1.71% -62.31%
51-64 51 0.83% 32 0.53% 26 0.43% 23 0.40% 18 0.30% -64.71%
65 and over 1 0.02% 1 0.02% 0 0.00% 0 0.00% 3 0.05% 200.00%
Unknown 0 0.00% 0 0.00% 0 0.00% 0 0.00% 0 0.00% .
Average Age 20.90 20.43 19.77 19.91 19.49
64
ACC 2016-2017 FACT BOOK
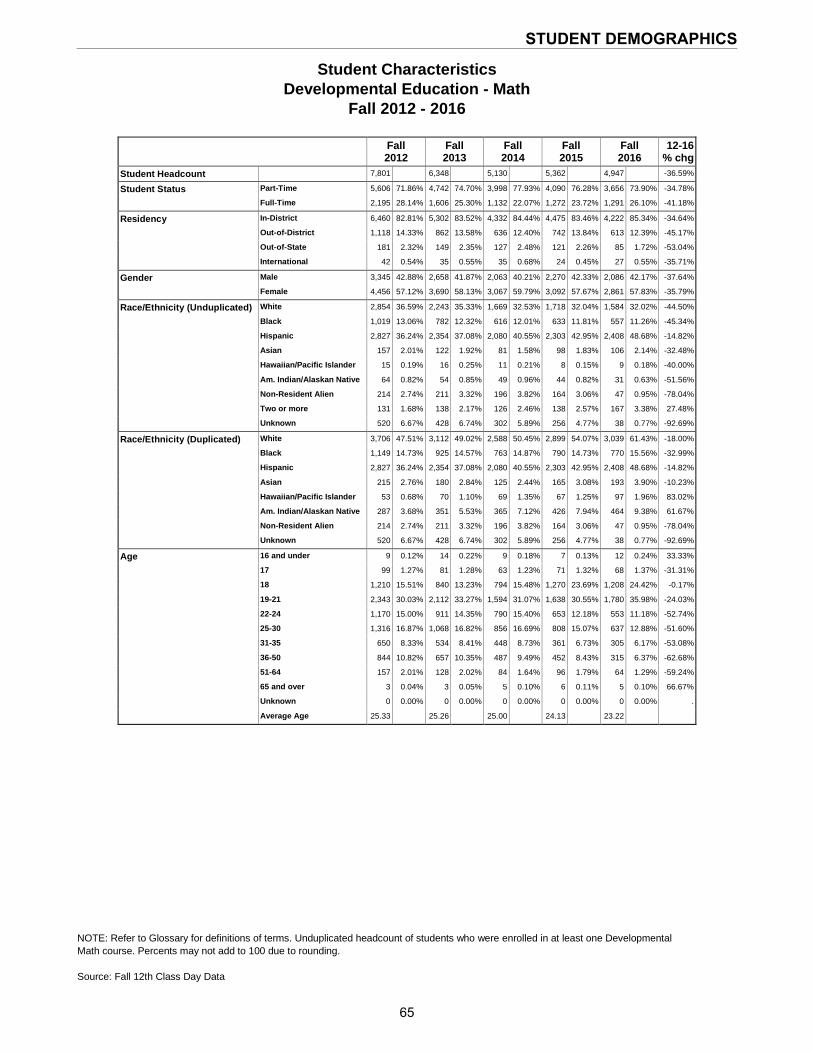
Student Characteristics Developmental Education - Math
Fall 2012 - 2016
NOTE: Refer to Glossary for definitions of terms. Unduplicated headcount of students who were enrolled in at least one Developmental Math course. Percents may not add to 100 due to rounding. Source: Fall 12th Class Day Data
Fall 2012
Fall 2013
Fall 2014
Fall 2015
Fall 2016
12-16 % chg
Student Headcount 7,801 6,348 5,130 5,362 4,947 -36.59%
Student Status Part-Time 5,606 71.86% 4,742 74.70% 3,998 77.93% 4,090 76.28% 3,656 73.90% -34.78%
Full-Time 2,195 28.14% 1,606 25.30% 1,132 22.07% 1,272 23.72% 1,291 26.10% -41.18%
Residency In-District 6,460 82.81% 5,302 83.52% 4,332 84.44% 4,475 83.46% 4,222 85.34% -34.64%
Out-of-District 1,118 14.33% 862 13.58% 636 12.40% 742 13.84% 613 12.39% -45.17%
Out-of-State 181 2.32% 149 2.35% 127 2.48% 121 2.26% 85 1.72% -53.04%
International 42 0.54% 35 0.55% 35 0.68% 24 0.45% 27 0.55% -35.71%
Gender Male 3,345 42.88% 2,658 41.87% 2,063 40.21% 2,270 42.33% 2,086 42.17% -37.64%
Female 4,456 57.12% 3,690 58.13% 3,067 59.79% 3,092 57.67% 2,861 57.83% -35.79%
Race/Ethnicity (Unduplicated) White 2,854 36.59% 2,243 35.33% 1,669 32.53% 1,718 32.04% 1,584 32.02% -44.50%
Black 1,019 13.06% 782 12.32% 616 12.01% 633 11.81% 557 11.26% -45.34%
Hispanic 2,827 36.24% 2,354 37.08% 2,080 40.55% 2,303 42.95% 2,408 48.68% -14.82%
Asian 157 2.01% 122 1.92% 81 1.58% 98 1.83% 106 2.14% -32.48%
Hawaiian/Pacific Islander 15 0.19% 16 0.25% 11 0.21% 8 0.15% 9 0.18% -40.00%
Am. Indian/Alaskan Native 64 0.82% 54 0.85% 49 0.96% 44 0.82% 31 0.63% -51.56%
Non-Resident Alien 214 2.74% 211 3.32% 196 3.82% 164 3.06% 47 0.95% -78.04%
Two or more 131 1.68% 138 2.17% 126 2.46% 138 2.57% 167 3.38% 27.48%
Unknown 520 6.67% 428 6.74% 302 5.89% 256 4.77% 38 0.77% -92.69%
Race/Ethnicity (Duplicated) White 3,706 47.51% 3,112 49.02% 2,588 50.45% 2,899 54.07% 3,039 61.43% -18.00%
Black 1,149 14.73% 925 14.57% 763 14.87% 790 14.73% 770 15.56% -32.99%
Hispanic 2,827 36.24% 2,354 37.08% 2,080 40.55% 2,303 42.95% 2,408 48.68% -14.82%
Asian 215 2.76% 180 2.84% 125 2.44% 165 3.08% 193 3.90% -10.23%
Hawaiian/Pacific Islander 53 0.68% 70 1.10% 69 1.35% 67 1.25% 97 1.96% 83.02%
Am. Indian/Alaskan Native 287 3.68% 351 5.53% 365 7.12% 426 7.94% 464 9.38% 61.67%
Non-Resident Alien 214 2.74% 211 3.32% 196 3.82% 164 3.06% 47 0.95% -78.04%
Unknown 520 6.67% 428 6.74% 302 5.89% 256 4.77% 38 0.77% -92.69%
Age 16 and under 9 0.12% 14 0.22% 9 0.18% 7 0.13% 12 0.24% 33.33%
17 99 1.27% 81 1.28% 63 1.23% 71 1.32% 68 1.37% -31.31%
18 1,210 15.51% 840 13.23% 794 15.48% 1,270 23.69% 1,208 24.42% -0.17%
19-21 2,343 30.03% 2,112 33.27% 1,594 31.07% 1,638 30.55% 1,780 35.98% -24.03%
22-24 1,170 15.00% 911 14.35% 790 15.40% 653 12.18% 553 11.18% -52.74%
25-30 1,316 16.87% 1,068 16.82% 856 16.69% 808 15.07% 637 12.88% -51.60%
31-35 650 8.33% 534 8.41% 448 8.73% 361 6.73% 305 6.17% -53.08%
36-50 844 10.82% 657 10.35% 487 9.49% 452 8.43% 315 6.37% -62.68%
51-64 157 2.01% 128 2.02% 84 1.64% 96 1.79% 64 1.29% -59.24%
65 and over 3 0.04% 3 0.05% 5 0.10% 6 0.11% 5 0.10% 66.67%
Unknown 0 0.00% 0 0.00% 0 0.00% 0 0.00% 0 0.00% .
Average Age 25.33 25.26 25.00 24.13 23.22
65
STUDENT DEMOGRAPHICS
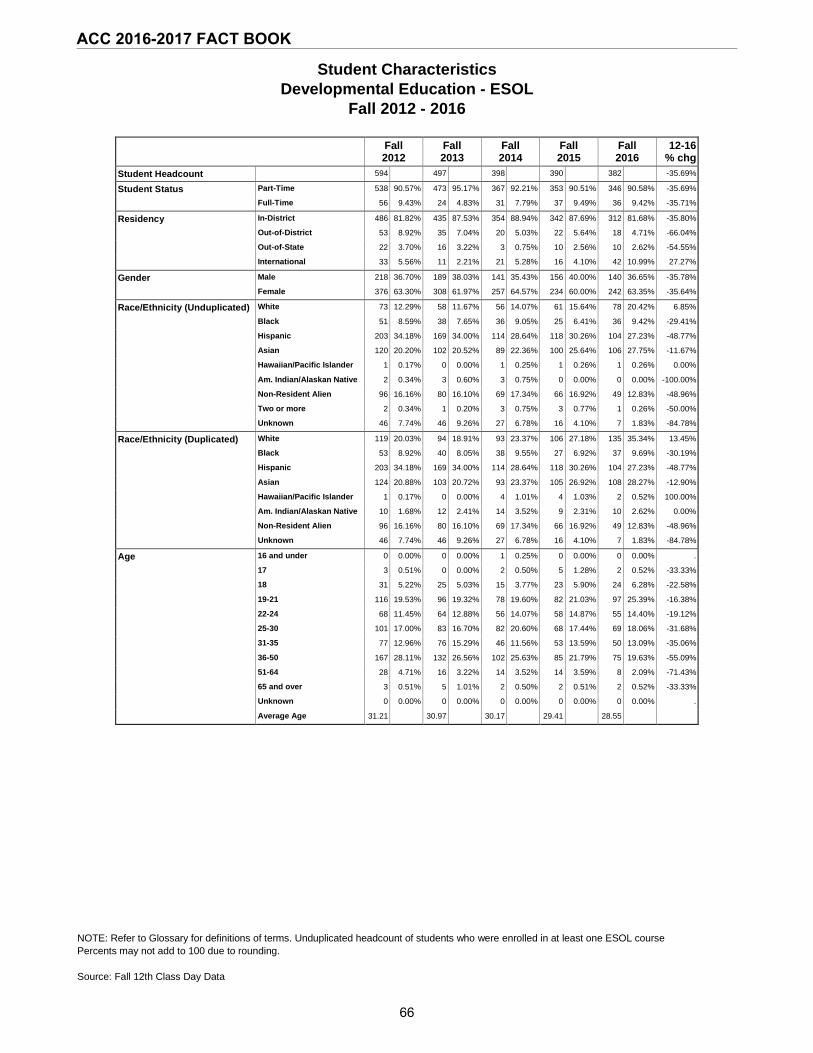
Student Characteristics Developmental Education - ESOL
Fall 2012 - 2016
NOTE: Refer to Glossary for definitions of terms. Unduplicated headcount of students who were enrolled in at least one ESOL course Percents may not add to 100 due to rounding. Source: Fall 12th Class Day Data
Fall 2012
Fall 2013
Fall 2014
Fall 2015
Fall 2016
12-16 % chg
Student Headcount 594 497 398 390 382 -35.69%
Student Status Part-Time 538 90.57% 473 95.17% 367 92.21% 353 90.51% 346 90.58% -35.69%
Full-Time 56 9.43% 24 4.83% 31 7.79% 37 9.49% 36 9.42% -35.71%
Residency In-District 486 81.82% 435 87.53% 354 88.94% 342 87.69% 312 81.68% -35.80%
Out-of-District 53 8.92% 35 7.04% 20 5.03% 22 5.64% 18 4.71% -66.04%
Out-of-State 22 3.70% 16 3.22% 3 0.75% 10 2.56% 10 2.62% -54.55%
International 33 5.56% 11 2.21% 21 5.28% 16 4.10% 42 10.99% 27.27%
Gender Male 218 36.70% 189 38.03% 141 35.43% 156 40.00% 140 36.65% -35.78%
Female 376 63.30% 308 61.97% 257 64.57% 234 60.00% 242 63.35% -35.64%
Race/Ethnicity (Unduplicated) White 73 12.29% 58 11.67% 56 14.07% 61 15.64% 78 20.42% 6.85%
Black 51 8.59% 38 7.65% 36 9.05% 25 6.41% 36 9.42% -29.41%
Hispanic 203 34.18% 169 34.00% 114 28.64% 118 30.26% 104 27.23% -48.77%
Asian 120 20.20% 102 20.52% 89 22.36% 100 25.64% 106 27.75% -11.67%
Hawaiian/Pacific Islander 1 0.17% 0 0.00% 1 0.25% 1 0.26% 1 0.26% 0.00%
Am. Indian/Alaskan Native 2 0.34% 3 0.60% 3 0.75% 0 0.00% 0 0.00% -100.00%
Non-Resident Alien 96 16.16% 80 16.10% 69 17.34% 66 16.92% 49 12.83% -48.96%
Two or more 2 0.34% 1 0.20% 3 0.75% 3 0.77% 1 0.26% -50.00%
Unknown 46 7.74% 46 9.26% 27 6.78% 16 4.10% 7 1.83% -84.78%
Race/Ethnicity (Duplicated) White 119 20.03% 94 18.91% 93 23.37% 106 27.18% 135 35.34% 13.45%
Black 53 8.92% 40 8.05% 38 9.55% 27 6.92% 37 9.69% -30.19%
Hispanic 203 34.18% 169 34.00% 114 28.64% 118 30.26% 104 27.23% -48.77%
Asian 124 20.88% 103 20.72% 93 23.37% 105 26.92% 108 28.27% -12.90%
Hawaiian/Pacific Islander 1 0.17% 0 0.00% 4 1.01% 4 1.03% 2 0.52% 100.00%
Am. Indian/Alaskan Native 10 1.68% 12 2.41% 14 3.52% 9 2.31% 10 2.62% 0.00%
Non-Resident Alien 96 16.16% 80 16.10% 69 17.34% 66 16.92% 49 12.83% -48.96%
Unknown 46 7.74% 46 9.26% 27 6.78% 16 4.10% 7 1.83% -84.78%
Age 16 and under 0 0.00% 0 0.00% 1 0.25% 0 0.00% 0 0.00% .
17 3 0.51% 0 0.00% 2 0.50% 5 1.28% 2 0.52% -33.33%
18 31 5.22% 25 5.03% 15 3.77% 23 5.90% 24 6.28% -22.58%
19-21 116 19.53% 96 19.32% 78 19.60% 82 21.03% 97 25.39% -16.38%
22-24 68 11.45% 64 12.88% 56 14.07% 58 14.87% 55 14.40% -19.12%
25-30 101 17.00% 83 16.70% 82 20.60% 68 17.44% 69 18.06% -31.68%
31-35 77 12.96% 76 15.29% 46 11.56% 53 13.59% 50 13.09% -35.06%
36-50 167 28.11% 132 26.56% 102 25.63% 85 21.79% 75 19.63% -55.09%
51-64 28 4.71% 16 3.22% 14 3.52% 14 3.59% 8 2.09% -71.43%
65 and over 3 0.51% 5 1.01% 2 0.50% 2 0.51% 2 0.52% -33.33%
Unknown 0 0.00% 0 0.00% 0 0.00% 0 0.00% 0 0.00% .
Average Age 31.21 30.97 30.17 29.41 28.55
66
ACC 2016-2017 FACT BOOK
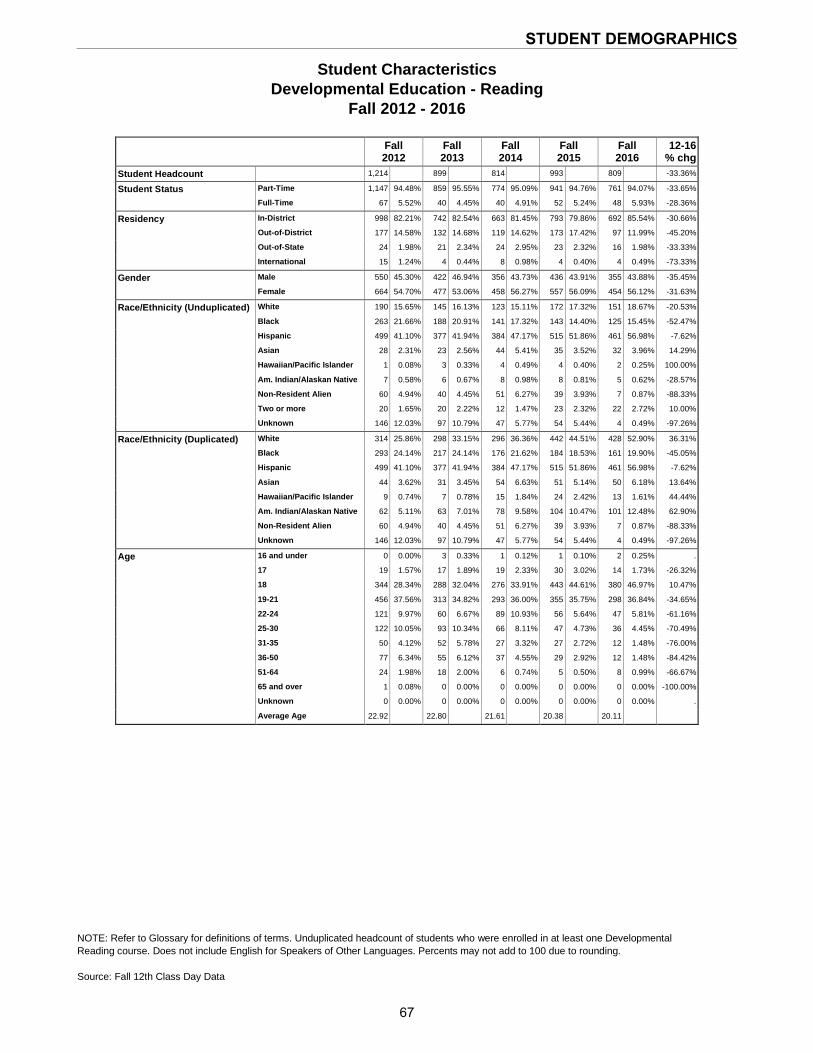
Student Characteristics Developmental Education - Reading
Fall 2012 - 2016
NOTE: Refer to Glossary for definitions of terms. Unduplicated headcount of students who were enrolled in at least one Developmental Reading course. Does not include English for Speakers of Other Languages. Percents may not add to 100 due to rounding. Source: Fall 12th Class Day Data
Fall 2012
Fall 2013
Fall 2014
Fall 2015
Fall 2016
12-16 % chg
Student Headcount 1,214 899 814 993 809 -33.36%
Student Status Part-Time 1,147 94.48% 859 95.55% 774 95.09% 941 94.76% 761 94.07% -33.65%
Full-Time 67 5.52% 40 4.45% 40 4.91% 52 5.24% 48 5.93% -28.36%
Residency In-District 998 82.21% 742 82.54% 663 81.45% 793 79.86% 692 85.54% -30.66%
Out-of-District 177 14.58% 132 14.68% 119 14.62% 173 17.42% 97 11.99% -45.20%
Out-of-State 24 1.98% 21 2.34% 24 2.95% 23 2.32% 16 1.98% -33.33%
International 15 1.24% 4 0.44% 8 0.98% 4 0.40% 4 0.49% -73.33%
Gender Male 550 45.30% 422 46.94% 356 43.73% 436 43.91% 355 43.88% -35.45%
Female 664 54.70% 477 53.06% 458 56.27% 557 56.09% 454 56.12% -31.63%
Race/Ethnicity (Unduplicated) White 190 15.65% 145 16.13% 123 15.11% 172 17.32% 151 18.67% -20.53%
Black 263 21.66% 188 20.91% 141 17.32% 143 14.40% 125 15.45% -52.47%
Hispanic 499 41.10% 377 41.94% 384 47.17% 515 51.86% 461 56.98% -7.62%
Asian 28 2.31% 23 2.56% 44 5.41% 35 3.52% 32 3.96% 14.29%
Hawaiian/Pacific Islander 1 0.08% 3 0.33% 4 0.49% 4 0.40% 2 0.25% 100.00%
Am. Indian/Alaskan Native 7 0.58% 6 0.67% 8 0.98% 8 0.81% 5 0.62% -28.57%
Non-Resident Alien 60 4.94% 40 4.45% 51 6.27% 39 3.93% 7 0.87% -88.33%
Two or more 20 1.65% 20 2.22% 12 1.47% 23 2.32% 22 2.72% 10.00%
Unknown 146 12.03% 97 10.79% 47 5.77% 54 5.44% 4 0.49% -97.26%
Race/Ethnicity (Duplicated) White 314 25.86% 298 33.15% 296 36.36% 442 44.51% 428 52.90% 36.31%
Black 293 24.14% 217 24.14% 176 21.62% 184 18.53% 161 19.90% -45.05%
Hispanic 499 41.10% 377 41.94% 384 47.17% 515 51.86% 461 56.98% -7.62%
Asian 44 3.62% 31 3.45% 54 6.63% 51 5.14% 50 6.18% 13.64%
Hawaiian/Pacific Islander 9 0.74% 7 0.78% 15 1.84% 24 2.42% 13 1.61% 44.44%
Am. Indian/Alaskan Native 62 5.11% 63 7.01% 78 9.58% 104 10.47% 101 12.48% 62.90%
Non-Resident Alien 60 4.94% 40 4.45% 51 6.27% 39 3.93% 7 0.87% -88.33%
Unknown 146 12.03% 97 10.79% 47 5.77% 54 5.44% 4 0.49% -97.26%
Age 16 and under 0 0.00% 3 0.33% 1 0.12% 1 0.10% 2 0.25% .
17 19 1.57% 17 1.89% 19 2.33% 30 3.02% 14 1.73% -26.32%
18 344 28.34% 288 32.04% 276 33.91% 443 44.61% 380 46.97% 10.47%
19-21 456 37.56% 313 34.82% 293 36.00% 355 35.75% 298 36.84% -34.65%
22-24 121 9.97% 60 6.67% 89 10.93% 56 5.64% 47 5.81% -61.16%
25-30 122 10.05% 93 10.34% 66 8.11% 47 4.73% 36 4.45% -70.49%
31-35 50 4.12% 52 5.78% 27 3.32% 27 2.72% 12 1.48% -76.00%
36-50 77 6.34% 55 6.12% 37 4.55% 29 2.92% 12 1.48% -84.42%
51-64 24 1.98% 18 2.00% 6 0.74% 5 0.50% 8 0.99% -66.67%
65 and over 1 0.08% 0 0.00% 0 0.00% 0 0.00% 0 0.00% -100.00%
Unknown 0 0.00% 0 0.00% 0 0.00% 0 0.00% 0 0.00% .
Average Age 22.92 22.80 21.61 20.38 20.11
67
STUDENT DEMOGRAPHICS
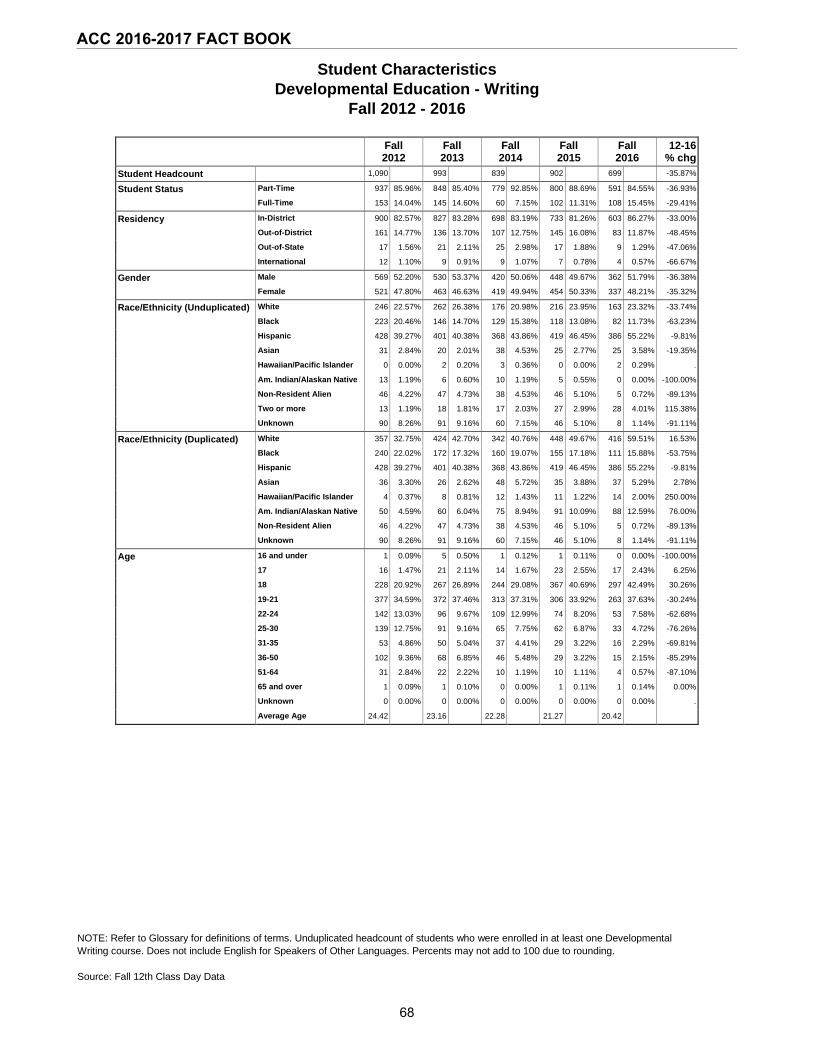
Student Characteristics Developmental Education - Writing
Fall 2012 - 2016
NOTE: Refer to Glossary for definitions of terms. Unduplicated headcount of students who were enrolled in at least one Developmental Writing course. Does not include English for Speakers of Other Languages. Percents may not add to 100 due to rounding.
Source: Fall 12th Class Day Data
Fall 2012
Fall 2013
Fall 2014
Fall 2015
Fall 2016
12-16 % chg
Student Headcount 1,090 993 839 902 699 -35.87%
Student Status Part-Time 937 85.96% 848 85.40% 779 92.85% 800 88.69% 591 84.55% -36.93%
Full-Time 153 14.04% 145 14.60% 60 7.15% 102 11.31% 108 15.45% -29.41%
Residency In-District 900 82.57% 827 83.28% 698 83.19% 733 81.26% 603 86.27% -33.00%
Out-of-District 161 14.77% 136 13.70% 107 12.75% 145 16.08% 83 11.87% -48.45%
Out-of-State 17 1.56% 21 2.11% 25 2.98% 17 1.88% 9 1.29% -47.06%
International 12 1.10% 9 0.91% 9 1.07% 7 0.78% 4 0.57% -66.67%
Gender Male 569 52.20% 530 53.37% 420 50.06% 448 49.67% 362 51.79% -36.38%
Female 521 47.80% 463 46.63% 419 49.94% 454 50.33% 337 48.21% -35.32%
Race/Ethnicity (Unduplicated) White 246 22.57% 262 26.38% 176 20.98% 216 23.95% 163 23.32% -33.74%
Black 223 20.46% 146 14.70% 129 15.38% 118 13.08% 82 11.73% -63.23%
Hispanic 428 39.27% 401 40.38% 368 43.86% 419 46.45% 386 55.22% -9.81%
Asian 31 2.84% 20 2.01% 38 4.53% 25 2.77% 25 3.58% -19.35%
Hawaiian/Pacific Islander 0 0.00% 2 0.20% 3 0.36% 0 0.00% 2 0.29% .
Am. Indian/Alaskan Native 13 1.19% 6 0.60% 10 1.19% 5 0.55% 0 0.00% -100.00%
Non-Resident Alien 46 4.22% 47 4.73% 38 4.53% 46 5.10% 5 0.72% -89.13%
Two or more 13 1.19% 18 1.81% 17 2.03% 27 2.99% 28 4.01% 115.38%
Unknown 90 8.26% 91 9.16% 60 7.15% 46 5.10% 8 1.14% -91.11%
Race/Ethnicity (Duplicated) White 357 32.75% 424 42.70% 342 40.76% 448 49.67% 416 59.51% 16.53%
Black 240 22.02% 172 17.32% 160 19.07% 155 17.18% 111 15.88% -53.75%
Hispanic 428 39.27% 401 40.38% 368 43.86% 419 46.45% 386 55.22% -9.81%
Asian 36 3.30% 26 2.62% 48 5.72% 35 3.88% 37 5.29% 2.78%
Hawaiian/Pacific Islander 4 0.37% 8 0.81% 12 1.43% 11 1.22% 14 2.00% 250.00%
Am. Indian/Alaskan Native 50 4.59% 60 6.04% 75 8.94% 91 10.09% 88 12.59% 76.00%
Non-Resident Alien 46 4.22% 47 4.73% 38 4.53% 46 5.10% 5 0.72% -89.13%
Unknown 90 8.26% 91 9.16% 60 7.15% 46 5.10% 8 1.14% -91.11%
Age 16 and under 1 0.09% 5 0.50% 1 0.12% 1 0.11% 0 0.00% -100.00%
17 16 1.47% 21 2.11% 14 1.67% 23 2.55% 17 2.43% 6.25%
18 228 20.92% 267 26.89% 244 29.08% 367 40.69% 297 42.49% 30.26%
19-21 377 34.59% 372 37.46% 313 37.31% 306 33.92% 263 37.63% -30.24%
22-24 142 13.03% 96 9.67% 109 12.99% 74 8.20% 53 7.58% -62.68%
25-30 139 12.75% 91 9.16% 65 7.75% 62 6.87% 33 4.72% -76.26%
31-35 53 4.86% 50 5.04% 37 4.41% 29 3.22% 16 2.29% -69.81%
36-50 102 9.36% 68 6.85% 46 5.48% 29 3.22% 15 2.15% -85.29%
51-64 31 2.84% 22 2.22% 10 1.19% 10 1.11% 4 0.57% -87.10%
65 and over 1 0.09% 1 0.10% 0 0.00% 1 0.11% 1 0.14% 0.00%
Unknown 0 0.00% 0 0.00% 0 0.00% 0 0.00% 0 0.00% .
Average Age 24.42 23.16 22.28 21.27 20.42
68
ACC 2016-2017 FACT BOOK
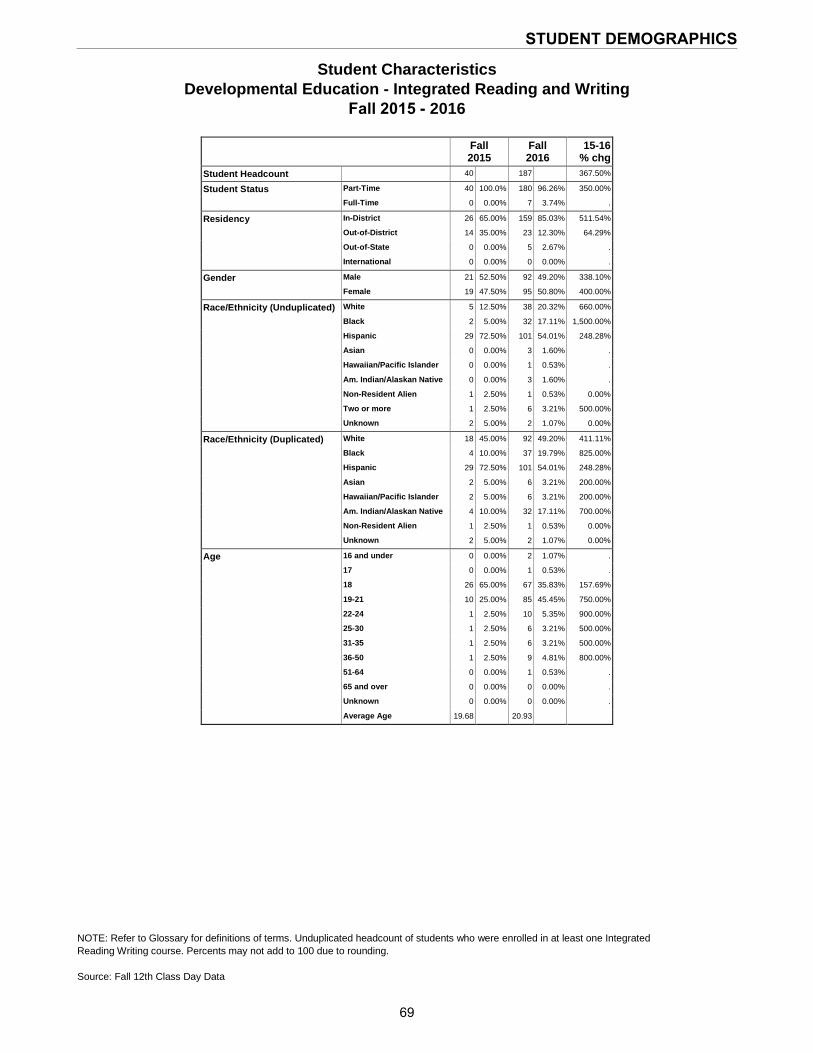
Student Characteristics Developmental Education - Integrated Reading and Writing
Fall 2015 - 2016
NOTE: Refer to Glossary for definitions of terms. Unduplicated headcount of students who were enrolled in at least one Integrated Reading Writing course. Percents may not add to 100 due to rounding.
Source: Fall 12th Class Day Data
Fall 2015
Fall 2016
15-16 % chg
Student Headcount 40 187 367.50%
Student Status Part-Time 40 100.0% 180 96.26% 350.00%
Full-Time 0 0.00% 7 3.74% .
Residency In-District 26 65.00% 159 85.03% 511.54%
Out-of-District 14 35.00% 23 12.30% 64.29%
Out-of-State 0 0.00% 5 2.67% .
International 0 0.00% 0 0.00% .
Gender Male 21 52.50% 92 49.20% 338.10%
Female 19 47.50% 95 50.80% 400.00%
Race/Ethnicity (Unduplicated) White 5 12.50% 38 20.32% 660.00%
Black 2 5.00% 32 17.11% 1,500.00%
Hispanic 29 72.50% 101 54.01% 248.28%
Asian 0 0.00% 3 1.60% .
Hawaiian/Pacific Islander 0 0.00% 1 0.53% .
Am. Indian/Alaskan Native 0 0.00% 3 1.60% .
Non-Resident Alien 1 2.50% 1 0.53% 0.00%
Two or more 1 2.50% 6 3.21% 500.00%
Unknown 2 5.00% 2 1.07% 0.00%
Race/Ethnicity (Duplicated) White 18 45.00% 92 49.20% 411.11%
Black 4 10.00% 37 19.79% 825.00%
Hispanic 29 72.50% 101 54.01% 248.28%
Asian 2 5.00% 6 3.21% 200.00%
Hawaiian/Pacific Islander 2 5.00% 6 3.21% 200.00%
Am. Indian/Alaskan Native 4 10.00% 32 17.11% 700.00%
Non-Resident Alien 1 2.50% 1 0.53% 0.00%
Unknown 2 5.00% 2 1.07% 0.00%
Age 16 and under 0 0.00% 2 1.07% .
17 0 0.00% 1 0.53% .
18 26 65.00% 67 35.83% 157.69%
19-21 10 25.00% 85 45.45% 750.00%
22-24 1 2.50% 10 5.35% 900.00%
25-30 1 2.50% 6 3.21% 500.00%
31-35 1 2.50% 6 3.21% 500.00%
36-50 1 2.50% 9 4.81% 800.00%
51-64 0 0.00% 1 0.53% .
65 and over 0 0.00% 0 0.00% .
Unknown 0 0.00% 0 0.00% .
Average Age 19.68 20.93
69
STUDENT DEMOGRAPHICS
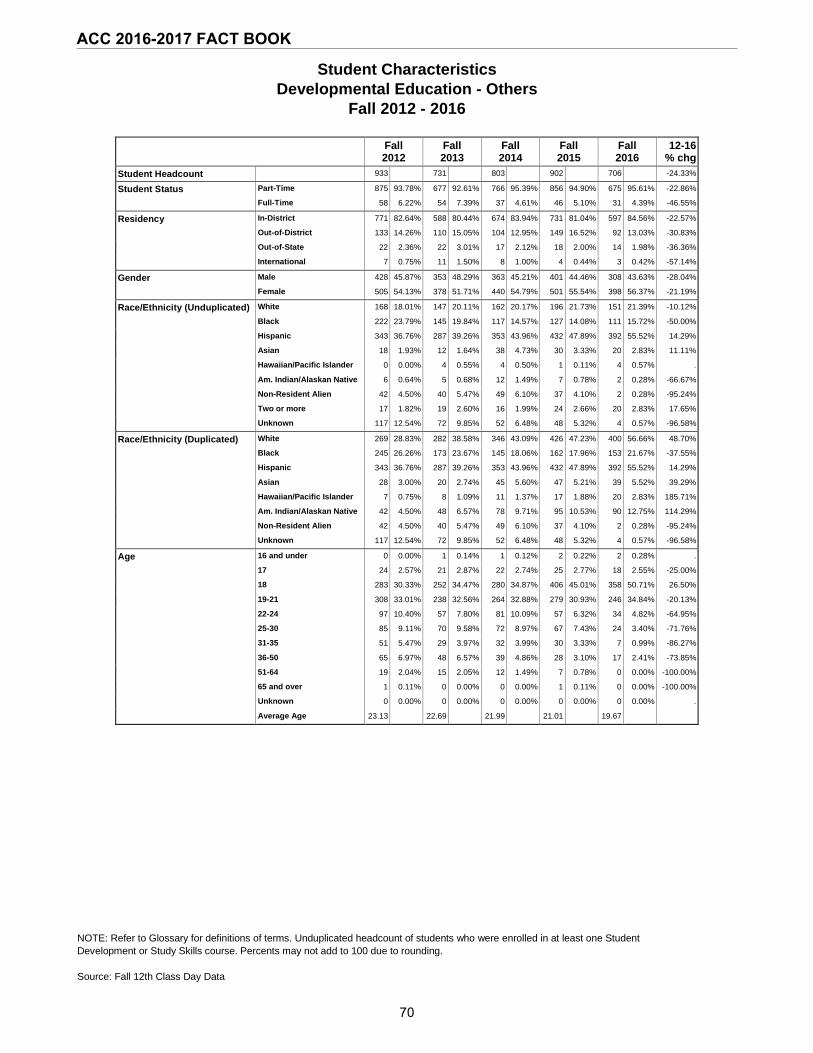
Student Characteristics Developmental Education - Others
Fall 2012 - 2016
NOTE: Refer to Glossary for definitions of terms. Unduplicated headcount of students who were enrolled in at least one Student Development or Study Skills course. Percents may not add to 100 due to rounding. Source: Fall 12th Class Day Data
Fall 2012
Fall 2013
Fall 2014
Fall 2015
Fall 2016
12-16 % chg
Student Headcount 933 731 803 902 706 -24.33%
Student Status Part-Time 875 93.78% 677 92.61% 766 95.39% 856 94.90% 675 95.61% -22.86%
Full-Time 58 6.22% 54 7.39% 37 4.61% 46 5.10% 31 4.39% -46.55%
Residency In-District 771 82.64% 588 80.44% 674 83.94% 731 81.04% 597 84.56% -22.57%
Out-of-District 133 14.26% 110 15.05% 104 12.95% 149 16.52% 92 13.03% -30.83%
Out-of-State 22 2.36% 22 3.01% 17 2.12% 18 2.00% 14 1.98% -36.36%
International 7 0.75% 11 1.50% 8 1.00% 4 0.44% 3 0.42% -57.14%
Gender Male 428 45.87% 353 48.29% 363 45.21% 401 44.46% 308 43.63% -28.04%
Female 505 54.13% 378 51.71% 440 54.79% 501 55.54% 398 56.37% -21.19%
Race/Ethnicity (Unduplicated) White 168 18.01% 147 20.11% 162 20.17% 196 21.73% 151 21.39% -10.12%
Black 222 23.79% 145 19.84% 117 14.57% 127 14.08% 111 15.72% -50.00%
Hispanic 343 36.76% 287 39.26% 353 43.96% 432 47.89% 392 55.52% 14.29%
Asian 18 1.93% 12 1.64% 38 4.73% 30 3.33% 20 2.83% 11.11%
Hawaiian/Pacific Islander 0 0.00% 4 0.55% 4 0.50% 1 0.11% 4 0.57% .
Am. Indian/Alaskan Native 6 0.64% 5 0.68% 12 1.49% 7 0.78% 2 0.28% -66.67%
Non-Resident Alien 42 4.50% 40 5.47% 49 6.10% 37 4.10% 2 0.28% -95.24%
Two or more 17 1.82% 19 2.60% 16 1.99% 24 2.66% 20 2.83% 17.65%
Unknown 117 12.54% 72 9.85% 52 6.48% 48 5.32% 4 0.57% -96.58%
Race/Ethnicity (Duplicated) White 269 28.83% 282 38.58% 346 43.09% 426 47.23% 400 56.66% 48.70%
Black 245 26.26% 173 23.67% 145 18.06% 162 17.96% 153 21.67% -37.55%
Hispanic 343 36.76% 287 39.26% 353 43.96% 432 47.89% 392 55.52% 14.29%
Asian 28 3.00% 20 2.74% 45 5.60% 47 5.21% 39 5.52% 39.29%
Hawaiian/Pacific Islander 7 0.75% 8 1.09% 11 1.37% 17 1.88% 20 2.83% 185.71%
Am. Indian/Alaskan Native 42 4.50% 48 6.57% 78 9.71% 95 10.53% 90 12.75% 114.29%
Non-Resident Alien 42 4.50% 40 5.47% 49 6.10% 37 4.10% 2 0.28% -95.24%
Unknown 117 12.54% 72 9.85% 52 6.48% 48 5.32% 4 0.57% -96.58%
Age 16 and under 0 0.00% 1 0.14% 1 0.12% 2 0.22% 2 0.28% .
17 24 2.57% 21 2.87% 22 2.74% 25 2.77% 18 2.55% -25.00%
18 283 30.33% 252 34.47% 280 34.87% 406 45.01% 358 50.71% 26.50%
19-21 308 33.01% 238 32.56% 264 32.88% 279 30.93% 246 34.84% -20.13%
22-24 97 10.40% 57 7.80% 81 10.09% 57 6.32% 34 4.82% -64.95%
25-30 85 9.11% 70 9.58% 72 8.97% 67 7.43% 24 3.40% -71.76%
31-35 51 5.47% 29 3.97% 32 3.99% 30 3.33% 7 0.99% -86.27%
36-50 65 6.97% 48 6.57% 39 4.86% 28 3.10% 17 2.41% -73.85%
51-64 19 2.04% 15 2.05% 12 1.49% 7 0.78% 0 0.00% -100.00%
65 and over 1 0.11% 0 0.00% 0 0.00% 1 0.11% 0 0.00% -100.00%
Unknown 0 0.00% 0 0.00% 0 0.00% 0 0.00% 0 0.00% .
Average Age 23.13 22.69 21.99 21.01 19.67
70
ACC 2016-2017 FACT BOOK