student assignment redesign community input february 2, 2010
DESCRIPTION
Student Assignment Redesign Community Input February 2, 2010. Community Engagement about the Options. - PowerPoint PPT PresentationTRANSCRIPT

1
Student Assignment Redesign
Community InputFebruary 2, 2010

2
Community Engagement about the Options• SFUSD staff worked with Parents for Public Schools and the
Parent Advisory Council to plan and implement multiple opportunities for diverse stakeholders to give input about the options, including: - An online survey- Small Community Conversations with parents - Town Hall meetings in 5 different areas of the city open to the public - Meetings with community based organizations, SFUSD teachers,
administrators and high school students and other groups as requested
• Every meeting and the survey shared the same information and asked participants to respond to the same set of questions.

3
SFUSD Facilitated MeetingsCOMMUNITY GROUPS• DCYFS Staff• SFUSD Enrollment Fair• Families and Youth in
Transition• Jamestown• Mission Ed Project• Mission Head Start• NAACP General Meeting• Parent Advisory Council• Rooftop PTA• City & SFUSD Select
Committee
SFUSD STAFF• UASF Executive Team• UESF Leadership• All Staff (x 2 meetings)• Special Education, Multilingual,
etc. SFUSD STUDENTS• Peer Resources (x 3 meetings)• Student Delegates• Student Advisory Council • Youth Commission• Youth Summit

4
SFUSD Facilitated Town Hall Meetings & Online Survey
• Drew Elementary • Feinstein Elementary• Francisco Middle• Mission High School• Washington High School
Online Survey– 1,219 English, 15 Cantonese, 6 Spanish

5
SFUSD Meetings: Demographic Data• Approximately 680 meeting participants.• About 1/3 filled out the demographic survey.
0% 10% 20% 30% 40% 50% 60% 70%
SFUSD Parent
SFUSD Student
SFUSD Educator
Parent K-12 not in SFUSD
Youth Organization Worker
SF Business Member
Community Member - Not Parent
Parent 0-5
Other

6
SFUSD Meetings: Grades of School Age Children
0% 10% 20% 30% 40% 50%
Pre-K
K to 5th grade
6th to 8th Grade
9th to 12th Grade

7
SFUSD Meetings: Zip Code of Home Address
0% 2% 4% 6% 8% 10% 12% 14% 16% 18%
94102: Hayes Valley, Tenderloin
94103: South of Market (SoMa)
94104: Financial District
94105: Embarcadero (south) & SoMa
94107: Potrero Hill
94108: Chinatow n
94109: Nob Hill, Russian Hill
94110: Mission, Bernal Heights
94111: Embarcadero, Barbary Coast
94112: Ingelside-Excelsior
94114: Castro, Noe Valley
94115: Pacif ic Heights, Western Addition, Japantow n
94116: Outer Sunset
94117: Haight Ashbury & Cole Valley
94118: Inner Richmond
94121: Outer Richmond
94122: Inner Sunset
94123: Marina, Cow Hollow
94124: Bayview
94127: St. Francis Wood, West Portal
94129: Presidio
94130: Treasure Island
94131: Tw in Peaks, Glen Park
94132: Lake Merced
94133: North Beach, Fisherman's Wharf
94134: Visitacion Valley

8
SFUSD Meetings: Race / Ethnicity
0% 5% 10% 15% 20% 25% 30% 35%
African American
American Indian/Alaska Native
Chinese
Hispanic/Latino
Pacif ic Islander
Other Asian
White (not Hispanic)
Multi-Racial
Other
9
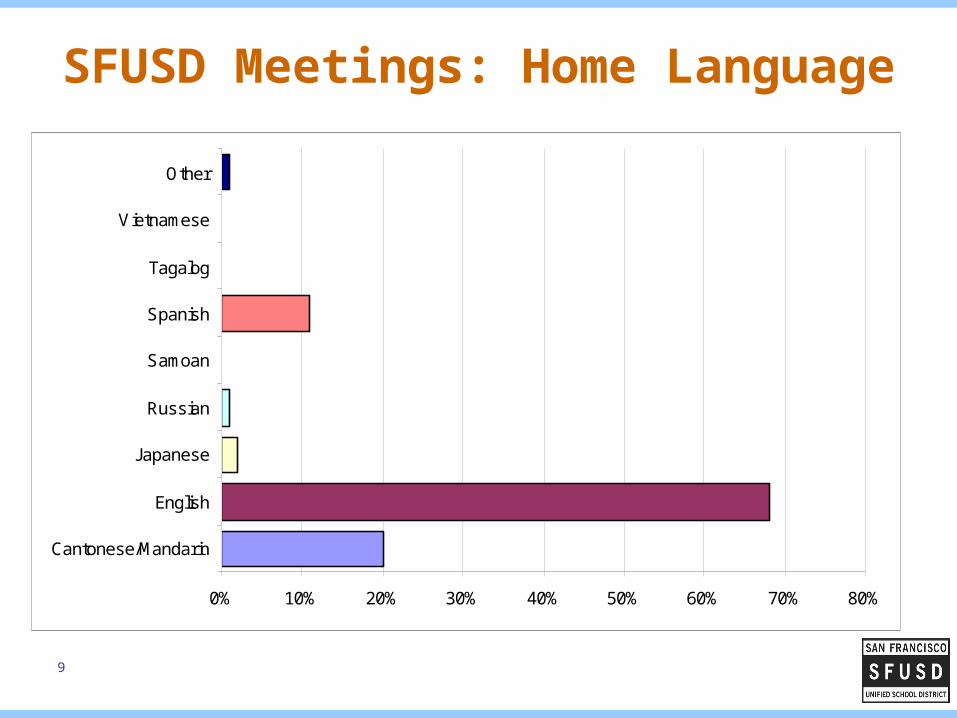
SFUSD Meetings: Home Language
0% 10% 20% 30% 40% 50% 60% 70% 80%
Cantonese/Mandarin
English
Japanese
Russian
Samoan
Spanish
Tagalog
Vietnamese
Other

10
SFUSD Meetings: Family Income Level
0% 5% 10% 15% 20% 25%
Less than $40,000
$40,000 to $80,000
$80,000 to $120,000
$120,000 to $160,000
More than $160,000

11
Online Survey: Connection to SFUSD
0% 10% 20% 30% 40% 50%
SFUSD Parent
SFUSD Student
SFUSD Educator
Parent K-12 not in SFUSD
Youth Organization Worker
SF Business Member
Community Member - Not Parent
Parent 0-5
Other

12
Online Survey: Grade/s of Children
0% 10% 20% 30% 40% 50% 60% 70%
PreK
K to 5th Grade
6th to 8th Grade
9th to 12th Grade

13
Online Survey: Zip of Home Address
Zip Code of Home Address
941029410394105
94107
94108
94109
94110
94111
94112
94114
94115
94116
9411794118
94121
94122
9412394124
94127
9412994130
94131
9413294133
94134
94158
Outside SF
0%
2%
4%
6%
8%
10%
12%
14%
9410
2
9410
5
9410
8
9411
0
9411
2
9411
5
9411
7
9412
1
9412
3
9412
7
9413
0
9413
2
9413
4
Out
side
SF
% o
f A
ll R
es
po
ns
es

14
Online Survey: Race/Ethnicity
0% 10% 20% 30% 40% 50% 60% 70%
African American
American Indian
Chinese
Latino
Pacific Islander
Other Asian
White
Multi-Racial/Ethnic
Other

15
Online Survey: Home Language
0% 20% 40% 60% 80% 100%
Cantonese/Mandarin
English
Japanese
Russian
Samoan
Spanish
Tagalog
Vietnamese
Other

16
Online Survey: Family Income Level
0% 5% 10% 15% 20% 25% 30% 35%
Less than $40,000
$40,000 to $80,000
$80,000 to $120,000
$120,000 to $160,000
More than $160,000

17
Findings from Meetings & Survey
Staff has provided notes from the meetings and the survey responses to the Board and will be posting these online.
In order to best capture the views expressed, we encourage the Board to review the notes from district facilitated meetings along with the report of findings from the PAC and PPS facilitated conversations.

18
Preferences: SFUSD Meetings & Online Survey
Participants supported Local Schools more than any of the other options, especially for elementary schools.
“If there were quality schools in all neighborhoods people would want to go to their neighborhood schools. Put more resources where there is greater need.”
- Enrollment Fair parent participant
“Local schools empower stronger communities (ties among neighbors).” - Drew Elementary Town Hall participant
- “I am more comfortable with a local school option; I feel like my child will be safer.”
- Dianne Feinstein Elementary Town Hall participant

19
Preferences: SFUSD Meetings and Online Survey
• Several participants shared concerns with a Local School option and preferred a Lottery/Choice system.
“Local schools enhance disparity between neighborhoods.” – Drew ES Town Hall participant
“Because of income levels there would not be access to those schools. Parents would not be able to live there because of low income.”
- Jamestown Community Center participant
“Being prepared for college is worth going across town to a better school.”- Balboa High School student
• Most participants did not like the Zone Option.
20
Student Assignment Redesign
Staff RecommendationsFebruary 2, 2010
21
Outline
• Quick Review
– Why Redesign Student Assignment
– Redesign Process
• Complex Challenges
• Staff Recommendations
• Next Steps

22
Why Redesign Student Assignment?

23
Strategic Plan for Quality Schools
The Board of Education sees the achievement gap as the greatest civil rights issues facing the District today and it is committed to transformation through the implementation of its equity-centered strategic plan – Beyond the Talk: Taking Action to Educate Every Child Now
24
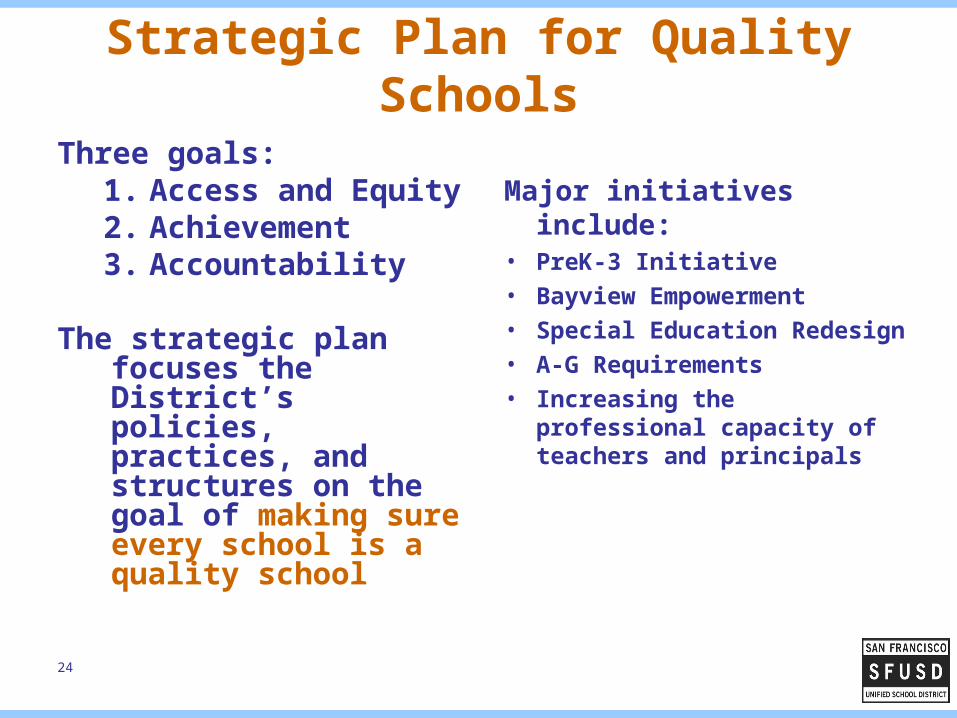
Strategic Plan for Quality Schools
Three goals:1. Access and Equity2. Achievement3. Accountability
The strategic plan focuses the District’s policies, practices, and structures on the goal of making sure every school is a quality school
Major initiatives include:• PreK-3 Initiative• Bayview Empowerment • Special Education Redesign• A-G Requirements• Increasing the professional
capacity of teachers and principals

25
Concerns about the Current System
• Current student assignment plan is not meeting the SFUSD’s longtime goals of reducing racial isolation and improving educational opportunities and outcomes for all students.– Racially Isolated Schools - Quarter of our schools have
more than 60% of a single racial/ethnic group, even though the District is racially/ethnically diverse and does not have a majority group.
– Achievement Gap - Although the SFUSD’s standardized test scores have steadily increased over the past few years, the achievement gap has persisted for African American, Latino, and Samoan students.

26
Concerns about the Current System
Achievement Gap• There are sharp differences in achievement outcomes and
teacher assignment practices in schools that are 80% to 100% African American, Latino, and Samoan, and there is some differential at the 60% rate.
• Average years of teacher service goes down• Teacher turnover goes up• Student attendance rates decline• Suspension rates increase
(March 9, 2009 and December 14, 2010 Ad Hoc Committee meetings)

27
Concerns about the Current System
• Participation in choice process varies by racial/ethnic group.
• Boundaries for attendance areas have not been revised since the early 1980s.
• Some schools are under-enrolled while others are over-enrolled.
• Many families report finding the current system time consuming, unpredictable, and difficult to understand.

28
Board’s Priorities for Student Assignment
• Reverse the trend of racial isolation and the concentration of underserved students in the same school.
• Provide equitable access to the range of opportunities offered to students.
• Provide transparency at every stage in the assignment process.
29
Quick Review of Redesign Process

30
ResourcesDonated Time and Expertise•School Redesign Network at Stanford•Researchers from Stanford, Duke, Harvard, and MIT•Parent Advisory Council •Parents for Public Schools
Council of Great City Schools and NAACP Legal Defense & Education Fund sponsored qualitative study at 24 randomly selected schools
The Hellman Family Foundation, the Zellerbach Family Foundation, and a grant from the US Department of Education•Demographers•Community Engagement•Project Management

31
Redesign Process and Timeline
1. Analyze current conditions2. Develop priorities
December 2008 to June 2009
3. Design and analyze different options July 2009 to January 2010
4. Develop and approve new policy January 2010 to March 2010
5. Build the infrastructure March 2010 to October 2010
6. Implement and monitor the new policy November 2010 to September 2011
See Addendum for key findingsSee Addendum for key findings

32
Complex Challenges

33
Challenge: Choice Assignments
• Choice assignments do not result in integrated schools because the applicant pools are racially isolated.– To achieve diversity through choice, applicant pools
have to be diverse.
• However, choice does allow students to move out of racially isolated neighborhoods.
• So choice has the potential to make schools more diverse IF parents of different racial/ethnic, socio-economic, and linguistic backgrounds apply to the same schools.

34
Challenge: Choice Assignments
• A student assignment system that uses choice as a tactic to achieve diversity and equitable access can only be successful if the following are true:– families from all racial/ethnic groups have the same
opportunity to understand which schools they like and to submit their choices on-time for the assignment process; and
– the applicant pools for schools are diverse.
• SFUSD and urban school districts throughout the country experience similar challenges creating these conditions.– Require significant parent effort.– Require Districts and Communities to invest money.– Create inequity for families in transition (mobility).

35
Challenge: Neighborhood Assignments
• Neighborhood assignments do not result in integrated schools because the housing patterns in San Francisco are racially isolated.
• However, some schools would be more diverse and more robustly enrolled if all the students in the neighborhood attended the schools.

36
Challenge: Neighborhood Assignments
• The non-uniform distribution of programs throughout the city makes it difficult to have a strict neighborhood assignment system.
• A strict neighborhood system is not possible in the southeast with the current configuration of schools because there are more residents than school capacity.
37
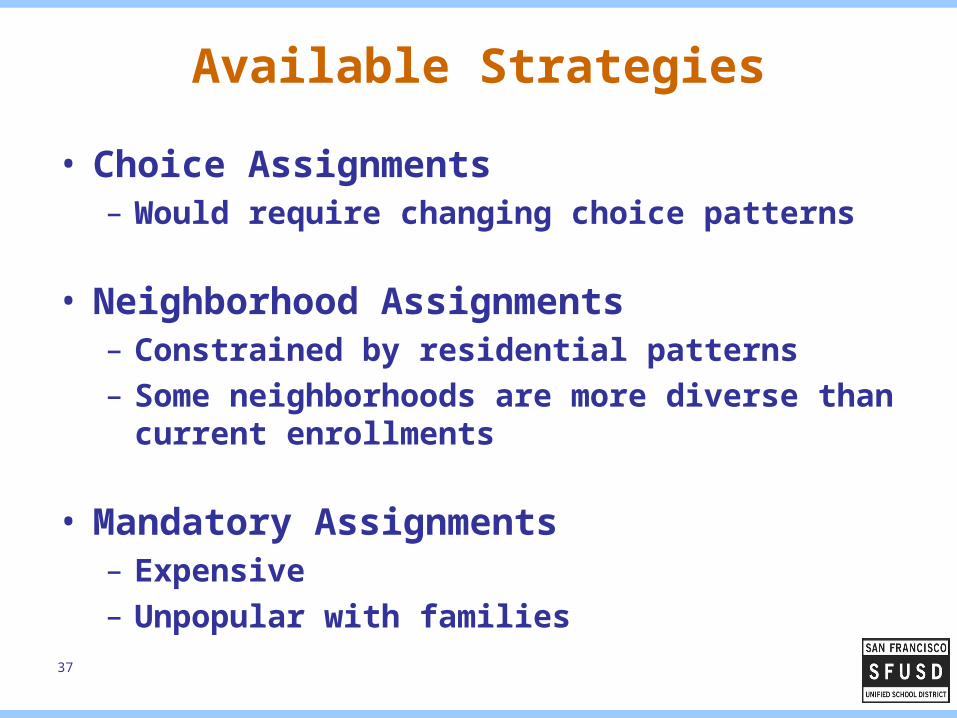
Available Strategies
• Choice Assignments– Would require changing choice patterns
• Neighborhood Assignments– Constrained by residential patterns– Some neighborhoods are more diverse than current
enrollments
• Mandatory Assignments– Expensive– Unpopular with families

38
Staff Recommendations

39
Recommended Approach
1. Design a student assignment system that is simple and flexible so it can be easily adjusted if it is not accomplishing the Board’s priorities.
2. Encourages families to enroll in schools where they will add to the diversity of the school (i.e., change demand patterns).
3. Establish an annual monitoring mechanism to determine if schools are becoming less racially concentrated, and revise annually as necessary.

40
Staff Evaluation
• Meet the Board’s Priorities?
• Flexible enough to respond if:
– it is not meeting its intended objectives
– programs and services change?
• Easy to understand?
• Increase predictability for families?
• Cost effective?

41
Elementary and Middle School

42
Six Options
Staff reduced the options from six to two.1. Lottery with local school preference.2. Lottery with academic diversity preference.
3. Lottery with academic diversity preference and local preference – MODIFIED into Option A.
4. Zone designated assignment.5. Local schools with choice for city-wide programs.
6. Local schools with choice for all schools – MODIFIED into Option B.
Staff modified the two remaining options into Options A and B.
43
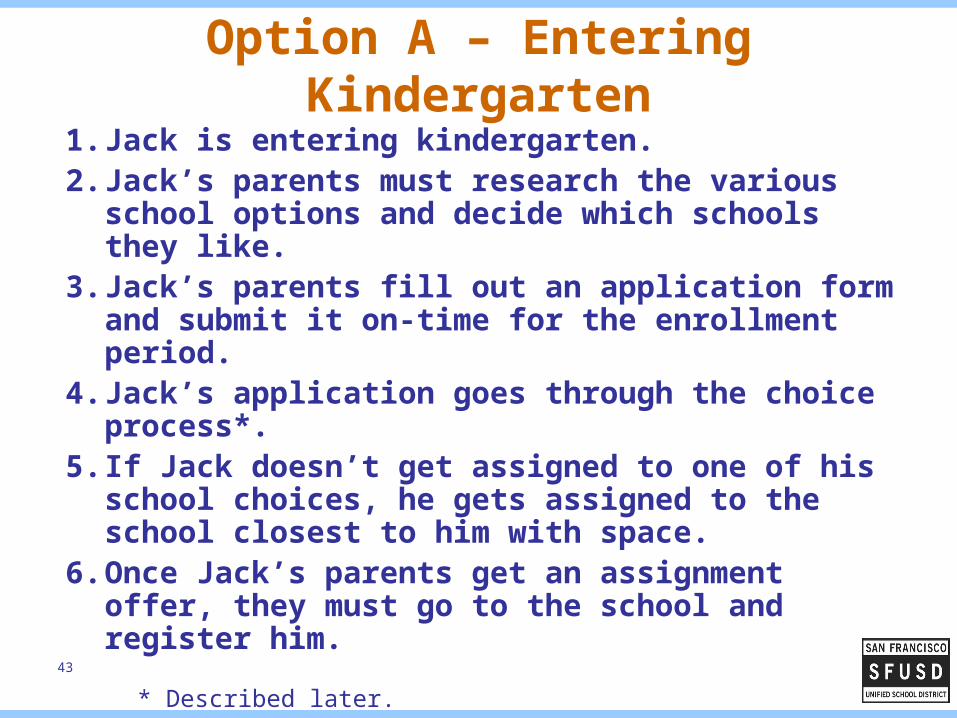
Option A – Entering Kindergarten
1. Jack is entering kindergarten. 2. Jack’s parents must research the various school
options and decide which schools they like.3. Jack’s parents fill out an application form and
submit it on-time for the enrollment period.4. Jack’s application goes through the choice
process*.5. If Jack doesn’t get assigned to one of his school
choices, he gets assigned to the school closest to him with space.
6. Once Jack’s parents get an assignment offer, they must go to the school and register him.
* Described later.

44
Option A – Entering 6th Grade
Same process described for Kindergarten.

45
Option B – Entering Kindergarten
1. Sally is entering kindergarten. 2. Sally fills out an application form, learns what her
attendance area school is, and gets an initial offer to her attendance area school.
3. Sally’s parents can decide they want to research the various school options and participate in a choice process*.
4. If Sally doesn’t get assigned to one of her school choices, she gets assigned to her attendance area school.
* Described later.
46
Option B – Entering 6th Grade
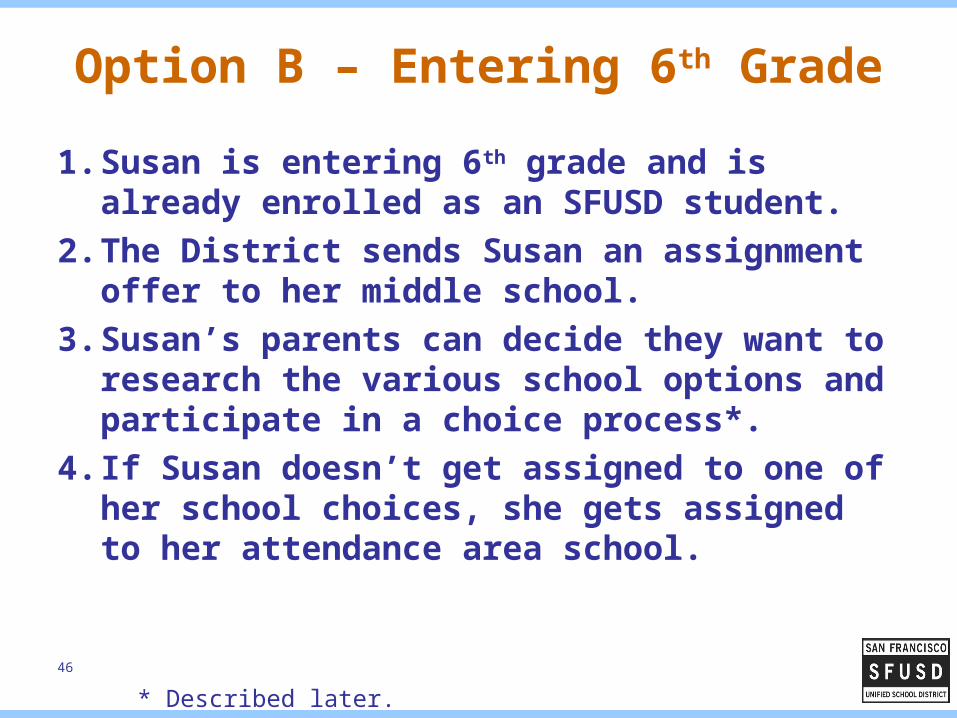
1. Susan is entering 6th grade and is already enrolled as an SFUSD student.
2. The District sends Susan an assignment offer to her middle school.
3. Susan’s parents can decide they want to research the various school options and participate in a choice process*.
4. If Susan doesn’t get assigned to one of her school choices, she gets assigned to her attendance area school.
* Described later.

47
Choice Process

48
How Does the Choice Process Work?Two levers working together have the potential to
create integrated learning environments while also using choice and a neighborhood preference.
1.1. Census Tract Integration Preference (CTIP)Census Tract Integration Preference (CTIP)A preference for integrating schools by enabling students living in demographically different areas of the city to attend the same school together.
2.2. Local Preference (LP)Local Preference (LP)A preference for students who live near a school.

49
Census Tract Integration Preference (CTIP)
• The achievement values for each Census Tract will be determined by computing the average of all available test score data for K-12 students living in the Census Tract.
• CTIP 1 will contain the Census Tracts with the bottom 40% of the range of average achievement values
• CTIP 2 will contain the Census Tracts with the top 60% of the range of average achievement values

50
Geographic Area: Census Tracts
• Census Tracts were chosen rather than another geographical unit because:– they are large enough to have substantial numbers of
students living in them, minimizing the effects of random variation; yet
– they are small enough to permit a range of values to occur across geographical units.

51
Demographic Measure: Academic Achievement
Academic achievement was chosen because: – Prior academic achievement is a predictor of future
student achievement– It does not require information about individual
students• Incoming kindergartners• Students from other Districts
– It is not self reported and can be verified

52
Census Tract Integration Preference (CTIP)
Concept –
A preference for integrating schools by enabling students living in demographically different areas of the city to attend the same school together.
Focus on the concept tonight. On 2/17/10, we can elaborate on more detailed mechanics.

53
Sample Census Tract Integration Preference Map
376
371
397
317
304
318
378
349
346
395
360
357
348
358
383393
371
388
376
400
377
391
346
368
387
370
357
380
381
375
398
371
355
389
373
374
351
395
309
378
361
309
373
315
387379
386
375
352
378
395
344
354
348
344
344
352
325
347
337
382
363
349
370
337
387
394
358
366
322
344
383
364
338
378
377
392
360
377
309
321
371
351
313
334
332
329
333
336
374
399
369
353
328
342
350
342
364
343
358
370
338
345
320
379
368
411
355
376
370
327
369
333
345
412
342
369
341
389
339
355 323
337
330
375
336
326
375
315
310
313
372
327
358
360
365
367
312318
335
354
325
322333
338
354
328
350
344340
359334
346
QuintileBottom 2Highest 3
CST Quintilefor Census Tracts or combinedCensus Tracts (if populations are small)Labels show average CST score of K-12 Students, Fall 2008
Lapkoff & Gobalet Demographic Research, Inc. 2/1/2010www.Demographers.com
Green = CTIP 1Purple = CTIP 2
CTIP gives preference to students who live in demographically different areas of the city to attend schools together.
Students living in CTIP 1 get preference in the choice process to attend schools located in CTIP 2
and
Students living in CTIP 2 get priority to attend schools located in CTIP 1

54
Two Preferences Work Together
• Census Tract Integration Preference (CTIP):– A preference for integrating schools by enabling
students living in demographically different areas of the city to attend the same school together.
• Local Preference (LP):– A preference for students who live in the
attendance area of a school.

55
It is simple:• Home address and school choices are the only
individual student characteristics needed for the proposed assignment system.
It is flexible:• It can be easily adjusted if it is not working – you
would just have to change the weight given to the different preferences.
Two Preferences Work Together

56
The District can adjust them in two primary ways.
1. The seats in a school could be divided into CTIP 1 seats and CTIP 2 seats.
– For example you could allocate 50% of the seats for CTP 1 and 50% of the seats for CTIP 2.
– If that didn’t help create diversity, you could adjust the percent of seats available for CTIP 1 or CTIP 2.
How are the Preferences Flexible?

57
2. The District can decide which priority (CTIP or LP) is ranked higher.
In Option A– The CTIP preference is ranked higher than the LP.
In Option B– The LP is ranked higher than the CTIP preference.
How are the Preferences Flexible?

58
Every student gets the preferences based on where she lives and the schools she chooses.
If Sally lives in the attendance area for Happy School, she has a local preference for Happy School.
If Sally’s home is in a census tract with a value of CTIP 1, Sally get’s preference in the choice process for any school in a census tract with a value of CTIP 2.
Two Preferences Work Together

59
Comparing the Two Options
Option A Option BNo initial assignment Initial assignment to Attendance Area
school (regardless of choice)
Younger Siblings Younger Siblings
Students who live attendance area & attend PreK in attendance area school
Students who live attendance area & attend PreK in attendance area school
Census Tract Integration Preference Local Preference
Local Preference Census Tract Integration Preference
All other students All other students
Different programs have different number of available seats (capacities). Same guidelines can apply to any set of program capacities.

60
Recommendation: Special Education
• As much as possible, given the unique needs of students as outlined in their Individual Education Plan (IEP), the student assignment process used to assign general education students will be used to assign Special Education students.
• SDC and Inclusion programs have separate seats. Openings can only be filled by students with an IEP that indicates they need the services.

61
Recommendation: English Language Learners
• Conduct English language and primary language assessments for all new students (K-12) who list a language other than English on the home language survey.
• Provide assessment results and counseling to ELL students before the assignment process.
• Use the same student assignment process used for non-ELL students.
• Language programs have separate seats.

62
Recommendation: Attendance Areas
Create service attendance areas to support the strategic placement of programs and services not available at every school (e.g., Inclusion and SDC programs).
Create attendance areas around elementary and middle schools, unless they are designated city-wide schools.
City-wide schools would not have a geographic preference area.
63
Recommendation: Attendance Areas
• Establish an Attendance Area Staff Working Group* to create attendance areas with general recognition of:
– Neighborhood demographics to maximize racial diversity – Where students live now and where enrollment changes are expected in the
future– Availability of facilities– Traffic patterns– Location of programs (e.g., PreK, Special Education, ELL)
• Attendance areas approved and online before the enrollment cycle for the 2010-11 year begins.
* Staff from Facilities, Transportation, Special Education, Multilingual and World Languages, English Learner Support Services, LEAD, Educational Placement Center, and the Information Technology Department

64
Recommendation: City-Wide Schools
• Strategic objectives for having schools without an attendance area:
1. to provide equitable access to the range of opportunities offered to students in SFUSD and
2. to use choice as a tactic to promote diversity.
• Current recommended parameters for identifying schools that should be city-wide:
• Newcomer schools• Immersion schools• K-8 schools
• Still exploring list of other schools that should be city-wide. May come back to Board with other recommendations once we being the work of drawing attendance areas.

65
Recommendation: For City Wide Schools
Younger siblings get priority to attend school with their older sibling.
School seats get split into two categories:• % of the seats for students living in CTIP 1• % of seats for students living in CTIP 2
If more applicants in one group than the other, instead of leaving seats open keep assigning students who requested the school.

66
Maintain centralized enrollment process first year– Identify 3-5 pilot schools and determine the best way to
decentralize some of the enrollment functions.
Replace Round 1 and Round 2 with one primary enrollment period:– Applications Available: – Application Deadline:– Assignment Offers:
This will give families more time to learn about their options and participate in the primary enrollment period.
Recommendation: Enrollment Process
67
Critical Success Factor: Diverse Applicant Pools
• Continue the work to make sure every school is a quality school.
• Change the current configuration of programs, particularly language programs that contribute to racial/ethnic concentrations in schools.
• Implement strategies that support integrated learning environments within each school.

68
• Invest in the development and implementation of targeted outreach and recruitment strategies to increase the diversity of the applicant pools.
• Provide limited but strategic transportation to elementary school students.
– Prioritize low-income families.
• Work with MUNI to ensure transportation services for middle and high school students.
Critical Success Factor: Diverse Applicant Pools

69
There are no big differences across options A & B in terms of reducing racial isolation and the concentration of underserved students in the same school.
This is because of the racial isolation in the applicant pools and the residential patterns.
Accomplish Board’s Priorities?

70
Differences occurred when looking at measures of:• Educational Equity• Predictability• Proximity• Cost-Effectiveness• Simplicity• Flexibility
Accomplish Board’s Priorities?

71
Option A• Greater percent of students from low CST census tracts
– get assigned to a school with an API of 8+– Get their first choice
• Greater parent effort required to gather information and participate in the enrollment process – more complicated and time consuming
• Less predictable– Fewer students get assigned to their attendance area school– Equity concerns for students enrolled in schools not chosen (access to
resources and services)– More difficult to plan educational programs and pathways
• More expensive to implement and sustain over time -- outreach and recruitment and transportation
• More flexible, easier to make changes if not working

72
Option B• Smaller percent of students from low CST census tracts
– get assigned to a school with an API of 8+– Get their first choice
• Parent effort is voluntary, not mandatory – simpler and less time consuming
• Significantly more predictable – Greater percent of students get assigned to their attendance
area or higher– Students get assigned closer to where they live
• More opportunity to create robust enrollments in school• Predictability provides greatest opportunity to manage limited
resources and focus programs and services• Less flexible, more difficult to adjust
73
Framework for High School

74
Recommendation: Framework for High Schools
• Families could continue to exercise school choice for any high school in SFUSD.
• Design a choice system that would:– Provide younger siblings with a priority to attend the same school as
their older sibling.– Give priority to students in middle school who are participating in a
language program pathway, career pathway, or other clearly identified pathway priority to continue in that pathway in high school.
– Maximize school integration and balance enrollments.• No geographic preference area for high schools.• Develop a targeted recruitment campaign to support exiting
8th graders navigate the choice system and learn about the different options high school options.

75
Board Policy Discussion
76
Next Steps

77
Immediate Next Steps
• Incorporate feedback from tonight’s discussion• February 9 - Regular Board Meeting
– Present proposal for First Reading• February 17 - Ad Hoc Committee
– Detailed description of how the proposed student assignment mechanism would work (scenarios and technical description)
– Implementation plan and budget• Board Committee Meetings (dates and times TBD)• March 9 - Regular Board Meeting
– Second Reading and Action

78
March to November 2010
• Draw the attendance area boundaries.• Develop a new transportation policy.• Create administrative regulations to support the
Board’s policy.• Build the technical infrastructure.• Create a policy and tools for calculating and
tracking the instructional capacities for each school.• Create a monitoring and evaluation system.• Create application materials (multilingual).• Develop an outreach and recruitment campaign.

79
Addendum:Key Findings from Redesign Process
www.SFUSD.edu/StudentAssignmentRedesign

80
Key Findings: Achievement Gap
• There are sharp differences in achievement outcomes and teacher assignment practices in schools that are 80% to 100% African American, Latino, and Samoan, and there is some differential at the 60% rate.

81
Key Findings: Achievement Gap
• The majority of SFUSD schools show a statistically significant achievement gap.
• Spatial proximity of diverse bodies does not guarantee a rich educational experience for all students.

82
Key Findings: Residential Patterns
• The residential patterns are racially isolated.• Underserved students are concentrated in the
southeast of the city, regardless of the diversity measure used: academic achievement, linguistic, socio-economic, race/ethnicity.
• Racially isolated schools (more than 60% of a single racial/ethnic group) are located in racially isolated neighborhoods.

83
Key Findings: Residential Patterns
• SFUSD students living near schools that have more than 60% African American and Latino students are more diverse than the students enrolled in the schools.– African American and Latino students are more
likely to request the schools than any other racial/ethnic group living near the schools.
84
Key Findings: Applicant Pools
• Applicant pools for individual schools are racially isolated, even though at a District level the applicant pools are racially diverse and do not have a majority group.
• Language programs designed to meet the needs of Spanish and Cantonese speaking English Language Learners (ELLs) impact the racial/ethnic composition of a school. – Most schools with an enrollment of more than 60%
Chinese or 60% Latino dedicate a majority of their seats to programs that support Cantonese or Spanish speaking ELLs.

85
Key Findings: Applicant Pools
• Applicant pools for schools that have an enrollment of more than 60% African American and Latino are small as well as racially isolated. – More students live near the schools than apply to the
schools.– There is more racial/ethnic diversity among students
residing near the schools than enrolled in the schools.

86
Key Findings: Racial Isolation of AA/L
Factors contributing to racial isolation of African American and Latino students.
1. Residentially patterns in the City. 2. African American and Latino students are more likely
to request the schools near where they live than other racial/ethnic groups living near the schools.
3. African American and Latino students: – participate later than other racial/ethnic groups, so– they have less access to schools, and – can only get assigned to schools with openings, which are– generally schools with high concentrations of African
American and Latino students.
87
Key Findings: School Capacity
• District-wide, school capacity exceeds enrollment at the elementary and middle school levels.
• However, given the mismatch between where students live and where schools are located, it is not possible to have a strict neighborhood school system throughout the City:– More elementary and middle school students reside in
the southeast than seats to accommodate them.– The north and west is not as densely populated – there
are more seats than SFUSD students living near the schools.

88
Capacity Issues - Elementary

89
Capacity Issues – Middle School

90
Key Findings: Boundaries• Our ability to improve school diversity using attendance
area boundaries is limited because of San Francisco’s residential patterns.
– Individual boundaries– Small zones– Large zones– Satellites
• The larger the area the more diverse the residents, and therefore the greater the opportunity to create diverse school enrollments through designated assignments.
• Small clusters would restrict the SFUSD’s ability to create diversity (due to residential patterns) and would not provide equitable access to programs and schools.

91
Partial elementary attendance area scenario that maximizes diversity in the southeast.
It disregards school capacities and student safety (freeways and major thoroughfares are crossed).
Individual Boundaries

92
Elementary zones scenario. There are high concentrations of African Americans and Hispanics in a large part of the District.
Small Zones

93
Large Zones

94
Satellites

95
Five Choice Options
1. Lottery with local school preference.2. Lottery with academic diversity
preference. 3. Lottery with academic diversity
preference and local preference
5. Local schools with choice for city-wide programs.
6. Local schools with choice for all school
96
Key Findings: Choice Simulations
Board’s 1st Priority: Reduce racial isolation and the concentration of underserved students in the same school.
• There were no big differences across the different options in terms of the number of schools with: – more than 40% English Language Learners – more than 60% of students
• achieving Below Basic or Far Below Basic on the CST• of a single racial/ethnic group• with a low socio-economic status
• Option 5 performed less well, but it was not a big difference (local school assignments with choice for city-wide only)

97
Key Findings: Choice Simulations
Board’s 2nd Priority: Provide equitable access to the range of opportunities offered to students.
• The options that used the academic diversity preference (Options 2 and 3) outperformed the other options.
• There were no big differences across the options in terms of the number of under enrolled schools.

98
Key Findings: Choice Simulations
Board’s 3rd Priority: Provide transparency at every stage in the assignment process.
• All options performed the same in terms of providing transparency at every stage of the assignment process: they are strategically simple, non-wasteful, and allow for updates.
• The local options (Options 5 and 6) decrease the connection between on-time application and enrollment outcomes.