student achievement in response to intervention groups
TRANSCRIPT

East Tennessee State UniversityDigital Commons @ East
Tennessee State University
Electronic Theses and Dissertations Student Works
5-2016
Student Achievement in Response to InterventionGroupsAllison L. GardenhourEast Tennessee State Universtiy
Follow this and additional works at: https://dc.etsu.edu/etdPart of the Bilingual, Multilingual, and Multicultural Education Commons, Curriculum and
Instruction Commons, Curriculum and Social Inquiry Commons, Disability and Equity inEducation Commons, Educational Assessment, Evaluation, and Research Commons, EducationalLeadership Commons, Educational Methods Commons, and the Special Education and TeachingCommons
This Dissertation - Open Access is brought to you for free and open access by the Student Works at Digital Commons @ East Tennessee StateUniversity. It has been accepted for inclusion in Electronic Theses and Dissertations by an authorized administrator of Digital Commons @ EastTennessee State University. For more information, please contact [email protected].
Recommended CitationGardenhour, Allison L., "Student Achievement in Response to Intervention Groups" (2016). Electronic Theses and Dissertations. Paper3009. https://dc.etsu.edu/etd/3009

Student Achievement in Response to Intervention Groups
___________________
A dissertation
presented to
the faculty of the Department of Educational Leadership and Policy Analysis
East Tennessee State University
In partial fulfillment
of the requirements for the degree
Doctor of Education in Educational Leadership
_____________________
by
Allison L. Gardenhour
May 2016
_____________________
Dr. Virginia Foley, Chair
Dr. Eric Glover
Dr. Don Good
Dr. Karin Keith
Keywords: RTI, Response to Intervention, Intervention Programs, Student Growth, Closing
Achievement Gaps, Progress Monitoring
2
ABSTRACT
Student Achievement in Response to Intervention Groups
by
Allison L. Gardenhour
The purpose of this study was to identify components of Response to Intervention (RTI) groups
associated with increased student growth on progress monitoring tests. The relationship between
student growth scores and fidelity of implementation scores, types of groups, types of
interventionists, group setting, group time, and various demographic groups were examined.
Seven hundred fifteen students enrolled in reading and math groups in an RTI program at 8
schools in an Upper East Tennessee school system participated in this study. Ten research
questions and null hypotheses were analyzed using Pearson correlations, independent t tests, and
one-way Analyses of Variance. Results indicated significant gains for RTI students in every type
of reading and math intervention group and every demographic population. These results
contradicted current nationwide studies on RTI in which students made limited gains in
intervention.

3
DEDICATION
This work is dedicated to my family and friends who continue to fight to improve
education. Special thanks go out to our interventionists, our students, and all those who value
education precisely because they had to struggle and sacrifice to succeed. For Cindy, Courtney,
Corey, Dave, Dianna, Donna, Drew, Jami, JoDee, Naomi, Katherine, Kathleen, Shannon, and
Tiffany, my brothers and sisters in the fight to help students grow, thank you for your continued
moral support and friendship. For my cousin, Andrew, thanks for showing me how to fight the
good fight with perseverance and love. You will forever live on in our hearts.
A special thank you goes out to both of my parents for believing in me and instilling a
love of learning, education, and writing. Especially to my mother, Lynn, the first woman in the
family to graduate college, who went on to earn multiple graduate degrees while working and
raising me alone, you are a true inspiration. You lit a fire in me to speak for those whose voices
weren’t being heard. For my best friend and sister, Dianna. There just aren’t words to express my
gratitude for you. Thank you for supporting me in ways too numerous to count.
For my daughter, Isabel, you are an amazing young lady. Your loving support and kind
example have inspired me to be a better person. I hope this process has helped you see that with
passion, compassion, and effort, you can make positive changes in this world.
Last but never least, for my incredible husband, Chris, whose dedication to improving the
lives of his students and teachers has inspired me on countless occasions. You are making such a
difference in the lives of your students every day. Thank you for supporting me every step of the
way. You are my rock and my love. I treasure your wisdom, intellect, insight, and caring.
Without your sacrifice and support, this would not have been possible. Thank you.
4
ACKNOWLEDGEMENTS
There are so many people who will have my lifelong gratitude for their support on this
journey. When people asked me who was on my committee, I often said that I was blessed to
have the dissertation dream team. My committee was incredible and helped me every step of the
way. Dr. Virginia Foley, Dr. Eric Glover, Dr. Don Good, and Dr. Karin Keith could not have
been more supportive.
Dr. Foley, there just aren’t words to adequately express how grateful I am to you and how
much I respect and adore you. I knew from our first class together that I wanted you to be the
one to stand beside me throughout this process. You are a strong and inspirational woman who
leads with honesty, courage, and wisdom. You inspire us to dream of better schools and
encourage us as we strive to create them. Dr. Glover, thank you for always reminding me to
work toward a greater vision in life and education. You and Dr. Foley taught me that truly
systemic change takes passion, caring, and consensus. Dr. Good, thank you for helping me every
step of the way and for taking the extra time and effort to help me see that research is fun. Dr.
Keith, you are strong, brilliant, kind, and know so much more about literacy than I ever will. I’m
so grateful for you.
My heartfelt thanks goes to the leadership of Johnson City Schools for their incredible
support my work and of Response to Intervention. What our principals, supervisors, and board
do for our students and teachers is amazing. To be a part of a school system that supports
struggling students in so many ways is such a blessing. There are too many people to thank by
name. However, Dr. Roger Walk deserves special thanks. He showed me how to make the
impossible possible through his caring, thoughtful leadership. Thank you for supporting me and
changing the lives of countless students and teachers. You are truly a transformational leader.

5
TABLE OF CONTENTS
Page
ABSTRACT ...................................................................................................................... 2
DEDICATION ................................................................................................................... 3
ACKNOWLEDGEMENTS ................................................................................................. 4
LIST OF FIGURES ............................................................................................................... 8
1. INTRODUCTION ............................................................................................................. 9
Purpose of the Study .................................................................................................. 12
Research Questions .................................................................................................... 12
Significance of the Study ........................................................................................... 14
Definitions of Terms .................................................................................................. 15
Limitations and Delimitations .................................................................................... 19
Overview of the Study ............................................................................................... 20
2. REVIEW OF LITERATURE ............................................................................................ 22
Response to Intervention............................................................................................ 22
Historical Context of RTI: Federal, State, and Local Implementation ................ 24
The President’s Commission and the Reauthorization of IDEA ......................... 25
States Using RTI Prior to Federal Mandate (2004-2014) .................................... 28
Existing State RTI Models Prior to Federal Policy ............................................. 28
RTI and Special Education: A Complicated Relationship ......................................... 30
Consistency and Fairness in Determining SLD Eligibility .................................. 32
Using the Discrepancy Model to Determine SLD Eligibility ............................. 33
Using RTI to Determine SLD Eligibility ............................................................. 34
Using RTI to Reduce Numbers in Special Education .......................................... 35
Closing Achievement Gaps for Special Populations ................................................. 36
Components of Effective RTI Frameworks ............................................................... 38

6
The Three Tiers .................................................................................................... 40
Data Based Decision Making .............................................................................. 44
Collaborative Problem Solving and Planning ...................................................... 45
Data Collection in RTI ........................................................................................ 49
Research Based Interventions .............................................................................. 50
Testing in RTI: Universal Screening and Progress Monitoring ......................... 53
Fidelity of Implementation .................................................................................. 54
Administrative Support ....................................................................................... 57
Professional Development in RTI ........................................................................ 59
RTI Scheduling, Frequency, and Group Size ..................................................... 63
Chapter Summary ...................................................................................................... 66
3. METHODOLOGY ........................................................................................................... 67
Research Questions and Null Hypotheses ................................................................ 67
Population ................................................................................................................. 69
Instrumentation ......................................................................................................... 70
Data Collection ......................................................................................................... 73
Data Analysis ............................................................................................................ 75
Chapter Summary ..................................................................................................... 76
4. FINDINGS ........................................................................................................................ 77
Research Question 1 .................................................................................................. 77
Research Question 2 .................................................................................................. 79
Research Question 3 .................................................................................................. 81
Research Question 4 .................................................................................................. 83
Research Question 5 .................................................................................................. 85
Research Question 6 .................................................................................................. 87
Research Question 7 ................................................................................................. 89
Research Question 8 ................................................................................................. 91
7
Research Question 9 ................................................................................................. 93
Research Question 10 ............................................................................................... 95
Chapter Summary ..................................................................................................... 96
5. SUMMARY, CONCLUSIONS, AND RECOMMENDATIONS ............................... 97
Summary of the Study ............................................................................................... 97
Conclusions ............................................................................................................... 98
Recommendations for Practice ................................................................................. 112
Recommendations for Future Research .................................................................... 114
REFERENCES ...................................................................................................................... 116
APPENDICES ....................................................................................................................... 125
Appendix A: RTI2 Fidelity Report ............................................................................ 125
Appendix B: RTI2 Triangle (Tennessee Department of Education, 2013) ............... 126
VITA ..................................................................................................................................... 127
8
LIST OF FIGURES
Figure Page
1: Distribution of Student Growth Scores and Fidelity of Implementation Scores ...............79
2: Distribution of Student Growth Scores for Basic Reading, Reading Fluency, and
Reading Comprehension Groups .....................................................................................81
3: Distribution of Student Growth Scores for Basic Math, Math Computation, and Math
Problem Solving Groups ..................................................................................................83
4: Distribution of Growth Scores for Students Served by RTI Tutors, Part-time Assistants,
Full-time Assistants, and Classroom Teachers ................................................................85
5: Distribution of Growth Scores for Students in Groups that were 20-29 Minutes, 30-44
Minutes, 45-59 Minutes, and 60 or More Minutes ..........................................................87
6: Distribution of Growth Scores for Students that Received Intervention in Pull-Out and
Inclusion Groups ..............................................................................................................89
7: Distribution of Growth Scores for Students Receiving and Not Receiving English as a
Second Language Services .............................................................................................91
8: Distribution of Growth Scores for Students Receiving with Low Socioeconomic Status
and Other Socioeconomic Statuses ..................................................................................93
9: Distribution of Growth Scores for Students Receiving and Not Receiving Special
Education Services ...........................................................................................................95
7: Distribution of Growth Scores for Males and Females .....................................................97

9
CHAPTER 1
INTRODUCTION
Research about Response to Intervention (RTI) programs that are effective in closing
achievement gaps and meeting federal requirements could help school systems nationwide find
more effective ways to meet the needs of their struggling students. For this to happen it is
important that school systems examine the success and implementation of existing intervention
programs to ensure their effectiveness and alignment with the federal RTI model. The National
Research Council defined Response to Intervention (RTI) as student-centered assessment models
that use problem-solving and research-based strategies to identify and address learning problems
(Berkeley, Bender, Gregg-Peaster, & Saunders, 2009; Johnson, Mellard, Fuchs, & McKnight,
2006). The primary goal of RTI is to provide needed, individualized interventions for students
who struggle academically (Martinez & Young, 2011).
This study was used to examine the effectiveness and implementation of the Learning
Enrichment and Development (LEAD) Program in several different structural and instructional
areas. LEAD is an intensive literacy and math RTI program based on the strategies of many
existing research-based programs, such as Lindamood-Bell’s Seeing Stars, Beverly Tyner’s
Small Group Differentiated Instruction, Jan Richardson’s Guided Reading Groups, Fountas and
Pinnell’s Comprehension Toolkit, and Lindamood Bell’s Visualizing and Verbalizing. This study
was an examination of which organizational components and instructional practices positively
correlated with the most growth for students from varying demographic groups.

10
Response to Intervention: An Overview
Recently our nation mandated the implementation of a federal Response to Intervention
(RTI) model to help struggling students succeed and determine eligibility for Specific Learning
Disability (SLD). As of July 2014 every state was expected to be in compliance with the new
RTI requirements even though only 13 of them had fully implemented using RTI for Specific
Learning Disability diagnosis by 2011 (Zirkel, 2011). School systems all over the nation have
scrambled to learn everything they could about RTI in order to build programs that would
successfully fulfill the new requirements, align with the new standards, increase academic
achievement, and close achievement gaps for struggling students.
Many different types of RTI programs existed prior to the federal RTI roll-out in 2014.
Over time similarities in intervention programs have grown. Most RTI programs include a
process by which a team defines a student’s problem, plans and implements interventions to help
the student grow, and provides ongoing assessments to determine the extent to which the
interventions work (Bender & Shores, 2007; Fuchs, Mock, Morgan, & Young, 2003; Martinez &
Young, 2011).
While there are a wide variety of goals for using an RTI framework several goals are
prominent in the literature. The primary goal of most RTI programs is to provide students with
the individualized and intensive help they need to succeed. Another common goal of RTI is to
maintain an ongoing process that uses student performance to guide high-quality instruction to
meet the student’s needs whether in the classroom or in intervention groups (Abbott & Wills,
2012). A secondary goal of many RTI programs is either to cause so much growth that students
no longer need special education services or to accrue so much data during the intervention that
the eligibility process for Specific Learning Disability (SLD) is strengthened, streamlined, and
accelerated. RTI interventions are designed to identify needs early and allow for flexibility in
11
type and amount of service received. This allows students to receive extra help as needed and
frees them to return to the core curriculum without additional support as soon as they are ready.
During the 2004 reauthorization of the Individuals with Disabilities Education Act
(IDEA) the Response to Intervention (RTI) model was proposed as an alternative to the IQ-
discrepancy model formerly used to identify students with Specific Learning Disabilities (SLD).
Several states that were using RTI programs in 2007 had already begun to use student
performance in RTI to determine referral for special education testing (Berkeley et al., 2009).
With the federal roll-out of RTI in 2014, schools in Tennessee began using information gathered
from the RTI model as part of the criteria used to diagnose specific learning disabilities
(Tennessee Department of Education, 2013). The use of federal and state RTI models became
mandatory for the identification of students with specific learning disabilities in 2014. Many
states, including Tennessee, developed RTI frameworks that proposed to close achievement
gaps. A great deal of previous RTI research deals with teacher or administrator perceptions of
RTI rather than determining which RTI practices align with student growth. While perceptual
data are valuable, this study was designed to identify which interventions and other aspects of
this Response to Intervention program positively correlated with student growth on progress
monitoring tests. Response to Intervention programs are complex district wide initiatives that can
be used to determine which practices accelerate student growth. As such, they can be used as a
barometer of the effectiveness of instructional strategies and structural practices used within
schools.

12
Purpose of the Study
The purpose of this nonexperimental quantitative study was to identify factors associated
with increased student growth in RTI groups as measured by progress monitoring assessments on
either AIMSweb or DIBELS tests. McMillan and Schumacher (2012) share that nonexperimental
research design examines relationships between different phenomena without any direct
manipulation of variables used in the study. This study was used to examine the relation between
student growth on progress monitoring tests and specific research-based reading and math
interventions, position of the interventionists, fidelity of implementation, group time, and setting.
The study was used to explore growth comparisons of students from various demographic
groups, including gender, language background, socioeconomic status, and special education
status.
Research Questions
The nonexperimental quantitative design guided the following research questions:
Research Question 1: Is there a significant relationship between fidelity scores on RTI2 Fidelity
Reports and student growth on progress monitoring assessments?
Research Question 2: Is there a significant difference between student growth on progress
monitoring assessments as compared by the type(s) of reading intervention (basic reading group,
reading fluency group, or reading comprehension group)?
Research Question 3: Is there a significant difference in student growth on progress monitoring
assessments as compared by the type(s) of math intervention (basic math, math computation
group, or math reasoning group)?

13
Research Question 4: Is there a significant difference in student growth on progress monitoring
assessments as compared by interventionist’s position (RTI tutor, part time assistant, full time
assistant, or classroom teacher)?
Research Question 5: Is there a significant difference in student growth measured by progress
monitoring assessments as compared by the length of group time (30-44 minutes, 45-59 minutes,
or 60 or more minutes).
Research Question 6: Is there a significant difference in student growth on progress monitoring
assessments of pull-out groups and inclusion groups?
Research Question 7: Is there a significant difference between student growth on progress
monitoring assessments between ESL and non-ESL students?
Research Question 8: Is there a significant difference in student growth on progress monitoring
assessments between students in the low socioeconomic group and other socioeconomic groups?
Research Question 9: Is there a significant difference in student growth on progress monitoring
assessments for special education students and regular education students?
Research Question 10: Is there a significant difference in student growth on progress monitoring
assessments between males and females?

14
Significance of the Study
Previous studies of RTI have primarily focused on teacher or administrator perspectives
rather than which aspects of RTI programs may be related to student growth. This type of study
could be beneficial for school systems across the nation who are just starting or refining their
RTI programs and seeking to find effective ways to close achievement gaps. Overall, the
literature supported the use of RTI. However, the mixed results of a few studies demands further
examination into the effectiveness of RTI implementation in school systems (Adams, 2013; Balu
et al., 2015). Therefore, in order to create effective RTI programs, we must first learn which
practices within our programs align with growth on progress monitoring assessments. The results
of this study could be pivotal in refining the program’s use to better meet student needs. It could
also aid systems across the nation as they build their own effective RTI programs.
Further investigating RTI could provide a powerful tool for school improvement and
systemic reform. Adelman and Taylor (2011) confirmed this:
Addressing barriers to learning and teaching and reengaging disconnected students is a
school improvement imperative. Developing and implementing a comprehensive,
multifaceted, and cohesive system of learning supports is the next evolutionary stage in
meeting this imperative. It is the missing component in efforts to close the achievement
gap, enhance school safety, reduce dropout rates, shut down the pipeline from schools to
prisons, and promote well-being and social justice. (p. 8)
Students, parents, educators, school reformers, politicians, and advocates for social
change across the nation have long searched for the best way to meet the needs of students who
struggle academically because low literacy rates and academic failure are predictors of increased
rates of poverty and reliance on public assistance. The United States Department of Education
study on adult literacy revealed that attaining higher levels of literacy led to lower poverty
(Kutner et al., 2007). When adults progressed from Below Basic to Basic or Basic to Proficient
on different literacy measures, their likelihood to be in lower socioeconomic groups diminished.
15
Among women who received Below Basic ratings on prose, 10% had received public assistance
in the past and 4% were currently receiving assistance. Ikeda (2012) pointed out that while
research on intervention programs is important, research that helps us solve important social
problems, such as over-identification of minority students in special education programs, are the
most important things we can examine. Research that helps us pair aspects of effective RTI
programs with student growth can aid us in our quest to create more effective RTI programs that
close academic gaps for students who have long struggled in our schools.
Definitions of Terms
For this research, the following operational definitions were used:
1. AIMSweb - a set of formative assessments created by Shinn and Germann that measure
areas of basic literacy skills and basic math skills in grades K-8 using standardized
methods (Kiser, 2011). Each test takes only a few minutes and is designed to be
administered weekly, bi-weekly, or monthly. These are the tests given to all students in
this study every 10 days for progress monitoring with the exception of the K-1 reading
groups.
2. Core Curriculum - high-quality, rigorous, standards-based instruction for all students in
the classroom that incorporates a gradual release of responsibility, examples of the
thinking required to complete the work, and access to academic language, peer support,
and needs-based guided instruction (Fisher & Frey, 2010; Tennessee Department of
Education, 2013).
3. Curriculum-Based Measurement (CBM) - brief, national-normed, formative assessments
that allow for student growth scores to be graphed on a weekly, bi-weekly, or monthly
16
basis because they integrate the reliability and validity features of traditional
psychometrics with standardized measurement. CBMs are designed to allow teachers to
systematically monitor and evaluate the effects of instruction on student performance
(Ardoin & Christ, 2009). The AIMSweb, DIBELS, and EasyCBM tests used in this study
are all Curriculum-Based Measurements.
4. Differentiated Instruction - A multidirectional process of creating and implementing
educational experiences that are tailored to meet the individual needs of each child,
including the supports needed to foster the highest achievement possible by that
individual child (O’ Meara, 2011).
5. Dynamic Indicator of Basic Early Literacy Skills (DIBELS) - a set of formative
assessments created by Good and Kaminski that include measures for letter and sound
recognition, phonemic awareness, and oral reading fluency (Abbott & Wills, 2012; Kiser,
2011). The DIBELS tests we used for this study were phoneme segmentation fluency
(PSF), nonsense word fluency (NWF), and DIBELS oral reading fluency (DORF).
DIBELS tests were given to all K-1 students as a universal screener three times a year
and to kindergarten and first grade RTI students every 10 days for progress monitoring.
6. EasyCBM - a set of curriculum-based measurements that include measures for basic
reading and math skills for grades K-8 very similar to the AIMSweb and DIBELS tests
listed above (Brinker-McCammon, 2011). For this study EasyCBM tests were given as
universal screeners three times a year in reading comprehension and vocabulary for
second through eighth grades and for math in grades K-8. These assessments were part of
the criteria used to decide who needed RTI.

17
7. Eligibility - the process by which a student becomes eligible to receive the resources and
modifications provided by special education programs based on a diagnosis of specific
learning disability (SLD) or another disability category. This process should include a
categorical and explanatory diagnosis as well as treatment planning (Johnson, Humphrey,
Mellard, Woods, & Swanson, 2010).
8. Fidelity Check - walkthrough-style observations designed to ascertain the extent to which
the staff adheres to RTI procedures as they were designed, intended, and planned (Drury
& Walter, 2014). See Appendix A for a detailed form used for fidelity checks.
9. Fidelity of Implementation - the delivery of instruction in the way it was intended to be
delivered (Gresham, MacMillan, Boebe-Frankenburger, & Bocian, 2000). In the RTI
program being studied this included not only program-specific and research-based
teaching strategies but also higher-level questioning, stimuli-response feedback, and
classroom management techniques.
10. Fidelity Report - a form used to monitor management and teaching strategies during a
fidelity check (Tennessee Department of Education, 2013). The RTI2 Fidelity Report
used in this study is shown in Appendix A.
11. Intervention - explicit, small group or individual instruction in a student’s area of
weakness based on a systematic instructional approach that includes a set of delivery and
design procedures focused on critical content and derived from effective school research
(Tennessee Department of Education, 2014).
12. Progress Monitoring Assessment - a brief assessment in the student’s area of weakness
(i.e.- basic reading, reading fluency, reading comprehension, math calculation, math
problem solving, or written expression) given every 5-10 days to determine growth and
18
the effectiveness of the intervention (Tennessee Department of Education, 2013).
Academic deficits within the RTI framework can be monitored using CBMs or another
instrument that is sensitive to change (Tennessee Department of Education, 2014).
AIMSweb and DIBELS were the CBMs used to progress monitor students every 10 days
in this study.
13. Response to Intervention (RTI) or Response to Instruction and Intervention (RTI2) - a
path to providing instructional opportunities for all students who fall at or below the 25th
percentile, which includes a detailed, data-based decision making process in which
appropriate data are collected to inform and drive instructional decisions, and small group
interventions are implemented and monitored to help students grow academically
(Tennessee Department of Education, 2013). The terms RTI and RTI2 are used
interchangeably in this study.
14. Specific Learning Disability (SLD) - a disability that adversely affects a child’s
educational performance and may manifest itself in the imperfect ability to listen, think,
read, write, spell, or do mathematical calculations. Categories of SLD include basic
reading, reading fluency, reading comprehension, math calculations, math problem
solving, written expression, or another basic psychological process of understanding or
using written or spoken language (Tennessee Department of Education, 2014).
15. Student Growth- for this study student growth was defined as a student’s responsiveness
to intervention as evidenced by higher post intervention scores than pre intervention
scores. Post intervention scores were created by subtracting the average of the last three
national percentile scores on progress monitoring tests minus the pre intervention scores
(the average of the first three progress monitoring scores taken). As these national

19
percentiles were grade-normed, the growth of the natural slope of student learning
throughout the year was already included in this equation. Average growth on a national
percentile is zero and anything above a zero is a gain.
16. Universal Screening - a brief screening assessment of academic skills given to all
students to determine whether or not they have the academic foundation necessary to
achieve grade-level standards in basic reading, reading fluency, reading comprehension,
math calculation, and math problem solving (Tennessee Department of Education, 2013,
2014). Easy CBM and DIBELS tests were used to screen the students in this study three
times a year to determine eligibility in this RTI program.
Limitations and Delimitations
Correlational research always carries with it the limitation that we can only show an
association between variables, not a causal relationship between the variables (Simon & Goes,
2013). The relationships found in this study were not widely generalizable because they are
based on use in one school system.
The limitations of this study include the following:
1. The RTI2 Fidelity Report, while based on state templates, state requirements, and
modified and approved by a diverse array of knowledgeable educators across the school
system, was not tested for reliability and validity.
2. Each interventionist and RTI coordinator in the school system was provided with ongoing
professional development in the form of multiple instructional workshops, monthly
collaborative meetings, frequent academic coaching, and modeling of instructional
practices. Each interventionist was given lesson plan templates with specific research-

20
based instructional strategies designed to help students grow in reading or math.
However, in order to differentiate instruction to students’ individual needs, instructional
practices vary slightly among the eight elementary schools in the study.
The delimitations of this study, potentially affecting the generalizability of the study to other
school systems, include the following:
1. The population of this study was limited to kindergarten through fourth grade students
because RTI was not mandated or implemented consistently in grades 5-12 during the
year the study was conducted.
2. The participants of this study were restricted to a single school system in Upper East
Tennessee to make it feasible to gather relatively large amounts of data for each student,
as well as to keep the instructional strategies, structural procedures, and assessments used
consistent throughout the study. While only one school system was used, it should be
noted that the school system where this study took place included a diverse population of
students.
Overview of the Study
This study is organized into five chapters. Chapter 1 includes an introduction to the study,
the purpose and significance of the study, research questions, definitions of terms used in the
study, and the study’s limitations and delimitations. Chapter 2 provides a review of the literature
that explored the national and historical context of Response to Intervention (RTI), the
relationship between RTI and Special Education, the components of effective RTI programs, and
ways RTI can increase student learning in special populations. Chapter 3 documents the
methodology used to conduct the study. Chapter 4 discloses the findings of the statistical

21
analyses. Chapter 5 presents the summary of findings, conclusions, and recommendations for
practice and further research that arose from this study.

22
CHAPTER 2
REVIEW OF LITERATURE
Finding the best strategies to close achievement gaps for all students is something
educators have been striving for the past few decades with marginal success. This is difficult
because improving education for students who struggle academically requires systemic change in
schools and systems. RTI programs could help educators begin to close achievement gaps in
significant ways because they include the type of dynamic, collaborative, reflective, and data-
based decision making processes needed to incite systemic change. In 2004 RTI was proposed as
a strategy for identifying students with learning disabilities and preventing the over-identification
of students in special education programs as part of the Individuals with Disabilities Education
Act (IDEA) (Murakami-Ramalho & Wilcox, 2011). Over a decade later many schools are just
now beginning their RTI programs and are still working hard to close those gaps and to ensure
that all students receive a fair and appropriate public education that respects and fulfills their
individual needs. RTI programs could help ensure that students’ individual needs are met prior to
referral for SLD, which could reduce over-identification of our largest disability population and
begin to improve the quality and quantity of learning for most students significantly.
Response to Intervention
Response to Intervention (RTI) is a multifaceted intervention and decision-making
process designed to help students who struggle improve academically. There have been many
intervention programs designed to help struggling students prior to RTI. Some of these programs
were successful and some were not (Jimerson, Burns, & VanDerHeyden, 2007; O’Conner &
Witter-Freeman, 2012).
23
There were some issues with prior intervention programs that helped to set some of the
foundational pieces of RTI (Jimerson et al., 2007). Prior to RTI most intervention programs were
populated based on teacher referral, rather than on a combination of evidentiary proof of need
and teacher concern. As beliefs about the severity of student needs vary by teacher, some
students had a greater or lesser chance of being given intervention based on those beliefs. This
kept some students from getting the help they needed and kept other students in intervention
programs long after their needs were met. Unfortunately, prior to RTI most programs did not
contain the formative assessments needed to ensure that students were experiencing ongoing
growth during the period of intervention. Without ongoing monitoring in place to ensure that
students were continuing to grow, it became difficult to ensure that the strategies used to help
students were working. Ongoing progress monitoring is an essential component of effective
response to intervention programs because students have different learning styles and conceptual
needs. Prior to RTI many intervention programs included a great deal of reteaching of
misunderstood classroom content. For students who did not learn material in class when it was
taught the first time, merely reteaching those concepts in the same way rarely helped a struggling
student master the content (Kimmel, 2008).
RTI programs include several key components to deal with these challenges and ensure
students continue to grow throughout their time in intervention. First, all students are given
universal screening tests to determine who needs intervention and which specific skills they need
to master. Screening all students keeps some from being overlooked who may have needs that
had traditionally gone unnoticed. It also prevents intervention students who have closed their
achievement gaps from having to stay in intervention programs long after they need them and
enables them to return to classroom instruction as soon as they are able to work independently.

24
Those who enter RTI programs are assessed every 5 to 10 days with progress monitoring
tests to ascertain the specific skill gaps they possess and whether or not they are beginning to
master those concepts (Tennessee Department of Education, 2013). This information is critical to
help the interventionists and RTI team plan and refine interventions that are tailored to better
meet the students’ specific needs. The methods one student needs to learn may vary from the
methods another needs, even within small group intervention. Thus, within RTI, each student has
a team of educators reviewing his or her progress in all areas of schoolwork frequently and using
that information to better adjust instruction to meet those individual needs. This combination of
collaborative, ongoing data review and adjustment of instruction is the underlying process by
which all RTI programs ensure that each student gets intervention tailored to his or her
individual needs.
Historical Context of RTI: Federal, State, and Local Implementation
The concept of determining students’ need for special education based on how they
respond to intervention is not new but is a widely debated topic. Research on RTI dates back to
the 1960s. However, as it was only federally mandated in the past few years, the process is still
new for many parents and teachers (Bender & Shores, 2007; Berkeley et al., 2009). As such, it is
imperative that those implementing RTI ensure that educators and parents are informed and
actively participate in the process.
Barnett, Daly, Jones, and Lentz (2004) disclosed that the earliest mention of using
students’ responsiveness to intervention to determine eligibility for special education began in
the 1960s at the inception of full scale, nationwide special education services. The National
Research Council (NRC) mentioned changing the discrepancy model to identify SLD in 1982

25
(Martinez & Young, 2011). In that study the NRC also mentioned taking a close look at the
effectiveness of special education assessment procedures, core classroom instruction, and special
education instruction. These ideas paved the way for the fidelity checks and the other processes
we use to ensure that instruction, interventions, and assessments are rigorous and foster student
growth. Marie Clay, the prominent founder of the highly successful Reading Recovery early
intervention program, coined the term intervention in a 1987 article in which she argued that
children should not even be considered for learning disability designation until rigorous,
responsive instruction had been provided and failed to speed up the child’s progress (Lipson &
Wixson, 2012).
Early RTI models included the use of Curriculum Based Measurements (CBM) to screen
students for skill deficits and determine whether they were making progress toward the goal of
grade-level learning (Deno & Gross, 1973). Barnett et al. (2004) suggested determining the need
for special education based on failure to demonstrate a trajectory toward meeting those goals.
The President’s Commission and the Reauthorization of IDEA
To prepare for the reauthorization of the Individuals with Disabilities Act (IDEA) in
2004, the president created a Commission on Excellence in Special Education. In 2002, this
group evaluated the state of special education at every level across the nation to come up with
recommendations for improvement. Their findings formed the basis of the changes brought forth
in the IDEA reauthorization in 2004 (Drame & Xu, 2008). The President’s Commission made
several recommendations that became foundational pieces of RTI. For example, the commission
proposed the need for early intervention and identification systems to decrease the number of
students in the largest disability category, students with specific learning disabilities. To address

26
the over-identification of students with SLD, the commission proposed three pivotal changes to
the SLD identification process that paved the way for RTI. First, they recommended abandoning
the former classification process to make way for a new decision-making process that was based
on response to intervention for those students. Next, they recommended implementing
interventions that included scientifically validated, ongoing progress monitoring to ensure that
students were growing during their period of intervention prior to referral, thereby doing away
with the old “wait to fail” model. Finally, the commission recommended using the same,
dynamic progress monitoring methods to make reevaluation decisions for students already
receiving special education services (Barnett et al., 2004). The recommendations of the
President’s Commission on Excellence in Special Education formed the foundation of the
changes brought forth in the 2004 Reauthorization of IDEA.
The reauthorization of the Individuals with Disabilities Education Act (IDEA) in 2004
was a legislative event that spurred the creation of RTI programs across the nation. This was the
first time in our nation’s history that the use of RTI was made acceptable as an alternative way to
identify students with specific learning disabilities (Berkeley et al., 2009; Ikeda, 2012; Keller-
Margulis, 2012). Martinez and Young (2011) asserted that part of the reason Congress amended
the IDEA was to address the over-identification of students with SLD using the discrepancy
model. In addition to using RTI as an alternative means to identify students with SLD, the
regulations set forth in IDEA 2004 also made a shift from expecting all students, including those
in special education, to master grade-level standards.
This shift toward expecting all students to master grade-level standards undergirds the
focus on rigorous instruction in the classroom and in intervention programs. Barnett et al. (2004)
reflected that the changes in IDEA 2004 and the No Child Left Behind Act require that students
27
receive effective instruction, progress monitoring, and scientifically-based program components
prior to entering special education as a means of making educators accountable for student
growth. Drame and Xu (2008) confirmed this shift toward accountability for students to meet
grade-level standards. They described how documentation of underachievement to determine
eligibility for special education services for SLD was based on a child’s age, ability level, or
intelligence quotient prior to RTI. Underachievement is now based on a child’s lack of
achievement of state-approved, grade level standards (Tennessee Department of Education,
2014).
The current practice of expecting all children to attain rigorous grade-level standards
using evidence-based strategies was a relatively new educational practice that began with the
concurrent legislative initiatives of No Child Left Behind in 2002 and the Reauthorization of
IDEA in 2004. Ikeda (2012) revealed that state policy makers and educators may have missed
some of the underlying thought processes that fueled the reauthorization in 2004. Ikeda argued
that the first act was about getting students with disabilities into school buildings; whereas, the
IDEA regulations are about getting students with disabilities engaged with the core curriculum.
The evolution of thought driving the reauthorization has moved away from merely granting
children with disabilities access to schools and measuring progress against self. Now, students
with disabilities, like all other students, are measuring their progress against state-approved
grade-level standards and access to life outcomes. These concepts further underscore the need for
research on rigorous, highly-intensive instruction that propels student growth at each tier of an
RTI program.

28
States Using RTI Prior to Federal Mandate (2004-2014)
Systemic change takes time, effort, and resources. Some states began implementing RTI
programs immediately following IDEA’s proposal to use Response to Intervention programs in
2004. In the time between the reauthorization of IDEA and the federal roll-out of RTI in 2014,
37 states included a response to intervention process to their state regulations as a possible
alternative to the discrepancy model to identify students with SLD (Berkeley et al., 2009).
Berkeley et al. (2009) reviewed the degree to which states implemented RTI programs
across the nation in the years between the reauthorization of IDEA and federally mandated RTI.
Three years after the Reauthorization of IDEA in 2004, there were only three states that had not
addressed RTI in any way (Alaska, New Jersey, and South Carolina). At that time, 22 states had
begun developing their RTI models and 10 of them were already providing guidance to districts
about how to implement an RTI program. This guidance was found in many forms. Maryland
and Virginia already had comprehensive state RTI manuals in place, while other states were
providing professional development or merely answering questions about RTI. Berkeley also
found, by 2007, 15 states had adopted state RTI models and nine of those states had achieved
large scale implementation (Arizona, Delaware, Georgia, Iowa, Kansas, Ohio, Oregon, Utah, and
Washington). During this time, Tennessee and Massachusetts suggested that districts use existing
tiered programs through the Reading First Initiative to fulfill this goal.
Existing State RTI Models Prior to Federal RTI Policy
Prior to the inception of the formal RTI frameworks two popular models were used to
design intervention programs, the problem solving model and the standard treatment protocol
(STP) model. Drame and Xu (2008) discussed the STP designed by Fuchs and Fuchs. The STP

29
calls for the use of standard, empirically validated programs to be used with fidelity for students
who have similar problems for a specific period of time. The problem solving model was derived
from prereferral intervention models that use collaborative teams to decide the best way to treat
each student’s learning issues. A combination of these models was used to form our current state
and national RTI frameworks that include collaborative teaming, research-based instruction,
data-based decision making, and monitoring for fidelity of implementation.
Keller-Margulis (2012) reported that in the time before RTI models became widely-used,
there were various problem solving models on the scene. One of these models, the Instructional
Support Team process studied by Kovaleski, Gickling, Morrow, and Swank (1999), yielded
better academic outcomes for struggling students in Pennsylvania when it was implemented with
a high degree of integrity. These models were the stepping stones that paved the way for fidelity
monitoring within intervention programs. Berkeley et al. (2009) reported that fidelity monitoring
occurred as early as 2007 in Pennsylvania and Oregon. Perhaps this was due in part to the
findings that the Instructional Support Team process in Pennsylvania was more effective when
paired with fidelity monitoring. Berkeley et al. also found that by 2007 Oregon already had
specific fidelity checklists in place to rate the level of fidelity of instructors who provided
interventions. Our current state and federal RTI models use these types of fidelity checklists to
monitor and improve instruction within intervention programs (Tennessee Department of
Education, 2013).
During the 2014-15 school year the state of Tennessee and the federal government made
using an RTI process mandatory for determining eligibility for special education services for
students with specific learning disabilities (Tennessee Department of Education, 2013). At that
time, most school systems across the state of Tennessee were beginning to implement RTI

30
programs. While Oregon and Pennsylvania had already started fidelity checking by 2007,
Tennessee began implementing RTI in small pockets of the state. The schools that piloted RTI in
Tennessee received guidance from state officials who were not yet in the process of developing a
state RTI model (Berkeley et al., 2009). Thus, the RTI process was so new in Tennessee that no
one used it to determine eligibility for services for students with SLD. That process did not come
until 7 years later with the federally mandated use of RTI to determine eligibility for SLD
services in 2014.
RTI and Special Education: A Complicated Relationship
Response to Intervention is a general education initiative not part of special education.
This means RTI programs are not funded by special education and as such, they follow different
guidelines. One of the most notable differences between special education and RTI guidelines
includes the idea that parents cannot opt out of RTI because these interventions are considered a
normal part of the general education curriculum. Although RTI is not a part of special education,
data from RTI interventions must now be used to identify students with specific learning
disabilities that make them eligible to receive special education. This creates an important and
often complex relationship between RTI and special education (Adams, 2013).
In July 2014, the federal government mandated the use of RTI to identify SLD students.
The federal government mandated that states replace the discrepancy model with uniform RTI
processes to determine eligibility for students with SLD (Tennessee Department of Education,
2013). This federal policy created a sense of urgency for states and schools to adopt RTI as part
of their state regulations (Keller-Margulis, 2012; Zirkel & Thomas, 2010). This resulted in some
schools trying to implement RTI programs in a hurry. Because systemic change takes time
31
(Fullan, 2003), experts suggest that full implementation of RTI will take between 3 and 5 years
(Shapiro, 2009). The RTI program examined for this study matched federal and state mandates
for compliance including progress monitoring and fidelity monitoring procedures.
Drame and Xu (2008) noted that one difference between RTI and the discrepancy model
was that RTI ensured that students received services right away without having to wait months to
become eligible for special education services. Swanson, Solis, Ciullo, and McKenna (2012)
confirmed this when they noted the biggest advantage of RTI was getting to intervene with
students at the first sign of trouble instead of having to wait to help them until they showed a
discrepancy between their IQ and their performance. Several researchers have asserted that using
one-point-in-time assessments to determine eligibility for special education services has been a
long standing source of controversy (Barnett et al., 2004; Reschly & Ysseldyke, 2002).
Hughes and Dexter (2011) found that only a few studies showed slight decreases in
special education numbers while most special education rolls remained fairly constant. Denton,
Fletcher, Anthony, and Francis (2006) found that as many as 40% of the students in their
intervention programs were able to leave special education and return to the general education
population. Stuart, Rinaldi, and Higgins-Averill (2011) shared that after implementing their RTI
program, special education referrals were down by 50% the first year and another 50% the
following year. Their initial referral rates for special education have dropped from 10% to 3% of
the student population. One of the study participants in Stuart et al. articulated, “I think that the
fact that we haven’t had referrals yet speaks for it right there (mid school year- year 2 of RTI
implementation). Last year we had 22 referrals; this year we’ve had only three. That’s huge.
There’s two pieces: We aren’t referring as much and students who might have been referred at an
earlier point two years ago are getting the services they need” (p. 61).
32
Consistency and Fairness in Determining SLD Eligibility
RTI programs have been determining rates of improvement and the need for further
special education testing for many years. However, prior to the federal policy in 2014, RTI
progress has never been used as the sole criteria for determining SLD. Prior to the federal
requirements RTI programs varied so widely that the discrepancy model was still used for
identifying SLD. As of 2011 only 13 states used RTI instead of the discrepancy model to identify
students with SLD (Zirkel, 2011). Vaughn and Fuchs (2006) shared that the use of the
discrepancy model was arbitrary and not valid. Hauerwas, Brown, and Scott (2013) confirmed
that even though many RTI resources are available, there did not seem to be a clear definition of
which specific RTI data collection and analysis processes should be used by the RTI team to
determine eligibility for SLD.
One challenge of using student responsiveness to intervention to determine eligibility for
SLD services is ensuring that the path to determining eligibility is consistent for all students
(Balu et al., 2015). Griffiths, Parsons, Burns, VanDerHeyden, and Tilly (2007) shared that a
great deal of fidelity and uniformity is needed across RTI programs in both instruction and
testing to ensure that eligibility for SLD services remains the same for students in different
schools. Tackett (2009) purported that without using the same criteria to determine eligibility,
students may qualify for services at one school and not another, which would make it difficult to
ensure students receive interventions as they move from one school to another.
Special education eligibility determines the types of modifications given on standardized
tests. Hauerwas et al. (2013) explained that RTI could replace or supplement standardized tests
as a part of the eligibility determination process for students with Specific Learning Disabilities.
Due to this fidelity of implementation is highly important. Hauerwas et al. also reasoned that
33
modifications to curriculum delivery, screeners, and decision rules within RTI can alter the
reliability and validity of the intervention in the same way that modifications alter the results of
standardized tests. Thus, it is imperative that we routinely assess the fidelity of implementation
of RTI instruction and structural components to ensure that they are in alignment with state and
federal requirements and standard enough to contribute to SLD eligibility determinations in a fair
way across school systems and states.
VanDerHeyden (2011) outlined several specific steps systems can take to ensure the
alignment and fidelity of testing to determine eligibility for SLD. These steps include
considering the sensitivity and predictive power of the tests, measuring the cost to benefit ratio
for various assessments, relying on cut scores rather than more subjective measures, and logging
the predictions of clinicians to find out the predictive validity of their hunches in relation to
posttest scores.
Using the Discrepancy Model to Determine SLD Eligibility
There is much debate about the use of an RTI model to diagnose SLD instead of the
previous discrepancy model between a student’s IQ and performance (Kavale, Kauffman,
Bachmeier, & LeFever, 2008; McKenzie, 2009; Reutenbach, 2008; VanDerHeyden, Witt, &
Gilbertson, 2007). Kirk introduced the term “learning disability” in 1962 to describe children
who were experiencing significant and unexplained underachievement in one or more academic
areas despite normal intelligence measured by an IQ test (Drame & Xu, 2008). Specific Learning
Disabilites (SLD) can be identified as a deficit in one of the following academic areas: oral
expression, listening comprehension, basic reading, reading fluency, reading comprehension,
math calculation, math problem solving, or written expression (Drame & Xu, 2008; Murakami-
34
Ramalho & Wilcox, 2011). In 1977 the U.S. Office of Education made the discrepancy between
IQ and performance the primary criteria for diagnosing SLD. Since then the number of SLD
students increased 200% (Berkeley et al., 2009; Vaughn, Linan-Thompson, & Hickman, 2003).
There have been some challenges with SLD identification throughout the years. Barnett
et al. (2009) asserted that special education decision-making processes have been plagued with
problems including the lack of validity and reliability of decisions that led to disability
categories. Drame and Xu (2008) confirmed this explaining that one problem with using the
discrepancy model to identify SLD was the need to wait until a there was a large enough gap
between IQ and achievement before receiving help. This process can take years. Berkeley et al.
(2009) reiterated this problem and proposed that the discrepancy model has created a “wait to
fail” attitude in which students are left to struggle until the upper grades when their achievement
gap has grown large enough to warrant eligibility for special education services. Another
argument against the discrepancy model is that it contributes to over-identification or under-
identification of minority groups in special education due to biased referral and assessment
(Drame & Xu, 2008). Perhaps the most serious indictment against traditional special education
classification procedures is that these procedures have failed to produce increased social and
academic outcomes for at-risk children (Barnett et al., 2004). Therefore, research has shown that
the discrepancy model has failed to adequately identify and intervene for students early enough
to help them close their achievement gaps.
Using RTI to Determine SLD Eligibility
State and federal policy in 2014 required the use of RTI to identify students with Specific
Learning Disabilities (Tennessee Department of Education, 2013). Work by Barnett et al. (2004)
35
supported this by suggesting that we identify students for special education based on structured,
data-based problem solving and flexible service delivery models in which we progress monitor
students in both intervention groups and their classrooms. Barnett et al. also found that the RTI
process can help educators judge a child’s least restrictive environment in a valid manner.
However, Berkeley et al. (2009) criticized using the RTI process to identify SLD because,
without the results of an IQ test, educators might label slow learners as SLD and they could not
factor out other disability categories such as mental retardation, behavioral disorders, or ADHD.
Drame and Xu (2008) were concerned that current RTI practices might be limited in their
application to culturally and linguistically diverse students.
Using RTI to Reduce Numbers in Special Education
Ultimately the purpose of RTI is not to identify students with Specific Learning
Disabilities for special education. Ikeda (2012) purported that sorting kids through tiers to
identify SLD kids is not the purpose of RTI and neither is solving problems for all kids without
consideration of their disability status. After all, there are many goals of RTI, and those vary by
the needs of the schools and the students that are served (Monaghan, 2011).
One of the purposes of RTI is to help students grow so they do not need special education
services. Hughes and Dexter (2011) found that only a few studies showed slight decreases in
special education numbers while most special education rolls remained fairly constant.
However, Denton et al. (2006) found that as many as 40% of the students in the RTI programs
they studied were able to leave special education and return to the general education population.
The programs studied by Denton et al. used Lindamood-Bell intervention strategies. This is
especially pertinent to this research study, as many of the strategies used in the LEAD program
36
are based on Lindamood-Bell techniques. A preponderance of research shows that Response to
Intervention programs are helping students catch up. The scientific literature shows that reading
difficulties of a large majority of pupils can be prevented if students are given intensive
interventions early (Gersten, & Dimino, 2006; Healy, Vanderwood, & Edelston, 2005; Justice,
2006; Vellutino, Scanlon, Sipay, Small, & Fanuele, 2006).
Closing Achievement Gaps in Special Populations
Drame and Xu (2008) expressed the ongoing difficulties many of our school systems
have closing achievement gaps for economically disadvantaged students, minority groups, and
English Language Learners. Abbott and Wills (2012) reported that within an RTI system, 80% of
students are expected to meet academic expectations with 20% of the student body requiring
intervention. However, the reality for urban schools or those in high-poverty areas is much
different. Abbott and Wills reported that only 17% of fourth-grade students and 15% of eighth
grade students who qualify for free and reduced lunch were proficient or better in reading on the
2009 National Assessment of Educational Progress. Prior to RTI implementation schools in the
system being studied that had more than 90% free and reduced lunch rates and had RTI programs
that served between 50%-75% of the school. This makes Tennessee’s three tiered RTI triangle
(see Appendix B) look more like a rectangle (Tennessee Department of Education, 2013). Abbott
and Wills (2012) contended that when more than 20% of students are below academic
expectations resources become strained. In this situation finding resources to provide the explicit,
intensive, systematic, and persistent literacy intervention and monitoring for those who struggle
can be challenging. Although RTI programs are one of the best ways to provide excellent
educational opportunities for students living in poverty, the strain on resources at high poverty

37
schools is often more than schools alone can provide. Fortunately, after a few years of RTI
intervention, many students in this program had their needs met and were able to return to the
classroom, thereby reducing the numbers served to those that more closely matched state
recommendations. In systems that have a high percentage of failing students systems may need
to look at improving Tier 1 instruction, trying to find additional funding to implement larger RTI
programs, or using temporarily using local norms to reduce numbers within their programs.
In the past there has been a great deal of controversy surrounding the seemingly
disproportionate representation of African-American students in special education programs.
Murakami-Ramalho and Wilcox (2011) documented:
In an increasingly ethnically-diverse society, such as the USA, the over-identification of
students due to biases related to racial, cultural, and language background has been
reported (Linan-Thompson et al., 2007). The number of children identified for special
education services decades later after the IDEA amendment, are high and may include
biases, especially for those from linguistically diverse groups. After millions of dollars
have been spent to alleviate educational inequalities, blacks and minorities are still
overrepresented in the referral and special education process. (p. 485)
This over-representation has been documented throughout the years. Proctor, Graves, and Esch
(2012) reasoned that this controversy stems from perceptions that standardized measures of
intelligence, which are often used to help determine students’ eligibility for special education
services, are biased toward African-Americans, and the use of these measures contributes to the
disproportionate representation of African Americans in special education. SLD diagnoses are
the most common in special education. Murukami-Ramalho and Wilcox (2012) proposed that
bypassing intelligence tests that are potentially biased could reduce over-representation of
African-American students in special education programs. As an additional safeguard to reduce
minority over-representation in special education, Drame and Xu (2008) proposed that schools
first evaluate patterns of special education prevalence by specific demographic characteristics,
38
such as socioeconomic status, cultural and linguistic diversity, and staffing and administrative
qualifications and characteristics to reduce the over and under-representation of linguistically
diverse students in RTI programs and special education programs.
Ensuring mastery of the English language for all students, including our English
Language Learners (ELL), is a top priority in our schools. Research suggests that RTI programs
can help ELL reach this goal. In a study of first grade ELL at a school who scored low on
DIBELS tests, Healy (2007) found that after tiered intervention all of the students attained
mastery of reading concepts; some met their reading goals after 12 weeks and others needed 25
weeks, but all met their goal after tiered intervention. The students in the Healy study were not
only English Language Learners but also attended a school with 100% poverty rate, thereby
including them in multiple at-risk categories. Vaughn et al. (2006) found that ELLs who received
small group instruction for 50 minutes a day in groups of three to five students in the areas of
phonemic awareness, letter knowledge, decoding, and comprehension made statistically
significant gains compared to their ELL peers in the control group.
Components of Effective RTI Frameworks
To determine the effectiveness of an RTI program we must first look to effective
intervention programs of the past and determine which components made those programs
successful. Swanson et al. (2012) explained that RTI frameworks must include high-quality
classroom instruction paired with universal screening procedures to identify students with
academic difficulties; secondary intervention that includes a standard, research-based treatment
paired with progress monitoring; and tertiary intervention that is highly intensive and tailored to
individual student needs. RTI researchers explained that the essential requirements of the federal

39
RTI model are (1) to put into place Tiers I, II, and III that provide high quality instruction that
increases in intensity and decreases in numbers throughout the tiers; (2) to use universal
screeners and frequent progress monitoring to determine the extent of student growth; (3) to have
procedures in place to determine the extent to which these interventions are being implemented
with fidelity; and (4) to have teams of knowledgeable educators meet frequently to make
decisions about placement and instruction within these tiers based on the data collected (Denton
et al., 2006; Gettinger & Stoiber, 2008; Jenkins, Schiller, Blackorby, Thayer, & Tilly, 2013;
Powers & Mandal, 2011; Sanger, Freidli, Brunken, Snow, & Ritzman, 2012).
This basic framework was in place in each effective RTI program throughout the
literature. The studies show that effective RTI programs include high quality, research-based,
core instruction in Tier I and intensive small group programs for at-risk students in Tier II. Tier
III programs are highly intensive, explicit, and systematic interventions for a few students who
have severe academic deficits. Students at each of the tiers should receive high-quality
instruction that is differentiated to meet their individual needs and monitored for fidelity (Bender
& Shores, 2007; Cusumano & Mueller, 2007; Daly, Martens, Barnett, Witt, & Olson, 2007;
McKenzie, 2009; Reutenbach, 2008). Differentiation for individual student need was a key
component in successful RTI programs.
Adding to this framework, researchers (e.g. Gettinger & Stoiber, 2008; Hughes & Dexter,
2011; Morris et al., 2000) have found several characteristics common to the best RTI programs.
These characteristics include the federal RTI requirements but also add collaborative planning
and problem solving, teacher commitment, administrative support, and ongoing professional
development to the components needed to create a successful RTI program. Ongoing coaching
and modeling by reading specialists, reading teachers, program consultants, or district leaders

40
were cited as an important part of improving learning throughout the tiers (Denton et al., 2006;
Hughes & Dexter, 2011; Meltzer, 2002; Morris et al., 2000; Stuart & Rinaldi, 2009).
The Three Tiers
The Response to Intervention model requires that students receive a multi-tiered
approach to instruction based upon individual need that is responsive to change as the students’
needs shift. The instruction within all tiers should be research-based and rigorous. Strong
instruction benefits students at all levels and makes schools more effective. The intensity and
amount of time spent in instruction should rise among the tiers as the needs of the students grow.
The number of students served in each tier should decline as the intensity of instruction rises
(Tennessee Department of Education, 2013). Adelman and Taylor (2011) reiterated the need for
the number of students in groups to decline as the interventions become increasingly intense.
They also suggested that one way to understand the three tiers is to consider the purpose of each
tier in an interrelated continuum of overlapping intervention subsystems that promote student
growth and prevent problems, respond to academic problems as early as possible, and treat
severe, chronic, academic issues. Perhaps the easiest way to conceptualize the relationships of
the three tiers used in RTI is by looking at the Tennessee RTI triangle in which it becomes clear
that Tier 1, or core instruction given to all students in the classroom, is designed to meet the
needs of 80% of students, Tier 2, or secondary intervention, is an intensive 30-45 minute group
designed to meet the need of 5%-10% of students, and Tier 3, or tertiary intervention, is a highly
intensive 45-60 minute group designed to meet the needs of 3%-5% of students (Tennessee
Department of Education, 2013). This is the model used to design the program studied for this
research. (See Appendix B for RTI triangle).

41
Tier 1. Many schools that are dealing with large numbers in RTI have a Tier 1 problem.
According to the National Assessment of Educational Progress, 34% of fourth-grade students
have below basic levels of achievement in reading (Ritchey, Silverman, Montanaro, Speece, &
Schatschneider, 2012). Jenkins et al. (2013) suggested schools build a strong, high-quality,
research-based core curriculum in Tier 1 prior to creating an RTI program to reduce the need for
tiered instruction.
Several authors (e.g. Berkeley et al., 2009; Jenkins et al., 2013; Justice, 2006; Sanger et al.,
2012) remarked that the push to increase the quality of core curricular instruction in Tier I will
benefit our schools and that classrooms that differentiate instruction within Tier I get better
results. They also suggested that all students should partake in high quality, core instruction that
is of sufficient quality and rigor that most students will have their needs met in the classroom.
According to RTI requirements all students should engage in high quality Tier 1 instruction
and be assessed with universal screeners that are nationally norm referenced, give percentile
scores, and are sensitive to a rate of improvement in each domain of Reading and Math
(Tennessee Department of Education, 2013). Powers and Mandal (2011) explained that most
students make adequate progress when provided with a rigorous core curriculum and that those
who do not should receive increasingly targeted and intensive interventions provided by
professionals with greater expertise working with students who struggle. Berkeley et al. (2009)
explained that RTI programs that include a strong core curriculum can be used to predict at-risk
students and intervene with them earlier than RTI programs with weak classroom instruction.
Hill, King, Lemons, and Partanen (2012) explained that schools that have poor Tier I instruction
have higher numbers of students in Tier II. Research indicates that Tier 1, often referred to as the

42
preventive tier, includes both whole-group instruction and universal screening that takes place in
the general education classroom and typically meets the needs of 80% of students (Berkeley et
al., 2009; Fuchs & Fuchs, 2007; Tennessee Department of Education, 2013).
Tier 2. Students who score between the 11th through the 25th percentile on the universal
screeners receive additional instruction in Tier 2. The RTI framework in Tennessee suggests that
80%-85% of students should succeed in Tier I, while only 10%-15% should fall into the Tier II
category (Tennessee Department of Education, 2013). The National Center on Response to
Intervention (2010) refers to Tier II as the secondary level of prevention used to address the
challenges of most at-risk students. Berkeley et al. (2009) explained that Tier 2 serves around
15% of students in intensive research-based interventions with progress monitoring. Tier 2 is
referred to as the secondary intervention tier and is given in addition to the primary instruction
received by all students in Tier 1.
Tier 3. According to the Tennessee Department of Education (2013), the third tier,
sometimes called tertiary intervention, should be the most intensive intervention within RTI.
These small groups provide approximately 5% of students with highly intensive instruction
targeted to their individual areas of need (Berkeley et al., 2009). Fewer students are served in
Tier III, but they are given interventions that are highly individualized and intense, often by
interventionists who are highly trained in how to meet the needs of the most severely struggling
students. The Tennessee Department of Education (2013) recommends that Tier III groups are
comprised of three to five students who have either fallen below the 10th percentile on universal
43
screeners or are more than 1 ½-2 years behind grade level. They recommend that only 3%-5% of
students are served in Tier III.
Movement within tiers and data points. RTI research calls for increasing intensity, increasing
amount of time, and decreasing numbers of students as intervention students move from Tiers II
to III (Daly et al., 2007; McKenzie, 2009; Reutenbach, 2008; Scholin & Burns, 2012; Tunmer,
2007). Ideally, students in Tier II will have their needs met and get to return to normal classroom
instruction in Tier 1. However, if students do not grow in Tier II, they will move into Tier III.
Kratochwill, Volpiansky, Clements, and Ball (2007) explained that the combination of
systematic progress monitoring and the student’s response to a given level of intervention
determines movement across tiers. The decisions the team makes regarding whether students are
ready to move to a more intense or less intense intervention are based on student data. The nature
of this movement through the tiers is a flexible, dynamic process that changes based on the
changing needs of the students, which is why frequent collaborative meetings are needed to
determine whether the current forms of intervention are working or not.
In summation, student movement through the tiers is flexible, multidirectional, and based
on individual student progress or lack thereof. The intensity of instruction increases as the level
of tiers increase. Barnett et al. (2004) described intervention intensity as an increase of time,
effort, resources, or use of strategies that are difficult to achieve in a typical classroom, which
makes intervention necessary. Barnett et al. also proposed that due to the nature of the design of
increasing or decreasing intensity in assessment and instruction based on student growth; RTI
could be used not only to determine the least restrictive environment needed by a student to
achieve success, but also which instructional strategies are the least intrusive and most efficient.

44
Data Based Decision Making
Another hallmark of effective RTI programs is the frequent review of data from progress
monitoring assessments, universal screeners, and fidelity reports by a group of stakeholders
interested in the success of each individual child (Daly et al., 2007; McKenzie, 2009; Nellis,
2012; Reutenbach, 2008; Scholin & Burns, 2012). Fidelity reports and progress monitoring
assessments were analyzed to ascertain the relationship between student growth and fidelity of
implementation. These items form a great deal of the data analyzed by RTI teams to make
decisions about changes to instruction within intervention and ultimately movement throughout
the tiers. School-based RTI teams form professional learning communities that make decisions
about the nature and intensity of each student’s services. Students who grow within Tiers II and
III have the opportunity to return to a less-intense tier as they move closer to grade level.
Students who do not grow within Tiers II and III may be referred to special education to be
considered for a diagnosis of Specific Learning Disability (SLD). This relationship between the
data and the collaborative teams was confirmed by Abbott and Wills (2012) when they argued
that teams should:
Own the data. The data are what drives an RTI system. The RTI reading team members need
to embrace all aspects of data collection and use. Data collection procedures should fit well
within the school’s unique environment, and most important, the RTI reading team should
embrace and use the data to guide practice and intervention. (p. 43)
Data based decision making that includes data analysis, collaborative teaming, and problem
solving about how to provide the best intensive, differentiated instruction for each student is an
essential component of RTI (Tennessee Department of Education, 2013).

45
Collaborative Problem Solving and Planning
Collaboration was a theme that emerged across the research of successful RTI programs. Stuart
et al. (2011) found a multidimensional collaborative planning model embedded into the process
of successful RTI programs. This included weekly planning time given to individuals, grade
levels, and school level members to work together. Flexible scheduling also provided additional
time for two teachers per grade level to participate on vertical teams where members of varying
grade levels met to discuss how concepts taught flow throughout the grades. In addition to
collaborative meetings, professional development opportunities were given by experts in the new
instructional strategies. Stuart et al. also found that effective RTI models included frequent
meetings of teachers from various disciplines in which they planned and refined interventions,
reflected on instruction and progress monitoring, and solved problems for students who were not
growing. This type of collaboration and on-going professional development is a hallmark of
successful RTI programs. The RTI program in this study held collaborative meetings monthly,
more often if needed.
In addition to cross curricular teaming and planning, open and frequent communication
among administrators, RTI program leaders, and teachers can strengthen RTI programs. Open
communication can form the foundation for the teacher commitment and administrative support
needed to help programs excel. Frequent, open communication can also make problem-solving
and planning easier. Abbott and Wills (2012) suggested we involve every possible staff member
at the school to help students in intervention programs improve academic outcomes.
Stakeholder involvement and meetings. To be successful, RTI programs must have
support at the school and district level in the form of teacher commitment, strong leadership,
46
instructional coaching, ongoing professional development, and effective management of
physical, human, and fiscal resources (Kavale et al., 2008; Reutenbach, 2008; Shinn, 2007;
Tunmer, 2007; VanDerHeyden et al., 2007). Administrators who support RTI carefully allocate
time, money, space, and personnel to benefit the students in intervention programs.
Response to Intervention programs are district-wide initiatives aimed at helping students
improve their academic outcomes. As such, they need support from teachers, parents, students,
administrators, and other stakeholders at each school to be successful. System-wide educational
initiatives are more successful when school systems create them with input and support from the
teachers and administrators implementing the changes. Teacher and administrator commitment
were listed as key components of effective RTI programs. Teacher commitment was evidenced
in educators’ willingness to participate in ongoing professional development activities and data
teams (Cusumano & Mueller, 2007; Gilbertson, Witt, LaFleur, Singletary, & VanDerHeyden,
2007; Reutenbach, 2008). Schools in which teachers were supported with ongoing, job-
embedded professional development by academic coaches, consultants, or specialists saw the
greatest level of fidelity of implementation in their RTI programs (Cusumano & Mueller, 2007;
Gilbertson et al., 2007; Reutenbach, 2008). For example, Cusumano and Mueller (2007)
expressed that students showed exemplary growth at the schools in which their teachers
participated in reflective coaching with specialists, district workshops were provided for each
program, book studies were available to help teachers improve student learning, ongoing
professional learning communities were embedded in school structures, and horizontal and
vertical data teaming were expected parts of teaching responsibilities.
47
Monthly RTI meetings: people involved. Collaborative teaming is an important and
required part of RTI programs. In Tennessee, an RTI team is required to meet every 4 ½ weeks
to discuss the progress of each child in Tiers II or III (Tennessee Department of Education,
2013). There is some debate about who should engage in the monthly meetings to problem solve
for the intervention students. Barnett et al. (2004) asserted that the people who are analyzing the
amount of effort and intensity required to accelerate the student’s progress should be
knowledgeable about the child and the available resources in that school. Abbott and Wills
(2012) indicated that the team should be made up of the teachers, administrators, and
paraprofessional staff who are involved in the instruction and the intervention. Other researchers
agreed that these decision-making teams should consist of teachers and administrators, but added
school psychologists and parents into the process (Bender & Shores, 2007; Berkeley et al., 2009;
Fuchs et al., 2003).
Monthly RTI meetings: activities and time involved. The RTI program studied held
official meetings every month in compliance with the state RTI requirements (Tennessee
Department of Education, 2013). Frequent changes need to be made to student instruction within
intervention to ensure that students continue to progress at an accelerated rate to catch up with
their typically developing peers. Monthly collaborative meetings are required in state and federal
RTI policy (Tennessee Department of Education, 2013). However, in the RTI program studied,
this type of data-based decision making and problem solving occurs at each school many times
each day by the system RTI coach, the school RTI coordinators, and the interventionists working
with the students.

48
The literature confirms the need for ongoing problem-solving and data-based decision
making within RTI programs. Researchers suggested that monthly RTI team meetings follow a
cyclical process in which the team defines problems, plans and implements interventions to solve
those problems, and evaluates student progress to see if those interventions are working and to
further refine them (Bender & Shores, 2007; Berkeley et al., 2009; Fuchs et al., 2003). The
overall purpose of RTI meetings, whether they were held weekly, monthly, or on an as-needed
basis, was to discuss individual progress within interventions and refine instructional practices to
accelerate that progress (Abbott & Wills, 2012). According to Abbott and Wills (2012) as the
meetings evolved, the collaborative teams began to take on new responsibilities outside the
intervention process in the schools. Abbott and Wills also found that as the teams analyzed the
data, they began to shoulder the responsibility for deciding which assessments, instructional
practices, schedules, and staff would best be used to improve academic outcomes for not only
students within RTI, but also to improve classroom instruction. Therefore, what started as
frequent data analyses designed to help struggling students grow in intervention became a
collaborative, problem-solving model for overall school improvement. Barnett et al. (2004)
added that according to the IDEA mandates, team judgements about service needs are the final
arbiters for making special education decisions that could address the failure of traditional
decision-making models for special education decisions brought forth by the President’s
Commission on Excellence in Special Education. These data teams, whether used to improve
instruction within special education programs, the growth of individual students in intervention
programs, or to promote widespread changes within Tier 1 instruction, are powerful tools for
positive change in our schools.
49
Data Collection in RTI
One of the hallmarks of an RTI program is that the interventions and decisions are guided
by a great deal of student data. Martinez and Young (2011) suggested we identify students early
and assess them frequently. In Tennessee, it is required that RTI students be assessed every 5 to
10 days with progress monitoring assessments (Tennessee Department of Education, 2013).
Balancing the need for progress monitoring data and the need for instructional time is a school
team decision in Tennessee as long as testing occurs within a 10-day period. (Tennessee
Department of Education, 2013). During the year this study was conducted all schools gave
progress monitoring tests on the 10th day of instruction and official team meetings were held
monthly after the second set of progress monitoring had been recorded to determine student
growth.
In addition to traditional, standardized, nationally-normed progress monitoring tests, it is
important to keep anecdotal formative data to ensure that daily instruction is targeted to
individual student need. The interventionists in this study kept daily notes of student progress
and individual student errors so they could address individual student misconceptions in
subsequent lessons. This instructional record provided interventionists and RTI teams with the
information they needed to assist the students and modify instruction on a daily basis. Martinez
and Young (2011) asked RTI instructors whether RTI takes up too much time. The majority of
respondents disagreed that RTI takes up too much time. The respondents left many comments
that the overall RTI process was worth the time, but the paperwork and progress monitoring
components were exceedingly time consuming. One teacher in this study explained, “It’s hard to
get it all done in a school day. The paperwork, the (RTI) documentation… it’s been very trying
this year. It’s hard to manage, but we get it done” (Martinez & Young, 2011). Swanson et al.
50
(2012) reiterated this point when they explained that RTI processes and paperwork strained the
time and resources that could be used to address students’ needs earlier and more effectively.
Using data to differentiate placement and procedures. One of the responsibilities of RTI
teams is to analyze the data and determine the timing, placement, and content of instruction used
to accelerate student growth in RTI. Abbott and Wills (2012) studied the progress of students as
they participated in a set of research-based interventions and found that as second-grade students
improved their decoding and vocabulary skills, their intervention focus moved away from basic
decoding skills toward fluency instruction. As they progressed through the intervention this
required a change in instructional programming from using Early Intervention in Reading to
using Read Naturally. The move from one program to another required the intervention
instructors to be skilled in both programs and to closely monitor student progress to ascertain
when this switch was needed. However, Abbott and Wills found that the students grew more and
the intervention teachers became skilled in both programs, which added to the flexibility of
services available to students.
Research Based Interventions
In Tennessee RTI programs must use scientifically validated, evidence based
instructional practices (Tennessee Department of Education, 2013). This is common across the
nation now that federal RTI policy is in place. Berkeley et al. (2009) reported that 93.3% of
states made specific reference to using research-based intervention programs. Some states
determined their research-based interventions through problem solving teams, while other states
predetermine a list of research-based interventions approved for use with students of similar
51
academic needs (Berkeley et al.). The Tennessee RTI Framework incorporates both strategies by
providing a rubric to determine whether or not individual intervention programs meet state
criteria for being scientifically research based, peer reviewed, systematic, and explicit
(Tennessee Department of Education, 2013). Kratochwill et al. (2007) maintained that the
limited number of evidence-based interventions available created a challenge for those trying to
implement RTI programs.
Research-based literacy instruction. Providing excellent instruction in each of the five
core components of reading was a hallmark of effective RTI literacy programs throughout the
literature (Denton et al.., 2006; Gettinger & Stoiber, 2008; Hughes & Dexter, 2011; Justice,
2006). The five components of literacy instruction that spanned the research were phonics,
phonemic awareness, fluency, vocabulary, and comprehension (Linan-Thompson, Cirino, &
Vaughn, 2007; Morris, Tyner, & Perney, 2000; Swanson et al., 2012). Each component was
addressed differently in each program, but all were present. Swanson et al. (2012) explained each
of the five components of reading in detail. They shared that phonemic awareness strategies that
involve manipulating phonemes within spoken words are highly effective. They also stated that
systematic phonics instruction improves decoding and that fluency instruction needs to include
guided, repeated reading with feedback. Word recognition activities were mentioned. They
suggested that vocabulary needs to be taught both directly and indirectly with repetition and
multiple exposures and that comprehension instruction needs to include seven components. The
seven components of comprehension instruction mentioned are comprehension monitoring,
cooperative learning, graphic organizers, question answering, question generation, focus on story
structure, and summarization (Swanson, 2012). Metzler (2002) also mentioned the importance of
52
using questioning to teach thinking strategies to improve cognition while improving reading
skills.
When Abbott and Wills (2012) studied research-based interventions being implemented
in kindergarten, they found that at the end of the first year of intervention, when teachers only
wanted to focus on social-emotional growth, only 8% of the students met the benchmark. At the
end of Year 2, when teachers allowed paraprofessionals to work with their students on the
reading strategies listed above, 24% were at benchmark. As they continues to implement the
reading strategies listed above, 38% of the students met benchmark by the end of Year 3, and by
the end of the fourth school year, 55% met benchmark (Abbott & Willis). It was more difficult to
find research about RTI implementation in secondary schools. Berkeley et al. (2009) asserted
that most of the RTI research has targeted early childhood and that little empirical evidence
suggests that RTI is appropriate for students in secondary schools. Abbott and Wills (2012)
contended that implementing mastery learning, appropriate error correction, frequent
opportunities for student response and feedback, and increased reading time were effective at all
ages. Kimmel (2008) found that 80%-90% of students met growth criteria in reading and math
after being provided with reading and math intervention that included modeling, guided practice,
and independent practice. Results of a study by O’Conner, Fulmer, Harty, and Bell (2005)
indicated that kindergarten and first grade students who participated in tiered intervention that
included explicit instruction in blending phonemes progressed in their reading skills more
significantly than those who did not receive tiered intervention. Each of these strategies is used
in the RTI program being studied.

53
Testing in RTI: Universal Screening and Progress Monitoring
The effectiveness of instruction in RTI programs can be determined in many ways using
many different assessments. The two major forms of assessments required by federal RTI policy
are universal screening and progress monitoring (Tennessee Department of Education, 2013).
Universal screening is the first step used to identify at-risk students. Hughes and Dexter (2011)
described universal screening as an assessment in which all students are screened in one or more
academic area. Those identified as at risk for learning difficulties are provided additional
evidence-based intervention and progress monitoring in that area. Progress monitoring is an
ongoing assessment given to students in Tiers II and III to determine whether they need to stay in
their current intervention, return to the classroom, or be considered for special education.
Progress monitoring assessments are given frequently and are used to assist with lesson planning
as well as placement. The frequency of universal screening and progress monitoring is fairly
uniform across the nation. Berkeley et al. (2009) reported that most states require universal
screening three times per year and progress monitoring two to four times per month in Tiers II
and III. In Tennessee universal screening takes place three times a year in elementary schools,
and the results are used to determine placement in Tiers II and III as well as to guide instruction
(Tennessee Department of Education, 2013).
Screening instruments. There are many different universal screeners available across the
nation. The state and federal RTI models state that the best way to ensure that screeners are
indeed universal is to require that the tests have been nationally norm referenced and use
percentile rankings (Tennessee Department of Education, 2013). This can add a measure of
uniformity to universal screening and progress monitoring procedures across the nation.
54
The literature emphasized both the DIBELS and AIMSweb tests are appropriate measures to
determine student needs in intervention and future reading success (Abbott & Wills, 2012;
Barnett et al., 2004). Barnett et al. highlighted work by Fuchs and Fuchs, (1986), Shinn and
Bamonto, (1998), and Shapiro and Kratochwill, (2000) that reported curriculum-based
measurements have been successfully used throughout the years as basic methods for examining
readiness for general education and targeting interventions for students with academic problems.
One of these tests, the DIBELS, includes a benchmark score that has a predictive value of future
student success in reading and is used to delineate which students need intervention (Abbott &
Wills, 2012).
Fidelity of Implementation
Another way to determine the effectiveness of RTI programs and appropriate placement
within interventions is to conduct fidelity checks. Fidelity checks are walkthrough-style
observations used to determine the degree to which interventionists are implementing the RTI
program as designed (Drury & Walter, 2014). Ensuring fidelity of implementation across
multiple schools and school systems is both essential and difficult for RTI practitioners. Keller-
Margulis (2012) argued that fidelity of implementation often receives less attention than other
elements of RTI, but it is more important because student growth on progress monitoring tests
may be hard to interpret if the intervention was not evaluated for the recommended frequency,
duration, and intensity of instruction. Bianco (2010) stated that assuring fidelity of
implementation, or the delivery of instruction in the way it was intended to be delivered, is
probably the most challenging goal of districts. Berkeley et al. (2009) concurred that while
fidelity of implementation is critical to the integrity of the RTI process, it is difficult to address
55
and most state models do not have clear fidelity monitoring requirements. RTI programs in
Tennessee are required to monitor fidelity frequently throughout each cycle of intervention to
ensure the use of research-based instruction (Tennessee Department of Education, 2013). If
interventionists modify instruction significantly, the activities used in RTI programs may no
longer fall under the auspices of the original research that made that intervention research-based.
This could result in programs becoming less effective and not complying with the research-based
criteria needed for state approval (Tennessee Department of Education, 2013).
Several studies discussed which criteria should be considered during fidelity monitoring.
Abbott and Wills (2012) argued that it is important to properly train those doing fidelity checks
to ensure reliability; they also advised RTI teams to create a methodology for data collection
within fidelity monitoring to ensure that the critical components of instruction were being
implemented effectively in classrooms and intervention groups. Keller-Margulis (2012) asserted
that fidelity checks should include both direct and indirect measures of implementation from
multiple informants. They also proposed that monitoring needed to take place periodically in
both expected and unexpected visits to get an accurate view of what is taking place in RTI
groups and enable the team to collect data that reflected true implementation of the duration and
intensity of the intervention provide; doing so would help the team determine the actual duration,
frequency, and intensity of intervention the student needs to grow. While differentiating
instruction to target student need and implementing intervention programs with fidelity may
seem at odds, when the fidelity form used to monitor implementation includes several sections
about differentiation, targeting individual needs through lesson planning, providing
individualized feedback, and using appropriate questioning to correct student misconceptions,
fidelity monitoring can be combined with differentiation to help students grow without limiting

56
their instruction to fidelity to a specific instructional program (See Fidelity Report in Appendix
A).
Throughout the literature the importance of monitoring the fidelity of Tier I classroom
instruction became apparent. Hill et al. (2012) suggested that it is hard to evaluate the effect of
intervention programs without information about the quality of Tier I instruction because
students who did not grow in a classroom that provided low-quality Tier I instruction would be
inherently easier to “remediate” than students who were not responding to high-quality Tier I
instruction. Drame and Xu (2008) added that the impact of community, school, classroom, and
teacher factors at each tier of instruction should be taken into account when evaluating student
achievement in instruction and intervention. Thus, fidelity monitoring should take place at all
tiers of instruction and intervention to help determine the best ways to help struggling students
grow. If Tier I instruction is lacking, it should be improved first to help students grow prior to
needing intervention.
As instructional leaders at their schools, administrators and academic coaches are
uniquely qualified to help teachers and interventionists refine instruction at each tier. As such,
administrators and academic coaches are often used to provide fidelity monitoring. Several
suggestions were made throughout the literature as to who should monitor fidelity. Abbott and
Wills (2012) suggested that teams have administrators or academic coaches conduct fidelity
checks because some teachers with excellent teacher effectiveness scores may have difficulty
following intervention protocols that ensure fidelity and that findings of fidelity checks should be
used to drive future professional development and implementation plans. Several programs
studied suggested the use of academic coaches or consultants, tracking forms, frequent
observations, and progress monitoring to ensure the fidelity of the programs (Abbott & Wills,
57
2012; Bianco, 2010). Fidelity monitoring is an important part of refining and improving RTI
programs and classroom instruction.
Administrative Support
Administrators have the ability to support teachers and interventionists throughout the
RTI process. Much of the research cited administrative support as an important factor in RTI
success (Gilbertson et al., 2007; Kavale et al., 2008; O’Conner & Witter-Freeman, 2012;
Reutenbach, 2008; VanDerHeyden, Witt, & Barnett, 2005; Wexler, Vaughn, Edmonds, &
Reutenbach, 2008). One of the most important roles administrators have in RTI programs is to
ensure the fidelity of the program by doing frequent fidelity checks and giving specific corrective
feedback to the stakeholders involved. Gilbertson et al. (2007) noted that it is essential for those
giving feedback after fidelity checks to be very specific and offer detailed corrective feedback.
Teachers and interventionists are often more willing to receive this type of feedback from the
instructional leaders of their schools than outside personnel. Gilbertson et al. found that only
40% of teachers increased their fidelity of RTI implementation after being asked how the
interventions were going, but 60% improved their practice after receiving modeling and specific
feedback about their performance. This type of feedback often means more coming from
administrators, but it may also come from academic coaches, consultants, or reading specialists
who are experts in the interventions being used (Cusumano & Mueller, 2007).
Providing funding. Fidelity monitoring is just one of the ways administrators can support
the implementation of RTI programs. In addition to providing specific feedback to instructors,
administrators can support RTI by helping schools access resources needed to make programs

58
run smoothly. For example, administrators allocate the funding needed to hire academic coaches,
specialists, and high quality interventionists to run programs and provide interventions.
VanDerHeyden et al. (2007) revealed that evidence-based interventions can markedly decrease
the need for special education services when implemented with a high degree of fidelity by
someone highly trained and paid to provide interventions. Finding the money to pay for highly
trained specialists to work with students can be a challenge with our current budgets, especially
because Tennessee RTI mandates come without any state funding to back them (Tennessee
Department of Education, 2013). McKenzie (2009) raised questions about the supply and quality
of interventionists providing RTI programs in our schools. It is challenging to find funding to
procure high quality instructors for our students who need them the most. Thus, administrators
are in a unique position to either procure funding to either hire specialists to provide the
intervention or to provide professional development opportunities that improve interventionists’
ability to help students grow. Both of these options can be a challenge.
Personnel decisions. Abbott and Wills (2012) stated that many schools across the nation
find themselves in a situation where the personnel capacity is grossly outweighed by student
need for intervention. For example, in schools where most of the students were not performing at
benchmark levels, Abbott and Wills found that schools had classroom teachers assume
intervention responsibilities in order to maximize the number of students receiving highly-
structured small group interventions as quickly as possible. Ikeda (2012) argued that while
schools want to implement practices that benefit students as quickly as possible using resources
they already possess, classroom teachers may not have the skills they need to deliver instruction
that is differentiated beyond accommodations in the school setting.
59
Balancing the need for a high-quality Tier I program with highly-intensive interventions
can stress both fiscal and human resources in schools. To deal with this issue the skill and
experience of interventionists across the nation vary widely based on the available resources.
Berkeley et al. (2009) disclosed that in Utah and Virginia, Tier 2 instruction is provided by the
classroom teacher, special education teacher, English-language-learning teacher, speech
language pathologist, or another specialist; while in other states, like South Dakota, interventions
can be provided by any trained staff member under the supervision of a specialist with expertise
in the intervention. In elementary schools in Tennessee interventions can be provided by trained
staff members under the supervision of a certified teacher and in middle and high schools,
interventions must be provided by a certified teacher, though that person need not be certified at
the specific grade level being taught (Tennessee Department of Education, 2013). Adelman and
Taylor (2011) explained that in most schools today interventions are provided by a wide range of
school employed personnel and sometimes community-based providers who work at the schools.
Adelman and Taylor purport that this is due to the long-standing marginalization of student and
learning supports needed to provide for students with academic issues. However, several
researchers argued that schools want to implement practices that are good for struggling students,
but that those students require more instruction than classrooms can provide. Therefore, every
staff member becomes an essential part of the process to provide additional instruction for these
students (Abbott & Wills, 2012; Ikeda, 2012).
Professional Development in RTI
Whether intervention programs use highly-qualified classroom teachers or
interventionists under the supervision of an intervention expert or academic coach, professional
60
development opportunities are an important part of helping those who provide interventions gain
the knowledge and skills needed to implement interventions effectively. Professional
development was a key component of the effective RTI programs studied in the literature
(Abbott & Wills, 2012; Berkeley et al., 2009; Brown-Chidsey & Steege, 2005; Ikeda, 2012;
Kratochwill et al., 2007). Berkeley et al. (2009) confirmed that each state had adopted an RTI
model that included a professional development component within it, although the delivery of
that professional development varied widely. Kratochwill et al. (2007) pointed out that RTI was
a systemic school improvement effort that required change on many levels, including improving
the professional practice of educators; thus, professional development was a centerpiece of
concern.
The need for professional development that improved teaching practices and student
growth was evident throughout the literature. Berkeley et al. (2009) insisted that for an RTI
program to succeed, classroom teachers must assume active responsibility for delivering high
quality instruction of research based interventions while collaborating with special educators and
related service personnel to provide supports for struggling students. However, Berkeley et al.
were concerned that classroom teachers do not currently have the knowledge or skills needed to
do that effectively. Kratochwill et al. (2007) asserted that effective professional development
aimed at improving teacher knowledge must result in changes in student outcomes. Providing
targeted professional development that help both students and teachers improve in their areas of
weakness can be difficult because those weaknesses evolve over time. However, providing
dynamic professional development that is targeted to individual needs is essential to the success
of strong, effective RTI programs. Ikeda (2012) reasoned that schools spend an incredible
amount of energy finding students who are disabled and incredibly little time supporting teachers

61
and teaching them how to intervene for these students once they are identified. RTI programs
must support their interventionists with ongoing professional development to ensure intensive
instruction and effective implementation.
Ongoing professional development activities. Much of the literature mentioned the need
for ongoing professional development opportunities. Kratochwill et al. (2007) indicated that the
lack of training of how to implement of evidence-based practices presented a significant
challenge to RTI implementation. In fact, Kratochwill et al. found that in a sample of 104 school
districts across 12 states many districts adopted research-based programs but only 19% of district
coordinators indicated the schools actually implemented the research-based curriculum that was
adopted. Among the reasons listed for this lack of implementation were the lack of teacher
training materials and required lessons in teaching strategies needed to implement the
curriculum.
To combat this problem Brown-Chidsey and Steege (2005) recommended that RTI
trainings were held over several sessions and emphasize three essential elements: schedule,
teacher learning outcomes, and indicators of mastery of RTI methods. In one system different
teachers were sent to different RTI workshops and required to train the other teachers providing
interventions. This “train the trainers” model reduced the amount of knowledge lost by
interventionist turnover that plagues programs that work with at-risk students (Abbott & Wills,
2012). Ikeda (2012) suggested that strategies with known effect that teachers can implement
tomorrow need to be made available and that the professionals who support the interventionists
and special educators implementing these strategies need even more support.
62
Embedded instructional coaching and professional learning communities. Due to the
demanding nature of using rigorous, intensive, research-based interventions and the dynamic
nature of targeting evolving individual needs, those providing the interventions need ongoing
professional development by someone with explicit knowledge of the interventions, the
instructors, and the students. Kratochwill et al. (2007) asserted that research has shown that
isolated training is insufficient and educators need ongoing support and training to maintain a
high degree of implementation. There are many variables to consider when implementing
professional development for RTI, including training on evidence-based practices that align with
multi-tiered interventions. Kratochwill et al. also expressed that RTI training must include an
understanding of the scheduling, collaboration, curriculum, and leadership needs that drive the
programs. As RTI programs impact areas of student learning and instructional techniques used
throughout the school, the professional development must be embedded with a systems-change
perspective if they are to continually impact student learning.
When making widespread changes to a school system, as educators do when
implementing RTI programs, understanding about the nature of creating lasting change needs to
be taken into account. Fullan (2003) reported that systemic transformation of this kind takes at
least 10 years to implement. Abbott and Willis (2012) confirmed that modifying complicated
school environments to incorporate new research-based strategies and interventions often
requires years rather than months of systematic change.
To implement systemic change that takes years, alters beliefs, and introduces new
research-based practices, it is imperative that we have collaborative professional development
systems in place to create the kind of community in which new strategies are welcomed,
supported, and evolve over time. Wiggins and McTighe (2007) suggested that action research
63
and professional improvement must become an expected part of everyone’s ongoing job
responsibilities. Wiggins and McTighe also recommended that professional development for
teachers take place at their schools as they engage in ongoing action research and study groups,
which could create a source of significant long-term improvement in teaching. The data collected
in RTI could be used to fuel such action research and further study into which instructional
techniques and programs are working best for struggling students.
If interventionists are to engage in this type of long term, research-based, reflective,
professional development, it is crucial that we provide support and guidance as to how to do that.
Knight (2007) expressed that teachers need to continually try improving their teaching practices
if they are to reach all students, and he found that instructional coaching was an efficient method
to help teachers better instruct students with academic difficulties. Knight also affirmed that
changing the way we teach requires changing habits of behavior, which is not easy. Engagement
in professional learning communities in which interventionists can explore new teaching
methods while surrounded by supportive, experienced colleagues and academic coaches who are
experts in implementing these research-based interventions could provide the support needed to
create ongoing change within RTI. Pairing the expertise of instructional coaching with the
support, collaboration, reflection, and data-based decision making practices found in professional
learning communities can make RTI teams stronger and RTI implementation more successful
and more widespread over time.
RTI Scheduling, Frequency, and Group Size
Picking the best interventionists, supporting them with ongoing professional
development, and providing the most effective research-based interventions are arguably the
64
most important ways administrators can help their RTI programs become effective. However,
there are other administrative decisions that leaders must make to improve implementation of
RTI. These include scheduling the interventions in such a way that the recommended frequency,
duration, group size, and attendance in groups are maintained (Wanzek & Vaughn, 2008).
Throughout the literature the research discussed organizational details of effective RTI
programs. One of these details dealt with how many students should be served in each intensive
group. Several studies focused on the effectiveness and feasibility of one-on-one tutoring
programs; in most cases the programs were effective but too costly for many schools to
implement (Elbaum, Vaughn, Hughes, & Moody, 2000; Gettinger & Stoiber, 2008; Morris et al.,
2000). Elbaum et al. (2000) studied different intervention programs to see which type of
instruction was most effective, small group or one-on-one. They found that both made significant
gains, providing a foundation for more students to be served at a lower cost. Most Tier II and
Tier III groups consist of small groups of between 3-5 students (Elbaum et al., 2000; Jenkins et
al., 2013). The Tennessee RTI Framework suggests that Tier II students in elementary schools be
served in groups of fewer than six students and Tier III students be served in groups of one to
four (Tennessee Department of Education, 2013).
Tennessee’s RTI framework also provided recommended amounts of time for students to
engage in each of the tiers. In reading classes at the elementary level students are required to
receive a minimum of 90 minutes in Tier I, an additional 30 minutes in Tier II, and an additional
45-60 minutes in Tier III (Tennessee Department of Education, 2013). The time allotments for
math instruction and intervention are similar. Combined, a student who needs Tier III
intervention should receive around 2½ hours daily in each of these core subjects. This leaves
little time for any other subject. For students who also receive ESL, Special Education, or Speech

65
services, scheduling can be a true challenge. Swanson et al. (2012) confirmed that scheduling
was a commonly cited challenge. Some students with multiple needs are pulled out of the
classroom to receive so many different services that it is difficult for teachers to schedule Tier I
instruction for them. To alleviate this problem Abbott and Wills (2012) reported that one
school’s RTI team created an intervention block that included every available person in the
school. In this study office personnel oversaw students at benchmark level as they did
independent work in the library, classroom teachers remained in their room and provided
interventions for struggling students, while paraprofessionals provided scripted interventions
(Abbott & Wills). The intervention block format is used widely in Upper East Tennessee but not
in the system being studied because it takes time and focus away from Tier I instruction.
Regardless of whether interventions are provided by intervention blocks or pull-out groups,
flexible scheduling of small groups and creative use of staff resources was critical to
implementing effective reading interventions. Flexible, dynamic scheduling is key to creating a
program that evolves with the changing needs of the students. Whether dealing with student
movement through the tiers or interventionist absences, flexible schedule is imperative in RTI
programs. Abbott and Wills disclosed that at one school dealing with frequent interventionist
absences, the RTI team created a backup plan to ensure that small-group interventions happened
daily. This meant that sometimes students were divided into larger temporary groupings or that
small-group intervention time was shortened when there was an assembly or field trip.
The literature documented variation in frequency and group size within RTI
interventions. Berkeley et al. (2009) found that in Delaware, Pennsylvania, Kansas, Arizona, and
Nebraska, Tier 3 interventions were provided in small groups; whereas in Florida, Ohio, Oregon,
and Washington, Tier 3 interventions are individualized. However, in Utah, West Virginia, and

66
Louisiana, systems are allowed to provide Tier 3 interventions in small groups or individually.
Berkeley et al. also found that while state requirements for instructional group size varied, 80%
of the states did have a specified group size per tier. As for frequency of intervention, 66.6% of
states specify guidelines by tier for how frequently interventions needed to occur, which
typically involved the requirement of additional supplementary instruction at Tiers 2 and 3
(Berkeley et al., 2009).
Chapter Summary
A preponderance of research supports the need for Response to Intervention. Justice
(2006) shared that the need for early and intensive multi-tiered intervention programs is proven
by the scientific literature, which shows that the academic difficulties of a large majority of
students can be prevented if early and intensive interventions are provided. RTI teams are at the
heart of a school’s ability to problem-solve and provide a better education for students who
struggle. As Abbott and Wills (2012) said, “When a school is able to clearly define school goals
and the actions that can move the school toward goal attainment, major changes can happen” (p.
44). The literature shows that Response to Intervention can powerfully impact academic
outcomes for students and improve instruction in schools. This could potentially spread positive
systemic changes in our education system and our communities.
67
CHAPTER 3
METHODOLOGY
The purpose of this nonexperimental quantitative study was to identify components of
RTI programs associated with increased student growth in RTI groups. McMillian and
Schumacher (2010) maintained that nonexperimental research design examined relationships
between different phenomena without any direct manipulation of the conditions experienced in
the study. This study was used to examine the relationship between student growth and specific
research-based reading and math interventions, position of interventionists, fidelity of
implementation, group time, and setting. This nonexperimental quantitative study was also used
to explore growth comparisons of students from various demographic groups including gender,
language background, socioeconomic status, and special education status within this RTI
program.
Research Questions and Null Hypotheses
The nonexperimental quantitative design guided the following research questions and null
hypotheses:
Research Question 1: Is there a significant relationship between fidelity scores and student
growth on progress monitoring assessments?
H01: There is no significant relationship between fidelity scores and student growth on
progress monitoring assessments.

68
Research Question 2: Is there a significant difference between student growth on progress
monitoring assessments as compared by the type(s) of reading intervention (basic reading group,
reading fluency group, or reading comprehension group)?
H02: There is no significant difference in student growth on progress monitoring
assessments as compared by the type(s) of reading intervention.
Research Question 3: Is there a significant difference in student growth on progress monitoring
assessments as compared by the type(s) of math intervention (basic math, math computation
group, or math problem solving group)?
H03: There is no significant difference in student growth on progress monitoring
assessments as compared by the type(s) of math intervention.
Research Question 4: Is there a significant difference in student growth on progress monitoring
assessments as compared by interventionist’s position (RTI tutor, part time assistant, full time
assistant, or classroom teacher)?
H04: There is no significant difference in student growth on progress monitoring
assessments as compared by interventionist’s position.
Research Question 5: Is there a significant difference in student growth measured by progress
monitoring assessments as compared by the length of group time (20-29 minutes, 30-44 minutes,
45-59 minutes, or 60 or more minutes)?
H05: There is no significant difference in student growth measured by progress
monitoring assessments as compared by the length of group time.
Research Question 6: Is there a significant difference in student growth on progress monitoring
assessments of pull-out groups and inclusion groups?
69
H06: There is no significant difference in student growth on progress monitoring
assessments of pull-out groups and inclusion groups.
Research Question 7: Is there a significant difference between student growth on progress
monitoring assessments between ESL and non-ESL students?
H07: There is no significant difference between student growth on progress monitoring
assessments between ESL and non-ESL students.
Research Question 8: Is there a significant difference in student growth on progress monitoring
assessments between students in low socioeconomic groups and other socioeconomic groups?
H08: There is no significant difference in student growth on progress monitoring
assessments between students in low socioeconomic groups and other socioeconomic
groups.
Research Question 9: Is there a significant difference in student growth on progress monitoring
assessments for special education students and non-special education students?
H09: There is no significant difference in student growth on progress monitoring
assessments for special education students and non-special education students.
Research Question 10: Is there a significant difference in student growth on progress monitoring
assessments between males and females?
H010: There is no significant difference in student growth on progress monitoring
assessments between males and females.
Population
The population of this study was 715 kindergarten through fourth grade students
participating in Response to Intervention groups at eight elementary schools in an Upper East

70
Tennessee school system. The students involved in this study participated in Tier II or Tier III
response to intervention groups during 2014-2015. The population met all the state criteria for
participation in RTI groups including scores on approved universal screening and initial progress
monitoring tests at or below the 25th percentile on national norms.
The population for this study included all students enrolled in reading and math Tier II
and Tier III RTI groups at each of the eight elementary schools in this system during 2014-15, a
total of 715 students. The only students excluded from the study were those who had incomplete
data because they moved into or out of the school system prior to exiting RTI or finishing the
school year. The number of RTI students studied at each school were: School 1 (N= 92), School
2 (N= 45), School 3 (N= 87), School 4 (N= 166), School 5 (N= 53), School 6 (N= 100), School
7 (N= 44), and School 8 (N= 100).
Instrumentation
AIMSweb and DIBELS tests were used to show student growth based on existing
research that these measures have been proven to be both valid and reliable over time. The OR
(Oral Reading Fluency) test in AIMSweb and the DORF (DIBELS Oral Reading Fluency) tests
were both previously called the CBM-R, or Curriculum-Based Measurement for Reading.
Previous studies identified the CBM-R as a sensitive measure that can adequately assess reading
skill level and growth over time, both of which are important pieces of information needed to
make sound decisions within an RTI framework (Burns & Senesac, 2005; Fuchs, 2003;
Gresham, 2002; Scholin & Burns, 2012). AIMSweb and DIBELS assessments have been tested
for validity and reliability: both tests have a high degree of content, construct, and predictive
validity. While AIMSweb and DIBELS tests have a high concurrent validity with each other,

71
they do not have a high degree of concurrent validity with the EasyCBM tests given as universal
screeners in this program. Therefore, we did not use the EasyCBM test scores in this study.
AIMSweb, DIBELS, and EasyCBM tests were all on the state approved list of RTI
assessments and were rigorously studied by assessment experts at the state level before being
placed on that list. Each of these types of assessments have proven reliable in accurately
assessing the level of response to intervention in this RTI program and in other intervention
programs across the country. To measure the validity of growth scores within each type of
intervention group, the assessments were paired with the students’ corresponding skills deficit.
The AIMSweb tests used for second through fourth grade reading students were the OR (Oral
Reading) for Reading Fluency groups and the MAZE for Reading Comprehension groups. The
OR test is a 1-minute running record in which students read a passage aloud and the teacher
notes how many words are read and marks any missed words on the page. The MAZE test is a 3-
minute reading passage with cloze sentences spaced throughout the passage. Students must pick
one of three vocabulary words in each cloze sentence to make the passage make sense. The
AIMSweb tests used for students in second through fourth grade math groups were the MCOMP
(Math Computation) for math calculations and the MCAP (Math Concepts and Problem Solving)
for math reasoning. The MCOMP is an 8-minute test of basic math fluency problems including
addition, subtraction, multiplication, and division. The MCAP test is an 8-minute test of all other
math concepts including fractions, time, money, word problems, etc.
For kindergarten and first grade math intervention students we used the TEN (Tests of
Early Numeracy) that assess oral counting skills, number identification skills, quantity
discrimination skills, and the ability to fill in a missing number in a series. Each of these 1-
minute tests is a quick check of number sense for students in Basic Math groups. On the Oral

72
Counting test, students count orally to 100, or as high as they can within a minute. The Number
Identification test is a 1-minute test in which students demonstrate their recognition of numerals
to 20. On the Quantity Discrimination test, students are given sets of two numbers and asked to
find the one that the teacher names. For the Missing Number test, students are given sets of three
chronological numbers in which one is missing. They must name the missing number for several
of these sets within the minute allotted.
The DIBELS tests we used for kindergarten through first grade basic reading groups were
the NWF (Nonsense Word Fluency) test that assessed correct letter sound relationships and
whole words read, the PSF (Phoneme Segmentation Fluency) test that assessed the ability to
segment phonemes, and the DORF (DIBELS Oral Reading Fluency) test that assesses oral
reading fluency and is very similar to AIMSweb’s OR test of oral reading fluency. Students in
Basic Reading groups take the NWF or PSF tests. On the NWF test students must read as many
nonsense words and their corresponding letter sound relationships as they can in 1 minute. For
the PSF students need to segment the sounds in a series of two to three phoneme words within a
minute.
Fidelity of implementation was determined using scores from the RTI2 Fidelity Report
(see Appendix A). This form was created to meet the requirements set forth by the Tennessee
Department of Education in 2013. Several areas on the report were taken directly from sample
fidelity check forms found in the RTI2 Framework Implementation Guide (Tennessee
Department of Education, 2013). The form was then created and refined with input from the
school system’s RTI Coordinator, RTI Coach, RTI Coordinators from each school included in
the study and several interventionists. The form was reviewed, revised, and approved by several
school system supervisors, several members of the special education team, the school

73
psychologist, the diagnostician, and principals from every school included in the study. This
district team created the form to serve for both types of fidelity monitoring: documentation and
implementation checks.
Documentation checks are periodic reviews of the paperwork that provide evidence that
the students are receiving instruction as specified by their RTI team. Document checks include
the first six items on the RTI2 Fidelity Report. These items chronicle the interventionist’s efforts
to use research-based activities aligned with the students’ skill deficits while maintaining records
of attendance, progress monitoring scores, anecdotal records of student growth on daily informal
notes, and lesson plans that are current, rigorous, research-based, and aligned with the students’
individual needs.
Implementation checks are also measured using the RTI2 Fidelity Report. Implementation
checks are full, direct observations that include a quick check of the items included on the
document check but also measure whether or not the interactions between students and
interventionists are positive, engaging, well-paced, occur for the full group time, and use
appropriate stimuli-feedback response and questioning techniques. To align with state fidelity
standards, scores of 80% or higher on the Fidelity Report are considered proficient (Tennessee
Department of Education, 2013).
Data Collection
Permission to conduct research was obtained from the director of the school system and
principals of all the schools studied as well as the Institutional Review Board (IRB) of East
Tennessee State University. The Power School database was used to access demographic data
regarding socioeconomic status, ELL status, socioeconomic status, and gender. General
74
demographic data were transferred onto Excel and SPSS with no identifiable information
included.
While participating in the RTI program in 2014-15, students were given assessments to
monitor their progress every 10 days using AIMSweb and DIBELS tests. Student growth was
measured using AIMSweb tests for kindergarten through fourth grade math intervention students
and for second through fourth grade reading intervention students. Student growth scores came
from the DIBELS database for students in kindergarten and first grade reading groups.
Nationally normed percentile scores from these assessments were recorded onto Student
Intervention Plans by school personnel at that time. The school system and the IRB granted
permission for me to gather information from the Student Intervention Plans and transfer them
into Excel and SPSS prior to data analysis with no identifying student, teacher, or school
information included. Data that detailed type of intervention groups received, number of weeks
in intervention, allotted time in group, interventionist position, and group setting were also
collected from the Student Intervention Plans and transferred into Excel and SPSS without
identifiable information included.
During the 2014-15 school year principals, RTI coordinators, and academic coaches
conducted fidelity checks of the intervention groups and denoted their findings on RTI2 Fidelity
Reports. Fidelity percentages were written on the fidelity reports at that time. The school system
and the IRB granted permission for me to gather information from the fidelity reports and
transfer them into Excel and SPSS with no identifying information attached. Each school in the
system kept copies of all Student Intervention Plans and Fidelity Checks from 2014-15 in a
notebook. Due to the retrospective, archival nature of these documents, I was granted permission
by the school system and the IRB to gather this information at the school site and enter the data
75
into Excel and SPSS without identifying information to reduce bias and maintain the
confidentiality of students, interventionists, and schools.
Data Analysis
Prior to conducting the analyses to address the research questions, student growth scores
were calculated. Student growth scores were computed by subtracting the median baseline scores
from the median postintervention scores for each test given. Median baseline scores consisted of
an average of the first three progress monitoring scores received and median postintervention
scores were created using the last three progress monitoring scores given. The progress
monitoring scores used were national percentiles, thus factoring in the normal student growth
expected by typically-developing peers throughout that school year. As it takes a score of zero to
maintain the same position in national percentiles, any student growth score above zero shows a
gain. AIMSweb and DIBELS had already created statistically valid and reliable national
percentiles for typically developing peers for all of their assessments, so this information could
be used to accurately assess whether an intervention student is growing faster or slower than a
typically-developing student.
Student growth was the dependent variable for all research questions and the fidelity of
implementation, interventionist position, group focus, group setting, group time, or demographic
groups were the independent variables. The dependent variable for all research questions was the
mean student growth in RTI.
Research Question 1 was analyzed using a Pearson r correlation between student growth
scores and the average fidelity score. Research Questions 2-5 were analyzed using a series of
Analysis of Variance (ANOVA) tests to determine whether or not a significant difference existed
76
between student growth and the various grouping variables (types of reading intervention, types
of math intervention, interventionist position, and length of group time the student received).
Research Questions 6-10 were analyzed using a series of independent samples t-tests. These
questions examined differences in student growth scores as compared by two groups (inclusion
or pull-out groups, gender, and students who were identified or not identified as having ELL,
special education, or low socioeconomic status). All data were analyzed at the .05 level of
significance.
Chapter Summary
Chapter 3 describes the methodology used in this nonexperimental quantitative research
study. After a brief introduction the research questions and null hypotheses were delineated and
the population was documented. These sections were followed by an explanation of the
instrumentation, data collection, and analysis procedures used to determine the relationships
between student growth scores and the structural, instructional, and demographic variables being
studied within this Response to Intervention program.

77
CHAPTER 4
FINDINGS
The purpose of this study was to identify factors associated with increased student growth
in RTI groups. This study was an examination of the relationship between student growth on
progress monitoring tests and types of reading and math groups, position of the interventionists,
fidelity of implementation, group time, and setting. The study was an exploration of growth
comparisons of students from various demographic groups including gender, language
background, socioeconomic status, and special education status. In this chapter data were
presented and analyzed to answer 10 research questions and 10 null hypotheses. Data were
retrieved from eight schools and 715 students who participated in Response to Intervention
groups during the 2014-15 school year.
Research Question 1
Research Question 1: Is there a significant relationship between fidelity scores and
student growth on progress monitoring assessments?
H01: There is no significant relationship between fidelity scores and student growth on
progress monitoring assessments.
A Pearson correlation coefficient was calculated to test the relationship between student
growth scores and fidelity report scores of K- 4 intervention students across the school system.
The results of the analysis revealed a strong positive relationship between the growth scores of
students (M = 25.38, SD = 23.27) and fidelity of implementation (M = 97.36, SD = 3.72) and a

78
statistically significant correlation [r(719) = .107, p = .004]. The coefficient of determination for
this would be 0.01, indicating that 1% of the variance of the two variables is explained by the
relationship, leaving 99% unexplained. Thus the findings are statistically significant but lack
importance. As a result of the analysis the null hypothesis was rejected. Overall, the results
suggest that students with high growth scores tended to be served in groups in which the
interventionist received high fidelity scores. Figure 1 shows the distribution of fidelity scores and
growth scores.
Figure 1. Distributions of Student Growth Scores and Fidelity of Implementation Scores
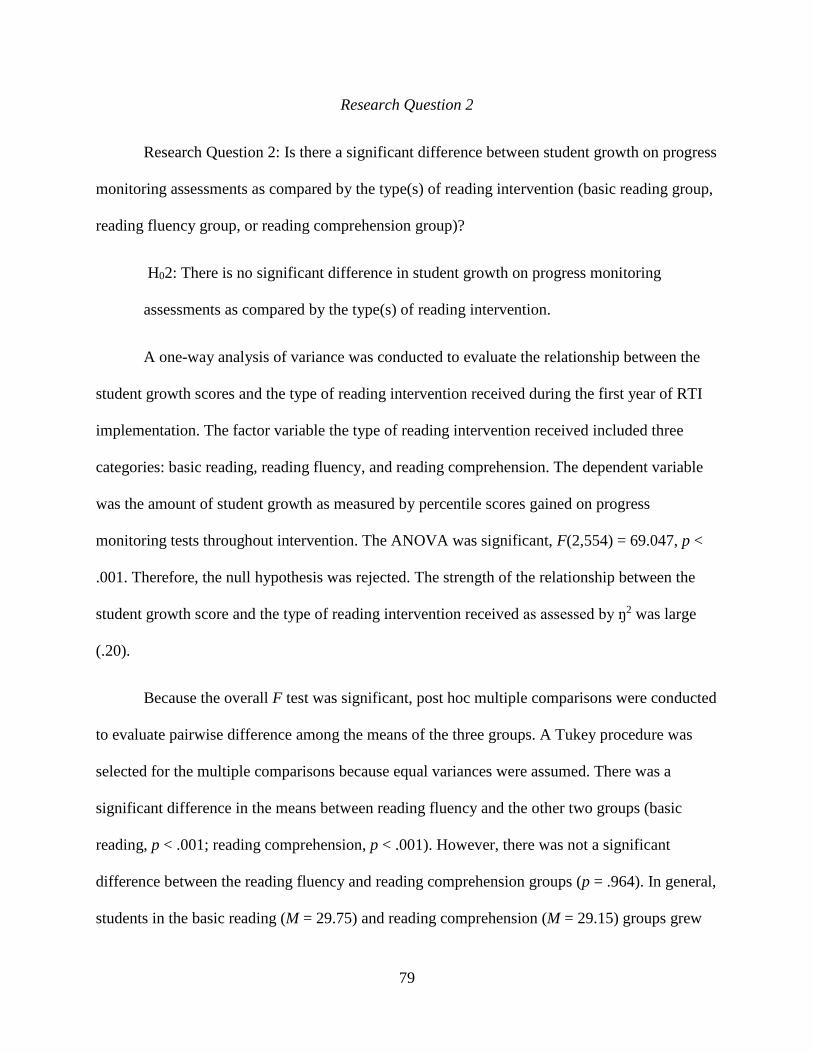
79
Research Question 2
Research Question 2: Is there a significant difference between student growth on progress
monitoring assessments as compared by the type(s) of reading intervention (basic reading group,
reading fluency group, or reading comprehension group)?
H02: There is no significant difference in student growth on progress monitoring
assessments as compared by the type(s) of reading intervention.
A one-way analysis of variance was conducted to evaluate the relationship between the
student growth scores and the type of reading intervention received during the first year of RTI
implementation. The factor variable the type of reading intervention received included three
categories: basic reading, reading fluency, and reading comprehension. The dependent variable
was the amount of student growth as measured by percentile scores gained on progress
monitoring tests throughout intervention. The ANOVA was significant, F(2,554) = 69.047, p <
.001. Therefore, the null hypothesis was rejected. The strength of the relationship between the
student growth score and the type of reading intervention received as assessed by ŋ2 was large
(.20).
Because the overall F test was significant, post hoc multiple comparisons were conducted
to evaluate pairwise difference among the means of the three groups. A Tukey procedure was
selected for the multiple comparisons because equal variances were assumed. There was a
significant difference in the means between reading fluency and the other two groups (basic
reading, p < .001; reading comprehension, p < .001). However, there was not a significant
difference between the reading fluency and reading comprehension groups (p = .964). In general,
students in the basic reading (M = 29.75) and reading comprehension (M = 29.15) groups grew
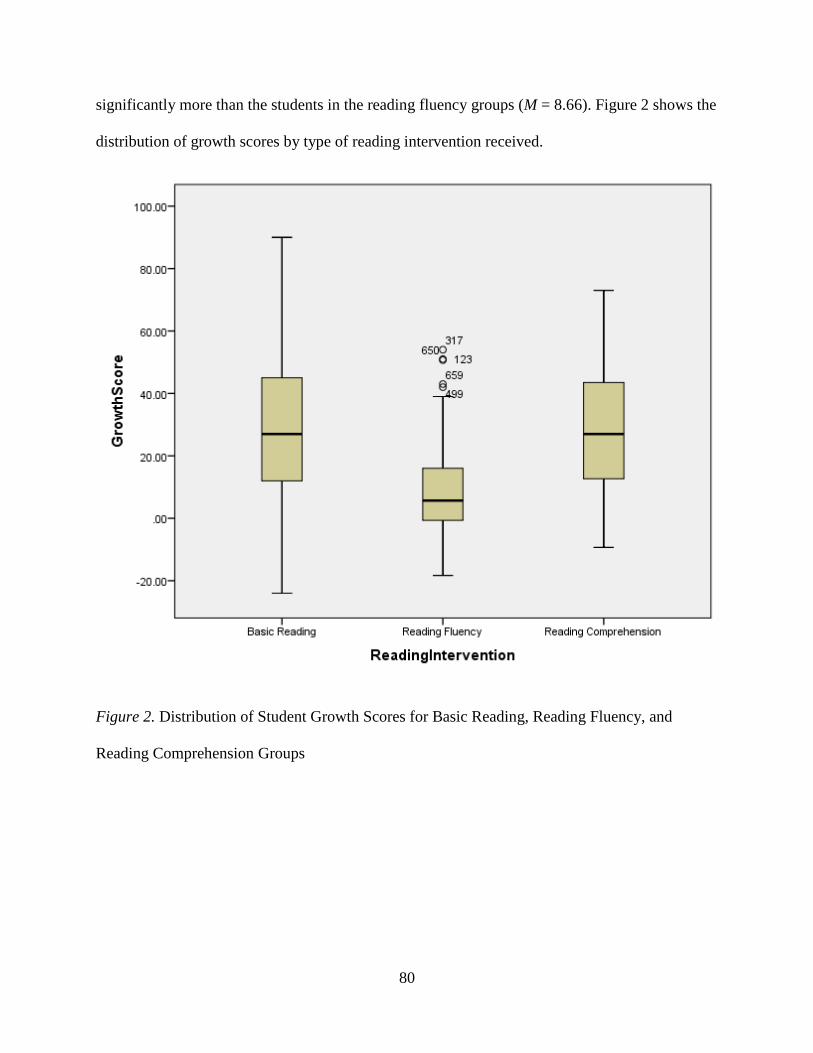
80
significantly more than the students in the reading fluency groups (M = 8.66). Figure 2 shows the
distribution of growth scores by type of reading intervention received.
Figure 2. Distribution of Student Growth Scores for Basic Reading, Reading Fluency, and
Reading Comprehension Groups

81
Research Question 3
Research Question 3: Is there a significant difference in student growth on progress
monitoring assessments as compared by the type(s) of math intervention (basic math, math
computation group, or math problem solving group)?
H03: There is no significant difference in student growth on progress monitoring
assessments as compared by the type(s) of math intervention.
A one-way analysis of variance was conducted to evaluate the relationship between the
student growth scores and the type of math intervention received during the first year of RTI
implementation. The factor variable the type of math intervention received included three
categories: basic math, math computation, and math problem solving. The dependent variable
was the amount of student growth as measured by growth in percentile scores throughout
intervention. The ANOVA was significant, F(2,162) = 5.19, p = .007. Therefore, the null
hypothesis was rejected. The strength of the relationship between the student growth score and
the type of math intervention received as assessed by ŋ2 was medium (.06).
Because the overall F test was significant, post hoc multiple comparisons were conducted
to evaluate pairwise difference among the means of the three groups. A Tukey procedure was
selected for the multiple comparisons because equal variances were assumed. There was a
significant difference in the means between basic math and math problem solving (p = .005).
However, there was not a significant difference between the basic math and math computation
groups (p = .070) or the math computation and math problem solving groups (p = .506).

82
In general, students in the basic math (M = 46.11) groups grew significantly more than the
students in the math computation (M = 36.02) and the math problem solving groups (M = 31.71).
Figure 3 shows the distribution of growth scores by type of math intervention received.
Figure 3. Distribution of Growth Scores for Basic Math, Math Computation, and Math Problem
Solving Groups

83
Research Question 4
Research Question 4: Is there a significant difference in student growth on progress
monitoring assessments as compared by interventionist’s position (RTI tutor, part time assistant,
full time assistant, and classroom teacher)?
H04: There is no significant difference in student growth on progress monitoring
assessments as compared by interventionist’s position.
A one-way analysis of variance was conducted to evaluate the relationship between the
student growth scores and the position of the interventionists. The factor variable the
interventionists’ position included four categories: RTI tutor, part-time assistant, full-time
assistant, and classroom teacher. The dependent variable was the amount of student growth as
measured by percentile scores on progress monitoring tests throughout intervention. The
ANOVA was significant, F(3,719) = 7.102, p < .001. Therefore, the null hypothesis was
rejected. The strength of the relationship between the student growth score and the type of
reading intervention received as assessed by ŋ2 was small to medium (.03).
Because the overall F test was significant, post hoc multiple comparisons were conducted
to evaluate pairwise difference among the means of the three groups. A Tukey procedure was
selected for the multiple comparisons because equal variances were assumed. There was a
significant difference in the means between the part-time assistants and the RTI tutors (p = .002)
and part-time assistants and classroom teachers (p < .001). However, there was not a significant
difference between the RTI tutors and full-time assistants (p = .789) or the RTI tutors and the
classroom teachers (p = .326). There was also not a significant difference between the part-time
and full-time assistants (p = .322) or full-time assistants and classroom teachers (p = .230).

84
Overall, students who had classroom teachers (M = 29.68), RTI tutors (M = 26.08), and full-time
assistants (M = 23.12) as interventionists grew significantly more than the students with part-
time assistants (M = 16.76). Figure 4 shows the distribution of growth scores by interventionist
position.
Figure 4. Distribution of Growth Scores for Students Served by RTI Tutors, Part-time Assistants,
Full-time Assistants, and Classroom Teachers
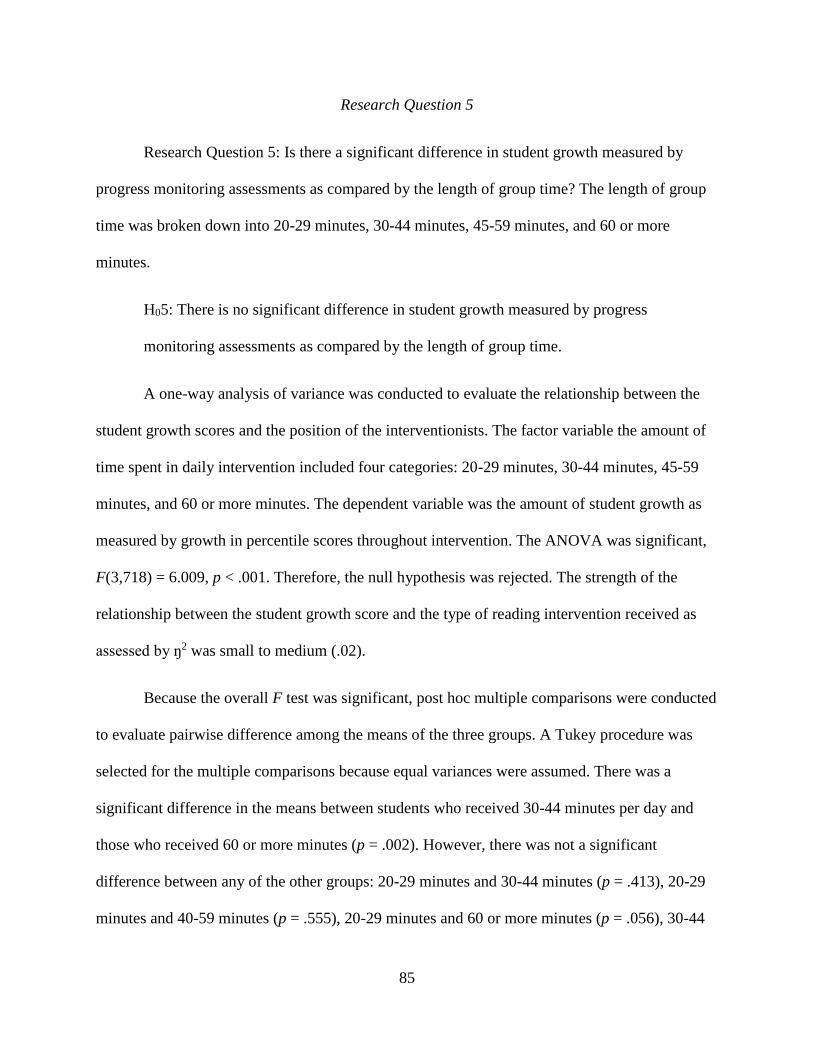
85
Research Question 5
Research Question 5: Is there a significant difference in student growth measured by
progress monitoring assessments as compared by the length of group time? The length of group
time was broken down into 20-29 minutes, 30-44 minutes, 45-59 minutes, and 60 or more
minutes.
H05: There is no significant difference in student growth measured by progress
monitoring assessments as compared by the length of group time.
A one-way analysis of variance was conducted to evaluate the relationship between the
student growth scores and the position of the interventionists. The factor variable the amount of
time spent in daily intervention included four categories: 20-29 minutes, 30-44 minutes, 45-59
minutes, and 60 or more minutes. The dependent variable was the amount of student growth as
measured by growth in percentile scores throughout intervention. The ANOVA was significant,
F(3,718) = 6.009, p < .001. Therefore, the null hypothesis was rejected. The strength of the
relationship between the student growth score and the type of reading intervention received as
assessed by ŋ2 was small to medium (.02).
Because the overall F test was significant, post hoc multiple comparisons were conducted
to evaluate pairwise difference among the means of the three groups. A Tukey procedure was
selected for the multiple comparisons because equal variances were assumed. There was a
significant difference in the means between students who received 30-44 minutes per day and
those who received 60 or more minutes (p = .002). However, there was not a significant
difference between any of the other groups: 20-29 minutes and 30-44 minutes (p = .413), 20-29
minutes and 40-59 minutes (p = .555), 20-29 minutes and 60 or more minutes (p = .056), 30-44

86
minutes and 45-59 minutes (p = .998) and 45-59 minutes and 60 or more minutes (p = .190). In
general, students served for 20-29 minutes per day (M = 37.92) grew significantly more than the
students served for longer periods of time: 30-44 minutes (M = 27.89), 45-59 minutes (M =
28.49), and 60 or more minutes (M = 21.42). Figure 5 shows the distribution of growth scores by
the daily amount of time spent in group.
Figure 5. Distribution of Growth Scores for Students in Groups That Were 20-29 Minutes, 30-
44 Minutes, 45-59 Minutes, or 60 or More Minutes Per Day

87
Research Question 6
Research Question 6: Is there a significant difference in student growth on progress
monitoring assessments of pull-out groups and inclusion groups?
H06: There is no significant difference in student growth on progress monitoring
assessments of pull-out groups and inclusion groups.
An independent-samples t test was conducted to evaluate whether the mean amount of
student growth differs in pull-out groups (outside the classroom) or inclusion groups (inside the
classroom). The student growth on progress monitoring assessments was the test variable, and
the grouping variable was the group setting (pull-out or inclusion). The test was significant,
t(720) = 2.578, p = .010. Therefore, the null hypothesis was rejected. Students in inclusion
groups (M = 29.42, SD = 25.41) scored significantly higher than those in pull-out groups (M =
24.15, SD = 22.46). The 95% confidence interval for the difference in means was -9.27 to -1.26.
The Cohen’s d index was 0.23, which indicated a small effect size. Students in the inclusion
groups tended to make significantly more growth on progress monitoring tests than those who
received instruction outside the classroom. Figure 6 shows the distributions for the two groups.

88
Figure 6. Distribution of Growth Scores for Students that Received Intervention in Pull-Out and
Inclusion Groups
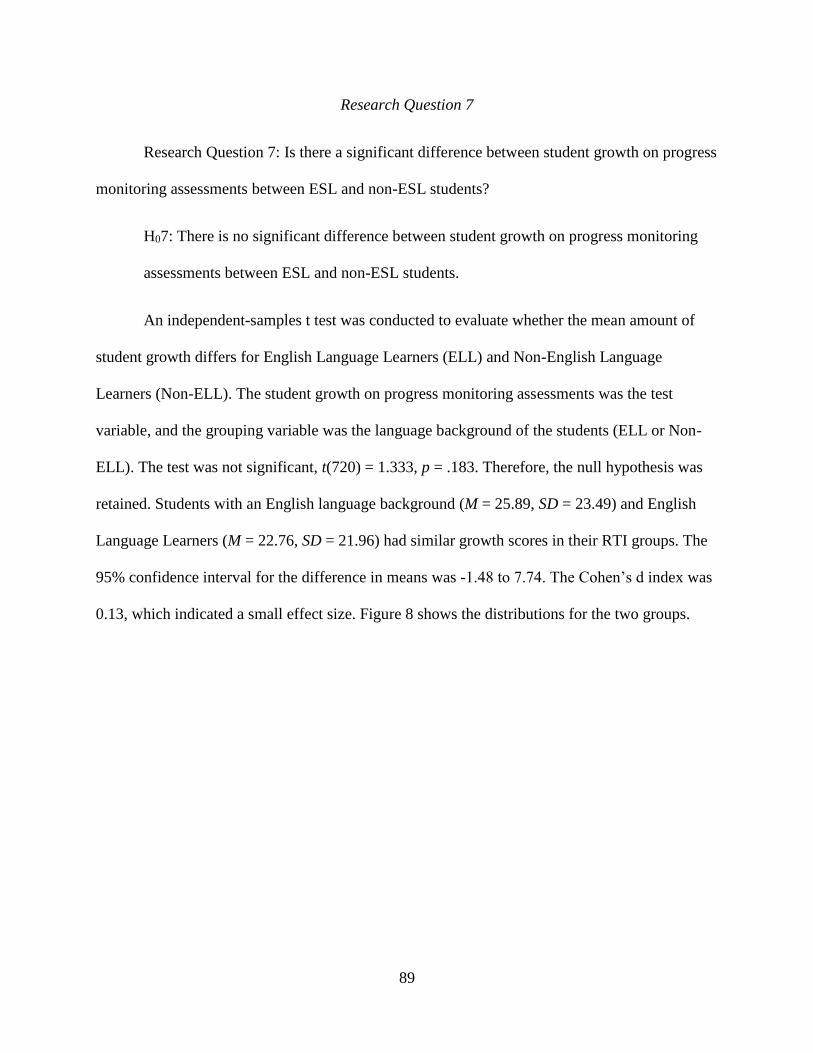
89
Research Question 7
Research Question 7: Is there a significant difference between student growth on progress
monitoring assessments between ESL and non-ESL students?
H07: There is no significant difference between student growth on progress monitoring
assessments between ESL and non-ESL students.
An independent-samples t test was conducted to evaluate whether the mean amount of
student growth differs for English Language Learners (ELL) and Non-English Language
Learners (Non-ELL). The student growth on progress monitoring assessments was the test
variable, and the grouping variable was the language background of the students (ELL or Non-
ELL). The test was not significant, t(720) = 1.333, p = .183. Therefore, the null hypothesis was
retained. Students with an English language background (M = 25.89, SD = 23.49) and English
Language Learners (M = 22.76, SD = 21.96) had similar growth scores in their RTI groups. The
95% confidence interval for the difference in means was -1.48 to 7.74. The Cohen’s d index was
0.13, which indicated a small effect size. Figure 8 shows the distributions for the two groups.
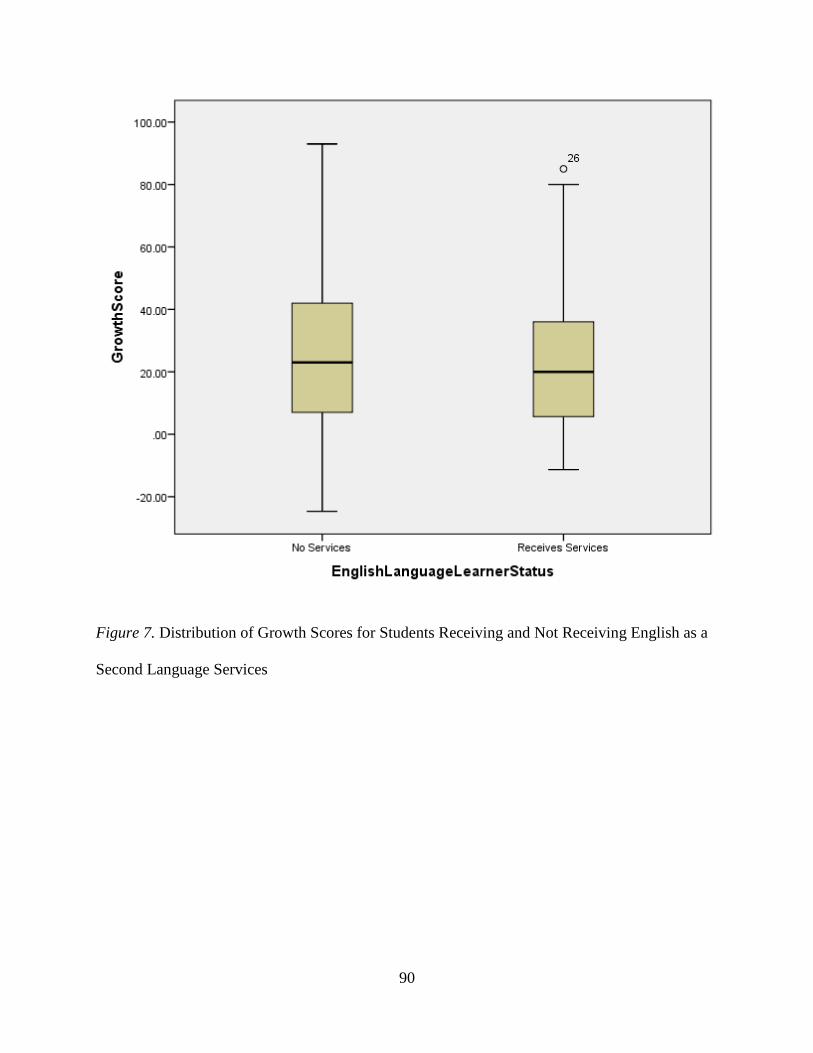
90
Figure 7. Distribution of Growth Scores for Students Receiving and Not Receiving English as a
Second Language Services

91
Research Question 8
Research Question 8: Is there a significant difference in student growth on progress
monitoring assessments between students in the low socioeconomic group and other
socioeconomic groups?
H08: There is no significant difference in student growth on progress monitoring
assessments between students in the low socioeconomic group and other socioeconomic
groups.
An independent-samples t test was conducted to evaluate whether the mean amount of
student growth differs for students with low socioeconomic status or other socioeconomic
statuses as measured by fee-waiver eligibility. The student growth on progress monitoring
assessments was the test variable, and the grouping variable was the socioeconomic status of the
students. The test was significant, t(720) = 4.149, p < .001. Therefore, the null hypothesis was
rejected. Students with low socioeconomic status (M = 23.19, SD = 22.53) scored significantly
lower than those with other socioeconomic statuses (M = 31.14, SD = 24.21). The 95%
confidence interval for the difference in means was 4.19 to 11.71. The Cohen’s d index was 0.35,
which indicated a small to medium effect size. Students in other socioeconomic groups tended to
make significantly more growth on progress monitoring tests than those in the low
socioeconomic group. Figure 8 shows the distributions for the two groups.

92
Figure 8. Distribution of Growth Scores for Students with Low Socioeconomic Status and Other
Socioeconomic Statuses
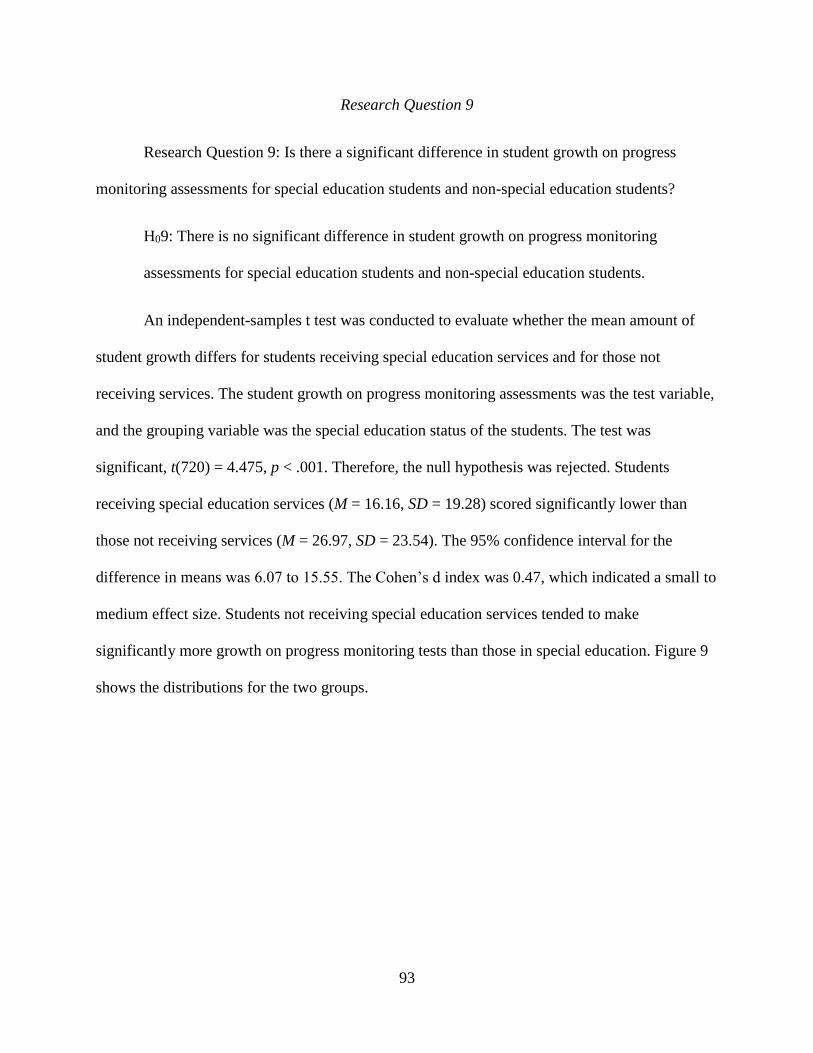
93
Research Question 9
Research Question 9: Is there a significant difference in student growth on progress
monitoring assessments for special education students and non-special education students?
H09: There is no significant difference in student growth on progress monitoring
assessments for special education students and non-special education students.
An independent-samples t test was conducted to evaluate whether the mean amount of
student growth differs for students receiving special education services and for those not
receiving services. The student growth on progress monitoring assessments was the test variable,
and the grouping variable was the special education status of the students. The test was
significant, t(720) = 4.475, p < .001. Therefore, the null hypothesis was rejected. Students
receiving special education services (M = 16.16, SD = 19.28) scored significantly lower than
those not receiving services (M = 26.97, SD = 23.54). The 95% confidence interval for the
difference in means was 6.07 to 15.55. The Cohen’s d index was 0.47, which indicated a small to
medium effect size. Students not receiving special education services tended to make
significantly more growth on progress monitoring tests than those in special education. Figure 9
shows the distributions for the two groups.
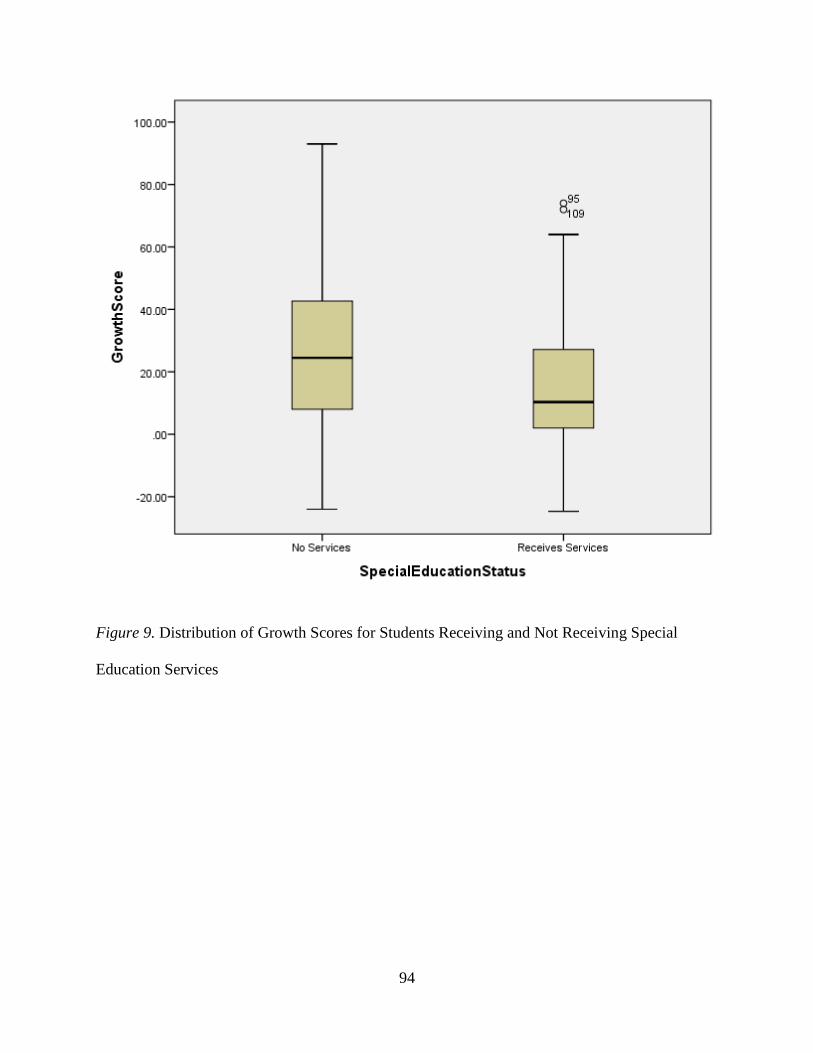
94
Figure 9. Distribution of Growth Scores for Students Receiving and Not Receiving Special
Education Services
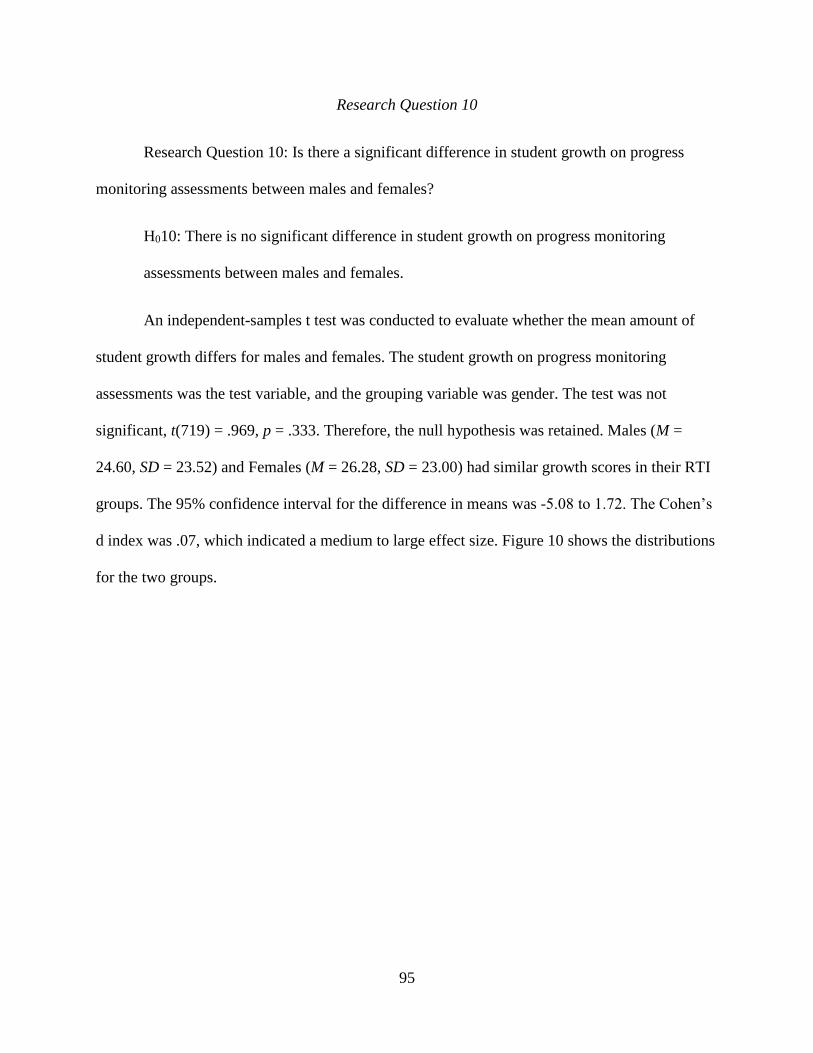
95
Research Question 10
Research Question 10: Is there a significant difference in student growth on progress
monitoring assessments between males and females?
H010: There is no significant difference in student growth on progress monitoring
assessments between males and females.
An independent-samples t test was conducted to evaluate whether the mean amount of
student growth differs for males and females. The student growth on progress monitoring
assessments was the test variable, and the grouping variable was gender. The test was not
significant, t(719) = .969, p = .333. Therefore, the null hypothesis was retained. Males (M =
24.60, SD = 23.52) and Females (M = 26.28, SD = 23.00) had similar growth scores in their RTI
groups. The 95% confidence interval for the difference in means was -5.08 to 1.72. The Cohen’s
d index was .07, which indicated a medium to large effect size. Figure 10 shows the distributions
for the two groups.
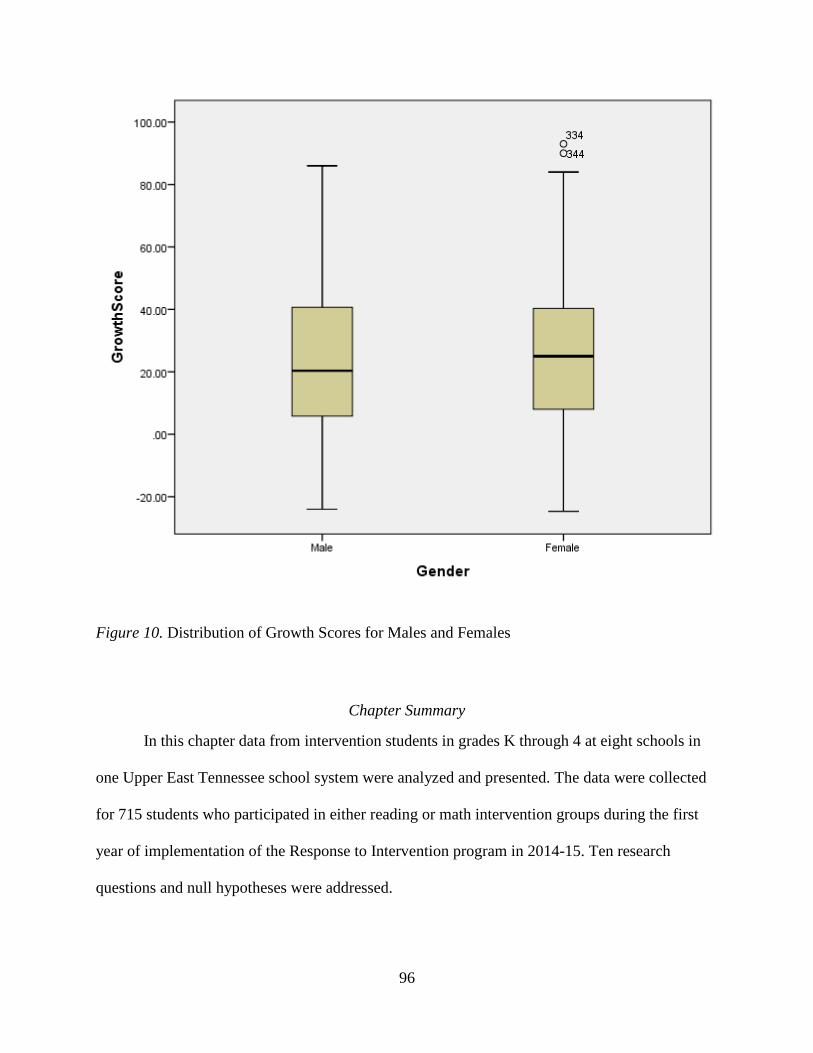
96
Figure 10. Distribution of Growth Scores for Males and Females
Chapter Summary
In this chapter data from intervention students in grades K through 4 at eight schools in
one Upper East Tennessee school system were analyzed and presented. The data were collected
for 715 students who participated in either reading or math intervention groups during the first
year of implementation of the Response to Intervention program in 2014-15. Ten research
questions and null hypotheses were addressed.

97
CHAPTER 5
SUMMARY, CONCLUSIONS, AND RECOMMENDATIONS
This chapter contains a summary and conclusions of the findings as well as
recommendations for readers who may use the results to inform future research and practice for
Response to Intervention programs. The purpose of this study was to examine the relationship
between student growth on progress monitoring tests and types of reading and math groups,
position of the interventionists, fidelity of implementation, group time, and setting. The study
was an exploration of growth comparisons of students from various demographic groups
including gender, language background, socioeconomic status, and special education status. This
study was conducted using data from students who participated in Response to Intervention
groups at eight elementary schools in an Upper East Tennessee school system during the first
year of RTI implementation in 2014-15.
Summary of the Study
The statistical analysis reported in the study was based on 10 research questions and null
hypotheses presented in Chapters 1 and 3. Research Question 1 was analyzed using a Pearson r
correlation. Research Questions 2 through 5 were analyzed using one-way analyses of variance.
Research Questions 6 through 10 were analyzed using independent-samples t tests. Seven
hundred fifteen intervention students participated in this study. The level of significance used in
each test was .05. Findings indicated that intervention students in this study grew more in all
types of intervention than their national peers (Balu et al., 2015). The results also indicated that
students in all subgroups made significant gains. Those of lower socioeconomic status and those

98
receiving special education services grew at a significantly lower rate than their peers who did
not receive free or reduced priced lunches or special education services. English Language
Learners and both genders grew at the same pace as their peers.
Conclusions
This research study focused on 10 research questions. The questions and findings are
discussed below.
Research Question 1:
Is there a significant relationship between fidelity scores and student growth on progress
monitoring assessments?
The results of the correlational analysis revealed a strong positive relationship between an
increase in student growth scores on progress monitoring tests and an increase in fidelity scores
on the Fidelity Report. In general, the research found that students in groups with a higher level
of fidelity of implementation had higher scores on progress monitoring assessments.
State fidelity requirements ask that those working in RTI programs to verify that
research- based instruction takes place in groups 80% of the time (Tennessee Department of
Education, 2013). However, fidelity monitoring requirements in this school system are more
rigorous and holistic than the state fidelity forms. They are based on a variety of proven
instructional practices, such as differentiation, motivation, and questioning techniques designed
to build student engagement and understanding. To receive a high fidelity score for each lesson
interventionists must use research-based reading or math strategies, align instruction with student

99
academic and emotional needs as identified by both quantitative and qualitative data, and
differentiate instruction based on those needs. Interventionists with high fidelity scores must do
this while maintaining appropriate pacing, positive interactions with students, and high levels of
student engagement. To receive high fidelity scores interventionists must also use a variety of
higher order, differentiated questioning aligned with the varying responses of students and
designed to enhance thinking skills. Each of these areas measured on the Fidelity Report aligns
seamlessly with the literature discussions about ensuring a high degree of fidelity of
implementation in intervention groups. In fact, Abbott and Wills (2012) suggested:
Fidelity of implementation checklists include... (a) use of procedures as outlined in the
curriculum guide; (b) instructional features such as modeling, error correction, feedback,
appropriate pacing; (c) instruction of key early literacy skills within lessons (e.g., oral
reading with fluency practice, comprehension checks); and (d) management features such
as the use of praise, transitions, and effective behavior management techniques with
feedback provided to the teachers (pp. 38-39).
When interventionists’ adherence to fidelity was rated using this format, students increased their
reading ability and teachers improved their fidelity of implementation to more than 90% in the
third year of implementation (Abbott & Wills, 2012). Fidelity of implementation in this study
aligns with the Abbott and Wills study but is very different from fidelity of implementation in
many other RTI programs studied. In the program being researched fidelity of implementation
refers more to providing the dynamic, differentiated intervention the learner needs rather than
fidelity to a scripted intervention program or model. For the purposes of this study fidelity means
something vastly different from what it means in other programs. In many systems the term
fidelity means close adherence to a scripted program without deviating from the script. Fidelity
to this program is much more holistic and flexible than that, as shown on the fidelity form in
Appendix A. To teach with fidelity in this program means masterfully using research-based
100
activities, aligning student need and instruction, differentiating instruction based on anecdotal
notes, testing, and observation within the groups. To adhere to this program with fidelity
instructors must build upon students’ strengths and responses in a positive way that encourages
active engagement and learning. Student responses are met with varied, appropriate feedback and
specific stimuli-response questioning techniques that further build on students’ strengths and
differentiate learning to meet individual student needs. Appropriate pacing and documentation
must also take place to receive a high score on a fidelity check. The findings of our study were
vastly different from studies in which fidelity meant merely adherence to a program. This
confirms that increased fidelity in the areas above aligns with increased student growth in
intervention.
Research Question 2:
Is there a significant difference between student growth on progress monitoring
assessments as compared by the type(s) of reading intervention?
A one-way analysis of variance (ANOVA) was conducted to evaluate the relationship
between the student growth scores and the type of reading intervention received during the first
year of RTI implementation. Post hoc multiple comparisons were conducted to evaluate pairwise
differences among the means of the three groups, basic reading, reading fluency, and reading
comprehension. Results indicated that students in all reading groups within the RTI program
made gains and that those in the basic reading and comprehension groups made significant gains.
The post hoc tests indicated that there was a significant difference between the mean student
growth scores in reading fluency and the other two groups. Students in reading fluency groups
101
made fewer percentile gains on progress monitoring assessments than those in basic reading and
reading comprehension groups.
It is positive that on average students in all reading groups made gains. It was not
surprising that students in basic reading and reading comprehension groups made greater gains
than those in fluency groups because this school system has been using reading programs that
focused more on phonics and comprehension strategies prior to RTI implementation, while the
strategies used in fluency groups have only been in place for a few years. Wanzek and Vaughn
(2008) confirmed that in multiple reading intervention studies students consistently made fewer
gains in reading fluency than other areas of reading. Reading fluency incorporates basic reading
and comprehension skills. It is often one of the last components of reading to develop. When
students learn new reading strategies, they sometimes slow their reading pace to attend to
accuracy and comprehension, which results in a dip in reading fluency. Thus, lower fluency
scores paired with high decoding and comprehension scores could indicate that students are
slowing down to process the text. Additional inquiry into changes in self-correction rates could
clarify whether the lag between fluency and comprehension growth is based on students slowing
down to improve their reading or not.
Furthermore, most reading intervention students in this program who struggle to decode
text begin in basic reading groups and move on to reading fluency or reading comprehension
groups if they do not grow enough to exit the program. Many students graduate from basic
reading groups and return to the classroom, making it more likely that the students left in fluency
and comprehension groups are slower to make gains in reading. This helps to clarify the lower
fluency gains and underscores the importance of the high comprehension scores. Flexible
movement of students within and among groups is prevalent in this program as student needs

102
change. This type of fluid movement among groups was noted in Abbott and Wills (2012), in
which students moved from one research-based program to the next as they gained knowledge in
each area.
In general students in this program who have a deficit in basic reading skills begin
receiving basic decoding, phonemic awareness, and phonics instruction using components of
Beverly Tyner’s Small Group Differentiated Instruction or Lindamood-Bell’s Seeing Stars
program including phonemic awareness, phonics, word recognition, and guided reading tasks. If
their needs are not fully met after this instruction, students often progress to reading fluency
groups using Jan Richardson or Fountas and Pinnell style guided reading strategies. Students
who have severe reading comprehension deficits often move from using strategies from the
Lindamood-Bell Visualizing and Verbalizing program into using those similar to the Fountas and
Pinnell Comprehension Toolkit program. Thus, each student receives a variety of research-based
instructional practices throughout their time in reading intervention groups.
Although research-based interventions used by this RTI program are listed, it should be
noted that it is unlikely that any scripted intervention program will provide the significant gains
experienced by this system. Rather than using the aforementioned programs in a formulaic way,
this system used the research-based strategies from each of these programs that were most
appropriate to meet the needs of each individual student to achieve these gains. While each
individual activity used with students was research based and aligned with the core components
of reading and math instruction proposed by the National Reading Panel and National Council of
Teachers of Math, interventionists were given a great deal of flexibility to teach each student
using the methods best suited for him or her.
103
The RTI program being studied currently uses the DIBELS and AIMSweb tests for universal
screening and progress monitoring in math and reading. The literature emphasized both the
DIBELS and AIMSweb tests as appropriate measures to determine student needs in intervention
and future reading success (Abbott & Wills, 2012; Barnett et al., 2004). Barnett et al. highlighted
work by Fuchs and Fuchs (1986), Shinn and Bamonto (1998), and Shapiro and Kratochwill
(2000) that reported that curriculum-based measurements have been successfully used
throughout the years as basic methods for examining readiness for general education and
targeting interventions for students with academic problems. One of these testing batteries, the
DIBELS, includes a benchmark score that has a predictive value of future student success in
reading and is used to delineate which students need intervention (Abbott & Wills, 2012).
To maintain the same position in national percentiles, a typically developing student has a
percentile gain of zero. Any score higher than that indicates a gain. Thus, it is notable that the
basic reading and reading comprehension students have grown, on average, more than 25
percentile points. To qualify for RTI services, students must fall below the 25th percentile on
nationally normed tests. Therefore, the average RTI student in this study, even one with a very
low initial percentile, made enough gains to exit their basic reading or reading comprehension
group.
At the national and state levels, students in reading groups did not grow as much as those
in this study. Balu et al. undertook a massive nationwide study of RTI reading programs for the
U.S. Department of Education in 2015. The Balu et al. study included around 24,000 students
receiving intervention groups in first through third grades across the nation. First graders in the
Balu et al. study made statistically significant, negative gains (M = -0.13, p < .001). In contrast,
the first graders included in our study were provided basic reading groups that made statistically
104
significant, positive gains of nearly 30 points (M = 29.75, p < .001). Second and third grade
reading intervention students in the Balu et al. (2015) study did not make statistically significant
gains (M = 0.04, p = 0.085); (M = -0.01, p = 0.82). When using national percentiles, the cut
scores are adjusted so that the gains of a typically developing student at the 50th percentile revert
to zero. Therefore, it makes sense that in a nationwide study with a large population, like the
Balu et al. study, student gains remained close to zero. However, in our smaller study, students in
the same grades made significant gains in their reading fluency and reading comprehension
groups (M = 8.67, p < .001); (M = 29.15, p < .001). Although both studies use national
percentiles, the discrepancy in results between the two studies suggests that students in this RTI
program are outpacing their national peers significantly in all types of reading intervention.
On the national and state levels universal screening and progress monitoring tests identify
the specific skill deficits to be addressed in intervention groups (Balu et al., 2015; Tennessee
Department of Education, 2013). Although this intervention program does use screening tests to
identify specific skill deficits and address them, both perceptual data and quantifiable data are
used to determine how to best meet student needs. Instruction is modified daily using anecdotal
daily notes about student responses in intervention. Both questioning and instruction are
designed to build from areas of strength into areas to refine. Using the strengths approach boosts
student motivation, commitment, and willingness to attempt increasingly difficult tasks. This
type of instruction and questioning is modeled by academic coaches on a regular basis in group
and reinforced on fidelity checks. This combination of evidence-based, strengths building, and
flexible, instructional design is notably different from the intervention programs with
significantly fewer gains studied by Balu et al. (2015).
105
Research Question 3:
Is there a significant difference in student growth on progress monitoring assessments as
compared by the type(s) of math intervention?
A one-way analysis of variance (ANOVA) was conducted to evaluate the relationship
between the student growth scores and the type of math intervention received during the first
year of RTI implementation. Post hoc multiple comparisons were conducted to evaluate pairwise
differences among the means of the three groups (basic math, math computation, and math
problem solving). Results indicated that students in all math groups within the RTI program
made significant gains. The post hoc tests indicated that there was a significant difference
between the mean student growth scores in the basic math and math problem solving groups, but
not among the other group pairings. Students showed the most growth in the basic math groups,
followed by math computation, and math problem solving, respectively. This aligns with the
growing complexity of concepts taught in each type of math group. To maintain their same
position in national percentiles a typically developing student has a percentile gain of zero. It is
notable that the intervention students in this system have grown by more than 30 or 40 percentile
points on average.
The students in the math groups in this program engage in instruction that is closely
aligned to their specific skill need evidenced on progress monitoring assessments. Each lesson is
designed for those students using an “I do, we do, you do” gradual release of responsibility
lesson format. The gradual release model, initiated by Vygotsky, has become a research-based
instructional format that emphasizes mentoring students to become capable thinkers and learners
by engaging in, and discussing, progressively more difficult tasks with greater levels of
independence (Kong, 2002). By using this model students in the math intervention groups have

106
been exposed to a wide variety of ways to solve each math task and are routinely asked to
explain the reasoning behind their answers or thought processes. The statistically significant and
highly positive growth scores in math intervention groups align with these practices.
Research Question 4:
Is there a significant difference in student growth on progress monitoring assessments as
compared by interventionist’s position (RTI tutor, part-time assistant, full-time assistant, and
classroom teacher)?
A one-way analysis of variance (ANOVA) was conducted to evaluate the relationship
between the student growth scores and the type of position of the person providing the
intervention. Post hoc multiple comparisons were conducted to evaluate pairwise differences
among the means of the four groups: RTI tutor, part-time assistant, full-time assistant, and
classroom teacher. Results indicated that students who were served by classroom teachers made
the most growth, followed by RTI tutors, full-time assistants, and part-time assistants,
respectively. The post hoc tests indicated that there was a significant difference between the
mean student growth scores for students who had part-time assistants as opposed to classroom
teachers or RTI tutors.
In the RTI program being studied classroom teachers are only asked to teach Tier II
students with less need in small groups within the classroom. Tier II and Tier III students with
the lowest scores receive pull-out groups with interventionists who are RTI tutors or assistants.
Classroom teachers are highly trained in their areas and already have relationships with the
students. They also serve the students with lesser need than the students being served by
107
assistants and tutors in Tier III. Fives and Buehl (2010) found that classroom teachers
differentiate instruction more often and more effectively than preservice teachers. Many of the
RTI tutors in this program are preservice teachers. Each of these things could factor in to the
higher gains scores of students taught by classroom teachers.
It makes sense that classroom teachers made higher gains than the other groups, but we
should inquire as to why the gains of the RTI tutors were close behind the teachers, despite being
paid the least and having the highest amount of turnover of all the interventionists. The amount
of job-embedded professional development received by RTI tutors and classroom teachers may
play a role in the significant gains made by their students. RTI tutors are trained in strategies to
differentiate instruction, questioning, and feedback to help students grow in their specific area of
need. The comparable gains between RTI tutors and classroom teachers may be explained, in
part, to the fact that the RTI tutors spend the vast majority of the day working with intervention
groups, whereas many assistants are pulled to do other duties during their work day. While every
type of interventionist in the school system is provided with frequent coaching and modeling of
student specific, research-based instructional strategies; RTI tutors, who teach groups most often,
end up with the most training by academic coaches in how to implement these strategies. The
literature suggests that academic coaching can have a positive influence on student achievement
(Abbott & Wills, 2012; Brown-Chidsey & Steege, 2005; Ikeda, 2012; Knight, 2007; Kratochwill,
2007). Although the scope of this study did not analyze this, perhaps the embedded instructional
coaching the RTI tutors received and the amount of time spent in groups could be having an
effect on the scores of their students. The fact that the student growth scores of those served by
RTI tutors, who are paid significantly less than assistants, were almost as high as students taught
by classroom teachers confirms that higher pay does not necessarily equate with higher gains.
108
Research Question 5:
Is there a significant difference in student growth measured by progress monitoring
assessments as compared by the length of group time?
A one-way analysis of variance (ANOVA) was conducted to evaluate the relationship
between the student growth scores and the amount of time students spent in group daily. Post hoc
multiple comparisons were conducted to evaluate pairwise differences among the means of the
four groups: 20-29 minutes, 30-44 minutes, 40-59 minutes, and 60 or more minutes. Results
indicated that students in the 20-29 minute groups made the most growth and the students who
received 60 or more minutes made the least growth. On the surface it may seem like the students
who were in groups for more time should make the most growth. However, when placing student
in RTI groups, those who score the lowest are placed in Tier III groups that last 45-60 minutes.
Therefore, the lowest performing students are often placed in the 60 minute groups. This makes
it highly likely that the students who have the lowest scores and have not made gains in the past
would be in the groups receiving the most time. Future research could be conducted to ascertain
whether student growth was affected more by group time or initial scores used to place students
in tiers. Another possibility for further study is to see if students lose motivation in longer groups
because they are exposed to their area of difficulty for additional amounts of time. An additional
point to consider is that the only students in this study who received 20-29 minute groups were
Tier II kindergarten students who are served in the classroom. These students are being taught by
their own teachers, so they had higher scores than their Tier III peers at the beginning of
intervention. These students are also being taught the basic reading skills that aligned with the
highest gains scores of all the reading interventions in Research Question 2.
109
Research Question 6:
Is there a significant difference in student growth on progress monitoring assessments of
pull-out groups and inclusion groups?
An independent-samples t test indicated that there was a significant difference in student
growth scores between students in pull-out groups and inclusion groups. Students in inclusion
groups scored significantly higher than those in pull-out groups. Within the RTI program
studied, the only students taught in inclusion groups are the higher-scoring Tier II students in
grades K-2. The Tier II students being served in the classroom are made up of students who
scored higher on the initial testing or started in Tier III groups and grew so much they moved
into Tier II groups. Additionally, most K-2 students being served in the classroom are served in
basic reading groups, which aligned with the highest scores of the three types of reading
intervention in Research Question 2. Thus, it would make sense that these students would make
greater gains than those in the pull-out groups, which include greater numbers of Tier III students
receiving all three types of reading and math intervention. Finally, students in inclusion groups
are being taught by their classroom teacher with whom they already have a working relationship.
Further inquiry into how relationships with interventionists affected student growth in classroom
and pull-out groups could be examined in the future.
Research Question 7:
Is there a significant difference between student growth on progress monitoring
assessments between ESL and non-ESL students?
110
An independent-samples t test indicated that there was no significant difference in student
growth scores between students who are English Language Learners and those who grew up with
English as a first language. The students from both groups had very similar gains scores and the
null hypothesis was retained. This is a very significant finding because it means English
Language Learners in this RTI program are having their needs met at basically the same level of
students who are not receiving ESL services. Closing achievement gaps for special populations is
something people working in RTI programs strive to do and the data indicate that this
intervention is working for the ELL population in this school system as well as the non-ELL
students. The coordinators of this RTI program work closely with ESL teachers to ensure
appropriate placement and instruction for ELL students. Healy (2007) and Vaughn et al. (2006)
both found that English Language Learners who were given basic reading and comprehension
instruction for 50 minutes a day met their reading goals in 12 to 25 weeks. The comparable
growth of English Language Learners and native English speakers underscores the fact that RTI
programs can help English Language Learners, and other struggling students close achievement
gaps in both reading and math.
Research Question 8:
Is there a significant difference between student growth on progress monitoring
assessments between students in the low socioeconomic group and those in other socioeconomic
groups?
An independent-samples t test indicated that there was a significant difference in student
growth scores between students with low socioeconomic status and students from other

111
socioeconomic groups. Although students from the lower socioeconomic group did make
significant gains in intervention, gaining more than 20 percentile points during their time in
intervention, students from other socioeconomic groups outpaced them by 8 percentile points.
Unfortunately, the gap between students of lower socioeconomic status and those of other
socioeconomic statuses was corroborated by nationwide studies of RTI (Abbott & Wills, 2012;
Balu et al., 2015: Drame & Xu, 2008). Conversely, it is uncommon to see the gains of 23
percentile points for Title I students in intervention that we did in our study (Balu et al., 2015).
Research Question 9:
Is there a significant difference in student growth on progress monitoring assessments
for special education students and non-special education students?
An independent-samples t test indicated that there was a significant difference in student
growth scores between students who received special education services and those who did not.
Although students receiving both RTI and Special Education did make more than 16 point gains
on progress monitoring tests during intervention, RTI students who did not receive special
education services surpassed these gains by 10 points. Unfortunately, the gap between special
education students and those not receiving special education has been noted repeatedly in
literature (Drame & Xu, 2008; Hughes & Dexter, 2011). Balu et al. (2015) found that students
receiving special education services in RTI programs had an overall negative pattern of gains
that was worse than that of their typically developing peers. Although our results did show the
special education students trailing behind their typically developing peers, they were still gaining
112
16 percentile points on average, well above those seen in the nationwide RTI study (Balu et al.,
2015).
Research Question 10:
Is there a significant difference in student growth on progress monitoring assessments
between males and females?
An independent-samples t test indicated that there was no significant difference in student
growth scores between males and females. The students from both groups had very similar gains
scores and the null hypothesis was retained. In fact, the two group averages only differed by two
points, which mirrored the difference in sample size of each group. This indicates that
intervention needs are being met equally for both male and female students.
Recommendations for Practice
The findings and conclusions of this study have identified the following conclusions for
practice in Response to Intervention programs:
1. The significant positive correlation between the fidelity scores and the student growth
scores indicates that the method used for checking fidelity of implementation does align
with increased student growth. The fidelity report used in this program is included in
Appendix A and could be used for future fidelity checks.
2. The significant positive growth experienced by students in all types of reading and math
intervention provides evidence that teaching practices in these groups are aligned with
113
student growth on progress monitoring tests. District leaders should analyze the gains in
all areas of math, reading comprehension, and basic reading to maintain and increase the
effectiveness of these types of groups in the future. Although the students in reading
fluency groups made gains, the significant discrepancy between growth experienced by
reading fluency groups and all other types of intervention groups underscores the need to
improve reading fluency instruction in this program.
3. The fact that English Language Learners did not have a statistical difference between
their growth and that of their native English speaking peers shows that the ELL students
are growing to the level of their peers and closing previous achievement gaps. District
leaders should examine why this is happening with English Language Learners and not
Special Education students or students from the low socioeconomic group. This will help
those working in the intervention program to better understand how to support students
from all populations to improve student learning.
4. District leaders should inquire as to why the RTI tutors and classroom teachers had
comparable scores despite the fact that classroom teachers served the highest students in
the program and the RTI tutors serve the lowest students. If this similarity is indeed due
to the coaching component of this intervention program, it would indicate that the
funding for instructional coaching in intervention programs is beneficial. Other systems
may want to consider building instructional coaching or ongoing professional
development into their RTI programs.
114
Recommendations for Future Research
As this study took place during the first year of implementation of this RTI program, this
study should be replicated in subsequent years to see if the growth scores increase once the
program has passed the implementation dip. Studying the same system in future years could also
help determine whether or not the achievement gaps for students in special education or with low
incomes close with added experience in RTI implementation. Most of the studies of RTI
programs found in the literature were based on teacher perceptions of the effectiveness of RTI
programs rather than student growth in RTI. A mixed methods study pairing student growth
results with teacher perceptions of RTI could be useful to help others determine whether or not
teacher perceptions of RTI students align with the students’ actual growth in intervention. This
school system was unique in having instructional coaches dedicated to the RTI program. Further
research on the effectiveness of instructional coaching and interventionist training within RTI
programs would be useful. A study using value added scores rather than percentiles may give
more in-depth and comprehensive results.
Replicating this study in other school systems or at higher grade levels would be
beneficial. Although this study was conducted during the first year of RTI implementation at the
elementary schools, the school system studied, as well as most of the school systems in
Tennessee will begin implementing RTI at the high school level during the 2016-17 school year.
Many systems are searching for information on effective high school RTI programs at this time.
Very little information on high school RTI programs could be found in the literature. Studies on
the effectiveness of RTI programs in grades 6-12 would be a great help to those beginning RTI
in high schools.

115
Additionally, relatively few studies in the literature focus on math intervention programs
relative to the large number of studies done on reading intervention. Although the results of this
study showed great gains in math groups, future studies that aligned specific instructional
strategies in math to student achievement scores would be helpful.

116
REFERENCES
Abbott, M., & Wills, H. (2012). Improving the upside-down Response-to-Intervention triangle
with a systematic, effective, elementary school reading team. Preventing School Failure,
56(1), 37-46. Retrieved November 3, 2015, from
http://www.tandfonline.com/doi/abs/10.1080/1045988X.2011.555793
Adams, J. (2013). Response to intervention framework and progress monitoring process: K-3
regular education teachers’ perception (Doctoral dissertation). Retrieved May 11, 2015,
from http://dc.etsu.edu/etd/1125/
Adelman, H., & Taylor, L. (2011). Moving beyond the three tier intervention pyramid toward a
comprehensive framework for student and learning supports. Center for Mental Health in
Schools at UCLA, 1-11.
Ardoin, S., & Christ, T. (2009). Curriculum-based measurement of oral reading: Standard errors
associated with progress monitoring outcomes from DIBELS, AIMSweb, and an
experimental passage set. School Psychology Review, 38(2), p. 266-283. Retrieved
October 12, 2015, from
http://search.proquest.com.iris.etsu.edu:2048/docview/219656384/fulltextPDF?accountid
=10771
Balu, R., Zhu, P., Doolittle, F., Shiller, E., Jenkins, J., & Gersten, R. (2015). Evaluation of
Response to Intervention Practices for Elementary School Reading (NCEE 2016-4000).
Washington, DC: National Center for Education Evaluation and Regional Assistance,
Institute of Educational Sciences, U.S. Department of Education. Retrieved December
20, 2015, from http://ies.ed.gov/ncee
Barnett, D. W., Daly, E. J., Jones, K. M., & Lentz, F. E. (2004). Response to intervention:
Empirically based special service decisions from single-case designs of increasing and
decreasing intensity. The Journal of Special Education, 38, 66-79. Retrieved November
3, 2015, from http://sed.sagepub.com/content/38/2/66
Barnett, D., Hawkins, R., Prasse, D., Graden, J., Nantais, M., & Pan, W. (2009). Decision-
making validity in response to intervention. In S. R. Jimerson, M. K.
Burns, & A. M. VanDerHeyden (Eds.), Handbook of response to intervention: The
science and practice of assessment and intervention (pp. 106-116). New York, NY:
Springer.
Bender, W. N., & Shores, C. (2007). Implementation of a standard treatment
protocol response to intervention. In Bender, W. N., & Shores, C. (Eds.),
Response to intervention: A practical guide for every teacher (pp. 21-45).
Thousand Oaks, CA: Corwin.
117
Berkeley, S., Bender, W., Gregg-Peaster, L., & Saunders, L. (2009). Implementation of response
to intervention: A snapshot of progress. Journal of Learning Disabilities, 42(1), 85-95.
Retrieved May 11, 2015, from http://ldx.sagepub.com
Bianco, S. (2009). Improving student outcomes: Data-driven instruction and fidelity of
implementation in a response to intervention (RTI) model. Teaching Exceptional
Children Plus, 6(5), 1-13.
Bradley, R., Danielson, L., & Doolittle, J. (2005). Response to intervention. Journal of Learning
Disabilities, 38, 485-486.
Brinker-McCammon, J. (2011). The effect of teacher collaboration and co-teaching on the
response to reading intervention of elementary-aged students with learning disabilities.
University of Northern Colorado, ProQuest.
Brown-Chidsey, R., & Steege, M. W. (2005). Response to intervention: Principles
and strategies for effective practice. New York, NY: Guilford.
Burns, M., & Senesac, B. (2005). Comparison of dual discrepancy criteria to assess response to
intervention. Journal of School Psychology, 43, 393-406.
Cusumano, C., & Mueller, J. (2007). How differentiated instruction helps struggling students.
Leadership, 36(4), 8-10.
Daly, E., Martens, B., Barnett, D., Witt, J., & Olson, S. (2007). Varying intervention delivery in
response to intervention: Confronting and resolving challenges with measurement,
instruction, and intensity. School Psychology Review, 36(4), 562-581.
Denton, C., Fletcher, J., Anthony, J., & Francis, D. (2006). An evaluation of intensive
intervention for students with persistent reading difficulties. Journal of Learning
Disabilities, 39(5), 447-466.
Deno, S., & Gross, J. (1973). The Seward-University project: A cooperative effort to improve
school services and university training. In E.N. Deno (Ed.), Instructional alternatives for
exceptional children (pp. 104-121). Arlington, VA: Council for Exceptional Children.
Drame, E., & Xu, Y. (2008). Examining sociocultural factors in response to intervention
models. Childhood Education, 85(1), 26-32. Retrieved May 11, 2015, from
http://go.galegroup.com.iris.etsu.edu:2048/ps/retrieve.do?sort=RELEVANCE&docType
=Article&tabID=T002&prodId=AONE&searchId=R1&resultListType=RESULT_LIST
&searchType=AdvancedSearchForm&contentSegment=¤tPosition=1&searchResu
ltsType=SingleTab&inPS=true&userGroupName=tel_a_etsul&docId=GALE%7CA1883
52658&contentSet=GALE%7CA188352658
Drury, D., & Walter, J. (2014). The fidelity of implementation of the Response to Intervention
(RTI) process in Missouri Public Schools. (Doctoral Dissertation, Saint Louis
University). Retrieved October 12, 2015, from http://etsu-edu-
primo.hosted.exlibrisgroup.com.iris.etsu.edu:2048/primo_library/libweb/action/display.d
o?tabs=detailsTab&ct=display&fn=search&doc=TN_proquest1553000623&indx=5&recI

118
ds=TN_proquest1553000623&recIdxs=4&elementId=4&renderMode=poppedOut&displ
ayMode=full&frbrVersion=4&dscnt=0&frbg=&scp.scps=scope%3A%2801ETSU%29%
2Cscope%3A%2801ETSU_BEPRESS+%29%2Cprimo_central_multiple_fe&tab=defaul
t_tab&dstmp=1444651106137&srt=rank&mode=Basic&&dum=true&tb=t&vl(freeText0
)=fidelity%20checks%20in%20RTI&vid=01ETSU
Elbaum, B., Vaughn, S., Hughes, M.T., & Moody, S.W. (2000). How effective are one-to-one
tutoring programs in reading for elementary students at risk for reading failure? A meta-
analysis of the intervention research. Journal of Educational Psychology, 92(4), 605-619.
Fisher, D., & Frey, N. (2010). Enhancing RTI: How to ensure success with effective classroom
instruction & intervention. Alexandria, VA: Association for Supervision and Curriculum
Development.
Fives, H., & Buehl, M. (2010). Examining the factor structure of the Teachers’ Sense of
Efficacy Scale. The Journal of Experimental Education, 78, 118-134. Retrieved February
20, 2016, from
http://search.proquest.com.iris.etsu.edu:2048/docview/744643474?accountid=10771
Fuchs, D., Mock, D., Morgan, P. L., & Young, C. L. (2003). Responsiveness-to-intervention:
Definitions, evidence, and implications for the learning disabilities construct. Learning
Disabilities Research & Practice, 18(3), 157-171.
Fullan, M. (2003). The moral imperative of school leadership. Thousand Oaks, CA: Corwin.
Gersten, R., & Dimino, J. (2006). RTI (response to intervention): Rethinking special education
for students with reading disabilities (yet again). Reading Research Quarterly, 41, 99-
108. Retrieved October 12, 2015, from
http://go.galegroup.com.iris.etsu.edu:2048/ps/retrieve.do?sort=RELEVANCE&docType
=Article&tabID=T002&prodId=ITOF&searchId=R2&resultListType=RESULT_LIST&s
earchType=AdvancedSearchForm&contentSegment=¤tPosition=1&searchResults
Type=SingleTab&inPS=true&userGroupName=tel_a_etsul&docId=GALE%7CA149881
663&contentSet=GALE%7CA149881663
Gettinger, M., & Stoiber, K. (2008). Applying a response-to-intervention model for early
literacy development in low-income children. Topics in Early Childhood Special
Education, 27(4), 198-213.
Gilbertson, D., Witt, J., LaFleur Singletary, L., & VanDerHeyden, A. (2007). Supporting
teacher use of interventions: Effects of response dependent performance feedback on
teacher implementation of a math intervention. Journal of Behavioral Education, 16,
311-326.
Gresham, F. (2002). Responsiveness to intervention: An alternative approach to the
identification of learning disabilities. In R. Bradley, L. Danielson, & D.P. Hallahan
(Eds.), Identification of learning disabilities: Research to practice, (pp. 467-519).
Mahwah, NJ: Lawrence Erlbaum Associates.

119
Gresham, F., MacMillan, D., Beebe-Frankenburger, M., & Bocian, K. (2000). Treatment
integrity in learning disabilities intervention research: Do we really know how treatments
are implemented? Learning Disabilities: Research & Practice, 15(4), 198-205.
Griffiths, A. J., Parsons, L. B., Burns, M. K., VanDerHeyden, A., & Tilly, W. D. (2007).
Response to intervention: Research for practice. National Association of State
Directors of Special Education, Inc. Alexandria, VA: Griffiths.
Hauerwas, L., Brown, R., & Scott, A. (2013). Specific Learning Disability and Response to
Intervention: State-Level Guidance. Council for Exceptional Children, 80(1), 101-120.
Healy, K., Vanderwood, M., & Edelston, D. (2005). Early literacy interventions for
English language learners: Support for an RTI model. The California School
Psychologist, 10, 55-63.
Healy, K. (2007). Word identification fluency and nonsense word fluency as predictors of
reading fluency in first grade (Doctoral Dissertation). Retrieved November 1, 2015, from
http://search.proquest.com.iris.etsu.edu:2048/docview/304878344/
Hill, D., King, S., Lemons, C., & Partanen, J. (2012). Fidelity of implementation and
instructional alignment in response to research. Learning Disabilities Research &
Practice, 27(3), 116-124.
Hughes, C., & Dexter, D. (2011). Response to Intervention: A research-based summary. Theory
into Practice, 50, 4-11.
Ikeda, M. (2012). Policy and practice considerations for Response to Intervention: Reflections
and commentary. Journal of Learning Disabilities, 45(3), 274-277. Retrieved April 11,
2015, from http://ldx.sagepub.com.iris.etsu.edu:2048/content/45/3/274
Jenkins, J., Schiller, E., Blackorby, J., Thayer, S.K., & Tilly, W.D. (2013). Responsiveness to
Intervention in reading: Architecture and practices. Learning Disability Quarterly, 36(1),
36-46.
Jimerson, S. R., Burns, M. K., & VanDerHeyden, A. M. (2007). Response to intervention at
school: The science and practice of assessment and intervention. In S. R. Jimerson, M. K.
Burns, & A. M. VanDerHeyden (Eds.), Handbook of response to intervention: The
science and practice of assessment and intervention (pp. 3-9). New York, NY: Springer.
Johnson, E., Humphrey, M., Mellard, D., Woods, K., & Swanson, H. (2010). Cognitive
processing deficits and students with specific learning disabilities: A selective meta-
analysis of the literature. Learning Disability Quarterly, 33(1), 3-18.
Johnson, E., Mellard, D., Fuchs, D., & McKnight, M. (2006). Responsiveness to intervention
(RTI): How to do it. Lawrence, KS: National Research Center on Learning Disabilities.
Justice, L. (2006). Evidence-based practice, Response to Intervention, and the prevention of
reading difficulties. Language, Speech, and Hearing Services in Schools, 37, 284-297.

120
Kavale, K., Kauffman, J., Bachmeier, R., & LeFever, G. (2008). Response-to-Intervention:
Separating the rhetoric of self-congratulation from the reality of specific learning
disability identification. Learning Disability Quarterly, 31, 135-150.
Keller-Margulis, M. (2012). Fidelity of implementation framework: A critical need for response
to intervention models. Psychology in the Schools, 49(4), 342-352.doi
Kimmel, M. K. (2008). The successes and challenges of response to intervention: A case study of
the impact of RTI implementation. (Doctoral dissertation, University of Southern
California, Los Angeles). Retrieved April 11, 2015, from
http://digitallibrary.usc.edu/cdm/ref/collection/p15799coll127/id/46254
Kiser, S. (2011). DIBELS and AIMSweb: A predictability study. (Doctoral Dissertation, Union
University). Retrieved October 12, 2015, from http://etsu-edu-
primo.hosted.exlibrisgroup.com.iris.etsu.edu:2048/primo_library/libweb/action/dlSearch.
do?vid=01ETSU&institution=01ETSU&indx=1&bulkSize=10&pcAvailabiltyMode=fals
e&ct=facet&fn=search&srt=rank&search_scope=Everything&tab=default_tab&search_p
refix=KW&query_text=aimsweb&query=any%2Ccontains%2Caimsweb
Knight, J. (2007). Instructional coaching: A partnership approach to improving instruction.
Thousand Oaks, CA: Corwin.
Kratochwill, T., Volpiansky, P., Clements, M., & Ball, C. (2007). Professional development in
implementing and sustaining multitier prevention models: Implications for Response to
Intervention. School Psychology Review, 36(4), 618-631.
Kong, A. (2002). Scaffolding in a learning community of practice: A case study of a gradual
release of responsibility from the teacher to the students. Paper presented at the Annual
Meeting of the International Reading Association (47th), San Francisco, CA. Retrieved
February 20, 2016, from http://files.eric.ed.gov/fulltext/ED465995.pdf
Kovaleski, J., Gickling, E., Morrow, H., & Swank, P. (1999). High versus low implementation of
instructional support teams: A case for maintaining program fidelity. Remedial and
Special Education, 20, 170-183.
Kutner, M., Greenberg, E., Jin, Y., Boyle, B., Hsu, Y., & Dunleavy, E. (2007). Literacy in
everyday life: Results from the 2003 National Assessment of Adult Literacy (NCES 2007-
480). U.S. Department of Education. Washington, DC: National Center for Education
Statistics. Retrieved February 20, 2016, from
http://files.eric.ed.gov/fulltext/ED495996.pdf
Linan-Thompson, S., Cirino, P., & Vaughn, S. (2007). Determining English Language Learners’
Response to Intervention: Questions and some answers. Learning Disability Quarterly,
30, 185-195.
Lipson, M. & Wixson, K. (2012). To what interventions are students responding? The Reading
Teacher, 66(2), 111-115.
121
Martinez, R. & Young, A. (2011). Response to Intervention: How is it practiced and perceived?
International Journal of Special Education, 26(1), 44-52.
McKenzie, R. (2009). Obscuring vital distinctions: The oversimplification of learning disabilities
within RTI. Learning Disability Quarterly, 32(3), 203-215.
McMillan, J., & Schumacher, S. (2010). Research in education: Evidence-based inquiry (7th ed.).
Upper Saddle River, NJ: Pearson.
Metzler, J. (2000). Adolescent literacy resources: Linking research and practice. Providence,
RI: Northeast and Islands Regional Educational Laboratory.
Monaghan, R. (2011). Implementation of Response to Intervention: How teacher and
administrator conceptions reframe district level policy implementation. (Doctoral
Dissertation). Retrieved November 3, 2015, from
http://search.proquest.com.iris.etsu.edu:2048/docview/894254240/
Morris, D., Tyner, B., & Perney, J. (2000). Early steps: Replicating the effects of a first-grade
reading intervention program. Journal of Educational Psychology, 92(4), 681-693.
Murakami-Ramalho, E. & Wilcox, K. (2011). Response to Intervention: A successful principal’s
approach. Journal of Educational Administration, 50(4), 483-500. Retrieved September
19, 2015, from http://dx.doi.org/10.1108/09578231211238602
National Center on Response to Intervention (2010). Essential components of RTI- A closer look
at Response to Intervention. Retrieved December 2, 2013, from
http://www.rti4success.org
Nellis, L. (2012). Maximizing the effectiveness of building teams in response to intervention
implementation. Psychology in the Schools, 49(3), 245-256.
O’Connor, R. E., Fulmer, D., Harty, K. R., & Bell, K. M. (2005). Layers of reading intervention
in kindergarten through third grade: Changes in teaching and student outcomes. Journal
of Learning Disabilities, 38(5), 440-455. Retrieved on November 1, 2015, from
http://ldx.sagepub.com/content/38/5/440
O’Connor, E., & Witter-Freeman, E. (2012). District level considerations in supporting and
sustaining RTI implementation. Psychology in the Schools, 49(3), 297-310.
Powers, K., & Mandal, A. (2011). Tier III assessments, Data-based decision making, and
interventions. Contemporary School Psychology, 15, 21-33.
Proctor, S., Graves, S., & Esch, R. (2012). Assessing African American students for specific
learning disabilities: The promises and perils of Response to Intervention. The Journal of
Negro Education, 81(3), 268-282.
Reutenbach, C. (2008). Succeed with a response-to-intervention model. Intervention in School
and Clinic, 44, 126-128.

122
Ritchey, K., Silverman, R., Montanaro, E., Speece, D., & Schatscheider, C. (2012). Effects of a
Tier 2 supplemental reading intervention for at-risk fourth-grade students. Exceptional
Children, 78(3), 318-334. Retrieved October 13, 2015, from
http://search.proquest.com.iris.etsu.edu:2048/docview/926833552/fulltextPDF?accountid
=10771
Sanger, D., Freidli, C., Brunken, C., Snow, P., & Ritzman, M. (2012). Educators’ year long
reactions to the implementations of a Response to Intervention (RTI) model. Journal of
Ethnographic & Qualitative Research, 7, 98-107.
Scholin, S., & Burns, M. (2012). Relationship between pre-intervention data and post-
intervention reading fluency and growth: A meta-analysis of assessment data for
individual students. Psychology in the Schools, 49(4), 385-398.
Shapiro, E. (2009). Tiered instruction and intervention in a response-to-intervention model.
Retrieved November 28, 2015, from
http://www.rtinetwork.org/essential/tieredinstruction/tiered-instruction-and-intervention-
rti-model
Shinn, M. (2007). Identifying students at risk, monitoring performance, and determining
eligibility within response to intervention: Research on educational need and benefit from
academic intervention. School Psychology Review, 36(4), 601-617.
Simon, M., & Goes, J. (2013). Dissertation and scholarly research: Recipes for success. Seattle,
WA: Dissertation Success LLC.
Stuart, S. & Rinaldi, C. (2009). A collaborative planning framework for teachers implementing
tiered instruction. Teaching Exceptional Children, 41(4), 52-57.
Stuart, S., Rinaldi, C., & Higgins-Averill, O. (2011). Agents of change: Voices of teachers on
Response to Intervention. International Journal of Whole Schooling, 7(2). 53-73.
Swanson, E., Solis, M., Ciullo, S., & McKenna, J. (2012). Special education teachers’
perceptions and instructional practices in Response to Intervention implementation.
Learning Disability Quarterly, 35(2), 115-126.
Tackett, K. (2009). More than the sum of its parts: A multiple case study on the implementation
of RTI in five sites. (Doctoral dissertation, The University of Texas at Austin). Retrieved
October 12, 2015, from http://etsu-edu-
primo.hosted.exlibrisgroup.com.iris.etsu.edu:2048/primo_library/libweb/action/search.do
?fn=search&ct=search&initialSearch=true&mode=Basic&tab=default_tab&indx=1&dum
=true&srt=rank&vid=01ETSU&frbg=&tb=t&vl%28freeText0%29=fidelity+checks+in+
RTI&scp.scps=scope%3A%2801ETSU%29%2Cscope%3A%2801ETSU_BEPRESS+%
29%2Cprimo_central_multiple_fe
Tennessee Department of Education (2014). Special education framework 2014. Nashville, TN:
Education, Tennessee Department of. Retrieved October 13, 2015, from
http://www.tn.gov/assets/entities/education/attachments/sped_framework_manual.pdf

123
Tennessee Department of Education (2013). TNCore RTI2 framework 2013: Implementation
Guide. Nashville, TN: Education, Tennessee Department of. Retrieved August 5, 2013,
from http://www.tn.gov/education
Tunmer, W. (2007). Recent developments in reading intervention research: Introduction to the
special issue. Reading and Writing, 21, 299-316.
U.S. Department of Education (2009). Implementing RTI using Title I, Title III, and CEIS funds:
Key issues for decision-makers. Washington, DC: Author. Retrieved April 11, 2015, from
http://www2.ed.gov/programs/titleiparta/rtifiles/rti.pdf
Vanderheyden, A. (2011). Technical adequacy of Response to Intervention decisions. Council
for Exceptional Children, 77(3), 335-350.
VanDerHeyden, A., Witt, J., & Barnett, D. (2005). The emergence and possible futures of
response to intervention. Journal of Psychoeducational Assessment, 23, 339-361.
VanDerHeyden, A., Witt, J., & Gilbertson, D. (2007). A multi-year evaluation of the effects of a
response to intervention (RTI) model on identification of children for special education.
Journal of School Psychology, 45, 225-256.
Vaughn, S., Cirino, P. T., Linan-Thompson, S., Mathes, P. G., Carlson, C. D., Cardenas-Hagan,
E., Pollard-Durodola, S. D., Fletcher, J. M., & Francis, D. J. (2006). Effectiveness of a
Spanish intervention and an English Intervention for English-language learners at risk for
reading problems. American Educational Research Journal, 43(3), 449-487. Retrieved
November 1, 2015, from http://aer.sagepub.com/content/43/3/449
Vaughn, S., Linan-Thompson, S., & Hickman, P. (2003). Response to instruction as
a means of identifying students with reading/learning disabilities. Exceptional Children,
69(4), 391-409.
Vaughn, S., & Fuchs, L. S. (2006). Response to “Competing views: A dialogue on
Response to Intervention.” Assessment for Effective Instruction, 32(1), 58-61.
Vellutino, F., Scanlon, D., Sipay, E., Small, S., & Fanuele, D., (2006). Response to intervention
as a vehicle for distinguishing between children with and without reading disabilities:
Evidence for the role of kindergarten and first-grade interventions. Journal of Learning
Disabilities, 39(2). 157-169.
Wanzek, J, & Vaughn, S. (2008). Response to varying amounts of time in reading intervention
for students with low response to intervention. Journal of Learning Disabilities, 41(2),
126-142. doi: 10.1177/0022219407313426.
Wexler, J., Vaughn, S., Edmonds, M., & Reutenbach, C. (2008). A synthesis of fluency
intervention for secondary struggling readers. Reading and Writing, 21, 317-347.
Wiggins, G., & McTighe, J. (2007). Schooling by design: mission, action, and achievement.
Alexandria, VA: Association for Supervision and Curriculum Development.
124
Zirkel, P. (2011). RTI confusion in the case law and the legal commentary. Learning Disability
Quarterly, 34(4), 242-247. doi: 10.1177/0731948711421760.
Zirkel, P., & Thomas, L. (2010). State laws and guidelines for implementing RTI. Teaching
Exceptional Children, 43(1), 60-73.
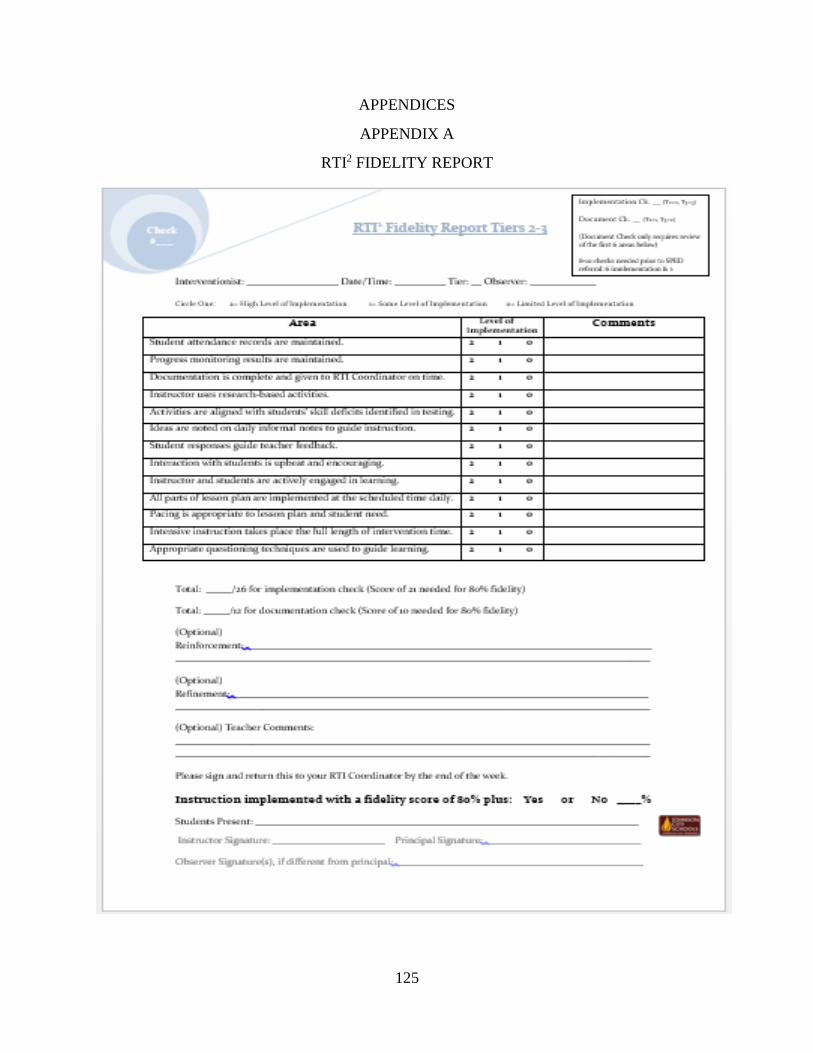
125
APPENDICES
APPENDIX A
RTI2 FIDELITY REPORT
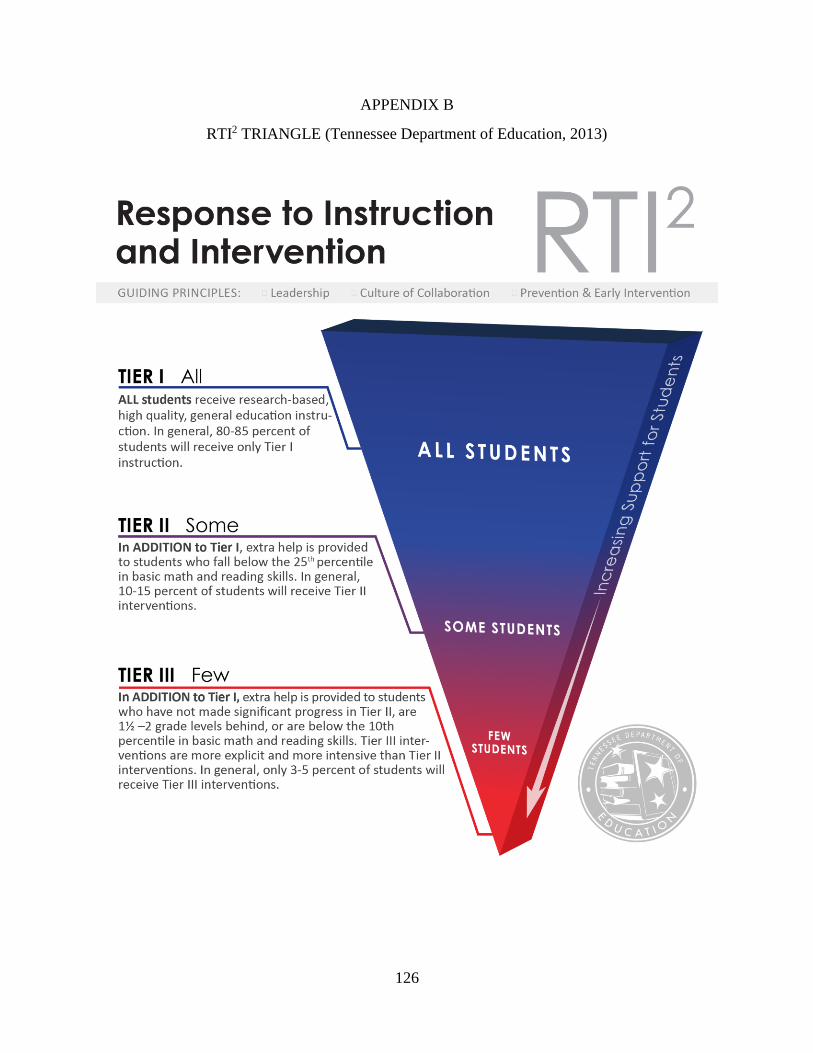
126
APPENDIX B
RTI2 TRIANGLE (Tennessee Department of Education, 2013)
127
VITA
ALLISON L. GARDENHOUR
Education: Doctor of Education, Educational Leadership
East Tennessee State University
Johnson City, TN 2016
Master of Education, Educational Leadership
East Tennessee State University
Johnson City, TN 2011
Bachelor of Science, Elementary Education
Indiana University School of Education, Indianapolis
Indianapolis, Indiana 1998
Professional Experience: Response to Intervention Coach, Grades K-12
Johnson City Schools, TN
2014- Present
LEAD Literacy Program Coordinator, Grades K-6
Johnson City Schools, TN
2011-14
Lindamood-Bell Coach, Title I Schools, Grades K-4
Johnson City Schools, TN
2009-11
Lindamood-Bell Lead Teacher, Mountain View Elementary
Johnson City Schools, TN
2007-2009
Elementary Teacher, Mountain View Elementary
Johnson City Schools, TN
1999-2007
Elementary Teacher, Arlington Elementary
Indianapolis, IN
1998-1999
Presentations: TNDOE RTI2 Regional Panel, 2016
Kingsport City Schools

128
UETCTM RTI2 Math Workshop, 2015
Upper East TN Council of Mathematics
Johnson City Schools
RTI2 Literacy and Math Workshops, 2014-Present
Johnson City Schools
RTI2 Assessment and Paperwork Workshops, 2014-Present
Johnson City Schools
RTI2 and Special Education Workshops, 2014-Present
Johnson City Schools
RTI2 Coordinators’ Workshops, 2014-Present
Johnson City Schools
RTI2 Readiness for High School and RTI2 Assessment, 2013-15
North Greene High School, Greene County Schools
RTI2 Reading Comprehension Strategies, 2014-15
Ottway Elementary/Middle School, Greene County Schools
Lindamood-Bell/LEAD Program Literacy Workshops, 2007-2015
Johnson City Schools
Teaching Struggling Readers for America Reads Tutors, 2012
East Tennessee State University
Professional Memberships: Johnson City Education Association, President (JCEA/NEA)
Parent Teacher Association, Board Member (PTA)
South Side Elementary
International Reading Association (IRA/ILA)
Tennessee Reading Association (TRA)
Indiana Reading Association (IRA)
Tennessee Earth Science Teacher Association (TEST)
Tennessee Earth, Aquatic, and Marine Science Assn. (TEAMS)