student absenteeism - igc · student absenteeism and school health programs in bihar by prabhat...
TRANSCRIPT

Working paper
Student Absenteeism and School Health Programmes in Bihar
Prabhat Ghosh Anjini Kochar
March 2013

Student absenteeism and School Health Programs in Bihar
By
Prabhat Ghosh† and Anjini Kochar††
December 2012 (revised February 2013)
†Asian Development Research Institute ††Stanford University This research was generously funded by a grant from the International Growth Center (Bihar Program). All opinions are those of the authors and they alone are responsible for any errors. The help and support received from Dr. Shaibal Gupta and researchers at ADRI is gratefully acknowledged.
1
1. Introduction This paper has two objectives. First, it provides information on student absenteeism in elementary school in two districts of the North Indian state of Bihar. While teacher absenteeism has received a significant amount of attention in the literature, less is known about student absenteeism. Knowledge of student absenteeism is critical for policies that attempt to improve schooling outcomes. It also helps the design of other programs that deliver services, such as health and nutrition, to children through schools. The extent of student absenteeism may critically affect coverage of any program delivered through schools. However, it is also necessary to understand the determinants of absenteeism since any systematic variation in absenteeism, across schools and amongst students within a school, will also influence the distribution of program benefits. A second objective is to assess the extent to which variation in coverage reflects components of the design of the program. This is particularly useful from a policy point of view, since it suggests methods whereby coverage can be enhanced, even given prevailing levels of student absenteeism. We investigate this in the context of a specific program, the Government of Bihar’s program for providing health checkups to all school children, termed the Nayi Pidhi Swasthya Guarantee Yojana (NPSGY). The study draws on a small survey that we ran in two districts of the state, covering 3 PHCs and 32 schools. Focusing attention on students in grade 2 in 2011-12, we collected information on whether the child received a health report card (and checkup), as well as attendance data for that child for each month of the school year. Combining this with information on the month of the school visit by the PHC team, we are able to assess whether the program affected absenteeism, and how the design of the program affected the relationship between attendance rates and program coverage. We find very high rates of student absenteeism, despite the fact that our survey was restricted to two of Bihar’s better-off districts. Our analysis of absenteeism reveal that it is higher amongst students from scheduled castes and tribes, suggesting that the delivery of health benefits through schools will generate lower coverage amongst students from these castes. Attendance is also lower in larger schools characterized by higher student-teacher. Given the relationship between class size and schooling achievement, these schools are likely to be of lower quality. Consequently, the delivery of health programs through schools is likely to provide fewer benefits to students who attend larger, lower quality schools. We also find no support for the hypothesis that the program may improve attendance, though we are not able to measure any long-term effects on school attendance through improved health. The very low coverage of the program, however, suggests that any effects on health are likely to be minimal.

2
Finally, we show that some aspects of the implementation of the program contributed to low coverage, and that better planning could significantly enhance coverage. The remainder of this paper is structured as follows. We start by discussing the Government of Bihar’s program for the delivery of health services through schools, the Nayi Pidhi Swasthya Guarantee Yojana (NPSGY). We then describe the survey that we conducted. Section 4 focuses on an analysis of school attendance rates in survey schools. Given the limited data currently available on student absenteeism in rural schools in India, this section provides evidence on what we consider to be a primary factor limited improvements in schooling in India. Section 5 provides regression evidence of the effect of attendance on the probability of receiving a health card. The last section concludes. 2. The Nayi Pidhi Swasthya Guarantee Yojana (NPSGY): High levels of infant and child malnutrition constitute one of the major challenges facing India. This is particularly true of states like Bihar with malnutrition amongst children ages 0-3 estimated to be as high as 58.4%, relative to the national average of 46%. In reducing malnutrition, the Government has been thwarted by the low performance of village-level health institutions. For example, National Family and Health surveys reveal that only 28% of children between the ages of 0 to 5 avail of services provided through village centers, Anganwadis, which constitute the delivery point for the Government’s nutrition program for pregnant women and children (ICDS). A mere 20% of these children were weighed in the year preceding the survey, and, of those weighed, only half of their mothers received nutritional counseling.
Given poorly functioning village-level health institutions, the Governments of many states are experimenting with programs that provide health services to children through schools, guided by the belief that this will increase coverage, even under prevailing rates of student absenteeism from schools. To ensure maximum coverage, Governments implementing such programs generally also provide information about these services to households so as to ensure attendance by children on dates when these services are planned.
One example of such a program is the Government of Bihar’s Nayi Pidhi Swasthya Guarantee Yojana (NPSGY). Initiated in March 2011, it is the first program in India to provide health cards and annual checkups to all children ages 0-14, and to girls between the ages of 14-18. The government of Bihar expects to reach 34 million children through the program. Organized through annual camps in government schools, the NPSGY provides health cards to children that enable monitoring their height and weight, as well as other key health indicators (including hemoglobin levels, susceptibility to heart and other chronic diseases,

3
skin diseases, etc). These indicators are assessed during the checkup. It also provides counseling on nutrition and health behaviors to children, as well as referrals for follow-up visits to Primary Health Centers (PHCs) and hospitals, as necessary. Health checkups were conducted by a team of doctors and medical specialists from the PHC.1 The implementation of the program in 2011-12 called for a plan to be drawn up for each PHC. This plan detailed all the health sub-centers (HSCs) under the PHC and, for each HSC, provided a list of all schools and Anganwadi centers that came under its jurisdiction, specifying a date for the visit of each school. The common practice was for each PHC to initiate school visits in May or June of the 2011-12 school year. Starting with the first HSC on the list, the PHC medical team would proceed from one school in the HSC to the next, then moving on to the second HSC and so forth, until all schools in the PHC were covered.
Because of the large number of schools, just one day was assigned to each school, regardless of the number of students in the school. While most visits to schools within a HSC would occur over the course of a month, the entire program of coverage of all HSCs under the jurisdiction of any given PHC could take several months, depending on the number of schools in the geographical zone covered by the PHC. In some PHCs, all schools could be covered over the course of a few months. In others, the program required 6 or more months. In our two survey districts, for example, school camps in the PHCs surveyed in Vaishali were conducted between July and December. In Buxar, school camps in the surveyed PHCs were conducted between June and September.
The implementation plan was drawn up by district level officials. In conversations with government officials and PHCs, we were informed that no specific rules were used for determining the dates of visits to any HSC or school. In some cases, it appeared that more distant HSCs were visited first, with HSCs closer to the PHC being visited last. In others, there appeared to be no systematic correlation between HSC characteristics and the order in which they were visited.
To ensure student attendance on the day of the school visit, information about the visit and the health checkups were to be disseminated to all households through village level health functionaries. Such functionaries, such as the Auxiliary Nurse Midwife (ANM) based in each sub-center, were to encourage parents to send their children to school so as to ensure universal coverage under the program.
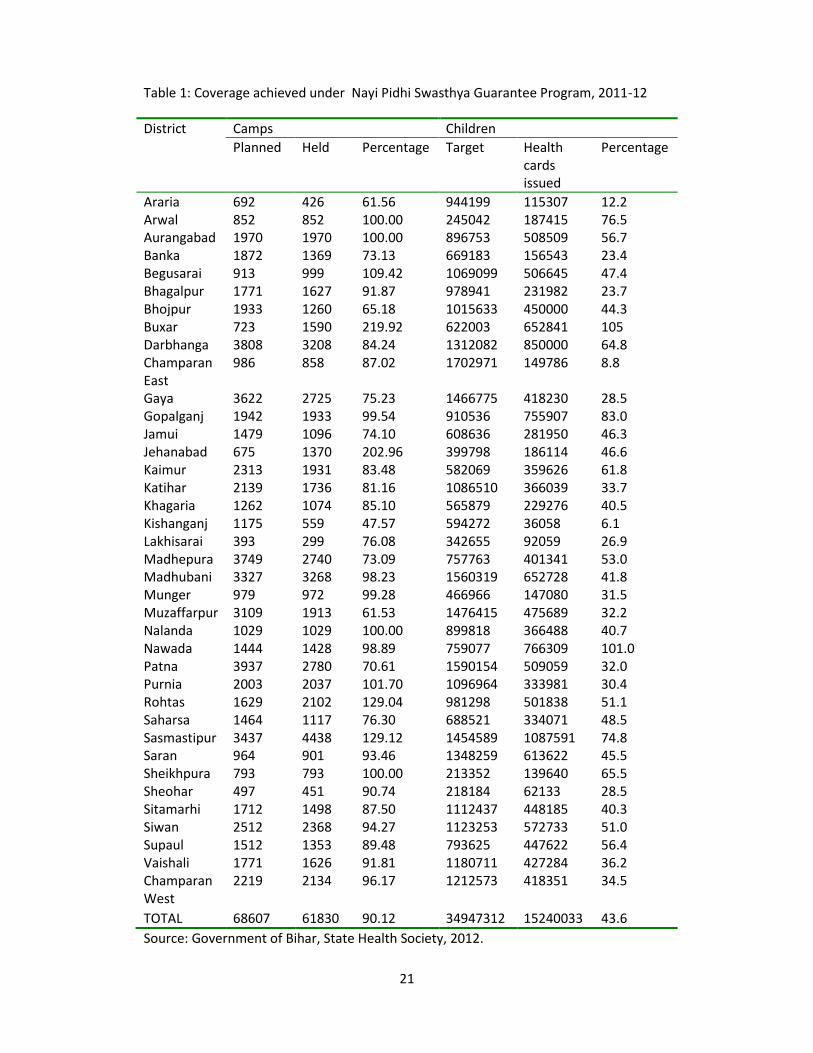
Data collected by the state Government, however, suggest a relatively low coverage rate during the first year. This data is reprinted in table 1. For the state 1 In a few cases, there were two teams formed in a PHC.

4
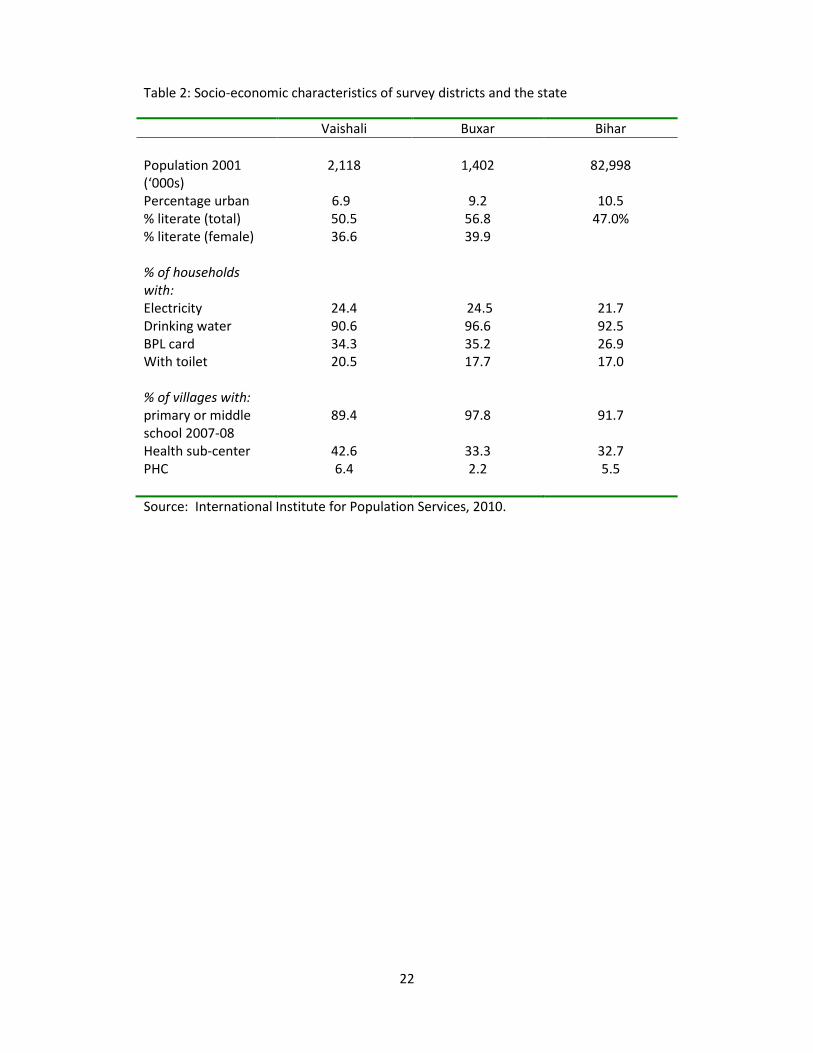
as a whole, though 90% of the planned camps were held, only 43.6% of targeted children received health cards. This figure was lower in Vaishali district (36.2), despite the district operating 92% of intended camps. The official data for Buxar, however, reveal more than 100% coverage of students. As we shall shortly discuss, this is at odds with our survey data, though our data are drawn only from three PHCs in the district. It is natural to assume that the low coverage reflects high absenteeism rates in the school. However, this may not necessarily be the case. Almost invariably, implementation plans called for all health checkups in a school to be completed within a day. In schools with high enrollments, this may not have been possible. Health officials may then have chosen to provide checkups only to targeted students, perhaps to girls or to those with below average height and weights who are more likely to be in relatively poor health. Alternatively, lack of time may also have caused health professionals to target healthier children, since this may reduce the time required for each checkup. In these instances, low coverage would reflect supply-side constraints, specifically, the shortage of medical personnel relative to the students to be covered in a day. Even in schools with relatively high absenteeism, the extent of absenteeism may not have been the binding constraint determining the number of checkups conducted in any given school. The role of absenteeism in explaining coverage is, therefore, an empirical question. 3. Survey Region, Data and Summary Statistics 3.1 Survey Data and Survey Area Our survey was conducted in two districts (Vaishali and Buxar) of the state. These districts were selected in consultation with the Government of Bihar’s State Health Society on the grounds that their implementation of the program was known to be above average. Not surprisingly, the two districts of our survey are amongst Bihar’s relatively better districts: Of 37 districts in the state, Vaishali and Buxar rank 11th and 12th, respectively, in terms of a composite index of development (International Institute for Population Studies, 2006). Table 2 provides data on some indicators of development in the two districts, and for the state as a whole. The study, therefore, does not provide a representative analysis of the program across Bihar’s districts, but focuses on better-performing states. This is because the coverage achieved by the program in a majority of districts is very low, partly because the program is in its first year of implementation. Within each district, three relatively well-performing blocks (and equivalently, three Primary Health Centers) were selected, also in consultation with District
5
Program Managers from the State Health Society.2 For each PHC, a list of the schools that came under its jurisdiction was prepared. Schools were listed in terms of the chronological order of their school visits. In the PHCs selected for the survey, the time taken for all school visits ranged from two to six months. Stratifying the sample by month of visit, schools were randomly selected from the set of schools visited in a given month. The Health Sub-centers (HSCs) associated with these schools were also surveyed. Thus, the total number of schools covered in the survey was 36. However, missing school records results in some of the analysis of this paper being conducted on a smaller set of 27 schools. The survey concentrated on children in grade 2 in 2011-12. Data was collected on the number of days of attendance of each child in grade 2, by month, for the 2011-12 school year. Similar data was also collected for the child in the previous year, when he or she was in grade 1. Simple socio-economic information on each child available at the school level, specifically the child’s gender and caste, was also collected. In addition to the school survey, we also implemented a HSC survey. The HSC survey provides information on the date of the school health camp, for all schools within the HSC. It also provides information on total school enrollments (across all schools) in the HSC, and hence allows us to assess issues such as the extent to which program effectiveness is affected by scale effects. 3.2 Summary statistics
Table 3 provides summary statistics on students and schools from the survey data. Data for all students in the school reveal that enrollments in elementary schools favor girls, with only 44% of students being boys. Scheduled caste and tribe students comprise 18% of all students, while minority students account for an additional 3%.
Elementary schools comprise both lower and higher primary schools, with lower primary schools providing instruction to students in grades 1 through 5, and higher primary schools extending to grade 7 or 8. Higher primary schools extending to grade 8 dominate, accounting for 75% of survey schools. Lower primary schools represent only 17% of the sample.
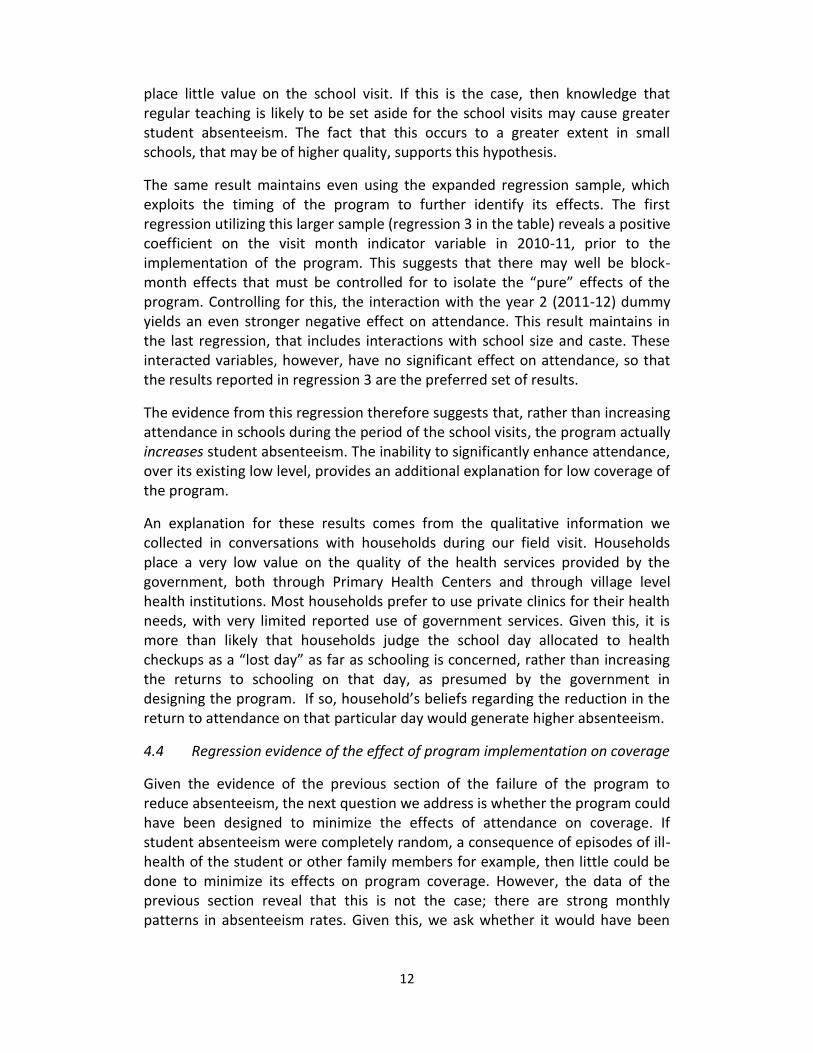
Schools are relatively large, with the mean school size being 454 students. Average enrollment is obviously higher in higher primary schools (mean of 518), and significantly lower in lower primary schools (244). Figure 1 plots a histogram
2 The blocks covered were Goraul, Desari and Chehrakala in Vaishali district and Raghunathpur, Dumraon and Simri in Buxar.

6
of schools by total enrollment, and displays the variation in school size, and provides evidence of very large school sizes in some schools.
Student teacher ratios in Bihar are far higher than in other states. As of 2002, the state reported 190,000 vacant teacher positions. To remedy this, the state government initiated a program to recruit local teachers. While many of these teachers, known as Panchayat teachers, lacked the level of schooling required for regular teacher positions, the Government also enacted an intensive training program to ensure their ability to teach elementary grades. The large scale appointment of Panchayat or contract teachers has significantly reduced student-teacher ratios in government schools since 2002.
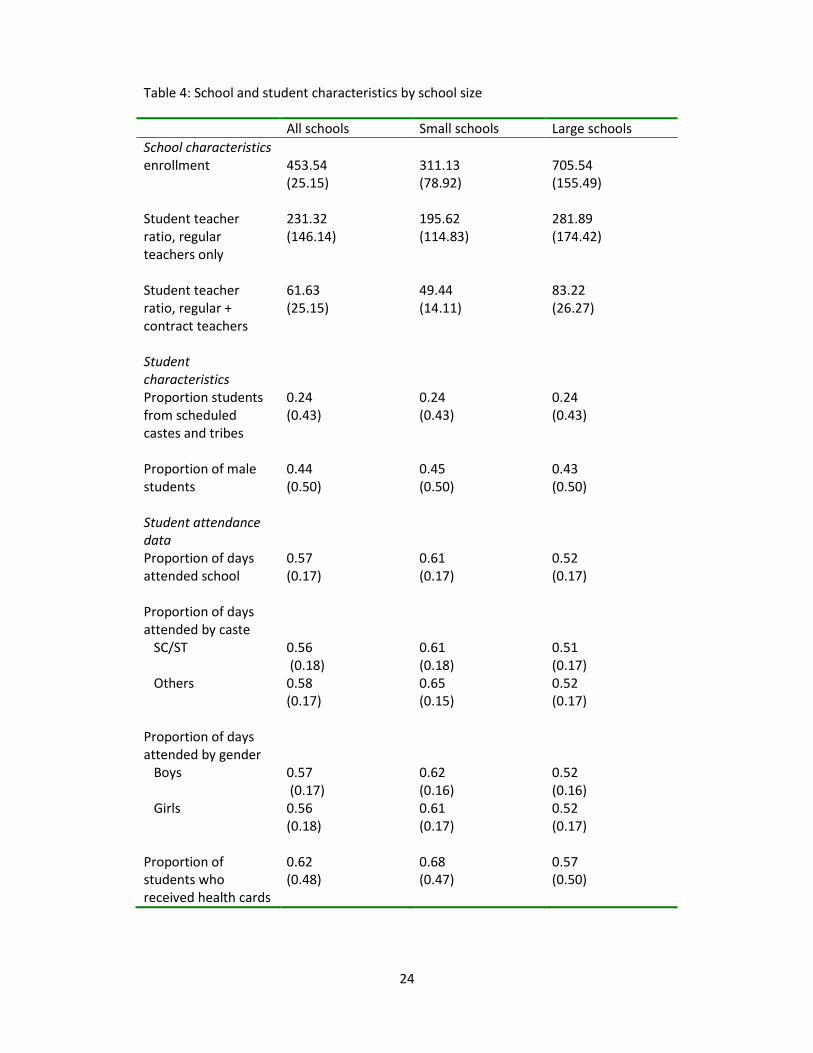
As in other parts of India, the number of teachers assigned to a school is based on school enrollments. The Right to Education Policy adopted by the Government of India in 2009 lays down the norms for teacher appointments. All schools are required to have a minimum of two teachers. For schools with enrollments up to 150, the norms imply a student teacher ratio of 30:1. Above this, the Right to Education policy calls for student teacher ratios that do not exceed 40. The norms are therefore biased in favor of small schools. This is also the case in Bihar. Table 4 provides data on student teacher ratios for small and large schools, with small schools being those with enrollments below the survey average. Two ratios are estimated, with the first calculated on the basis of the number of regular teachers only, while the second also includes contract or Panchayat teachers. The table reveals the significant difference in student teacher ratios across small and large schools.
3.3 Student teacher ratios and school quality
A finer classification of schools by size is presented in the next table, table 5, that provides data on student teacher ratios by quintiles of the distribution of school size. Student teacher ratios calculated on the basis of the total teachers in the school (regular plus contract) are close to national norms in the smallest schools (39), but rise dramatically with school size. In the largest schools, the mean student-teacher ratio is as high as 92.
Several studies suggest that student-teacher ratios are a significant determinant of schooling attainment. A seminal paper in this literature is by Angrist and Lavy (1999). This paper identifies the effect of class size on test scores by exploiting the specific non-linearity in the relationship between school size and the number of teachers, and hence the student-teacher ratio, generated by rules that provide additional teachers at specific enrollment levels, such as an additional teacher per 40 students. Applying this methodology to identify class size effects in Israeli schools, the authors find statistically significant effects on language and test scores for 5th grade students, but weaker effects on students in lower grades. For fifth grade students, they report an effect size of 0.29 standard
7
deviations: A one standard deviation increase in test scores across classes would reduce test scores by 0.29 standard deviations.
The same methodology has also been used to establish significant class size effects in developing countries. Urquiola (2006), for example, finds that larger class sizes significantly reduce learning amongst students in third grade in rural Bolivia. He reports a class size effect of 0.3 standard deviations, so that a one standard deviation reduction in class size would move a student from the 25th percentile to the median of the score distribution.
Gowda et al (2012) use the same methodology to assess the effect of class size on learning amongst third grade students in schools in rural Karnataka, India. They further compare class size effects to other factors believed to affect learning, primarily the effect of multi-grade classrooms in which one teacher is responsible for simultaneously teaching students from multiple grades, with all these students being in the same classroom. The study reports a similar class size effect to that in Urquiola (2006): a one standard deviation reduction in class size increases both language and mathematics test scores by 0.33 standard deviations. In contrast, they find no significant effect of multi-grade instruction in regressions that also control for class size effects. They conclude that the negative effect of multi-grade instruction (in regressions that do not control for class size) is a consequence of the correlation between multi-grade classrooms and class size.
Building on this research, student teacher ratios are frequently taken as a measure of school quality. It may well be the case that student teacher ratios have less of an effect on learning in environments with a sizeable private sector, as is the case in Bihar. In this economy, the availability of both private schools as well as private tutors (for students who continue to enroll in government schools) may allow households to compensate for poor school quality, thereby reducing the negative effect of class size on learning. Even here, however, student teacher ratios may be a good measure of school quality; if its effect is found to be low, this could support the hypothesis that parents have available private alternatives to compensate for the quality of government schools, while not detracting from the reliability of student teacher ratios as a measure of school quality. And, just as parents react to low school quality by increasing private expenditures, one would similarly expect low school quality to affect other indicators of household investments in government schools. One such indicator is, of course, student attendance in government schools.

8
4. Attendance
4.1 Annual attendance rates
Summary statistics on attendance rates are in table 4. Attendance is calculated from data on individual students who were in grade 2 in 2011-12. For each student, we have data on the total number of days of attendance in the month. We combine this with school-specific data on the number of school days in a month to calculate the child’s attendance rate.3 We present data on attendance for grade 2 students, and also disaggregated data by caste and gender. All statistics are provided for the sample as a whole, but also separately for students in schools with below average enrollments (small schools) and those with above average enrollments (large schools).
The average attendance rate for grade 2 students is strikingly low, at 57%, suggesting that students attend school for just over half of official school days. Available data from other sources support this finding. For example, 2005-06 data from the National Family Health Survey reveal an attendance rate of 64.6% for boys and 55.4% for girls in rural schools in the state. Our survey data however reveal little difference in attendance rates across boys and girls though, again, the relatively restricted geographic coverage of our study is worth keeping in mind. Attendance is slightly lower for students from scheduled castes and tribes and from minority groups (56%) relative to those from other castes (58%). This difference is larger in small schools, where the attendance rate by students from scheduled castes and tribes is 61%, relative to 65% for students from other castes.
The significant difference in attendance rates is across large and small schools: Attendance is significantly higher in small schools. The mean attendance rate in small schools is 61%, compared to just 52% in large schools. This difference in attendance across schools distinguished by size exists by gender and by caste. To the extent that large schools are characterized by poorer quality, as suggested by the data on student-teacher ratios, these data suggest that attendance rates may reflect differences in school quality correlated with school size.
Estimates from OLS regressions of the determinants of annual attendance rates are reported in table 6. In addition to the variables reported, the regression includes dummy variables for each survey block, thereby controlling for all block-specific factors that may determine attendance. These factors would include agricultural wage rates and other factors that may determine the opportunity cost of schooling and hence play an important role in explaining attendance. They also include the returns to schooling, since these returns are likely to be the same within the relatively small geographic unit of a block.
3 The number of school days in a month varies slightly across schools, because of local holidays.

9
Student characteristics included in the regression are the student’s gender and caste. School level determinants include school size and its square, the proportion of students in the school from scheduled castes and tribes, and the distance of the school from the Primary Health Center. We have not included the number of teachers in the school, since this is determined by school size. The quadratic in school size therefore captures the availability of all inputs that are determined on the basis of school size. As previously discussed, teacher allocation norms that favor small schools generally suggest that school quality declines with school size.
The regression results confirm the effect of school size on attendance: An increase in school size is associated with lower attendance, though the negative effect of size on attendance declines as school size increases. Unlike the summary statistics of the previous tables, however, the regression estimates also suggest lower attendance amongst students from scheduled castes and tribes. There is no significant effect of gender on participation.
These results have implications for health and other programs delivered through periodic or annual visits to schools, such as the NPSGY. To the extent that attendance determines coverage, the regression estimates suggest that program benefits will differentially accrue to students in smaller schools and to students from forward or upper castes, rather than those from scheduled castes and tribes. This suggests that existing rural inequalities may get compounded through the use of schools as a delivery platform for other programs; benefits are more likely to accrue to students who attend better quality schools (as measured by school size) and to students of higher socio-economic status.
4.2 Monthly variation in attendance
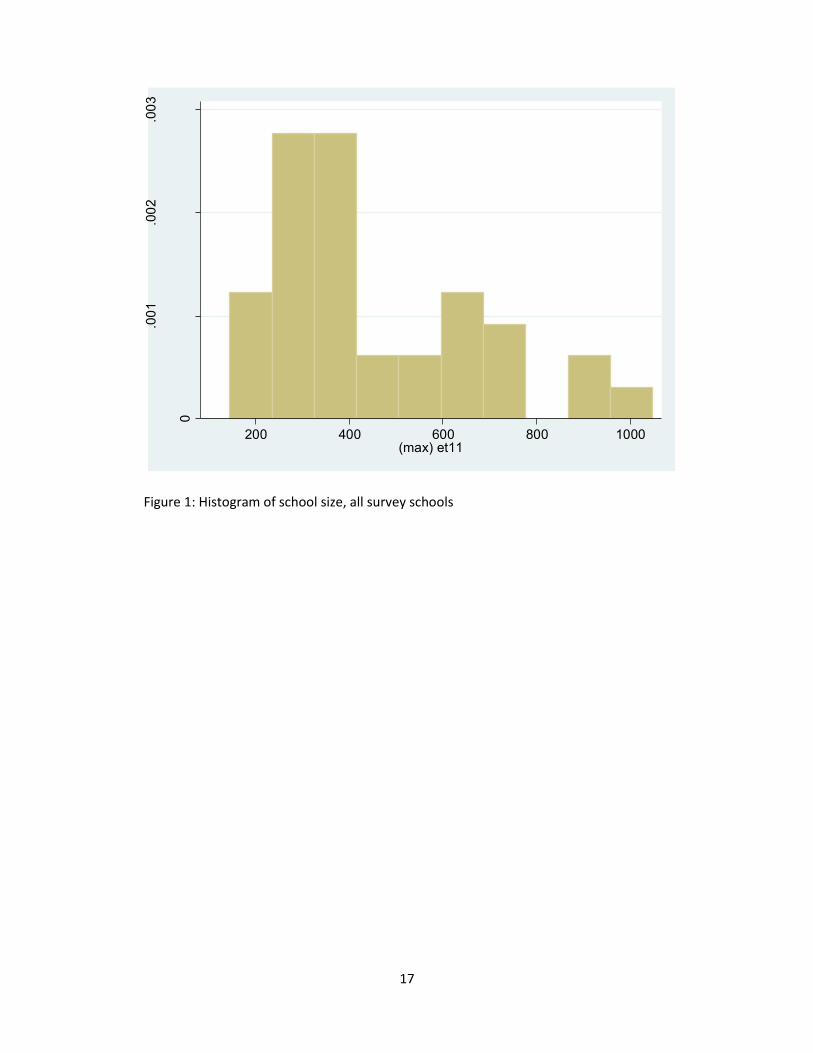
Figure 2 and table 7 provide data on average attendance rates in schools, by month. Attendance rates for each school are calculated from the child-level data on days attended by month and from information on the number of school days per month. The graph reveals the significant variation in attendance rates by month. Average attendance is very low at the beginning of the school year, with an average attendance rate of only 46%. While this number increases slowly over the next few months, it falls again in August, rises in September and October, and then falls again in November and December. The seasonality in attendance reflects a combination of factors. Low attendance in April and again in August reflects the seasonality in agricultural operations. Attendance rates also fluctuate with religious holidays, as in November.
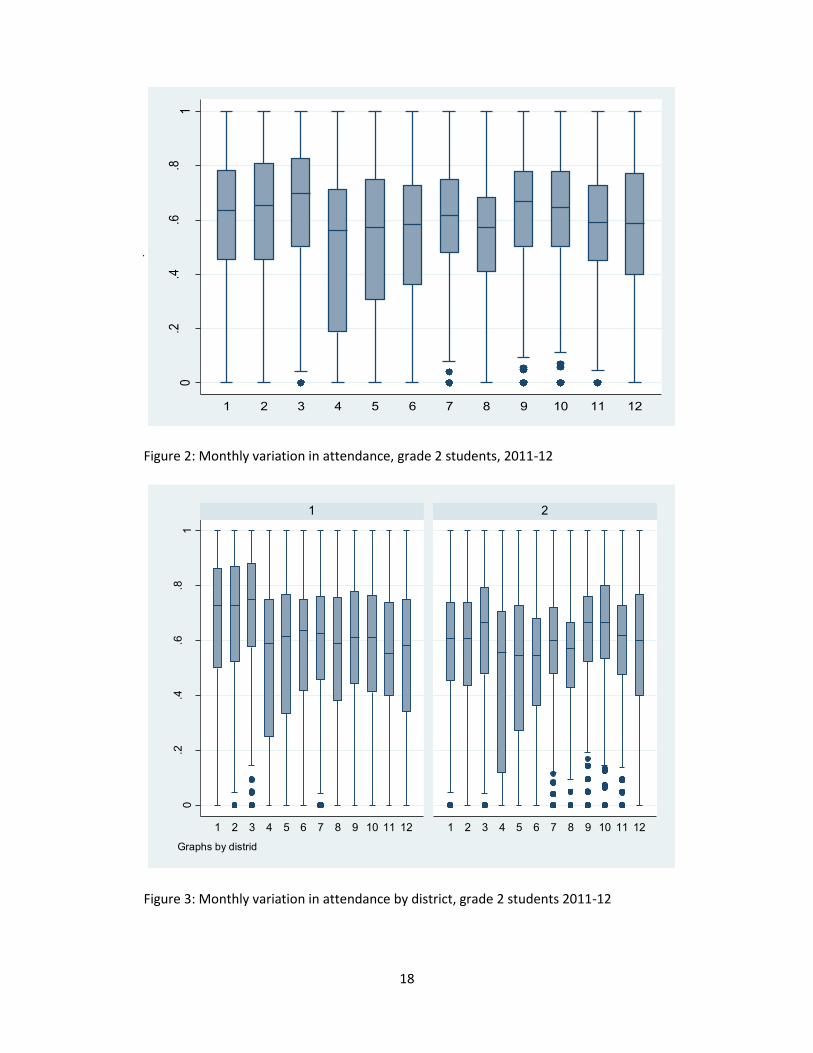
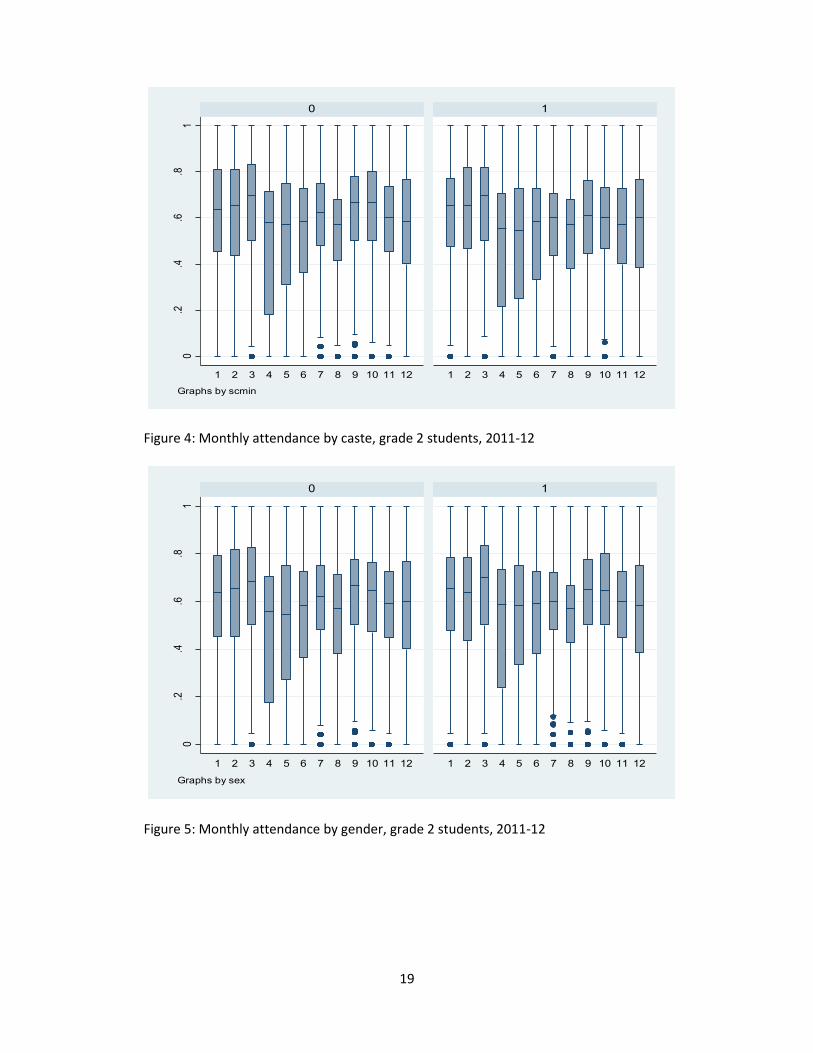
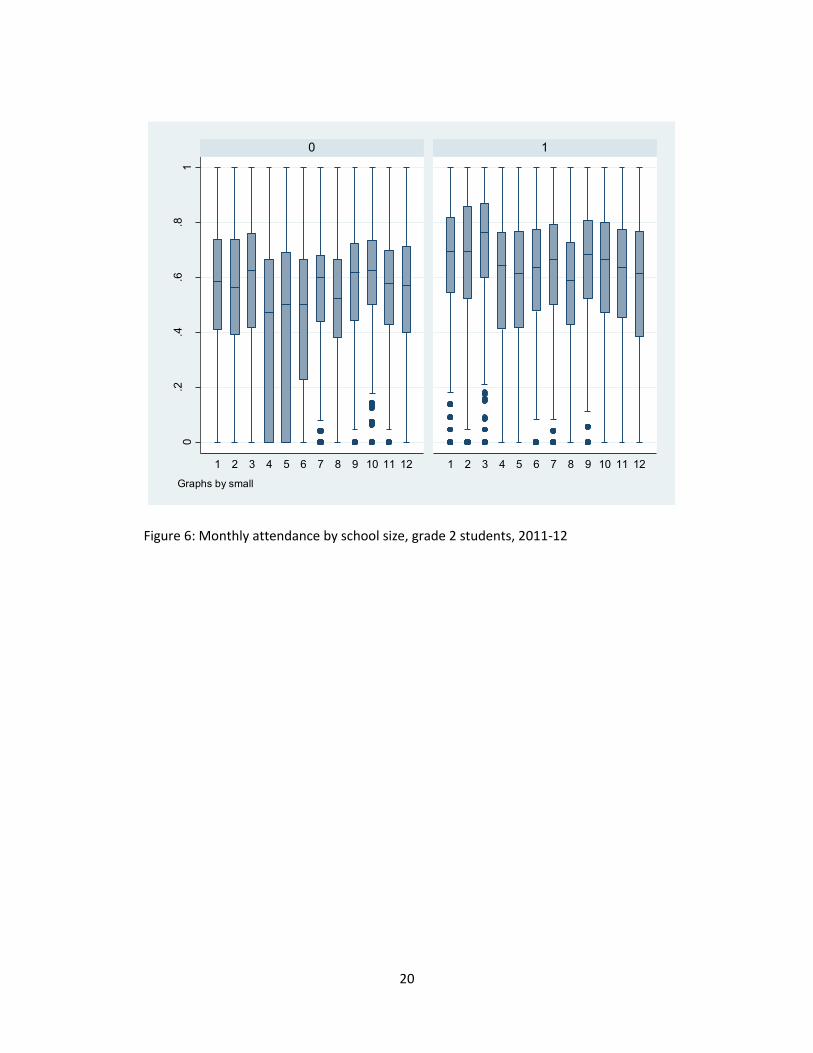
Figures 3, 4, 5 and 6, respectively, show the variation in monthly attendance rates by districts, caste (scheduled castes and tribes and minority students compared to other castes), gender and by school size. They reveal that the significant variation in monthly attendance rate exists, even within each of these categories. While the broad pattern in monthly variation is roughly similar across

10
these categories, differences do exit, both in monthly trends and in mean levels of attendance in each month. As in mean levels, the greatest difference in attendance on a monthly basis is between small and large schools.
Table 7 also reports program coverage rates by month, averaged over all schools. These data, too, reveal significant variation in coverage by month. Coverage is highest in July, November and December. November and December are months in which attendance dips, but the lack of correlation with coverage rates in this month may be a consequence of the fact that our survey includes just one school with health camps in each of these two months.
Given such high absenteeism rates, it is not surprising that many view the low coverage of programs that deliver services through schools, such as the NPSGY, to be a consequence of low attendance. The monthly variation in attendance rates has particular significance, as it suggests that lower than average coverage in some schools may not be a feature of the school or community but, instead, a consequence of program implementation, specifically, the decision to visit that school during a high absenteeism month. That is, a significant proportion of the variation in program coverage may not be because of the high mean level of absenteeism, but because of monthly variation in absenteeism coupled by variation in the month of the school visit.
Though these arguments appear convincing, the relationship between observed absenteeism in schools and coverage achieved under programs delivered through schools may be minimal, if the benefits delivered through the program are such as to cause increased attendance on the day of the program. Indeed, many believe that nutritional programs delivered through schools, such as the Mid-day Meal Program, have resulted in improved attendance. Though programs offered on just one day of the school year are unlikely to have a large effect on attendance, they may well boost attendance on the day of the program. This is important, since it would imply that low average attendance rates need not constrain coverage of the program; knowledge that health services were to be provided in the school on that day may encourage parents to send their children to school, thereby ensuring high coverage, even in schools with low average absenteeism. Therefore, before drawing a connection between observed attendance rates and program coverage, it is first necessary to provide empirical evidence on the effect of the program on attendance. We turn to this task in the next section.
4.3 Effect of the Program on Attendance
To investigate the effect of the program on attendance, we run regressions in which the dependent variable is the proportion of school days attended by the child in each month of the year. We allow for month specific effects on attendance by including a dummy indicator for each month of the calendar year. We also include dummy variables for each block covered in the survey. The set
11
of regressors includes the same student and school characteristics as in the previous regressions.
The primary results of this section come from the coefficient on an indicator variable that takes the value 1 if the school was visited in the month in question. Because the schools in our survey were randomly selected from amongst the schools within a block, the month of the visit is orthogonal to any school characteristics. The regression therefore allows us to assess whether the program improved attendance in the month in question.
However, our relatively small sample raises the possibility that, even with random selection of schools within a block, the estimates may not capture the pure effect of the program. For example, take the case of blocks with relatively few schools, in which total visits to all schools could be completed within a period of two months. In this case, if there is not significant variation in attendance rates across those two months, the visit month indicator variable may simply be capturing month-specific variation in attendance at the level of the block (that is, a block x month indicator variable).
It is possible to allow for this using data on student attendance, for the 2010-11 school year, the year prior to the implementation of the NPSGY. The 2010-11 data are for the same cohort of students, when they were in grade 1. We append data from this school year to the regression sample, and expand the set of regressors to include a year dummy variable, as well as an interaction of this dummy variable with the indicator variable for the visit month. The coefficient on the (year 2 x visit month) indicator reveals the effect of the program on attendance, while controlling for any block-month or school-month influences.
We also expand the regression to include interactions of the visit month indicator with school size and with an indicator variable for the student’s caste, to assess whether the program differentially affected attendance along these dimensions.
Table 8 provides regression results, both from a set of regressions using data just for the 2011-12 school year, and for the expanded regression sample that also includes data for the 2010-11 school year. The table reports results only from the variables of interest, excluding coefficients on the month indicator variables as well as from other regressors. The first two columns, reporting results from the 2011-12 sample, reveal a negative effect of the visit month indicator on student attendance in that month, an effect that is statistically significant at the 5% level. This result maintains even in the second regression, that includes interactions of the visit month indicator with school size and with the student’s caste. Indeed, this second regression reveals a larger negative effect, with a statistically significant positive coefficient on the interaction with school size. Thus, the regression estimates suggest that attendance falls in the visit month, and that this effect is larger in small schools. One explanation for this is that households
12
place little value on the school visit. If this is the case, then knowledge that regular teaching is likely to be set aside for the school visits may cause greater student absenteeism. The fact that this occurs to a greater extent in small schools, that may be of higher quality, supports this hypothesis.
The same result maintains even using the expanded regression sample, which exploits the timing of the program to further identify its effects. The first regression utilizing this larger sample (regression 3 in the table) reveals a positive coefficient on the visit month indicator variable in 2010-11, prior to the implementation of the program. This suggests that there may well be block-month effects that must be controlled for to isolate the “pure” effects of the program. Controlling for this, the interaction with the year 2 (2011-12) dummy yields an even stronger negative effect on attendance. This result maintains in the last regression, that includes interactions with school size and caste. These interacted variables, however, have no significant effect on attendance, so that the results reported in regression 3 are the preferred set of results.
The evidence from this regression therefore suggests that, rather than increasing attendance in schools during the period of the school visits, the program actually increases student absenteeism. The inability to significantly enhance attendance, over its existing low level, provides an additional explanation for low coverage of the program.
An explanation for these results comes from the qualitative information we collected in conversations with households during our field visit. Households place a very low value on the quality of the health services provided by the government, both through Primary Health Centers and through village level health institutions. Most households prefer to use private clinics for their health needs, with very limited reported use of government services. Given this, it is more than likely that households judge the school day allocated to health checkups as a “lost day” as far as schooling is concerned, rather than increasing the returns to schooling on that day, as presumed by the government in designing the program. If so, household’s beliefs regarding the reduction in the return to attendance on that particular day would generate higher absenteeism.
4.4 Regression evidence of the effect of program implementation on coverage
Given the evidence of the previous section of the failure of the program to reduce absenteeism, the next question we address is whether the program could have been designed to minimize the effects of attendance on coverage. If student absenteeism were completely random, a consequence of episodes of ill-health of the student or other family members for example, then little could be done to minimize its effects on program coverage. However, the data of the previous section reveal that this is not the case; there are strong monthly patterns in absenteeism rates. Given this, we ask whether it would have been

13
possible to enhance coverage by altering the plan of the program so as to have school visits only in months with high attendance.
This question is different from an analysis of the effect of student absenteeism on the receipt of benefits under the program. A child’s absence on the day in which health services are provided in the school will necessarily mean that he or she will not benefit from these services. We instead seek to identify a relationship that predicts the relationship between “usual” monthly attendance rates on the coverage of students, with the intent of assessing whether choosing months with higher attendance would improve coverage.
The regressions in table 8 are not well suited to answer this question, since they assess the effect of the program on monthly attendance rates, rather than program coverage rates. While attendance rates will be closely correlated with coverage rates, they will not be identical. As previously pointed out, high enrollments in schools, particularly in large schools, would make it almost impossible for a health team to ensure coverage of all students in just one day. Thus, while any specific child’s attendance would be a necessary condition for coverage, it is not a sufficient one; a significant proportion of students may not receive checkups due to lack of sufficient time.
We thus seek to estimate the relationship between attendance on the month of the visit and an indicator variable that takes the value 1 if the child received a health card. While attendance rates are endogenous, reflecting not just household variables but also school quality and the program itself, our intent is not to establish a causal relationship between attendance and coverage but to use the regression for predictive purposes only. Specifically, we use the regression results to predict the effect on coverage of implementing the program in months with different absenteeism rates.
For this exercise, we allow for non-linearity in the relationship between attendance and coverage rates as well as for heterogeneity in the form of an interaction between attendance rates in the month of the visit and school size. Allowing for a non-linear effect of attendance rates accommodates the hypothesis that the effect of increased attendance on coverage is higher at lower levels of attendance, falling off as attendance increases. The interaction with school size incorporates the belief that the correlation between attendance rates and coverage is lower in large schools, because of the inability to cover all students in one day.
Regression results are presented in table 9. These results confirm a concave relationship between attendance rates and coverage, with an increase in attendance having a greater effect on coverage at low attendance rates. The results also confirm a weaker correlation between attendance rates and coverage in large schools, supporting the belief that time constraints make it

14
difficult to ensure coverage of even those students present on the day of the school visit.
We use this regression to predict coverage under different assumptions about attendance rates in the month of the school visit. The regression results predict a coverage proportion of 0.62 (standard deviation of 0.26) at the mean attendance rate (0.59). If the school visit was conducted in months in which the attendance rate was at the 75th percentile (0.71), coverage would increase to 66%, a 4 percentage point increase. Comparing results on coverage across the 25th attendance percentile (0.43) and the 75th (0.71), the results show that moving school visits from months with an attendance rate of 43% to months with an attendance rate of 71% would increase coverage from 57% to 66%, a difference of 9 percentage points.
5. Conclusion
While there is significant interest in delivering health and other services to children through schools so as to ensure coverage, early evidence from programs such as the Government of Bihar’s Nayi Pidhi Swasthya Guarantee Yojana (NPSGY) reveal very low coverage rates. These rates may well be higher than what would obtain if health checkups were provided through village level health institutions such as the Anganwadi. Nevertheless, improvements in the policy necessitate research on the determinants of low coverage and on whether better program implementation could improve coverage.
This paper represents an initial investigation on program coverage and its determinants. Through a small field survey, we collected data on student absenteeism from schools and program coverage. The narrow geographical coverage of the survey and its relatively small size of the survey are limitations: the study provides evidence on absenteeism and coverage only in relatively well-off districts.
We document very high absenteeism rates in schools in our survey area, and the variation in absenteeism rates across students of different castes and across schools distinguished by size, finding higher absenteeism in larger schools. Because an important determinant of learning, classroom size, increases with school enrollments, our analysis suggest that delivering health services through schools could result in a skewed distribution of benefits favoring students from upper castes and those in higher quality schools.
These results would only maintain if the program did not itself increase attendance, minimizing the effects of attendance on coverage. We provide evidence that suggests that there was no such positive effect of the program on attendance. On the contrary, our estimates suggest a negative effect. Thus, low

15
attendance is a severe constraint on the ability of the state to deliver health services through schools. Because of low coverage rates, even in these well-off survey districts, it is extremely doubtful whether the program is able to generate any positive effects on health. This is even more unlikely in districts with higher absenteeism rates.
While mean absenteeism rates constrain coverage, monthly fluctuations in attendance suggest that coverage could be significantly improved if school visits were conducted only in months in which attendance was known to be high. We provide evidence of this in the paper. The practice of concentrating visits in high attendance months is followed in the state of Maharashtra, which also runs a similar program of health checkups provided through schools. In this state, school visits are conducted only in the months of November and December. Concentrating health visits in only two months, however, would imply that they could not all be conducted by one team from the Primary Health Center. It would be necessary to involve auxiliary health personnel, perhaps by involving village health functionaries. However, it is not possible to assess what the effect of this change in health personnel would imply. Households’ very low level of use of village health institutions suggest little value placed on the services provided by them. If, correspondingly, households place little value on health programs run by local health personnel, then coverage is unlikely to improve, since parents may well keep their children from school on days of the school visits, reducing attendance, even in (normally) high attendance months.
Ultimately, the design of a successful program would have to provide quality health care, and ensure that the program is designed to incorporate the constraints placed on coverage by student absenteeism from school.

16
References
Angrist, Joshua and Victor Lavy. 1999. “Using Maimonides Rule to Estimate the Effect of Class Size on Scholastic Achievement.” Quarterly Journal of Economics 114(2): 533-575/ Government of Bihar, State Health Society. 2012. “Nayi Pidhi Health Guarantee Program.” Gowda, Kallan, Anjini Kochar, C.S. Nagabhushana, and N. Raghunathan. 2012. “Compensating Policies for Small Schools and Regional Schooling Inequalities: Class Size and multi-grade teaching in India.” Stanford University, manuscript. International Institute for Population Services, 2010. District Level Household and Facility Survey (DLHS-3), 2007-08: India. Mumbai.
International Institute for Population Sciences. 2006. Ranking and Mapping of Districts. Mumbai. Urquiola, Miguel. 2006. “Identifying Class Size Effects in Developing Countries: Evidence from Rural Bolivia.” Review of Economics and Statistics 88(1): 171-177.
17
Figure 1: Histogram of school size, all survey schools
0
.001
.002
.003
Den
sity
200 400 600 800 1000(max) et11
18
Figure 2: Monthly variation in attendance, grade 2 students, 2011-12
Figure 3: Monthly variation in attendance by district, grade 2 students 2011-12
0.2
.4.6
.81
patt
1 2 3 4 5 6 7 8 9 10 11 12
0.2
.4.6
.81
1 2 3 4 5 6 7 8 9 10 11 12 1 2 3 4 5 6 7 8 9 10 11 12
1 2
patt
Graphs by distrid
19
Figure 4: Monthly attendance by caste, grade 2 students, 2011-12
Figure 5: Monthly attendance by gender, grade 2 students, 2011-12
0.2
.4.6
.81
1 2 3 4 5 6 7 8 9 10 11 12 1 2 3 4 5 6 7 8 9 10 11 12
0 1
patt
Graphs by scmin
0.2
.4.6
.81
1 2 3 4 5 6 7 8 9 10 11 12 1 2 3 4 5 6 7 8 9 10 11 12
0 1
patt
Graphs by sex
20
Figure 6: Monthly attendance by school size, grade 2 students, 2011-12
0.2
.4.6
.81
1 2 3 4 5 6 7 8 9 10 11 12 1 2 3 4 5 6 7 8 9 10 11 12
0 1pa
tt
Graphs by small
21
Table 1: Coverage achieved under Nayi Pidhi Swasthya Guarantee Program, 2011-12
District Camps Children Planned Held Percentage Target Health
cards issued
Percentage
Araria 692 426 61.56 944199 115307 12.2 Arwal 852 852 100.00 245042 187415 76.5 Aurangabad 1970 1970 100.00 896753 508509 56.7 Banka 1872 1369 73.13 669183 156543 23.4 Begusarai 913 999 109.42 1069099 506645 47.4 Bhagalpur 1771 1627 91.87 978941 231982 23.7 Bhojpur 1933 1260 65.18 1015633 450000 44.3 Buxar 723 1590 219.92 622003 652841 105 Darbhanga 3808 3208 84.24 1312082 850000 64.8 Champaran East
986 858 87.02 1702971 149786 8.8
Gaya 3622 2725 75.23 1466775 418230 28.5 Gopalganj 1942 1933 99.54 910536 755907 83.0 Jamui 1479 1096 74.10 608636 281950 46.3 Jehanabad 675 1370 202.96 399798 186114 46.6 Kaimur 2313 1931 83.48 582069 359626 61.8 Katihar 2139 1736 81.16 1086510 366039 33.7 Khagaria 1262 1074 85.10 565879 229276 40.5 Kishanganj 1175 559 47.57 594272 36058 6.1 Lakhisarai 393 299 76.08 342655 92059 26.9 Madhepura 3749 2740 73.09 757763 401341 53.0 Madhubani 3327 3268 98.23 1560319 652728 41.8 Munger 979 972 99.28 466966 147080 31.5 Muzaffarpur 3109 1913 61.53 1476415 475689 32.2 Nalanda 1029 1029 100.00 899818 366488 40.7 Nawada 1444 1428 98.89 759077 766309 101.0 Patna 3937 2780 70.61 1590154 509059 32.0 Purnia 2003 2037 101.70 1096964 333981 30.4 Rohtas 1629 2102 129.04 981298 501838 51.1 Saharsa 1464 1117 76.30 688521 334071 48.5 Sasmastipur 3437 4438 129.12 1454589 1087591 74.8 Saran 964 901 93.46 1348259 613622 45.5 Sheikhpura 793 793 100.00 213352 139640 65.5 Sheohar 497 451 90.74 218184 62133 28.5 Sitamarhi 1712 1498 87.50 1112437 448185 40.3 Siwan 2512 2368 94.27 1123253 572733 51.0 Supaul 1512 1353 89.48 793625 447622 56.4 Vaishali 1771 1626 91.81 1180711 427284 36.2 Champaran West
2219 2134 96.17 1212573 418351 34.5
TOTAL 68607 61830 90.12 34947312 15240033 43.6 Source: Government of Bihar, State Health Society, 2012.
22
Table 2: Socio-economic characteristics of survey districts and the state
Vaishali Buxar Bihar Population 2001 (‘000s)
2,118 1,402 82,998
Percentage urban 6.9 9.2 10.5 % literate (total) 50.5 56.8 47.0% % literate (female) 36.6 39.9 % of households with:
Electricity 24.4 24.5 21.7 Drinking water 90.6 96.6 92.5 BPL card 34.3 35.2 26.9 With toilet 20.5 17.7 17.0 % of villages with: primary or middle school 2007-08
89.4
97.8 91.7
Health sub-center 42.6 33.3 32.7 PHC 6.4 2.2 5.5 Source: International Institute for Population Services, 2010.

23
Table 3: Summary statistics, survey students and schools
Mean Standard deviation Student characteristics Proportion male 0.44 (0.49) Scheduled castes 0.18 (0.39) Minority students 0.03 (0.18) School characteristics Proportion of lower primary schools (to grade 5) to total schools
16.67% --
Proportion of schools with highest grade=7
8.33% --
Proportion of schools with highest grade=8
75.00% --
Mean School enrollment 2011-2012
453.56 (221.63)
Mean school enrollment in schools with highest grade=8
517.89 (215.92)
Mean school enrollment in lower primary schools
243.83 (59.71)
Grade 2 enrollment 2011-2012
58.11 (27.52)
School proportion SC/ST 0.23 (0.19) Proportion SC/ST, grade 2 0.23 (0.21) Number of regular teachers in the school
2.03 (1.65)
Number of contract teachers in the school
5.42 (1.76)
Distance to Health Sub-center
1.5 (1.36)
Distance to Primary Health Center
6.92 (6.57)
Source: survey data
24
Table 4: School and student characteristics by school size
All schools Small schools Large schools School characteristics enrollment 453.54
(25.15) 311.13 (78.92)
705.54 (155.49)
Student teacher ratio, regular teachers only
231.32 (146.14)
195.62 (114.83)
281.89 (174.42)
Student teacher ratio, regular + contract teachers
61.63 (25.15)
49.44 (14.11)
83.22 (26.27)
Student characteristics
Proportion students from scheduled castes and tribes
0.24 (0.43)
0.24 (0.43)
0.24 (0.43)
Proportion of male students
0.44 (0.50)
0.45 (0.50)
0.43 (0.50)
Student attendance data
Proportion of days attended school
0.57 (0.17)
0.61 (0.17)
0.52 (0.17)
Proportion of days attended by caste
SC/ST 0.56 (0.18)
0.61 (0.18)
0.51 (0.17)
Others 0.58 (0.17)
0.65 (0.15)
0.52 (0.17)
Proportion of days attended by gender
Boys 0.57 (0.17)
0.62 (0.16)
0.52 (0.16)
Girls 0.56 (0.18)
0.61 (0.17)
0.52 (0.17)
Proportion of students who received health cards
0.62 (0.48)
0.68 (0.47)
0.57 (0.50)

25
Table 5: student teacher ratio by school size
Quintile of school size distribution
Enrollment Student teacher ratio, regular teachers only
Student teacher ratio, regular and contract teachers
1 (smallest) 224 (49.69)
168.05 (77.46)
39.25 (10.52)
2 320.43
(19.42) 126.94 (40.58)
53.83 (14.26)
3 383.71
(25.52) 222.23
(134.66) 57.53
(12.44) 4 563.29
(77.88) 283.90
(135.95) 68.63
(30.64) 5 (largest schools) 809.14
(135.49) 305.06
(220.87) 92.13
(19.06)

26
Table 6: OLS regression estimates of determinants of Attendance rates
Variables Regression 1 Regression 2 Individual characteristics Male -0.003
(0.007) 0.01
(0.01) Scheduled caste/tribe -0.02*
(0.01) -0.02*
(0.01) School characteristics School size -0.001*
(0.0001) -0.0004*
(0.0001) School size square 1.5 e-7*
(6.9 e-8) 9.1 e-8
(1.02 e-7) Distance to PHC -0.002*
(0.001) -0.003*
(0.001) HSC characteristics Number of schools in HSC -- -0.02*
(0.01) Number of schools squared -- 0.002*
(0.001) Average school size -- 0.00004
(0.00008) Regression F 52.04
(0.00) 37.88 (0.00)
Sample size 1702 1342 Note: regression includes block dummy variables. Robust standard errors reported. Dependent variable is the proportion of school days attended in the 2011-12 school year. Regressions are run on students in grade 2. *Significant at 5% level +Significant at 10% level

27
Table 7: Monthly data on attendance, school days and coverage
Month Proportion of days attended school (mean across students) Number of school days
(mean)
Proportion of school children who received
check-up, when check-up was in
the month of
All districts Vaishali Buxar
April 0.46 (0.30) 0.49 (0.31) 0.44 (0.30) 16.00 (2.16) - May 0.51 (0.31) 0.54 (0.32) 0.50 (0.31) 12.23 (1.07) - June 0.51 (0.28) 0.55 (0.30) 0.49 (0.26) 18.00 (5.02) 0.48 (0.50) July 0.57 (0.25) 0.58 (0.27) 0.57 (0.23) 24.47 (0.79) 0.76 (0.43) August 0.53 (0.24) 0.55 (0.27) 0.52 (0.22) 21.31 (0.71) 0.67 (0.47) September 0.61 (0.24) 0.59 (0.27) 0.61 (0.22) 19.56 (1.45) 0.59 (0.49) October 0.60 (0.23) 0.56 (0.26) 0.63 (0.21) 16.01 (1.08) 0.35 (0.48) November 0.57 (0.23) 0.55 (0.25) 0.59 (0.21) 20.98 (1.20) 1.00 (0.00) December 0.57 (0.26) 0.55 (0.28) 0.59 (0.24) 13.38 (1.14) 0.71 (0.46) January 0.60 (0.25) 0.64 (0.28) 0.58 (0.22) 22.14 (0.71) -- February 0.60 (0.26) 0.65 (0.28) 0.56 (0.24) 22.78 (0.50) -- March 0.63 (0.26) 0.68 (0.27) 0.60 (0.26) 22.06 (1.88) --
Note: Data on attendance are from individual student files, that provide, for each student, the number of days of attendance by month. School days per month are from school records, and vary across schools because of local holidays.

28
Table 8: Regression estimates of the effect of the program on attendance
Variable 2011-2012 sample only 2010-11 and 2011-12 sample Regression 1 Regression 2 Regression 3 Regression 4
Visit month indicator variable
-0.02*
(0.01) -0.09*
(0.02) 0.03*
(0.01) -0.01 (0.02)
Visit month* school size
-- 0.0001*
(0.00003) -- 0.0001+
(0.00003) Visit month * SC/ST
-- 0.003 (0.01)
-- 0.02 (0.02)
Year 2 (2011-12)
-- -- -0.04*
(0.003) -0.04*
(0.003) Visit month * year 2
-- -- -0.06*
(0.01) -0.04+
(0.02) Visit month * school size * year 2
-- -- -- -0.00002 (0.00004)
Visit month * SC/ST * year 2
-- -- -- -0.02 (0.02)
Regression F 81.67
(0.00) 76.93 (0.00)
97.39 (0.00)
83.90 (0.00)
Sample Size 14,105 14,105 23,183 23,183 Note: Regression sample is monthly observations for each student. In addition to regressors listed above, each regression includes an indicator variable for the month, the student’s gender and caste, school size and school size square, proportion of SC/ST students in the school, distance to the PHC, and a set of block dummy variables. Robust standard errors in parentheses.
*Significant at 5% level +Significant at 10% level

29
Table 9: Probit Predicting equations for relationship between attendance and coverage rates Dependent variable: Indicator variable for whether child received a health card
Coeff Std. error Attendance rate, visit month
3.31* (1.34)
Attendance rate squared -2.94* (1.37) Attendance rate * school size
-0.005* (0.002)
Attendance rate squared * school size
0.006* (0.002)
Male 0.16* (0.07) SC/ST 0.46* (0.09) School size -0.006* (0.001) School size square 5.2 e-6* (9.6 e-7) Distance to PHC -0.05* (0.01) Number of schools, HSC -0.24* (0.08) Number of schools squared -0.02* (0.01) Average enrollment HSC schools
-0.005* (0.001)
LR χ2 (Prob. > χ2)
513.22 (0.00)
Note: regression is a Probit regression. Regressors include a set of dummy variables for different survey blocks.
*Significant at 5% level +Significant at 10% level

Designed by soapbox.co.uk
The International Growth Centre (IGC) aims to promote sustainable growth in developing countries by providing demand-led policy advice based on frontier research.
Find out more about our work on our website www.theigc.org
For media or communications enquiries, please contact [email protected]
Subscribe to our newsletter and topic updates www.theigc.org/newsletter
Follow us on Twitter @the_igc
Contact us International Growth Centre, London School of Economic and Political Science, Houghton Street, London WC2A 2AE