strukturellebioinformatik (masterstudiengangbiochemie) filehomology modelling is more reliable than...
TRANSCRIPT

Strukturelle Bioinformatik(Masterstudiengang Biochemie)
Strukturmodellierung
Sommersemester 2018
Peter Güntert & Sina Kazemi
MVLSEGEWQLVLHVWAKVEADVAGHGQDILIRLFKSHPETLEKFDRFKHLKTEAEMKASEDLKKAGVTVLTALGAILKKKGHHEAELKPLAQSHATKHKIPIKYLEFISEAIIHVLHSRHPGNFGADAQGAMNKALELFRKDIAAKYKELGYQG
A conceptually simple problem

1. Homology modeling/comparative modeling– Similar sequences à similar structures– Practically very useful, but requires structural homologues
2. Fold recognition and threading– Many sequence-wise unrelated proteins share the same
structural fold – Structures are more conserved than sequences
3. ab initio (or template-free methods) – Can use first principles to fold proteins– Do not require templates– High computational complexity
Methods
Methods for protein structure prediction
Methods are distinguished according to the relationship between the target protein and proteins of known structure:• Comparative modeling: A clear evolutionary relationship between
the target and a protein of known structure can be easily detected from the sequence.• Fold recognition: The structure of the target turns out to
be related to that of a protein of known structure although the relationship is difficult, or impossible, to detect from the sequences.• New fold prediction: Neither the sequence nor the structure of the
target protein are similar to that of a known protein.

Homology modelling is more reliable than other methods.
But, you can’t always find similar sequences of known structure.
Baker, D, Sali, A. (2001). Science 294, 93-96
Structure prediction
difficulty
accuracy
CASP: Critical Assessment of Techniques forProtein Structure Prediction
CASP (Critical Assessment of Structure Prediction) is a community wide experiment to determine and advance the state of the art in modeling protein structure from amino acid sequence. Every two years since 1994, participants are invited to submit models for a set of proteins for which the experimental structures are not yet public. Independent assessors then compare the models with experiment. Assessments and results are published in a special issue of the journal Proteins. In the most recent CASP round, CASP12, nearly 100 groups from around the world submitted more than 50,000 models on 82 modeling targets.
http://predictioncenter.org/

CASP: Template-based modelling
http://predictioncenter.org/
CASP: Ab initio modelling
http://predictioncenter.org/

CASP: Contact prediction
http://predictioncenter.org/
CASP: Experimental data-assisted modelling
http://predictioncenter.org/

CASP13 GoalsCASP assesses many aspects of modeling, including the accuracy of protein topologies, atom co-ordinates, and multi-protein assemblies. The experiment also examines the extent to which models can answer questions of biological interest, and how different types of sparse or low resolution experimental data can improve model accuracy.
CASP13 has started in April 2018 and will address the following questions:
• How similar are the models to the corresponding experimental structure? • Are domain orientations, subunit interactions, and the protein initeractions in complexes
modeled correctly? • How much more accurate are template-based models than those that can be obtained by
simply copying the best template? • How reliable are overall, residue, and atomic level error estimates? • How much can current refinement methods improve the accuracy of models? • How effective are approaches to predicting protein three dimensional contacts? • How well do the models help answering relevant biological questions? • How helpful is additional information, particularly sparse NMR data, chemical cross-linking,
SAXS and FRET? • In which areas has there been progress since the last CASP? • Where can future effort be most productively focused?
http://predictioncenter.org/casp13
CASP13 Modeling Categories• The High Accuracy Modeling category will include domains where majority of submitted models
are of sufficient accuracy for detailed analysis. This category replaces the previous Template Based Modeling category.
• The Topology category (formerly Free Modeling) will assess domains where submitted models are of relatively low accuracy.
• The Contact Prediction category will assess the ability of methods to predict three dimensional contacts in targets structures.
• The Refinement category will analyze success in refining models beyond the accuracy obtained in the initial submissions. For each target, one of the best initial models will be selected, and reissued as the starting structure for refinement.
• The Assembly category will assess how well current methods can determine domain-domain, subunit-subunit, and protein-protein interactions. As in CASPs 11 and 12, we hope to work closely with CAPRI in this category.
• The Accuracy Estimation category will assess the ability to provide useful accuracy estimates for the overall accuracy of models and at the domain and residue level.
• The Data Assisted category will assess how much the accuracy of models is improved by the addition of sparse data. Targets for which such data are available will be re-released after initial data independent models have been collected, together with the available data. Data types are expected to include sparse NMR data, crosslinking data, SAXS data and FRET.
• The Biological Relevance category will assess models on the basis of how well they provide answers to biological questions. Target providers will be asked to say what questions prompted the determination of the experimental structure. The usefulness of the models in answering those questions will be compared with the that of the experimental structures.
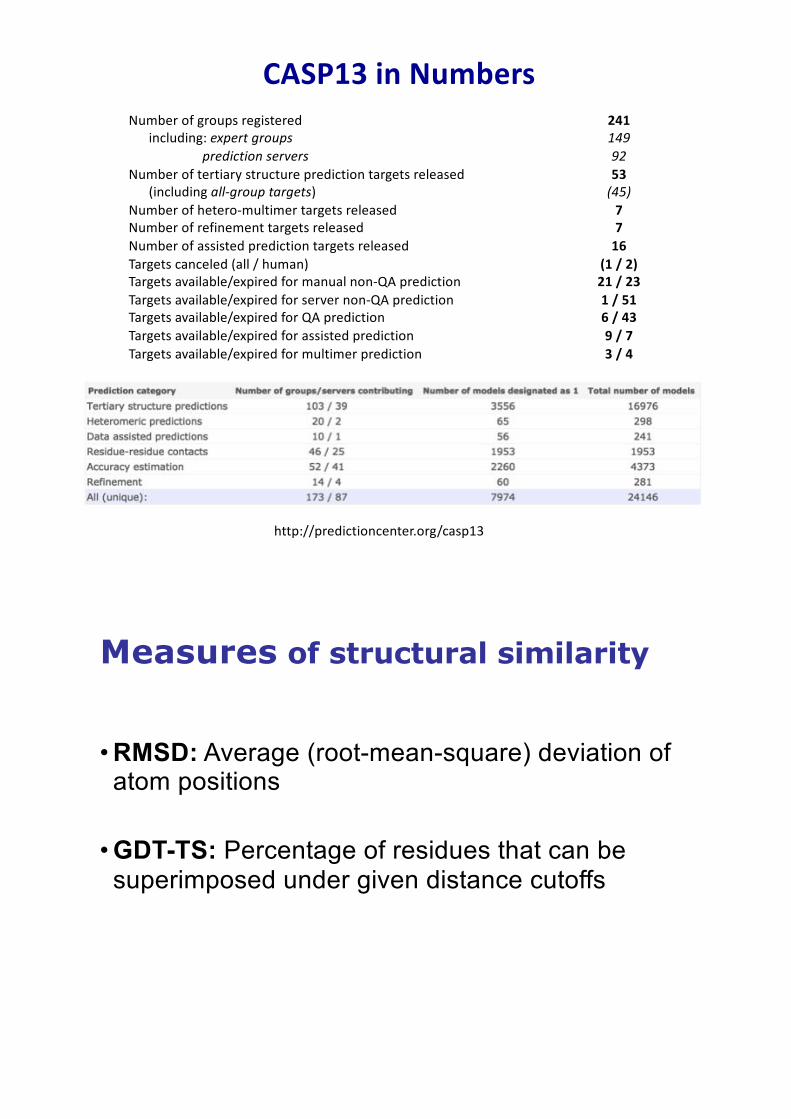
CASP13 in Numbers
http://predictioncenter.org/casp13
Number of groups registered 241including: expert groups 149
prediction servers 92Number of tertiary structure prediction targets released 53
(including all-group targets) (45)Number of hetero-multimer targets released 7 Number of refinement targets released 7 Number of assisted prediction targets released 16 Targets canceled (all / human) (1 / 2)Targets available/expired for manual non-QA prediction 21 / 23Targets available/expired for server non-QA prediction 1 / 51Targets available/expired for QA prediction 6 / 43Targets available/expired for assisted prediction 9 / 7Targets available/expired for multimer prediction 3 / 4
Measures of structural similarity
•RMSD: Average (root-mean-square) deviation of atom positions
•GDT-TS: Percentage of residues that can be superimposed under given distance cutoffs

RMSD (root-mean-square deviation)
• Zwei Strukturen mit n Atomen und Koordinaten x1, x2,…, xn und y1, y2,…, yn
• Minimum über alle Rotationen R und Translationen t → optimale Überlagerung
å=
--=n
iiitR tyRx
nRMSD
1
2,1min
!!!!
RMSD values of structure bundles
0.5 Å
16 Å8 Å4 Å
2 Å1 Å

GDT_TS• The GDT (“global distance test”) algorithm searches for the
largest (not necessarily continuous) set of residues that deviate by no more than a specified distance cutoff.
• Results are reported as the percentage of residues under a given distance cutoff.
• A popular measure is the “GDT total score”,
GDT_TS = (P1 + P2 + P4 + P8)/4,
where Pd is the fraction of residues that can be superimposed under a distance cutoff of d Å, which reduces the dependence on the choice of the cutoff by averaging over four different distance cutoff values.
CASP13 in Numbers
Moult et al. Proteins 86, 7–15 (2018).

CASP12 Prediction accuracy
Moult et al. Proteins 86, 7–15 (2018).
CASP12 Prediction accuracy
Moult et al. Proteins 86, 7–15 (2018).

CASP12 Prediction accuracy
Moult et al. Proteins 86, 7–15 (2018).
Comparative protein structure modelling
(template-based modelling)(homology modelling)

Build a model for the query sequenceCore modeling, side chain modeling
loop modeling
Model evaluation
Identify homologous protein structures
Model refinement
Most of the steps can be automated
Very important
step
Homology Modeling
HM can give excellent predictions
Align query sequence with template sequence
Threshold for Structural Homology

Chameleon Sequences
Same short protein sequence adopts different secondary structures

A: 24 mutationsB: 17 mutations
Absolutely Critical: • Sequence alignment is the bottleneck of the modeling process• No comparative modeling scheme can recover from an incorrect
alignment.
How does one find template(s)?• The simplest template determination approaches use fairly
common database searching methods (i.e., BLAST and FASTA).• In slightly more difficult cases, multiple sequence alignment and
profile-based methods might be used to identify and better align the template to the target sequence.
Target-Template Sequence Alignment
When multiple targets are identified, there are a variety of ways of determining the best — this is a very important step.
Key factors to consider include: • coverage• sequence similarity/phylogenetic clustering • matching of target predicted secondary structure with
observed template secondary structure• structure quality (resolution, R-factor, etc.)• known functional relationships, etc.
Target-Template Sequence Alignment
Backbone Model Generation• For most of the model, creating the backbone structure with
a traditional homology modeling protocol is trivial (simply copy the coordinates from one template to the model!). If there is a match within the alignment, the coordinates of the side-chain can be copied as well.
• More recent methods attempt to use multiple structural templates (e.g. if one template has good overlap in one area, while the other has better overlap elsewhere).

Backbone Model Generation• The program SEGMOD builds the model structure using a
hexapeptide fragment library. The model structure is built based on a series of these fragments.
• The widely used program MODELLER generates a series of distance constraints from the template structure, and then builds a model using these restraints in much the same way that is done with NMR structure determination.
One of the advantages of using the satisfaction of spatial restraints method is that it can incorporate various restraints from experiments, such as NMR experiments, site-directed mutagenesis and cross-linking experiments.
• Modeling loops that lack coverage within the template is extremely difficult, yet common due to:o Template structure is not well resolved.o Sequence divergenceo Insertions/Deletions
• To make things worse, loop regions vary significantly between model and template even when complete coverage is present.o Surface loops tend to be involved in crystal contacts, leading to significant
conformational changes dependent upon the unit cell.o The exchange of a small to bulky side-chain underneath the loop
(within the core) can “push” it aside.o Also, remember that loop regions are generally floppy and fluctuate
constantly, meaning a fixed conformation may have little biological meaning.
Loop Modelling

Knowledge-based:• Find matching loops with the right number of residues and
matching endpoints within the PDB.• In particularly difficult cases (loops longer than ~8 residues), chain
fragments together. Based on the premise that irregular substructures are built from combinations of small standard structures.
Energy-based:• Generate random loops of right length and endpoints. Evaluate
resultant structure with some sort of energy function.
Loop Modeling Methods
Some sort of knowledge-based rotamer library from high-resolution structures is used.
Side-chain Modelling/Packing

Combinatorial explosion:• Intuitively, it makes sense that the conformation of one residue will affect the
conformations of others.• Fortunately, rotamer space is not limitless. • Assuming on average 5 rotamers per residue, there are still 5100 different
combinations to score within a 100 amino acid protein.
Solutions:• Certain backbone conformations strongly favor certain rotamers, meaning the
others can be ignored.• More rigid residues can be modeled first, and the more flexible (larger rotamer
space) can be modeled subsequently. The advantage of this is that the more rigid residue limits the space that must be explored by the flexible one.
• Nature picks rotamer conformations that maximize packing (minimize voids) and the number of interactions with other groups (i.e. H-bonds, salt bridges, disulfide bonds, etc.).
Side-chain Modeling/Packing
The last step is to optimize the model using some sort of iterativerefinement.
• Unfortunately, current force fields are not sufficient.
• While they will remove the few big errors (bumps), they introduce many small errors.
Model optimization

Summary of the steps
1. Pick a template
2. Refine the sequence alignment
3. Build a model of the protein backbone
4. Model loops
5. Add side-chains
6a. Optimize side-chain configurations
6b. Optimize entire structure
7. Assessment
1.
2.
3.
4.
5.
6.
ModWeb: Server for Comparative Protein Structure Modeling
using MODELLER
http://modbase.compbio.ucsf.edu/modweb/
http://salilab.org/modeller/
Given an alignment of a sequence to be modeled with known related structures, MODELLER automatically calculates a model containing all non-hydrogen atoms. MODELLER implements
comparative protein structure modeling by satisfaction of spatial restraints and can perform many
additional tasks, including de novo modeling of loops in protein structures, optimization of various
models of protein structure with respect to a flexibly defined objective function, multiple alignment of
protein sequences and/or structures, clustering, searching of sequence databases, comparison of protein structures, etc.

SWISS-MODEL
• Swiss-Model - an automated homology modeling server http://swissmodel.expasy.org/
• Closely linked to Swiss-PdbViewer, a tool for viewing and manipulating protein structures and models.
• May take hours to get results returned!
Typical errors in comparative modelingErrors in side-chain packing Distortions and shifts in
correctly aligned regions Errors in regions
without a template
Errors due to misalignments Errors due to an incorrect template

Conclusions on homology modeling• Homology modeling focuses on the use of a structural template
derived from known structures to build an all-atom model of the protein. • Can give good overall (fold level) results.• Yet, the models are often not good enough for detailed
structure/function analyses.• In fact, the models tend to look a lot like their templates,
meaning a key challenge is picking the right template.• Detecting meaningful sequence homology in the Twilight Zone
is very difficult (if not impossible).
Methods for protein structure prediction
Methods are distinguished according to the relationship between the target protein(s) and proteins of known structure:• Comparative modelling: A clear evolutionary relationship
between the target and a protein of known structure can be easily detected from the sequence.• Fold recognition: The structure of the target turns out to
be related to that of a protein of known structure although the relationship is difficult, or impossible, to detect from the sequences.• New fold prediction: Neither the sequence nor the structure of
the target protein are similar to that of a known protein.

Science 309, 1868–1871 (2005)
Softwarehttp://www.rosettacommons.org/
Serverhttp://robetta.bakerlab.org/
Rosetta

Assembly of sub-structural units
knownstructures
…
fragmentlibrary
proteinsequence
predictedstructure
Structure Prediction with Rosetta
• While not every protein fold is present in the protein databank, all possible conformations of small peptides are.
• Select fragments consistent with local sequence preferences.
• Assemble fragments into models with native-like global properties.
• Identify the best model from the population of decoys.

Modelling
• Model each candidate local structure as a node
Protein sequence
Modelling
• Model each candidate local structure as a node
• If two consecutive local structure are compatible, an edge joins them
Protein sequence

Modelling
• Model each candidate local structure as a node
• If two consecutive local structure are compatible, an edge joins them
• Add a source s and sink t to the graph
Protein sequences
t
Modelling
• Model each candidate local structure as a node
• If two consecutive local structure are compatible, an edge joins them
• Add a source s and sink t to the graph
• Each path from s to t forms a candidate structure
Protein sequences
t

Local Sequence Bias – RapidApproximation of Local Interactions
• While not every protein fold is present in the protein databank, all possible conformations of small peptides are!• Approximate local interactions using
the distribution of conformations seenfor similar sequences in known protein structures• For each sequence window, select
fragments that represent the conformations sampled duringfolding
Rosetta Fragment Libraries
• 25–200 fragments for each 3 and 9 residue sequence window
• Selected from database of known structures> 2.5 Å resolution< 50 % sequence identity
• Ranked by sequence similarity and similarity of predicted and known secondary structure

Scoring Function
The ideal energy function – has a clear minimum in the native structure– has a clear path towards the minimum– Global optimization algorithm should find the
native structure.
Rosetta Potential Function
• Derived from Bayesian treatment of residue distributions in known protein structures
• Reduced representation of protein used; one centroid per sidechain
• Potential Terms:• environment (solvation)• pairwise interactions (electrostatics)• strand pairing• radius of gyration• Cb density• steric overlap

Decoy Discrimination: Identifying the Best Structure
• 1000–100,000 short simulations to generate a population of 'decoys'• Filter population to correct systematic biases• Full atom potential functions to select the deepest energy minimum• Cluster analysis to select the broadest minimum• Structure-structure matches to database of known structures
Rosetta: Energy vs. Accuracy
Plots of Ca-RMSD (x axis) against all atom energy (y axis) for refined natives (blue points) and the de novo models (black points). Red arrows indicate the lowest energy de novo models.

The Rosetta Scoring Function
ROSETTA search algorithmMonte Carlo/Simulated Annealing
• Structures are assembled from fragments: – Begin with a fully extended chain – Randomly replace the conformation of one 9
residue segment with the conformation of one of its neighbors in the library
– Evaluate the move: Accept or reject based on an energy function
– Make another random move, taboo list is built to forbid some local minimums
– After a prescribed number of cycles, switch to 3-residue fragment moves

ROSETTA results in CASP5Ribbon diagrams of predictions made by using the fragment insertion approach. The native structure and best submitted model are shown colored from the N-terminus (blue) to C-terminus (red). For T148, the best generated model is also shown, and for T156, both template-based and fragment insertion based models are shown. For targets T173, T135, T156, and T191, colored regions deviate from the native structure by <4 Å, and gray regions deviate by >4 Å. For targets T129 and T156, colored regions deviate from the native structure by <6 Å Ca RMSD, whereas the gray regions deviate by >6 Å.
High-resolution de novo structure predictions
Superposition of low-energy models (blue) with experimental structures (red) showing core side chains.
A: Hox-B1B: UbiquitinC: RecAD: KH domain of Nova-2E: 434 repressorF: Fyn tyrosine kinase