struggling to succeed: what happened to seniors who did...
TRANSCRIPT

South Hall, Room 4722 www.lmri.ucsb.edu/dropouts Phone: 805-893-2683 University of California Fax: 805-893-8673 Santa Barbara, CA 93106-3220 Email: [email protected]
Struggling to Succeed: What Happened to Seniors Who Did Not Pass the California High School Exit Exam?
California Dropout Research Project Report #11 June 2008
By
Shane Jimerson, Michael Furlong, Jill Sharkey, Erika Felix, Mary Skokut, and James Earhart
University of California, Santa Barbara

ABSTRACT
Since 2006, students in California have been required to pass the California High School
Exit Exam (CAHSEE) to receive their high school diploma. Most students have either passed the
CAHSEE by their senior year or dropped out. However, more than 70,000 high school seniors in
the 2007 graduating class had not passed the CAHSEE, yet chose to remain enrolled in school
rather than abandon their education. A better understanding of these students and their
experiences could help improve the state’s graduation rate. This report summarizes findings from
a study of 167 twelfth graders from the class of 2007 in four California public school districts.
Participants were randomly selected from a group of students who did not pass the CAHSEE as
of the fall semester of their senior year. These students were unique because they were at “high
academic risk” given their poor performance on the CAHSEE, but they were also “persistent” as
they were still enrolled in school despite their academic struggles. Participants were surveyed in
the spring of their senior year and again the following fall to determine what happened to these
students. The findings reveal characteristics and outcomes of a unique population of students
who, despite knowing they had taken and not passed the CAHSEE multiple times, still enrolled
in school for their senior year. Overall, these students did not resemble high school dropouts in
traditional characteristics. The majority of these students attended class regularly, generally
avoided trouble, felt connected to their schools, and held high educational values and hopes for
their future. Most of these students were English Learners who struggled with their English
language skills. This particular group of students appears willing to work hard to earn an
education and appear to be looking for opportunities to achieve this objective.
The authors would like to acknowledge the contributions of Dr. Russell Rumberger who was responsible for developing the initial draft of the survey in 2006. Please address correspondence to:
Shane Jimerson Gevirtz Graduate School of Education, University of California, Santa Barbara
Center for School-Based Youth Development Department of Counseling, Clinical, and School Psychology

TABLE OF CONTENTS
INTRODUCTION AND OVERVIEW........................................................................................... 5
In Brief ....................................................................................................................... 5
Primary Purpose......................................................................................................... 5
Contemporary Context............................................................................................... 6
Description of the CAHSEE ...................................................................................... 7
Analyses of CAHSEE................................................................................................ 8
Relevant School Dropout and Completion Literature ............................................... 9
Reflections on School Completion Literature............................................................11
Current Study .............................................................................................................12
Research Questions....................................................................................................14
SECTION 1: INITIAL SURVEY RESULTS .................................................................................15
Demographics...........................................................................................................15
1.1 Basic demographics .............................................................................................15
1.2 Language demographics ......................................................................................16
1.3 Language proficiency...........................................................................................16
1.4 Perceived language proficiency ...........................................................................16
Academic Experiences ............................................................................................17
1.5 Academic achievement ........................................................................................17
1.6 Time spent on homework.....................................................................................17
1.7 Experience with the CAHSEE.............................................................................18
Educational Placements...........................................................................................19
1.8 Educational programs ..........................................................................................19
1.9 Grade retention.....................................................................................................19
Behavior Problems at School ..................................................................................20
1.10 Tardies, truancy, absences, not following school rules .....................................20
1.11 Suspensions, transfers, expulsions.....................................................................20
Perceptions, Values, and Involvement in School ..................................................21
1.12 Student perceptions of school / education .........................................................21

1.13 Value of education .............................................................................................22
1.14 Extracurricular activity involvement .................................................................22
1.15 Total hours spent on extracurricular activities per week ...................................23
Educational Plans and Self-Expectations .............................................................23
1.16 Current educational plans ..................................................................................23
1.17 Educational self-expectations ............................................................................24
Work Characteristics...............................................................................................24
1.18 Work experiences...............................................................................................24
1.19 Summer work plans ...........................................................................................25
Student Characteristics ...........................................................................................25
1.20 Self-prediction of graduation status ...................................................................25
1.21 Views on the importance of life attainments .....................................................26
1.22 Academic self-efficacy and life satisfaction ......................................................26
Family Characteristics.............................................................................................27
1.23 Family structure .................................................................................................27
1.24 Parent expectations ............................................................................................27
1.25 Parent-student communication...........................................................................28
Friend Characteristics .............................................................................................28
1.26 Friend characteristics .........................................................................................28
1.27 Friend expectations ............................................................................................29
SECTION 2: FOLLOW-UP SURVEY RESULTS.........................................................................29
Educational Outcomes.............................................................................................30
2.1 Graduation status at follow-up.............................................................................30
2.2. Current educational plans at follow-up...............................................................31
2.3 Educational self-expectations at follow-up..........................................................32
Employment Outcomes ...........................................................................................33
2.4 Work characteristics at follow-up........................................................................33
Life Satisfaction........................................................................................................34
2.5 Life satisfaction at follow-up...............................................................................34

SECTION 3: RESULTS OF ANALYSES .....................................................................................35
3.1 Passing the CAHSEE...........................................................................................35
3.2 High school graduation ........................................................................................36
3.3 Post-secondary enrollment...................................................................................37
3.4 Did not graduate, but pursued other viable educational option ...........................37
3.5 Demographic and achievement characteristics ....................................................37
DISCUSSION............................................................................................................................38
Characteristics and Experiences of Students ........................................................39
Student Outcomes at Fall Follow-up......................................................................44
Factors Predicting Student Outcomes ...................................................................46
CONCLUSIONS........................................................................................................................47
REFERENCES..........................................................................................................................51
APPENDICES...........................................................................................................................56
APPENDIX 1. Tables ....................................................................................................56
APPENDIX 2. Brief Summary of Participating School Districts .................................82
APPENDIX 3. Initial Survey .........................................................................................84
APPENDIX 4. Follow-up Survey ..................................................................................93
APPENDIX 5. Description of Composite Variables and Recategorized Variables......96

5
INTRODUCTION AND OVERVIEW
In Brief
Since June 2006, students in California have been required to pass the California High
School Exit Exam (CAHSEE) to receive their high school diploma (California Department of
Education, 2007a). California Department of Education (CDE, 2007b) data reveal a stable trend
of tens of thousands of students dropping out of high school during grades 9, 10, and 11, but
since 2000 there has been a relative increase in the number of students who have dropped out
after entering grade 12. Better understanding the characteristics and educational experiences of
the group of students who have not passed the CAHSEE as of the fall of their twelfth-grade year
is of great interest, particularly to gain further understanding of factors associated with students
choosing to drop out and those who pursue other viable education alternatives.
Primary Purpose
Data from the CDE reveal that between 2000-2006, whereas the number of students who
dropped out of school was relatively stable in grades 9, 10, and 11, the number of dropouts in
Grade 12 increased from 14,202 in 2002 to 33,286 in 2006 (CDE, 2007b; data available online).
Using CDE data from 2000 to 2006, the range of the number of students who drop out of Grades
9-11 is 11,000–15,000 per grade level. For example, in 2006 11,627 ninth-grade students, 11,249
tenth-grade students, and 13,217 eleventh-grade students dropped out. These data show that by
the time students are enrolled in Grade 12, there have already been a large number of dropouts
(over 36,000 students dropped out from Grades 9-11 in 2006). Given the substantial number of
students who drop out during Grade 12, there is great interest in better understanding who these
youths are and what happens to them during and immediately after their senior year of high
school. Furthermore, it is documented that 69% of students pass both the English Language Arts

6
and Mathematics sections of the CAHSEE in Grade 10, and 15% pass in Grade 11 for a total of
84% of students who have successfully passed by the time they enter Grade 12 (Human
Resources Research Organization [HumRRO], 2007). Students who are still in school but have
yet to pass the CAHSEE in Grade 12 warrant further understanding, particularly when
considering the recent increase in the number of dropouts among high school seniors. The
present study focuses on academically high-risk twelfth-grade students who had not passed the
CAHSEE as of the fall term, but still persisted in their high school education through the end of
their senior year.
Contemporary Context
In the current context of No Child Left Behind (NCLB Act, 2001), federal law makes high
schools accountable for the education of their graduating seniors. For many states, this
accountability requirement took the form of an exit exam, which requires students to display a
minimum level of academic skill in order to receive their diploma. According to the California
Department of Education (CDE, 2007a), the California High School Exit Exam was designed to
improve student achievement and provide a standardized way for schools across the state to
ensure reading, writing, and math competency for their graduating students. The CAHSEE is a
relatively new requirement in California; thus, little is known about its potential influence on the
graduation and future plans of students (see HumRRO, 2007 and CDE website
www.cde.ca.gov/ta/tg/hs/evaluations.asp for further details of independent evaluations).
This report presents results from a study in which information was gathered on
characteristics and experiences of students who had not passed the exam as of the fall of twelfth-
grade; hence, this group of students entered their senior year of high school vulnerable to not
receiving a high school diploma even if they otherwise fulfilled all other diploma requirements.

7
This report also explores factors associated with passing the CAHSEE, graduating high school,
and post-secondary school attendance for these students—including analyses of what happens to
students who do not pass the CAHSEE.
Description of the CAHSEE
Descriptions of the content and history of the CAHSEE can be found on the CDE website
(2007a). In brief, the CAHSEE is a minimum competency test based on California content
standards, and is divided into two sections: English/language arts (ELA) and mathematics.
Although the CAHSEE was first administered in 2001, it was not until spring 2006 that—in
addition to completing the necessary course credits—students in California were required to pass
the CAHSEE in order to receive their high school diploma (see CDE, 2007a, for a full discussion
regarding the development and implementation of the CAHSEE). Starting in Grade 10, students
can take the CAHSEE up to six times until they pass both sections—with an additional summer
administration offered to students who still have not passed at the end of their senior year. For
students who struggle to pass the exam, schools are required to provide remedial opportunities
and extra support, the form of which varies from district to district. Districts are also required to
make modifications and/or provide accommodations when necessary for students with
disabilities. Students enrolled in special education programs may qualify for an exemption from
the exam. Students with limited English proficiency who are classified as English Language
Learners (ELL) may hear test directions translated into their primary language or ask clarifying
questions and receive answers translated into their primary language. ELL students may be
allowed to use a language translation glossary, take the test in the same room as other ELL
students, and be given additional assistance.

8
Analyses of the CAHSEE
Analyses of the CAHSEE were sanctioned by the CDE in January 2000, when the exam
was in its preliminary stages and not yet a graduation requirement. The task of conducting an
independent evaluation of the CAHSEE was granted to the Human Resources Research
Organization (HumRRO). HumRRO has produced a yearly evaluation of the exam and in the
most recent 2007 report, they examine the test in its first and second year as a graduation
requirement. Approximately 100,000 students in 2006 and 110,000 in 2007, entered their senior
year without having yet passed the CAHSEE. Of these students, approximately 25% had special
education exemptions. When these students were excluded, in both 2006 and 2007,
approximately 39,000 students did not pass the exam by the end of their senior year. Analyzing
this population further for 2007, it was found that 46% of these students were English Language
Learners (ELL), 62% were economically disadvantaged, and 65% were Hispanic (the percentage
in each of these groups is similar in both 2006 and 2007). HumRRO data also revealed that about
40% of seniors in the class of 2006 who did not pass the CAHSEE by the end of their senior year
continued to take the exam as repeat high school or adult education students. Of these, about
25% went on to pass the exam within the next year.
HumRRO conducted further analyses on the ELL students in their study. Not
surprisingly, they found that ELL students were more likely to pass the mathematics section of
the exam in comparison to the likelihood of passing the ELA section. In 2007, HumRRO found
that only 18% of ELL twelfth-graders who were still taking the CAHSEE passed the ELA
section by the end of the school year. This finding was related to how long the ELL student had
been enrolled in United States schools, as more recently enrolled students had lower passing
rates on the ELA section. The study also examined students who had been reclassified as having

9
English proficiency (RFEP) and found that they actually did slightly better on the ELA than the
mathematics section, which was comparable to the general population of students. The RFEP
students also had higher passing rates on the ELA and mathematics sections than ELL students
and English-only students. HumRRO hypothesized that RFEP students perform better than ELL
students because they have had experience taking language tests, as the California Expressive
Language Development Test (CELDT), a requirement to be reclassified as fluent in English, is
administered annually starting in kindergarten until ELLs demonstrate English proficiency.
HumRRO (2006) also conducted a survey for students who had not yet passed the
CAHSEE and found that over 60% of seniors entering their final year reported that the exam was
the factor most likely to prevent them from graduating. Another student survey found that 89%
said they needed to work harder in some way to meet the CAHSEE requirements, 40% claimed
to be working harder in their classes, 20% were going to take extra classes, 16% were repeating a
course to learn the material better, and approximately 15% were getting help outside the
classroom. Approximately 20% of twelfth-graders reported that the CAHSEE covered material
they did not learn in their classes. In 2007, HumRRO also asked students what they thought they
would do after they completed high school and found a large majority were planning to pursue
further education. Finally, in a survey of principals, the top barrier reported as preventing
students from passing the CAHSEE was a language barrier, followed by poor school attendance.
Relevant School Dropout and Completion Literature
In order to guide the focus of the current study, surveys were developed by drawing upon
research examining high school dropout and school completion. Many scholars have studied the
characteristics of students who do not complete high school, and the current study compares how
the population of high school dropouts may or may not compare to the current study’s population

10
of students who persist through high school but do not graduate and/or do not pass the CAHSEE.
The extant literature includes over 125 variables associated with school dropout and identifies a
range of factors that may put students at risk for dropping out or increase their chances of school
completion (Rosenthal, 1998; Rumberger, 2004). Below is a brief summary of important
variables examined in this study, including student factors, school factors, and family factors.
Student Factors
Risk factors such as a history of poor academic achievement (Gleason & Dynarski,
2002), grade retention (Jimerson, Ferguson, Whipple, Anderson, & Dalton, 2002), and behavior
problems (Dowrick & Crespo, 2005) are associated with poor school completion outcomes.
Students who take on adult responsibilities such as working full-time or being a parent also tend
to drop out at higher rates (Gleason & Dynarski, 2002; Rosenthal, 1998). Personal factors such
as low self-esteem or self-confidence, impulsivity and low levels of self-control, and low
educational self-expectations have also been identified as risk factors (Dowrick & Crespo, 2005;
Gleason & Dynarski, 2002; Rosenthal, 1998).
School Factors
“Disliking school” has been the most frequently cited reason why students drop out of
school (Ekstrom, 1986; Rumberger, 1987). Other research has focused on demonstrating the link
between student engagement and school completion (Finn & Rock, 1997; Reschly &
Christenson, 2006). Additionally, a sense of school belonging has been associated with better
academic outcomes for Mexican-American and other Latino high school students (Gonzalez &
Padilla, 1997; Sanchez et al., 2005). Some research has found that students who participate in
extracurricular activities are more likely to complete high school (Randolph, Fraser, & Orthner,
2004), and similarly positive academic experiences have been found for Latino students

11
participating in extracurricular activities (Davalos, Chavez, & Guardiola, 1999; Martinez,
DeGarmo, & Eddy, 2004). Emergent research also shows that student engagement impacts
friendship networks and subsequent school completion/dropout in ways that may or may not
differ by race/ethnicity (Ream & Rumberger, in press).
Family Factors
Family factors such as socioeconomic status, minority group status, parental employment
status, single parent households, and home languages other than English have been found
influential regarding school completion rates (Dowrick & Crespo, 2005; Gleason & Dynarski,
2002; Randolph, Fraser, & Orthner, 2006; Rosenthal, 1998; Rumberger, 1987; Steinberg, Blinde,
& Chan, 1984). Although the dropout rate for Latino youths has declined somewhat in recent
years, dropout rates for Latino youths have consistently remained higher than rates for other
ethnic groups (Jimerson et al., in press). Additionally, parent expectations for the level of their
child’s educational attainment has been found to be associated with a variety of educational
outcomes for high school students (Jeynes, 2007). Factors involving parent communication and
support have also been associated with positive academic outcomes for Latino high school
students (Alfaro, Umana-Taylor, & Bamaca, 2006; DeGarmo & Martinez, 2006; Eamon, 2005).
Reflections on School Completion Literature
Although much information is available regarding risk factors for high school dropouts in
general, less is known regarding the school completion experiences of ELL students. This
population of students may be particularly vulnerable for deleterious educational outcomes given
their lack of language proficiency. A statistic that may shed light on school completion for ELL
students is that an alarming 36.5% of Latino young adults (ages 16-24) born outside the United
States (who immigrate to the United States during their childhood) do not complete a high school

12
education (National Center for Educational Statistics, 2005). Similarly, a recent report of school
completion and dropout in California revealed that more than 40% of Latino students drop out
(WestEd, 2005). The dropout rate is halved among non-immigrant Latinos, however. Smith’s
(2003) related findings in The American Economic Review are particularly compelling in that he
tracked educational attainment among Latinos of Mexican descent over successive generations
rather than taking a single snapshot of Latinos in any one year. The high Latino dropout rate
likely reflects many complex issues, such as language acquisition as well as a variety of issues
such as acculturation. Cognitive academic language proficiency skills take an average of five to
seven years to develop. Therefore, ELL students may be at a disadvantage for fulfilling academic
requirements, including the ELA section of the CAHSEE. Given the large and growing
population of Latino students in California, the issue of the interplay between language
acquisition and standards/accountability needs to be addressed in future efforts to reduce the
education gap.
Current Study
The purpose of the present study was to provide further information and insights
regarding the unique group of students who were still enrolled in school but had not passed the
California High School Exit Exam as of the fall of their twelfth-grade year. Student participants
in this study entered Grade 12 during the 2006-2007 academic year and were enrolled in one of
four school districts in southern-central California coastal regions. The districts from which this
sample was selected included urban, suburban, and more rural communities. Although this
sample is not representative of the entire state of California, it nonetheless provides sufficient
information with which to better understand the factors associated with high school completion
among high school seniors who have not passed the CAHSEE. See Appendix 1 for a brief

13
summary of participating school districts. School district liaisons randomly selected students
(50, 50, 49, and 18 students from each of the four districts, for a total of N = 167) to participate
in the study from a list of students who had not yet passed both sections of the CAHSEE as of
the fall of their senior year. For the purposes of this report, these students are considered to be of
“high academic risk” given that they had not yet passed the CAHSEE by fall of their twelfth-
grade academic year (these students are among the 16% of high school seniors who have not
passed the exam as they begin Grade 12. These students can also be considered educationally
“persistent” because they continued to persist in their education through their senior year of high
school, despite the setback of not yet having passed the CAHSEE.
Student participants completed the initial survey during the spring of their senior year to
gather further information on their backgrounds, educational experiences, and education
expectations. See Appendix 2 for the complete initial survey. The follow-up telephone survey
with the students (43, 44, 47, and 14 students, respectively, n = 148) during the fall after twelfth-
grade was completed. This follow-up survey yielded data on educational outcomes, work
experiences, and life satisfaction. See Appendix 3 for the complete follow-up survey.
Additionally, demographic information on students was obtained from each school
district to determine ethnicity, gender, birth date, language proficiency, home language,
free/reduced lunch status, special education status, discipline referrals during the 2006-2007
school year, absences during the 2006-2007 school year, number of credits earned as of spring
2007, GPA as of spring 2007, standardized state test scores during the 2005-2006 school year
(note that Grade 11 test scores were used because Grade 12 students do not take the standardized
state tests), and CAHSEE pass/not pass status as of spring 2007. See the Appendices for more
detailed information on measures used in this study.

14
Research Questions
Results of the current study are reported in three sections:
1. Results from the initial survey provide information regarding the characteristics and
experiences of students who had not passed the exam as of the fall of Grade 12.
Questions such as the following are answered in this section: What are the demographic
backgrounds of these academically high-risk but persistent students? Specifically,
language, socioeconomic status, gender, and ethnic backgrounds will be examined. What
have these high-risk but persistent twelfth-graders experienced up to this point in their
academic careers? Specifically, academic experiences, educational placements, behavior
problems, school perceptions and involvement, educational plans/self-expectations, work
experiences, and personal/family/friend characteristics will be examined.
2. Results from the follow-up survey describe what happened to these academically high-
risk but persistent students following their senior year of high school. Questions such as
the following are answered in this section: What percentage of these high-risk but
persistent students graduated high school and enrolled in post-secondary school? What
kind of self-expectations for educational attainment do these students hold for
themselves? What kind of work experiences and life satisfaction do these students report
following their senior year?
3. Results of outcome analyses are provided to explore what factors predict which students
eventually passed the CAHSEE, as well as other educational outcomes. Questions
answered in this section include: What characteristics predict which of these
academically high-risk but persistent students eventually succeeded in passing the
CAHSEE by the end of their senior year? What characteristics predict which of these

15
students graduated high school? What characteristics predict which of these students
enrolled in post-secondary education? What characteristics predict which of these
students did not graduate, but pursued other viable educational options?
SECTION 1: INITIAL SURVEY RESULTS
The initial survey provided data on student participants during the spring of Grade 12.
Data from the initial survey provide information regarding student demographics; academic
experiences; educational placements; behavioral problems at school; perception, values, and
involvement in school; educational plans and self-expectations; work characteristics; and
student, family, and friends’ characteristics. Additional demographic information obtained from
the school districts is also provided.
Demographics
1.1 Basic Demographics
Demographic information on this sample of high academic risk students was obtained
from self-reported data on initial surveys, as well as from data obtained through school district
databases. The vast majority of participants were Latino students from low socioeconomic
backgrounds. Of the 167 students in the present study, there were 83 males and 84 females of
which 87% were Latino, 4% White, 4% Asian/Pacific Islander, 4% African American, and 1%
American Indian. Their ages ranged from 17 to 21 years, with an average age of 18.5 years. A
large majority (78%) were considered to be of low socioeconomic standing based on their
eligibility for the free lunch program. See Table 1.1 for a summary of basic demographic
characteristics.

16
1.2 Language Demographics
Initial survey data also provided language demographic information such as language
history, involvement in language programs at school, as well as students’ perceptions of their
proficiency in both English and Spanish. A large number of participating students reported
being native Spanish speakers. In fact, 75% of students reported that English was not their
native language—and 93% of these non-native English-speaking students identified Spanish as
their native language. From school archival data, Spanish was considered the home language for
78% of students in this sample, 15% had English as their home language, and 7% had another
language (i.e., Mixteco, Cambodian, Farsi, Korean, Filipino, or Thai) listed as their home
language. Well over half (59%) of the participating students reported having been in an English
as a Second Language (ESL) course or program at their school. See Table 1.2 for a summary of
language demographics.
1.3 Language Proficiency
Data obtained from school records revealed that a majority of these students were
considered English Language Learners (ELL). Seventy-nine percent of students in the sample
were ELL compared to 13% of students who spoke only English. Schools may also reclassify a
student’s ELL status and 7% were reclassified as English proficient. See Table 1.3 for data on
language proficiency.
1.4 Perceived Language Proficiency
Students reported their perceived level of language proficiency in the initial survey.
Participants reported a relatively stronger grasp (i.e., understanding, speaking, and
reading) of the Spanish language as compared to the English language. Fifty-eight percent
reported understanding spoken Spanish “very well,” as compared to the 45% who reported

17
understanding spoken English very well. Sixty-two percent reported speaking Spanish very well,
as compared to 32% for English. Forty-nine percent reported reading Spanish very well, as
compared to 32% for English. Finally, 43% reported writing Spanish very well, as compared to
33% for English. See Table 1.4 for a summary of perceived language proficiency.
Academic Experiences
1.5 Academic Achievement
Students in this study demonstrated a wide range of scores on measures of academic
competency. The current sample had an average GPA of 2.33 (SD = .57), ranging from 0.66 to
3.78. On the California Standards Tests (CST), the majority of students scored below basic or far
below basic (87% for math, 81% for English). In regards to credits earned, students completed an
average of 231 (SD = 34.18) credits by the end of their senior year. Credits earned ranged from
100 to 335. See Table 1.5 for a summary of academic achievement.
1.6 Time Spent on Homework
Another area in which data were collected was academic behavior—specifically, time
spent on homework each week. All participants reported spending some time engaged in
homework each week, most reported at least 1 to 3 hours a week. A large percentage of
students (82%) reported spending between 1 to 9 hours on homework each week, both in and out
of school. A smaller proportion (12%) indicated spending higher amounts of time on homework.
Out of all the possible response options, the highest percentage (46%) of students reported
spending between 1 to 3 hours on homework each week. See Table 1.6 for a summary of time
spent on homework.

18
1.7 Experience with the CAHSEE
Students reported the number of times they had taken the CAHSEE English and Math
sections as of spring their senior year and the results revealed a wide range of experiences.
Fifteen percent of students reported having taken the CAHSEE English section just once (16%
took Math just once), and 12% reported having taken the CAHSEE English section more than
five times (7% took Math more than five times). These data revealed that students who did
not pass the CAHSEE as of their senior year represent a wide range of prior experiences
with the CAHSEE including both students who have had minimal attempts at passing the
CAHSEE, as well as students who have attempted to pass the CAHSEE on numerous prior
occasions.
The majority of students in this sample were involved in activities to help them
prepare for the CAHSEE (with only 8% reporting no involvement in special preparation
activities). Many students reported having a special class to learn material for the exam (64%),
reviewing the material in class (49%), and tutoring to help them prepare for the exam (26%).
When students were asked about where they went for information about passing the exam, the
majority of students reported going to their guidance counselors (74%) and teachers (68%).
Some students also reported getting information from other sources such as friends (38%), tutors
(20%), parents (22%), siblings (10%), other relatives (7%), and coaches (3%). These data show
that most students in this academically vulnerable sample reported being involved in special
efforts to help them prepare for the exam and having various people—especially school staff—to
go to for information about passing the CAHSEE.
School districts provided data on whether or not students had passed the CAHSEE as of
the spring of their senior year. The data showed that 66% of students had passed the Math

19
section of the CAHSEE, but only 26% had passed the English section of the CAHSEE by the
spring of their senior year. It should be noted that these percentages reflect those students who
had not yet passed in the fall but succeeded in passing by the spring of that same year. Eighty
percent of this high academic risk sample failed to fully pass the CAHSEE by the end of
their senior year. This percentage from the current study is higher than results found in the
HumRRO 2007 report, in which 52% of students who had not passed the CAHSEE at the
beginning of their senior year failed to pass the CAHSEE by the end of that year. Demographic
data may help explain these different findings. While HumRRO reported 52% ELL, 66%
economically disadvantaged, and 66% Latino students in their sample, our sample contained
79% ELL, 78% economically disadvantaged, and 87% Latino. It appears that the sample in the
current study faced higher demographic risk factors, which may help explain their poorer
CAHSEE performance. See Table 1.7 for a summary of student experiences with the CAHSEE.
Educational Placements
1.8 Educational Programs
According to school data, 15% of the sample currently had Special Education status
during their senior year. Based on student surveys, 19% of students reported ever having been
in a special education program. Seventeen percent of students reported ever having been
involved in a vocational program in high school. See Table 1.8 for a summary of student
involvement in various educational programs.
1.9 Grade Retention
Students reported in the initial survey whether or not they ever experienced grade
retention, and at which grades they were retained. The majority of participating students had
not been retained, but 16% reported a history of grade retention. Of those students who had

20
been retained, a variety of grade levels were reported regarding when students experienced being
held back in school. Twelfth grade and first grade were the most frequently reported grade levels
at which students were held back, at 21% and 18%, respectively. It should also be noted that 11
students reported being retained more than once—thus, 41% of retained students had been
retained more than once. It is important to note that the participating students were high school
seniors and previous literature reveals that students who are retained are likely to leave school
before their senior year (see Jimerson, Anderson, & Whipple, 2003). See Table 1.9 for a
summary of grade retention experiences.
Behavior Problems at School
1.10 Tardies, Truancy, Absences, Not Following School Rules
On the initial survey, students were asked to report how many times they had been tardy,
truant, or absent during the second semester of the past school year—as well as how many times
they were in trouble for not following school rules. Results showed a wide variety of experiences
with these problem behaviors. Although many students reported having never or rarely been
tardy, truant, absent, or in trouble for not following school rules, a handful did indeed
report that these behaviors/events had occurred 10 or more times (i.e., 16% for tardies, 8%
for truancy, 13% for absences, and 3% for not following school rules). Additional data were
obtained from school district records on student absences, revealing that students were absent an
average number of 7.5 days for the school year—with a range of 0 days to 48 days, and the
majority falling under less than 20 days absent. See Table 1.10 for a summary of these results.
1.11 Suspensions, Transfers, Expulsions
Students also reported on the initial survey how many times they had been put on in-
school suspension, given out-of-school suspension, transferred to another school for disciplinary

21
reasons, and/or expelled from school during the second semester of the past school year. The
majority of participating students reported not being involved in any of these types of
disciplinary sanctions. Eighty-nine percent had never had in-school suspension, and 93% had
never had out-of-school suspension. Ninety-eight percent of students had never been transferred
to another school for disciplinary reasons, and 98% had never been expelled from school.
However, 10% received in-school suspensions and 7% received out-of-school suspensions to
varying degrees of frequency. Also, 3% had been transferred, and 2% expelled. See Table 1.11
for a summary of these results.
Perceptions, Values, and Involvement in School
1.12 Student Perceptions of School / Education
Students completed a school connectedness scale on the initial survey, indicating how
close they felt to people at school, how happy they were to be at their school, how much they felt
like they were a part of the school, how fairly they felt teachers at school treated students, and
how safe they felt at school. In general, students reported highest percentages of feeling
connected to school or not being sure how they felt. For each connectedness item, over half
(between 54% and 66%) reported agreeing moderately or strongly. Although numbers were
lower for students reporting that they did not feel connected, it should be noted that 19%
reported not feeling close to people at school; 14% were not happy to be at their school; 22% did
not feel like they were a part of their school; 19% did not feel teachers treated students fairly at
their school; and 21% did not feel safe at school. The school connectedness scale results revealed
an overall average score of 2.63 (on a 0-4 scale), indicating that students felt generally neutral-
to-moderately connected at school. This finding is relatively consistent with school
connectedness results from other studies of randomly sampled adolescents (Sharkey, You, &

22
Schnoebelen, in press). Students in the current study of high academic risk youth actually
reported slightly higher levels of school connectedness. See Table 1.12 for a summary of school
connectedness.
1.13 Value of Education
Students also completed a scale indicating their beliefs about the value of education.
Scale items included four statements about the value of education, including: education is the key
to success in the future; the way for poor people to get ahead is for them to get a good education;
young people have a chance of making it if they do well in school; and regardless of where you
come from, or who you are, if you work hard and get a good education, you have a chance to
make it in America. Students could respond that they strongly disagree (score of 0), disagreed
(1), felt neutral (2), agreed (3), or strongly agreed (4) with each statement. Responses revealed
that three-quarters of the students agreed or strongly agreed with these statements; thus,
reflecting the positive perception of the value of education among participants. See Table
1.13 for a summary of these findings.
1.14 Extracurricular Activity Involvement
On the initial survey, students provided data describing whether or not they participated
in various school-sponsored extracurricular activities, and to what degree they participated. The
majority of students reported participating in at least one extracurricular activity, with
38% not participating at all. For each category, between 4% and 24% of students reported
participating. Interscholastic sports, intramural sports, and academic clubs were the most highly
cited activities (24%, 22%, 22%, respectively). See Table 1.14 for a summary of extracurricular
activity involvement.

23
1.15 Total Hours Spent on Extracurricular Activities Per Week
Students also reported how many total hours per week they typically spent on school-
sponsored extracurricular activities. Most students reported spending less than 1–4 hours
each week on extracurricular activities. Among those involved in extracurricular activities,
30% reported no involvement; 15% reported spending less than 1 hour per week on
extracurricular activities; and 33% reported spending 1–4 hours per week on extracurricular
activities. Smaller percentages reported spending five or more hours per week on extracurricular
activities. See Table 1.15 for a summary of time spent on extracurricular activities.
Educational Plans and Self-Expectations
1.16 Current Educational Plans
On the initial survey, students were asked to report on their current educational plans (as
of the spring of their senior year). Nineteen percent of students expressed plans for earning a
regular high school diploma by re-enrolling in high school, independent study, adult secondary
school, district courses to prepare for the CAHSEE, or community college adult education
programs. Another 23% reported plans to earn an equivalent diploma by either passing the
General Educational Development test (GED) or the California High School Proficiency Exam
(CHSPE). The majority of participants reported plans to enroll in some form of
postsecondary education. Forty-one percent planned to enroll in community college, another
9% in trade/vocational school, and 6% in a four-year college. Only 4% of students reported
having no current plans to attend further school. From these results, it appears that in the
spring of their senior year many of these students planned on earning their high school
diploma and/or pursuing further education. See Table 1.16 for a summary of current
educational plans.
24
1.17 Educational Self-Expectations
Students were also asked on the initial survey how far in school they believed they would
get. Only 8% reported that they would likely stop at getting their high school diploma through
normal graduation or through the equivalent GED/CHSPE. Only 2% believed they would not
finish high school or receive any sort of diploma. A large majority of students expressed
aspirations of pursuing further education. Twenty-six percent responded that they believed
they would finish one to two years at a community college, while about 50% of the students said
they would go on to attend a four-year college or beyond. These results reveal that students
who had not passed the CAHSEE upon entering their senior year still tended to have high
self-expectations of furthering their education. See Table 1.17 for a summary of educational
self-expectations.
Work Characteristics
1.18 Work Experiences
Students in this sample reported a wide range of work experiences. Most students
reported work experience, although the range of current and previous employment varied
considerably. Thirty-one percent had never worked for pay; however, 33% were currently
employed, 19% had a summer job only, and 17% had worked before but were not currently
employed. Students demonstrated some variety regarding when they began their current or most
recent jobs, but most students (83%) began their jobs within the past few years. Of the students
who were employed during their senior year, 29% worked 0-9 hours, 25% worked 10-19 hours,
and 46% worked 20 or more hours. Although the majority of the students (67%) reported not
working during their senior year, one-third did—and according to their report, most of them
worked long hours. Data on students who were currently, or at one time, employed showed that
25
most reported working between 1-9 hours (63%), with some (33%) working 10-19 hours and
fewer (5%) working 20 or more hours on the weekends. See Table 1.18 for a summary of work
experiences during the school year.
1.19 Summer Work Plans
Most students planned to work during the summer. When asked if they had a regular
job lined up for the summer, 47% of the students reported that they already had a specific job
opportunity planned for the summer. Another 45% claimed to be looking for a summer job, and
8% said that they had not done anything to find a summer job. Participating students had a
variety of employment prospects, the most common being fast food workers, cashier/grocery
clerks, salespersons, and construction related jobs. See Table 1.19 for a summary of students’
summer work plans.
Student Characteristics
1.20 Self-prediction of Graduation Status
Several sections of the initial survey completed in the spring of the senior year focused
on personal characteristics and values of seniors who had not yet passed the CAHSEE. Over
three-fourths of the participating students (77%) predicted that they would go on to
graduate from high school this year, whereas less than one-fourth (23%) believed they
would not. When students who did not believe they would graduate from high school were
asked what they thought would be the reasons for not graduating, most of the students
(68%) reported that they would not pass the ELA section of the CAHSEE. Less than half
reported that they would not have enough credits and about a quarter believed not passing the
math section of the CAHSEE would prevent them from graduating. Some students had concerns
about more than one barrier, such as failing both sections of the CAHSEE or failing the

26
CAHSEE and lacking the necessary credits to graduate. See Table 1.20 for a summary of self-
prediction of graduate status.
1.21 Views on the Importance of Life Attainments
On the initial survey, students also indicated the importance of various life attainments.
Trends in the data revealed that the most valued life attainments included getting a good
education and not only getting a good job, but also being successful or an expert in their
career field. Participating students also felt strongly about giving their future children
opportunities that they never had. In addition, while not as strongly supported by the overall
sample, having strong friendships and being an active and informed citizen were reported to be
areas of particular importance. Only 16% reported that “getting away from this area of the
country” was very important to them, which was the lowest response for this category of
importance out of all the items listed. See Table 1.21 for a summary of views on the importance
of life attainments.
1.22 Academic Self-Efficacy and Life Satisfaction
Overall, students on the initial spring survey reported an average academic self-
efficacy score of 1.87, indicating a modest sense of believing that they could engage in the
behaviors needed to succeed in school through effort and persistence. On the Students’ Life
Satisfaction Scale (SLSS, Huebner, 1991), participating students had a mean score of 3.91 on the
initial survey, indicating that they felt a mild level of satisfaction with their current lives. Other
studies using this scale have found typical adolescents score approximately 4.21 on the SLSS
(Huebner et al., 2000; Suldo & Huebner, 2004). Thus, average SLSS score of students in this
sample was just below a typical population. See Table 1.22 for a summary of self-efficacy and
life satisfaction scores.

27
Family Characteristics
The initial survey yielded information on a variety of family characteristics such as
family structural living situation, parents’ educational expectations as perceived by the students,
and level of communication between students and their parents.
1.23 Family Structure
Results showed that approximately half of the students reported living with both
their mom and dad, 25% lived with their mom only, 5% with only their dad, and 12%
without their mom or dad. It should be noted that the survey question only asked whether the
student was living with their mom or dad and did not specify whether they were stepparents or
biological parents. Therefore, these results reflect students’ interpretation of who they considered
to be a “mom” and a “dad.”
1.24 Parent Expectations
Previous sections provided information on students’ self-expectations for educational
attainment. The initial survey also contained items in which students indicated what they believe
their mother and father think is the most important thing for them to do right after high school,
including attending post-secondary school. By far, the most frequently rated perceived
mother and father expectations for student educational attainment was to attend college
after high school. Eighty-six percent of students indicated that their mothers viewed post-
secondary school attendance as most important, and 70% of students indicated that their fathers
viewed post-secondary school attendance as most important. The next highest option was getting
a full-time job, in which 6% of mothers and 9% of fathers were believed to expect their children
to do. Parent expectations to enter the military, get married, and do whatever you want were all
endorsed by 2% or less of students in our sample. See Table 1.24 for a summary of these results.

28
1.25 Parent-student Communication
On a measure of family communication, participating students averaged a score of 1.31
on a scale from 0.00-2.00, indicating that students tended to discuss educational topics and other
topics relevant to their lives with their parents to a moderate degree (between sometimes and
often). When analyzing individual sections of the measure, students most often talked to their
parents about grades, college attendance, and employment they would like after high school.
Students reported talking to their parents somewhat less frequently about school activities,
choosing classes at school, current events less frequently, and things that were troubling them.
The overall pattern revealed that students were more likely to talk to parents about all of
these topics either “sometimes” or “always,” and less likely to report “never” talking to
parents about these topics. See tables 1.25a and 1.25b for a summary.
Friend Characteristics
During high school years, peers play a tremendously influential role in students’ lives.
Data were collected in the initial survey on characteristics of participating students’ friends.
1.26 Friend Characteristics
Students provided information in the initial survey regarding different outcomes their
close friends were choosing (or likely to choose) after high school. Examination of the data
revealed patterns in the number of friends, ranging from 0–4 or more, that were heading down
various post-secondary school paths. For example, most students reported believing several
friends or more were planning to enroll in some form of postsecondary education after high
school, whereas many did not have any friends or only one friend planning on going into the
military or becoming a homemaker. Students reported a fairly even distribution of friends
(from 0-4 or more) who had dropped out of high school without graduating, indicating that

29
many of these high academic risk youths have friends who were also academically at-risk.
Many students also reported having one or more friends who planned to secure a full-time job
right after high school. From these reports, it seems that students in this sample have friends with
a variety of educational / vocational plans. See Table 1.26 for a summary of friend
characteristics.
1.27 Friend Expectations
A large majority (77%) of participating students reported believing that their
friends thought college was the most important thing for them to do after high school. Six
percent reported believing that friends would think the student getting a job right after high
school is most important, and 9% reported believing that friends would think the student should
do whatever he/she wants. See Table 1.27 for a summary of friend expectations.
SECTION 2: FOLLOW-UP SURVEY RESULTS
As reported above in Section 1, the initial survey provided information about the student
participants during the spring of their senior year in high school. Data from the follow-up survey
reveals subsequent information about these students’ outcomes during the fall following Grade
12. The follow-up survey was a shortened version of the initial survey that highlighted outcomes
such as whether or not these students graduated high school and enrolled in post-secondary
school, their updated self-expectations for educational attainment, actual work experiences
following their senior year, and life satisfaction measures. The follow-up fall survey data were
obtained from 148 (89%) of the 167 students who took the initial spring survey.

30
Educational Outcomes
2.1 Graduation Status at Follow-up
Results from the follow-up survey reveal that 47% of the students in this sample of
individuals who were at high academic risk went on to pass the CAHSEE and receive their high
school diploma as of the fall following their senior year; however, 53% did not. Students who
had not graduated at follow-up were asked to provide reason(s) for why they did not graduate. A
total of 72% of the non-graduates reported not passing the ELA section of the CAHSEE.
Thirty-four percent of non-graduates reported not passing the math section of the CAHSEE. As
Richard Durán points out in related literature, lack of English proficiency can inhibit student
performance even on mathematics tests (Durán, 1987, pp., 119-121). Many students reported a
combination of reasons for not graduating, but 48% reported not graduating solely due to not
passing the ELA section of the CAHSEE. This finding is not surprising because nearly 80% of
students sampled were considered ELL with Spanish as their home language.
It should be noted that, as reported in Section 1.7, previous school records from the
spring of the students’ senior year indicated that 80% of the students had not fully passed the
CAHSEE by the end of their senior year. Follow-up data reveal that many more went on to
receive their diploma after their senior year. It seems that many of these students took advantage
of extra support options and eventually passed the CAHSEE during the summer exam period
after school ended.
Referring back to the initial survey, when students were asked if they expected to
graduate from high school that year, approximately three-fourths indicated they would. Of the
students that reported they would not graduate from high school that year, 77% ended up
not graduating and 24% did, indicating that they generally had a realistic appraisal of

31
their prospects of earning a diploma. Among the students who reported that they would
graduate, more than half (55%) went on to actually graduate and receive their diploma by
September 2007. On the initial survey, students who did not believe they would graduate were
also asked what might prevent them from doing so. These students listed the ELA section of the
CAHSEE most frequently as the main factor that would prevent them from graduating. Follow-
up data confirmed these predictions and found that for non-graduates, not passing the ELA
section outweighed both not passing the mathematics section and not having enough credits to
graduate. However, it appears that more students who did not graduate (29%) ended up not
having enough credits to graduate—compared to the 13% who had originally been concerned
about credits holding them back from graduating.
2.2. Current Educational Activities at Follow-up
The follow-up survey also revealed what kinds of educational activities these students
were involved in during the fall following their senior year. Students who had graduated with
their diploma overwhelmingly reported involvement in post-secondary education. Sixty-six
percent were attending a community college that fall, and an additional 24% reported that they
had plans to enroll in further schooling within the upcoming year. Only 9% of the high school
graduates said they did not plan to attend further schooling.
For students who did not receive their diploma, 13% were working toward their high
school diploma by re-enrolling in high school, and 19% were pursuing options such as tutoring,
independent study, adult secondary school, or district CAHSEE courses to work toward
receiving their diploma. Thirty-one percent of students who did not graduate high school
were attending community college in the fall following their senior year. Twenty-five
percent of these non-graduates who were attending post-secondary school were also

32
simultaneously working on passing the CAHSEE and earning their high school diploma
through extra district courses, tutoring, or independent study. In addition, 24% of non-
graduates reported intentions to attend further schooling within the upcoming year. As with
graduates, 10% of students who did not receive their diploma had no further educational plans. It
was interesting to note that none of the participating individuals reported that they were
attempting to earn their equivalent high school diploma by passing the GED and none were
attending a 4-year college or university at the time of the follow-up survey. See Tables 2.2a,
2.2b, and 2.2c for summaries of educational plans for all students in the sample, high school
graduates, and students who did not graduate high school.
2.3 Educational Self-expectations at Follow-up
The follow-up survey in the fall 2007 also provided an opportunity to assess students’
educational self-expectations following their senior year of high school. Students were asked
how much education they thought they would eventually attain. Thirty-five percent reported self-
expectations of attending community college. Even in this academically vulnerable group, 34%
expected to complete a 4-year college degree and 12% reported expecting to complete education
beyond four years of college. Comparisons of self-expectations from the initial survey to the
follow-up survey show some interesting patterns. On the initial survey, 26% had reported
expecting to complete community college, and 24% had reported expecting to graduate
from a 4-year university. At follow-up, these percentages increased to 35% for finishing
community college, and 34% for graduating from a 4-year college. Fewer students reported
that they did not know how far they would get and fewer also believed they would stop at only a
high school diploma. Despite their struggles, the educational aspirations of these students
33
actually increased after their senior year of high school. More students also reported aspirations
of getting a Master’s degree and beyond at the follow-up survey.
Comparisons were made between self-expectations of graduates and non-graduates.
Students who graduated with a diploma reported similar, though slightly higher, future
educational expectations as those who did not graduate. Thirty-nine percent of these
graduates reported that they would complete community college and another 39% reported that
they would eventually complete a 4-year college. Comparatively, 32% of those that did not
graduate reported that they would go on to complete community college and 30% reported that
they would eventually graduate from a 4-year college. These findings may reflect relevant
literature regarding the differences between students’ educational motivations/expectations and
their actual behaviors (Schneider & Stevenson, 1999). See Table 2.3 for a summary of
educational self-expectations at follow-up for all students, those who graduated, and those who
did not graduate.
Employment Outcomes 2.4 Work Characteristics at Follow-up
In the follow-up survey, details about students’ employment status were also collected
and compared to the initial survey. In the fall following their senior year, half of the
participants were employed, another 16% had a job only for the summer, 7% used to be
employed but no longer were, and one–third had never worked for pay. Of the students who
were currently working for pay or had before, the average number of hours worked per week was
27 hours. Most worked in the 20–29 hour range, but a large portion (27%) also worked 40 or
more hours per week. About 70% of these students worked weekends for an average of about 10
hours in total for Saturday and Sunday. A large majority of these students were employed within
34
the last year or two of the follow-up survey, meaning that they worked while attending high
school.
Compared to the initial survey, a higher percentage of students were employed following
their senior year—47% at follow-up compared to 33% at initial survey. Perhaps as might be
expected, students also averaged longer working hours after graduation. On the initial survey,
46% of students reported to work 20 or more hours per week. On the follow up, 82% worked 20
or more hours, including 27% working 40 or more hours. A lower percentage of students were
working weekends at the follow-up survey. See Table 2.4 for a summary of work characteristics
at follow-up.
Life Satisfaction
2.5 Life Satisfaction at Follow-up
On the Students’ Life Satisfaction Scale (SLSS), students on the initial survey had a mean
of 3.91 (on a range of 1-6) with a standard deviation of 1.03. At follow-up, the overall mean
SLSS score for all students increased to 4.21 with a standard deviation of 0.96. Students who
graduated had a slightly higher life satisfaction with an average of 4.35, standard deviation of
0.85; whereas non-graduates had an average of 4.08 with a standard deviation of 1.04. As
mentioned in Section 1, past research found late adolescents to have a mean SLSS score of 4.16
with a standard deviation of 1.10 and focused on a largely African American and European
American population, whereas this sample was overwhelmingly Latino American. It appears
that participants reported SLSS scores that are generally similar to other populations, at
both initial and follow-up points of data collection. It is also interesting to note the increase
in students’ life satisfaction after their senior year, as compared to during their senior year.
See Table 2.5 for a summary of these results.

35
SECTION 3: OUTCOME ANALYSES RESULTS
Logistic regression analyses were completed to examine the association between specific
variables traditionally associated with several student outcomes of interest in the present study.
The four outcomes of primary interest were: (a) passing the CAHSEE (i.e., both language and
mathematics as of spring 2007); (b) high school graduation (as of fall 2007); (c) post-secondary
enrollment (as of fall 2007); and (d) did not graduate but pursued other viable educational
options (as of fall 2007).
The initial survey included numerous variables of interest, including the following six
composite variables: (a) youth’s perception of the value of education, (b) academic self-efficacy,
(c) life satisfaction, (d) parent-child communication, (e) school connectedness, and (f)
extracurricular activities (see description of each of these composite variables in Appendix 4).
Given the large number of ELL students (n = 127), t-tests were completed to compare composite
scores with non-ELL students (n = 31). There were no significant differences found for
extracurricular activities, school connectedness, parent-child communication, self-efficacy, and
valuing education. However, the groups were significantly different on life satisfaction (p =
0.049*) with non-ELL students reporting slightly higher life satisfaction (M = 4.26) on average,
compared to ELL students (M = 3.87).
3.1 Passing the CAHSEE
Logistic regression analyses revealed that only one of the six composite variables
was significantly associated with passing the CAHSEE as of the spring 2007. Life
satisfaction, perhaps not surprisingly, was significantly associated with passing the CAHSEE (p
= 0.02*). Students who passed the CAHSEE reported higher life satisfaction. See Table 3.1 for a
summary of results of these analyses. Analyses with other variables of interest from the initial

36
survey revealed very few significant results. However, those students whose home language
was not English were significantly less likely to pass the CAHSEE. Also, it was found that
those students who had reported that they had a regular, full-time job lined up for the summer
were significantly less likely to have passed the CAHSEE. This finding suggests that these
students who had low expectations for passing the CAHSEE were pro-active in anticipating and
arranging summer employment as a viable postsecondary option, relative to those who passed
the CAHSEE. Student report of understanding spoken English and Spanish as well as speaking,
reading, and writing in English and Spanish were also significantly related to passing the
CAHSEE.
3.2 High School Graduation
Logistic regression analyses revealed that only one of the six composite variables was
significantly associated with high school graduation. Valuing education was significantly
associated with high school graduation (p = 0.04*). Paradoxically, students who did not graduate
high school reported higher levels of valuing education than students who did graduate. These
results are counterintuitive; however, one possible explanation might be that students who did not
graduate were more vividly aware of the benefits that could come from earning a high school
diploma. See Table 3.2 for a summary of results of these analyses. Analyses with other variables
of interest from the initial survey revealed very few significant results. Students who reported
having close friends who had dropped out of high school without graduating were
significantly less likely to graduate, however. Student reports of understanding spoken
English as well as speaking, reading, and writing in Spanish were also significantly related to
high school graduation. These results involving perceived language proficiency suggest that
students who report that they do not understand spoken English very well are less likely to

37
graduate, and students with less Spanish skills are more likely to graduate. It was also found that
those students who had reported that they had a regular, full-time job lined up for the summer
were significantly less likely to graduate from high school, which suggests that these students
were pro-active in anticipating and arranging summer employment, relative to those who
graduated. However, the group of students who would graduate in the spring reported expecting to
work a higher number of hours during the summer.
3.3 Post-Secondary Enrollment
Logistic regression analyses revealed that none of the six composite variables were
significantly associated with post-secondary enrollment. See Table 3.3 for a summary of results
of these analyses. Analyses with other variables of interest from the initial survey revealed very
few significant results. Within the parent-child communication scale, a single item—having
discussed “going to college” with parents was significantly associated with post-secondary
enrollment. Also, mom’s, dad’s, and self-expectation that it is important to go on to post-
secondary school after high school were also significantly associated with post-secondary
enrollment.
3.4 Did Not Graduate, But Pursued Other Viable Educational Options
In order to focus on what happened to students who did not graduate, multinomial
regressions were run to determine what factors predicted the following four outcomes: (a) no
current plans to attend school, (b) pursuing high school diploma, (c) intentions of someday going
to post-secondary school, and (d) currently enrolled in post-secondary school. None of the six
composite variables were significantly associated with these outcomes.
3.5 Demographic and Achievement Characteristics

38
Logistic regression analyses revealed that student age and absences during Grade 12
were not significantly associated with passing the CAHSEE, high school graduation, or
post-secondary enrollment. Additionally, as would be expected considering previous studies,
the number of credits a student had earned as of spring 2007 was associated with passing the
CAHSEE, high school graduation, and post-secondary enrollment; and GPA was significantly
associated with passing the CAHSEE and post-secondary enrollment. Furthermore, in
examining the association between performance on standardized achievement tests and the
three outcomes, student scores on the English Language Arts section of the State
standardized achievement test were significantly associated with passing the CAHSEE and
high school graduation (p = 0.000**, p = 0.007**). This finding further corroborates results
indicating the importance of English language skills for students in this sample.
DISCUSSION
As noted in the introduction to this report, data from the California Department of
Education (CDE, 2007b) reveal that the number of dropouts in Grade 12 increased from 14,202
in 2002 to 33,286 in 2006. Furthermore, the CDE data also illustrate that by the time students are
enrolled in Grade 12, there have already been a large number of dropouts (over 36,000 students
dropped out from Grades 9–11 in 2006). Moreover, it is documented that 84% of students who
persisted into Grade 12 passed the CAHSEE by the time they began their senior year. The
present study focused on those students who had not passed the California High School Exit
Exam (CAHSEE) as of the fall of their senior year of high school, in order to provide further
information and insights into this population of students.
The following discussion of findings focuses on: (a) information regarding the
characteristics and experiences of students who had not passed the exam as of the fall of Grade

39
12; (b) information regarding whether or not these students graduated high school and enrolled in
post-secondary school, self-expectations for educational attainment, work experiences following
senior year, and life satisfaction measures; and (c) information regarding what factors predict
which students eventually passed the CAHSEE, as well as other educational outcomes.
Characteristics and Experiences of Students
Regarding the characteristics of participating students who had not yet passed the
CAHSEE as of the fall of Grade 12, the results of this study revealed information about the
various background experiences of this particular population of students.
Demographic Characteristics
The vast majority of participants were Latino students from low socioeconomic
backgrounds. A large number of participating students also reported being native Spanish
speakers. The majority of these students were considered English Language Learners (ELL).
Participants reported a relatively stronger grasp (i.e., understanding, speaking, and reading) of
the Spanish language as compared to the English language. The districts from which this sample
was selected included urban, suburban, and more rural communities. Although this sample is not
representative of the entire state of California, it nonetheless provides sufficient information with
which to better understand the factors associated with high school completion among high school
seniors who have not passed the CAHSEE, particularly for Latino(a) students.
Academic Characteristics
Students in this study demonstrated a wide range of scores on measures of academic
competency. All participants reported spending some time engaged in homework each week,
most reported at least 1 to 3 hours a week. Participants included both students who have had
minimal attempts at passing the CAHSEE, as well as students who have tried to pass the

40
CAHSEE on numerous occasions prior to entering Grade 12rade. Approximately 15% of the
participants had Special Education status during Grade 12, which is only slightly higher than
district averages, and 16% reported a history of grade retention, which is a much smaller
proportion than might be expected based on the relevant dropout literature. The majority of
students in this sample were involved in activities to help them prepare for the CAHSEE.
Discipline Characteristics
Although many students reported having never or rarely been tardy, truant, absent, or in
trouble for not following school rules, a handful did report that these behaviors/events had
occurred 10 or more times. Many students reported having never or rarely been tardy, truant,
absent, or in trouble for not following school rules, a handful reported that these behaviors/events
had occurred 10 or more times. The majority of participating students reported not being
involved in suspensions, expulsions, or transfers related to disciplinary sanctions and these
factors appear to have played a minor part in whether or not these students received a diploma. In
general, participants for the most part seemed motivated to attend school and did not present
serious disciplinary challenges to the school staff.
Individual Characteristics
Individual expectations. Over three-fourths of the participating students predicted in the
spring of their senior year that they would go on to graduate from high school, although the
actual graduation rate was less. When students who did not believe they would graduate from
high school were asked what they thought would be the reasons for not graduating, most of the
students reported that they would not pass the ELA section of the CAHSEE. In fact, the
CAHSEE exam itself presented the primary challenge to these students’ receiving their diploma

41
because a majority of them otherwise participated regularly in school, received passing grades in
their courses, and had enough credit to meet the diploma requirements.
School connectedness. A factor associated with school completion is the sense of
connection students feel with the school (staff and peers). Most of this sample of students
reported feeling positively connected to school, but there was a substantial minority who were
neutral or not sure how they felt about their social bonds in school. The average of students’
responses regarding the value of education revealed that students as a whole felt slightly
connected. The majority of students reported participating in at least one extracurricular activity,
with about one-third not participating at all. Most students reported spending less than an hour to
four hours each week on extracurricular activities. Although there appears to be room to enhance
the school connections of this group of students, not many of them reported having negative
perceptions of their personal and academic connections to school.
Education plans and expectations. Over half of the participants reported plans to enroll in
some form of postsecondary education, as most of these students planned on earning their high
school diploma and/or pursuing further education. Three-quarters indicated that they expected to
complete at least two years of post-secondary education. Despite what objectively can be
described as having to cope with several years of educational challenges and ambiguity about
their prospects of being able to earn a high school diploma, these students, as a whole, clung to
their aspirations to receive as much education as possible. They generally appear to be a group of
students who are looking for multiple educational opportunities and options.
Employment. Most students reported work experience, although the range of current and
previous employment varied considerably; about one–third were currently employed. Most
students planned to work during the summer. Employment is a reality for these students as it is

42
for many students pursuing postsecondary education. Opportunities for stable and meaningful
employment are likely to be necessary for these students from low-income families to afford to
attend junior college and other educational options. Employment is a variable to consider in
relation to school completion because the literature has demonstrated that students who take on
adult responsibilities such as working full-time tend to drop out at higher rates (Gleason &
Dynarski, 2002; Rosenthal, 1998). However, this concern did not appear to be an issue within
our sample.
Life aspirations. Patterns in the data revealed that the most valued life attainments
included getting a good education and not only getting a good job, but also being successful or
an expert in their careers. Participating students also felt strongly about giving their future
children opportunities that they never had. Students in this sample had higher life aspirations
than expected given extant literature regarding high school dropouts.
Self-efficacy. Overall, students on the initial survey reported an average self-efficacy
score, indicating a modest sense of being able to control outcomes of their academic efforts
through effort and persistence. Although this may not appear to be a strength for these students,
it is important to note that they were at least able to maintain this positive level of self-beliefs
about their educational pursuits despite several years of ambiguity about their educational status.
In general, this group of students appears to have educational resilience.
Communication with Parents
The overall pattern revealed that students were more likely to talk to parents about each
of the topics either “sometimes” or “always,” and less likely to report “never” talking to parents
about these topics. Commonly discussed topics involved grades, going to college, or getting a
job after school, while current events and things that were troubling them were less common

43
topics among students and parents. Research using nationally representative survey data shows
that adolescents who “talk school” with their parents are more likely to graduate high school, and
that this finding is true across social class groupings (Ream & Palardy, in press). About one–
quarter of student participants reported living with their mom only, only 5% with only their dad,
and 12% without their mom or dad. By far, the majority of students perceived that mother and
father expectations for their education were to attend college after high school rather than other
options to do after high school, such as get a job or get married. These results indicate that
participating students have fairly strong levels of family support and expectations.
Friends Characteristics
Most students reported having friends who had dropped out of high school without
graduating—indicating that many of these high academic risk youths have friends who likely
were also academically at-risk. The literature shows that dropouts’ friends also often drop out of
school (Carbonaro, 1998; Rumberger & Thomas, 2000). However, it should be noted that
participants reported even more friends that were going on to postsecondary education, pointing
out that education is important within their friend groups as well. Also, over three-quarters of
participating students reported believing that their friends thought college was the most
important thing for them to do after high school, which suggests that participating youths also
had positive peer influences on their educational aspirations. Current research has found that (a)
having dropout friends increases the likelihood of dropping out, but that (b) having school-
oriented friends decreases the likelihood of dropping out, and that (c) student engagement
behaviors influence whether adolescents have street- or school-oriented friends in the first place
(Ream & Rumberger, in press).

44
Percent Passing the CAHSEE
Over three-quarters of participating youth did not pass the CAHSEE by the end of Grade
12. Again, for most of these students, they had taken and failed the CAHSEE multiple times, yet
many steadfastly remained committed to valuing and continuing their education as indicated by
their attendance at school and educational aspirations.
Student Outcomes at Fall Follow-up
The fall follow-up survey conducted in August 2007 revealed information about student
outcomes following the completion of their high school senior year. The follow-up survey
highlighted outcomes such as whether or not these students graduated high school and enrolled
in post-secondary school, their self-expectations for educational attainment, work experiences
following senior year, and life satisfaction measures.
Educational Outcomes
Although only 20% of students had passed both required sections of the CAHSEE as of
the spring of Grade 12, many students took advantage of the summer test administration and
47% had successfully completed the CAHSEE as of August 2007, at which time they were
awarded their high school diploma. These findings reflect similarities to HumRRO’s 2007 report,
which found that only 18% of ELL students passed the ELA section and 23% passed the Math
section by the end of their senior year. They also found that about 40% of those who did not pass
by the end of their senior year continued taking the CAHSEE, and more than a quarter eventually
passed within the next year (HumRRO, 2007). At follow-up in the current study, about three-]–
fourths of the non-graduates reported they were unable to pass the ELA section of the CAHSEE.
Fewer students reported lack of credits or passing the Math section as the main factor that

45
prevented them from graduating. This indicates that the ELA section of the CAHSEE was the
main reason that students in this sample were unable to receive their high school diploma.
Of the students that predicted they would not graduate from high school earlier that year,
three-quarters did not graduate. Among the students who in the spring 2007 survey reported that
they believed that they would graduate, half eventually graduated and received their diploma by
August 2007. Of those students who did not graduate high school by the follow-up survey in
August 2007, one-third were attending community college in the fall following their senior year.
This indicates that a large portion of students who did not pass both sections of the CAHSEE in
time to graduate from high school still pursued in their educational goals by attending
community college. Community college offers the opportunity to progress towards a two-year or
four-year college degree without a high school diploma, which is a choice relatively popular
amongst these educational persisters. In addition, one-third of these non-graduates who were
attending community college were also simultaneously working on passing the CAHSEE and
earning their high school diploma through extra district courses, tutoring, or independent study.
Educational Aspirations
On the initial spring survey, one-quarter of the students reported expecting to complete
community college, and one-quarter reported expecting to graduate from a 4-year university. At
the follow-up fall survey, these percentages increased to one-third with aspirations for finishing
community college, and one–third with aspirations for graduating from a 4-year college.
Students who graduated reported similar, though slightly higher, future educational expectations
than those did not graduate. Again, despite their educational challenges, many of these students
actually raised their educational aspirations and goals.

46
Employment Outcomes
In the fall following their senior year, half of the participants were employed, another
16% had a job only for the summer, 7% used to be employed but no longer were, and a third had
never worked for pay. Of the students who were currently working for pay or had before, the
average number of hours worked per week was 27 hours. This suggests that students in the study
were not choosing full-time employment over post-secondary education.
Life Satisfaction
It was apparent that participants reported SLSS scores that are generally similar to other
populations, at both initial and follow-up points of data collection. It is also interesting to note
the increase in students’ life satisfaction after their senior year, as compared to during their
senior year.
Factors Predicting Student Outcomes
This study examined variables previously revealed as important in studies of dropout and
school completion, including six composite variables: (a) youth’s perception of the value of
education, (b) youth self efficacy, (c) life satisfaction, (d) parent child communication, (e) school
connectedness, and (f) extracurricular activities (see description of each of these composite
variables in Appendix 4). The four outcomes of primary interest were: (a) passing the CAHSEE
(i.e., both language and mathematics as of spring 2007); (b) high school graduation (as of fall
2007); (c) post-secondary enrollment (as of fall 2007); and (d) did not graduate but pursued other
viable educational options (as of fall 2007). The most surprising findings were the lack of
significance between the composite variables and the outcomes. In fact, of the six composites
entered into the logistic regression analyses only one (life satisfaction) was significantly related
to passing the CAHSEE, only one (valuing education) was significantly related to high school

47
graduation, and none of the composites were significantly related to post-secondary school
attendance.
Students whose home language was not English were significantly less likely to pass the
CAHSEE. Student reports of understanding spoken English and Spanish as well as speaking,
reading, and writing in English and Spanish were also significantly related to passing the
CAHSEE. Students’ standardized achievement test scores in ELA were significantly related to
passing the CAHSEE and graduating high school. It is clear from these results that students’
language backgrounds and English language abilities are influential regarding educational
outcomes, perhaps especially for those comparably resilient students who persevered in school
into Grade 12 (in spite of language and SES challenges) but who have yet to pass CAHSEE.
Students who reported having close friends who had dropped out of high school without
graduating were less likely to graduate. Student reports of understanding spoken English as well
as speaking, reading, and writing in Spanish were significantly related to high school graduation.
Having discussed “going to college” with parents was significantly associated with post-
secondary enrollment. In addition, perceived mom’s, dad’s, and self-expectation regarding the
importance of the student going on to post-secondary school after high school were also
significantly associated with post-secondary enrollment.
CONCLUSIONS
The current study sheds light on characteristics and outcomes of a unique population of
students who, despite many challenges and/or experiences of failure throughout their education,
still persisted in their high school education through the end of their senior year of high school.
Despite knowing that they had taken and not passed the CAHSEE multiple times, they enrolled
in school during their senior year. The majority of these students attended class regularly, did not

48
cause undue disciplinary problems, and engaged in day-to-day academic behaviors to earn
enough units to meet high school diploma requirements. The lack of significant differences
between participating twelfth-grade students on the various outcomes is a significant finding
within this study. In particular, results highlight that the variables that consistently predict school
completion and dropout among high school students in general do not provide prediction of the
educational outcomes among this group of twelfth-grade students who persist in school despite
significant difficulty passing the CAHSEE. It may be that the results of the present study do not
mirror previous studies of school completion because students who are most vulnerable to
dropping out of high school may have already left the schools prior to their senior year.
Although much of the literature on dropout and school completion fails to differentiate
between students who drop out of school and students who stay in high school for four years but
do not graduate, the results of the current study demonstrate that these two groups appear to
represent two very distinct groups of youths. There is limited research on non-graduates who
persist for all four years of high school. Some previous studies have shown that non-graduate
persisters resemble high school graduates much more closely than they resemble high school
dropouts, according to factors such as number of school absences, ability test scores,
achievement test scores, under-achievement, and special education referrals (Barrington &
Hendricks, 1989). The results of the current study reveal that non-graduate persisters have
aspirations to continue their education. In fact, most indicate that they want to complete at least
two years of post-secondary education.
Perhaps the main difference between students who experienced various educational
outcomes in this study revolved around language experiences. It is clear that the English
Language Arts portion of the CAHSEE is the predominant challenge that prohibits many of these

49
students from graduating. This is not surprising given most of these students are classified as
English Language Learners. Recent immigrants to the United States may not have the five to
seven years necessary to acquire cognitive academic language proficiency in English (Scribner,
2002), and thus, may repeatedly fail the CAHSEE despite best efforts in school. One area in
which the current study does not provide information is the influence of immigrant status. We
know from this study that students in their senior year reported having taken the CAHSEE
anywhere from just once to the maximum number of times allowed during their regular high
school calendar. One possible explanation for this range of experience is that some students may
be recent arrivals to this country and may not have been here long enough to have previous
opportunities to take the CAHSEE. Future research should examine the length of time a student
has been in the United States and their ability to pass the CAHSEE. Fortunately, results indicate
that many students take advantage of the opportunity to enroll in community colleges, which
highlights the importance of providing educational support services that can help to facilitate the
education transitions of these youth, particularly ELL youth within the community college
context.
The CAHSEE was developed and implemented within an era of accountability. Too often
the accountability of the system to provide educational supports to at-risk students is glossed
over as tests are developed that determine student graduation and punish rather than protect
students. There are high stakes associated with the CAHSEE given that students must pass in
order to receive their high school diploma. This test has only been required since 2006, and it is
important that evaluations continue to develop in order to thoroughly understand the CAHSEE
and its potential influences on high school students’ experiences of school completion. It is
essential that policies, processes, and resources are provided to address the needs of students who

50
continue to persist despite failing to pass the CAHSEE. In many ways, these students who
continue to meaningfully participate in high school during the senior year represent those that
society has a vested interest to support. They are persistent, attempting to cope with life
challenges in a positive way, and committed to attain the skills needed to be contributing
community members. Ironically, in some ways, these students are not educational “failures”
because many were unable to pass the CAHSEE and earn their high school diploma within
normal time limits. Rather, they may represent that group of students who embody the American
dream of seeing education as a pathway to a better life for themselves and their families. This
particular group of students appears willing to work hard to earn an education and appear to be
looking for opportunities to achieve this objective.

51
REFERENCES
Alfaro, E. C., Umana-Taylor, A. J., & Bamaca, M. Y. (2006). The influence of academic support
on Latino adolescents’ academic motivation. Family Relations, 55, 279-291.
Barrington, B. L., & Hendricks, B. (1989). Differentiating characteristics of high school
graduates, dropouts, and nongraduates. Journal of Educational Research, 82, 309-319.
California Department of Education. (2007a). CAHSEE questions and answers. Retrieved
September 29, 2007, from http://www.cde.ca.gov/ta/tg/hs/info200506.asp
California Department of Education. (2007b). DataQuest. Retrieved November 10, 2007, from
http://data1.cde.ca.gov/dataquest/DQ/Nclb_StDrp.aspx?cYear=2005-
06&cChoice=drpNCLB&Level=State
Carbonaro, W. (1998). A little help from my friends parents: Intergenerational closure
and educational outcomes. Sociology of Education 71, 295-313.
Davalos, D. B., Chavez, E. L., & Guardiola, R. J. (1999). The effects of extracurricular activity,
ethnic identification, and perception of school on student dropout rates. Hispanic Journal
of Behavioral Sciences, 21(1), 61-77.
DeGarmo, D. S., & Martinez, C. R. (2006). A culturally informed model of academic well-being
for Latino youth: The importance of discriminatory experiences and social support.
Family Relations, 55, 267-278.
Dowrick, P. W., & Crespo, N. (2005). School failure. In T. P. Gullotta & G. R. Adams (Eds.),
Handbook of adolescent behavioral problems: Evidence-based approaches to prevention
and treatment (pp. 589-610). New York: Springer Science.
Durán, R. (1987). Hispanics’ pre-college and undergraduate education: Implications for science
and engineering studies. In L. S. Dix (Ed), Minorities: Their underrepresentation and

52
career differentials in science and engineering, Washington, DC: National Academy
Press.
Eamon, M. K. (2005). Social-demographic, school, neighborhood, and parenting influences on
the academic achievement of Latino young adolescents. Journal of Youth and
Adolescence, 34, 163-174.
Ekstrom, R. B., Goertz, M., Pollack, J., & Rock, D. (1986). Who drops out of high school and
why? Findings from a national study. Teachers College Record, 87, 356-373.
Finn, J. D., & Rock, D. A. (1997). Academic success among students at risk for school failure.
Journal of Applied Psychology, 82, 221-234.
Gleason, P., & Dynarski, M. (2002). Do we know whom to serve? Issues in using risk factors to
identify dropouts. Journal of Education for Students Placed at Risk, 7, 25-41.
Gonzalez, R., & Padilla, A. (1997). The academic resilience of Mexican American high school
students. Hispanic Journal of Behavioral Sciences, 19, 301-317.
Huebner, E. S. (1991). Initial development of the Students' Life Satisfaction Scale. School
Psychology International, 12, 231-240.
Human Resources Research Organization. (2006). Independent evaluation of the California High
School Exit Examination (CAHSEE): 2006 Evaluation report, volume 1 [Electronic
version]. Retrieved October 15, 2007, from www.cde.ca.gov/ta/tg/hs/evaluations.asp
Human Resources Research Organization. (2007). Independent evaluation of the California High
School Exit Examination (CAHSEE): 2007 Evaluation report, volume 1 [Electronic
version]. Retrieved November 5, 2007, from www.cde.ca.gov/ta/tg/hs/evaluations.asp
Jeynes, W. H. (2007). The relationship between parental involvement and urban secondary
school student academic achievement: A meta-analysis. Urban Education, 42, 82-110.

53
Jimerson, S. R., Anderson, G., & Whipple, A. (2002). Winning the battle and losing the war:
Examining the relation between grade retention and dropping out of high school.
Psychology in the Schools, 39, 441-457.
Jimerson, S. R., Ferguson, P., Whipple, A. D., Anderson, G. E., & Dalton, M. J. (2002).
Exploring the association between grade retention and dropout: A longitudinal study
examining socio-emotional, behavioral, and achievement characteristics of retained
students. The California School Psychologist, 7, 51-62.
Jimerson, S. R., Reschly, A. L., & Hess, R. S. (in press). Best practices in increasing the
likelihood of high school completion. In A. Thomas and J. Grimes (Eds.), Best practices
in school psychology V. Bethesda, MD: National Association of School Psychology.
Martinez, C. R., DeGarmo, D. S., & Eddy, J. M. (2004). Promoting academic success among
Latino youths. Hispanic Journal of Behavioral Sciences, 26, 128-151.
National Center for Education Statistics. (2005). Dropout rates in the United States: 2005.
Retrieved September 22, 2007, from http://nces.ed.gov/pubs2007/dropout05/
No Child Left Behind Act. (2001). Retrieved September 20, 2007, from
http://www.ed.gov/nclb/landing.jhtml
Randolph, K. A., Fraser, M. W., & Orthner, D. K. (2006). A strategy for assessing the impact of
time-varying family risk factors on high school dropout. Journal of Family Issues, 27,
933-950.
Randolph, K. A., Fraser, M. W., & Orthner, D. K. (2004). Educational resilience among youth at
risk. Substance Use and Misuse, 39, 747-767.

54
Ream, R. K., & Palardy, G. J. (in press). “Re-examining social class differences in the
availability and the educational utility of parental social capital.” American Educational
Research Journal 45, (2).pages
Ream, R. K., & Rumberger, R. W. (in press). Linking student engagement, peer social capital,
and school dropout among Mexican American and non-Latino White students.
American Educational Research Journal.
Reschly, A. L., & Christenson, S. L. (2006). Prediction of dropout among students with mild
disabilities: A case for the inclusion of student engagement variables. Remedial and
Special Education, 27, 276-292.
Rosenthal, B. S. (1998). Non-school correlates of dropout: An integrative review of the
literature. Children and Youth Services Review, 20, 413-433.
Rumberger, R. W. (1987). High school dropouts: A review of issues and evidence. Review of
Educational Research, 57, 101-121.
Rumberger, R. W. (2004). Why students drop out of school. In G. Orfied (Ed.), Dropouts in
America: Confronting the Graduation Rate Crisis (pp.131-155). Cambridge, MA:
Harvard Education Press.
Rumberger, R. W., & Thomas, S. (2000). The distribution of dropout and turnover rates among
urban and suburban high schools. Sociology of Education, 73, 39-67.
Sánchez, B., Colón, Y., & Esparza, P. (2005). The role of sense of school belonging and gender
in the academic adjustment of Latino adolescents. Journal of Youth and Adolescence, 34,
619-628.
Schneider, B., & Stevenson, D. (1999.) The ambitious generation: America’ teenagers,
motivated but directionless. New Haven: Yale University Press.

55
Sharkey, J. D., You, S., & Schnoebelen, K. J. (in press). The relation of school assets, individual
resilience, and student engagement for youth grouped by level of family
functioning. Psychology in the Schools.
Smith, J. (2003). Assimilation across the Latino generations. AER Papers and Proceedings 93,
315-319.
Steinberg. L., Blinde, P. L., & Chan, K. S. (1984). Dropping out among language minority
youth. Review of Educational Research, 54, 113-132.
Suldo, S. M., & Huebner, E. S. (2004). The role of life satisfaction in the relationship between
authoritative parenting dimension and adolescent problem behavior. Social Indicators
Research, 66, 165-195.
WestEd. (2004). California’s graduation rate: The hidden crisis. Retrieved November 10, 2007,
fromhttps://mail.education.ucsb.edu/attach/WestEd%20cde.gradrateII.pdf?sid=03emRQ
MVs/c&mbox=INBOX&charset=escaped_unicode&uid=19111&number=2&filename=
WestEd%20cde.gradrateII.pdf

56
Appendix 1. Tables
Following is the complete collection of tables referenced in the above report. Note that
the overall sample size within this study was N = 167; however, n is listed within each table, thus
reflecting any missing data for individual survey questions. Variables with an asterisk were
obtained from school district archival data. All other data was obtained from student surveys or
through data analyses.
Table 1.1 Basic Demographics Variable n %
(or range) Mean (SD)
Socioeconomic status*
Free and reduced price lunch – Yes
Free and reduced price lunch – No
114
33
78%
22%
Age at graduation* 166 17.5–21.4 18.5 (0.7)
Gender*
Male
Female
83
84
50%
50%
Ethnicity*
Latino
White
Asian/Pacific Islander
African American
American Indian
145
7
6
6
2
87%
4%
4%
4%
1%

57
Table 1.2 Language Demographics Variable n %
English as Native Language
Yes
No
41
126
25%
75%
Native Language (for non-native English speakers)
Spanish
Korean
Filipino
Farsi
Cambodian
Other
116
2
1
1
1
4
93%
2%
1%
1%
1%
3%
Home Language*
Spanish
English
Other (Mixteco, Cambodian, Farsi, Korean,
Filipino, Thai)
129
25
12
78%
15%
7%
Ever in an ESL course or program
Yes
No
92
64
59%
41%

58
Table 1.3 Language Proficiency Variable n %
English Language Proficiency*
English only
Reclassified English proficient
English language learner (ELL)
Initial English Proficient
20
11
127
2
13%
7%
79%
1%
Note. English language proficiency data was obtained from school district archival data. Initial English Proficient represents students for whom English was not the home language, however these students were English proficient when initially tested. Table 1.4 Perceived Language Proficiency Variable
Not at all n
(%)
Not well n
(%)
Well n
(%)
Very Well n
(%)
Understand Spoken English
0
(0)
20
(12)
70
(42)
75
(45) Speak English
1
(1)
43
(26)
69
(42)
53
(32) Read English
1
(1)
32
(20)
78
(48)
53
(32) Write English
1
(1)
45
(27)
65
(39)
54
(33) Understand Spoken Spanish
11 (7)
15 (9)
45
(27)
96
(58) Speak Spanish
16
(10)
14 (8)
34
(20)
103 (62)
Read Spanish
20
(12)
21
(13)
44
(26)
82
(49) Write Spanish
25
(15)
25
(15)
46
(28)
71
(43)

59
Table 1.5 Academic Achievement
Variable n % (Range)
Mean (SD)
GPA* 166 0.66-3.78 2.33 (.57)
State Standardized Test Scores* Math scale scores Math performance level
1 (Far Below Basic) 2 (Below Basic) 3 (Basic) 4 (Proficient) 5 (Advanced Proficient)
English scale scores English performance level
1 (Far Below Basic) 2 (Below Basic) 3 (Basic) 4 (Proficient) 5 (Advanced Proficient)
115
47 53 13 2 0
149
85 50 11 3 0
194-383
41% 46% 11% 2% 0%
154-378
51% 30% 7% 2% 0%
264 (34.04)
259 (33.55)
Credits Earned (by the end of senior year)* 166 100-335 231 (34.18) Table 1.6 Time Spent on Homework Variable
n %
Time Spent on Homework Each Week
None
Less than 1 hour each week
1 – 3 hours
4 – 6 hours
7 – 9 hours
10 – 12 hours
13 – 15 hours
16 – 20 hours
Over 20 hours each week
0
10
76
39
22
9
4
6
1
0%
6%
46%
23%
13%
5%
2%
4%
1%

60
Table 1.7 Experience with the CAHSEE Variable
n %
Number of times taken CAHSEE English section
0
1
2
3
4
5
More than 5
0
24
31
38
38
15
19
0%
15%
19%
23%
23%
9%
12%
Number of times taken CAHSEE Math section
0
1
2
3
4
5
More than 5
1
26
39
44
33
10
11
1%
16%
24%
27%
20%
6%
7%
Activities Undertaken to Prepare for CAHSEE
No special activities
Reviewed material in class
Had a tutor help to prepare for the exam
Had a special class to learn material for exam
14
82
44
107
8%
49%
26%
64%
Where Went for Information about Passing the Exam
Guidance counselor
Teacher
Coach
Parent
Friend
Brother or sister
124
114
5
37
64
74%
68%
3%
22%
38%

61
Other relative
Tutor
Clergy
Other
16
12
34
0
9
10%
7%
20%
0%
5%
CAHSEE Status (by the end of senior year)*
Passed Math section
Not yet passed Math section
Passed English section
Not yet passed English section
Overall CAHSEE status
Passed
Did not pass
88
46
38
108
33
128
66%
34%
26%
74%
21%
80%
Table 1.8 Educational Programs Variable n %
(Range) Special Education Status*
Yes
No
24
139
15%
85%
Ever Been in Special Education Program (IEP)
Yes
No
28
116
19%
81%
Ever Been in a Vocational Program
Yes
No
24
117
17%
83%
Note. Variables with an asterisk were obtained from school district archival data. All other data was obtained from student surveys.

62
Table 1.9 Grade Retention Variable n %
(Range) Ever Been Held Back / Repeated a Grade in School
Yes
No
27
140
16%
84%
Grade at which Retained Students Were Held Back
Kindergarten
1st grade
2nd grade
3rd grade
4th grade
5h grade
6th grade
7th grade
8th grade
9th grade
10th grade
11th grade
12th grade
2
7
1
2
1
0
1
3
3
5
4
1
8
5%
18%
3%
5%
3%
0%
3%
8%
8%
13%
11%
3%
21%

63
Table 1.10 Tardies, Truancy, Absences, and Not Following School Rules
Note. Data are based on student report of how many times each behavior/event occurred in the second semester or term of the past school year. Table 1.11 Suspensions, Transfers, and Expulsions
Variable Never
n (%)
1-2 times n
(%)
3-6 times n
(%)
7-9 times n
(%)
10+ times n
(%)
In-school suspensions Out-of-school suspensions Transferred to another school for disciplinary reasons Expelled from school
147 (89)
153 (93)
160 (98)
158 (98)
12 (7)
9
(5) 1
(1) 2
(1)
4 (2)
2
(1) 3
(2) 1
(1)
2 (1)
0
(0) 0
(0) 0
(0)
0 (0)
1
(1) 0
(0) 0
(0)
Note. Data are based on student report of how many times each behavior/event occurred in the second semester or term of the past school year.
Variable Never
n (%)
1-2 timesn
(%)
3-6 times n
(%)
7-9 timesn
(%)
10+ timesn
(%)
Tardies (“I was late for school”) Truancy (“I cut or skipped class”) Absences (“I was absent from school”) Not Following School Rules (“I got in trouble for not following school rules”)
31 (19)
57
(35)
36 (22)
132 (80)
42 (25)
61
(37)
59 (36)
22
(13)
52 (31)
24
(15)
36 (22)
4
(2)
15 (9)
8
(5)
10 (7)
1
(1)
26 (16)
13 (8)
22
(13) 5
(3)

64
Table 1.12 School Connectedness
Note. Possible range for the school connectedness measure was 0-4.
Table 1.13 Value of Education Composite Variable
n Range of scores (0 – 4 possible range)
Mean Score
Standard Deviation
Belief in the Value of Education
142 (0 – 4) 3.28 0.87
Variable
Strongly Disagree
n (%)
Moderately Disagree
n (%)
Neutral
n (%)
Moderately Agree
n (%)
Strongly Agree
n (%)
“I feel close to people at this school”
“I am happy to be at this school”
“I feel like I am a part of this school”
“The teachers at this school treat students fairly”
“I feel safe at school”
31 (19)
62
(38)
52 (32)
46
(28)
61 (37)
58 (35)
47
(28)
43 (26)
51
(31)
46 (28)
45 (27)
33
(20)
33 (20)
36
(22)
26 (16)
18 (11)
11 (7)
22
(13)
19 (12)
16
(10)
14 (8)
12 (7)
15 (9)
11 (7)
18
(11)
Composite Variable n Range of scores
Mean Score
Standard Deviation
School Connectedness 160 (0 – 4) 2.63 1.03

65
Table 1.14 Extracurricular Activity Involvement Variable
No participation n
(%)
Participated n
(%)
Officer/Captain n
(%) Intramural Sports (within school competition) Interscholastic Sports (competition with other schools) Band, Orchestra, Chorus, Choir School Play or Musical Student Government National Honors Society (NHS) or other academic honor society School Yearbook, Newspaper, Literary Magazine Service Club (e.g., Key Club, Big Brother, or Big Sister) Academic Club (e.g., art, computer, foreign language)
Hobby Club (e.g., photography, chess) Vocational Education Club, Vocational Student Organization (e.g., DECA, Skills USA, VICA, FFA, FHA) Ethnic Clubs (e.g., Asian Alliance, Black Student Union, MEChA)
127 (78)
124 (77)
144 (89)
144 (89)
136 (86)
152 (94)
137 (85)
137 (86)
123 (77)
136 (87)
153 (96)
145 (90)
28
(17)
32 (20)
17
(10)
16 (10)
19
(12) 8
(5)
23 (14)
19
(12)
34 (21)
19
(12) 4
(3)
13 (8)
8
(5) 6
(4) 1
(1) 1
(1) 4
(3) 2
(1) 2
(1) 4
(3) 2
(1) 1
(1) 2
(1) 3
(2)

66
Table 1.15 Total Hours Spent on Extracurricular Activities Per Week Variable n %
Weekly Hours Spent on Extracurricular Activities
None
Less than 1 hour per week
1 – 4 hours per week
5 – 9 hours per week
10 – 14 hours per week
15 – 19 hours per week
20 – 24 hours per week
25 hours or more per week
49
25
55
11
11
8
2
5
30%
15%
33%
7%
7%
5%
1%
3%
Table 1.16 Current Educational Plans – Initial Survey Variable
n %
Earn a regular high school diploma by… Re-enrolling in high school Enrolling in independent study in your district Enrolling in an adult secondary school program in district Enrolling in a district course to prepare for the CAHSEE Enrolling in a community college adult education program
Earn an equivalent high school diploma by…
Passing the CHSPE Passing the GED
Attend one of the following post-secondary school options…
Attend community college Attend vocational/trade school Attend a 4–year college
No current plans to attend school
11 3 1 6 8
12 26
68 15 10
7
6% 2% 1% 4% 5%
7% 15%
41% 9% 6%
4%

67
Table 1.17 Educational Self-Expectations Variable n % Less than high school graduation
GED or other equivalency only
High school graduation only
1–or 2–year community college or vocational school
Attend, but not complete, a 4–year college degree
Graduate from college (4–year degree)
Obtain a Master’s Degree or equivalent
Obtain a Ph.D., M.D., or other advanced degree
Don’t know
4
2
12
43
14
40
22
8
21
2%
1%
7%
26%
8%
24%
13%
5%
13%

68
Table 1.18 Work Experiences Variable n % Employment status (Not counting work around house)
No Yes, currently employed Yes, but only during the summer Yes, but not currently employed
52
55
32
28
31%
33%
19%
17% Year began current/most recent job
2000 2001 2002 2003 2004 2005 2006 2007
1
1
0
2
8
16
43
29
1%
1%
0%
2%
8%
15%
41%
27% Hours worked per week during school year (for students employed during senior year)
0 – 9 hours 10 – 19 hours 20 or more hours
16
14
25
29%
25%
46% Hours worked per weekend (for those who worked weekends)
1-9 10-19 20 or more
65
34
5
63%
33%
5%

69
Table 1.19 Summer Work Plans Variable
n %
Summer Employment
Yes, continuing the one I have now Yes, a new job lined up No, but looking for one No, have not done anything to find a job
52
26
75
13
31%
16%
45%
8%
Table 1.20 Self-Prediction of Graduation Status Variable
n %
Will graduate from high school Yes No
128
38
77%
23%
If not, why (mark all that apply)? Did not pass Math section of CAHSEE Did not pass ELA section Not enough credits Other
9
26
17
5
24%
68%
45%
13%

70
Table 1.21 Views on the Importance of Life Attainments Variable
Not important
n %
Somewhat important
n %
Very important
n %
Being successful in you line of work Finding the right person to marry Having lots of money Having strong friendships Finding steady work Helping others in the community Giving your children better opportunities than you had Living close to parents and relatives Getting away from this area of the country Working to correct social and economic inequalities Having children Having leisure time to enjoy your interests Becoming and expert in your field of work
1
1%
15 9%
9
5%
4 2%
1
<1%
4 2%
4
2%
11 7%
56
34%
18 11%
29
18%
10 6%
8
5%
16
10%
53 32%
82
49%
50 30%
38
23%
64 39%
9
5%
68 41%
83
50%
79 48%
72
43%
70 42%
23
14%
149
90%
96 59%
76
46%
112 68%
125
76%
97 59%
154
92%
87 52%
27
16%
68 41%
65
39%
87 52%
134
81%

71
Getting a good education
Getting a good job
Being an active and informed citizen
Supporting environmental causes
Being patriotic
1 1%
2
1%
1 1%
6
4%
23 14%
10 6%
6
4%
37 22%
75
46%
86 52%
154 93%
158
95%
128 77%
84
51%
56 34%
Table 1.22 Academic Self-Efficacy and Life Satisfaction Variable n Range of scores Mean
Score Standard Deviation
Academic Self-Efficacy 157 0.00 – 3.00 1.87 0.73 Life Satisfaction Scale 118 1.43 – 6.00 3.91 1.03 Note. Possible ranges for self-efficacy and life satisfaction measures were 1-6. Table 1.23 Family Structure Variable
n %
Living situation Mother and father Mother without father Father without mother Without mother or father
93
44
8
20
56%
27%
5%
12%

72
Table 1.24 Parent Expectations Variable
Mother Father
n % n % Parent expectations of the most important thing for student to do right after high school…
Go to college Get a full-time job Enter a vocational or apprenticeship program Enter the military Get married You should do what you want Don’t know Not applicable
140
10
3
1
0
3
5
1
86%
6%
2%
1%
0%
2%
3%
1%
107
13
2
3
1
8
11
8
70%
9%
1%
2%
1%
5%
7%
5%

73
Table 1.25a Parent-Student Communication Variable
Never n %
Sometimes n %
Often n %
Selecting courses or programs at school
School activities that interest you
Things you’ve studied in class
Your grades Jobs you would like after high school Specific jobs you might apply for after high school
Going to college
Community, national, or world events
Things that are troubling you
19
12%
30 19%
21
13%
4 2%
11
7%
16 10%
11
7%
44 27%
26
16%
98
60%
94 58%
85
52%
46 29%
60
37%
73 45%
46
28%
92 57%
72
44%
47
29%
38 24%
57
35%
111 69%
90
56%
74 45%
107
65%
26 16%
65
40%
Table 1.25b Parent-Student Communication Composite Variable n Range of scores Mean Standard
Deviation Parent-student communication 155 0.11 – 2.00 1.31 0.41 Note. Possible range for the parent-student communication scale was 0.00 – 2.00.

74
Table 1.26 Friend Characteristics Variable
0 n %
1 n
%
2 n
%
3 n
%
4+ n
%
Dropped out of high school without graduating? Plan to have a regular full-time job after high school? Plan to attend a two-year community college or technical school? Plan to attend a four-year college or university? Plan to enter the military? Plan to become a homemaker?
3622%
74%
53%
2012%
7948%
8350%
3622%
2817%
2515%
3924%
4628%
3823%
3622%
4024%
3320%
2113%
2616%
2917%
21
13%
40 24%
30
18%
25 15%
3
2%
8 5%
3722%
5030%
7043%
6036%
117%
95%
Note. Students responded by indicating how many close friends (0–4 or more) choose each option. Table 1.27 Friend Expectations Variable n %
What best friend thinks is the most important thing for you to do right after high school:
College or Trade/Vocational school Work Whatever you want Other/Don’t Know Enter the military Get married
124
10
14
10
2
2
77%
6%
9%
6%
1%
1%

75
Table 2.1 Graduation Status at Follow-up Variable n % Graduated from high school
Yes No
70
78
47%
53% If did not graduate, why not?
Did not pass ELA section of the CAHSEE Did not pass math section of the CAHSEE Did not pass both sections of the CAHSEE Did not have enough credits Did not pass ELA section of the CAHSEE, and did not have enough credits Did not pass math section of the CAHSEE, and did not have enough credits Did not pass both sections of the CAHSEE, and did not have enough credits
27
8
5
4
6
4
2
48%
14%
9%
7%
11%
7%
4%
Note. The total n for reasons why students did not graduate was 56. This number was less than the number for those who did not graduate (n = 78) due to missing data within the follow-up survey.

76
Table 2.2a Current Educational Plans at Follow-up: All Students Variable n % Earn a regular high school diploma by:
Re-enroll in high school Receive tutoring to pass CAHSEE Enroll in independent study in your district Enroll in an adult secondary school program Enroll in a district course focusing on the CAHSEE
Earn a high school equivalent Passing the CHSPE Passing the GED
Attend community college
Attend vocational/trade school
Attend a 4–year college
No current plans to attend school
Attend further schooling at a later date, but not this fall
10
1
4
6
4
1
0
70
2
0
14
36
7%
1%
3%
4%
3%
1%
0%
47%
1%
0%
9%
24%
Table 2.2b Current Educational Plans at Follow-up: High School Graduates Variable n % Current Educational Plans
Attend community college Attend vocational/trade school Attend a 4–year college No current plans to attend school Attend further schooling at a later date, but not this fall
46
1
0
6
17
66%
1%
0%
9%
24%

77
Table 2.2c Current Educational Plans at Follow-up: Students Who Did Not Graduate High School Variable n % Earn a regular high school diploma by:
Re-enroll in high school Receive tutoring to pass CAHSEE Enroll in independent study in your district Enroll in an adult secondary school program Enroll in a district course focusing on the CAHSEE
Earn a high school equivalent Passing the CHSPE Passing the GED
Attend community college
Attend vocational/trade school
Attend a 4–year college
No current plans to attend school
Attend further schooling at a later date, but not this fall
10
1
4
6
4
1
0
24
1
0
8
19
13%
1%
5%
8%
5%
1%
0%
31%
1%
0%
10%
24%

78
Table 2.3 Educational Self-Expectations at Follow-up: All Students, Graduated, and Did Not Graduate All Students Graduated Did Not Graduate Variable n (%) n (%) n (%)
Less than high school graduation High school graduation only 2–year community college Attend, but not complete, a 4–year degree Graduate from a 4–year college Obtain a Masters Degree or equivalent Obtain a Ph.D., M.D., or other advanced degree Don’t Know
1 (1%)
7 (5%)
52(35%)
6 (4%)
50 (34%)
13 (9%)
5 (3%)
14 (10%)
0 (0%) 1 (1%)
1 (1%) 6 (8%)
27 (39%) 25 (32%)
4 (6%) 2 (3%)
27 (39%) 23 (30%)
6 (9%) 7 (9%)
0 (0%) 5 (6%)
5 (7%) 9 (12%)
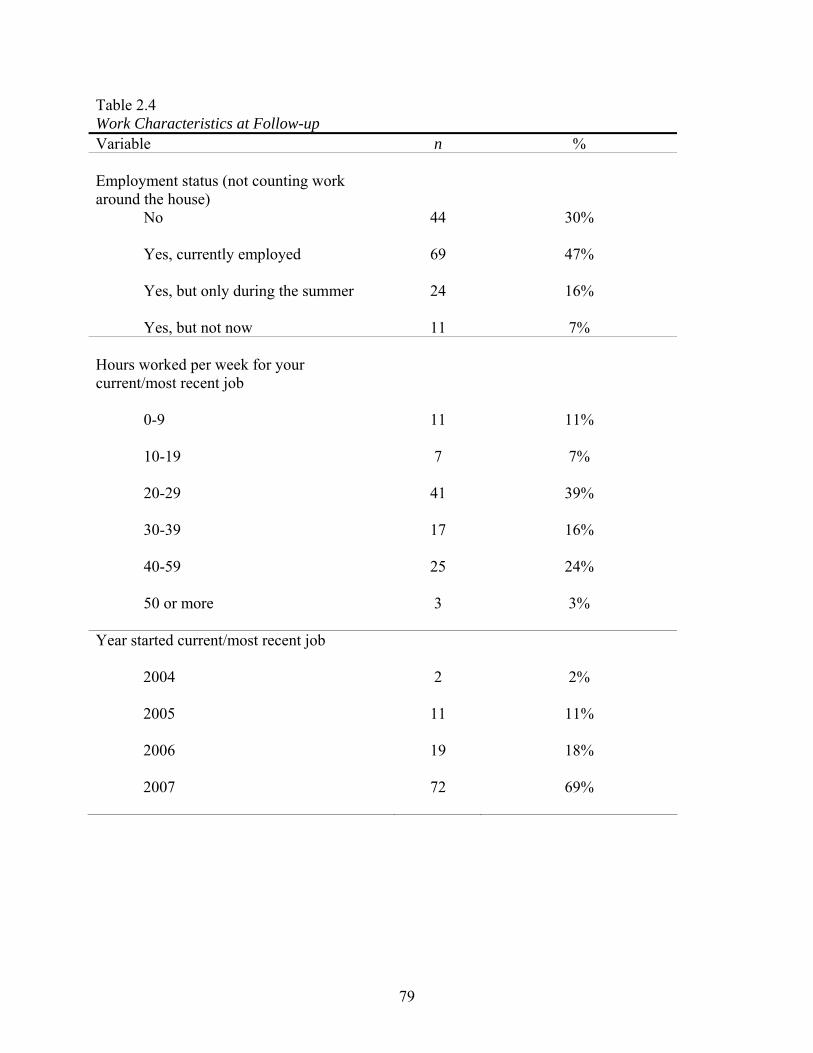
79
Table 2.4 Work Characteristics at Follow-up Variable n % Employment status (not counting work around the house)
No Yes, currently employed Yes, but only during the summer Yes, but not now
44
69
24
11
30%
47%
16%
7% Hours worked per week for your current/most recent job
0-9 10-19 20-29 30-39 40-59 50 or more
11 7
41
17
25 3
11%
7%
39%
16%
24%
3%
Year started current/most recent job 2004 2005 2006 2007
2
11
19
72
2%
11%
18%
69%

80
# of hours for those that worked weekends (n= 70)
1-9 10-19 20 or more
39
28 3
56%
40%
4%
Average Hours
Standard Deviation
Average number of hours worked 27 11.22 Average number of weekend hours 10 4.60 Table 2.5 Life Satisfaction at Follow-up
Note. The range for the Life Satisfaction Scale is 1–6.
Table 3.1 Logistic Regression Analyses for Predicting CAHSEE Status (Pass/No Pass) Variable B S.E. Wald’s χ2 Sig.
Extracurriculars 0.07 0.06 1.16 0.28
School Connect 0.02 0.04 0.20 0.66
P-C Commun. 0.00 0.05 0.00 0.99
Self-efficacy -0.06 0.06 1.23 0.27
Value education -0.03 0.02 3.27 0.07
Life satisfaction 0.07 0.03 5.15 0.02*
Variable
n
Range of sample scores
Mean
Standard Deviation
Life Satisfaction mean score
Overall sample
Graduates Non-graduates
148
70
78
1.7–6.0
2.3–6.0
1.7–6.0
4.21
4.35
4.08
0.96
0.85
1.04

81
Table 3.2 Logistic Regression Analyses for Predicting High School Graduation Variable B S.E. Wald’s χ2 Sig.
Extracurriculars 0.04 0.07 0.28 0.60
School Connect 0.00 0.03 0.02 0.90
P-C Commun. -0.05 0.04 1.49 0.22
Self-efficacy -0.02 0.05 0.10 0.75
Value education -0.04 0.02 4.31 0.04*
Life satisfaction -0.84 0.57 2.15 0.14
Table 3.3 Logistic Regression Analysis for Predicting Post-secondary Enrollment Variable B S.E. Wald’s χ2 Sig.
Extracurriculars 0.03 0.07 0.15 0.70
School Connect -0.00 0.03 0.00 0.96
P-C Commun. 0.06 0.04 1.70 0.19
Self-efficacy -0.01 0.05 0.02 0.89
Value education 0.01 0.02 0.20 0.65
Life satisfaction 0.00 0.03 0.03 0.87

82
Appendix 2. Brief Summary of Participating School Districts
The districts from which this sample was selected included urban, suburban, and more
rural communities. Although this sample is not representative of the entire state of California, it
does provides sufficient information with which to better understand the factors associated with
high school completion among high school seniors who have not passed the CAHSEE. A
random sample of students was obtained from each of the participating school districts.
The first school district serves urban communities and includes over 180,000 students in
grades 9-12 in 65 comprehensive high schools, and 45 continuation high schools. Students across
these schools are 73% Latino and 9% Anglo. As an example of student enrollment, two sample
comprehensive high schools have student enrollments in grades 9-12 of about 4,800 to 5,200
each, with 99% Latino, 0.3% Anglo, 56% socio-economically disadvantaged (as measured by
eligibility for the free/reduced price lunch program), and 52% English Learners in one and 99%
Latino, 0.2% Anglo, 68% socioeconomically disadvantaged, and 63% English Learners in the
other.
The second school district serves suburban communities and includes about 7,500
students in grades 9-12 in three comprehensive high schools, and one continuation high school.
Students across these schools are 45% Latino and 45% Anglo. As an example of student
enrollment, two comprehensive high schools have student enrollments in grades 9-12 of about
2,300 each, with 52% Latino, 41% Anglo, 33% socioeconomically disadvantaged, and 22%
English Learners in one and 44% Latino, 48% Anglo, 27% socioeconomically disadvantaged,
and 20% English Learners in the other.
The third school district serves rural communities and includes about 7,600 students in
grades 9-12 in two comprehensive high schools, and two continuation high schools. Students

83
across these schools are 58% Latino and 30% Anglo. The two comprehensive high schools have
student enrollments in grades 9-12 of about 2,500 each, with 81% Latino, 9% Anglo, 69%
socioeconomically disadvantaged, and 38% English Learners in one and 36% Latino, 52%
Anglo, 25% socioeconomically disadvantaged, and 8% English Learners in the other.
The fourth school district serves suburban communities and includes about 5,800 students
across three comprehensive high schools, one continuation high school, and two alternative high
schools. Students across these schools are 38% Latino and 49% Anglo. As an example of student
enrollment, two of the comprehensive high schools have student enrollments in grades 9-12 of
about 2,200, with 33% Latino, 56% Anglo, 20% socioeconomically disadvantaged, and 18%
English Learners in one and 40% Latino, 50% Anglo, 32% socioeconomically disadvantaged,
and 19% English Learners in the other.

84
Appendix 3. Initial Survey

85

86

87
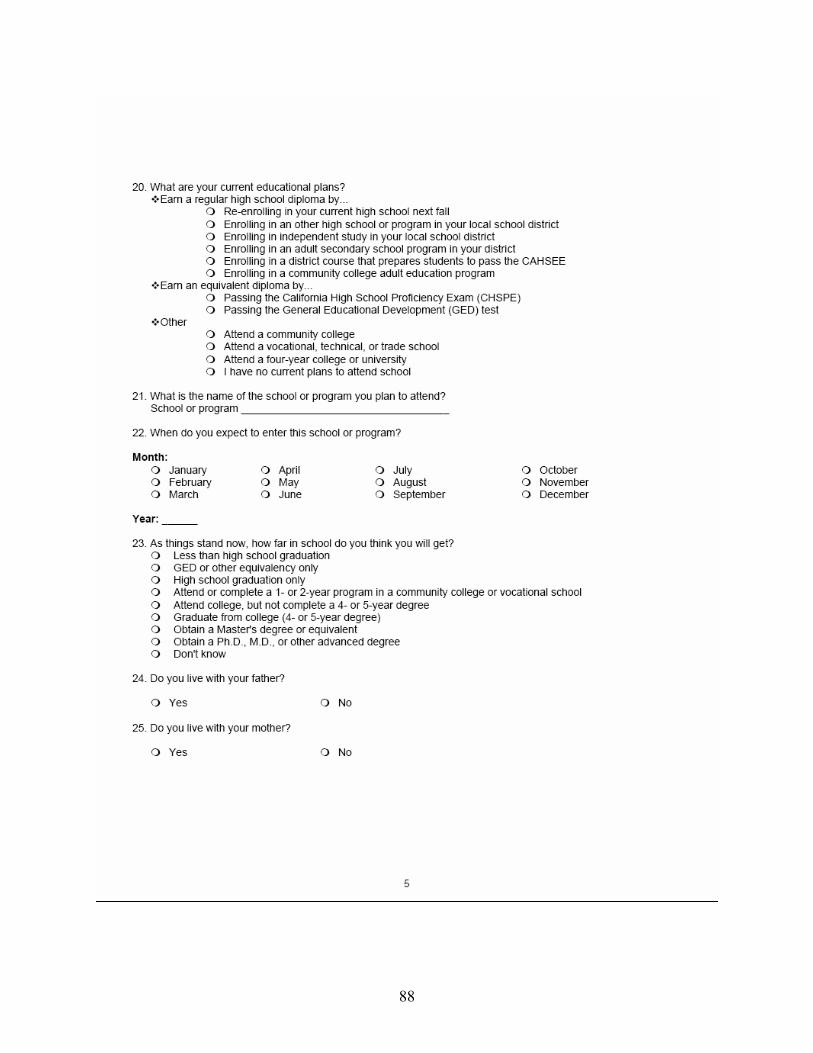
88

89

90

91

92

93
Appendix 4. Follow-up Survey
UC SURVEY OF CALIFORNIA HIGH SCHOOL SENIORS Follow-Up Survey
1. Did you graduate from high school last year? ______ No -- ______ Yes SKIP TO QUESTION 4 2. Will you graduate from high school this year? ______ No -- ______ Yes SKIP TO QUESTION 4 ↓ 3. If No, is it because:
(MARK ALL THAT APPLY)
a. You did not pass the math section of the CAHSEE………………. O b. You did not pass the English section of the CAHSEE……… ….. O c. You did not have enough credits for a diploma……………… ….. O
4. What are your current educational plans? (MARK ONE RESPONSE)
a. Earn a regular high school diploma by
i. Re-enrolling in your current high school next fall…………………………….. O ii. Tutoring to pass the CAHSEE exam…………………………….. O
iii. Enrolling in an other high school or program in your local school district …..… O iv. Enrolling in independent study in your local school district………O v. Enrolling in an adult secondary school program in your district……O
vi. Enrolling in a district course that prepares students to pass the CAHSEE….. O vii. Obtaining a high school diploma through enrolling in a community college’s adult
education program. ….…………….. O b. Earn an equivalent high diploma by
viii. Passing the California High School Proficiency Exam (CHSPE) ….…………….. O ix. Passing the General Educational Development (GED) test………………………… O
c. Attend a community college………………………………………………………. O d. Attend a vocational, technical, or trade school………………………………………… O e. Attend a four-year college or university ………………………………………… O f. I have no current plans to attend school.. …………………………….. O SKIP
TO QUESTION 7 5. What is the name of the school or program you plan to attend:
_______________________________________________________________________

94
6. When do you expect to enter this school or program? __ __ __ __ __ __
Month Year 7. As things stand now, how far in school do you think you will get?
(MARK ONE RESPONSE) Less than high school graduation................................…................O GED or other equivalency only..................................................... O High school graduation only.......................................................... O Attend or complete a 1- or 2-year program in a community college or vocational school........................…..…..... O
Attend college, but not complete a 4- or 5-year degree.......…........ O Graduate from college (4- or 5-year degree)........ ..............…......... O Obtain a Master's degree or equivalent................................…........ O Obtain a Ph.D., M.D., or other advanced degree.................…........ O Don't know...........................................................................………O
8. Have you ever worked for pay, not counting work around the house?
(MARK ONE RESPONSE)
No................................................................................ O SKIP TO QUESTION 12 Yes, and you are currently employed............................ O Yes, but this was a summer only job……………………O Yes, but you are not currently employed...................... O
9. When did you start your current or most recent job? __ __ __ __ __ __
Month Year
10. How many hours do you usually work each week on your current or most recent job? ________ hours
11. How many of those hours each week are/were on the weekend (Saturday or Sunday)? ________ hours

95
12. How much do you agree with the following?
(MARK ONE RESPONSE ON EACH LINE)
Strongly
Disagree
Moderately Disagree
Mildly Disagree
Mildly Agree
Moderately Agree
Strongly Agree
a. My life is going well O O O O O O b. My life is just right O O O O O O c. I would like to change many things in my life O O O O O O
d. I wish I had a different kind of life O O O O O O
e. I have a good life O O O O O O f. I have what I want in life O O O O O O g. My life is better than most kids O O O O O O

96
Appendix 5. Description of Composite Variables and Recategorized Variables
School connectedness. School connectedness as reported in section 1.12 was measured
with a scale used by Resnick and colleagues (1997) in the National Longitudinal Study of
Adolescent Health (Add Health). See question 29 in Appendix 2 for test items. Resnick and
colleagues (1997) reported a Cronbach’s alpha coefficient of 0.75 for this scale. Student
responses were computed into a composite score ranging from 0–4, with zero being the lowest
possible level of school connectedness and 4 the highest.
Value of education. Value of education as reported in section 1.13 was measured using 4
statements regarding the value of education, including; education is the key to success in the
future, the way for poor people to get ahead is for them to get a good education, and young
people have a chance of making it if they do well in school, and regardless of where you come
from, or who you are, if you work hard and get a good education, you have a chance to make it
in America. Students could respond that they strongly disagree (score of 0), disagreed (1), felt
neutral (2), agreed (3), or strongly agreed (4) with each statement. See question 37 in Appendix 2
for items. Student responses were computed into a composite score ranging from 0–4, with zero
being the lowest level of belief in the value of education and 4 the highest.
Academic self-efficacy. Academic self-efficacy as reported in section 1.22 was
determined in the current study based on a combination of two scales used in the Educational
Longitudinal Study of 2002 (ELS; Burns et al., 2003). See question 26 in Appendix 2 for the
academic self-efficacy scale used in the current study. The following items came from the ELS
scale “Control Expectation:” When I sit myself down to learn something really hard, I can learn
it; If I decide not to get any bad grades, I can really do it; If I want to learn something well, I
can. The following items came from the ELS scale “Effort and Persistence:” When studying, I

97
keep working even if the material is difficult; When studying, I put forth my best effort. Student
responses were computed into a composite score ranging from 0-3, with zero being the lowest
level of academic self-efficacy and 3 the highest.
Life satisfaction. Life satisfaction as reported in section 1.22 was determined through
using a scale originally cited in the Initial Development of the Students’ Life Satisfaction Scale
(SLSS, Huebner, E.S., 1991). See question 35 in Appendix 2. Student responses were computed
into a composite score ranging from 0–6, with zero being the lowest level of life satisfaction and
6 the highest.
Parent-student communication. Information on parent-student communication as reported
in section 1.25 was obtained from a question originally asked in the NELS 1988 study. See
question 30 in Appendix 2. Student responses were computed into a composite score ranging
from 0–2, with zero being the lowest possible level of parent-student communication and 2 the
highest.
Current educational plans. Students’ current educational plans at follow-up were
determined based on question 4 of the follow-up survey (see Appendix 3). Students reporting the
following option were categorized as still pursuing a high school diploma in Section 3 analyses:
re-enroll in high school; tutoring to pass the CAHSEE exam; enrolling in another high school or
program in your local school district; enrolling in independent study in your local school
district; enrolling in adult secondary school program in your district; enrolling in a district
course that prepares students to pass the CAHSEE; Earn an equivalent diploma by passing the
GED. If students reported current involvement in the following options: attend a community
college; attend a vocational, technical, or trade school; or attend a four–year college or
university, these students were categorized as currently being enrolled in post-secondary school.

98
If students indicated in question 6 of the follow-up survey (see Appendix 3) that they would not
begin post-secondary school until after the fall of 2007, these students were categorized as
having plans to attend further schooling at a later date, but not this fall.
Extracurricular activities. Extracurricular activity involvement as reported as composite
scores in Section 3 analyses was assessed from a 12-item scale based off the original scale used
in the National Education Longitudinal Study of 1988 (NELS; McLaughlin et al., 1997). See
question 5 in Appendix 2. This scale required students to indicate whether they did not
participate, participated, or participated as an officer, leader, or captain in various school-based
extracurricular activities. Student responses were computed into composite scores ranging from
0–3, with zero being the lowest possible level of involvement in extracurricular activities and 3
the highest.
Educational self-expectations. Students’ educational self-expectations as reported in
Section 3 analyses were determined using a question originally asked in the NELS:88 survey.
See question 23 in Appendix 2. Students who endorsed any of the response options related to
post-secondary school attendance (attend or complete a 1– or 2–year program in a community
college or vocational school; attend college, but not complete a 4– or 5–year degree; graduate
from college (4– or 5–year degree); obtain a Master’s degree or equivalent; obtain a Ph.D.,
M.D., or other advanced degree) were considered to have self-expectations of attending post-
secondary school, and all other students were categorized as not having self-expectations of post-
secondary school.
Parent expectations and friend expectations. Parent and friend expectations as reported in
Section 3 analyses were measured using student responses to a question originating from the
ELS 2002 study. See question 26 in Appendix 2. Students answered the question for their mother

99
(or female guardian), father (or male guardian), and best friend(s). If students indicated either of
the following response options: go to college, or enter a vocational-technical or apprenticeship
program, this response indicated parent expectations for future post-secondary education—
whereas all other responses were interpreted as a lack of parent expectations for future post-
secondary education. The same rule was used to determine friend expectations.