structured financing in transport projects … · structured financing in transport projects ......
TRANSCRIPT

Structured Financing in Transport Projects – Homework Assignment
STRUCTURED FINANCING IN TRANSPORT
PROJECTS – HOME WORK ASSIGNMENT
CASE STUDY OF CROSS CITY TUNNEL, SYDNEY
- JOAO FIALHO & NIKHIL MENON
CTIS [MIT PORTUGAL PROGRAM]
APRIL 2012, INSTITUTO SUPERIOR TECNICO

Nikhil Menon | Joao Fialho
1 | P a g e Structured Financing in Transport Projects – Homework Assignment
TABLE OF CONTENTS
1. PROJECT INTRODUCTION ........................................................................................... 2
1.1 DESIGN .................................................................................................................... 2
1.2 THE INFRASTRUCTURE DELIVERY MODEL ..................................................... 3
1.3 HISTORICAL DEVELOPMENT .............................................................................. 4
1.4 CROSS CITY TUNNEL – A NEW PROPOSAL FOR PROJECT FINANCING ....... 5
2. MAIN PARTNERS IN THE PROJECT ............................................................................ 5
3. SOURCES AND COST OF FINANCING ........................................................................ 7
3.1 PUBLIC FINANCING .............................................................................................. 8
3.2 EQUITY.................................................................................................................... 8
3.3 DEBT FINANCING .................................................................................................. 9
3.4 WEIGHTED AVERAGE COST OF CAPITAL (WACC) ........................................ 11
3.5 SENSITIVITY ANALYSIS ..................................................................................... 11
3.5.1 SENSITIVITY ANALYSIS ON THE MID-TERM DEBT LIMIT ................... 12
3.5.2 SENSITIVITY ANALYSIS ON THE PUBLIC FINANCING LIMIT .............. 12
3.5.3 SENSITIVITY ANALYSIS ON THE E/D RATIO .......................................... 13
4. RISK ANALYSIS ........................................................................................................... 13
4.1 RISK IDENTIFICATION ........................................................................................ 13
4.2 RISK ALLOCATION.............................................................................................. 14
5. KEY PERFORMANCE INDICATORS .......................................................................... 15
6. FINANCIAL ANALYSIS ............................................................................................... 16
7. FLEXIBILITY ANALYSIS ............................................................................................ 19
8. CONCLUSION ............................................................................................................... 21
9. REFERENCE(S) ............................................................................................................. 23

Nikhil Menon | Joao Fialho
2 | P a g e Structured Financing in Transport Projects – Homework Assignment
1. PROJECT INTRODUCTION
The Cross City Tunnel (CCT) is a 2.1 km-long tunnel located in Sydney, Australia. It
links Diamond Harbour on the Western fringe of the central business
district to Rushcutters Bay in the Eastern Suburbs. The tunnel is actually two distinct
tunnels and they largely follow a route underneath William Street and Park or Bathurst
Streets, depending on whether it is eastbound or westbound.
As of December 2006, the tollway was insolvent with debts of over A$500 million. On
20 June 2007, Leighton Contractors and investment bank ABN AMRO were chosen as
preferred purchasers of the Cross City Tunnel Group for $700 million.
It is privately owned and operated, but will revert to public ownership in 2030.
1.1 DESIGN
The tunnel in fact comprises two road tunnels — one eastbound and one westbound —
each with two traffic lanes, in addition to a third small ventilation tunnel. The Cross
City Tunnel also links with the Eastern Distributor, enabling vehicles traveling from the
West to travel to the Airport and Southern Suburbs. From the Eastern Distributor
Northbound, motorists have the ability to connect to the Cross City Tunnel Westbound,
avoiding the CBD once again.
The tunnels avoid 16 sets of traffic lights westbound, and 18 sets of traffic lights
eastbound on the alternative surface streets. The trip through the tunnel takes two
Nikhil Menon | Joao Fialho
3 | P a g e Structured Financing in Transport Projects – Homework Assignment
minutes in free flowing traffic, saving up to 20 minutes and an average of eleven
minutes in peak times on existing surface roads.
The Cross City Tunnel project involved two phases, the building of the tunnel, and the
associated surface street works. The surface street changes involved numerous changes
to the organization of streets. These mainly involved reducing general traffic lanes in
William St, widening footpaths, planting trees, building bus transit lanes and improving
cycle access. This was achieved through reducing general traffic lanes from three each
way to two each way toaccommodate these changes a number of changes were made to
the capacity to turn right out of William St.
The tunnel is Sydney's first completely electronic tollway requiring the driver to have an
electronic tolling tag installed in their car or register for an electronic pass (for casual or
less frequent users).
1.2 THE INFRASTRUCTURE DELIVERY MODEL
The CCT project involves the financing, design, construction, operation and
maintenance of two new east-west toll road tunnels, and the financing, design and
construction of associated improvements to surface roads, including new bus and
bicycle lanes, intersection improvements, traffic calming measures, wider footpaths and
other improvements to pedestrian facilities to take advantage of the opportunities
afforded by reduced traffic congestion.
CrossCity Motorway Consortiumwas the company contracted to finance, build, own,
operate and maintain the tunnel for concession terms. They were sponsored by
Baulderstone, Bilfinger, and Deutsche BankAktiengesellschaft.
Bilfinger Berger Aktiengesellschaft and Baulderstone Hornibrook formed a joint
venture to design, construct and commission the tunnels. This joint venture is known as
the Contractors.
Baulderstone Hornibrook is the Operator under an Operations and Management contract
with the Company.

Nikhil Menon | Joao Fialho
4 | P a g e Structured Financing in Transport Projects – Homework Assignment
1.3 HISTORICAL DEVELOPMENT
In 2002, the government of Bob Carr awarded Cross City Motorways the contract to
build, own, and operate an east-west tunnel underneath the Sydney CBD.
Construction work for the cross city tunnel commenced in January 2003, and the tunnel
was originally scheduled to open in October 2005. In April 2005 the NSW government
announced that the tunnel would open four months early, on Sunday 12 June.
The opening day was subsequently postponed due to detailed commissioning works,
with the official opening going ahead on Sunday 28 August 2005. Later a three-week
toll-free period was announced by the operators. At the same time, the operators
announced a freeze on toll increases for twelve months and the fee for casual (non-
electronic tag) users was waived.
The toll free period was then extended for a further two and a half weeks, until the end
of November, 2005.
In February 2006, with an average trip per day being approximately 30,000first media
speculation of a "buy-out" by the New South Wales government began. The rumoured
price would exceed A$1 billion while the tunnel only cost A$680 million to build.
On 3 March 2006, the Cross City tunnel consortium after consultation with the New
South Wales (NSW) government announced that the toll would be halved to $1.78 for
three months, that some planned road closures would not be pursued, and that some
existing road closures would be reversed. But two days prior to the end of the half-price
toll period, the Premier of NSW, Morris Iemma, ended negotiations with the Cross City
Tunnel Consortium without an agreement, announcing the immediate reversal of some
road closures, contrary to the contract.
In November 2006, it was reported that the motorway was in financial difficulties, and
that additional equity would be required from the tunnel's investors in order to avoid
placing the tunnel in administration. At the same time, it was suggested that traffic
volumes of between 60,000 and 90,000 per day were needed in order for the consortium
to meet the tunnel interest payments. The NSW government responded to the reports by
indicating that it would not buy out the tunnel, nor assist in its financing.

Nikhil Menon | Joao Fialho
5 | P a g e Structured Financing in Transport Projects – Homework Assignment
On 27 December 2006, a syndicate of 16 Australian and International banks appointed
the insolvency firm KordaMentha as receivers and managers for Cross City Motorway
Limited after the project accrued debts exceeding A$ 560 Million. The tunnel was later
sold.
1.4 CROSS CITY TUNNEL – A NEW PROPOSAL FOR PROJECT
FINANCING
During the course of our study, two major criticisms with regards to the project have
been observed:
I. The fundamental failure was in the estimation of revenue based on traffic
modeling. This modeling was clearly an error, suggesting that the CCM’s
estimates exceeded ceiling capacity for the tunnel, and indeed that the Road
Traffic Authority’s (RTA) estimates exceeded the ceiling capacity of the major
intersection directly before the eastern portal, a site which has evidenced in long
term traffic counts that it has reached a ceiling capacity at around 52,000-53,000
vehicles per day.
II. The requirement that the project be undertaken at no cost to government meant
that there was an increased impost of almost one-sixth of the standard cost of the
project. This factor coupled with the benefit expected from diverting the traffic
from the surface streets necessitated a higher cost for the project, which logically
could only be funded with sufficient throughput of customers.
Our purpose is to look into these two above-mentioned aspects and propose an
analysis/intervention on the grounds of a new infrastructure delivery model that would
try to avoid the above mentioned situations.
2. MAIN PARTNERS IN THE PROJECT
The Cross City Tunnel (CCT) project in Sydney, Australia involves the following main
organizations:
Key parties from the government
Minster for Roads
The Minister responsible for RTA which entered into the contract:

Nikhil Menon | Joao Fialho
6 | P a g e Structured Financing in Transport Projects – Homework Assignment
Treasurer
Authorising Minister for Roads to sign off project:
Key government agencies
Road and Traffic Authority (RTA)
The RTA is the proponent of the project under the EIS, and the government
representative on the contract. It is the organisation which provided entry into the deed.
Budget Committee of Cabinet (BCC)
BCC approves major capital works. Approval is given through five stages: project
definition; expressions of interest and short listing; detailed proposals and assessment;
negotiations and contracts; disclosure and implementation.
Department of Planning
The Minister for Planning has to give planning approval, to consult about strategic
planning and assessment, issue requirements for development of the EIS, assess
environmental impacts, and monitor compliance with conditions of approval. The
department changed name several times during the project.
Key private sector parties
CrossCity Motorway Consortium
The company contracted to finance, build, own, operate and maintain the tunnel for
concession terms. Sponsored by Baulderstone, Bilfinger, Deutsche Bank
Aktiengesellschaft.
Design and Construction Phase
Bilfinger Berger Aktiengesellschaft and Baulderstone Hornibrook formed a joint
venture to design, construct and commission the tunnels. This joint venture is known as
the Contractors, and signed the Design and Construct contract with the Trustee and
Company.
Operations Phase
Baulderstone Hornibrook is the Operator under an Operations and Management contract
with the Company.
The figure below shows the connection of the main partners in the Cross City Tunnel
(CCT) project.

Nikhil Menon | Joao Fialho
7 | P a g e Structured Financing in Transport Projects – Homework Assignment
3. SOURCES AND COST OF FINANCING
As seen in the previous chapter, two major criticisms towards the development of the
Cross City Tunnel was related to the erroneous traffic estimation procedure adopted and
the fact that the project ran on a no cost to the government policy, which inflated its
costs of construction.
This chapter is devoted to the definition of the sources and the cost of financing the
Cross City Tunnel. It is of the opinion that the costs involved in the construction and
other operations is bound to come down when there is an investment from the Public
side. This act would reduce the total costs of financing that will be incurred during the
construction and subsequent stages of the development of the Cross City Tunnel.
However, having said that, it also needs to be stated that the financing sources should be
selected by maximizing the value for money. This means that a Public Sector
Comparator (PSC) should be performed when deciding on the sources of financing.
Three major sources of financing are proposed in this chapter. They are:
1. Public Financing
2. Equity
3. Debt Financing

Nikhil Menon | Joao Fialho
8 | P a g e Structured Financing in Transport Projects – Homework Assignment
3.1 PUBLIC FINANCING
By Public Financing, it is meant ways and means to finance the project using Public
funds. It is done in an effort to reduce the overall costs of financing due to the lower
expected rate of return coupled with a very low level of risk. Taxation is the central part
of modern public financing. Alternatively, governments like any legal entity can take
out loans, issue bonds and make financial investments.
For the purposes of designing this PPP, the rate of interest considered was 4.25% in line
with the rates issued by the Reserve Bank of Australia (RBA) for the year 2012. It was
decided that the upper limit of the public financing shall not exceed 30% of the total
equity being considered for the project.
PROS
It reduces the overall cost of financing for the projects.
Public financing is seen as a source of encouragement on the part of the private
side for their involvement in a project.
CONS
It generates and subsequently leads to an increase of a public debt.
There are commercial risks as to the allotted levels of public finance since the
project depends on other sources of finance for its overall success.
3.2 EQUITY
Equity financing is a long term capital provided by an investor in exchange for shares,
representing ownership in the company or the project. A key characteristic that
distinguishes equity from debt is the holder’s claim to assets. Equity holders receive
dividends and capital gains which are based on net earnings and distributed only after
all debt holders have been paid. In the event of default, equity holders have a claim on
the income and the assets which is secondary to debt holders. In exchange, equity
holders have unlimited potential returns compared to debt holders whose investment
returns are limited to the interest earned on the debt.

Nikhil Menon | Joao Fialho
9 | P a g e Structured Financing in Transport Projects – Homework Assignment
In the current project, the rate of interest considered is at 8.7% which is the rate of
interest, which is also the internal rate of return accrued by the Deutsche Bank, (one of
the sponsors of the project encompassing the Cross City Motorway Consortium) during
the course of the project. It was also determined that the E/D ratio for the particular
project in the real scenario was found to be 0.171, which meant that the debt was found
to be 6 times more than that of the equity. Citing this high variation coupled with the
introduction of public financing proposed in the new PPP, it was subsequently decided
to maintain an E/D ratio of 0.41 for the course of this PPP. We are however aware that
increasing the E/D ratio might be a detriment in finding a private sponsor for the
project, but we have decided to persist with this ratio for the course of the new PPP.
PROS
The Equity is seen to have a positive effect on the aspect of risk sharing for a
particular project, since it leads to a tie up of the private sector on the success of
the project.
By increasing the role of the private sector in the project, there is an intention to
bring in the private sector practices into the working of the PPP, which could be
a possible reason for the increase in efficiency of the work to be done.
CONS
The equity financing is seen to be the most expensive way of financing the
project since the equity holders receive the dividends only after all the debt
holders have been paid. This translates to larger amount of risks since there
won’t be any cash recovered during the short term.
3.3 DEBT FINANCING
Debt Financing is money borrowed to finance a project and the investment return for
the debt holders is limited to interest earned on the Principal. Debt capital can come
from many sources and structured in many ways. For the purpose of this project, it is
proposed that the debts are distinguished according to their maturity as the following:
I. LONG-TERM DEBT

Nikhil Menon | Joao Fialho
10 | P a g e Structured Financing in Transport Projects – Homework Assignment
II. MID-TERM DEBT
All debt financings have a senior claim to the income and the assets of the company or
project. In this projected, it is proposed that the long term debts are financed by
investment banks and that the mid-term debts are financed by the commercial banks.
The associated interest rates with long term debt and mid – term debt are assigned at
7.5% and 6.8% respectively. Another constraint encountered and subsequently
implemented is on the aspect of mid – term debt financing.
Since this belongs to the category of road infrastructure projects, it is understood that
that traffic demand for the Cross City Tunnel is expected to increase along with time.
Thus it is felt that that mid – term debt has to be constrained in such a way that it does
not reach unrealistic levels which will make it impossible to pay back in the said
amount of time. Hence, it is proposed that the mid – term shall not exceed more than
15% of the total cost of the project.
PROS
Unlike equity financing, the borrower does not need to part with a certain
percentage of the shares of the project, thus giving him total control over the
project even when he has borrowed the money, looking at it from the part of the
borrower.
Borrowers have the option of obtaining different interest rates depending on the
maturity of the loan or of the debt financing procured.
CONS
Though the debt holders are limited to the interest, they have a senior claim to
income and assets of the company or project over the other sources of financing.
Once the borrower resorts to different interest rates over his debt finance, he is
faced with the prospect of different pay back periods for each of the interest
rates, which in an event of low generations of the cash flow during the initial
years may lead to high risks of non-payback of mid – term loans, if any.

Nikhil Menon | Joao Fialho
11 | P a g e Structured Financing in Transport Projects – Homework Assignment
3.4 WEIGHTED AVERAGE COST OF CAPITAL (WACC)
The weighted average cost of capital (WACC) is the rate that a company is expected to
pay on average to all its security holders to finance its assets. The WACC is the
minimum return that a company must earn on an existing asset base to satisfy its
creditors, owners and other providers of capital, or they will invest elsewhere.
Companies can use WACC to see if the investment projects are worthwhile to
undertake.
The WACC method was used to formulate the financing model in such a way so as to
minimize the value of Weighted Average Cost of Capital. A linear programming model
with the objective of minimizing the weighted average cost of capital (WACC) is
formulated and the observations are as follows:
OBJECTIVE FUNCTION
𝑀𝑖𝑛 𝑊𝐴𝐶𝐶 =𝐸
𝑇𝐼× 𝐾𝐸 +
𝑃
𝑇𝐼× 𝐾𝑝 +
𝐿𝐷
𝑇𝐼× 𝐾𝐿𝐷 +
𝑀𝐷
𝑇𝐼× 𝐾𝑀𝐷 × (1 − 𝑡)
where E – Equity; TI – Total Investment; KE – Cost of Equity capital; P – Public
financing; KP – Cost of public capital; LD – Long term debt financing; KLD – Cost of
long term debt financing; MD – Mid-term debt financing; KMD – Cost of mid-term debt
financing; t – income tax rate (30%).
For the constraints proposed, the minimum value of the weighted average cost of capital
is found to be 5.92%, with the following composition of the financing structure:
Equity Financing
(%)
Public Financing
(%)
Long term debt
Financing (%)
Mid-term debt
Financing (%)
26.8 8.0 50.2 15.0
3.5 SENSITIVITY ANALYSIS
In order to check for the variation of the various parameters for a specific set of
constraints proposed on the financing model, a sensitivity analysis was performed and
the following observations are obtained:

Nikhil Menon | Joao Fialho
12 | P a g e Structured Financing in Transport Projects – Homework Assignment
3.5.1 SENSITIVITY ANALYSIS ON THE MID-TERM DEBT LIMIT
Sensitivity Analysis was performed on the mid-term debt limit and the following
observations are obtained:
As observed, the weighted average cost of capital (WACC) decreases with an increase
in the levels of mid – term debt financing.
3.5.2 SENSITIVITY ANALYSIS ON THE PUBLIC FINANCING LIMIT
The sensitivity analysis on the public financing limits shows the following observations:
As expected, with an increase in public financing, the weighted average cost of capital
(WACC) reduces on the grounds of a lesser interest rate.
Mid-term Debt
LimitWACC
10% 5,94%
15% 5,92%
20% 5,89%
Public Financing
LimitWACC
25% 5,96%
30% 5,92%
35% 5,88%

Nikhil Menon | Joao Fialho
13 | P a g e Structured Financing in Transport Projects – Homework Assignment
3.5.3 SENSITIVITY ANALYSIS ON THE E/D RATIO
The sensitivity analysis was performed on the E/D ratio to obtain the following results:
As can be seen, an increase in equity financing leads to a subsequent increase in the
weighted average cost of capital (WACC), since this involves an increase in the interest
rates.
4. RISK ANALYSIS
This section mainly consists of two parts:
I. Risk Identification
II. Risk Allocation
4.1 RISK IDENTIFICATION
A summary of all possible risks are enlisted. This is preceded by the identification of
the said risks associated with the construction and the subsequent operation of the Cross
City Tunnel (CCT). The risks identified for the course of this study are as follows:
Construction Cost: One of the major sources of uncertainties arising in the
Cross City Tunnel (CCT) project is on the lines of the construction costs. Since
the project consists of a tunnel, the uncertainties arising due to the geology
existing in the region of the tunnel remains unknown despite all the geological
investigations. The costs of land acquisition are an issue which needs to be
addressed in the fairest of manners since it might involve possible
E/D ratio WACC
36% 5,85%
41% 5,92%
46% 5,97%
Nikhil Menon | Joao Fialho
14 | P a g e Structured Financing in Transport Projects – Homework Assignment
rehabilitation of people which add to the existing costs. Another uncertainty to
be taken into consideration is the possible chance of poor performance by the
contractors in fulfilling their obligations.Poor performance means delays,
which translate into extra costs. Other possible risks include public protests
regarding the construction of the infrastructure, inflation in the construction
industry.
Demand: The uncertainty in demand is one of the main sources of risk
involved in the Cross City Tunnel project. One of the major flaws in the
original PPP of the Cross City Tunnel (CCT) project was the blatant over
estimation in the traffic demand levels. It was understood from analysis that the
forecasted demand was thrice the actual demand on the tunnel causing the
financial failure of the project, thus sending it into administration few years
after the tunnel started operating.
Operation Performance: Another source of risk that could possibly arise is on
the aspect of the operation performance of the Cross City Tunnel (CCT). Issues
pertaining to adherence to safety standards and the emphasis on the
environment could be stand points in defining the operation performance levels
of the Cross City tunnel. Adherence to level of service standards could be one
of the possible risks in this category where in, the tunnel might not be in a
position to fulfill the previously agreed upon levels of service due to several
issues. Routine maintenance of the tunnel to ensure the adherence to levels of
security and safety could be another possible risk worth exploring.
Others: Other sources of risk include events like Force Majeure,
reasonableness of behaviour of public and private agencies.
4.2 RISK ALLOCATION
The risks identified above are to be allocated among the public and the private agencies.
For this purpose, a list of the possible risks that could be encountered is determined.
Allocation to a particular agency will mean that the particular agency will be
responsible for possible mitigation measures to be taken, should that risk arise in the
course of the project. It is to be noted that some of the risks are duly allocated to both
parties since it is felt that the mitigation process can only be proceeded upon by the

Nikhil Menon | Joao Fialho
15 | P a g e Structured Financing in Transport Projects – Homework Assignment
active involvement of the two agencies together, instead of it being allocated to one of
the two. They are as listed below:
Risks Public Private
Geology Uncertainty X
Land Acquisition X
Contractor Performance X
Public Protests and Litigation X
Construction Costs Inflation X
Demand X
Safety and Environmental Standards X
Levels of Sevice X
Maintenance X
Force Majeure X
Agency Behaviour X
5. KEY PERFORMANCE INDICATORS
This chapter proposes to set up a list of key performance indicators (KPIs) which might
be used in order to gauge the performance levels in the Cross City tunnel. The operator
stands to receive an incentive for keeping up to the prescribed levels of performance.
The payment stream by these means is performance based and will vary depending on
whether, and to what extent each of the KPIs is met. A bonus or an abatement regime on
the toll revenues would be developed in line with this concept.
The KPIs for the current study are divided into two groups namely: the construction
phase and the operations phase.
The guidelines for proposing KPIs are as follows:

Nikhil Menon | Joao Fialho
16 | P a g e Structured Financing in Transport Projects – Homework Assignment
CONSTRUCTION PHASE:
Construction costs according to the proposed budget
Construction works in accordance with the schedule
OPERATIONS PHASE:
Lack of congestion (average travel times)
Road accidents (number of traffic incidents)
Ride Quality (pavement surface condition)
Environmental Impacts ( number of incidents of breach in noise/ air quality
requirements)
Provision of traveler information (accuracy and frequency)
Vehicle breakdown services (availability and response times)
6. FINANCIAL ANALYSIS
The Net Present Value (NPV) of the present project is analyzed in this section. The
analysis is mainly done with the aid of the Cash Flow Statement in which some
assumptions have been taken for the current study. The assumptions are as listed below:
The demand that has been adopted for the current study is not the demand
proposed through forecasts in case of the original project study but the actual
demand that was observed post all the forecasts. We proposed an increase in the
toll fares mainly due to the financial irregularities observed in the original
project and the subsequent loss in generation of revenue.
The next assumption was with respect to inflation. The values of inflation
adopted in the current study are representative of the values observed for the
Reserve Bank of Australia (RBA) in the year 2011. The inflation rate stands at
3.42% for the current study.
The next assumption was in the construction costs of the Cross City Tunnel. The
construction costs for the current study constitute only 65% of the construction
costs that pertained during the original project study. It is so because, in the
current study, it was understood that there need be only one tunnel and not two
in view of the low levels of traffic that had been observed. The possible

Nikhil Menon | Joao Fialho
17 | P a g e Structured Financing in Transport Projects – Homework Assignment
expansion of the tunnel in order to build the second tunnel would be explored in
the chapter concerning the aspect of Flexibility.
The costs of construction adopted for the current study are divided into three
years, the period required for the construction of the Cross City tunnel (CCT).
Next assumption is based on the aspect of Operation Cost. The Operation costs
have been subdivided into “Fixed Costs” and “Variable Costs”. The fixed costs
for the Cross City Tunnel were taken to be in the tune of A$5 million per year.
The variable costs are taken to a function of the traffic demand, basically 10% of
the total toll revenues.
The toll values were assumed to be A$4.5 for light vehicles and A$9 for the
heavy vehicles. This is against the original toll fare of A$3.5 and A$7 for light
and heavy vehicles respectively, an increase by 28-29%. Thus, in order to adjust
the demand to the new toll regime, we introduced the concept of elasticity onto
the levels of actual demand being observed at the Cross City Tunnel (CCT). The
levels adopted were -0.26 and -0.60 for light and heavy vehicles respectively.
The NPV for the present study is shown as under:
Value of the Project (NPV)
$256.981.670
A series of Sensitivity analyses were done in order to gauge the response of the NPV
with respect to five parameters, namely: Demand, Rate of Return, Inflation,
Construction Costs and Operation Costs. The variations are as shown below:
-$400.000.000
-$200.000.000
$0
$200.000.000
$400.000.000
$600.000.000
$800.000.000
2012 2017 2022 2027 2032
Sensitivity Analysis - Demand
60%
80%
100%
120%
140%

Nikhil Menon | Joao Fialho
18 | P a g e Structured Financing in Transport Projects – Homework Assignment
The graphic above shows the expected variation between Demand and NPV. As can be
seen, there is a big variation in the NPV parameter with respect to a variation in the
demand.
The graphic above shows the variation between NPV and the Rate of Return. As
expected, there is a decrease in the NPV with an increasing rate of return without
compromising the feasibility of the project.
The graphic above shows the variation of inflation with the NPV. When the inflation is
higher, there is an initial slump in the NPV which later recovers in due course of time.
Otherwise, an increasing inflation rate has an increasing trend on the NPV.
$0
$100.000.000
$200.000.000
$300.000.000
$400.000.000
2012 2017 2022 2027 2032
Sensitivity Analysis - Rate of Return
4,70%
6,70%
8,70%
10,70%
12,70%
$0
$200.000.000
$400.000.000
$600.000.000
$800.000.000
2012 2017 2022 2027 2032
Sensitivity Analysis - Inflation
1,42%
2,42%
3,42%
4,42%
5,42%
-$100.000.000
$0
$100.000.000
$200.000.000
$300.000.000
$400.000.000
2012 2017 2022 2027 2032
Sensitivity Analysis - Construction Costs
90%
95%
100%
105%
110%

Nikhil Menon | Joao Fialho
19 | P a g e Structured Financing in Transport Projects – Homework Assignment
The fourth sensitivity analysis is pitting construction costs against NPV. As is obvious,
an increase in the construction costs leads to a decrease in the NPV of the project.
The final sensitivity analysis is on operation costs against the NPV. Higher operation
costs indicate a lesser NPV, something which can be understood from the graphic
above. From the range of values tested, neither of them puts the NPV into the negative
zone.
7. FLEXIBILITY ANALYSIS
The forecast is always wrong. True to that statement, we need to take into account the
fact that the future is always uncertain. This section strives to analyze the impact of the
uncertainties on the financial performance of the project.
The main uncertainty in this project was related to the demand since the revenues
depended on the evolution of traffic over time. The binomial lattice model was resorted
to, to analyze this situation. The lattice model presents all the states of the world, which
would happen in the future course of time in order to help us in making our decisions.
The assumption and the procedures adopted are as listed below:
Calibration of the parameters u, d, p: The parameters u, d, p which are
required in the binomial lattice model are evaluated in accordance to the
formula prescribed.
√
√
𝑝
√ 𝑡
$0
$100.000.000
$200.000.000
$300.000.000
$400.000.000
2012 2017 2022 2027 2032
Sensitivity Analysis - Operation Costs
90%
95%
100%
105%
110%

Nikhil Menon | Joao Fialho
20 | P a g e Structured Financing in Transport Projects – Homework Assignment
The value of v = 0.023 (annual growth) and the value of 𝞼 = 0.067. The value of
𝞼 is so because it is assumed that uncertainty grows regularly at the rate of 15% over 5
years.
The lattice model was developed considering the net cash flows, which were evaluated
considering the following:
Construction Costs (-)
Operation Costs (-)
Capital Costs (-)
Toll Revenues (+)
The current study involves comparison of two cases: one of a base case and the second
of a flexible design case. The base case consists of building one tunnel with no
provision of increasing the capacity by building a second one at all times. The flexible
design case consist of building one tunnel with the provision for increasing capacity by
building a second tunnel at any time depending on the need by calling on that option.
The binomial lattice model was applied to both the cases. The expected values of the
NPVs are as shown below. This also gives the value of the option which is as shown
under:
Base Case Flexible Design Case Value of Flexibility
ENPV $139.318.190 $140.525.996 $1.207.806
As is seen from the graphic above, the Expected Net Present Value (ENPV) of the
flexibility design case is higher than the ENPV of the base case with no flexibility. The
difference in the values of Expected Net Present Value (ENPV) from the base case to
the flexibility design case is found to A$1,207,806, which is called as the “value of
flexibility”.
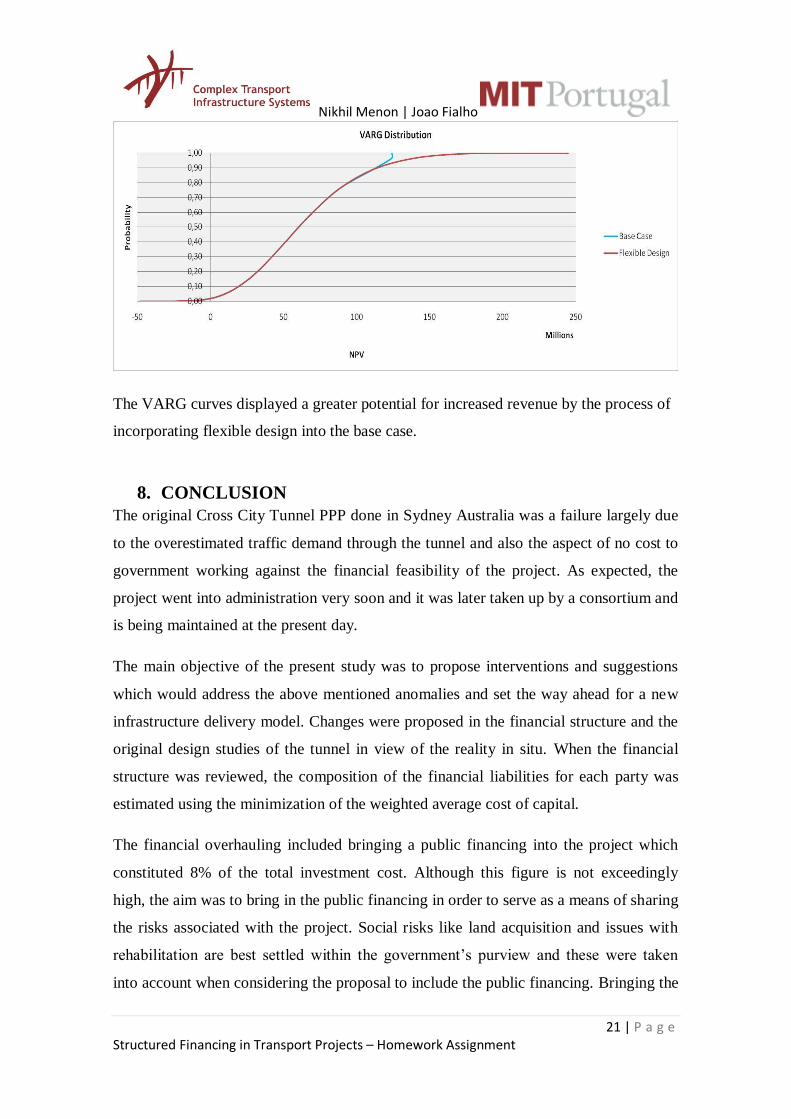
The VARG curves obtained for this option show some expansion of the upside potential
of the project. And they are as shown below:
Nikhil Menon | Joao Fialho
21 | P a g e Structured Financing in Transport Projects – Homework Assignment
The VARG curves displayed a greater potential for increased revenue by the process of
incorporating flexible design into the base case.
8. CONCLUSION
The original Cross City Tunnel PPP done in Sydney Australia was a failure largely due
to the overestimated traffic demand through the tunnel and also the aspect of no cost to
government working against the financial feasibility of the project. As expected, the
project went into administration very soon and it was later taken up by a consortium and
is being maintained at the present day.
The main objective of the present study was to propose interventions and suggestions
which would address the above mentioned anomalies and set the way ahead for a new
infrastructure delivery model. Changes were proposed in the financial structure and the
original design studies of the tunnel in view of the reality in situ. When the financial
structure was reviewed, the composition of the financial liabilities for each party was
estimated using the minimization of the weighted average cost of capital.
The financial overhauling included bringing a public financing into the project which
constituted 8% of the total investment cost. Although this figure is not exceedingly
high, the aim was to bring in the public financing in order to serve as a means of sharing
the risks associated with the project. Social risks like land acquisition and issues with
rehabilitation are best settled within the government’s purview and these were taken
into account when considering the proposal to include the public financing. Bringing the

Nikhil Menon | Joao Fialho
22 | P a g e Structured Financing in Transport Projects – Homework Assignment
public investment was also a means to earmark levels of performance which the public
authority would set up and expect the private consortium to comply upon. In this way,
both parties had an advantage in being part of the Cross city tunnel project.
The original project PPP had failed to share any risks between the public and the private
agencies and the risks were tilted heavily in favour of the public authority. Thus with
the participation of the public authority, the overall private debt and costs of capital was
reduced which proved to be good for the sustenance of the tunnel. Another success in
the smooth running of the tunnel was the decision to intervene on the design of the
tunnels. It was determined that traffic was one – third of what was used as forecasts in
the original PPP. This was taken into account and it was realized the need to only
construct one tunnel instead of two, thus leading to a decrease in the construction costs
and the subsequent investments into the tunnel.
Flexibility was incorporated in the current study. The possibility of expansion of the
tunnel from one to two was the main element of flexibility involved in this PPP.It was
done with the aid of the binomial lattice model. The calibration of the parameters u, d,
and p was done in accordance with the prescribed formula and the expected value of
NPV was calculated for both the base as well as the flexible design case. The value of
flexibility obtained was in the order of A$ 1,207,806. The corresponding VARG curves
were plotted which displayed the variation of the expected value of the NPV with the
cumulative probability distributions. Flexibility is capable of increasing the value of the
project and was proved during this exercise.
It is felt from the current study that PPPs are beneficial for better quality of standards
maintained in the construction of infrastructure projects as it involves the private
consortium coupled with the possibility of reductions in operational costs and
investments due to the involvement of the public authority. Although, having said that,
it also needs to be said that the successful implementation of a PPP could only happen if
both the parties did their due diligence towards the successful completion of their
projects.

Nikhil Menon | Joao Fialho
23 | P a g e Structured Financing in Transport Projects – Homework Assignment
9. REFERENCE(S)
http://www.tollroadsnews.com/node/1742
http://www.maths.usyd.edu.au/u/geoffp/melfinrv.pdf
http://www.parliament.nsw.gov.au/Prod/parlment/committee.nsf/0/457c0aac44997e
eeca2571000019d549/$FILE/Sub%2054%20NRMA%20Motoring%20&%20Services.pdf
http://www.parliament.nsw.gov.au/prod/parlment/committee.nsf/0/f412e826bc3dfd
5bca2571720010fc97/$FILE/Final%20Second%20Report.pdf
http://www.irspm2008.bus.qut.edu.au/papers/documents/pdf/Chung%20-
%20Public%20Private%20Partnerships%20A%20Procurement%20Device%20to%20Ma
nage%20Public%20Sector%20Debt%20-%20IRSPM%20-%202008.pdf
http://soac.fbe.unsw.edu.au/2007/SOAC/drivingalone.pdf
http://www.oecd.org/dataoecd/41/9/45039865.pdf
http://www.evanspeck.com/Publications/Towards%20a%20New%20Public%20Private
%20Partnership%20Model%20PPP%20Model.pdf
http://www.bizresearchpapers.com/1.Andrew.pdf
http://www.scribd.com/doc/35386818/Sydney-Cross-City-Tunnel
http://eprints.qut.edu.au/28597/1/Esther_Cheung_Thesis.pdf
http://www.smh.com.au/news/national/cross-city-tunnel-deal-the-whole-bloody-
thing-will-be-made-public/2005/10/18/1129401256764.html
http://www.crosscity.com.au/files/Media/CCT%20Financial%20Close%2027Sept07.pdf
http://auditofficestaging.elcom.com.au/ArticleDocuments/138/152_Cross_City_Tunne
l.pdf.aspx?Embed=Y
http://www.parliament.nsw.gov.au/Prod/parlment/committee.nsf/0/ae685f47fb0e28
84ca257100001bb60d/$FILE/051209%20Dr%20Goldberg%20Cross%20City%20Tunnel.
http://www.atrf.info/papers/2006/2006_Goldberg.pdf
http://www.omegacentre.bartlett.ucl.ac.uk/studies/cases/pdf/AUS_SYDNEY_PROFILE
_260311.pdf
http://www.en.wikipedia.org
Nikhil Menon | Joao Fialho
24 | P a g e Structured Financing in Transport Projects – Homework Assignment
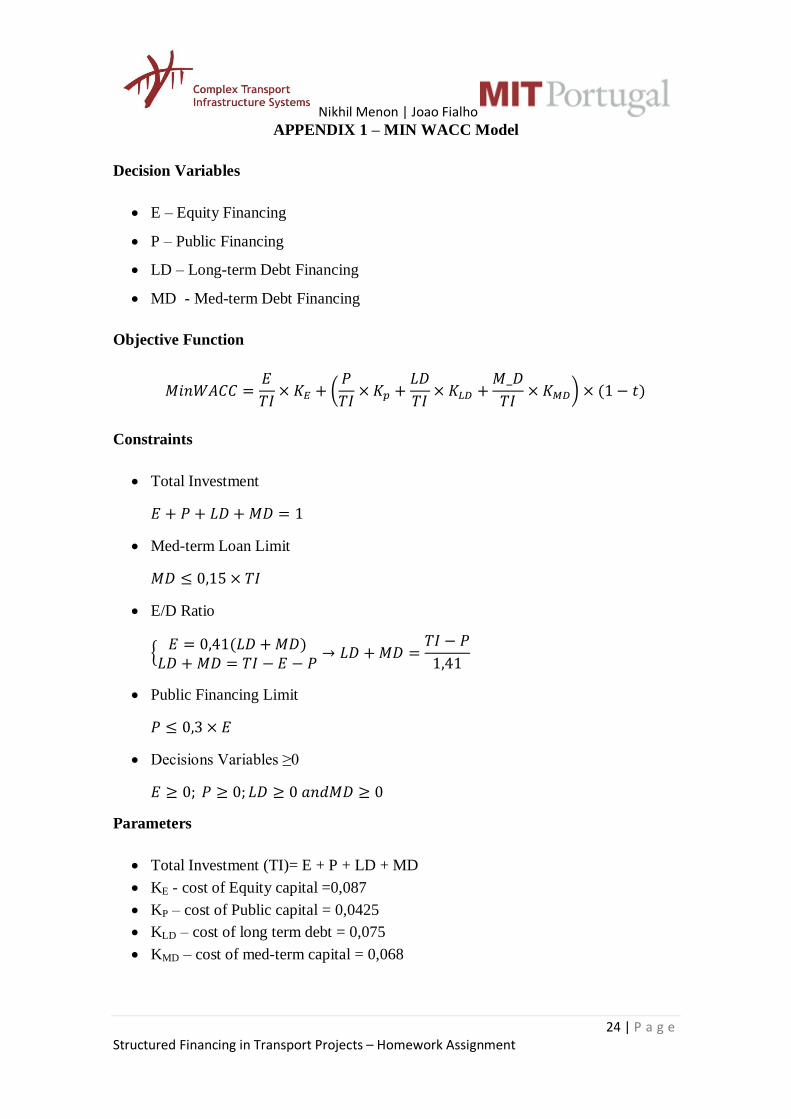
APPENDIX 1 – MIN WACC Model
Decision Variables
E – Equity Financing
P – Public Financing
LD – Long-term Debt Financing
MD - Med-term Debt Financing
Objective Function
𝑀𝑖𝑛𝑊𝐴𝐶𝐶 𝐸
𝑇𝐼 𝐾
𝑃
𝑇𝐼 𝐾
𝐿𝐷
𝑇𝐼 𝐾
𝑀 𝐷
𝑇𝐼 𝐾 − 𝑡
Constraints
Total Investment
𝐸 𝑃 𝐿𝐷 𝑀𝐷
Med-term Loan Limit
𝑀𝐷 𝑇𝐼
E/D Ratio
{𝐸 𝐿𝐷 𝑀𝐷
𝐿𝐷 𝑀𝐷 𝑇𝐼 − 𝐸 − 𝑃 𝐿𝐷 𝑀𝐷
𝑇𝐼 − 𝑃
Public Financing Limit
𝑃 𝐸
Decisions Variables ≥0
𝐸 𝑃 𝐿𝐷 𝑛 𝑀𝐷
Parameters
Total Investment (TI)= E + P + LD + MD
KE - cost of Equity capital =0,087
KP – cost of Public capital = 0,0425
KLD – cost of long term debt = 0,075
KMD – cost of med-term capital = 0,068

Nikhil Menon | Joao Fialho
25 | P a g e Structured Financing in Transport Projects – Homework Assignment
APPENDIX 2 – Financial Projections
2012 2013 2014 2015 2016 2017 2018 2019 2020 2021 2022
Inflation Rate
Inflation 3,42% 1,000 1,034 1,070 1,106 1,144 1,183 1,224 1,265 1,309 1,353 1,400
Total Expenses
Construction Cost $97.500.000 $134.446.000 $139.044.053 $0 $0 $0 $0 $0 $0 $0 $0
Fixed Cost $97.500.000 $134.446.000 $139.044.053
Operation Costs $0 $0 $0 $7.822.554 $8.402.383 $9.012.721 $9.654.979 $10.330.626 $11.041.195 $11.788.283 $12.191.442
Fixed Costs $3.594.984 $3.717.932 $3.845.086 $3.976.588 $4.112.587 $4.253.237 $4.398.698 $4.549.134
Variable Costs $4.227.570 $4.684.450 $5.167.635 $5.678.392 $6.218.039 $6.787.957 $7.389.584 $7.642.308
Capital Costs (Interests) $0 $6.120.000 $22.485.466 $31.971.260 $30.682.739 $29.300.828 $27.818.655 $26.228.838 $24.523.442 $23.539.703 $22.480.208
Equity 8,70% $10.492.200 $10.280.106 $10.049.559 $9.798.955 $9.526.548 $9.230.442 $8.908.575 $8.558.705
Public Financing 4,25% $1.530.000 $1.486.606 $1.441.367 $1.394.206 $1.345.040 $1.293.785 $1.240.351 $1.184.647 $1.126.575 $1.066.035
Long-term Debt 7,5% $16.942.500 $16.551.261 $16.130.678 $15.678.552 $15.192.516 $14.670.028 $14.108.353 $13.504.553 $12.855.467
Mid-term Debt 6,80% $4.590.000 $4.056.360 $3.486.432 $2.877.750 $2.227.677 $1.533.399 $791.910
Total Revenues
Toll Revenue $0 $0 $0 $42.275.705 $46.844.501 $51.676.355 $56.783.916 $62.180.393 $67.879.571 $73.895.845 $76.423.082
Expected Traffic/day - light vehicles 14580 15621 16663 17704 18746 19787 20829 20829
Expected Traffic/day - heavy vehicles 4344 4655 4965 5275 5586 5896 6206 6206
Unit Toll Price - light Vehicle $5,0 $5,1 $5,3 $5,5 $5,7 $5,9 $6,1 $6,3
Unit Toll Price - heavy Vehicle $10,0 $10,3 $10,6 $11,0 $11,4 $11,8 $12,2 $12,6
Earnings
Earnings Before Taxes -$97.500.000 -$140.566.000 -$161.529.519 $2.481.890 $7.759.379 $13.362.805 $19.310.282 $25.620.928 $32.314.934 $38.567.859 $41.751.433
Taxes 30,00% $0 $0 $0 $744.567 $2.327.814 $4.008.842 $5.793.085 $7.686.279 $9.694.480 $11.570.358 $12.525.430
Net Earnings -$97.500.000 -$140.566.000 -$161.529.519 $1.737.323 $5.431.565 $9.353.964 $13.517.197 $17.934.650 $22.620.454 $26.997.501 $29.226.003
Cummulative Flow -$97.500.000 -$238.066.000 -$399.595.519 -$397.858.196 -$392.426.631 -$383.072.667 -$369.555.470 -$351.620.820 -$329.000.366 -$302.002.865 -$272.776.862
Inflows $103.500.000 $225.900.000 $120.600.000 $0 $0 $0 $0 $0 $0 $0 $0
Equity $120.600.000
Public Financing $36.000.000
Long-term Debt $225.900.000
Mid-term Debt $67.500.000
Outflows $0 $0 $0 $0 $0 $25.627.055 $25.627.055 $51.218.642 $40.289.132 $40.289.132 $40.289.132
Equity 8,70% $14.697.545 $14.697.545 $14.697.545
Public Financing 4,25%
Long-term Debt 7,5% $25.591.587 $25.591.587 $25.591.587 $25.591.587
Mid-term Debt 6,80% $25.627.055 $25.627.055 $25.627.055
Cumulative Cash Flow $6.000.000 $91.334.000 $50.404.481 $52.141.804 $57.573.369 $43.527.955 $32.951.496 $15.129.443 $20.799.560 $29.921.058 $40.272.101

Nikhil Menon | Joao Fialho
26 | P a g e Structured Financing in Transport Projects – Homework Assignment
2023 2024 2025 2026 2027 2028 2029 2030 2031 2032 2033 2034
Inflation Rate
Inflation 3,42% 1,448 1,497 1,548 1,601 1,656 1,713 1,771 1,832 1,894 1,959 2,026 2,096
Total Expenses
Construction Cost $0 $0 $0 $0 $0 $0 $0 $0 $0 $0 $0 $0
Fixed Cost
Operation Costs $12.608.389 $13.039.596 $13.485.550 $13.946.756 $14.423.735 $14.917.027 $15.427.189 $15.954.799 $16.500.453 $17.064.769 $17.648.384 $18.251.959
Fixed Costs $4.704.714 $4.865.615 $5.032.019 $5.204.114 $5.382.095 $5.566.163 $5.756.525 $5.953.399 $6.157.005 $6.367.574 $6.585.345 $6.810.564
Variable Costs $7.903.675 $8.173.981 $8.453.531 $8.742.642 $9.041.640 $9.350.864 $9.670.664 $10.001.400 $10.343.448 $10.697.194 $11.063.038 $11.441.394
Capital Costs (Interests) $21.339.019 $20.109.730 $18.785.421 $17.358.625 $15.821.283 $14.164.691 $12.379.455 $10.455.431 $8.381.667 $6.146.337 $3.736.671 $1.138.881
Equity 8,70% $8.178.397 $7.765.002 $7.315.641 $6.827.186 $6.296.235 $5.719.092 $5.091.737 $4.409.803 $3.668.540 $2.862.787 $1.986.934 $1.034.881
Public Financing 4,25% $1.002.922 $937.127 $868.535 $797.029 $722.483 $644.769 $563.753 $479.293 $391.243 $299.452 $203.759 $103.999
Long-term Debt 7,5% $12.157.701 $11.407.601 $10.601.244 $9.734.411 $8.802.565 $7.800.830 $6.723.965 $5.566.336 $4.321.884 $2.984.098 $1.545.979
Mid-term Debt 6,80%
Total Revenues
Toll Revenue $79.036.752 $81.739.809 $84.535.310 $87.426.418 $90.416.401 $93.508.642 $96.706.638 $100.014.005 $103.434.484 $106.971.943 $110.630.384 $114.413.943
Expected Traffic/day - light vehicles 20829 20829 20829 20829 20829 20829 20829 20829 20829 20829 20829 20829
Expected Traffic/day - heavy vehicles 6206 6206 6206 6206 6206 6206 6206 6206 6206 6206 6206 6206
Unit Toll Price - light Vehicle $6,5 $6,7 $7,0 $7,2 $7,5 $7,7 $8,0 $8,2 $8,5 $8,8 $9,1 $9,4
Unit Toll Price - heavy Vehicle $13,0 $13,5 $13,9 $14,4 $14,9 $15,4 $15,9 $16,5 $17,1 $17,6 $18,2 $18,9
Earnings
Earnings Before Taxes $45.089.343 $48.590.483 $52.264.339 $56.121.036 $60.171.383 $64.426.924 $68.899.993 $73.603.775 $78.552.364 $83.760.838 $89.245.328 $95.023.104
Taxes 30,00% $13.526.803 $14.577.145 $15.679.302 $16.836.311 $18.051.415 $19.328.077 $20.669.998 $22.081.132 $23.565.709 $25.128.251 $26.773.599 $28.506.931
Net Earnings $31.562.540 $34.013.338 $36.585.037 $39.284.725 $42.119.968 $45.098.847 $48.229.995 $51.522.642 $54.986.655 $58.632.586 $62.471.730 $66.516.173
Cummulative Flow -$241.214.321 -$207.200.983 -$170.615.946 -$131.331.220 -$89.211.252 -$44.112.405 $4.117.590 $55.640.232 $110.626.887 $169.259.473 $231.731.203 $298.247.376
Inflows $0 $0 $0 $0 $0 $0 $0 $0 $0 $0 $0 $0
Equity
Public Financing
Long-term Debt
Mid-term Debt
Outflows $40.289.132 $40.289.132 $40.289.132 $40.289.132 $40.289.132 $40.289.132 $40.289.132 $48.432.585 $48.432.585 $48.432.585 $48.432.585 $22.840.998
Equity 8,70% $14.697.545 $14.697.545 $14.697.545 $14.697.545 $14.697.545 $14.697.545 $14.697.545 $14.697.545 $14.697.545 $14.697.545 $14.697.545 $14.697.545
Public Financing 4,25% $8.143.453 $8.143.453 $8.143.453 $8.143.453 $8.143.453
Long-term Debt 7,5% $25.591.587 $25.591.587 $25.591.587 $25.591.587 $25.591.587 $25.591.587 $25.591.587 $25.591.587 $25.591.587 $25.591.587 $25.591.587
Mid-term Debt 6,80%
Cumulative Cash Flow $51.881.607 $64.778.416 $78.991.207 $94.548.397 $111.478.034 $129.807.671 $149.564.237 $163.109.725 $178.045.461 $194.391.799 $212.167.615 $256.981.670

Nikhil Menon | Joao Fialho
27 | P a g e Structured Financing in Transport Projects – Homework Assignment
APPENDIX 3 – Lattice Model, Call Option
2015 2016 2017 2018 2019 2020 2021 2022 2023 2024 2025 2026 2027 2028 2029 2030 2031 2032 2033
N N N N N N N N N N N N N N N Y Y N N
N N N N N N N N N N N N N N N N N N
N N N N N N N N N N N N N N N N N
N N N N N N N N N N N N N N N N
N N N N N N N N N N N N N N N
N N N N N N N N N N N N N N
N N N N N N N N N N N N N
N N N N N N N N N N N N
N N N N N N N N N N N
N N N N N N N N N N
N N N N N N N N N
N N N N N N N N
N N N N N N N
N N N N N N
N N N N N
N N N N
N N N
N N
N
CA
LL
OP
TIO
N?