structured conceptualization approach to survey design slideshare 0213 dmf
TRANSCRIPT

David Filiberto, Ph.D.2013
A Structured Conceptualization Approach to Survey Design

Why seek a new approach toward survey design?
Research question:can a structured conceptualization process improve survey content development, design and framework from standard best practices within a group format?
Best practices of survey design merged with a structured conceptualization process (concept mapping)
MethodDeterminants of success Results
Overview

New York State Energy Research and Development Authority (NYSERDA), Home Energy Use Goals and objectives:
1. Evaluate homeowner energy use, conservation and efficiency in New York’s Southern Tier
2. Produce instrument with diverse stakeholder ‘buy-in’ while managing complexity of survey content and design
Project 1:

Village of Trumansburg, NY Comprehensive Plan Goals and objectives:
1. Assess citizen beliefs, attitudes and concerns relating to the future governance of the Village of Trumansburg
2. Produce instrument with diverse stakeholder ‘buy-in’ while managing complexity of survey content and design
Project 2:

Best Practices for Survey Instrument Design
1. Have specific goals and objectives for the survey
2. Understand and avoid the four types of error
3. Choose the survey method that works best for the project
4. Select samples that well represent the population to be studied
5. WRITE ‘GOOD’ QUESTIONS AND ORDER THEM EFFECTIVELY
6. Pre test and revise questionnaire
7. Code, computerize and analyze the data

• Concept mapping is a method that can be used to help an individual or group describe their ideas about a topic in a pictorial form
• Useful when researchers want to involve relevant stakeholder groups or individuals in the creation of a research project
• Practical applications include strategic planning, product development, market analysis, decision making, and measurement development among others
What is Concept Mapping?

Source: Trochim, 1999
From Idea to Map in Six Steps
1. Develop a Focus
2. Brainstorm Ideas
3. Sort and Rate Statements
4. Compute the Map
5. Interpret the Map
6. Utilize the Map
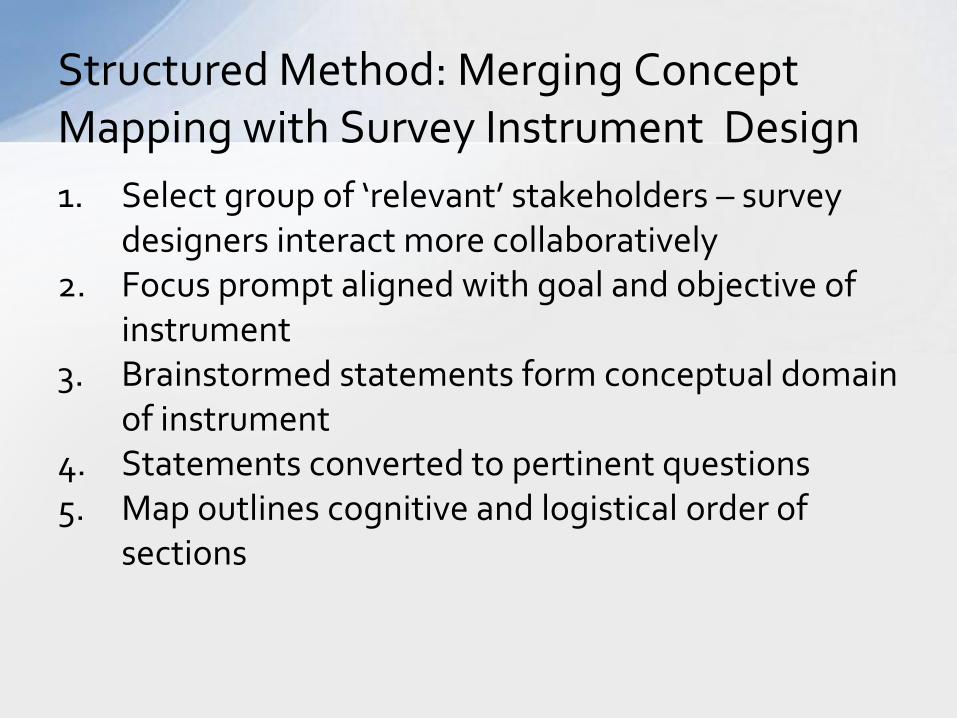
1. Select group of ‘relevant’ stakeholders – survey designers interact more collaboratively
2. Focus prompt aligned with goal and objective of instrument
3. Brainstormed statements form conceptual domain of instrument
4. Statements converted to pertinent questions5. Map outlines cognitive and logistical order of
sections
Structured Method: Merging Concept Mapping with Survey Instrument Design

Preparing the Project: Develop a Focus, Engage Diverse Groups
NYSERDA Survey Focus Prompt:
Please generate short phrases or statements to finish the following sentence:
“Specific factors and concerns that influence my energy consumption and energy conservation are….”
Cooperative
ExtensionHomeowners
Energy
Contractors
NYSERDA
Specialists
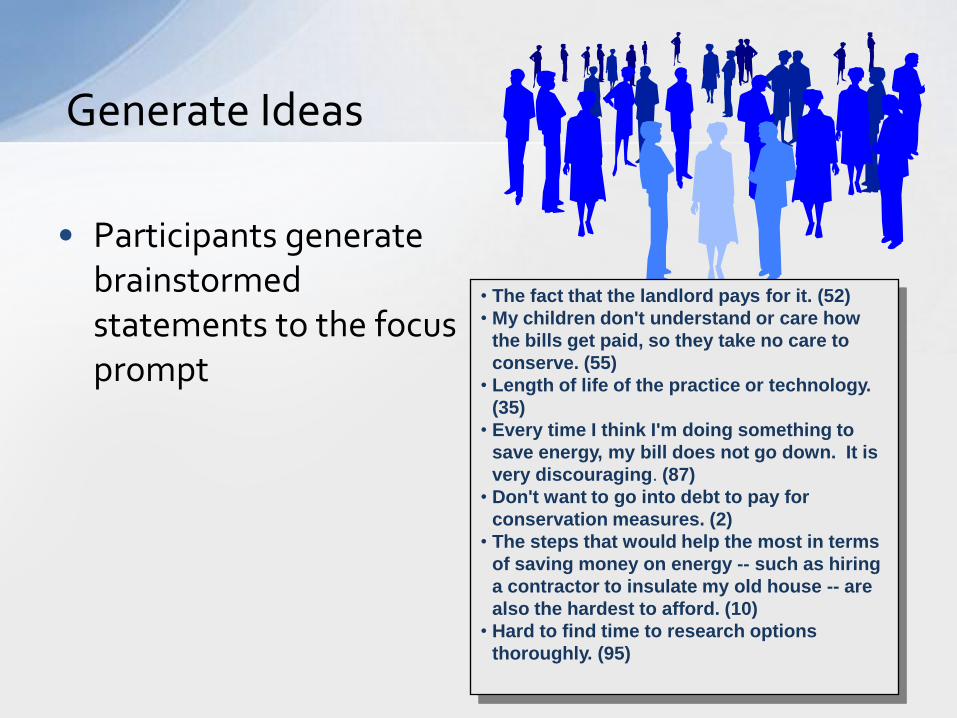
Generate Ideas
• Participants generate brainstormed statements to the focus prompt
• The fact that the landlord pays for it. (52)
• My children don't understand or care how
the bills get paid, so they take no care to
conserve. (55)
• Length of life of the practice or technology.
(35)
• Every time I think I'm doing something to
save energy, my bill does not go down. It is
very discouraging. (87)
• Don't want to go into debt to pay for
conservation measures. (2)
• The steps that would help the most in terms
of saving money on energy -- such as hiring
a contractor to insulate my old house -- are
also the hardest to afford. (10)
• Hard to find time to research options
thoroughly. (95)

Participants Build the Conceptual Framework – Sort the Statements
• Group the statements according to how similar in meaning they are to one another
• Record the results. Give a short phrase or title that describes the contents of the pile
Length of life of the practice or
technology. (35)
The fact that the landlord pays for it.
(52)
My children don't understand or care
how the bills get paid, so they take no care
to conserve. (55)
Pile Title or Main Topic: Lack of KnowledgeRecord here the identifying number of each item in this pile, separating
the ID numbers with commas.
28, 8, 86, 66, 23, 13, 85, 5

Total Square Similarity Matrix for All
Participants
Compute the Map: Structuring of the Statements
Binary Square Similarity Matrix for One
Sorter
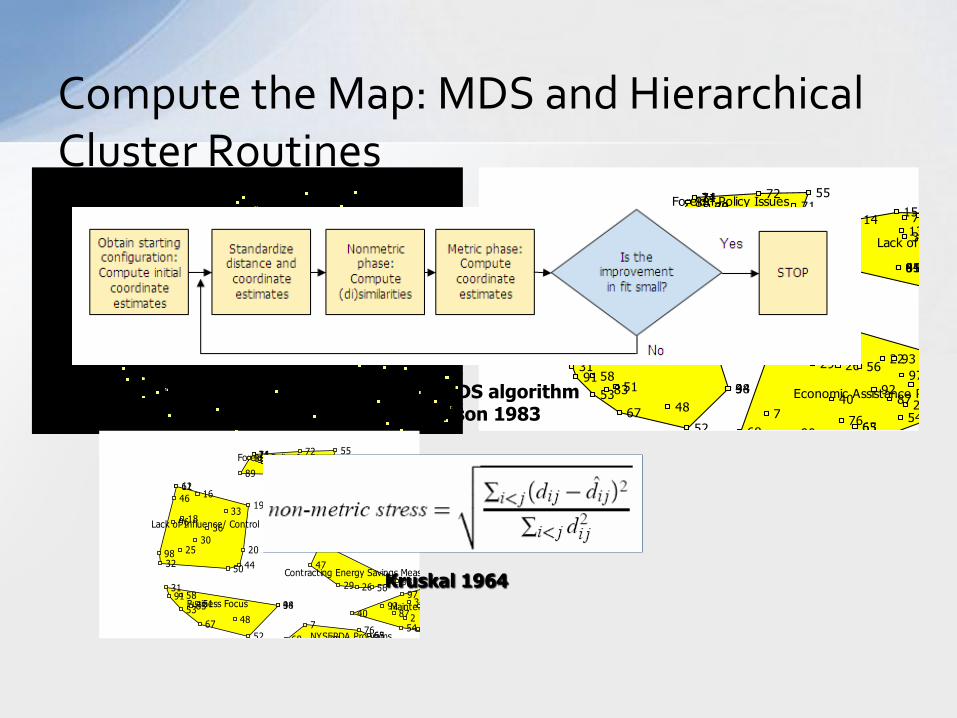
Compute the Map: MDS and Hierarchical Cluster Routines
Economic Assistance Program
Personal Habits / Concerns
Lack of Knowledge
Foreign Policy Issues
1 2
3
4
5
6
7
8 9 10
11
12 13
14 15
16
17
18
19
20
21
22
23
24
25
26
27
28 29
30
31
32
33
34
35
36
37
38
39
40
41 42
43
44
45
46
47
48 49
50
51
52
53
54
55
56
57
58 59
60
61
62 63
64
65
66
67
68
69 70 71 72
73 74
75
76
77
78 79 80 81 82
83
84
85 86
87
88
89
90
91 92
93
94
95
96
97
98
99
100 1 2
3
4
5
6
7
8 9 10
11
12 13
14 15
16
17
18
19
20
21
22
23
24
25
26
27
28 29
30
31
32
33
34
35
36
37
38
39
40
41 42
43
44
45
46
47
48 49
50
51
52
53
54
55
56
57
58 59
60
61
62 63
64
65
66
67
68
69 70 71 72
73 74
75
76
77
78 79 80 81 82
83
84
85 86
87
88
89
90
91 92
93
94
95
96
97
98
99
100
Maintenance
Contracting Energy Savings Measures
NYSERDA Programs
Business Focus
Lack of Influence/ Control
Lack of Knowledge
Foreign Policy Issues
1 2
3
4
5
6
7
8 9 10
11
12 13
14 15
16
17
18
19
20
21
22
23
24
25
26
27
28 29
30
31
32
33
34
35
36
37
38
39
40
41 42
43
44
45
46
47
48 49
50
51
52
53
54
55
56
57
58 59
60
61
62 63
64
65
66
67
68
69 70 71 72
73 74
75
76
77
78 79 80 81 82
83
84
85 86
87
88
89
90
91 92
93
94
95
96
97
98
99
100
Kruskal 1964
Nonmetric MDS algorithmSource: Davison 1983

Interpret Maps
1 Financial Considerations
2 Hassle Factors
3 Program and Subsidy Issues
4 Fear and Anxiety
5 Influence/ Control
6 Time & Knowledge Considerations
7 Social and Environmental
Awareness
12
3
4
5
6
7
8910
11
1213
1415
16
17
18
19
20
21
22
23
24
25
26
27
2829
30
31
32
33
34
35
36
37
38
39
40
4142
43
44
45
46
47
48
49
50
51
52
53
54
55
56
57
5859
60
61
62
63
64
65
66
67
68
69 70 71
72
73
74
75
76
77
7879 80
81
82
83
84
8586
87
88
89
90
91
92
93
94
95
96
97
98
99
100
Social /
Psychological
Technical /
Analytical
…contains all the details and provides a
conceptual framework
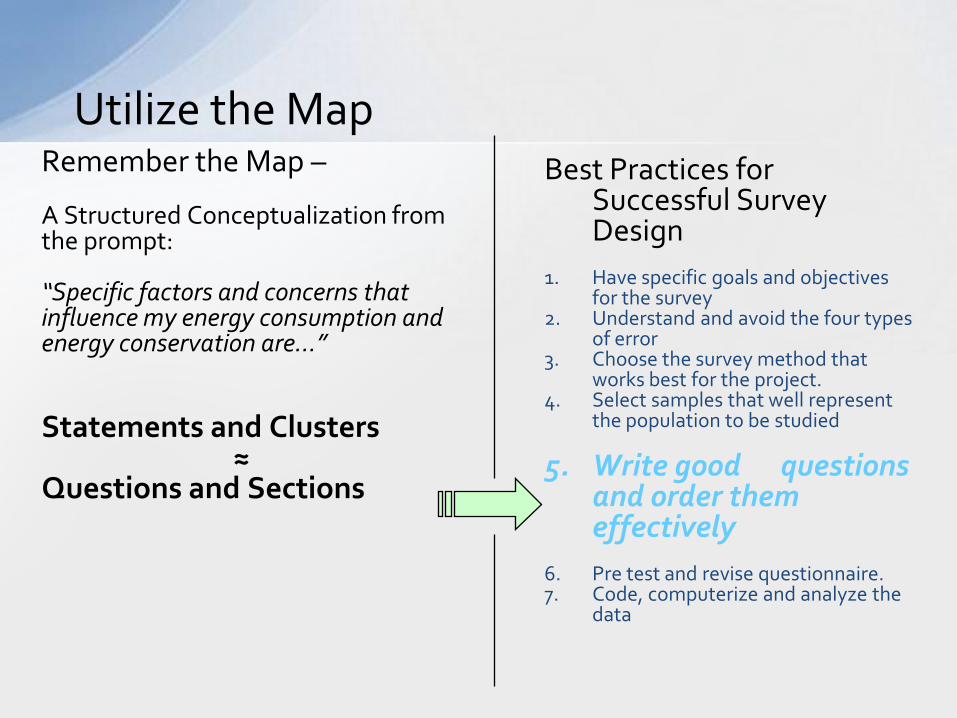
Utilize the MapRemember the Map –
A Structured Conceptualization from the prompt:
“Specific factors and concerns that influence my energy consumption and energy conservation are…”
Statements and Clusters≈
Questions and Sections
Best Practices for Successful Survey Design
1. Have specific goals and objectives for the survey
2. Understand and avoid the four types of error
3. Choose the survey method that works best for the project.
4. Select samples that well represent the population to be studied
5. Write good questions and order them effectively
6. Pre test and revise questionnaire.7. Code, computerize and analyze the
data

A Collaborative Process• Outline and order the questionnaire sections to
correspond to Map Clusters
• Develop survey questions from statements within each Cluster section
From Map to Questionnaire

1. Avoids the four common sources of error:Coverage, Sampling, Measurement, Non –response
2. Produces accurate, timely and accessible data or “fitness for use” (Biemer and Lyberg 2003)
Determinants of a Successful Survey
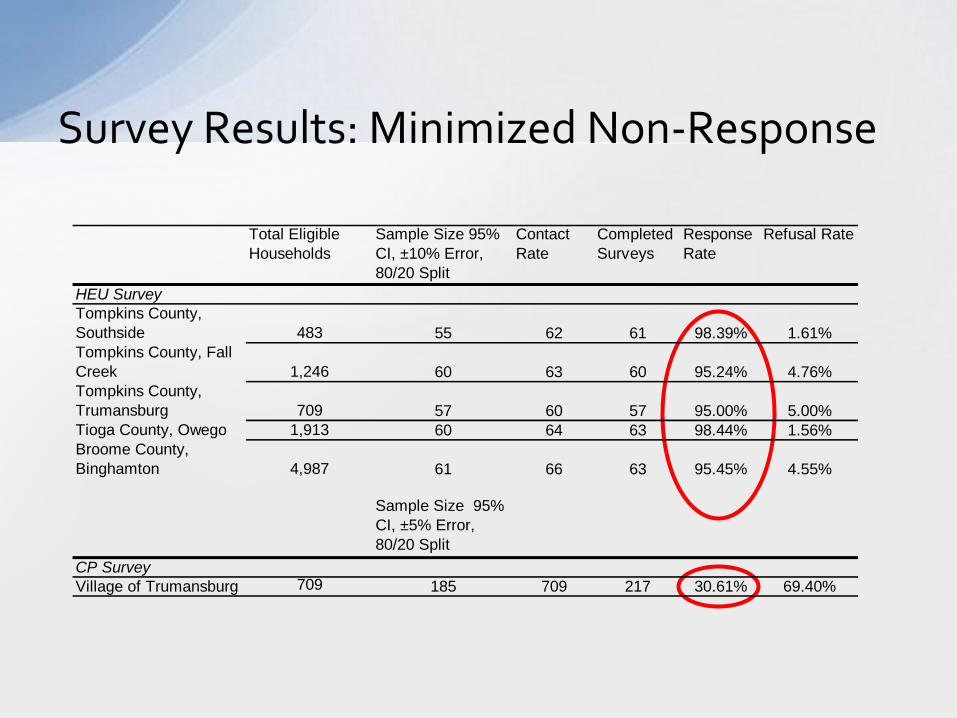
Survey Results: Minimized Non-Response
Total Eligible
Households
Sample Size 95%
CI, ±10% Error,
80/20 Split
Contact
Rate
Completed
Surveys
Response
Rate
Refusal Rate
HEU Survey
Tompkins County,
Southside 483 55 62 61 98.39% 1.61%
Tompkins County, Fall
Creek 1,246 60 63 60 95.24% 4.76%
Tompkins County,
Trumansburg 709 57 60 57 95.00% 5.00%
Tioga County, Owego 1,913 60 64 63 98.44% 1.56%
Broome County,
Binghamton 4,987 61 66 63 95.45% 4.55%
Sample Size 95%
CI, ±5% Error,
80/20 Split
CP Survey
Village of Trumansburg 709 185 709 217 30.61% 69.40%

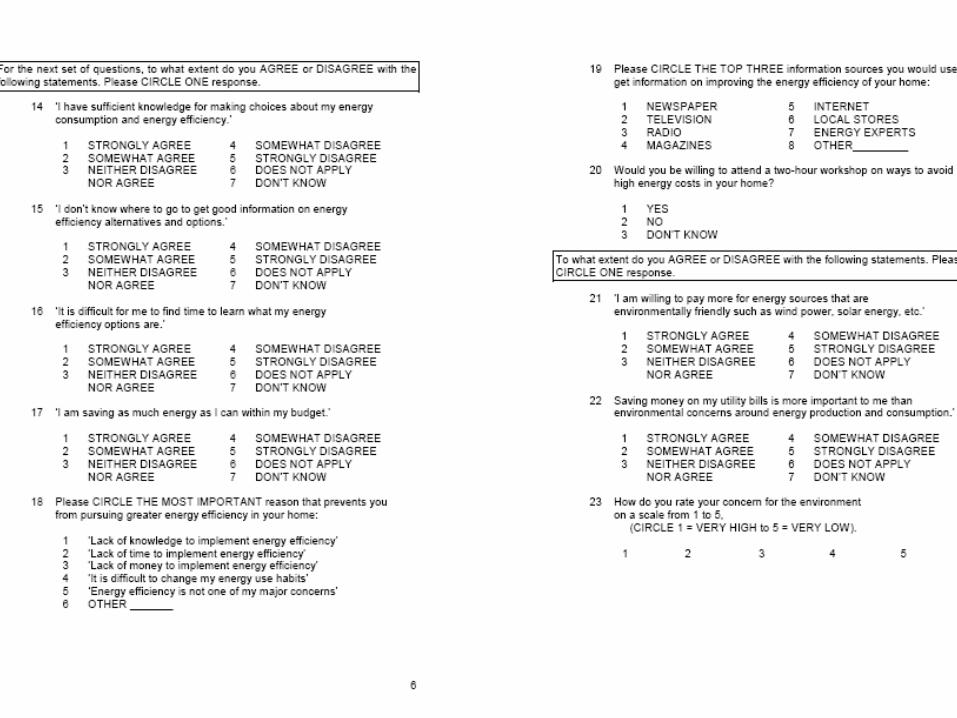
HEU Survey: Deliverables: • 47 question, drop off/pickup questionnaire administered to
sample from Southern Tier, NY• Analysis resulting in targeted energy conservation and efficiency
workshops and programs
CP Survey:Deliverables: • 19 question, mailed questionnaire administered as a census of
Trumansburg, NY• Results formed foundation of a new Village comprehensive plan
Survey Results: Fit For Use

A structured conceptualization approach provides an alternative and complimentary method:
• where statements provide pertinent and relevant material for question generation
• cluster solutions provide an effective cognitive order to survey sections which,
• results in greater collaboration and buy-in of relevant stakeholders than traditional best practices of survey design
Summary: Additional Approach to Survey Design
