structure, rheological properties and connectivity of gels
TRANSCRIPT

HAL Id: tel-02077051https://tel.archives-ouvertes.fr/tel-02077051
Submitted on 22 Mar 2019
HAL is a multi-disciplinary open accessarchive for the deposit and dissemination of sci-entific research documents, whether they are pub-lished or not. The documents may come fromteaching and research institutions in France orabroad, or from public or private research centers.
L’archive ouverte pluridisciplinaire HAL, estdestinée au dépôt et à la diffusion de documentsscientifiques de niveau recherche, publiés ou non,émanant des établissements d’enseignement et derecherche français ou étrangers, des laboratoirespublics ou privés.
Structure, Rheological Properties and Connectivity ofGels Formed by Carrageenan Extracted from Different
Red Algae SpeciesTran Nu Thanh Viet Bui
To cite this version:Tran Nu Thanh Viet Bui. Structure, Rheological Properties and Connectivity of Gels Formed byCarrageenan Extracted from Different Red Algae Species. Organic chemistry. Université du Maine,2019. English. �NNT : 2019LEMA1007�. �tel-02077051�

THESE DE DOCTORAT DE
LE MANS UNIVERSITE
COMUE UNIVERSITE BRETAGNE LOIRE
ECOLE DOCTORALE N° 596
Matière Molécules et Matériaux
Spécialité : « Chimie et Physicochimie des Polymères »
Par
« Tran Nu Thanh Viet BUI »
«Structure, Rheological Properties and Connectivity of Gels Formed
by Carrageenan Extracted from Different Red Algae Species»
Thèse présentée et soutenue à « Le Mans Université », le « Jeudi 28 Février, 2019 »
Unité de recherche : Le Mans Université, Institut des molécules et matériaux du Mans UMR CNRS 6283
Thèse N° : 2019LEMA1007
Composition du Jury :
M. Jacques DESBRIERES, Professeur, Université de Pau et des Pays de l’Adour (Rapporteur)
M. Luc PICTON, Professeur, Université Rouen Normandie (Rapporteur)
Mme Isabelle CAPRON, Directrice de Recherche, INRA- BIA (Examinateur)
M. Taco NICOLAI, Directeur de Recherche CNRS, Le Mans Université (Directeur de thèse)
M. Frédéric RENOU, Maître de conférences, Le Mans Université (Co-encadrant de thèse)
M. Trong Bach NGUYEN, Docteur, Nha Trang Université, Vietnam (Co-encadrant de thèse)

i
ACKNOWLEDGEMENTS
First I would like to acknowledge my supervisors: Dr. Taco Nicolai, Dr. Frédéric
Renou and Dr. Nguyen Trong Bach for their support and advice throughout my thesis. Sincere
gratitude I would like to express to Bach for his help with the experimential material and other
works related to my position at Nha Trang University. I appreciate the help from Frédéric not
only for his research ideas but also on the technique and documents. I am especially grateful to
Taco for his advice and his joy and enthusiasm for scientific research that is contagious and
motivation me to finish successfully my thesis and continue doing research in the future as
well.
I also gratefully acknowledge to the Ministry of Education and Training of Vietnam
for financial support during my study in France.
My sincere thanks are expressed to Prof. Jacques Desbrieres , Prof. Luc Picton and Dr.
Isabelle Capron as members in my academic committee for their time, and interest and helpful
comments.
I have had the pleasure to work with the staffs from PCI. I would like to thank to Prof.
Christophe Chassenieux and Prof. Lazhar Benyahia for their useful discussions. Many thanks
also go to Erwan Nicol, Olivier Colombani, Cyrille Dechancé, Frederick Niepceron, Boris
Jacquette for their technical help on NMR, rheology, confocal microscopy and SEC.
I would like to thank my friends and Vietnamese families living in Le Mans who made
my time here more pleasurable.
A special thanks to my parents, my sisters, my brothers and my parents in law for all
their love and encouragement. The kindest words I would like to send to my two daughters
Dang Viet Han and Dang Viet Linh. Although my absence was hard for them, they
encouraged me by showing their happiness every day. Words are not enough to reveal how
grateful I am to my husband Dang Thanh Pha who has helped me organize smoothly
everything from family to work. Thank you.

i
TABLE OF CONTENTS
Introduction ............................................................................................................................... 1
Chapter 1 Background ............................................................................................................. 4
1.1. Marine polysaccharides ....................................................................................................... 4
1.2. Carrageenan ......................................................................................................................... 6
1.2.1. Source of carrageenan .............................................................................................. 6
1.2.2. Chemical structure of carrageenan ........................................................................... 7
1.2.3. Carrageenan extraction .......................................................................................... 10
1.2.4. Properties of carrageenan in aqueous solution ....................................................... 12
1.2.5. Mixtures of different types of carrageenan ............................................................ 19
1.2.6. Microstructure of carrageenan gels ........................................................................ 20
1.2.7. Applications ........................................................................................................... 22
References ................................................................................................................................ 24
Chapter 2 Materials and Methods ........................................................................................ 33
2.1. Materials ............................................................................................................................ 33
2.1.1. Raw carrageenan extracted from red algae ............................................................ 33
2.1.2. Purification of raw carrageenan ............................................................................. 34
2.1.3. Fluorescent labelling of carrageenan ..................................................................... 35
2.1.4. Preparation of solutions ......................................................................................... 35
2.2. Methods ............................................................................................................................. 36
2.2.1. Light Scattering ...................................................................................................... 36
2.2.2. NMR spectroscopy ................................................................................................. 39
2.2.3. Yield, moisture and mineral content determination ............................................... 39
2.2.4. Rheology ................................................................................................................ 40
2.2.5. Turbidity ................................................................................................................ 40
2.2.6. Confocal Laser Scanning Microscopy (CLSM) .................................................... 40
2.2.7. Release of unbound carrageenan from gels ........................................................... 44
References ................................................................................................................................ 46
ii
Chapter 3 Characterization and Rheological Properties of Carrageenan Extracted from
Different Red Algae Species ................................................................................................... 48
3.1. Introduction ........................................................................................................................ 48
3.2. Results ................................................................................................................................ 49
3.3. Conclusions ........................................................................................................................ 59
References ................................................................................................................................ 60
Chapter 4 Mixtures of Iota and Kappa-Carrageenan ......................................................... 63
4.1. Introduction ........................................................................................................................ 63
4.2. Results and discussion ....................................................................................................... 64
4.2.1. Mixtures of iota and kappa carrageenan in presence of calcium ions .................. 64
4.2.2. Mixtures of iota and kappa carrageenan in presence of potassium ions ............... 73
4.3. Conclusions ........................................................................................................................ 77
References ................................................................................................................................ 78
Chapter 5 Mobility of Carrageenan Chains In Iota and Kappa Carrageenan Gels ........ 80
5.1. Introduction ........................................................................................................................ 80
5.2. Results ................................................................................................................................ 81
5.2.1. Mobility of carrageenan in salt free aqueous solution ........................................... 81
5.2.2. Mobility of carrageen in gels ................................................................................. 83
5.2.3. Release of carrageenan from the gels .................................................................... 89
5.3. Conclusion ......................................................................................................................... 93
References ................................................................................................................................ 94
General Conclusion and Outlook .......................................................................................... 96
iii
List of abbreviations
Car: carrageenan
Ka: Kappaphycus alvarezii
Ks: Kappaphycus striatum
Km: Kappaphycus malesianus
Ed: Euchuma denticulatum
ι-car: iota carrageenan
κ-car: kappa carrageenan
FAO: Food and Agriculture Organization of the United Nations
Rh: Hydrodynamic radius
Rg: Radius of gyration
Mw: molecular weight
Ma: apparent molar mass
Rha: apparent hydrodynamic radius
T: temperature
Tc: coil –helix temperature
Tg: gelling temperature
Tm: melting temperature
NMR: Nuclear Magnetic Resonance
LS: Light Scattering
FRAP: Fluorescence Recovery After Photobleaching
CLSM: Confocal Laser Scanning Microscopy
G’: storage modulus
G”: loss modulus

1
Introduction
Carrageenan (Car) is a linear sulfated polysaccharide extracted from various species of
edible red algae and it is widely used as thickener, stabilizer and gelling agent in food
products, pharmaceutical applications and cosmetics. Their demand is expected to increase
due to the fact that it is not toxic, cheap and biocompatible 1,2
. The molecular structure of Car
is based on a disaccharide repeat of alternating units of D-galactose and 3,6-anhydro-galactose
(3,6-AG) joined by α-1,4 and β-1,3-glycosidic linkage. It is classified into various types such
as λ (lambda), κ (kappa), ι (iota), υ (nu), μ (mu) and θ (theta) based on the difference in their
content of 3,6-anhydro-D-galactose and the number and position of sulfate groups within the
disaccharide repeat structure. Higher levels of sulfate mean lower solubility temperatures and
lower gel strength 3–6
.
The most common types of Car used in the industry are κ- and ι-car due to their good
gelling properties. κ-Car is mainly extracted from Kappaphycus alvarezii and ι-car is mainly
obtained from Eucheuma denticulatum. Southeast Asia is the principal area of production of
carrageenan derived from these species 7,8
. Many species of red marine algae are found to
grow well in Vietnam’s maritime surroundings such as Kappaphycus alvarezii, Kappaphycus
striatum, Kappaphycus cottonii, Kappaphycus malesianus, Kappaphycus ennerme,
Kappaphycus galatinum and Euchuma denticulatum 9,10
. Kappaphycus striatum, Kappaphycus
alvarezii and Euchuma denticulatum have been selected for expansion of the cultivation areas
along coastal provinces. The annual yield of Kappaphycus alvarezii is around 4.000 dry tons
and it is mainly exported in the form of dried seaweed or raw Car.
Car forms a thermal-reversible gel in aqueous solution via the transition from a random
coil to a helical conformation followed by the aggregation of helices to form a space-spanning
network 11,12
. The coil-helix transition is induced by cooling in the presence of cations. The
differences in structure of κ- and ι-car result in differences in their gelling properties. κ-Car
can form a strong gel in presence of specific monovalent cations, whereas the conformation
transition of ι-car is particularly sensitive to divalent ions 13
and forms a weak gel. Another
difference is that ι-car gels show no thermal hysteresis and less syneresis 14–16
.
A large number of reports on the gelling properties of individual Car have been
published, but there are few investigations on mixtures of κ- and ι-car. Some studies have

2
shown that the coil-helix transitions of κ- and ι-car are independent 15,17,18
. It has been
suggested that there is a microphase separated network in the mixed system 16,17,19,20
, which
could explain the synergistic effect found for the rheological properties 20,21
. However, there is
lack of microscopic evidence to support this hypothesis. Therefore the gel structure in mixed
systems is still an open question.
The mobility of Car within the network can yield information about the extent to which
chains are bound to the network and is important with respect to the release of Car from the
gel. Very little attention has been paid so far to this issue, probably because it has generally
been considered that all Car chains are strongly connected in the gel and their release from the
gels has attracted little attention so far.
Objectives
The aim of this research was first to characterize native Car extracted from selected
seaweeds cultured in Cam Ranh Bay, Khanh Hoa province of Vietnam in order to select the
best types of species for culture in this area. The second objective was to elucidate the gelation
process of κ- and ι-car in mixed system. Finally, we investigated the mobility of Car chains
within gels.

3
Outline of the thesis
The thesis consists of five chapters and a general conclusion:
Chapter 1 gives an overview of the literature on carrageenan: source, structure,
extraction, properties and application.
Chapter 2 describes the materials and methods used in this research
Chapter 3 presents the characterization and rheological properties of Car extracted
from different red algae species. These results have been published: Viet T. N. T. Bui, Bach T.
Nguyen, Frédéric Renou & Taco Nicolai. Structure and rheological properties of
carrageenans extracted from different red algae species cultivated in Cam Ranh Bay,
Vietnam. Journal of Applied Phycology (2018) https://doi.org/10.1007/s10811-018-1665-1.
Chapter 4 shows results on the microstructure and rheological properties of mixed Car
gels. These results have been published:Viet T. N. T. Bui, Bach T. Nguyen, Frédéric Renou &
Taco Nicolai. Rheology and microstructure of mixtures of iota and kappa-carrageenan. Food
Hydrocolloids 89 (2019) 180–187.
Chapter 5 shows results on the mobility of Car chains in Car gels. These results have
been published:Viet T. N. T. Bui, Bach T. Nguyen, Frédéric Renou & Taco Nicolai. Mobility of
carrageenan chains in iota- and kappa carrageenan gels. Colloids and Surfaces A 562 (2019),
113-118

4
Chapter 1
Background
1.1. Marine polysaccharides
Marine polysaccharides are biopolymers extracted from sea organisms. Seaweeds are the
main sources of these carbohydrates, mostly red and brown algaes. Widely used seaweed
carbohydrates are alginate, agar and carrageenan, which are extracted from selected genera
and species of brown (Phaeophyceae) and red (Rhodophyceae) seaweeds. The global value of
marine hydrocolloids is estimated at 1.1 billion US$ and it is expected to increase 22
. These
products are increasingly preferred for applications in various industries due to the fact that
they are cheap, natural, environmentally friendly, biocompatible, not toxic and versatile in
properties. According to FAO statistics 23,24
, major seaweed producers are in Asia such as
China, Indonesia, Philippines and Japan followed by countries elsewhere such as Chile,
Tanzania, Spain, France and Madagascar.
Of the three mentioned hydrocolloids, the use of agar was discovered first in Japan in
the 17th
century 25
. Agar is a hydrophilic galactan consisting of β-D-galactopyranose and 3,6-
anhydro-α L-galactopyranose linked via alternating α-(1→3) and β-(1→4) glycosidic linkages.
Agar is naturally comprised of two polysaccharides fractions, namely agarose and agaropectin
26. Agarose is neutral and responsible for gelling, whereas agaropectin is charged,
heterogeneous and highly-substituted, and is responsible for thickening properties. Agar is
produced from the agarophytes red seaweed genera Gelidium, Gracilaria, and Gelidiella. The
cultivation of these algae is taking place in many places around the globe but mainly in China,
Indonesia and Philippines (see table 1.1). It is easy to obtain agar by extraction in hot water,
however native agar shows poor gelling properties, hence alkaline treatment is usually applied
to reduce the number of sulfate groups in the agaropectin faction to improve the gel strength.
Agar is mainly used in food applications (approximately 80%) and the remaining 20% is used
in pharmaceutical and biotechnology industries 27–29
.

5
Table 1.1. Commercial marine polysaccharides, their sources and production in 2016 .
Products Species Location Yield*
(thousands ton)
Agar
Rhodophyta:
Gracilaria
Gelidium
Gelidiella
China, Indonesia, Philippines,
Chile, Tanzania, Spain,
France
4150
Alginate
Phaeophyceae
Laminaria spp
Sargassum spp
Japan, Indonesia, China,
Philippines, Madagascar
8000
Carrageenan
Rhodophyta:
Kappaphycus
Euchuma
Indonesia, Philippines, China,
Madagascar, Vietnam
12046
Sources 23,24,30
;* fresh seaweed
Alginate is a marine hydrocolloid extracted from the outer layer of cell walls of the
brown algae genera Phaeophyceae. Alginate is a linear polymer composed of β-D-mannuronic
acid (M) and α-L-guluronic acid (G). These two uronic acids are arranged alternately in
various proportions of MM, MG and GG blocks, depending on the source of seaweed and
extraction methods 31–33
. The M/G ratio and block structure influence the physico-chemical
properties of alginate. Typically, with increasing guluronic acid content stronger alginate gels
are formed. Inversely, more flexible gels are formed with a higher fraction of alginate-M
blocks 33
. The most interesting property of alginates is their ability to react with polyvalent
metal cations, specifically calcium ions. The ions establish a cooperative association between
M and G blocks, resulting in a tridimensional network. Alginate is used as a stabilizer and
thickener in food products such as drinks, jelly, ice-cream, desserts, etc. Alginate is also
widely used for pharmaceutical applications due to their biodegradability, biocompatibility,
non-antigenicity and chelating properties.
Carrageenan has the highest total value of the three main marine polysaccharides 24
widely used in food products, pharmaceutics and cosmetics. In the following we will discuss
the properties of Car in more detail.

6
1.2. Carrageenan
1.2.1. Source of carrageenan
Car can be extracted from several species of Rhodophyta including Gigartina,
Chondrus, Kappaphycus, Eucheuma and Hypnea 6,34–36
. However, commercial κ-, ι- and λ-car
are predominantly obtained from Kappaphycus alvarezii known in trade as Eucheuma cottonii
(or simply cottonii), Eucheuma denticulatum (trade name Eucheuma spinosum or simply
spinosum) and Chondrus spp, respectively. Originally, these seaweeds grew naturally in
Indonesia and the Philippines, but from the 1970s, cultivation was started in both countries
and expanded to other places such as Tanzania, Vietnam and some of the Pacific Islands 30
.
The Gigartina and Chondrus species are sources of mixtures of λ- and κ-car 30,37,38
. Chondrus
is mostly harvested in Canada, Chile and France. The demand for each type of Car is
determined by their properties (see table 1.2).
Table 1.2. Main carrageenan, their sources and application
Carrageenan Seaweed source Location Application References
Kappa Kappaphycus alvarezii
Indonesia,Philippines
Tanzania
Gelling agent
(strong and brittle
gel)
30,39
Iota Euchuma denticulatum
Indonesia,Philippine,
Tanzania
Gelling agent
(weak and elastic
gel)
30,39
Lamda
Chondrus crispus,
Gigartina
Canada, France,
Chile Thickener
30,40
Mu Kappaphycus alvarezii
κ-car precursor
41–43
Nu Euchuma denticulatum
ι-car precursor
41–43
Many studies have shown that the Kappaphycus species contains predominantly κ-car
with a small amount of ι-car and µ-precursor residues, while Eucheuma denticulatum contains
mainly ι-car and a small amount of ν-precursor residues 21,41–43
. Interestingly, the biological
precursors μ- and ν-car can be converted into κ- and ι-car by alkaline treatment of raw
seaweed which reduces the number of sulfate groups.

7
1.2.2. Chemical structure of carrageenan
The linear structure of Car is composed of alternating 3-linked-β-D-galactopyranose
and 4-linked-α-D-galactopyranose units (Figure 1.1). Different types of Car can be
distinguished by the amount and position of the sulfate groups as well as the content of 3.6-
AG. Figure 1.2 shows that κ-car and ι-car only differ by the presence of an additional sulfate
group at the second carbon of the 1,4 linked galactose unit for the latter. λ-Car has the highest
sulfate content and no 3,6-AG 4,5,44,45
. Higher levels of sulfate lead to lower solubility
temperature and lower gel strength 42,46
.
Figure 1.1. Basic repeat structure of carrageenan
Figure 1.2. Structure of kappa, iota and lambda carrageenan (Knutsen et al 3)
μ- and ν-car contain kinking units and are biochemical precursors of κ- and ι-car,
respectively. They can be converted into κ- and ι-car by adding OH- as a catalyst, see Figure
1.3. The presence of μ- and ν-car in Car powder has undesirable effects on the gelling
properties.

8
Figure 1.3. Conversion of the precursors μ- and ν-car into κ- and ι-car (Knutsen et al 3)
The Car chain contains not only galactose and sulfate, but also other carbohydrate
residues such as xylose, glucose and uronic acids 6. Minerals such as ammonium, calcium,
magnesium, potassium, and sodium are also present 47,48
.
Since Car is naturally contaminated by other carbohydrate residues and is quite
polydisperse 49–52
, it is difficult to characterize quantitatively. Currently, NMR and light
scattering (LS) techniques are utilized to determine the size distribution and structure.
Investigations of the molar mass and size of Car using LS have been reported by many authors
52–56. Car has an average molecular weight (Mw) ranging between 10
5 and 10
6 g/mol
34,49,50,57,58.
The average radius of gyration (Rg) of Car chains in the coil conformation is proportional to
the molar mass and varies between different types of Car. The hydrodynamic radius (Rh) is
systematically smaller than Rg. Table 1.3 shows the molecular characteristics of Car in 0.1 M
NaCl evaluated from static and dynamic light scattering at temperature 20-25oC.
O
OH
O
OH
O 3 SO
O
HO OH
OSO 3 O O
OH
O
OH
O 3 SO
O O O
OH
OH
Mu-carrageenan Kappa-carrageenan
G4S
D6S G4S DA
O
OH
O
OH
O 3 SO
O
HO OSO 3
OSO 3 O
G4S
OH
O
OH
O
OH
O 3 SO
O O O
OSO 3 G4S
D2S,6S
DA2S
Nu-carrageenan Iota-carrageenan

9
Table 1.3. The average molar mass (Mw), the z-average radius of gyration (Rg) and
hydrodynamic radius (Rh) of Car
Carrageenan Mw (g/ mol) Rg (nm) Rh (nm) References
κ-car 3.7 105 67 - Wittgren et al
59
κ-car 6.75 105 69 33 Viebke et al
60
κ-car 4.21 105 72 32.9 Meunier et al
58
κ-car 3.71 105 66.8 29.7 Thanh et al
61
ι-car 5.43 105
73.3 32.7 Thanh et al 61
λ-car 2.3 106 109 118 Thanh et al
61
Table 1.4. Chemical shifts (ppm) of the α-anomeric protons of Car with respect to DSS as an
internal standard at 0 ppm, recorded at 65oC (van De Velde et al
5)
Car Monosaccharide* Chemical shift (ppm)
β (beta) DA 5.074
ι (iota) DA2S 5.292
κ (kappa) DA 5.093
λ (lambda) D2S, 6S 5.548
ν (nu) D2S, 6S 5.501
μ (mu) D6S 5.238
*Codes refer to the nomenclature developed by Knutsen et al
6
NMR spectroscopy (both 1H and
13C NMR) can be used to analyze the sulfate content
and monosaccharide composition. Samples for 13
C NMR are prepared at relatively high
concentrations (5–10% w/w) compared to 1H NMR samples (0.5–1.0 % w/w)
6 and in order to
reduce the viscosity of Car in the commonly used solvents D2O or DMSO, concentrated
solutions are sonicated. Table 1.4 shows an example of the 1H NMR chemical shift of Car

10
recorded at 65oC obtained at C = 30 g/L in D2O with 20 mM Na2HPO4 and with DSS as a
reference standard. The results show that different types of Car can be identified by chemical
shifts (ppm) between 5.07 and 5.5 ppm. Other studies present similar results 6,36,42
. The
chemical shifts of the α-anomeric protons of the same type of Car depend on the recorded
temperature 62
.
1.2.3. Carrageenan extraction
There are mainly two methods to extract Car namely extraction in aqueous and alkaline
environments 30,63–65
(summarized in Figure 1.4). From the early 1970s to the 1980s,
extraction of Car with hot water was widely applied, the insoluble part was removed by
filtration and Car was recovered from the solution. The native structure of Car could be
maintained by this extraction method, but it had disadvantages: difficulty to filter due to the
high viscosity of solutions, the presence residual solids in the extract and high costs.
Therefore extraction in an alkaline solution during several hours was preferred, which
also led to an increase of the gel strength. In this manner all compounds that dissolve in
alkaline solution are washed out. The product obtained in this manner is called semi-refined
Car. Refined Car is obtained by heating semi-refined Car in aqueous solution followed by
filtration 30
. The main purpose of the treatment of seaweed with alkaline is that the penetration
of OH-
groups into seaweed tissues leads to a nucleophilic displacement of some sulfate
groups at the C6 position by alkoxy groups (-RO‾) produced from the hydroxyl groups at the
C3 positions to create 3,6-anhydro rings see Figure 1.3. However, exposure to high pH for an
extended time leads hydrolysis and thus a decrease of the molar mass of the Car chains 43
.
Car can be recovered from solution by precipitation or by freezing – thawing cycles
and drying. Ethanol is commonly used for precipitation and the use of other solvents like
methanol and isopropanol is restricted. Removing water from Car solutions by freezing-
thawing has become a favored technique, because it is environmentally friendly. However,
this process takes more time than precipitation and it can only be applied to strong gels such as
κ-car. The residual water content of Car is removed by various drying techniques such as
drying in the sun, hot air drying, vacuum drying and freeze drying. Drying in the sun is
generally utilized by pilot manufacturers, while the hot air drying is the common method for
producing commercial Car 30
.

11
Figure 1.4. Flow chart of carrageenan extraction
Car naturally contains potassium, sodium, magnesium, and calcium sulfate. The
relative proportion of ions in Car can be changed by processing methods. Pure sodium Car can
be obtained by dialysis first against a NaCl solution and then against deionized water.
Several new extraction methods are being developed as eco-friendly alternatives to the
alkaline treatment such as using enzymes to convert bioprecusors (μ- and ν-carrabiose) to the
kappa and iota type 66,67
, microwave-assisted 68
or ultrasound-assisted extraction 69
. However,
the extraction using these methods is currently not commercially viable.
Washing
Hot aqueous extraction
Filtration/ Centrifugation
Precipitation
Drying
Semi refined
Car
Washing
Filtration
Gelling
Cutting
Freezing
Thawing
Dialysis
Drying
Purified Car
Alkaline treatment
Refined Car
Heating in water
Seaweed
Concentrating
Water

12
Parameters that influence the yield and quality of Car are not only the processing
method 47,65,70,71
, but also the location and conditions of seaweed cultivation 10,72
and the
storage conditions either 73
. Increasing the duration of cultivation can increase the Car quality
and the highest yields have been obtained from seaweed cultured between 45 and 60 days 9,72
.
Only κ- and ι-car are used widely in industry due to their gelling properties. In general,
seaweed does not produce pure - or -car with good gelling properties, because they are
contaminated with bioprecursors that influence their functional properties. Hence, the
manufacturers almost use the alkaline extraction to modify the Car structure to some extent.
1.2.4. Properties of carrageenan in aqueous solution
1.2.4.1. Solubility and stability
All Car are hydrophilic and insoluble in organic solvents such as alcohol, ether, and oil.
The solubility depends on the type of Car, temperature and their associated cations. -Car is
less soluble than others, because contains more hydrophobic 3.6-anhydro-D-galactose residues
as part of the repeating unit and less sulfate groups, whereas λ-car that contains more sulfates
and is devoid 3,6-anhydro-D-galactose residues is easily soluble at most conditions.
As will be discussed in the following section - and -car associate in aqueous solutions
below a critical temperature that depends on the type and concentration of ions that are
present. Therefore these types need to be solubilized at higher temperatures. Car is stable in
aqueous solution in the pH range 7-10, but at lower pH and high temperatures hydrolysis may
occur leading to loss of viscosity and gelling properties.
1.2.4.2. Gelation
The conformation of κ- and ι-car chains in aqueous solution changes from a random coil
to a helix below a critical temperature (Tc) 74,75
. The helices have a tendency to associate
causing aggregation and gelation of the Car below Tc. Figure 1.5 shows example of the

13
dependence of the oscillatory storage (G') and loss (G") moduli during cooling and heating.
Figure 1.5a. Evolution of G’ (closed symbols) and G” (open symbols) as a function of
temperature of κ-car at 0.4 g/L without KCl added, on cooling (circles) and heating (squares)
(Núñez-Santiago et al 76
). Arrow indicates Tc
Figure 1.5b. Changes in G' (closed symbols) and G" (open symbols) on cooling (triangles)
and heating (circles) at 1oC/ min for 10 g/L κ-car with 5 mM added KCl. (Doyle et al
77).
Figure 1.5c. Temperature dependence of G’ of 2.5% purified sodium ι-car in 0.25M NaCl
obtained on cooling (solid lines) and heating (dotted lines) at an oscillating frequency of 0.2
(▲), 0.5 (■), 1 (♦) or 2 (●) Hz. The arrow indicates Tc.
T (
oC)
(c)
G
’ (P
a)

14
The effect of aggregation or gelation when T < Tc causes a sharp increase of the moduli.
If the Car concentration is sufficiently high and/or in presence of specific cations gels are
formed and G' becomes larger than G". Tc and the gel stiffness strongly depend on the type
and concentration of Car and the type and concentration of ions that are present 13,21,78–82
.
Rochas et al 13
determined Tc for κ-car as a function of the salt concentration for a range of
different cations (see Figure 1.6), ι-car is less sensitive to the presence of monovalent cations,
but is more sensitive to divalent ions 13,15,16
.
Figure 1.6. Dependence of the critical temperature of κ-car solutions on the total
concentration (CT) of various cations (Rochas et al 13
).
There is still controversy about whether double or single helices are formed 14,51,56,83–87
,
see Figure 1.7. In either case gels are formed by association of helices into a system spanning
network.

15
Figure 1.7. Gelation model of Car (Rochas et al 65
and Smidsrød et al 80
)
Figure 1.8. Variation of gelling temperature (Tg) and melting temperature (Tm) of κ-car in the
presence of KCl for cooling (○) and heating (●) curves (Rochas et al 13
).
Ccrit, Tc

16
The coil-helix transition is thermo-reversible, which means that the gel can be formed
by cooling hot solutions and melted by heating. For κ-car gels, the melting temperature (Tm) is
often higher than the gelling temperature (Tg) which is called thermal hysteresis and depends
on the type and concentration of cations, see Figure 1.5b. Figure 1.8 shows an example of the
dependence of transition temperatures on the concentration of K+, for κ-car. Below a critical
polymer concentration (Ccrit), Tm and Tg are similar and there is no hysteresis. The transition
temperature of ι-car is most often lower than that of κ-car 74
and there is no hysteresis for ι-car
14. The presence of biological precursor units (λ-, μ-, and ν-cars) in the extracts impede the
helix formation, thereby negatively influencing the gelation properties 43,46
.
1.2.4.3. Rheological properties
Carrageenan solutions
Many factors influence the viscosity of Car solutions, such as molecular weight,
concentration, temperature, type of Car, and cations in the solution 65,88,89
. Figure 1.9 shows
that the viscosity of Car in deionized water increases strongly with the increasing Car
concentration.
Figure 1.9. Viscosity of ι-car in deionized water (Stefan et al 88
)
Research of Croguennoc et al 90
on semidilute κ-car solutions in the coil conformation
(0.1 M NaCl, 20 °C) found that the low shear viscosity () increased following a power law at

17
higher polymer concentration, see Figure 1.10a. The presence of specific ions can cause
aggregation of κ- and ι-car leading to more viscous systems. Núñez-Santiago et al 76
(Figure
1.10b) studied the viscosity of 5 g/L κ-car as a function of KCl concentration at 25°C and
showed that there was first a decrease of up to 4mM KCl, caused by screening of
electrostatic interactions and subsequently a sharp increase caused by aggregation of the Car.
Michele et al 91
showed that increased reversibly with decreasing temperature (Figure 1.11).
Figure 1.10a. The viscosity (η) of κ-car solution as a function of the concentration. The solid
line represents the theoretical prediction for semidilute, flexible polymers in a good solvent
(Croguennoc et al 90
)
Figure 1.10b. Variations of the viscosity of 5 g/L κ-car as a function of KCl concentration
(Núñez-Santiago et al 76
).
a
b

18
Figure 1.11. Arrhenius plots of the viscosity for κ-car solutions at different concentrations
(Michel et al 91
)
Carragenan gels
The differences in gel strength for different types of Car are mainly caused by the
presence of 3,6-anhydro-D-galactose residues that are present in gelling κ- and ι-car, but not in
non-gelling Car such as the λ-, μ-, and ν-car (Figure 1.2 & 1.3). The gel stiffness increases
with increasing cation concentration, but saturates above a certain concentration 79,89
.
Figure 1.12. Phase diagram of ι- and κ-car in the presence of CaCl2/ CuCl2 and KCl,
respectively (■ turbid gel, □ clear gel, ○ clear sol, x syneresis, + precipitate) (Michel et al 82
)

19
Results of Michel et al 82
showed that the sol-gel diagram of κ- and ι-car (see Figure
1.12) depends on the type of Car and the type and concentration of the cations. The
homogeneity/ heterogeniety of the Car solutions and gels also depend on the type of ions and
Car.
The gel stiffness increases with increasing Car concentration 12,80,83,92
. The critical Car
concentration to form a self supporting gel depends on the type of Car and ions present.
Nguyen et al 80
, for example, showed that in the presence of 10 mM KCl, κ-car at 2 g/L was
enough to form a gel. Moreover, the investigations of Smidsrød et al 92
and Rochas et al 21
on
the role of the molecular weight of κ-car found that gels are formed more easily with high
molar mass Car. Below a critical value (Mw< 3 x 10⁴
Da) gelation did not occur.
1.2.5. Mixtures of different types of carrageenan
Mixtures of κ- and ι-car were in first instance studied in order to measure the effect of
impurity of ι-car in κ-car gel 15
and vice versa 21
. Rochas et al 21
found that the elastic modulus
of mixed gels decreased with increasing ι-car content. However, the yield stress of the mixed
gels at a 50-50 ratio was higher than the sum of the individual Car gels. Later on, more studies
were done on the behavior of Car in mixed systems by using other techniques such as DSC
(Differential Scanning Calorimetry), NMR, turbidity and rheological measurements 17–20,93,94
.
These studies showed a two-step gelation process at temperatures that were equal to the coil–
helix temperature (Tc) of the individual Car solutions at the same ion concentrations 16–20
. This
means that the coil-helix transition of the two types of Car chains is not influenced by the
presence of the other type. The gel stiffness of ι-car gels in mixtures with κ-car in the coil
conformation was found to be very close to that of the equivalent individual ι-car gels
indicating that the gelation of ι-car was little influenced by the presence of κ-car coils.
However, the gel stiffness of mixed gels was found to be much larger than the sum of the
elastic moduli of the individual gels. This means that the two types of Car do not form
independent homogeneously distributed networks 20
.
It was suggested that the networks of each type of Car are microphase separated
16,17,19,20. Microphase separation causes the density of each network to be higher, which could
explain the higher gel stiffness compared to a simple sum of the moduli of the individual
networks. However, phase separation was not observed when solutions of κ-car and ι-car

20
were mixed in the coil conformation. In addition, the fact that the stiffness of ι-car gels is not
influenced by the presence of κ-car coils suggests that phase separation does not occur in that
case either. Therefore microphase separation, if it indeed occurs, is driven by formation of the
κ-car network within the ι-car network when both Car are in the helical conformation.
Brenner et al 20
discussed in some details the issue of whether interpenetrated or
microphase separated mixed gels are formed. They excluded on the basis of rheological
measurements that non-interacting interpenetrated κ-car and ι-car networks are formed in the
mixtures. Instead they concluded that the results were compatible with formation of
bicontinuous microphase separated networks, but this hypothesis was not backed up by
measurements of the microstructure. More recently, Hu et al 93
studied the diffusion of trace
PEO chains in individual and mixed κ-car and ι-car gels using pulsed field gradient NMR.
They observed a single diffusion process of PEO chains in mixed gels, which implies that if
microphase separation occurs the κ-car and ι-car domains are smaller than 450 nm.
1.2.6. Microstructure of carrageenan gels
The microstructure of Car gels has been studied by Scanning Electron Microscopy
(SEM), Atomic Force Microscopy (AFM), and Confocal Laser Scanning Microscopy (CLSM)
95–99. Thrimawithana et al
99 have investigated the interaction between counter-ions and
molecules of individual κ-car or ι-car by SEM. They could distinguish the absence or
appearance of cross-linked structures by observing the absence or formation of rectangular
pores on the images. The same technique was used by MacArtain et al 79
to observe the
structure of κ-car in the presence of Ca2+
. Figure 1.13 shows SEM images of individual of κ-
car and ι-car in the presence of calcium ions. The network of ι-car in the presence of calcium
ion shows a dense structure (Figure 1.13a), whereas in the case of κ-car, it is a fine structure
with thin filaments of κ-car linked together to form a continuous network (Figure 1.13b).
However, a network of κ-car with excessive amount of KCl appeared as a rigid structure
resulting presumably from large aggregates of helices 95
. These observations are compatible
with the investigations on rheological properties of Car gels in the literature that show that κ-
car forms a strong gel with potassium ions, and ι-car gelation is induced by calcium ions.

21
Figure 1.13. SEM images of ι-car gel at 4 g/L and 6 mM CaCl2 (Thrimawithana et al 99
) (a)
and κ-car at 5 g/L and 5 g/L CaCl2 (MacArtain et al 79
) (b).
CLSM has been shown to be a useful method for investigating the structure of
polymers. With this technique, the sample does not need to be dehydrated as for SEM or
AFM, which might perturb the structure. However, CLSM requires labelling with fluorescent
probes. Study of Núñez-Santiago et al 76
showed that κ-car (labeled with rhodamine B
isothiocyanate) in the presence of KCl appeared as a homogeneous network on length scales
accessible to light microscopy (>100nm) (Figure 1.14). Lundin et al 17
showed a
heterogeneous microstructure for a mixture of ι- and κ-car, see Figure 1.15, and interpreted
this in terms of microphase separation between the two types of Car, However, a
heterogeneous microstructure does not imply that microphase separation has occurred as
similar heterogeneous microstructure can also be seen for individual Car gels.
Figure 1.14. CLSM image of κ-car 5g/L and 100 mM KCl at 20oC (Núñez-Santiago et al).
a b

22
Figure 1.15. Confocal laser scanning micrographs of a mixture of 11.25 g/L ι-car and 15 g/L
κ-car ) in 400 mM NaCl (a) and mixture of 10 g/L ι-car and 15 g/L κ-car in 50 mM KCl (b)
(Lundin et al 17
)
1.2.7. Applications
1.2.7.1. Food applications
Car has no nutritional value but it is widely utilized in the food industry due to its
excellent physical functional properties such as thickening, gelling and stabilizing abilities. It
is not significantly degraded in gastrointestinal tract in the stomach, but neither does
significantly affect absorption of nutrients 100
. As a food additive (E407), Car is present in
many processed foods, including dairy products, meat products, beverages, condiments, infant
formula, and pet food 6,30
.
Car has the ability to bind with milk proteins, hence the addition to dairy products can
improve texture, thickness, and solubility 101
. Some typical products containing Car are
whipped cream, yogurt, and liquid milk products 75
.
Car is used as a fat substitute in processed meats and base-meat products 4,101,102
. In
these products, Car contributes to gel formation and water retention. It improves the water
holding capacity leading to decreased toughness and increased juiciness, preserving the
sensory quality during storage. By adding 3% Car during preparation of frankfurter sausages
the sensory scores in the texture, color and taste were all higher than that of control
sausages103
. Verbeken et al 104
indicated that the presence of Car in salt-soluble meat networks
increased the gel strength and the water holding capacity. This was due to the network formed
b)
10 μm

23
by protein and Car upon cooling. Research on Alaska pollock surimi 105
also showed that
adding κ-car enhanced the gel strength of the product.
Edible coating produced by Car for fresh-cut packaged fruits is one example of novel
use of the polymer in food industry 106–108
. Car coatings function as a gas barrier, adhering to
the cut surface of the fruit and reduce respiration. These studies have shown that Car reduced
microbial contamination and prolonged shelf life.
1.2.7.2. Non- food application
Car is also used in various non-food products, such as pharmaceutics, cosmetics,
printing and textile formulations 6,27
. For example, Car is used in air freshener gels, toothpaste,
shampoo and cosmetic creams. In recent years, it has been established that Car can control the
release of bioactive compounds, flavors and probiotics 109,110
.

24
References
1. Juteau, A., Doublier, J. L. & Guichard, E. Flavor release from ι-carrageenan matrices: a
kinetic approach. J. Agric. Food Chem. 52, 1621–1629 (2004).
2. Yegappan, R., Selvaprithiviraj, V., Amirthalingam, S. & Jayakumar, R. Carrageenan
based hydrogels for drug delivery, tissue engineering and wound healing. Carbohydr.
Polym. 198, 385–400 (2018).
3. Knutsen, S. H., Myslabodski, D. E., Larsen, B. & Usov, A. I. A. Modified System of
Nomenclature for Red Algal Galactans. Bot. Mar. 37, 163–169 (1994).
4. Trius, A. & Sebranek, J. G. Carrageenans and Their Use in Meat Products. Crit. Rev.
Food Sci. Nutr. 36, 69–85 (1996).
5. van De Velde, F., Pereira, L. & Rollema, H. S. The revised NMR chemical shift data of
carrageenans. Carbohydr. Res. 339, 2309–2313 (2004).
6. van De Velde, F., Knutsen, S. H., Usov, A. I., Rollema, H. S. & Cerezo, A. S. 1H and
13C high resolution NMR spectroscopy of carrageenans: application in research and
industry. Trends Food Sci. Technol. 13, 73–92 (2002).
7. Ask, E. I. & Azanza, R. V. Advances in cultivation technology of commercial
eucheumatoid species: A review with suggestions for future research. Aquaculture 206,
257–277 (2002).
8. Phang, S. M., Yeong, H. Y., Lim, P. E., Nor, A. R. M. & Gan, K. T. Commercial
varieties of Kappaphycus and Eucheuma in Malaysia. Malaysian J. Sci. 29, 214–224
(2010).
9. Ohno, M., Nang, H. Q. & Hirase, S. Cultivation and carrageenan yield and quality of
Kappaphycus alvarezii in the waters of Vietnam. J. ofApplied Phycol. 8, 431–437
(1996).
10. Hung, L. D., Hori, K., Nang, H. Q., Kha, T. & Hoa, L. T. Seasonal changes in growth
rate, carrageenan yield and lectin content in the red alga Kappaphycus alvarezii
cultivated in Camranh Bay, Vietnam. J. Appl. Phycol. 21, 265–272 (2009).
11. Morris, E. R. Molecular Interactions in Polysaccharide Gelation. Br. Polym. J. 18, 14-
21 (1986).
12. Landry, M. R. S. & Rochas, C. Role of the Molecular Weight on the Mechanical Cels
Properties of Kappa Carrageenan previously. Carbohydr. Polym. 2, 255–266 (1990).
25
13. Rochas, C. & Rinaudo, M. Activity Coefficients of Counterions and Conformation in
Kappa-Carrageenna System. Biopolymers 19, 1675–1687 (1980).
14. Yuguchi, Y., Thu Thuy, T. T., Urakawa, H. & Kajiwara, K. Structural characteristics of
carrageenan gels: Temperature and concentration dependence. Food Hydrocolloids 16,
515–522 (2002).
15. Piculell, L., Nilsson, S. & Muhrbeck, P. Effects of small amounts of kappa-carrageenan
on the rheology of aqueous iota-carrageenan. Carbohydr. Polym. 18, 199–208 (1992).
16. Picullel, L., Håkansson, C. & Nilsson, S. Cation specificity of the order-disorder
transition in iota carrageenan: effects of kappa carrageenan impurities. Int. J. Biol.
Macromol. 9, 297–301 (1987).
17. Lundin, L., Odic, K., Foster, T. J., & Norton, I. T. Phase separation in mixed
carrageenan systems. In Supermolecular and colloidal structures in Biomaterials and
Biosubstrates 436–449 (ICP, 2000)
18. Parker, A., Brigand, G., Miniou, C., Trespoey, A. & Vallée, P. Rheology and fracture of
mixed ι- and κ-carrageenan gels: Two-step gelation. Carbohydr. Polym. 20, 253–262
(1993).
19. Du, L., Brenner, T., Xie, J. & Matsukawa, S. A study on phase separation behavior in
kappa/iota carrageenan mixtures by micro DSC, rheological measurements and
simulating water and cations migration between phases. Food Hydrocoll. 55, 81–88
(2016).
20. Brenner, T., Tuvikene, R., Parker, A., Matsukawa, S. & Nishinari, K. Rheology and
structure of mixed kappa-carrageenan/iota-carrageenan gels. Food Hydrocoll. 39, 272–
279 (2014).
21. Rochas, C., Rinaudo, M. & Landry, S. Relation between the molecular structure and
mechanical properties of carrageenan gels. Carbohydr. Polym. 10, 115–127 (1989).
22. Bixler, H. J. & Porse, H. A decade of change in the seaweed hydrocolloids industry. J.
Appl. Phycol. 23, 321–335 (2011).
23. FAO. The State of World Fisheries and Aquaculture. Contributing to food security and
nutrition for all (2016). doi:92-5-105177-1
24. FAO. The State of World Fisheries and Aquaculture. Meeting the sustainable
development goals (2018). doi:978-92-5-130562-1

26
25. Armisen, R. Agar and agarose biotechnological applications. Hydrobiologia 221, 157–
166 (1991).
26. Araki, C. & Arai, K. Studies on the Chemical Constitution a New Disaccharide as a
Reversion of Agar-agar . Isolation Product from Acidic Hydrolysate. Bull. Chem. Soc.
Jpn. 40, 1452–1456 (1967).
27. Tye, Y. Y. et al. A review of extractions of seaweed hydrocolloids: Properties and
applications. eXPress Polym. Lett. 12, 296–317 (2018).
28. Rhein-Knudsen, N., Ale, M. T., Ajalloueian, F., Yu, L. & Meyer, A. S. Rheological
properties of agar and carrageenan from Ghanaian red seaweeds. Food Hydrocoll. 63,
50–58 (2017).
29. Cristiane, M. et al. Antioxidant activities of sulfated polysaccharides from brown and
red seaweeds. J. Appl. Phycol. 19, 153–160 (2007).
30. McHugh Dennis J. FAO Fisheries Technical Paper 441. A guide to the seaweed
industry. (2003).
31. Sharma, A. & Gupta, M. N. Three phase partitioning of carbohydrate polymers:
Separation and purification of alginates. Carbohydr. Polym. 48, 391–395 (2002).
32. Torres, M. R. et al. Extraction and physicochemical characterization of Sargassum
vulgare alginate from Brazil. Carbohydr. Res. 342, 2067–2074 (2007).
33. Szekalska, M., B, A. P., N, E. S., Ciosek, P. & Winnicka, K. Alginate: Current Use and
Future Perspectives in Pharmaceutical and Biomedical Applications. Int. J. Polym. Sci.
1–17 (2016).
34. Webber, V., De Carvalho, S. M. & Barreto, P. L. M. Molecular and rheological
characterization of carrageenan solutions extracted from Kappaphycus alvarezii.
Carbohydr. Polym. 90, 1744–1749 (2012).
35. Estevez, J. M., Ciancia, M. & Cerezo, A. S. The system of low-molecular-weight
carrageenans and agaroids from the room-temperature-extracted fraction of
Kappaphycus alvarezii. Carbohydr. Res. 325, 287–299 (2000).
36. van de Velde, F. & Rollema, H. S. High Resolution NMR of Carrageenans. in Modern
Magnetic Resonance (ed. Webb, G. A.) 1605–1610 (Springer, Dordrecht, 2008).
37. Mccandless, E. L. Carrageenans in the Gametophytic and Sporophytic Stages of
Chondrus crispus. Planta (Berl.) 112, 201-212, (1973).

27
38. Falshaw, R., Bixlerb, H. J. & Johndrob, K. Structure and perfonnance of commercial
kappa-2 carrageenan extracts. Structure analysis. Food Hydrocoll. 15, 441-452 (2001).
39. Tan, J. et al. Kappaphycus malesianus sp: a new species of Kappaphycus (Gigartinales,
Rhodophyta) from Southeast Asia. J. Appl. Phycol. 26, 1273–1285 (2014).
40. Collén, J. et al. Chondrus crispus - A present and historical model organism for red
seaweeds. Advances in Botanical Research 71, 53-89 (2014).
41. Aguilan, J. T. et al. Structural analysis of carrageenan from farmed varieties of
Philippine seaweed. Bot. Mar. 46, 179–192 (2003).
42. van de Velde, F. Structure and function of hybrid carrageenans. Food Hydrocoll. 22,
727–734 (2008).
43. Azevedo, G., Torres, M. D., Sousa-pinto, I. & Hilliou, L. Effect of pre-extraction alkali
treatment on the chemical structure and gelling properties of extracted hybrid
carrageenan from Chondrus crispus and Ahnfeltiopsis devoniensis. Food Hydrocoll. 50,
150–158 (2015).
44. Campo, V. L., Kawano, D. F., Silva, D. B. da & Carvalho, I. Carrageenans: Biological
properties, chemical modifications and structural analysis - A review. Carbohydr.
Polym. 77, 167–180 (2009).
45. van De Velde, F. et al. The structure of κ/ι-hybrid carrageenans II. Coil-helix transition
as a function of chain composition. Carbohydrate Research 340, 1113–1129 (2005).
46. van De Velde, F. et al. Coil-helix transition of ι-carrageenan as a function of chain
regularity. Biopolymers 65, 299–312 (2002).
47. Chan, P. T. & Matanjun, P. Chemical composition and physicochemical properties of
tropical red seaweed, Gracilaria changii. Food Chem. 221, 302–310 (2017).
48. Smitha, J. L., Summers, G. & Wong, R. Nutrient and heavy metal content of edible
seaweeds in New Zealand. New Zeal. J. Crop Hortic. Sci. 38, 19–28 (2010).
49. Lars-Gosta Ekstrom, J. K. Optimality conditions for linear fractional bilevel programs.
Carbohydr. Res. 116, 89–94 (1983).
50. Viebke, C., Borgstrsm, J. & Piculell, L. Characterisation of kappa- and iota-carrageenan
coils and helices by MALLS / GPC. 8617, 145–154 (1995).
51. Hoffmann, R. A., Gidley, M. J., Cooke, D. & Frith, W. J. Effect of isolation procedures
on the molecular composition and physical properties of Eucheuma cottonii

28
carrageenan. Top. Catal. 9, 281–289 (1995).
52. Meunier, V., Nicolai, T., Durand, D. & Parker, A. Light Scattering and Viscoelasticity
of Aggregating and Gelling κ-Carrageenan. Macromolecules 32, 2610–2616 (1999).
53. Meunier, V., Nicolai, T. & Durand, D. Structure and Kinetics of Aggregating.
Macromolecules 33, 2497–2504 (2000).
54. Slootmaekers, D. & Mandel, M. Dynamic light scattering by iota- and kappa-
carrageenan solutions. Int. J. Biol. Macromol. 13, 17–25 (1991).
55. Abad, L. V et al. Dynamic light scattering studies of irradiated kappa carrageenan. Int.
J. Biol. Macromol. 34, 81–88 (2004).
56. Mangione, M. R., Giacomazza, D., Bulone, D., Martorana, V. & Biagio, P. L. S.
Thermoreversible gelation of kappa-carrageenan: relation between conformational
transition and aggregation. Biophysical Chem. 104, 95–105 (2003).
57. Lecacheux, D., Panaras, R., Brigand, G. & Martin, G. Molecular weight distribution of
carrageenans by size exclusion chromatography and low angle laser light scattering.
Carbohydr. Polym. 5, 423–440 (1985).
58. Brown, W. Light Scattering: Principles and Developments. (Oxford: Clarendon Press,
1996).
59. Wittgren, B., Borgstrom, J., Picullel, L. & Wahlund, K, -G. Conformational Change
and Aggregation of κ-Carrageenan Studied by Flow Field-Flow Fractionation and
Multiangle. Biopolymers 45, 85–96 (1997).
60. Viebke, C. & Williams, P. A. Determination of molecular mass distribution of κ-
carrageenan and xanthan using asymmetrical flow field-flow fractionation. Food
Hydrocoll. 14, 265–270 (2000).
61. Thành, T. T. T. et al. Molecular Characteristics and Gelling Properties of the
Carrageenan Family 1, Preparation of Novel Carrageenans and their Dilute Solution
Properties. Macromol. Chem. Phys. 15–23 (2002).
62. Tojo, E. & Prado, J. A simple 1H NMR method for the quantification of carrageenans in
blends. Carbohydr. Polym. 53, 325–329 (2003).
63. Bixle, H. J. Recent developments in manufacturing and marketing carrageenan.
Hydrobiologia 326/327, 35–57 (1996).
64. Montolalu, R. I., Tashiro, Y., Matsukawa, S. & Ogawa, H. Effects of extraction

29
parameters on gel properties of carrageenan from Kappaphycus alvarezii (Rhodophyta).
J. Appl. Phycol. 20, 521–526 (2008).
65. Bono, A., Anisuzzaman, S. M. & Ding, O. W. Effect of process conditions on the gel
viscosity and gel strength of semi-refined carrageenan (SRC) produced from seaweed
(Kappaphycus alvarezii). J. King Saud Univ. - Eng. Sci. 26, 3–9 (2014).
66. Zinoun, M., Diouris, M., Potin, P., Floc, J. Y. & Deslandes, E. Evidence of
Sulfohydrolase Activity in the Red Alga Calliblepharis jubata. 40, 49–53 (1997).
67. Sabine M. Genicot; Agnès Groisiller, Hélène Rogniaux, Laurence Meslet-Cladière,
Tristan Barbeyron, W. H. Discovery of a novel iota carrageenan sulfatase isolated from
the marine bacterium Pseudoalteromonas carrageenovora. Front. Chem. 2, 1–15
(2014).
68. E. Vázquez-Delfín & D. Robledo & Y. Freile-Pelegrín. Microwave-assisted extraction
of the Carrageenan from Hypnea musciformis Microwave-assisted extraction of the
Carrageenan from Hypnea musciformis (Cystocloniaceae, Rhodophyta). J. Appl.
Phycol. 26, 901–907 (2013).
69. Rafiquzzaman, S. M., Ahmed, R., Lee, M., Noh, G. & Jo, G. Improved methods for
isolation of carrageenan from Hypnea musciformis and its antioxidant activity. J. Appl.
Phycol. 28, 1265–1274 (2015).
70. Moses, J., Anandhakumar, R. & Shanmugam, M. Effect of alkaline treatment on the
sulfate content and quality of semi-refined carrageenan prepared from seaweed
Kappaphycus alvarezii Doty (Doty) farmed in Indian waters. African J. Biotechnol. 14,
1584–1589 (2015).
71. Karlsson, A. & Singh, S. K. Acid hydrolysis of sulphated polysaccharides.
Desulphation and the effect on molecular mass. Carbohydr. Polym. 38, 7–15 (1999).
72. Hayashi, L. et al. The effects of selected cultivation conditions on the carrageenan
characteristics of Kappaphycus alvarezii (Rhodophyta, Solieriaceae) in Ubatuba Bay,
São Paulo, Brazil. J. Appl. Phycol. 19, 505–511 (2007).
73. Hilliou, L. et al. The impact of seaweed life phase and postharvest storage duration on
the chemical and rheological properties of hybrid carrageenans isolated from
Portuguese Mastocarpus stellatus. Carbohydr. Polym. 87, 2655–2663 (2012).
74. Rochas, R. M. Calorimetric determination of the conformational transition of kappa
30
carrageenan. Carbohydr. Res. 105, 227–236 (1982).
75. Piculell, L. Gelling Carrageenans. in Food Polysaccharides and Their Applications (ed.
A.Williams, A. M. Stephen and G. O. Phillips) 239–288 (Taylor & Francis, 2006)
76. Núñez-Santiago, M. C., Tecante, A., Garnier, C. & Doublier, J. L. Rheology and
microstructure of κ-carrageenan under different conformations induced by several
concentrations of potassium ion. Food Hydrocoll. 25, 32–41 (2011).
77. Doyle, J., Giannouli, P., K. Philp & Morris, E. R. Effect of K+ and Ca
2+ cations on
gelation of kappa-carrageenan. Gums Stabilisers Food Ind. 11, 158–164 (2002).
78. Norton, I. T., Goodall, D. M., Morris, E. R. & Rees, D. A. Role of cations in the
conformation of iota and kappa carrageenan. J. Chem. Soc. Faraday Trans. 1 79, 2475–
2488 (1983).
79. MacArtain, P., Jacquier, J. C. & Dawson, K. A. Physical characteristics of calcium
induced κ- carrageenan networks. Carbohydr. Polym. 53, 395–400 (2003).
80. Nguyen, B. T., Nicolai, T., Benyahia, L. & Chassenieux, C. Synergistic effects of
mixed salt on the gelation of κ-carrageenan. Carbohydr. Polym. 112, 10–15 (2014).
81. Robal, M. et al. Monocationic salts of carrageenans: Preparation and physico-chemical
properties. Food Hydrocoll. 63, 656–667 (2017).
82. Michel, A. S., Mestdagh, M. M. & Axelos, M. A. V. Physico-chemical properties of
carrageenan gels in presence of various cations. International Journal of Biological
Macromolecules 21, 195–200 (1997).
83. Morris, E. R., Rees, D. A. & Robinson, G. Cation-specific aggregation of carrageenan
helices: Domain model of polymer gel structure. J. Mol. Biol. 138, 349–362 (1980).
84. Viebke, C., Piculell, L. & Nilsson, S. On the Mechanism of Gelation of Helix-Forming
Biopolymers 27, 4160–4166 (1994).
85. Kara, S., Tamerler, C. & Pekcan, Ö. Cation effects on swelling of κ-carrageenan: A
photon transmission study. Biopolymers 70, 240–251 (2003).
86. Smidsrod, O. & Grasdalen, H. Some physical properties of carrageenan in solution and
gel state. Carbohydr. Polym. 2, 270–272 (1982).
87. Schefer, L., Adamcik, J. & Mezzenga, R. Unravelling Secondary Structure Changes on
Individual Anionic Polysaccharide Chains by Atomic Force Microscopy. Angewandte
Communications 53, 5376–5379 (2014).

31
88. Iglauer, S., Wu, Y., Shuler, P., Tang, Y. & Goddard, W. A. Dilute iota- and kappa-
Carrageenan solutions with high viscosities in high salinity brines. J. Pet. Sci. Eng. 75,
304–311 (2011).
89. Lai, V. M. F., Wong, P. A. L. & Lii, C. Y. Effects of cation properties on sol-gel
transition and gel properties of κ-carrageenan. J. Food Sci. 65, 1332–1337 (2000).
90. Croguennoc, P., Meunier, V., Durand, D. & Nicolai, T. Characterization of semidilute
κ-carrageenan solutions. Macromolecules 33, 7471–7474 (2000).
91. Marcotte, M., Taherian, A. R. & Ramaswamy, H. S. Rheological properties of selected
hydrocolloids as a function of concentration and temperature. Food Res. Int. 34, 695–
703 (2001).
92. Smidsrød, O. & Grasdalen, H. Polyelectrolytes from seaweeds. Hydrobiologia 116–
117, 19–28 (1984).
93. Hu, B., Du, L. & Matsukawa, S. NMR study on the network structure of a mixed gel of
kappa and iota carrageenans. Carbohydr. Polym. 150, 57–64 (2016).
94. Ridout, M. J., Garza, S., Brownsey, G. J. & Morris, V. J. Mixed iota-kappa carrageenan
gels. Int. J. Biol. Macromol. 18, 5–8 (1996).
95. Ikeda, S., Morris, V. J. & Nishinari, K. Microstructure of aggregated and nonaggregated
κ-carrageenan helices visualized by atomic force microscopy. Biomacromolecules 2,
1331–1337 (2001).
96. Walther, B., Lorén, N., Nydén, M. & Hermansson, A. M. Influence of κ-carrageenan
gel structures on the diffusion of probe molecules determined by Transmission Electron
Microscopy and NMR diffusometry. Langmuir 22, 8221–8228 (2006).
97. Lorén, N. et al. Dendrimer Diffusion in kappa-carrageenan Gel Structures.
Biomacromolecules 10, 275–284 (2009).
98. Hans Tromp, R., Van de Velde, F., Van Riel, J. & Paques, M. Confocal scanning light
microscopy (CSLM) on mixtures of gelatine and polysaccharides. Food Res. Int. 34,
931–938 (2001).
99. Thrimawithana, T. R., Young, S., Dunstan, D. E. & Alany, R. G. Texture and
rheological characterization of kappa and iota carrageenan in the presence of counter
ions. Carbohydr. Polym. 82, 69–77 (2010).
100. Weiner, M. L. Food additive carrageenan: Part II: A critical review of carrageenan in

32
vivo safety studies. Crit. Rev. Toxicol. 44, 244–269 (2014).
101. McKim, J. M. Food additive carrageenan: Part I: A critical review of carrageenan in
vitro studies, potential pitfalls, and implications for human health and safety. Crit. Rev.
Toxicol. 44, 211–243 (2014).
102. Sarteshnizi, A. & Khaneghah, M. Mini Review A review on application of
hydrocolloids in meat and poultry products. Inter. Food Research J. 22, 872–887
(2015).
103. Cierach, M., Modzelewska-kapituła, M. & Szaciło, K. The influence of carrageenan on
the properties of low-fat frankfurters. Meat Sci. 82, 295–299 (2009).
104. Verbeken, D., Neirinck, N., Meeren, P. Van Der & Dewettinck, K. Meat Influence of
kappa-carrageenan on the thermal gelation of salt soluble meat proteins. Meat Science
70, 161–166 (2005).
105. Eom, S. et al. Effects of Carrageenan on the Gelatinization of Salt-Based Surimi Gels.
Fish Aquat Sci 16, 143–147 (2013).
106. Bico, S. L. S., Raposo, M. F. J., Morais, R. M. S. C. & Morais, A. M. M. B. Combined
effects of chemical dip and / or carrageenan coating and / or controlled atmosphere on
quality of fresh-cut banana. Food Control 20, 508–514 (2009).
107. Mustaffa, H., Osman, A., Ping, C. & Mohamad, F. Postharvest Biology and Technology
Carrageenan as an alternative coating for papaya (Carica papaya L.cv. Eksotika).
Postharvest Biol. Technol. 75, 142–146 (2013).
108. Lin, M. G., Lasekan, O., Saari, N. & Khairunniza-bejo, S. Effect of chitosan and
carrageenan-based edible coatings on post-harvested longan (Dimocarpus longan)
fruits. CyTA - J. Food 16, 490–497 (2018).
109. Ellis, A., Keppeler, S. & Jacquier, J. C. Responsiveness of κ-carrageenan microgels to
cationic surfactants and neutral salts. Carbohydr. Polym. 78, 384–388 (2009).
110. Chakraborty, S. Carrageenan for encapsulation and immobilization of flavor, fragrance,
probiotics, and enzymes: A review. J. Carbohydr. Chem. 36, 1–19 (2017).

33
Chapter 2
Materials and Methods
2.1. Materials
2.1.1. Raw carrageenan extracted from red algae
2.1.1.1. Seaweed cultivation
Seaweeds were cultured following the method described by Hung et al 1 from
September to January at Cam Ranh Bay, Khanh Hoa province of Vietnam (111°56'37.9"N
109°11'07.9"E). Briefly, mature specimens of Kappaphycus alvarezii (Ka), Kappaphycus
striatum (Ks), Kappaphycus malesianus (Km), and Eucheuma denticulatum (Ed) were donated
from one farm owner at Cam Ranh Bay. Specimens were selected for which the radius of the
main stems was 3-5 mm and the length of the branches was 5-7 cm. The seaweed was
immerged in the seawater attached to strings (see Figure 2.1), and the cultivation area was
surrounded with fishing nets to avoid fragment dispersion and attack by fish.
Figure 2.1. An example of setting up of seaweed cultivation on the farm
The seaweed was collected after 60 days and washed immediately with tap water to
remove salt and sand. It was dried first 6 hours in the sun and subsequently dried at 60°C for
24 hours in a ventilated oven. The dried products were stored under vacuum condition at room
temperature. Images of the seaweed and the residual water content after drying are shown in
Table 2.1.

34
Table 2.1. Images of Ka, Ks, Km and Ed and residual water content of the dried seaweeds
Sample Ka Ks Km Ed
Moisture (wt%) 30 28 28 29
Pictures
2.1.1.2. Carrageenan extraction
Raw Car was extracted according to the method described by Montolalu et al 2 with
some modifications. Briefly, 30 g dried seaweed was soaked and washed in distilled water for
two hours to remove pigments, salts and other material dispersible in water at ambient
temperatures. The washed seaweed was then cut and minced into small pieces (≈ 1 mm) and
added to 2.1 L of distilled water at 70°C and kept at this temperature during 75 minutes for
Ka, Ks, Km and during 100 minutes for Ed while stirring continuously. The hot suspension
was filtered through a membrane with pore size 25 µm. Finally, the solution was freeze-dried
to obtain the raw Car.
In preliminary work (not shown) we investigated the effects of temperature, duration
and ratio of volume of water to dried algae on the Car yield and the viscosity of Car from Ka
by using a statistical method (Response Surface Methodology). We found that optimum
conditions of yield and viscosity were obtained at temperatures between 70 and 75°C during
75 minutes. In the case of Eucheuma denticulatum, however the optimum extraction time to
have best viscosity was found to be longer, 100 minutes.
2.1.2. Purification of raw carrageenan
Raw carrageenan and commercial carrageenan (a gift from Cargill, Baupte, France) were
purified by centrifugation of aqueous suspensions at C = 5 g/L at 1.5x10⁴ g for 15 minutes at
35°C in order to remove insoluble part, followed by dialysis first against 0.1 M NaCl for 18
hours in order to exchange K+ for Na
+ and subsequently against Milli-Q water for 1 day in

35
order to remove excess salt. Finally, the purified carrageenan solution was freeze-dried and
stored at room temperature for further analysis.
2.1.3. Fluorescent labelling of carrageenan
The purified Car was covalently labelled with Fluorescein isothiocyanate (FITC) and
rhodamine B isothiocyanate (RBITC) following the method described by Heilig, Göggerle and
Hinrichs 3 with minor modifications. Briefly, 20 ml DMSO and 80 µl pyridine were mixed
with 1 g carrageenan and stirred at 70°C for 30 min. After adding 0.1 g FITC or RBITC and
40 µl dibutyltin dilaurate, the mixture was incubated for 3 h at 70°C. The Car was then
precipitated and washed many times with ethanol 95% until the waste solvent became
colorless. The precipitate was dissolved and dialyzed against Milli-Q water in order to remove
any residual free FITC. The FITC absorbance at 480 nm of the bath water was checked and
the dialysis process was considered complete when the absorbance was negligible. After
purification the labelled Car was freeze-dried. Comparison of the absorbance of labelled Car
with that of known concentrations of the fluorophore showed that about 1 in 100 sugar units
was labelled. Mw and Rh were reduced during the labelling process: Mw = 5.0 x10⁵ g/mol, Rh =
67 nm for κ-car, Mw = 5.0 x10⁵ g/mol, Rh = 75 nm for ι-car and Mw = 2.1 x10
5 g/mol, Rh = 60
nm for the commercial κ-car. We speculate that the labelling treatment led to breakage of one
or two covalent bonds in the larger Car chains. It was verified that the rheological properties
of the labelled Car were the same as for unlabelled Car.
2.1.4. Preparation of solutions
Stock solutions of non-labelled and labelled Car solutions were prepared by dissolving
the freeze-dried Car at a concentration of 30 g/L in Milli-Q water with 200 ppm sodium azide
added as a bacteriostastic agent with stirring for few hours at 70°C.
For light scattering measurements on diluted solutions, the stock solution of Car was
diluted with 0.1 M NaCl to between 0.2 and 1 g/L and subsequently filtered through 0.45 μm
pore size filters (Anatop). The concentration of the Car solutions was determined by
measuring the refractive index using a refractive index increment dn/dc = 0.145 mL/g.
36
For measurements on individual and mixed Car solutions that gelled during cooling,
individual Car solutions were first heated to 90°C before mixing and addition of aliquots of
0.4 M KCl or CaCl2 solutions in the required amounts while stirring. The solutions were kept
at 90°C for 30 minutes before cooling.
For Confocal Laser Scanning Microscopy (CLSM) observations 10% of the Car was
replaced by labelled Car.
2.2. Methods
2.2.1. Light Scattering
Light Scattering (LS) is a technique that can be used to measure the average molar mass
(Mw), z-average radius of gyration (Rg) and z-average hydrodynamic radius (Rh) of polymers
in solution. In this study the size and molar mass were determined by using a commercial
static and dynamic light scattering equipment (ALV-5000, ALV-Langen, Germany). The light
source was a He–Ne laser with wavelength of 632 nm. The temperature was controlled by a
thermo-stat bath within ± 0.1°C. The relative scattering intensity (Ir) was calculated as the
measured intensity minus the solvent scattering divided by the scattering intensity of toluene
at 20°C.
In dilute solutions, Ir is related to Mw and the structure factor (S(q)) of the solute:
(2.1)
with K an optical constant
(
)
(
)
(2.2)
Here, Na is Avogadro’s number and Rtol = 1.35×10⁻⁵
cm-1
is the Rayleigh constant of the
toluene standard. The structure factor describes the dependence of the intensity on the
scattering wave vector (q) and depends on the structure and the size of the solute. The initial q-
dependence can be used to obtain the z-average radius of gyration (Rg):

37
S(q)=(1+q2.Rg
2/3)
-1 (2.3)
If interaction between the solute molecules is not negligible, eq. 2.3 can be used to obtain an
apparent molar mass (Ma) and radius of gyration (Ra). The true molar mass and radius of
gyration are obtained by extrapolation to C = 0:
(2.4)
where A2 is the second virial coefficient.
Examples of S(q) as a function of q.Ra are shown in Figure 2.2 for Car at different
concentrations in 0.1 M NaCl. The solid curve in Figure 2.2 represents eq 2.3. Figure 2.3
shows Ma and Ra as a function of C from which Mw, Rg and A2 can be obtained.
Figure 2.2. Structural factor of different Car concentration in function of angle
q * Rg
1
Sq
1
0.8 g/L
0.6
0.4
0.2
0.1

38
a
C (g/L)
0.0 0.2 0.4 0.6 0.8 1.0
Ma (
g/m
ol)
105
106
b
C (g/L)
0.0 0.2 0.4 0.6 0.8 1.0
Ra (
nm
)
70
80
90
100
200
300
Figure 2.3. Dependence of Ma and Ra on the Car concentrations.
With the dynamic light scattering technique intensity auto correlation functions are
determined, which can be analyzed in terms of a sum of exponential relaxations with a
corresponding distribution of relaxation times 4. For polymer solutions, relaxation times can be
related to translational diffusion coefficients (D), which in terms can be related to apparent
hydrodynamic radius using the Stokes-Einstein equation:
(2.5)
with η the viscosity of the solvent, k Boltzman’s constant, and T the absolute temperature.
The z-average hydrodynamic radius (Rh) of the solute is obtained by extrapolating Rha
to q=0 and C=0. Examples of Rha as a function of q are shown in Figure 2.4a for Car at
different concentrations in 0.1 M NaCl. Rha taken at low q-values is plotted as a function of C
in figure 2.4b. Rh can be obtained by extrapolating to C = 0.

39
a
q1e+7
Rha (
nm
)
0
20
40
60
80
100
120
140
0.8 g/L
0.4
0.2
0.1
b
Car (g/L)
0.0 0.2 0.4 0.6 0.8 1.0
Rha (
nm
)
100
Figure 2.4. q-dependence of Rha (a) and Rha taken at low q-values (took at flateau regime) as a
function of Car concentration (b).
2.2.2. NMR spectroscopy
1H NMR spectroscopy analyses was done following the methods described by van De
Velde et al 5 and Tojo and Prado
6 with some modifications. 0.05 g of purified Car powder was
dissolved in 2 ml D2O at 70 oC by stirring for 10 minutes. In order to reduce the viscosity, the
solution was sonicated during 10 minutes using an ultrasound sonicator (Vibra-cellTM
75115)
operating at 30% amplitude. The solution was filtered through 0.45 μm pore size filters. 1H
NMR spectra were obtained for solutions at 80 oC with a Bruker spectrometer operating at 400
MHz. The number of scans was 256.
2.2.3. Yield, moisture and mineral content determination
The residual water in dried seaweed was obtained by weighing before and after drying
process. Moisture content (W %) was calculated as:
(2.6)
where Wb and Wa are the weight of seaweed before and after drying.

40
The moisture content of the raw and purified Car powders was determined by thermo-
gravimetric analysis (TGA). Approximately 7 mg of the samples was heated from room
temperature at 20°C per minute up to 200°C in a Q500 TA instrument (USA), combined with
TA instrument universal analysis 2000 software. The moisture content (%) was determined by
the stable weight loss (%) at a temperature around 170°C.
The yield of Car before and after purification was defined as the mass of extracted
material divided by the mass of dry seaweed .
The quantity of sodium, potassium and calcium in the powders was determined using
flame atomic absorption spectrometry as described by Noël et al 7. The concentrations of the
elements were determined from calibration curves of the standard elements. The results were
expressed in mg per gram powder.
2.2.4. Rheology
The rheological properties were determined using a stress-controlled rheometer
(ARG2, TA Instruments) in combination with a cone – plate or plate – plate geometry. The
temperature was controlled by a Peltier system and the periphery of the samples was covered
with a thin layer of paraffin oil to prevent water evaporation. Carrageenan solutions were
loaded unto the rheometer at high temperatures where they were liquid. Oscillatory storage
(G’) and loss (G”) moduli were determined as a function of time, the frequency and the
temperature in the linear response regime. The viscosity was measured as a function of the
shear rate and the zero shear viscosity (0) value was taken in the linear response regime.
Results obtained with increasing and decreasing shear rates were the same.
2.2.5. Turbidity
The turbidity of individual carrageenan solutions and mixtures was done at a wavelength
of 600 nm as a function of the temperature in 1 cm quartz cuvettes using a UV-visible
spectrometer Varian Cary - 50 Bio. The temperature was varied from 80°C to 5°C at a rate of
approximately 1°C/ min.
2.2.6. Confocal Laser Scanning Microscopy (CLSM)
2.2.6.1. CLSM observations

41
The κ- and ι-car were visualized separately by using different fluorescent labelling:
FITC or RBITC. CLSM observations were made with a Zeiss LSM800 (Germany). The
images of 512 x 512 pixels were produced at different zooms with objective 63. The solutions
were inserted between a concave slide and a coverslip and hermetically sealed. The incident
light was emitted by a laser beam at 543 and/or 488 nm. The signal from FITC was collected
at wavelengths below 520 nm where RBITC does not emit light. The signal from RBITC was
detected at wavelengths above 550 nm where FITC emits relatively little light.
Figure 2.5. An example of CLSM images (25x25 μm) of mixed Car in the presence of CaCl2 of
labelled κ-carrageenan with FITC (left) and labelled ι-car with RBITC (right).
2.2.6.2. Pair correlation function of CLSM images
The differences in the microstructure can be quantified by calculating the pair
correlation function (g(r)) of the fluorescence intensity fluctuations from the CSLM images:
g(r) =∑ ∑
∑ ∑
with | ⃗ ⃗| , (2.7)
where Ai is the fluorescence intensity of pixel i and r is the distance between pixels i and j.
Figure 2.6 shows an example of g(r) for different zooms and objectives before (a) and after
superposition (b). Results from three magnifications were combined to increase the range of r
(figure 2.6c), see ref 8 for more detail on this method. It was verified that the fluorescence

42
intensity was linearly proportional to the carrageenan concentration in the range observed
here. This means that g(r) represents the pair correlation function of the carrageenan
concentration fluctuations. The value of g(r0) characterizes the amplitude of concentration
fluctuations and the distance r at which g(r) become zero characterizes the length scale of the
concentration fluctuations.
a
r (m)
0.1 1 10
g (
r)
1.00
1.02
1.04
1.06
Objective 25, zoom 1
Objective 63, zoom 1
Objective 63, zoom 4
b
r (m)
0.1 1 10
g (
r)
1.00
1.02
1.04
1.06
Objective 25, zoom 1
Objective 63, zoom 1
Objective 63, zoom 4
c
r (m)
0.1 1 10
g (
r)
1.00
1.02
1.04
1.06
g(r)
Figure 2.6. g(r) as a function of r for different zooms and objectives before (a) and after
superposition (b), (c)

43
2.2.6.3. Fluorescence recovery after photobleaching
Fluorescence recovery after photobleaching (FRAP) is a widely used method to obtain
information on the dynamics of fluorescently labelled molecules. Experimentally, the sample
is imaged with a low intensity laser to verify that the sample is not bleached by the laser
during the recovery phase 9. Subsequently, the intensity is increased to maximum to bleach
interesting regions for a very short time. After bleaching, unbleached fluorescent molecules
from the surroundings gradually diffuse into the bleached region, whereas bleached
fluorescent molecules diffuse out. The rate of fluorescence recovery depends on the mobility
of molecules. If the exchange is caused by Brownian motion, the diffusion coefficient can be
evaluated from analyzing the fluorescence recovery. If not all fluorescent molecules are
mobile the recovery is only partial and the fraction of mobile molecules is equal to the fraction
of the fluorescence that is recovered.
In a typical FRAP measurement, the images and fluorescence recovery are shown in
Figure 2.7. The fraction of molecules that has exchange in time t (F(t)) can be calculated from
fluorescence intensity after bleaching at the time t (It) 10
:
(2.8)
where Ii is the intensity before bleaching and Ib that just after bleaching. If all labelled
molecules diffuse with the same diffusion coefficient the intensity cross profile of a cylindrical
bleached area is Gaussian with a minimum at the centre of the area. Fits to the intensity
distribution of the image as a function of time yields the diffusion coefficient (D). The time
dependence of the intensity of all the pixels in the image was analyzed using a fit routine
developed by Jonasson et al 11
. The time dependence of the recovery is given by:
F(t)=exp(-2/t)[I0(2/t)+I1(2/t)], (2.9)
where = w2/4D is the characteristic time needed to diffuse out of the bleached area with
radius w and I0 and I1 are Bessel functions 12
.

44
If a sample is heterogeneous, the observed recovery depends where the sample is
bleached and the size of the bleached area 13
. However, if the bleached area is much larger
than the length scale of the heterogeneities an average mobility will be detected.
Figure 2.7. Typical fluorescence recovery images of 2% gelatin gel at 25 °C (A)(Hagman et
al14
), and curves (B) (Klein et al 10
) in a FRAP experiment
In our experiments, the Car solutions were inserted at high temperatures, where they
were liquid, between a concave slide and a cover slip that was sealed and then cooled down to
20°C at which temperature all FRAP measurements were done. Circular areas with radius w =
10 µm were bleached and the fluorescence recovery was probed by taking images of size 110
x 110 µm. After bleaching first 33 images were taken at time intervals of Δt = 0.6 s, followed
by images with increasing Δt in order to obtain representative images of the recovery on a
logarithmic time scale. Care was taken that the total number of images taken during detection
of the recovery did not lead to significant additional bleaching.
2.2.7. Release of unbound carrageenan from gels
In order to investigate the release of unbound Car from the gels, 50g of κ-car gel at
C=10g/L and KCl=50 mM was cut into small pieces (2mm3) and added to 350ml water
containing the same salt concentration as in the gel, see Figure 2.8. The suspension was kept
t= 0
t=1s
t=5s
B
Ii
It
Ft
Ib
t=0s
t=1s
s
t=5s
s

45
while stirring at 10 rpm. At regular intervals the release of Car into the supernatant was
checked by measuring the light scattering intensity. The same protocol was applied for a ι-car
gel at C=10g/L and CaCl2=50 mM.
Figure 2.8. Schematic representation of the method to release of unbound Car from the gels
10 rpm
Gel 50 mM K
+
/ Ca2+
46
References
1. Hung, L. D., Hori, K., Nang, H. Q., Kha, T. & Hoa, L. T. Seasonal changes in growth
rate, carrageenan yield and lectin content in the red alga Kappaphycus alvarezii
cultivated in Camranh Bay, Vietnam. J. Appl. Phycol. 21, 265–272 (2009).
2. Montolalu, R. I., Tashiro, Y., Matsukawa, S. & Ogawa, H. Effects of extraction
parameters on gel properties of carrageenan from Kappaphycus alvarezii (Rhodophyta).
J. Appl. Phycol. 20, 521–526 (2008).
3. Heilig, A., Göggerle, A. & Hinrichs, J. Multiphase visualisation of fatcontaining β-
lactoglobulin-κ-carrageenan gels by confocal scanning laser microscopy, using a novel
dye, V03-01136, for fat staining. LWT - Food Sci. Technol. 42, 646–653 (2009).
4. Berne, B. J. & Pecora, R. Dynamic Light Scattering. Br. Polym. J. 177 (1976).
5. van De Velde, F., Pereira, L. & Rollema, H. S. The revised NMR chemical shift data of
carrageenans. Carbohydr. Res. 339, 2309–2313 (2004).
6. Tojo, E. & Prado, J. A simple 1H NMR method for the quantification of carrageenans in
blends. Carbohydr. Poly. 53, 325–329 (2003).
7. Noël, L., Carl, M., Vastel, C. & Guérin, T. Determination of sodium, potassium,
calcium and magnesium content in milk products by flame atomic absorption
spectrometry (FAAS): A joint ISO/IDF collaborative study. Int. Dairy J. 18, 899–904
(2008).
8. Ako, K., Durand, D., Nicolai, T. & Becu, L. Quantitative analysis of confocal laser
scanning microscopy images of heat-set globular protein gels. Food Hydrocoll. 23,
1111–1119 (2009).
9. Lorén, N. et al. Fluorescence recovery after photobleaching in material and life
sciences : putting theory into practice. Q. Rev. Biophys. 3, 323–387 (2015).
10. Klein, C. & Waharte, F. Analysis of molecular mobility by fluorescence recovery after
photobleaching in living cells. In Microscopy: Science, Technology, Applications and
Education, 772–783 (Formatex, 2010).
11. Jonasson, J. K., Lorén, N., Olofsson, P., Nydén, M. & Rudemo, M. A pixel-based

47
likelihood framework for analysis of fluorescence recovery after photobleaching data. J.
Microsc. 232, 260–269 (2008).
12. Soumpasis, D. M. Brief communication theoretical analysis of fluorescence
photobleaching recovery experiments. Biophys. J. 41, 95–97 (1983).
13. Lorén, N., Nydén, M. & Hermansson, A. Determination of local diffusion properties in
heterogeneous biomaterials. Adv. Colloid Interface Sci. 150, 5–15 (2009).
14. Hagman, J., Lorén, N. & Hermansson, A. M. Effect of gelatin gelation kinetics on
probe diffusion determined by FRAP and rheology. Biomacromolecules 11, 3359–3366
(2010).

48
Chapter 3
Characterization and Rheological Properties of Carrageenan
Extracted from Different Red Algae Species
3.1. Introduction
The various species of Rhodophyta including Gigartina, Chondrus, Kappaphycus,
Eucheuma and Hypnea 1–4
are well known for extraction of Car. Extracts from different
species yield different types of Car with different functional properties. The genera
Kappaphycus and Hypnea are principally used for extraction of κ-car 4–7
, Eucheuma is the
main source of ι-car 4,8
and Chondrus is used to extract λ-car 9. Ruth et al
10,11 showed that
extracts from Gigartina predominantely contained λ- and ξ-car. β-, θ-, µ-, ξ- and ν-car are
known as bioprecursors and are present in low amounts in the extracts of all mentioned
species. Their presence in Car powder has undesirable effects on the gelling properties.
Many parameters influence the yield and quality of Car including processing methods
12–15, cultivation conditions
16,17 and storage conditions
18. For instance, using alkali treatment
removes some of the sulfate groups and modifies the functional properties 12,14,16,19
. Hoffman
et al 20
compared alkali treated Car with untreated Car. The results showed that there was an
increase in 3,6-anhydro-D-galactose residues from 37.4 to 44.8 (mol%) and a decrease of
sulfate groups from 25.5 to 17.5 wt%. Moses et al 14
found that the optimum concentration of
KOH solution to treat Kappaphycus alvarezii was 6-12% (w/v). Studies of the parameters
affecting the yield and quality of Kappaphycus alvarezii by Hung et al 16
and Hayashi et al 17
showed that the highest productivity was obtained from seaweed when cultured in the winter
season between 44 and 59 days 17,21
. Hayashi et al 17
also found that from the 59th
day of
cultivation there was a significantly increase of the iota Car fraction in the extract from
Kappaphycus alvarezii.
In this chapter, four species of red algae cultured at Cam Ranh Bay in Khanh Hoa
province of Vietnam: Kappaphycus alvarezii (Ka), Kappaphycus striatum (Ks), Kappaphycus
melasianus (Km) and Euchuma denticulatum (Ed) were selected. We aimed to characterize the
chemical structure and the physico-chemical properties of the extracted Car in the native state.
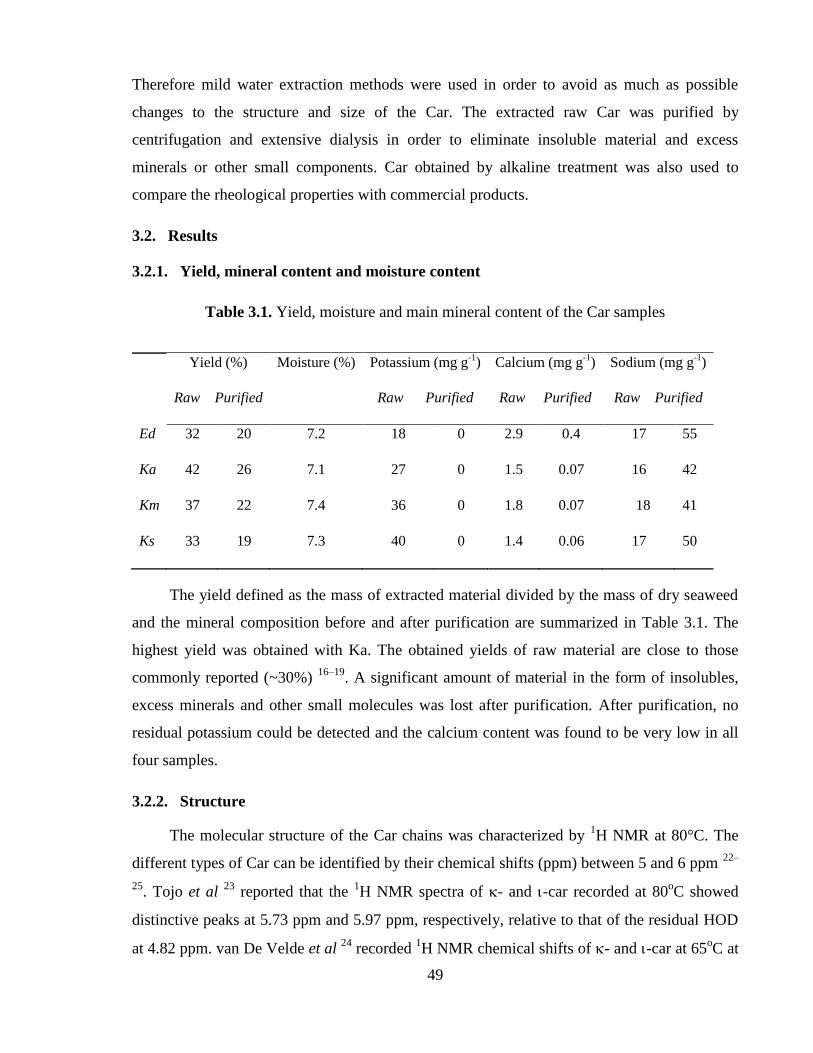
49
Therefore mild water extraction methods were used in order to avoid as much as possible
changes to the structure and size of the Car. The extracted raw Car was purified by
centrifugation and extensive dialysis in order to eliminate insoluble material and excess
minerals or other small components. Car obtained by alkaline treatment was also used to
compare the rheological properties with commercial products.
3.2. Results
3.2.1. Yield, mineral content and moisture content
Table 3.1. Yield, moisture and main mineral content of the Car samples
Yield (%)
Raw Purified
Moisture (%) Potassium (mg g-1
)
Raw Purified
Calcium (mg g-1
)
Raw Purified
Sodium (mg g-1
)
Raw Purified
Ed 32 20 7.2 18 0 2.9 0.4 17 55
Ka 42 26 7.1 27 0 1.5 0.07 16 42
Km 37 22 7.4 36 0 1.8 0.07 18 41
Ks 33 19 7.3 40 0 1.4 0.06 17 50
The yield defined as the mass of extracted material divided by the mass of dry seaweed
and the mineral composition before and after purification are summarized in Table 3.1. The
highest yield was obtained with Ka. The obtained yields of raw material are close to those
commonly reported (~30%) 16–19
. A significant amount of material in the form of insolubles,
excess minerals and other small molecules was lost after purification. After purification, no
residual potassium could be detected and the calcium content was found to be very low in all
four samples.
3.2.2. Structure
The molecular structure of the Car chains was characterized by 1H NMR at 80°C. The
different types of Car can be identified by their chemical shifts (ppm) between 5 and 6 ppm 22–
25. Tojo et al
23 reported that the
1H NMR spectra of - and -car recorded at 80
oC showed
distinctive peaks at 5.73 ppm and 5.97 ppm, respectively, relative to that of the residual HOD
at 4.82 ppm. van De Velde et al 24
recorded 1H NMR chemical shifts of - and -car at 65
oC at
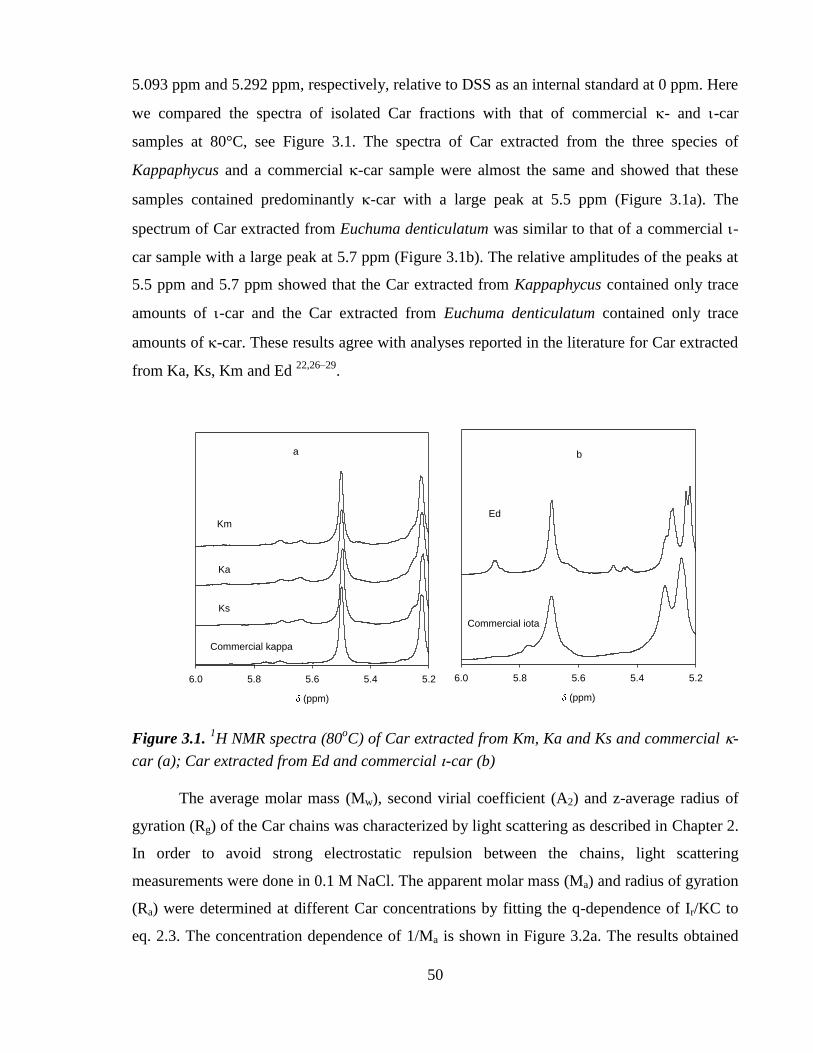
50
5.093 ppm and 5.292 ppm, respectively, relative to DSS as an internal standard at 0 ppm. Here
we compared the spectra of isolated Car fractions with that of commercial - and -car
samples at 80°C, see Figure 3.1. The spectra of Car extracted from the three species of
Kappaphycus and a commercial -car sample were almost the same and showed that these
samples contained predominantly -car with a large peak at 5.5 ppm (Figure 3.1a). The
spectrum of Car extracted from Euchuma denticulatum was similar to that of a commercial -
car sample with a large peak at 5.7 ppm (Figure 3.1b). The relative amplitudes of the peaks at
5.5 ppm and 5.7 ppm showed that the Car extracted from Kappaphycus contained only trace
amounts of -car and the Car extracted from Euchuma denticulatum contained only trace
amounts of -car. These results agree with analyses reported in the literature for Car extracted
from Ka, Ks, Km and Ed 22,26–29
.
Figure 3.1. 1H NMR spectra (80
oC) of Car extracted from Km, Ka and Ks and commercial -
car (a); Car extracted from Ed and commercial -car (b)
The average molar mass (Mw), second virial coefficient (A2) and z-average radius of
gyration (Rg) of the Car chains was characterized by light scattering as described in Chapter 2.
In order to avoid strong electrostatic repulsion between the chains, light scattering
measurements were done in 0.1 M NaCl. The apparent molar mass (Ma) and radius of gyration
(Ra) were determined at different Car concentrations by fitting the q-dependence of Ir/KC to
eq. 2.3. The concentration dependence of 1/Ma is shown in Figure 3.2a. The results obtained
Commercial kappa
(ppm)
5.25.45.65.86.0
Ks
Ka
Km
a
Ed
(ppm)
5.25.45.65.86.0
Commercial iota
b
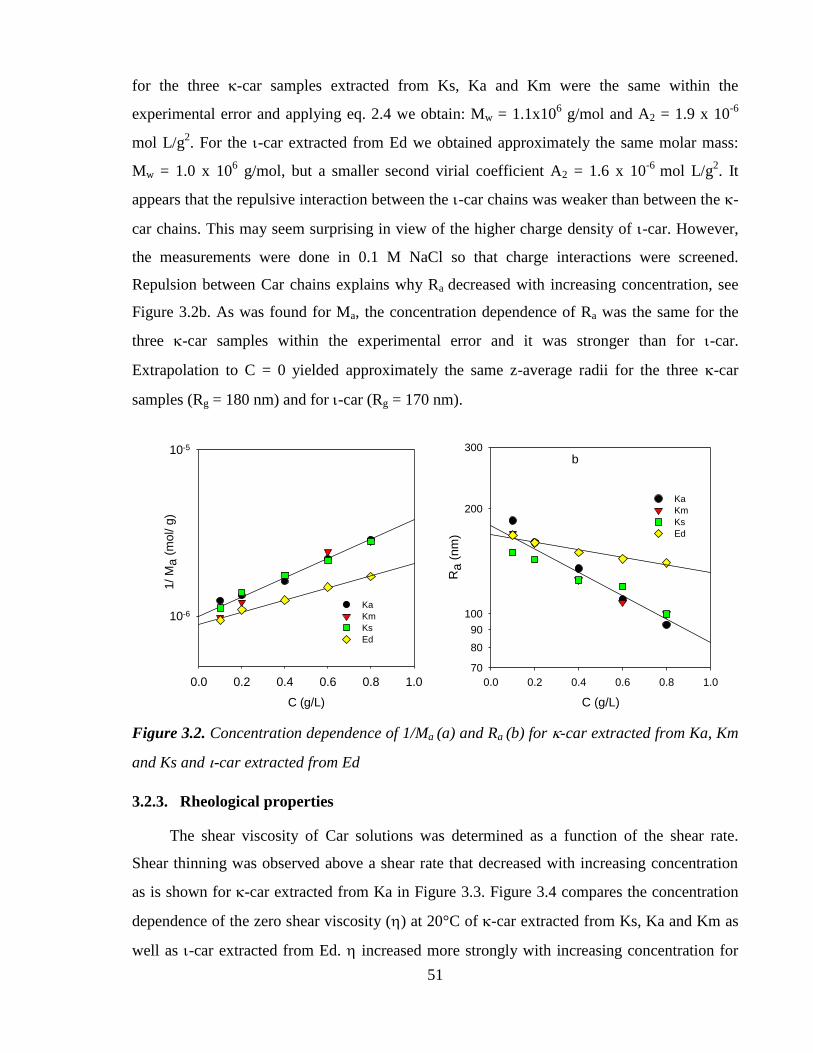
51
for the three -car samples extracted from Ks, Ka and Km were the same within the
experimental error and applying eq. 2.4 we obtain: Mw = 1.1x10⁶ g/mol and A2 = 1.9 x 10
-6
mol L/g2. For the -car extracted from Ed we obtained approximately the same molar mass:
Mw = 1.0 x 10⁶ g/mol, but a smaller second virial coefficient A2 = 1.6 x 10
-6 mol L/g
2. It
appears that the repulsive interaction between the -car chains was weaker than between the -
car chains. This may seem surprising in view of the higher charge density of -car. However,
the measurements were done in 0.1 M NaCl so that charge interactions were screened.
Repulsion between Car chains explains why Ra decreased with increasing concentration, see
Figure 3.2b. As was found for Ma, the concentration dependence of Ra was the same for the
three -car samples within the experimental error and it was stronger than for -car.
Extrapolation to C = 0 yielded approximately the same z-average radii for the three -car
samples (Rg = 180 nm) and for -car (Rg = 170 nm).
C (g/L)
0.0 0.2 0.4 0.6 0.8 1.0
1/ M
a (
mol/ g
)
10-6
10-5
Ka
Km
Ks
Ed
Figure 3.2. Concentration dependence of 1/Ma (a) and Ra (b) for -car extracted from Ka, Km
and Ks and -car extracted from Ed
3.2.3. Rheological properties
The shear viscosity of Car solutions was determined as a function of the shear rate.
Shear thinning was observed above a shear rate that decreased with increasing concentration
as is shown for -car extracted from Ka in Figure 3.3. Figure 3.4 compares the concentration
dependence of the zero shear viscosity () at 20°C of -car extracted from Ks, Ka and Km as
well as -car extracted from Ed. increased more strongly with increasing concentration for
b
C (g/L)
0.0 0.2 0.4 0.6 0.8 1.0
Ra (
nm
)
70
80
90
100
200
300
Ka
Km
Ks
Ed
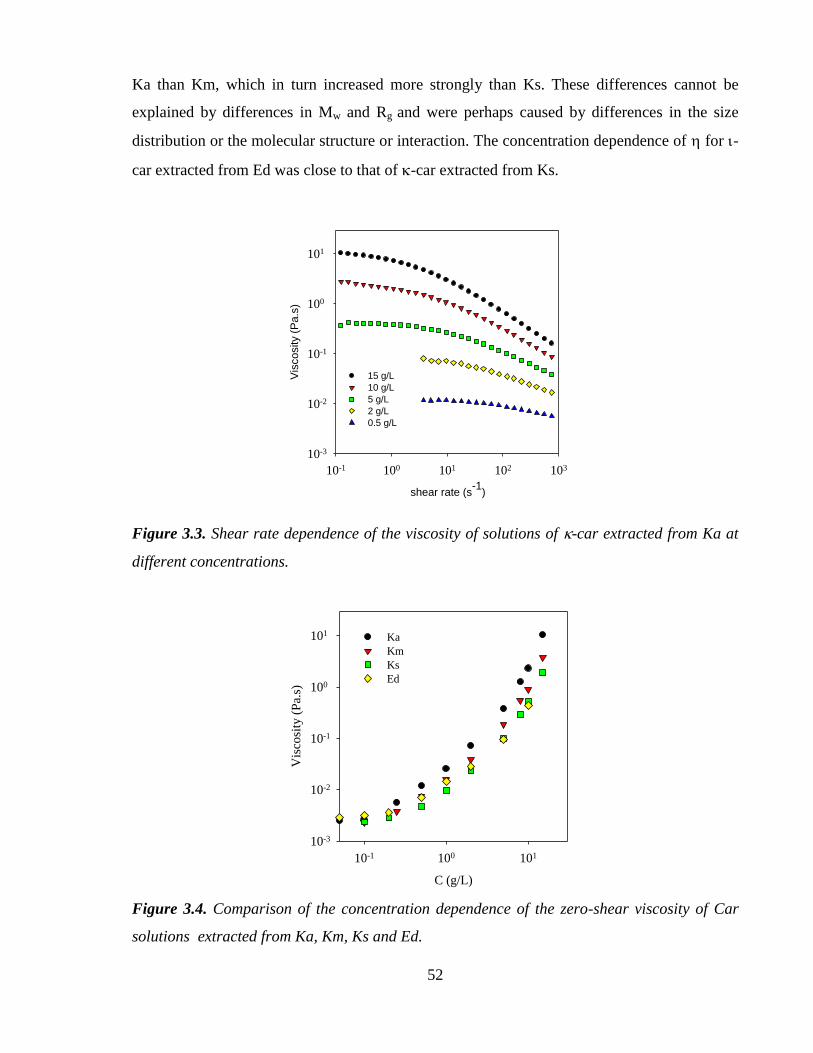
52
Ka than Km, which in turn increased more strongly than Ks. These differences cannot be
explained by differences in Mw and Rg and were perhaps caused by differences in the size
distribution or the molecular structure or interaction. The concentration dependence of for -
car extracted from Ed was close to that of -car extracted from Ks.
shear rate (s-1
)
10-1 100 101 102 103
Vis
cosity (
Pa
.s)
10-3
10-2
10-1
100
101
15 g/L
10 g/L
5 g/L
2 g/L
0.5 g/L
Figure 3.3. Shear rate dependence of the viscosity of solutions of -car extracted from Ka at
different concentrations.
C (g/L)
10-1 100 101
Vis
cosi
ty (
Pa.
s)
10-3
10-2
10-1
100
101 Ka
Km
Ks
Ed
Figure 3.4. Comparison of the concentration dependence of the zero-shear viscosity of Car
solutions extracted from Ka, Km, Ks and Ed.
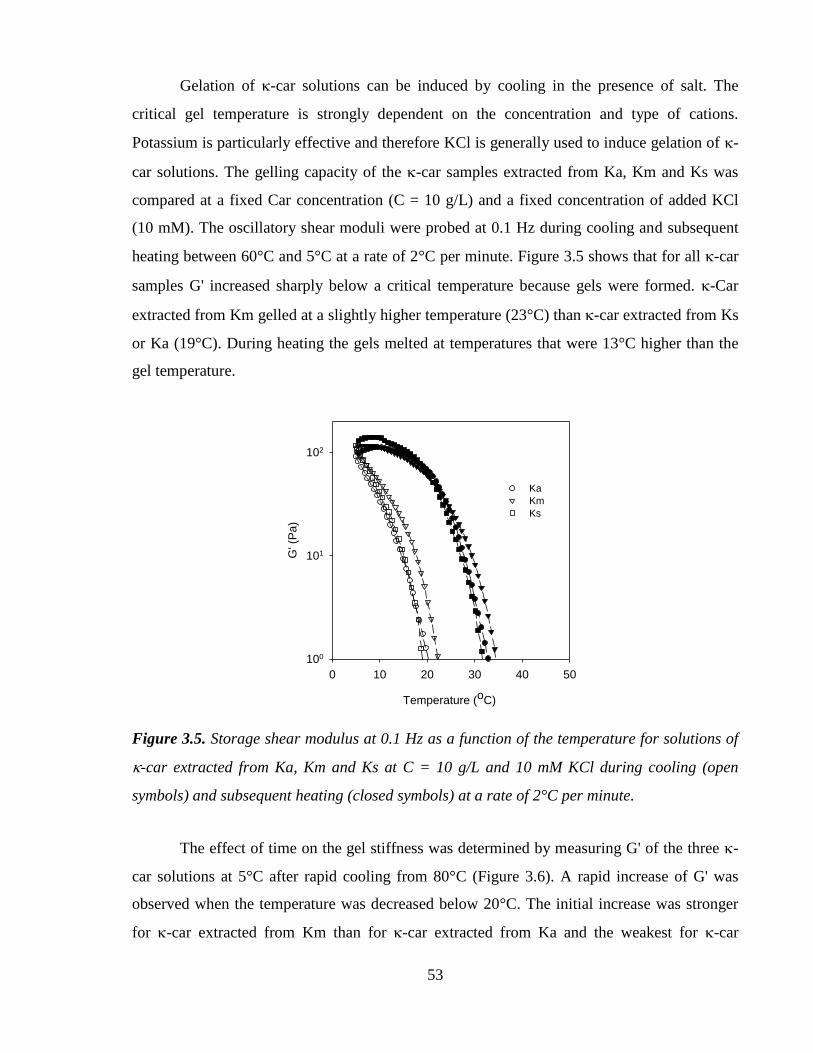
53
Gelation of -car solutions can be induced by cooling in the presence of salt. The
critical gel temperature is strongly dependent on the concentration and type of cations.
Potassium is particularly effective and therefore KCl is generally used to induce gelation of -
car solutions. The gelling capacity of the -car samples extracted from Ka, Km and Ks was
compared at a fixed Car concentration (C = 10 g/L) and a fixed concentration of added KCl
(10 mM). The oscillatory shear moduli were probed at 0.1 Hz during cooling and subsequent
heating between 60°C and 5°C at a rate of 2°C per minute. Figure 3.5 shows that for all -car
samples G' increased sharply below a critical temperature because gels were formed. -Car
extracted from Km gelled at a slightly higher temperature (23°C) than -car extracted from Ks
or Ka (19°C). During heating the gels melted at temperatures that were 13°C higher than the
gel temperature.
Figure 3.5. Storage shear modulus at 0.1 Hz as a function of the temperature for solutions of
-car extracted from Ka, Km and Ks at C = 10 g/L and 10 mM KCl during cooling (open
symbols) and subsequent heating (closed symbols) at a rate of 2°C per minute.
The effect of time on the gel stiffness was determined by measuring G' of the three -
car solutions at 5°C after rapid cooling from 80°C (Figure 3.6). A rapid increase of G' was
observed when the temperature was decreased below 20°C. The initial increase was stronger
for -car extracted from Km than for -car extracted from Ka and the weakest for -car
Temperature (oC)
0 10 20 30 40 50
G' (
Pa
)
100
101
102
Ka
Km
Ks
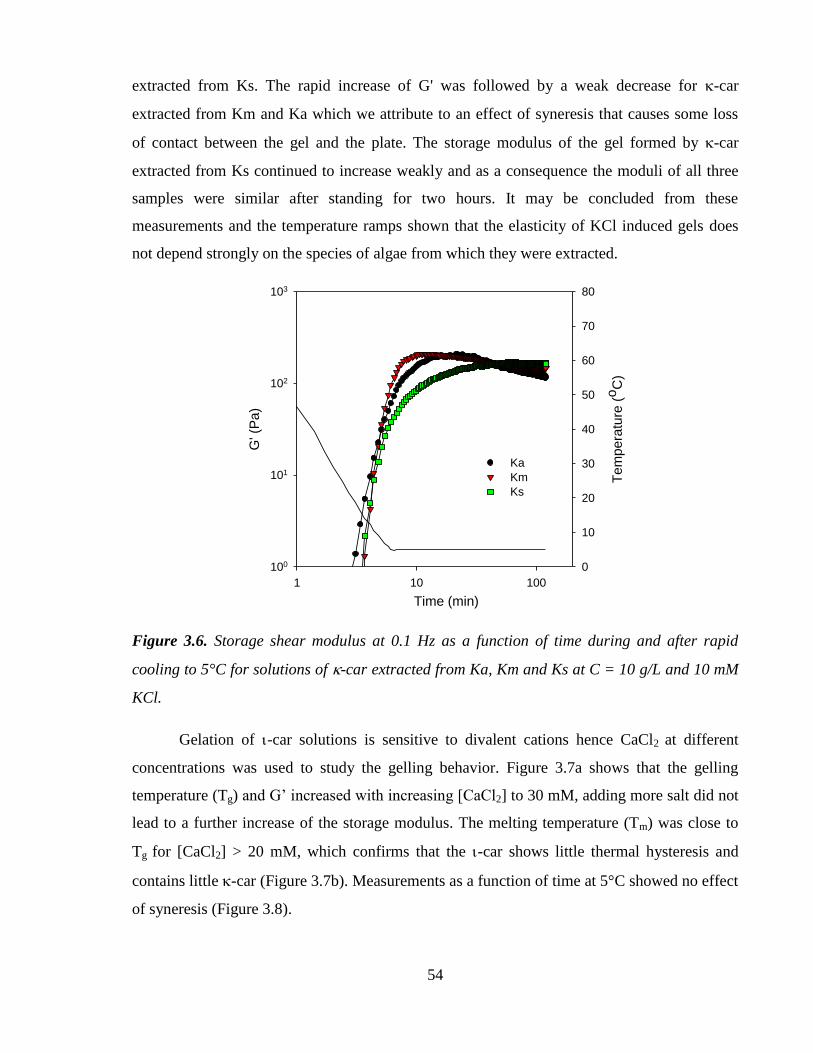
54
extracted from Ks. The rapid increase of G' was followed by a weak decrease for -car
extracted from Km and Ka which we attribute to an effect of syneresis that causes some loss
of contact between the gel and the plate. The storage modulus of the gel formed by -car
extracted from Ks continued to increase weakly and as a consequence the moduli of all three
samples were similar after standing for two hours. It may be concluded from these
measurements and the temperature ramps shown that the elasticity of KCl induced gels does
not depend strongly on the species of algae from which they were extracted.
Time (min)
1 10 100
G' (
Pa)
100
101
102
103
Tem
pera
ture
(oC
)
0
10
20
30
40
50
60
70
80
Ka
Km
Ks
Figure 3.6. Storage shear modulus at 0.1 Hz as a function of time during and after rapid
cooling to 5°C for solutions of -car extracted from Ka, Km and Ks at C = 10 g/L and 10 mM
KCl.
Gelation of -car solutions is sensitive to divalent cations hence CaCl2 at different
concentrations was used to study the gelling behavior. Figure 3.7a shows that the gelling
temperature (Tg) and G’ increased with increasing [CaCl2] to 30 mM, adding more salt did not
lead to a further increase of the storage modulus. The melting temperature (Tm) was close to
Tg for [CaCl2] > 20 mM, which confirms that the -car shows little thermal hysteresis and
contains little -car (Figure 3.7b). Measurements as a function of time at 5°C showed no effect
of syneresis (Figure 3.8).
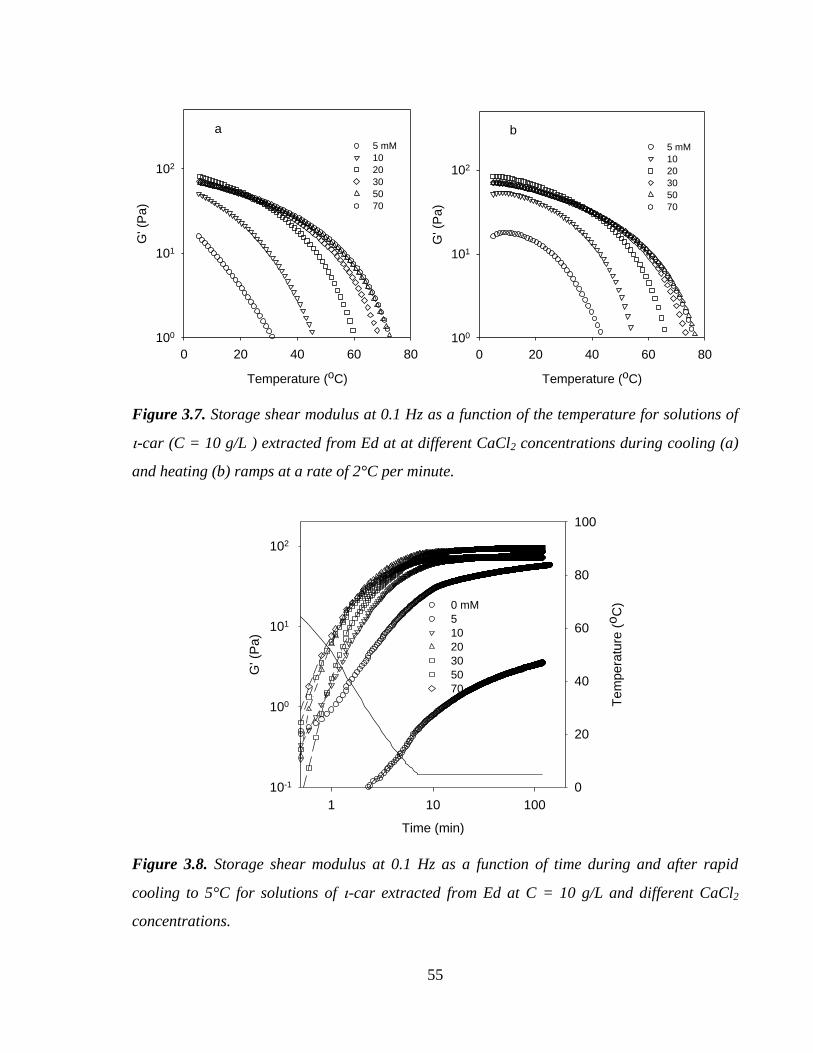
55
Figure 3.7. Storage shear modulus at 0.1 Hz as a function of the temperature for solutions of
-car (C = 10 g/L ) extracted from Ed at at different CaCl2 concentrations during cooling (a)
and heating (b) ramps at a rate of 2°C per minute.
Figure 3.8. Storage shear modulus at 0.1 Hz as a function of time during and after rapid
cooling to 5°C for solutions of -car extracted from Ed at C = 10 g/L and different CaCl2
concentrations.
a
Temperature (oC)
0 20 40 60 80
G' (P
a)
100
101
102
5 mM
10
20
30
50
70
b
Temperature (oC)
0 20 40 60 80
G' (P
a)
100
101
102
5 mM
10
20
30
50
70
Time (min)
1 10 100
G' (
Pa)
10-1
100
101
102
Tem
pera
ture
(o
C)
0
20
40
60
80
100
0 mM
5
10
20
30
50
70
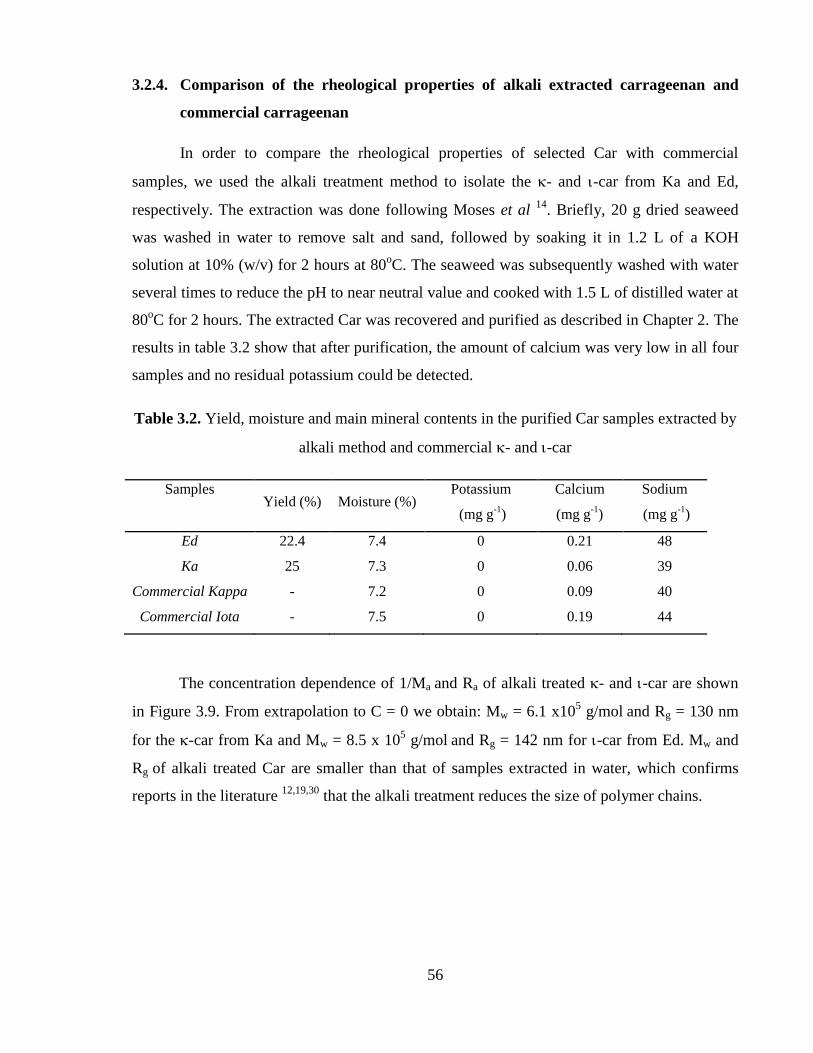
56
3.2.4. Comparison of the rheological properties of alkali extracted carrageenan and
commercial carrageenan
In order to compare the rheological properties of selected Car with commercial
samples, we used the alkali treatment method to isolate the - and -car from Ka and Ed,
respectively. The extraction was done following Moses et al 14
. Briefly, 20 g dried seaweed
was washed in water to remove salt and sand, followed by soaking it in 1.2 L of a KOH
solution at 10% (w/v) for 2 hours at 80oC. The seaweed was subsequently washed with water
several times to reduce the pH to near neutral value and cooked with 1.5 L of distilled water at
80oC for 2 hours. The extracted Car was recovered and purified as described in Chapter 2. The
results in table 3.2 show that after purification, the amount of calcium was very low in all four
samples and no residual potassium could be detected.
Table 3.2. Yield, moisture and main mineral contents in the purified Car samples extracted by
alkali method and commercial - and -car
Samples Yield (%) Moisture (%)
Potassium
(mg g-1
)
Calcium
(mg g-1
)
Sodium
(mg g-1
)
Ed 22.4 7.4 0 0.21 48
Ka 25 7.3 0 0.06 39
Commercial Kappa - 7.2 0 0.09 40
Commercial Iota - 7.5 0 0.19 44
The concentration dependence of 1/Ma and Ra of alkali treated - and -car are shown
in Figure 3.9. From extrapolation to C = 0 we obtain: Mw = 6.1 x10⁵ g/mol
and Rg = 130 nm
for the -car from Ka and Mw = 8.5 x 10⁵ g/mol
and Rg = 142 nm for -car from Ed. Mw and
Rg of alkali treated Car are smaller than that of samples extracted in water, which confirms
reports in the literature 12,19,30
that the alkali treatment reduces the size of polymer chains.

57
Figure 3.9. Concentration dependence of 1/Ma (a) and Ra (b) for alkali treated - and -car
extracted from Ed and Ka, respectively.
Figure 3.10. Storage shear modulus at 0.1 Hz as a function of the temperature during cooling
(open symbols) and subsequent heating (closed symbols) at a rate of 2°C/min (a) and as a
function of time during and after rapid cooling to 5°C (b) for solutions of -car from Ka
(alkali treatment) and a commercial product at C = 10 g/L and 10 mM KCl.
a
C (g/ L)
0.0 0.2 0.4 0.6 0.8 1.0 1.2
1/ M
a (
mo
l/ g
)
10-6
10-5
Ka
Ed
b
C (g/ L)
0.0 0.2 0.4 0.6 0.8 1.0 1.2
Ra
(nm
)
70
80
90
100
200
300
Ka
Ed
a
Temperature (oC)
0 10 20 30 40 50
G' (
Pa
)
100
101
102
103
-car
Commercial car
b
Time (min)
1 10 100
G' (P
a)
100
101
102
103
Tem
pera
ture
(oC
)0
10
20
30
40
50
60
70
car
Commercial car

58
Figure 3.10 compares G’of alkali treated -car from Ka with commercial -car at C =
10 g/L and 10 mM KCl. Commercial -car gelled at a slightly higher temperature (20°C) than
-car extracted from Ka (19°C) (Figure 3.10a), but the gel stiffness measured after keeping the
samples at 5°C for 2 hours were not different (Figure 3.10b). The comparison was done also
for alkali treated and commercial -car at C = 10 g/L and 10 mM CaCl2, see Figure 3.11.
Interestingly, the gelling and melting temperatures of these two samples were exactly the
same, but the storage modulus of the commercial sample was lower than that extracted from
Ed.
Figure 3.11. Storage shear modulus at 0.1 Hz as a function of the temperature during cooling
(open symbols) and subsequent heating (closed symbols) at a rate of 2°C/min (a) and as a
function of time during and after rapid cooling to 5°C (b) for solutions of alkali treated -car
from Ed and a commercial products at C = 10 g/L and 10 mM CaCl2.
Comparing the rheological properties of - and -car obtained with (Figures 3.10, 3.11)
and without (Figures 3.5-3.8) alkali treatment shows that alkali treatment causes a strong
increase of G’. The increase of the gel stiffness is caused by a decrease of the content of
sulfate groups, which favors formation of stronger gels.
a
Temperature (oC)
0 20 40 60 80
G' (
Pa)
100
101
102
103
car
Commercial -car
b
Time (min)
1 10 100
G' (
Pa
)
100
101
102
Te
mp
era
ture
(oC
)
0
10
20
30
40
50
60
70
car
Commercial car

59
3.3. Conclusions
The yield of -car extracted from Ks and Km and -car extracted from Ed was between
32 and 37% and is somewhat higher (42%) for -car extracted from Ka. The size and molar
mass of the -car chains extracted from the three different subspecies of Kappaphycus was
within the experimental error the same and was slightly smaller for -car extracted from Ed.
Small differences were observed in the concentration dependence of the zero shear viscosity
with -car extracted from Ka giving the highest viscosity followed by -car extracted from Ks
and Km. The viscosity of -car extracted from Ed was close to that of -car extracted from
Km. Gelation of -car solutions could be induced by addition of small amounts of KCl. The
critical gel temperature depended weakly on the origin and was higher for -car extracted
from Ka than Ks, which was in turn a few degrees lower than for -car extracted from Km.
Gel stiffness of Car extracted from Ka and Ed after alkali treatment was larger than for water
extracted Car and close to that of commercial - and -car. The principal conclusion is that K.
alvarezii is the best choice for cultivation to yield -car at the Cam Ranh Bay in Khanh Hoa
province of Vietnam as it has the highest yield and has the best viscosifying and gelling
properties. Most likely, the same conclusion is valid also for cultivation in other areas.

60
References
1. Webber, V., Carvalho, S. M. de, Ogliari, P. J., Hayashi, L. & Barreto, P. L. M.
Optimization of the extraction of carrageenan from Kappaphycus alvarezii using
response surface methodology. Food Sci. Technol. 32, 812–818 (2012).
2. Estevez, J. M., Ciancia, M. & Cerezo, A. S. The system of low-molecular-weight
carrageenans and agaroids from the room-temperature-extracted fraction of
Kappaphycus alvarezii. Carbohydr. Res. 325, 287–299 (2000).
3. van de Velde, F. & Rollema, H. S. High Resolution NMR of Carrageenans. In Modern
Magnetic Resonance (ed. Webb, G. A.) 1605–1610 (Springer, Dordrecht, 2008).
4. van de Velde, F., Knutsen, S. H., Usov, A. I., Rollema, H. S. & Cerezo, A. S. 1H and
13C high resolution NMR spectroscopy of carrageenans: application in research and
industry. Trends Food Sci. Technol. 13, 73–92 (2002).
5. McHugh Dennis J. FAO Fisheries Technical Paper 441. A guide to the seaweed
industry, (2003).
6. E. Vázquez-Delfín & D. Robledo & Y. Freile-Pelegrín. Microwave-assisted extraction
of the carrageenan from Hypnea musciformis (Cystocloniaceae, Rhodophyta ). J. Appl.
Phycol. 26, 901–907 (2013).
7. Vanina A. Cosenzaa, Diego A. Navarroa, Eliana N. Fissoreb, Ana M. Rojasb, C. A. S.
Chemical and rheological characterization of the carrageenans from Hypnea
musciformis (Wulfen) Lamoroux. Carbohydr. Polym. 102, 780–789 (2014).
8. Piculell, L., Nilsson, S. & Muhrbeck, P. Effects of small amounts of kappa-carrageenan
on the rheology of aqueous iota-carrageenan. Carbohydr. Polym. 18, 199–208 (1992).
9. Collén, J. et al. Chondrus crispus - A present and historical model organism for red
seaweeds. In Advances in Botanical Research 71, 53–89 (Elsevier, 2014).
10. Falshaw, R. & Furneaux, R. H. Carrageenans from the tetrasporic stages of Gigartina
clavifera and Gigartina alveata. Carbohydr. Res. 276, 155–165 (1995).
11. Falshaw, R. & Furneaux, R. H. Carrageenan from the tetrasporic stage of Gigartina
decipiens ( Gigartinaceae , Rhodophyta ). Carbohydr. Res. 252, 171–182 (1994).

61
12. Bono, A., Anisuzzaman, S. M. & Ding, O. W. Effect of process conditions on the gel
viscosity and gel strength of semi-refined carrageenan (SRC) produced from seaweed
(Kappaphycus alvarezii). J. King Saud Univ. - Eng. Sci. 26, 3–9 (2014).
13. Chan, P. T. & Matanjun, P. Chemical composition and physicochemical properties of
tropical red seaweed, Gracilaria changii. Food Chem. 221, 302–310 (2017).
14. Moses, J., Anandhakumar, R. & Shanmugam, M. Effect of alkaline treatment on the
sulfate content and quality of semi-refined carrageenan prepared from seaweed
Kappaphycus alvarezii Doty (Doty) farmed in Indian waters. African J. Biotechnol. 14,
1584–1589 (2015).
15. Karlsson, A. & Singh, S. K. Acid hydrolysis of sulphated polysaccharides.
Desulphation and the effect on molecular mass. Carbohydr. Polym. 38, 7–15 (1999).
16. Hung, L. D., Hori, K., Nang, H. Q., Kha, T. & Hoa, L. T. Seasonal changes in growth
rate, carrageenan yield and lectin content in the red alga Kappaphycus alvarezii
cultivated in Camranh Bay, Vietnam. J. Appl. Phycol. 21, 265–272 (2009).
17. Hayashi, L. et al. The effects of selected cultivation conditions on the carrageenan
characteristics of Kappaphycus alvarezii (Rhodophyta, Solieriaceae) in Ubatuba Bay,
São Paulo, Brazil. J. Appl. Phycol. 19, 505–511 (2007).
18. Hilliou, L. et al. The impact of seaweed life phase and postharvest storage duration on
the chemical and rheological properties of hybrid carrageenans isolated from
Portuguese Mastocarpus stellatus. Carbohydr. Polym. 87, 2655–2663 (2012).
19. Rhein-Knudsen, N., Ale, M. T., Ajalloueian, F., Yu, L. & Meyer, A. S. Rheological
properties of agar and carrageenan from Ghanaian red seaweeds. Food Hydrocoll. 63,
50–58 (2017).
20. Hoffmann, R. A., Gidley, M. J., Cooke, D. & Frith, W. J. Effect of isolation procedures
on the molecular composition and physical properties of Eucheuma cottonii
carrageenan. Top. Catal. 9, 281–289 (1995).
21. Ohno, M., Nang, H. Q. & Hirase, S. Cultivation and carrageenan yield and quality of
Kappaphycus alvarezii in the waters of Vietnam. J. of Applied Phycol. 8, 431–437
(1996).

62
22. van De Velde, F. et al. Coil-helix transition of ι-carrageenan as a function of chain
regularity. Biopolymers 65, 299–312 (2002).
23. Tojo, E. & Prado, J. A simple 1H NMR method for the quantification of carrageenans in
blends. Carbohydr. Polym. 53, 325–329 (2003).
24. van De Velde, F., Pereira, L. & Rollema, H. S. The revised NMR chemical shift data of
carrageenans. Carbohydr. Res. 339, 2309–2313 (2004).
25. van De Velde, F. et al. The structure of κ/ι-hybrid carrageenans II. Coil-helix transition
as a function of chain composition. Carbohydrate Research 340, 1113–1129 (2005).
26. Aguilan, J. T. et al. Structural analysis of carrageenan from farmed varieties of
Philippine seaweed. Bot. Mar. 46, 179–192 (2003).
27. Campo, V. L., Kawano, D. F., Silva, D. B. da & Carvalho, I. Carrageenans: Biological
properties, chemical modifications and structural analysis - A review. Carbohydr.
Polym. 77, 167–180 (2009).
28. Chan, S. W., Mirhosseini, H., Taip, F. S., Ling, T. C. & Tan, C. P. Comparative study
on the physicochemical properties of κ-carrageenan extracted from Kappaphycus
alvarezii (doty) doty ex Silva in Tawau, Sabah, Malaysia and commercial κ-
carrageenans. Food Hydrocoll. 30, 581–588 (2013).
29. Mendoza, W. G., Montaño, N. E., Ganzon-Fortes, E. T. & Villanueva, R. D. Chemical
and gelling profile of ice-ice infected carrageenan from Kappaphycus striatum
(Schmitz) Doty ‘sacol’ strain (Solieriaceae, Gigartinales, Rhodophyta). J. Appl. Phycol.
14, 409–418 (2002).
30. Azevedo, G., Torres, M. D., Sousa-pinto, I. & Hilliou, L. Effect of pre-extraction alkali
treatment on the chemical structure and gelling properties of extracted hybrid
carrageenan from Chondrus crispus and Ahnfeltiopsis devoniensis. Food Hydrocoll. 50,
150–158 (2015).

63
Chapter 4
Mixtures of Iota and Kappa-Carrageenan
4.1. Introduction
There are many types of Car, but only κ and ι-car are used widely in industry due to
their gelling properties. As was mentioned in Chapter 1, gels of κ-car or ι-car in aqueous
solution are formed below a critical temperature (Tc) caused by a conformational transition
from a random coil to a helix followed by association of the helices into a system spanning
network. Tc and the gel stiffness strongly depend on the type of Car, and the type and
concentration of ions that are present 1–8
. There is a huge number of reports on the gelling
properties of individual κ-car or individual ι-car in presence of typical ions, whereas few
reports have done on mixtures of these Car and the structure of mixed Car gels has not yet
been established.
Understanding gelation of mixtures of κ-car and ι-car is important not only because the
two types of Car are often present together in commercial samples, but also because the
synergetic rheological properties of mixtures compared to individual systems can potentially
be exploited in applications. Furthermore there is the interesting fundamental issue of how
these polysaccharides with the same chemical structure, but a different charge density, interact
during gelation.
As mentioned in Chapter 1, earlier studies of mixtures suggested formation of
bicontinuous microphase separated networks in mixed Car gels, but there is lack of
microscopic evidence to support this hypothesis. In this chapter, therefore gelation of mixtures
of κ-car and ι-car was investigated using confocal laser scanning microscopy and rheology in
parallel. All previous investigations on gelation of mixtures of κ-car and ι-car were done in the
presence of NaCl or KCl. Here we have used CaCl2 which leads to κ-car gels with a more
heterogeneous microstructure than in the presence of KCl and therefore allows us to better
observe the effect of ι-car on the gel structure. A few measurements were repeated using KCl
in order to assess the generality of the conclusions.
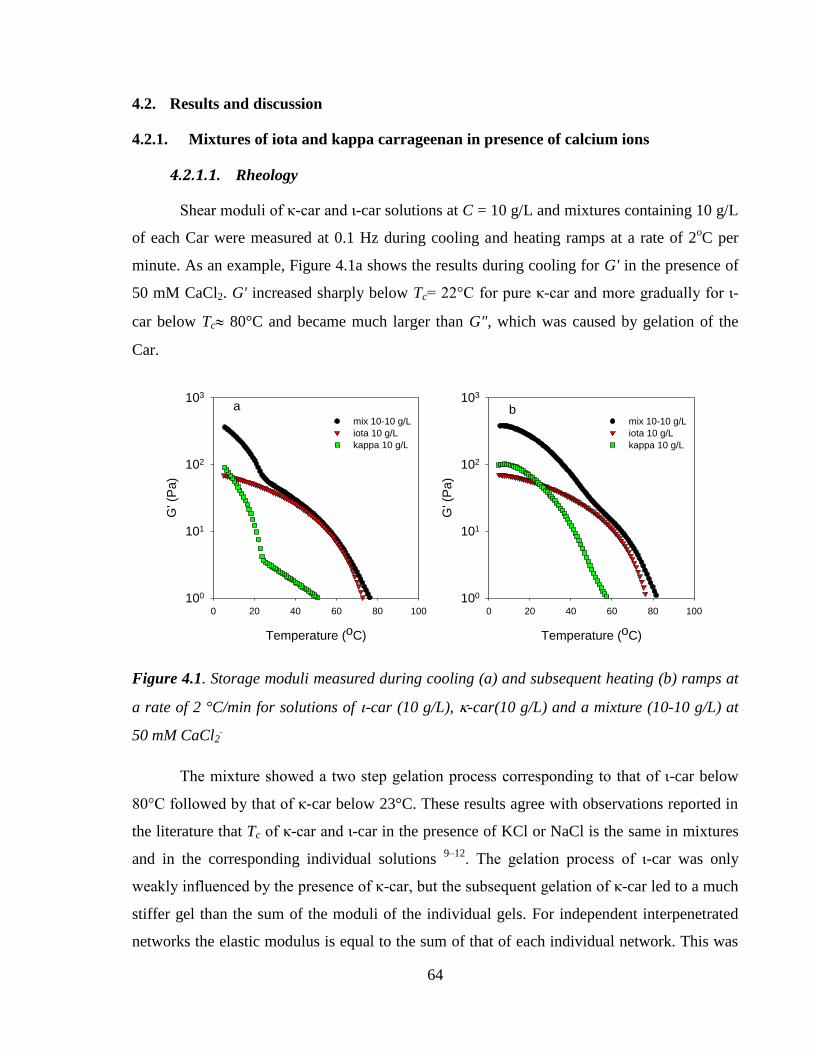
64
4.2. Results and discussion
4.2.1. Mixtures of iota and kappa carrageenan in presence of calcium ions
4.2.1.1. Rheology
Shear moduli of κ-car and ι-car solutions at C = 10 g/L and mixtures containing 10 g/L
of each Car were measured at 0.1 Hz during cooling and heating ramps at a rate of 2oC per
minute. As an example, Figure 4.1a shows the results during cooling for G' in the presence of
50 mM CaCl2. G' increased sharply below Tc= 22°C for pure κ-car and more gradually for ι-
car below Tc 80°C and became much larger than G", which was caused by gelation of the
Car.
Figure 4.1. Storage moduli measured during cooling (a) and subsequent heating (b) ramps at
a rate of 2 °C/min for solutions of -car (10 g/L), -car(10 g/L) and a mixture (10-10 g/L) at
50 mM CaCl2.
The mixture showed a two step gelation process corresponding to that of ι-car below
80°C followed by that of κ-car below 23°C. These results agree with observations reported in
the literature that Tc of κ-car and ι-car in the presence of KCl or NaCl is the same in mixtures
and in the corresponding individual solutions 9–12
. The gelation process of ι-car was only
weakly influenced by the presence of κ-car, but the subsequent gelation of κ-car led to a much
stiffer gel than the sum of the moduli of the individual gels. For independent interpenetrated
networks the elastic modulus is equal to the sum of that of each individual network. This was
Temperature (oC)
0 20 40 60 80 100
G' (
Pa
)
100
101
102
103
mix 10-10 g/L
iota 10 g/L
kappa 10 g/L
a
Temperature (oC)
0 20 40 60 80 100
G' (
Pa
)
100
101
102
103
mix 10-10 g/L
iota 10 g/L
kappa 10 g/L
b

65
clearly not the case when both ι-car and κ-car had gelled confirming the conclusion of Brenner
et al 11
for gels formed in the presence of KCl. Subsequent heating ramps showed that melting
of the κ-car and ι-car gels also occurred at the same temperatures as for the individual Car
solutions, see Figure 4.1b. κ-Car gels melted at significantly higher temperatures than Tc,
whereas for ι-car gelation and melting temperatures were close.
b
[CaCl2] (mM)
0 20 40 60 80 100
Gel (P
a)
101
102
103
mix 10- 10 g/L
car 20 g/L
car 20 g/L
car 10 g/L
car 10 g/L
Figure 4.2a. Critical temperature as a function of the CaCl2 concentration for -car (blue)
and ι-car (red) in individual solutions at C = 10g/L (circles) or C = 20g/L (triangles) as well
as in mixtures containing 5 g/L (squares) or 10 g/L (diamonds) of each Car.
Figure 4.2b. Elastic modulus after one hour at 5°C as a function of the CaCl2 concentration
for individual -car and -car gels at C = 10 g/L and 20 g/L and mixed Car gels containing 10
g/L of each Car.
Similar results were obtained at other CaCl2 concentrations ([CaCl2]). The dependence
of Tc on [CaCl2] is shown in Figure 4.2a. Additional results for Tc obtained for individual Car
solutions at C = 20 g/L and mixtures at C = 10 g/L are also shown. The experimental
uncertainty in the measured values of Tc can be estimated from the spread in the data and is
about 3°C. Tc is within the experimental uncertainty the same in mixtures and in individual
solutions and is independent of the Car concentration. For both types of Car, Tc increased with
- car
[CaCl2] (mM)
0 20 40 60 80 100
Tc (
°C)
0
20
40
60
80
100
a
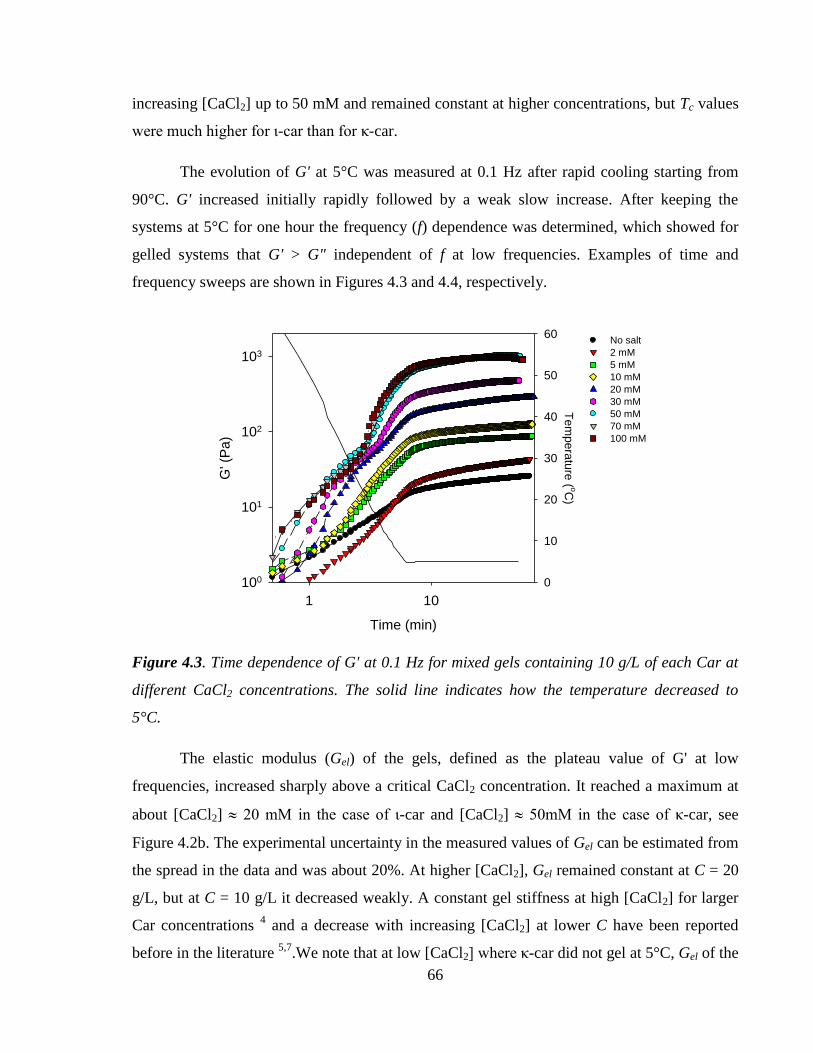
66
increasing [CaCl2] up to 50 mM and remained constant at higher concentrations, but Tc values
were much higher for ι-car than for κ-car.
The evolution of G' at 5°C was measured at 0.1 Hz after rapid cooling starting from
90°C. G' increased initially rapidly followed by a weak slow increase. After keeping the
systems at 5°C for one hour the frequency (f) dependence was determined, which showed for
gelled systems that G' > G" independent of f at low frequencies. Examples of time and
frequency sweeps are shown in Figures 4.3 and 4.4, respectively.
Time (min)
1 10
G' (
Pa)
100
101
102
103
Te
mp
era
ture
(oC
)
0
10
20
30
40
50
60No salt
2 mM
5 mM
10 mM
20 mM
30 mM
50 mM
70 mM
100 mM
Figure 4.3. Time dependence of G' at 0.1 Hz for mixed gels containing 10 g/L of each Car at
different CaCl2 concentrations. The solid line indicates how the temperature decreased to
5°C.
The elastic modulus (Gel) of the gels, defined as the plateau value of G' at low
frequencies, increased sharply above a critical CaCl2 concentration. It reached a maximum at
about [CaCl2] 20 mM in the case of ι-car and [CaCl2] 50mM in the case of κ-car, see
Figure 4.2b. The experimental uncertainty in the measured values of Gel can be estimated from
the spread in the data and was about 20%. At higher [CaCl2], Gel remained constant at C = 20
g/L, but at C = 10 g/L it decreased weakly. A constant gel stiffness at high [CaCl2] for larger
Car concentrations 4 and a decrease with increasing [CaCl2] at lower C have been reported
before in the literature 5,7
.We note that at low [CaCl2] where κ-car did not gel at 5°C, Gel of the
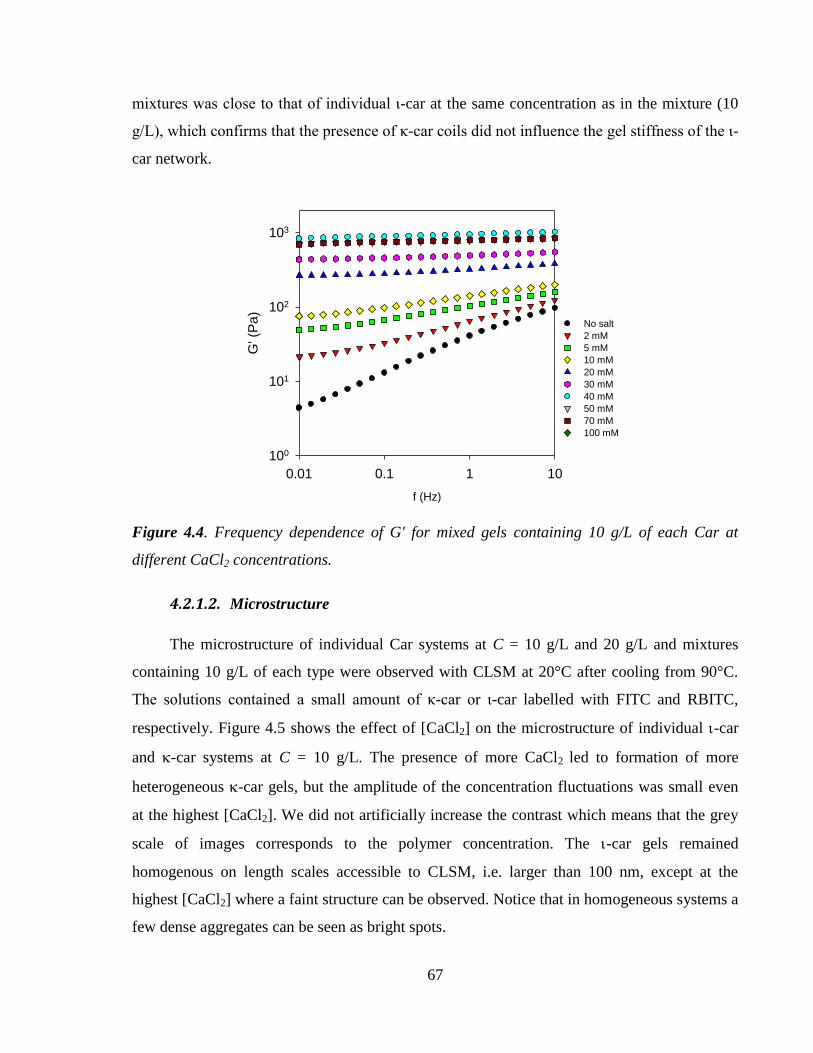
67
mixtures was close to that of individual ι-car at the same concentration as in the mixture (10
g/L), which confirms that the presence of κ-car coils did not influence the gel stiffness of the ι-
car network.
f (Hz)
0.01 0.1 1 10
G' (
Pa)
100
101
102
103
No salt
2 mM
5 mM
10 mM
20 mM
30 mM
40 mM
50 mM
70 mM
100 mM
Figure 4.4. Frequency dependence of G' for mixed gels containing 10 g/L of each Car at
different CaCl2 concentrations.
4.2.1.2. Microstructure
The microstructure of individual Car systems at C = 10 g/L and 20 g/L and mixtures
containing 10 g/L of each type were observed with CLSM at 20°C after cooling from 90°C.
The solutions contained a small amount of κ-car or ι-car labelled with FITC and RBITC,
respectively. Figure 4.5 shows the effect of [CaCl2] on the microstructure of individual -car
and -car systems at C = 10 g/L. The presence of more CaCl2 led to formation of more
heterogeneous -car gels, but the amplitude of the concentration fluctuations was small even
at the highest [CaCl2]. We did not artificially increase the contrast which means that the grey
scale of images corresponds to the polymer concentration. The -car gels remained
homogenous on length scales accessible to CLSM, i.e. larger than 100 nm, except at the
highest [CaCl2] where a faint structure can be observed. Notice that in homogeneous systems a
few dense aggregates can be seen as bright spots.
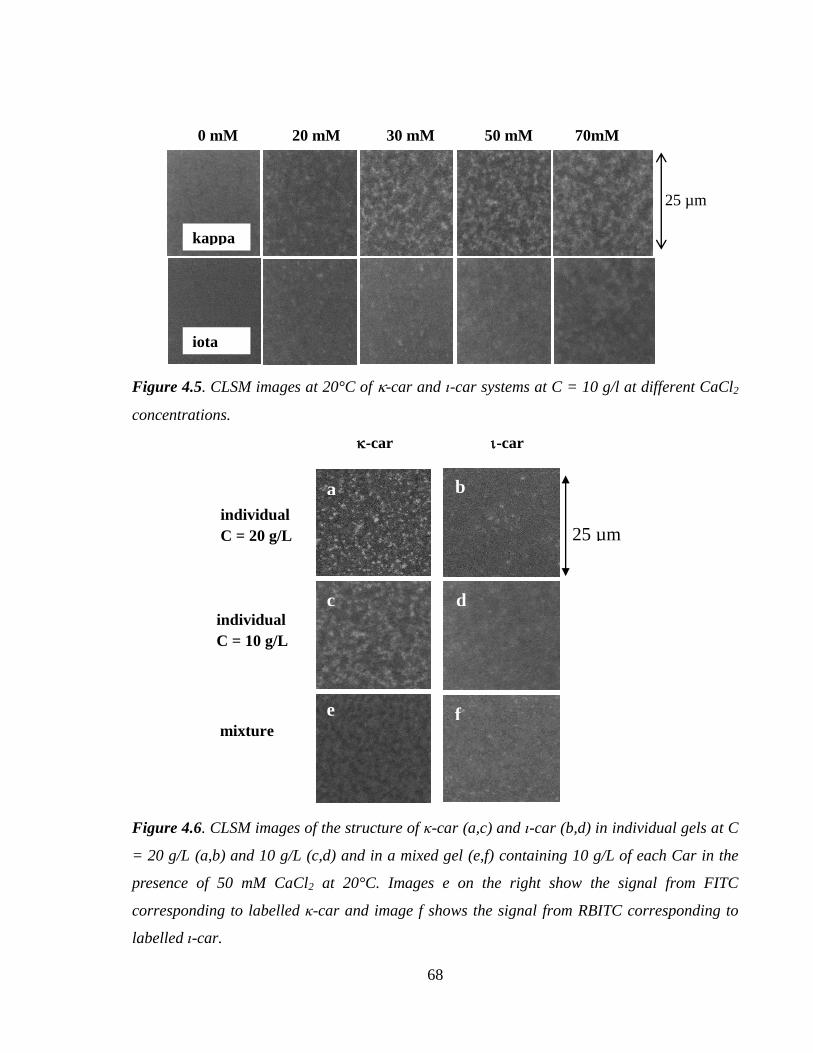
68
Figure 4.5. CLSM images at 20°C of -car and ι-car systems at C = 10 g/l at different CaCl2
concentrations.
Figure 4.6. CLSM images of the structure of κ-car (a,c) and ι-car (b,d) in individual gels at C
= 20 g/L (a,b) and 10 g/L (c,d) and in a mixed gel (e,f) containing 10 g/L of each Car in the
presence of 50 mM CaCl2 at 20°C. Images e on the right show the signal from FITC
corresponding to labelled κ-car and image f shows the signal from RBITC corresponding to
labelled ι-car.
25 µm
0 mM 20 mM 30 mM 50 mM 70mM
kappa
iota
25 µm
individual
C = 20 g/L
mixture
individual
C = 10 g/L
-car
-car
a b
c d
e f

69
The effect of mixing κ-car and ι-car was tested at [CaCl2] = 50 mM. Figure 4.6
compares images of individual κ-car and ι-car gels at C = 20 g/L (a and b) and C = 10 g/L (c
and d) with the FITC signal corresponding to κ-car (e) and the RBTIC corresponding to ι-car
(f) chains in the gelled mixture containing 10 g/L of each car. At these conditions ι-car chains
were homogeneously distributed on length scales accessible to CLSM both in the individual
systems and the mixture. The distribution of -car chains was heterogeneous both in the
individual gels and in the mixture, but it appears to be less heterogeneous in the latter.
Figure 4.7. Pair correlation functions of the Car concentration fluctuations for individual κ-
car (a) and ι-car (b) gels at C = 10 g/L and different [CaCl2] indicated in the figure. Figure
4.7c shows g(r) of κ-car concentration fluctuations in the mixed gels containing 10 g/L of each
Car. Figure 4.7d compares g(r) for individual κ-car and ι-car gels with that of the mixed gel
at [CaCl2] = 50 mM.
r (µm)
0.1 1 10
g (
r)
1.00
1.02
1.04
1.06
no salt
10 mM
20 mM
30 mM
40 mM
50 mM
70 mM
a
r (µm)
0.1 1 10
g (
r)
1.00
1.02
1.04
1.06
b
r (µm)
0.1 1 10
g (
r)
1.00
1.02
1.04
1.06c
r (µm)
0.1 1 10
g (
r)
1.00
1.02
1.04
1.06
-car individual
-car individual
-car in mixture
-car in mixture
d
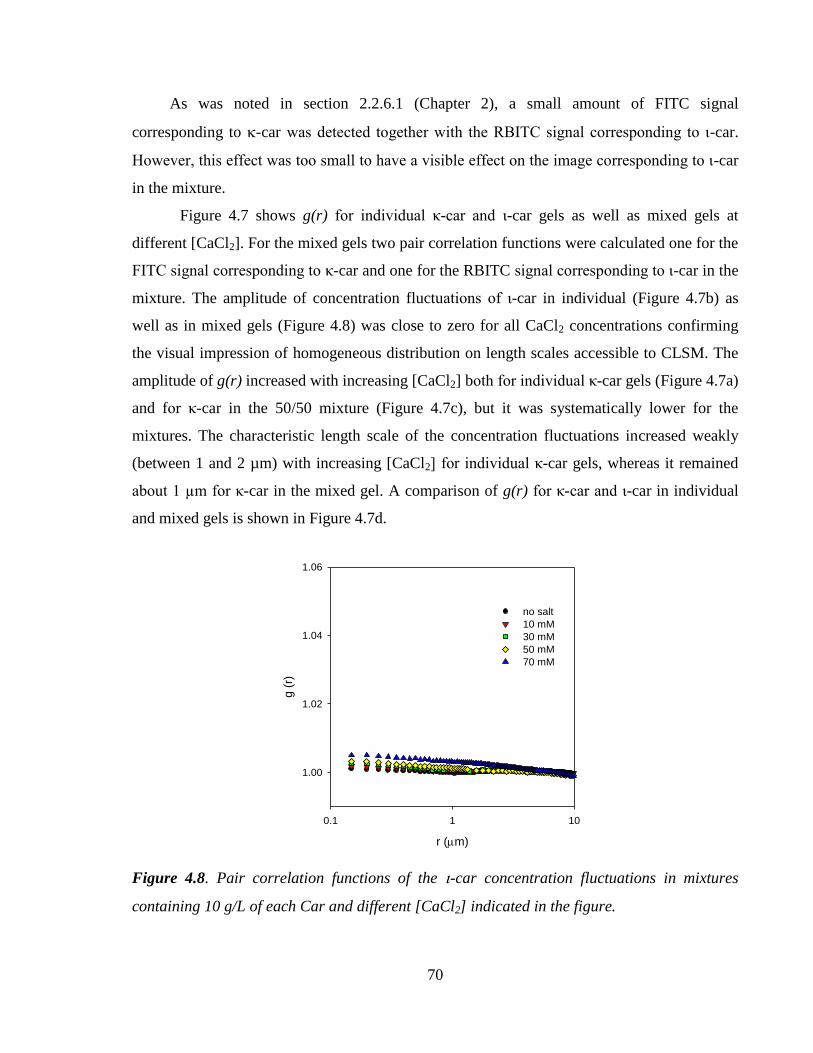
70
As was noted in section 2.2.6.1 (Chapter 2), a small amount of FITC signal
corresponding to -car was detected together with the RBITC signal corresponding to ι-car.
However, this effect was too small to have a visible effect on the image corresponding to ι-car
in the mixture.
Figure 4.7 shows g(r) for individual κ-car and ι-car gels as well as mixed gels at
different [CaCl2]. For the mixed gels two pair correlation functions were calculated one for the
FITC signal corresponding to κ-car and one for the RBITC signal corresponding to ι-car in the
mixture. The amplitude of concentration fluctuations of ι-car in individual (Figure 4.7b) as
well as in mixed gels (Figure 4.8) was close to zero for all CaCl2 concentrations confirming
the visual impression of homogeneous distribution on length scales accessible to CLSM. The
amplitude of g(r) increased with increasing [CaCl2] both for individual κ-car gels (Figure 4.7a)
and for κ-car in the 50/50 mixture (Figure 4.7c), but it was systematically lower for the
mixtures. The characteristic length scale of the concentration fluctuations increased weakly
(between 1 and 2 µm) with increasing [CaCl2] for individual κ-car gels, whereas it remained
about 1 µm for κ-car in the mixed gel. A comparison of g(r) for κ-car and ι-car in individual
and mixed gels is shown in Figure 4.7d.
r (m)
0.1 1 10
g (
r)
1.00
1.02
1.04
1.06
no salt
10 mM
30 mM
50 mM
70 mM
Figure 4.8. Pair correlation functions of the -car concentration fluctuations in mixtures
containing 10 g/L of each Car and different [CaCl2] indicated in the figure.

71
The rheology results are compatible with microphase separation for the mixed gel, but
they also imply that there is no microphase separation in -car gel mixed with κ-car coils.
CLSM showed that the microstructure of -car gels was homogeneous at least on length scales
larger than about 100 nm, whereas κ-car gels were heterogeneous on length scales of a few
µm. The more heterogeneous microstructure of κ-car gels is consistent with the observed
higher turbidity. In the mixed network, the distribution of -car was still homogeneous on
length scales larger than 100 nm. The implication is that if microphase separation does occur
the domains are smaller than 100 nm. Given that the chains in the coil conformation span
about 400 nm it is difficult to maintain that distinct -car and κ-car domains are formed on
length scales smaller than 100 nm. The distribution of κ-car was found to be less
heterogeneous in the mixed gel than in the corresponding individual κ-car network, which also
argues against microphase separation.
4.2.1.3. Turbidity
Figure 4.9 shows the turbidity as a function of temperature during a cooling ramp at a
rate of 1°C/ min for individual Car solutions and mixtures at different [CaCl2]. The turbidity of
κ-car solutions increased sharply below Tc and more so when more CaCl2 was present. By
comparison the turbidity of ι-car gels remained low and increased only weakly with increasing
[CaCl2]. Repeat measurements of the same systems showed the same turbidities within a few
percent and upturns at the same temperature with a few degrees.
Temperature (°C)
10 20 30 40 50 60 70 80
Tu
rbid
ity (
cm
-1)
0.0
0.1
0.2
0.3
0.4
0.5
0 mM
10 mM
30 mM
50 mM
70 mM
a
Temperature (°C)
10 20 30 40 50 60 70 80
Tu
rbid
ity (
cm
-1)
0.0
0.1
0.2
0.3
0.4
0.5
b
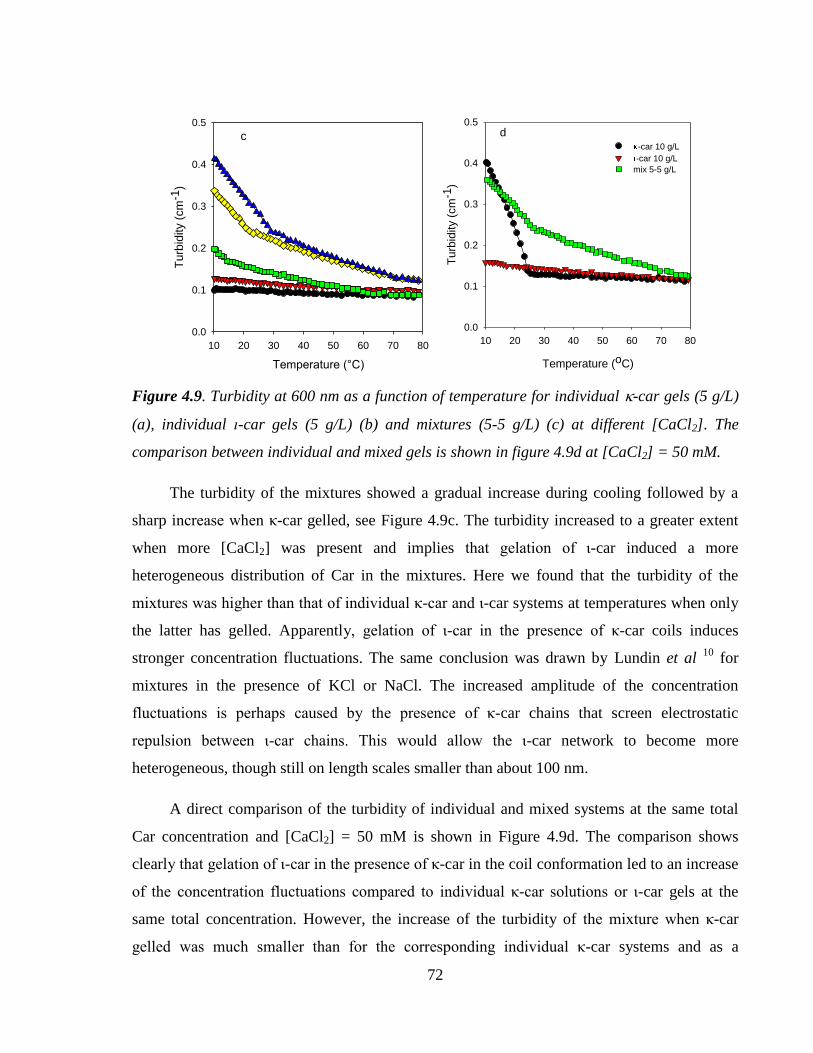
72
Figure 4.9. Turbidity at 600 nm as a function of temperature for individual -car gels (5 g/L)
(a), individual ι-car gels (5 g/L) (b) and mixtures (5-5 g/L) (c) at different [CaCl2]. The
comparison between individual and mixed gels is shown in figure 4.9d at [CaCl2] = 50 mM.
The turbidity of the mixtures showed a gradual increase during cooling followed by a
sharp increase when κ-car gelled, see Figure 4.9c. The turbidity increased to a greater extent
when more [CaCl2] was present and implies that gelation of ι-car induced a more
heterogeneous distribution of Car in the mixtures. Here we found that the turbidity of the
mixtures was higher than that of individual κ-car and ι-car systems at temperatures when only
the latter has gelled. Apparently, gelation of ι-car in the presence of κ-car coils induces
stronger concentration fluctuations. The same conclusion was drawn by Lundin et al 10
for
mixtures in the presence of KCl or NaCl. The increased amplitude of the concentration
fluctuations is perhaps caused by the presence of κ-car chains that screen electrostatic
repulsion between ι-car chains. This would allow the ι-car network to become more
heterogeneous, though still on length scales smaller than about 100 nm.
A direct comparison of the turbidity of individual and mixed systems at the same total
Car concentration and [CaCl2] = 50 mM is shown in Figure 4.9d. The comparison shows
clearly that gelation of ι-car in the presence of κ-car in the coil conformation led to an increase
of the concentration fluctuations compared to individual κ-car solutions or ι-car gels at the
same total concentration. However, the increase of the turbidity of the mixture when κ-car
gelled was much smaller than for the corresponding individual κ-car systems and as a
Temperature (°C)
10 20 30 40 50 60 70 80
Turb
idity (
cm
-1)
0.0
0.1
0.2
0.3
0.4
0.5
c
Temperature (oC)
10 20 30 40 50 60 70 80
Turb
idity (
cm
-1)
0.0
0.1
0.2
0.3
0.4
0.5
-car 10 g/L
-car 10 g/L
mix 5-5 g/L
d

73
consequence the turbidity of the mixed gel was lower than that of the individual κ-car gel even
though it was higher at the start of κ-car gelation. The lower turbidity of the mixtures
corroborates the more homogeneous distribution of the κ-car chains in the mixed gel that was
observed in the CLSM images. It appears that the presence of the ι-car network inhibits
coarsening of the κ-car network instead of favoring it as would be expected in the case of
microphase separation. It should be realized, however, that the turbidity of car solutions and
gels is determined by the overall concentration fluctuations, but not by the relative distribution
of κ-car and ι-car chains, because their refractive index increment is practically the same.
Therefore microphase separation has no influence on the turbidity if the concentration of each
type of Car is the same in each phase. However, as was mentioned above, it seems likely that
in a microphase separated mixture the Car concentration of the κ-car phase would be higher
than that of the ι-car phase. Microphase separation leading to phases with different Car
concentrations would result in large fluctuations of the refractive index and therefore a strong
increase of the turbidity that was not observed.
4.2.2. Mixtures of iota and kappa carrageenan in presence of potassium ions
Many studies have been done on the gelation of Car induced by the presence of KCl.
Therefore we repeated here some experiments with individual and mixed gels formed in the
presence of different KCl concentrations. Figure 4.10 shows G’ measured during cooling
ramps for solutions of -car at concentration 10 g/L (a), -car at concentration of 10 g/L (b)
and their mixture (10-10 g/L) (c) and [KCl] from 5-70 mM. G' of κ-car solutions increased
rapidly at [KCl] > 10 mM and Tc gradually increased with increasing KCl concentration
(Figure 4.10a). For ι-car, the gel formed at [KCl] > 10 mM and G' and Tc also increased with
increasing KCl concentration, but G' remained much lower than for -car. The mixture
showed a two step gelation process but the gelation of ι-car in the mixture was less clear
compared to that in the mixture in presence of calcium. Figure 4.11 presents G’as a function of
time for -car (10g/l) and a mixture (10-10 g/l) at different salt concentrations during and after
rapid cooling to 5oC. The results show that the G’ rapidly increased for all samples, but the
syneresis occurred when [KCl] > 30 mM (see Figure 4.11a). Syneresis usually happens with
strong κ-car gels in presence of KCl and causes loss of contact between the gel and the plate 13
and the release of fluid from the gel 14
. However, this phenomenon did not occur in the mixed

74
gel, see Figure 4.11b. These results agree with observations reported in the literature that the
presence of ι-car inhibits syneresis in mixed Car gels 15
.
Figure 4.10. Storage moduli measured during cooling ramps at a rate of 2 °C/min for
solutions of 10 g/L of -car (a), -car (b) and a mixture, 10-10 g/L (c) at different KCl
concentrations.
a
Temperature (oC)
0 20 40 60 80
G' (
Pa)
10-1
100
101
102
103
104
5 mM
10
20
30
50
70
b
Temperature (oC)
0 20 40 60 80
G' (
Pa)
10-1
100
101
102
103
104
5 mM
10
20
30
50
70
Temperature (oC)
0 20 40 60 80
G' (
Pa)
10-1
100
101
102
103
104
5 mM
10
20
30
50
70
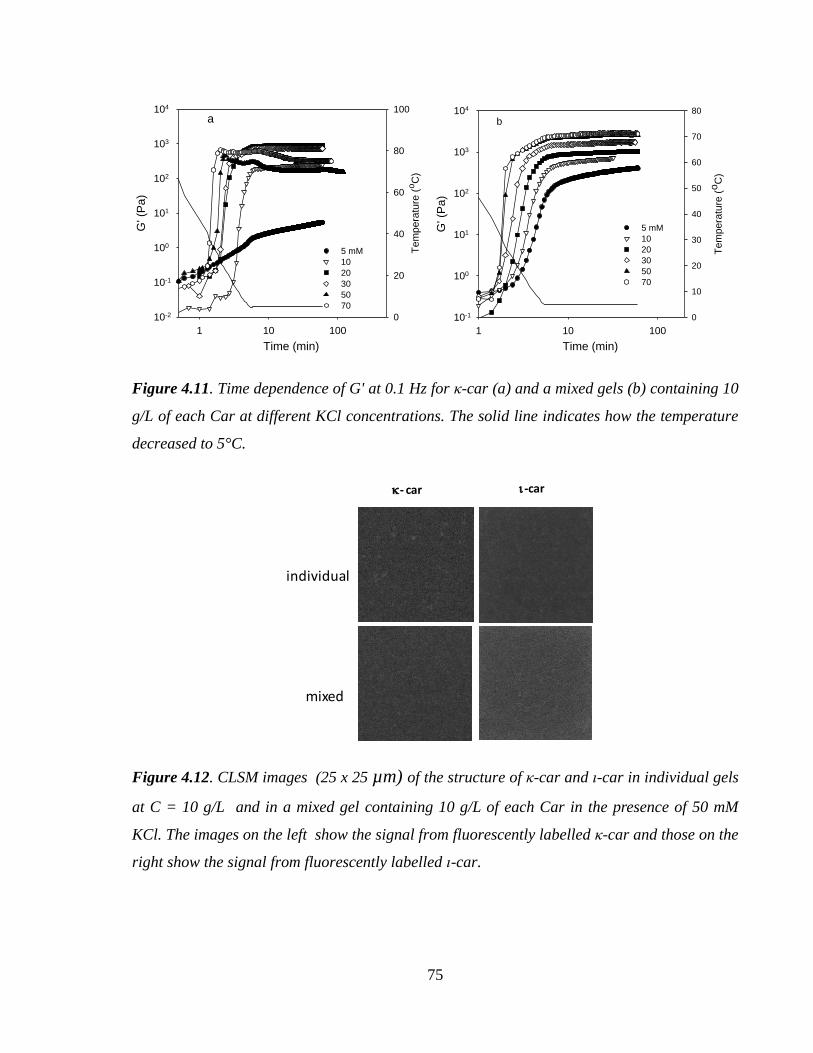
75
Figure 4.11. Time dependence of G' at 0.1 Hz for κ-car (a) and a mixed gels (b) containing 10
g/L of each Car at different KCl concentrations. The solid line indicates how the temperature
decreased to 5°C.
Figure 4.12. CLSM images (25 x 25 µm) of the structure of κ-car and ι-car in individual gels
at C = 10 g/L and in a mixed gel containing 10 g/L of each Car in the presence of 50 mM
KCl. The images on the left show the signal from fluorescently labelled κ-car and those on the
right show the signal from fluorescently labelled ι-car.
a
Time (min)
1 10 100
G' (
Pa)
10-2
10-1
100
101
102
103
104
Tem
pe
ratu
re (
oC
)
0
20
40
60
80
100
5 mM
10
20
30
50
70
b
Time (min)
1 10 100
G' (
Pa
)
10-1
100
101
102
103
104
Te
mpe
ratu
re (
oC
)
0
10
20
30
40
50
60
70
80
5 mM
10
20
30
50
70
- car -car
individual
mixed

76
50 mM KCl
Temperature (°C)
10 20 30 40 50 60 70
Turb
idity (
cm
-1)
0.05
0.10
0.15
0.20
0.25
0.30
-car 5 g/L
-car 5 g/L
mixture
Figure 4.13. Turbidity as a function of temperature for individual κ-car and ι-car solutions at
C = 5 g/L and mixtures containing 5 g/L of each Car in the presence of 50 mM KCl.
Figure 4.12 shows images of the microstructure of κ-car and ι-car in individual gels at
C = 10 g/L and in mixed gels containing 10g/L of each Car. The distribution of both types of
Car was homogeneous in all systems. This was confirmed by turbidity measurements that
showed very low turbidity for mixed and individual gels, see Figure 4.13. The turbidity of the
mixed gel was intermediate between that of the individual κ-car and ι-car gels.
The results here render it unlikely that microphase separation had occurred in the
mixed gels formed in the presence of KCl. If microphase separation does not occur, the
agreement between experimental Gel and predictions for microphase separated gels is
fortuitous. A different explanation is required for the observation that the stiffness of the
mixed gels is much higher than a simple sum of the elastic moduli of the two individual
networks. One possibility is that κ-car helices co-aggregate with ι-car helices thereby
increasing the crosslink density of the mixed gel. This would also explain why the gel stiffness
of ι-car is not modified by κ-car in the coil conformation and why the κ-car chains are
distributed more homogeneously in the mixed gel. Another possibility is that the ι-car and κ-
car remain independent, but that their structure and stiffness are somehow modified by the
interpenetration with the other network. In particular a more homogeneous κ-car network

77
suggested by the more homogeneous distribution of κ-car in the mixed gel, could be stiffer. In
fact, we found that the more homogeneous individual κ-car gels formed with KCl were
significantly stiffer than the more heterogeneous gels formed with CaCl2.
4.3. Conclusions
50/50 mixtures of ι-car and κ-car gel in two steps during cooling in the presence of CaCl2
with ι-car gelling at a higher temperature than κ-car. The gel temperatures in the mixtures are
the same as for corresponding individual gels indicating independent coil-helix transitions.
The gel stiffness of mixed gels is equal to that of the corresponding individual ι-car gel when
κ-car is in the coil conformation. However, when both carrageenans have gelled in the
mixtures the gel stiffness is much larger than the sum of the corresponding individual gels at
the same concentration as in the mixtures. It is in fact between that of individual κ-car and ι-
car gels at the same total Car concentration. CLSM images show that ι-car chains are
homogeneously distributed in individual and mixed gels, whereas the κ-car network is
heterogeneous on length scales of 1-2 µm. However, the κ-car network is more homogeneous
in the mixed gels than in the corresponding individual gels. This was confirmed by turbidity
measurements that showed that the amplitude of the overall car concentration fluctuations was
lower in mixed gels than in individual κ-car gels. Individual κ-car gels and mixed gels formed
in the presence of KCl were more homogeneous than gels formed in the presence of CaCl2. It
is concluded that microphase separation is highly unlikely to occur in mixed gels and it is
suggested that the increased gel stiffness is caused by co-aggregation of ι-car and κ-car or
changes in the structure of the interpenetrated networks.

78
References
1. Rochas, C. & Rinaudo, M. Activity coefficients of counterions and conformation in
kappa-carrageenna system. Biopolymers 19, 1675–1687 (1980).
2. Norton, I. T., Goodall, D. M., Morris, E. R. & Rees, D. A. Role of cations in the
conformation of iota and kappa carrageenan. J. Chem. Soc. Faraday Trans. 1 79, 2475–
2488 (1983).
3. Rochas, C., Rinaudo, M. & Landry, S. Relation between the molecular structure and
mechanical properties of carrageenan gels. Carbohydr. Polym. 10, 115–127 (1989).
4. Michel, A. S., Mestdagh, M. M. & Axelos, M. A. V. Physico-chemical properties of
carrageenan gels in presence of various cations. International Journal of Biological
Macromolecules 21, 195–200 (1997).
5. MacArtain, P., Jacquier, J. C. & Dawson, K. A. Physical characteristics of calcium
induced κ- carrageenan networks. Carbohydr. Polym. 53, 395–400 (2003).
6. Thrimawithana, T. R., Young, S., Dunstan, D. E. & Alany, R. G. Texture and
rheological characterization of kappa and iota carrageenan in the presence of counter
ions. Carbohydr. Polym. 82, 69–77 (2010).
7. Nguyen, B. T., Nicolai, T., Benyahia, L. & Chassenieux, C. Synergistic effects of
mixed salt on the gelation of κ-carrageenan. Carbohydr. Polym. 112, 10–15 (2014).
8. Robal, M. et al. Monocationic salts of carrageenans: Preparation and physico-chemical
properties. Food Hydrocoll. 63, 656–667 (2017).
9. Parker, A., Brigand, G., Miniou, C., Trespoey, A. & Vallée, P. Rheology and fracture of
mixed ι- and κ-carrageenan gels: Two-step gelation. Carbohydr. Polym. 20, 253–262
(1993).
10. Lundin, L., Odic, K., Foster, T. J., & Norton, I. T. Phase separation in mixed
carrageenan systems. In Supermolecular and colloidal structures in Biomaterials and
Biosubstrates 436–449 (ICP, 2000).
11. Brenner, T., Tuvikene, R., Parker, A., Matsukawa, S. & Nishinari, K. Rheology and
structure of mixed kappa-carrageenan/iota-carrageenan gels. Food Hydrocoll. 39, 272–
79
279 (2014).
12. Du, L., Brenner, T., Xie, J. & Matsukawa, S. A study on phase separation behavior in
kappa/iota carrageenan mixtures by micro DSC, rheological measurements and
simulating water and cations migration between phases. Food Hydrocoll. 55, 81–88
(2016).
13. Lai, V. M. F., Wong, P. A. L. & Lii, C. Y. Effects of cation properties on sol-gel
transition and gel properties of κ-carrageenan. J. Food Sci. 65, 1332–1337 (2000).
14. Ako, K. Influence of elasticity on the syneresis properties of κ-carrageenan gels.
Carbohydr. Polym. 115, 408–414 (2015).
15. Mikkelsen, T. R., Scottsdale, A. & Theiler, R. F. Water-based gel with low syneresis
field. United States Patent, US 2013/0157922 A1 1–6 (2013).

80
Chapter 5
Mobility of Carrageenan Chains In Iota and Kappa
Carrageenan Gels
5.1. Introduction
Car is a gelling polysaccharide with important applications in the areas of cosmetics,
drug delivery systems and food 1,2
. Understanding the mobility of Car chains within the gel is
important for a better understanding of the gel properties. Diffusion of probe molecules in Car
gels has been studied in the past and has been related to the structure of the network 3–7
. Zhao
et al 7 observed with pulsed field gradient NMR (PFG-NMR) that the fraction of -car chains
with highly mobile segments strongly reduced below the gelation temperature, which they
attributed to aggregation of helices. However, they observed that the diffusion coefficient of
the residual mobile chains in the gels increased with decreasing temperature. They concluded
that the residual mobile chains were made up of the shorter chains within the distribution of
chains sizes of the -car sample used in their study. The effect of the type of Car on the
fraction of mobile chains was not investigated by these authors nor the effect of the types and
concentration of added salt. Neither was the mobility related to macroscopic release of Car
chains from gels and the gel stiffness. It seems likely that if there is a significant fraction of
mobile chains this will influence the gel stiffness and leads to release of Car to the surrounding
aqueous phase, which could be important for applications.
In this chapter we will present an investigation of the mobility of Car chains in gels. A
systematic study was done of the mobility of sodium -car and -car chains in gels formed by
addition of KCl or CaCl2 using fluorescence recovery after photon bleaching (FRAP). Using
FRAP the mobility of Car chains can be monitored over much longer distances (tens of
microns) and much longer times (hours) than by the NMR. The results on the mobility in the
gels were compared with their corresponding stiffness determined with oscillatory shear
rheology and release of Car chains from macroscopic gel fragments in excess solvent with the
same ionic strength.

81
5.2. Results
5.2.1. Mobility of carrageenan in salt free aqueous solution
FRAP measurements were done for salt free solutions of ι-car and κ-car at different
concentrations between C = 1 and 20 g/L. For these systems the intensity profile quickly
became Gaussian indicating Brownian diffusion of labelled Car, see Figure 5.1. Figure 5.2
shows the normalized recovery of the fluorescence intensity: F(t) = (I(t)-Ib)/(Ii-Ib), where I(t) is
the integrated intensity of the bleached area at time t after bleaching, Ii is the intensity before
bleaching and Ib is the intensity just after bleaching. The recovery was slower at higher Car
concentrations, which is expected because the friction between chains increased. F(t) was
plotted on a logarithmic time scale, because full recovery was slow at higher concentrations.
For -car at C = 20 g/L, F(t) stagnated at about 60%. It was found that at this concentration -
car formed a weak gel at 20°C in salt free water (Figure 5.3). The effect of gelation on F(t)
will discussed in more detail below.
Distance (m)
0 5 10 15 20 25
Inte
nsity (
AU
)
0.00
0.05
0.10
0.15
0.20
0.25
0.30
1.2 s
2.4 s
4.8 s
9.8 s
18 s
23 s
37 s
62 s
102 s
Figure 5.1. Intensity profiles at different times after bleaching for a solution of -car in salt
free water at C = 1 g/L.

82
a
t (s)
10-1 100 101 102 103 104
F(t
) (%
)
0
20
40
60
80
100
1 g/L
2 g/L
5 g/L
10 g/L
20 g/L
b
t (s)
10-1 100 101 102 103 104 105
F(t
) (%
)
0
20
40
60
80
100
1 g/L
2 g/L
5 g/L
10 g/L
20 g/L
Figure 5.2. Recovery for the fluorescence intensity as a function of time after photobleaching
for solutions of κ-car (a) and ι-car (b) in salt free water at different concentrations. The solid
lines represent the expected behaviour for Brownian diffusion with a single diffusion
coefficient.
The solid lines in Figure 5.1 show the predictions of recovery caused by diffusional
motion of the labelled chains with a single diffusion coefficient (D):
F(t)=exp(-2/t)[I0(2/t)+I1(2/t)], where = w2/4D is the characteristic time needed to diffuse
out of the bleached area with radius w and I0 and I1 are Bessel functions 8. It is clear that F(t)
could not be described in terms of a single diffusion coefficient even at the lowest
concentrations, which can be explained by the polydispersity of the Car chains. Nevertheless,
D was calculated using only images taken during the first 20 s of the recovery. From the value
of D extrapolated to C = 0, a hydrodynamic radius was calculated using equation D =
kT/6πηRh: Rh = 43 nm and 63 nm for κ-car and ι-car, respectively. These values are smaller
than the z-average Rh obtained from dynamic light scattering 67 nm and 75 nm, respectively.
Smaller values are expected, because the Car chains were polydisperse in size and we
analyzed the initial recovery of the fluorescence that was dominated by diffusion of the
smaller chains.

83
f (Hz)
10-2 10-1 100 101
G', G
'' (P
a)
10-2
10-1
100
101
102
-car
-car
Figure 5.3. Frequency dependence of the storage (filled symbols) and loss (open symbols)
modulus of -car and -car solutions in salt free water at 20 g/L.
5.2.2. Mobility of carrageen in gels
Gelation of Car can be induced by adding salt. Here we have formed gels of -car and
-car by adding CaCl2 or KCl to aqueous solutions at C = 10 g/L. The storage (G') and loss
(G") moduli were measured as a function of the frequency (f) after keeping them for 1 h at
20°C. For gels G' was larger than G" and independent of f at low frequencies. Examples are
shown in Figure 5.4. G' at low frequencies was taken as the elastic modulus (Gel) of the gels
and is plotted in Figure 5.5 as a function of the salt concentration ([CaCl2] or [KCl]). Gels
were formed by -car at [CaCl2] ≥ 2 mM and [KCl] ≥ 20 mM, whereas they were formed by -
car for [CaCl2] ≥ 20 mM and [KCl] ≥ 10 mM. Gel increased initially rapidly with increasing
salt concentration, but remained constant at higher concentrations at least in range covered
here. For -car, Gel was larger in the presence of CaCl2 than in the presence of KCl, whereas
for -car Gel was larger in the presence of KCl than in the presence of CaCl2. The difference
between the gel stiffness in the presence of KCl and in the presence of CaCl2 was much larger
for -car than for -car.

84
f (Hz)
10-2 10-1 100 101
G' (
Pa)
10-1
100
101
102
10 mM
20
30
50
70
a
f (Hz)
10-2 10-1 100 101
G' (
Pa
)
10-1
100
101
102
2 mM
3
5
10
20
50
70 b
Figure 5.4. Frequency dependence of the storage modulus of -car systems ( C = 10 g/L ) at
different KCl (a) or CaCl2 (b) concentrations .
Figure 5.5. Elastic modulus of κ-car and ι-car gels at C = 10 g/L as a function of the KCl or
the CaCl2 concentrations. The solid lines are guides to the eye.
Salt concentration (mM)
0 20 40 60 80 100
Gel (P
a)
10-1
100
101
102
103
- car, KCl
- car, CaCl2
-car, KCl
-car, CaCl2

85
The fluorescence recovery of ι-car and κ-car samples in the presence of different
[KCl] or [CaCl2] is shown in Figure 5.6. The results in Figure 5.6 are shown for freshly
prepared samples, but repeat measurements on the same samples after one day showed similar
recoveries. After an initial increase of F(t) at short times that was similar for all samples, F(t)
was found to stagnate at values (Fpl) that decreased with increasing salt concentration and
depended on the type of Car and the type of salt. These results show that even though gels
were formed, a significant fraction of the Car chains remained mobile. As a consequence the
intensity profiles did not become Gaussian, see Figure 5.7. The observation that the recovery
up to Fpl was similar for all samples shows that residual mobile chains were those that moved
fastest also in the solutions. Furthermore it shows that the movement of the mobile chains is
not much modified by the immobilization of a fraction of the chains.
t (s)
10-1 100 101 102 103 104 105
F(t
) (%
)
0
20
40
60
80
100
0 mM
10
30
50
70
-car, KCl
t (s)
10-1 100 101 102 103 104
F(t
) (%
)
0
20
40
60
80
100
0 mM
10
30
50
70
100
-car, KCl
Time (s)
10-1 100 101 102 103 104 105
F(t
) (%
)
0
20
40
60
80
100
0 mM
5
10
20
30
50
70
100
-car, CaCl2
-car, CaCl2
t (s)
10-1 100 101 102 103 104 105
F(t
) (%
)
0
20
40
60
80
100
0 mM
10
30
50
70
Figure 5.6. Recovery for the fluorescence intensity as a function of time after photobleaching
for solutions of κ-car and ι-car at different concentrations of KCl and CaCl2 .

86
Distance (m)
0 5 10 15 20 25
Inte
nsity
0.0
0.1
0.2
0.3
1.2 s
2.4 s
4.8 s
18 s
38 s
608 s
Figure 5.7. Intensity profiles at different times after bleaching for a solution of -car at C = 10
g/L at [CaCl2] = 50 mM.
In order to check whether the presence of mobile chains in the gels was particular for
our batches of native Car, we did similar measurements with a commercial -car sample, see
Figure 5.8. The molar mass of the commercial -car was smaller leading to faster recovery in
salt free solutions. Also for the commercial -car we observed that a significant fraction of the
chains remained mobile in the gels.
t (s)
10-1 100 101 102 103 104 105
F(t
) (%
)
0
20
40
60
80
100
0 mM
10
30
50
70
Figure 5.8. Recovery for the fluorescence intensity as a function of time after photobleaching
for solutions of commercial κ-car at different KCl concentrations.
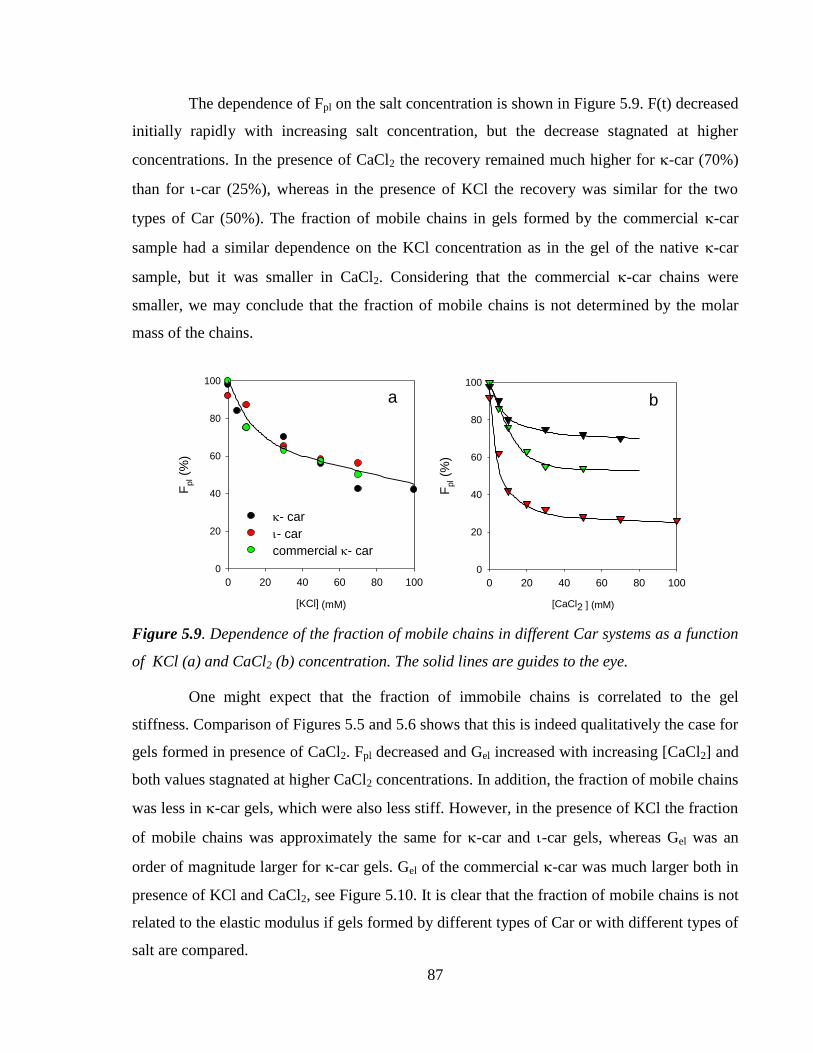
87
The dependence of Fpl on the salt concentration is shown in Figure 5.9. F(t) decreased
initially rapidly with increasing salt concentration, but the decrease stagnated at higher
concentrations. In the presence of CaCl2 the recovery remained much higher for -car (70%)
than for -car (25%), whereas in the presence of KCl the recovery was similar for the two
types of Car (50%). The fraction of mobile chains in gels formed by the commercial -car
sample had a similar dependence on the KCl concentration as in the gel of the native -car
sample, but it was smaller in CaCl2. Considering that the commercial -car chains were
smaller, we may conclude that the fraction of mobile chains is not determined by the molar
mass of the chains.
[KCl] (mM)
0 20 40 60 80 100
Fp
l (%
)
0
20
40
60
80
100
- car
- car
commercial - car
a
[CaCl2 ] (mM)
0 20 40 60 80 100
Fp
l (%
)
0
20
40
60
80
100
b
Figure 5.9. Dependence of the fraction of mobile chains in different Car systems as a function
of KCl (a) and CaCl2 (b) concentration. The solid lines are guides to the eye.
One might expect that the fraction of immobile chains is correlated to the gel
stiffness. Comparison of Figures 5.5 and 5.6 shows that this is indeed qualitatively the case for
gels formed in presence of CaCl2. Fpl decreased and Gel increased with increasing [CaCl2] and
both values stagnated at higher CaCl2 concentrations. In addition, the fraction of mobile chains
was less in -car gels, which were also less stiff. However, in the presence of KCl the fraction
of mobile chains was approximately the same for -car and -car gels, whereas Gel was an
order of magnitude larger for -car gels. Gel of the commercial -car was much larger both in
presence of KCl and CaCl2, see Figure 5.10. It is clear that the fraction of mobile chains is not
related to the elastic modulus if gels formed by different types of Car or with different types of
salt are compared.
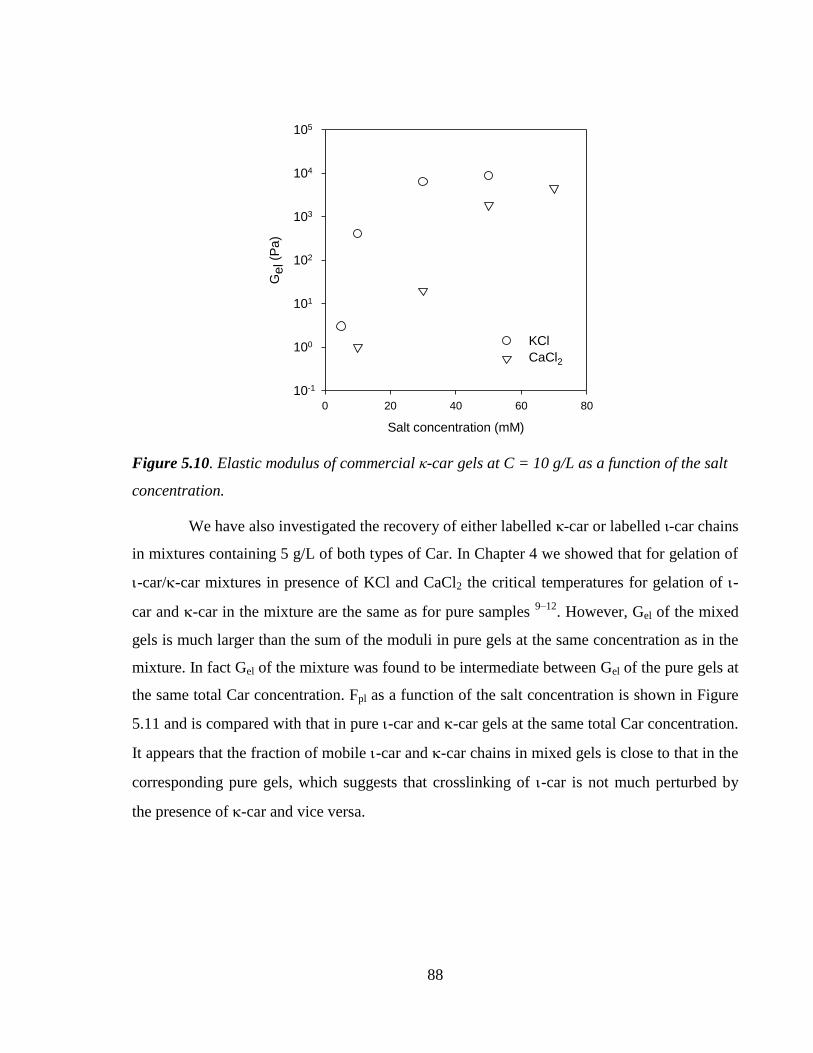
88
Salt concentration (mM)
0 20 40 60 80
Gel (P
a)
10-1
100
101
102
103
104
105
KCl
CaCl2
Figure 5.10. Elastic modulus of commercial κ-car gels at C = 10 g/L as a function of the salt
concentration.
We have also investigated the recovery of either labelled κ-car or labelled ι-car chains
in mixtures containing 5 g/L of both types of Car. In Chapter 4 we showed that for gelation of
-car/-car mixtures in presence of KCl and CaCl2 the critical temperatures for gelation of -
car and -car in the mixture are the same as for pure samples 9–12
. However, Gel of the mixed
gels is much larger than the sum of the moduli in pure gels at the same concentration as in the
mixture. In fact Gel of the mixture was found to be intermediate between Gel of the pure gels at
the same total Car concentration. Fpl as a function of the salt concentration is shown in Figure
5.11 and is compared with that in pure -car and -car gels at the same total Car concentration.
It appears that the fraction of mobile -car and -car chains in mixed gels is close to that in the
corresponding pure gels, which suggests that crosslinking of -car is not much perturbed by
the presence of -car and vice versa.

89
a
[KCl] (mM)
0 20 40 60 80 100
Fp
l (%
)
20
40
60
80
100
car
car
car in mixture
car in mixture
b
[CaCl2] (mM)
0 20 40 60 80 100
Fpl (
%)
0
20
40
60
80
100
Figure 5.11. Dependence of the fraction of mobile Car chains as a function of the KCl (a) and
CaCl2 (b) concentration in mixtures containing 5 g/L -car and 5 g/L -car. For comparison
of results obtained for individual -car and -car systems at C = 10 g/L are also shown. The
solid lines are guides to the eye.
5.2.3. Release of carrageenan from the gels
If a fraction of Car can diffuse through the gels then it should also be released from
macroscopic gels submerged in excess water at the same salt concentration. The release of Car
with time was probed for strong -car gels at [CaCl2] = 50 mM and strong -car gels at [KCl]
= 50 mM by measuring the scattering intensity of the excess water. Notice that the gels for
these measurements did not contain labelled Car. The intensity measured at a low scattering
angle was found to increase logarithmically with time, see Figure 5.12, but the release was
much slower from -car gels than from -car gels. After 36 hours the immerging liquid and the
gel fragments were separated and extensively dialyzed in order to remove all excess salt. It
was found that 11% of -car was released and 33% of -car. Commercial -car gels at [KCl] =
50 mM released 16% Car after 36 h. The amount of Car released after 36 h was still
significantly less that the mobile fraction determined from FRAP measurements (25% for -
car, 55% for -car and 55% for commercial -car). Clearly, 36 h was not enough to remove all
the mobile Car from the macroscopic gel fragments.

90
t (h)
1 10
Inte
nsity (
AU
)
0
2
4
6
8
10
12
14
car
car
Figure 5.12. Light scattering intensity of the excess salt solution into which pieces of -car or
-car gel were immerged as a function of time. The intensity was measured at a scattering
angle of 30°.
The -car that was released and the -car that was retained in the gel were recovered
and their gelation behaviour was studied at C = 10 g/L and [KCl] = 50 mM. The released -car
did not form a gel at these conditions, whereas Gel of the gel formed by the retained -car was
higher (Gel = 3.8x10⁴ Pa) than that of the initial -car gel (Gel = 1.4x10
4 Pa), see Figure 5.13. If
we consider that the mobile chains do not contribute to Gel we should compare the -car gel at
C = 10 g/L with the gel formed by the retained at C = 6.7 g/L. For the latter we found Gel =
2.2x10⁴ Pa, which is still larger than Gel of the initial gel. It appears that the mobile chains not
only did not contribute to the elastic modulus, but rendered the gels less stiff, possible because
they inhibited formation of elastic crosslinks.

91
f (Hz)
0.01 0.1 1 10
G' (
Pa)
100
1000
10000
car, 10 g/L
carR, 6.7 g/L
carR, 10 g/L
Figure 5.13. Frequency dependence of the storage modulus of Car before release (-car) and
after release (-carR) systems in presence of 50mM KCl.
We repeated FRAP measurements on a gel formed by -car containing 10% labelled
chains at C = 10 g/L and [KCl] = 50 mM after releasing part of the mobile chains (-carR) in
the same manner as described above. As expected, the gel showed less recovery than the gel
formed with the original -car sample at the same conditions, see Figure 5.14. In fact, the
reduction of the recovery due to diffusion of labelled -car chains from about 60% to about
30% is compatible with the observe release of 33% of the unlabelled -car chains. In the
FRAP experiments the mobility of labelled Car was determined and since the labelled Car was
significantly smaller than the non-labelled Car. These FRAP results show that the fraction of
released mobile chains is not much larger for labelled chains than for unlabelled chains.

92
t (s)
10-1 100 101 102 103 104 105
F(t
) (%
)
0
20
40
60
80
100
Figure 5.14. Recovery for the fluorescence intensity as a function of time after photobleaching
for gels of κ-car at C = 10 g/L and [KCl] =50 mM before (red triangles) and after (black
circles) release of a fraction of mobile chains.
Mw of the released -car (7x10⁵ g/mol), -car (2.5x10
5 g/mol) and commercial -car
(1.9x10⁵ g/mol) was found to be smaller than the average value found for the initial samples.
The difference can be in part explained by the fact that the smaller chains will be released first
and in part by the fact that the mobile chains are on average smaller than the immobile chains.
As was mentioned in the introduction, Zhao et al 7 concluded on the basis of PFG-NMR
measurements that the mobile chains in a -car gel consisted of the shortest chains in the
polydisperse sample. They found that the fraction of mobile chains was only 10%, i.e
substantially less than was found here. The difference cannot be attributed to the effect of
labelling as we found significantly more release also for unlabelled chains. However, the
polymer concentration was higher (20 g/L) and the salt composition was different containing
both KCl and CaCl2 for the system investigated by Zhao et al. The authors did not determine
the release from macroscopic gels. Therefore we cannot conclude whether the difference is
caused by the difference in the sample or whether with PFG-NMR one does not measure to
full amount of mobile chains.

93
5.3. Conclusion
-Car and -car gels formed in the presence of KCl or CaCl2 contain a significant
fraction of mobile chains, that diffuse through the gel. The fraction of mobile chains can be
determined using FRAP measurements. For a given system the fraction of mobile chains
decreased with increasing salt concentration until a plateau value was reached, which mirrored
the increase of the elastic shear modulus. However, the fraction of mobile chains at higher salt
concentration depended on the Car sample and the type of salt and was not correlated to the
gel stiffness. Mobile chains were on average smaller and were slowly released from
macroscopic gels submerged in excess solvent with the same salt concentration. Removal of
mobile chains led to a decrease of the recovery in FRAP measurements and an increase of the
elastic modulus of the -car gel.

94
References
1. Yegappan, R., Selvaprithiviraj, V., Amirthalingam, S. & Jayakumar, R. Carrageenan
based hydrogels for drug delivery, tissue engineering and wound healing. Carbohydr.
Polym.198, 385–400 (2018).
2. Juteau, A., Doublier, J.-L. & Guichard, E. Flavor release from iota-carrageenan
matrices: a kinetic approach. J. Agric. Food Chem.52, 1621–1629 (2004).
3. De Kort, D. W. et al. Heterogeneity of network structures and water dynamics in κ-
carrageenan gels probed by nanoparticle diffusometry. Langmuir 34, 11110–11120
(2018).
4. Hagman, J., Lorén, N. & Hermansson, A. M. Probe diffusion in κ-carrageenan gels
determined by fluorescence recovery after photobleaching. Food Hydrocoll.29, 106–
115 (2012).
5. Lorén, N. et al. Dendrimer diffusion in κ-carrageenan gel structures.
Biomacromolecules 10, 275–284 (2009).
6. Walther, B., Lorén, N., Nydén, M. & Hermansson, A. M. Influence of κ-carrageenan
gel structures on the diffusion of probe molecules determined by transmission electron
microscopy and NMR diffusometry. Langmuir 22, 8221–8228 (2006).
7. Zhao, Q., Brenner, T. & Matsukawa, S. Molecular mobility and microscopic structure
changes in κ-carrageenan solutions studied by gradient NMR. Carbohydr. Polym.95,
458–464 (2013).
8. Soumpasis, D. M. Brief communication theoretical analysis of fluorescence
photobleaching recovery experiments. Biophys. J.41, 95–97 (1983).
9. Brenner, T., Tuvikene, R., Fang, Y. & Matsukawa, S. Rheology of highly elastic iota-
carrageenan/kappa-carrageenan /xanthan/konjac glucomannan gels. Food Hydrocoll.44,
136–144 (2015).
10. Du, L., Brenner, T., Xie, J. & Matsukawa, S. A study on phase separation behavior in
kappa/iota carrageenan mixtures by micro DSC, rheological measurements and
simulating water and cations migration between phases. Food Hydrocoll.55, 81–88

95
(2016).
11. Lundin, L., Odic, K., Foster, T. J., & Norton, I. T. Phase separation in mixed
carrageenan systems. In Supermolecular and colloidal structures in Biomaterials and
Biosubstrates, 436–449 (ICP, 2000)
12. Ridout, M. J., Garza, S., Brownsey, G. J. & Morris, V. J. Mixed iota-kappa carrageenan
gels. Int. J. Biol. Macromol.18, 5–8 (1996).

96
General Conclusion and Outlook
Conclusions
We have determined the structure and rheological properties of Car extracted from three
subspecies of Kappaphycus alvarezii: K. alvarezii, K. striatum, and K. malesianus and from
Eucheuma denticulatum. Extracts from Ka, Ks, and Km mainly contained -car, whereas the
extract from Ed contains predominantly -car. The yield was higher for the raw extract from
K.alvarezii (42%) than for the other species (32−37%). The molar mass and the radius of
gyration were found to be close for all samples. The zero shear viscosity of -car extracted
from K. alvarezii was found to be systematically larger than the other carrageenan samples.
Gelation induced by adding KCl to -car from the three subspecies was found to occur at
approximately the same temperature leading to gels with approximately the same stiffness.
Gel stiffness of Car extracted from Ka and Ed after alkali treatment was larger than for water
extracted Car and close to that of commercial - and -car. Therefore, these types of seaweed
from Cam Ranh Bay can be used to produce Car industrially. K. alvarezii is the best choice for
expanding cultivation areas.
The study of the rheology and microstructure of 50/50 mixtures of ι-car and κ-car gel
in the presence of CaCl2 confirmed that the mixtures showed a two-step gelation process at
gelation temperatures (Tc) that coincided with those of the corresponding individual κ-car and
ι-car solutions. The stiffness of the mixed gels was much higher than the sum of the
corresponding individual gels. Confocal laser scanning microscopy and turbidity
measurements showed that the κ-car gel was always more heterogeneous than the ι-car gel, but
less in the mixture than in the individual system. In the presence of KCl, individual κ-car gels
and mixed gels formed were more homogeneous than gels formed in the presence of CaCl2.
The results show that microphase separation of ι-car and κ-car in mixed gels is highly
unlikely. It is suggested that the increased stiffness of the mixed gels is caused by co-
aggregation of κ-car and ι-car or changes in the structure of the interpenetrated networks.
The mobility of Car chains in native -car and -car gels and commercial -car gel was
determined by using FRAP measurements. The results showed that there is a significant
fraction of the Car chains that remains mobile and diffuses through the gel. The fraction of

97
mobile chains at higher salt concentrations depended on the type of Car and the type of salt
and was not correlated to the gel stiffness. The release of Car from gel fragments into excess
solvent at the same salt concentration was probed as a function of time with light scattering. It
was found that the released Car chains were on average smaller than in the initial Car sample.
Gels made with -car from which the mobile chains had been partially removed were
significantly stiffer even at the same concentration of immobile chains.
Perspectives
Here we concentrated on Car obtained from mild water extraction and tested only one
condition of alkali extraction. However, the quality of Car products from the mentioned
seaweeds could be increased by optimizing the alkali treatment. Therefore a more detailed
investigation of the influence of alkali treatment on the properties of Car is needed.
The rheological properties and microstructure of mixtures were done on adding KCl or
CaCl2. However, gelation of ι-car and κ-car is favored by different types of salts. Hence it
would be interesting to study mixed Car in presence of several types of cations so that gelation
of both types is favored within the mixture.
The mobility of Car chains in the gel was determined here only at 20oC after cooling a
hot solution. However, Car is applied in various types of products using different processing
techniques such as freezing, heating, irradiation etc. Therefore, an investigation of the mobility
at different temperatures and after different processing protocols would be useful.

Titre : Structure, propriétés rhéologiques et connectivité de gels de Carraghénanes extraits de
différentes espèces d’algues rouges
Mots clés : Carraghénane, Rhéologie, Microstructure, gel
Résumé: Les carraghénanes (Car) sont des polysaccharides
linéaires sulfatés extraits de différentes variétés d’algue rouge et
sont largement utilisés en tant qu’épaississants, stabilisant et
gélifiant dans les industries alimentaire, pharmaceutique et
cosmétique. Les rendements d’extraction ainsi que les
propriétés physicochimiques de car extraits de différentes
espèces cultivées dans la baie de Cam Ranh dans la province de
Khanh Hoa au Vietnam ont été déterminés. Les carraghénanes
-car et -car extraits respectivement de K. alvarezii et E.
denticulatum ont été sélectionnés pour l’étude des propriétés
rhéologiques et de la microstructure en solution seuls ou en
mélange à différentes concentrations en présence de CaCl2 ou
de KCl. Les mélanges présentent un processus de gélification
thermique en deux étapes qui correspondent chacune aux
températures de gélification du -car et -car individuellement.
Cependant, pour les mélanges, l’élasticité du gel est nettement
supérieure à la somme de celle des car seuls. Des mesures en
microscopie confocale et de turbidimétrie ont démontré que les
gels obtenus avec le -car étaient toujours plus turbides que
ceux avec le -car mais étaient moins turbides dans les
mélanges. Au vus des résultats, un mécanisme de séparation de
phase microscopique entre les deux car semble très peu
probable pour expliquer cette observation.
Des mesures de FRAP (Recouvrance de Fluorescence
Après Photo-blanchiment) ont permis de sonder la mobilité des
chaînes de car dans les gels, que ce soit pour les systèmes
individuels ou en mélange. Dans tous les cas, une recouvrance a
été observée démontrant qu’une fraction des chaînes de Car
reste mobile dans les gels. Cette fraction mobile varie de 25% à
75% selon le type de Car et le type/concentration en sel. Cette
fraction n’est pas corrélée à la dureté du gel quelles que soient
les conditions opératoires. Ces résultats ont été confirmés par
des mesures de relargage des chaînes mobiles d’un gel dans un
excès de solvant. Il a été démontré que les chaines relarguées
étaient plus petites que la moyenne de l’échantillon initial.
Title : Structure, Rheological Properties and Connectivity of Gels Formed by Carrageenan Extracted
from Different Red Algae Species
Keywords : Carrageenan, rheology, microstructure, gel
Abstract: Carrageenan (Car) is a linear sulfated polysaccharide
extracted from various species of red algae and is widely used
as thickener, stabilizer and gelling agent in food products,
pharmaceutics and cosmetics. The yield and properties of car
extracted from different algae species cultured at Cam Ranh
Bay in Khanh Hoa province of Vietnam were characterized. κ-
car from K. alvarezii and -car extracted from E.denticulatum
were selected to study the rheological properties and the
microstructure of individual and mixed car solutions at different
concentrations in the presence of CaCl2 and KCl. Mixtures
showed a two-step gelation process with gelation temperatures
that coincided with those of corresponding individual κ-car and
ι-Car solutions. However, the stiffness of the mixed gels was
much higher than the sum of the corresponding individual gels.
Confocal laser scanning microscopy and turbidity
measurements showed that the κ-car gel was always more
heterogeneous than the ι-car gel, but less in the mixture than in
the individual system. The results show that microphase
separation of ι-car and κ-car in mixed gels is highly unlikely.
The mobility of car chains in individual gels of κ-Car, ι-car
and their mixtures was determined using fluorescence recovery
after photobleaching. Slow recovery of the fluorescence was
observed for the gels showing that a fraction of the Car chains
remained mobile. The fraction of mobile chains in the gels
varied between 25% and 75% depending on the type of Car and
the type and concentration of salt. The fraction of mobile chains
in gels of different Car or indifferent types of salt was not
correlated to the gel stiffness. These results were confirmed by
the release of Car from gel fragments into excess solvent. It was
found that released Car chains were smaller than the average
size of the initial Car sample.