structure of hydrated clusters of dibenzo- 18-crown-6 … pump uv frequency. the experimental scheme...
TRANSCRIPT

1
Structure of hydrated clusters of dibenzo-
18-crown-6-ether in a supersonic jet
-Encapsulation of water molecules in the
crown cavity-
Ryoji Kusaka, Yoshiya Inokuchi, and Takayuki Ebata*
Department Chemistry, Graduate school of Science, Hiroshima University, Higashi-Hiroshima 739-
8526, Japan
Abstract
The structure of dibenzo-18-crown-6-ether (DB18C6) and its hydrated clusters has been
investigated in a supersonic jet. Two conformers of bare DB18C6 and six hydrated clusters
(DB18C6-(H2O)n) were identified by laser induced fluorescence, fluorescence detected UV-UV
hole-burning and IR-UV double-resonance spectroscopy. The IR-UV double resonance spectra
were compared with the IR spectra obtained by quantum chemical calculations at the B3LYP/6-
31+G* level. The two conformers of bare DB18C6 are assigned to "boat" and "chair I" forms,
respectively, among which the boat form is dominant. All the six DB18C6-(H2O)n clusters with n =
1–4 have a boat conformation in the DB18C6 part. The water molecules form a variety of hydration
networks in the boat-DB18C6 cavity. In DB18C6-(H2O)1, a water molecule forms the bidentate

2
hydrogen bond with the O atoms adjacent to the benzene rings. In this cluster, the water molecule is
preferentially hydrogen bonded from the bottom of boat-DB18C6. In the larger clusters, the
hydration networks are developed on the basis of the DB18C6-(H2O)1 cluster.
Introduction
Crown ether is one of the well known host molecules, along with calixarene and cyclodextrin.
These host molecules exhibit selective and cooperative encapsulation of ionic or neutral species, and
play vital roles in various kinds of chemical application such as phase transfer catalyst1 and
separation of chiral species.2 As can be seen in previous studies, the encapsulation is fairly
controlled by the conformation of host molecules and the non-covalent interaction between host and
guest molecules.3 Spectroscopic studies for host-guest complexes have been carried out mostly at
room temperature by absorption, fluorescence, NMR, IR, and Raman spectroscopy.4-8 Since the
energy scale of the non-covalent interaction in the complexes are comparable to the thermal energy,
only averaged aspects of the host-guest complexes were examined in these studies. Matsuura et al.
measured Raman spectra of 18-crown-6/water system at liquid nitrogen temperature.8 Ault et al.
measured IR spectra of (18-crown-6)–ClF, –Cl2, –HF, and –HCl complexes in argon matrix.9,10 In
both cases, Raman and IR spectra become sharper and simpler than those at room temperature,
suggesting that the cooling will be effective for shedding light on the details of the intermolecular
interaction in the host-guest complexes, free from congested spectral features. Supersonic jet
expansion is another powerful method for the cooling as well as for the solvent-free condition.
Very recently, we first reported a laser spectroscopic study on jet-cooled benzo-18-crown-6-ether
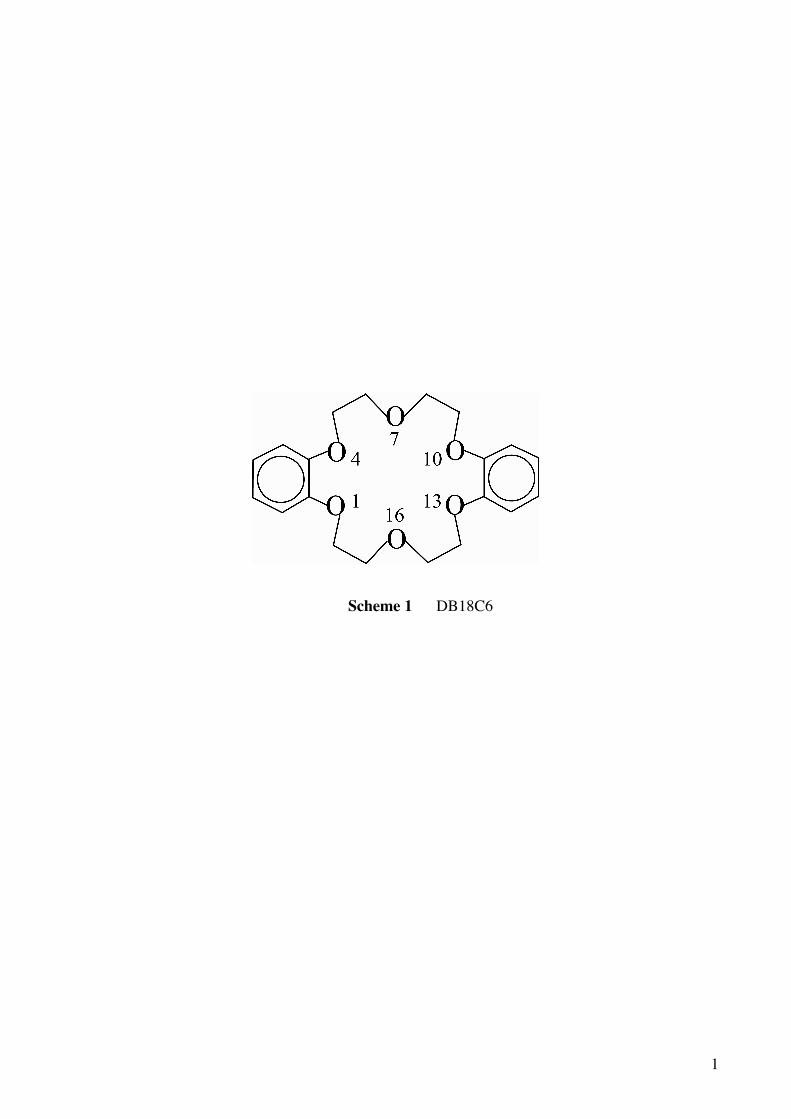
(B18C6) and dibenzo-18-crown-6-ether (DB18C6, scheme 1).11 In the paper, we discussed the
conformation of B18C6 and DB18C6, and the hydration structure of B18C6-(H2O)1 and DB18C6-
(H2O)1.
In the present work, we report the structure of DB18C6-(H2O)n with n = 0–4, by using laser
induced fluorescence (LIF), fluorescence-detected UV-UV hole-burning (HB), and IR-UV double-
3
resonance spectroscopy. We perform quantum chemical calculations to obtain probable structures
and IR spectra of DB18C6-(H2O)n. From the spectroscopic and calculated results, we discuss the
conformation of DB18C6 and the encapsulation structure of DB18C6-(H2O)n (n = 1–4).
Experimental
Details of the experiment were described in our previous papers.12,13 In brief, we used a
home-made pulsed nozzle to generate jet-cooled DB18C6. We attached a sample housing made of
poly-imido resin at the head of a commercially available nozzle (General Valve series 9). DB18C6
powder (Tokyo Kasei Kogyo) in the housing was heated to ~400 K. The mixture of DB18C6 and
water vapor with helium carrier gas (with a total pressure of 2 bar) was injected into vacuum through
the nozzle for generating a supersonic jet of DB18C6-(H2O)n. Partial pressure of water vapor was
controlled by regulating the temperature of a water container which was connected to the gas line.
For the LIF spectroscopic measurements, an output of a pulsed UV laser (Inrad, Autotracker
III (KDP) / Lambda Physik, Scanmate / Continuum, Surelite II) was introduced to the vacuum
chamber at ~30 mm downstream from the nozzle. Fluorescence was collected by a series of lenses
and detected by a photomultiplier tube (Hamamatsu Photonics, 1P28). For removing stray light, a
glass filter (CVI, CG-WG-295) was placed before the photomultiplier tube. LIF spectra were
obtained by plotting the fluorescence intensity as a function of UV frequency. For HB spectroscopy,
the UV laser in the LIF measurement was used for a probe light. The frequency of the probe UV
laser was fixed to a vibronic band of a single species and the fluorescence signal was monitored. A
pump UV laser (Inrad, Autotacker II (KDP)/ Continuum, ND6000/ Continuum, Surelite II) was
introduced to the jet at ~10 mm upstream of the probe position. The time interval between the
pump and the probe light was fixed to ~4 µs. When the pump laser frequency is resonant to a
transition of the species monitored, the species is excited to the upper state. This excitation by the
pump laser causes depletion of the fluorescence signal by the probe light. Thus, the electronic
spectrum of the monitored species was obtained as fluorescence dip spectra as a function of the
4
pump UV frequency. The experimental scheme of IR-UV double-resonance spectroscopy is similar
to that of HB spectroscopy. An output of a tunable IR laser (Laser Vision/ Quanta-Ray, GCR250)
was introduced coaxially with the UV probe laser ~100 ns prior to the probe pulse. The frequency
of the IR pump laser was scanned while monitoring the fluorescence signal. Depletion of the
fluorescence occurs when the IR frequency is resonant to a vibrational transition of the species
monitored. IR spectra in the S0 state were obtained as fluorescence dip spectra.
Geometry optimization and vibrational analysis were done at the B3LYP/6-31+G* level with
GAUSSIAN 03 program packege.14 A scaling factor of 0.9744 was employed to vibrational
frequencies calculated for comparison with the IR-UV double-resonance spectra.
Results
1. LIF and HB spectra
Fig. 1(a) shows the LIF spectrum of jet-cooled DB18C6 in the origin band region. The
spectrum was obtained under the condition with high water vapor pressure. The HB spectra
measured by monitoring bands m1, m2, a, and c–f are shown in Figs. 1(b)–1(h). Since the HB
spectra in Fig. 1 show different spectral features from each other, bands m1, m2, a, and c–e in the
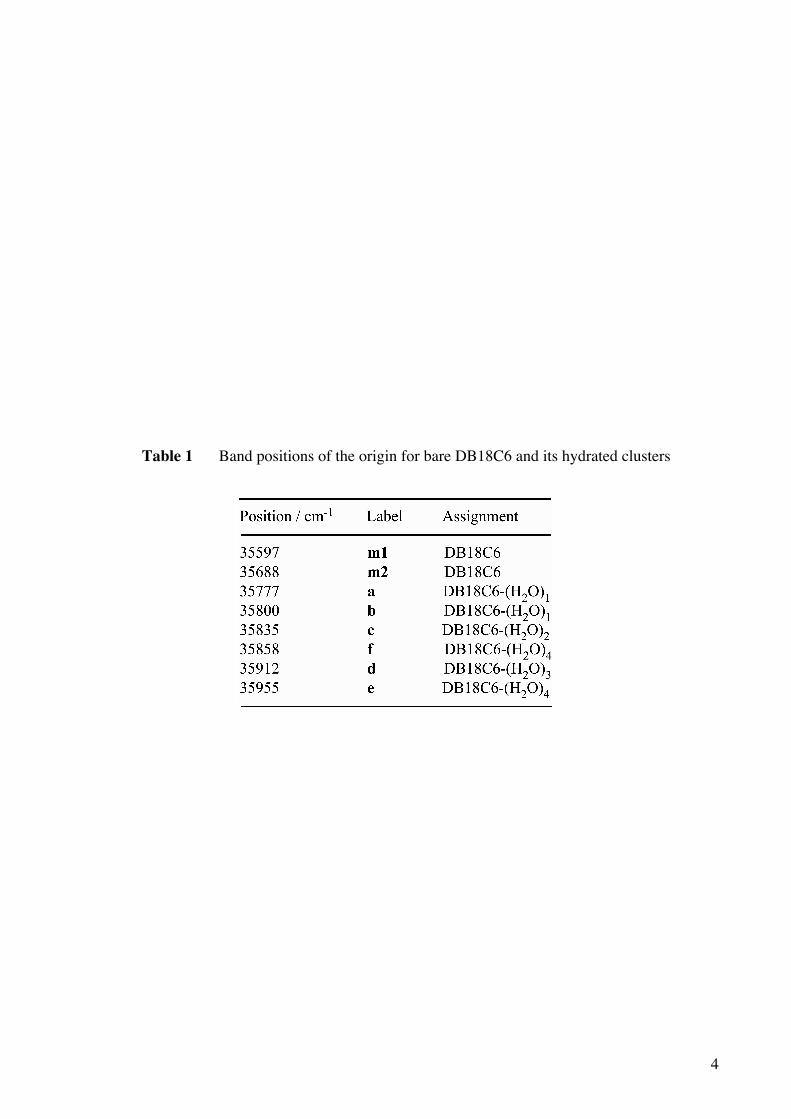
LIF spectrum are assigned to the origin bands of different species. The frequencies of the origin
bands are listed in Table 1. Bands m1 and m2 are assigned to different conformers of bare DB18C6,
because they do not exhibit any bands assignable to the OH stretching vibration in the IR spectra.11
Bands a–f can be ascribed to hydrated clusters DB18C6-(H2O)n. These bands are very weak
without the addition of water vapor. But their intensities increase drastically by adding water vapor
to the sample gas, and the IR-UV double-resonance spectra for these bands show the OH stretching
vibrations of water molecules, as shown later. In the HB spectra of m2, a, and c–e, the origin bands
are accompanied by a band with a small interval of ~5 cm-1, while the origin band of m1 is isolated
from other bands. Similar with the origin band, the HB spectra for m2, a, and c–e show several
pairs of two bands which are separated by ~5 cm-1.

5
2. IR-UV double-resonance spectra
Figs. 2(a)–2(f) show the IR-UV double-resonance spectra observed by probing bands a–f in
the LIF spectrum. All the bands in this IR region are ascribed to the OH stretching vibration of
water molecule(s). The IR spectra of a and b clearly show two OH stretching bands, suggesting
that bands a and b in the LIF spectrum are due to DB18C6-(H2O)1. As seen in Fig. 2(c), the IR
spectrum of band c displays four bands in this region. Therefore, band c is assignable to a DB18C6-
(H2O)2 cluster. The IR spectra of d–f have more than four OH bands; bands d–f are attributed to
DB18C6-(H2O)n with n > 3. Stick diagrams in the lower panels in Fig. 2 show the IR spectra
calculated for optimized structures of DB18C6-(H2O)n with n = 1–4. Details of the calculated
spectra, the optimized structures, and the assignment of the IR-UV double-resonance spectra are
mentioned in the next section.
Discussion
1. Bare DB18C6: bands m1 and m2
We first discuss the conformation of bare DB18C6 corresponding to bands m1 and m2. We
carried out geometry optimization of bare DB18C6 by DFT calculation at the B3LYP/6-31+G* level
and obtained three conformers. Figs. 3(a)–3(c) show the stable conformers of bare DB18C6 and
their total energies relative to that of the most stable one, which are given after the zero point energy
correction. The most stable isomer is a "boat" form, which belongs to C2v point group (Fig. 3(a)).
The other two conformers are different types of "chair" forms (Figs. 3(b) and 3(c)), both of which
belong to Ci point group. We call them "chair I" and "chair II". In our previous paper,11 chair II
was predicted to be the second most stable conformer. However, as seen in Fig. 3, we found
another isomer (chair I) which is more stable than chair II. A major difference between the two
chair forms is the conformation of four –O–CH2– frames connecting to the benzene rings. In chair I,
all the atoms of the –C–O–C=C–O–C– frame, where the C=C part of the frame stands for the carbon
atoms of the benzene rings, is in the same plane. In chair II, two of the four –O–CH2– frames are

6
twisted out of the planes. In Table 2, we list the observed transition energies and the S1←S0 and
S2←S0 transition energies of the three conformers obtained by time dependent (TD)-DFT calculation
at the B3LYP/6-31+G* level. The calculations show that the S1←S0 energy of chair I is the lowest
among those of the three forms, while chair II shows the highest energy. The result that the
transition energy of chair II is highest in the three conformers can be explained by the difference of
the delocalization of the π-orbitals. The electronic transition of DB18C6 is essentially the π-π*
transition of dimethoxybenzene (DMB). The π-π* transition energy decreases when the π-orbitals
largely extend to the adjacent O atoms. This delocalization can occur for boat and chair I
conformers, because all the atoms of the –C–O–C=C–O–C– frames are in the same planes of the
benzene rings. In chair II, on the contrary, the frames are twisted out of the benzene planes,
resulting in less delocalization of the π-orbitals and higher S1←S0 energy than "boat" and "chair I"
conformers. Thus, on the basis of relative energies and transition energies of the three conformers,
band m2, which is much stronger than m1 and located on the blue side of m1 in the LIF spectrum,
can be assigned to the boat conformer and m1 is to chair I conformer. These assignments are
reasonable since both boat and chair I conformers were found in a crystal.15
One noticeable feature of band m2 is that this band is accompanied by low frequency bands
with interval of 5 and 13 cm-1, while band m1 is isolated from other peaks. A possible assignment
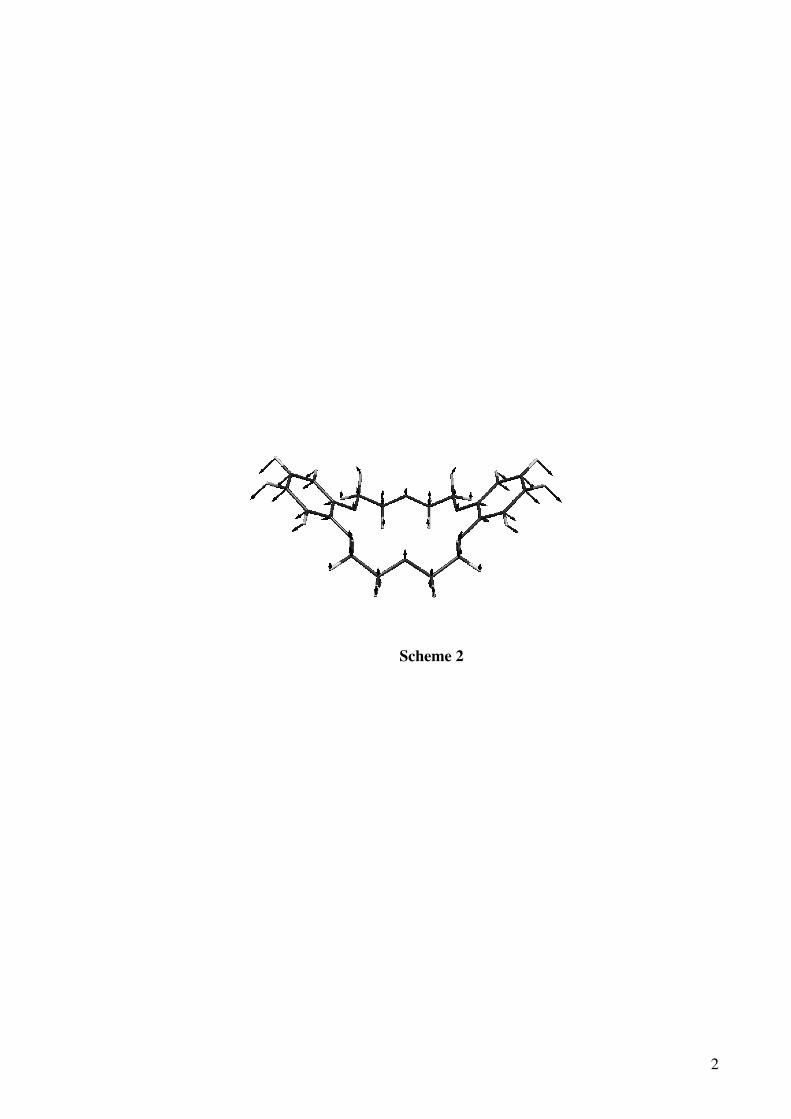
of such low frequency bands is the "butterfly" mode shown in scheme 2. By the DFT calculation in
S0, we obtained the vibrational frequency of 21 cm-1 for the "butterfly" mode, which is the lowest
frequency vibration in boat-DB18C6. Although the calculated frequency is for S0, the 5 cm-1
interval seems too low and the 13 cm-1 band is more probable to be assigned to the "butterfly" mode
in S1. Interestingly, in the HB spectrum of Fig. 2(c) the 13 cm-1 band is also accompanied by another
band with a 5 cm-1 interval. Therefore, it is quite probable that the bands accompanied with the 5
cm-1 interval is not due to the lowest frequency vibronic band.
The possible assignment of the 5 cm-1 band is due to exciton splitting. DB18C6 is regarded as
a combination of two DMB moieties. The excited states of DB18C6 can be expressed by linear

7
combinations of and :
S1 : (1a)
S2 : (1b)
where and stand for wavefunctions of DMB in the S1 and S0 states, respectively. For the boat
form, which has C2v symmetry, transitions from the S0(A1) state to both the S1(B1) and the S2(A1)
states are dipole allowed. On the contrary, in the chair forms, which have Ci symmetry, only the
transition to the S1(Au) state is dipole allowed. Therefore, the 5 cm-1 splitting of m2 can correspond
to the S2-S1 energy difference of boat-DB18C6, while the splitting does not appear in chair-DB18C6
due to symmetrical reason. In the weak interaction model, the S2–S1 spitting energy of a molecule
having equivalent two chromophores is given by 16, 17
€
Δ E = 2FVAB (2)
, where
€
VAB =µA ⋅µB
4πε0RAB3 (2cosθA cosθB − sinθA sinθB cosϕ) (3)
RAB is the distance between the two centers of the chromophores, θA and θB are the angles of the
transition dipole moment to the line connecting the two centers, and ϕ is the dihedral angle between
the two transition dipoles (scheme 3). VAB is the electronic part and F, which is the Franck-Condon
factor on the transition, is the vibrational part. To obtain VAB, we first calculated the oscillator
strength for the S1←S0 transition of DMB at the TD-DFT B3LYP/6-31+G* level. The calculated
S1←S0 oscillator strength of DMB is 0.049, which corresponds to the transition dipole moment of
= 5.5 × 10⁻³⁰ C·m. In boat-DB18C6, the values of θA, θB, ϕ and RAB are 320º, 220º, 0º, and
8.8 Å, respectively. By using these values, we obtain 70 cm-1 for 2VAB. The validity of the
estimation of the 70 cm-1 S2–S1 exciton splitting energy in boat-DB18C6 is supported by the TD-
DFT calculation given in Table 2; from the S1←S0 and S2←S0 transition energies, we obtain 82 cm-1

8
for the S2–S1 energy difference of boat-DB18C6. Estimation of the vibrational part F in eq. (2) is
difficult, because we do not know the Franck-Condon factor of the S1←S0 transition. Instead, we
estimated F from the relative transition intensity of the origin band from the LIF and UV-UV hole
burning spectra in Fig. 2(a) and 2(c). A roughly estimated ratio of the origin band LIF intensity to
the total LIF intensity is ~10%. This value and the calculated ΔE give 7 cm-1 for the origin band
splitting. Though this estimated value may have a large uncertainty, the value is in reasonable
agreement with the experimental observation (5 cm-1). Therefore, the 5 cm-1 split of band m2 can be
described to the exciton splitting.
2. DB18C6-(H2O)1: Bands a and b
The HB spectrum of band a (Fig. 1(d)) shows a doublet structure with 5 cm-1 interval, similar
to the HB spectrum of m2, indicating that the DB18C6 component of the species of band a has a
boat form. Fig. 2(a) shows the IR-UV spectrum of band a in the OH stretching region. The
spectrum of band a has already been reported in our previous paper.10 Since two bands appear in
the spectrum, band a is assigned to DB18C6-(H2O)1. The intensities of the two bands are
comparable with each other. In addition, their band positions (3580 and 3648 cm-1) are lower than
the symmetric and anti-symmetric stretching OH vibrations of a water molecule by 77 and 108 cm-1.
Thus, the two OH groups of the water molecule take part in the hydrogen bond (H-bond) as a double
hydrogen donor (bidentate). In the LIF spectrum, band a is located at 89 cm-1 higher frequency
from band m2. The magnitude of the blue-shift is similar to that of DMB-(H2O)1 with respect to
bare DMB (127cm-1).19 In DMB-(H2O)1, a water molecule is bound to the O atoms of the methoxy
groups via two O–H···O hydrogen-bonds. Thus, the similarity of the blue-shift indicates that in the
species of band a the OH groups of the water molecule are bonded to the O atoms next to the
benzene rings. The IR-UV double-resonance spectrum of band b (Fig. 2(b)) shows two OH
stretching bands with positions different from those of band a (Fig. 2(a)). Therefore, band b is
assigned to another DB18C6-(H2O)1 isomer with a bidentate H-bond. The frequencies of the two
OH stretching vibrations are slightly higher for b, suggesting weaker bidentate H-bond in the band b

9
species. Band b is not so largely apart from band a in the LIF spectrum. Therefore, the band b
species may probably have a boat conformer like the band a species.
For DB18C6-(H2O)n, it is quite time-consuming work to find all the structures by quantum
chemical calculations. Thus, in this work, we try to search particular isomers which reproduce the
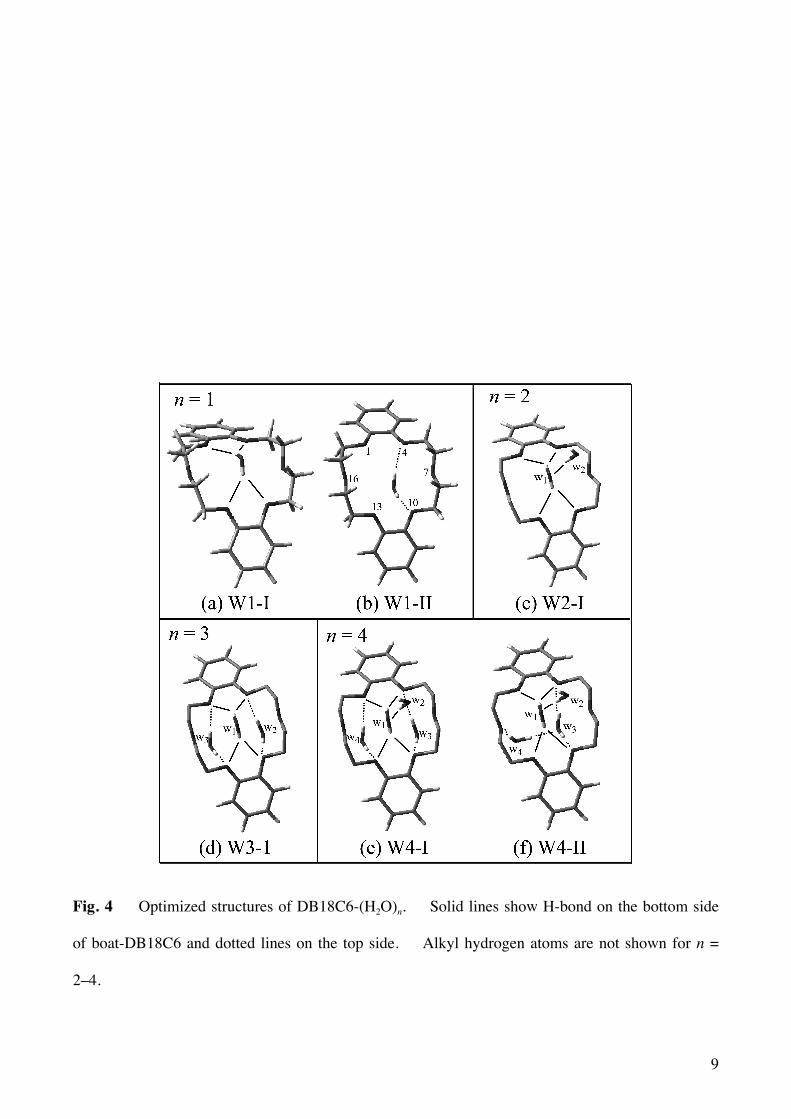
observed IR spectra. Fig. 4(a) and 4(b) show two optimized structures of DB18C6-(H2O)1 with boat
conformation (W1-I and W1-II). In these structures, a water molecule is H-bonded to the O atoms
adjacent to the benzene rings of DB18C6 as a bidentate form. In W1-I, the OH groups of the water
molecule point to the middle positions between O1 and O4 and between O10 and O13, and the cluster
has C2v symmetry. In W1-II, the OH groups are bonded directly to O4 and O10. The IR spectra
calculated for W1-I and W1-II are shown in the lower panels of Fig. 2(a) and 2(b) as stick diagram.
Both W1-I and W1-II display the symmetric and anti-symmetric OH stretching vibrations around
~3600 and ~3700 cm-1, respectively. These IR spectra well coincide with the IR-UV spectra of
bands a and b. We attribute bands a and b to W1-I and W1-II, respectively, because the OH
stretching frequencies of W1-I are slightly lower than those of W1-II, which reprocece the IR-UV
spectra of bands a and b. The effect of the bidentate H-bond like W1-I is seen in the HB spectrum
of band a. As described above, we assigned the vibronic band at 13 cm-1 above band m2 to the
butterfly vibration. The HB spectrum of band a shows that the frequency of this vibration increases
to 20 cm-1. This increase indicates that the bidentate water molecule in W1-I makes the crown-ether
frame more rigid and the frequency of the batterfly vibration higher than bare DB18C6.
The stronger H-bond in W1-I than W1-II can be examined with the charge distribution. Fig.
5(a) and 5(b) show a top and bottom view of the electrostatic potential of boat-DB18C6. The
negative charge on O1, O4, O10, and O13 atoms is well exposed to the bottom. Therefore, a water
molecule can form the H-bond to O1, O4, O10, and O13 atoms more strongly on the bottom side (W1-I)
than on the top side (W1-II). Fig. 5(c) and 5(d) show a top and bottom view of the electrostatic
potential of W1-I. Formation of the H-bond with a water molecule makes the negative charge on O1,
O4, O10, and O13 atoms relatively smaller than the case of bare DB18C6. On the other hand, the O
10
atom of the water molecule has large negative charge; the Mulliken charge of the water O atom is –
1.1. This charge in W1-I plays a very important role for the H-bond formation with additional
water molecules.
3. DB18C6-(H2O)2: band c
The HB spectrum of band c (Fig. 1(e)) also exhibits a doublet structure of ~5 cm-1 interval.
Thus, the DB18C6 component in the band c species also has boat form. The IR-UV double-
resonance spectrum of band c (Fig. 2c) shows four OH stretching bands, indicating that band c is
attributed to DB18C6-(H2O)2. By the comparison of the IR spectra of bands a and c, we can assign
the IR bands at 3562 and 3623 cm-1 in Fig. 2(c) to the symmetric and anti-symmetric OH stretching
vibrations of a bidentate water, which are red-shifted by 18 and 25 cm-1 from those of band a (Fig.
2(a)), respectively. The red-shift of the two OH stretching vibrations of the bidentate water implies
that the O atom of the bidentate water accepts the second water molecule. The bands at 3401 and
3716 cm-1 can be assigned to the H-bonded and free OH stretching vibrations of the second water
molecule, respectively. The H-bonded OH stretching frequency (3401 cm-1) is quite lower than that
of water molecule with the normal σ-type H-bond. For example, the frequency of the H-bonded
OH stretching vibration in water dimer, (H2O)2, is 3530 cm-1.19 Therefore, the H-bond of the second
water molecule in the band c species is much stronger than that in (H2O)2.
Fig. 4(c) shows the most probable structure for the species of band c (W2-I). In W2-I, the
second water molecule (w2) is H-bonded to the O atom of the bidentate water molecule (w1). The
IR spectrum calculated for W2-I is shown in Fig. 2(c). The red-shift of the symmetric and anti-
symmetric vibrations of w1 in W2-I is 17 and 25 cm-1 from those of W1-I, respectively. These
values are similar to the red-shifts of the OH stretch bands of band a with respect to those of band c
(18 and 25 cm-1). As shown in Fig. 5(d), the O atom of the bidentate water molecule is strongly
negatively charged in W1-I, which is a good target of the H-bond. Thus, the second water molecule
(w2) is strongly H-bonded to the first water (w1).
11
4. DB18C6-(H2O)3: band d
On the basis of the doublet feature for band d (Fig. 1(f)), we can say that the DB18C6
component in the band d species also has a boat form. Fig. 2(d) shows the IR-UV spectrum of band
d. There are six OH stretching bands in the spectrum; band d in the LIF spectrum can be assigned
to DB18C6-(H2O)3. Different from the IR spectrum of band c, all the bands are located close to
each other and no band is observed at the position of the free OH band (~3715 cm-1). This result
suggests that in this cluster there is no single-donor water molecule and all the water molecules form
the bidentate H-bond. On the basis of the IR band positions in Fig. 2(a) and 2(b), we classify the six
bands in Fig. 2(d) into three pairs: (1) 3575 and 3648 cm-1, (2) 3601 and 3663 cm-1, and (3) 3627 and
3685 cm-1. The lower and higher frequency bands for each pair are assignable to the symmetric and
anti-symmetric OH stretching vibrations, respectively. The frequencies of the lowest frequency pair
(3575 and 3648 cm-1) are very close to those of band a (3580 and 3648 cm-1). Therefore, this pair
can be assigned to a bidentate water molecule bonded on the bottom of the boat conformer like W1-I.
The frequencies of the other two pairs are close to those of band b (3606 and 3679 cm-1). Thus, the
water molecules corresponding to these pairs are thought to form weaker bidentate H-bonds on the
top of the boat form like W1-II.
From the IR spectral feature, the band d species has one and two water molecule(s) on the
bottom and the top sides of a boat conformer, respectively. Fig. 4(d) (W3-I) represents the most
probable structure of band d. This cluster belongs to C2v point group. In this structure, one
molecule (w1) is on the bottom side of boat-DB18C6 and forms the bidentate H-bond like W1-I.
The other two water molecules (w2 and w3) are located on the top side and form two bidentate H-
bonds to the O atoms near the benzene rings like W1-II. The IR spectrum calculated for W3-I is
shown in Fig. 2(d). Although each of the bands at ~3650 and ~3730cm-1 seems to be a single band,
there are two close bands assignable to w2 and w3 at each position. The positions of the six bands of
W3-I agree with those of the IR-UV spectrum of band d.

12
5. DB18C6-(H2O)4: bands e and f
The doublet feature in the HB spectrum of band e (Fig. 1(g)) also suggests a boat conformer in
the band e species. Fig. 2(e) shows the IR-UV spectrum measured by monitoring band e. Seven
bands are clearly observed, and the band at 3620 cm-1 has a shoulder on the higher frequency side.
Therefore, band e in the LIF spectrum is assigned to DB18C6-(H2O)4. The 3422 and 3716 cm-1
bands are assigned to the H-bonded and free OH stretching vibrations of a single-donor water,
respectively. The band positions are similar to the lowest and the highest bands of c (Fig. 2(c),
3401 and 3716 cm-1). Therefore, in the band e cluster, there is a single-donor water molecule like
w2 in W2-I. This result also implies that there is a water molecule corresponding to w1 in W2-I.
From the band positions of w1 in Fig. 2(c) (3562 and 3623 cm-1), the 3553 and 3620 cm-1 bands in
Fig. 2(e) can be ascribed to the w1 molecule in the band e species. The bands at 3596, 3643, and
3686 cm-1 along with the shoulder near the 3620 cm-1 band in Fig. 2(e) are close to the 3601, 3627,
3663, and 3685 cm-1 bands in Fig. 2(d), suggesting that there are also two bidentate water molecules
like w2 and w3 of W3-I in the band e species. Unfortunately, in our quantum chemical calculations
we cannot obtain any optimized DB18C6-(H2O)4 isomer whose IR spectrum matches the observed
IR spectrum. Instead, we present a probable structure (W4-I) of band e in Fig. 4(e). In this
structure, w1, w3, and w4 are H-bonded similar to W3-I, and w2 is H-bonded to w1 similar to W2-I.
Fig. 2(f) shows the IR-UV double-resonance spectrum of band f. From the similarity of the
IR band position, the 3438 cm-1 band can be assigned to the single-donor OH vibration of a water
molecule like w2 in W2-I. The band at 3714 cm-1 is assigned to the free OH stretching vibration of
the same water molecule. Since only one peak is observed in the free OH stretching region, there is
one single-donor water molecule in the band f species. The 3529 cm-1 band is characteristic of the
IR spectrum of band f; the other observed IR spectra in Fig. 2 do not show a band around 3529 cm-1.
The 3529 cm-1 band is located on the lower frequency side of the bands of the bidentate water
molecules like w1–w3 of W3-I. In addition, the width of the 3529 cm-1 band is much broader than
those of the bidentate water molecules. Therefore, the 3529 cm-1 band cannot be assigned to a

13
bidentate water molecule to the ether ring. It is necessary to consider a different type of H-bond for
the 3529 cm-1 band.
In Fig. 4(f) (W4-II) is shown a probable structure for band f. In W4-II, w1 and w2 construct
the bidentate and single-donor H-bonded network like W2-I. The water molecules labeled by w3
and w4 are located on the top side of boat-DB18C6 and form a new H-bond network. One water
molecule (w3) is bonded to the ether O atoms (O4 and O10) with a bidentate manner, and the other
one (w4) forms a bridge between an ether O atom (O16) and the O atom of w3. This type of the H-
bond network was also found in the 18-crown-6-ether/water system at liquid nitrogen temperate.8
The IR spectrum calculated for W4-II is displayed in Fig. 2(f). As connected by solid lines, the IR
spectrum calculated for W4-II well reproduces the IR-UV spectrum observed for band f. In
particular, the calculation predicts a band at ~3500 cm-1, which is the stretching vibration of w4
bonded to the O atom of w3. This band corresponds to the band at 3529 cm-1 in the IR-UV spectrum
observed for band f.
Summary
The electronic and IR spectra of jet-cooled DB18C6-(H2O)n (n = 0–4) have been observed by
LIF, UV-UV hole-burning, and IR-UV double-resonance spectroscopy. With the aid of quantum
chemical calculations (B3LYP/6-31+G*), we have revealed detailed pictures of hydrated DB18C6
structures. For bare DB18C6, two conformers were identified as "boat" form and "chair-I" form, in
which the boat conformer is dominant. All the electronic transitions of six hydrated clusters appear
in higher frequency region compared with bare DB18C6 and shift to blue with increasing the cluster
size. The H-bond networks are mainly constructed on the boat conformer. In DB18C6-(H2O)1, two
isomers have been identified (W1-I and W1-II). In these isomers, a water molecule forms a
bidentate H-bond to the O atoms connected to the benzene rings from the bottom (W1-I) and from
the top (W1-II) of boat-DB18C6. In DB18C6-(H2O)n with n > 2, the H-bond network grows on the
basis of W1-I. On the bottom side of W1-I, a water molecule is further H-bonded to the O atom of

14
the bidentate water molecule. On the top side, two types of H-bond networks are formed by two
water molecules: (1) both water molecules are independently H-bonded to the four ether O atoms
(O1, O4, O10, and O13) adjacent to the benzene rings by the bidentate manner, (2) one water molecule
has a bidentate H-bond with the O4 and O10 atoms, and the other water molecule forms a bridge
between the O atom of the bidentate water molecule and the O16 atom of the ether frame. Thus, the
present work revealed that DB18C6 has a high ability of encapsulating of water molecules with a
variety of H-bond network.
Acknowledgements
We gratefully thank Dr. Y. Yamada for valuable discussion from Kobe University. This work
is supported by JSPS through a Grant in-Aid project (# 18205003 and # 19655004) and by the
MEXT, Japan through the Grant-in-Aid for the Scientific Research on Priority Area "Molecular
Science for Supra Functional Systems" [477].
Reference
1 A. M. Stuart, J. A. Vidal, J. Org. Chem., 2007, 72, 3735.
2 M. H. Hyun, S. C. Han, H. J. Choi, B. S. Kang, H. J. Ha, J. Chromatogr. A, 2007, 1138, 169.
3 A. Bogdanova, M. W. Perkovic, V. V. Popik, J. Org. Chem., 2005, 70, 9867.
4 Y. V. Fedorov, O. Fedorova, N. Schepel, M. Alfimov, A. M. Turek, J. Saltiel, J. Phys. Chem. A,
2005, 109, 8653.
5 G. W. Buchanan, M. F. Rastegar, Solid State Nucl. Magn. Reson., 2001, 20, 137.
6 A. S. Denisova, E. M. Dem’yanchuk, G. L. Starova, L. A. Myund, A. A. Makarov, A. A.
Simanova, J. Mol. Structure, 2007, 828, 1.

15
7 C. Endicott, H. L. Strauss, J. Phys. Chem. A, 2007, 111, 1236.
8 K. Fukuhara, M. Tachikake, S. Matsumoto, H. Matsuura, J. Phys. Chem., 1995, 99, 8617.
9 H. Bai, B. S. Ault, J. Mol. Struct., 1989, 196, 47.
10 B. S. Ault, J. Mol. Struct., 1989, 93, 279.
11 R. Kusaka, Y. Inokuchi, T. Ebata, Phys. Chem. Chem. Phys., 2007, 9, 4452.
12 T. Ebata, T. Hashimoto, T. Ito, Y. Inokuchi, F. Altunsu, B. Brutschy, P. Tarakeshwar, Phys.
Chem. Chem. Phys., 2006, 8, 4783.
13 Y. Inokuchi, Y. Kobayashi, T. Ito, T. Ebata, J. Phys. Chem. A, 2007, 111, 3209.
14 M. J. Frisch et al., Gaussian 03, Rvision B.05, Gaussian, Inc., Pittsburgh PA, 2003.
15 D. Bright, M. R. Truter, J. Chem. Soc. B, 1970, 8, 1544.
16 A. Müller, F. Talbot, S. Leutwyler, J. Chem. Phys., 2002, 116, 2836.
17 J. E. Wessel, J. A. Syage, J. Phys. Chem. 1990, 94, 737.
18 J. T. Yi, J. W. Ribblett, D. W. Pratt, J. Phys. Chem. A, 2005, 109, 9456.
19 Z. S. Hang, R. E. Miller, J. Chem. Phys., 1989, 91, 6613.

16
1
Scheme 1 DB18C6
2
Scheme 2

3
Scheme 3 Symmetry axes and transition dipole moments of boat-DB18C6
4
Table 1 Band positions of the origin for bare DB18C6 and its hydrated clusters

5
Table 2 Transition energy (cm-1) and oscillator strength of S1←S0 and S2←S0. The
calculated values are obtained at the TD-B3LYP/6-31+G* level

6
Fig. 1 (a) LIF spectrum of DB18C6. (b)-(h) UV-UV hole-burning spectra measured by
monitoring bands m1, m2, a, and c–d in the LIF spectrum. The numbers in (c) and (d) show the
interval (cm-1) between the adjacent bands.

7
Fig. 2 IR-UV spectra measured by monitoring bands a–f in the LIF spectrum. Sticks in each
of the panels show IR spectra calculated for optimized structures.

8
Fig. 3 Optimized conformers for bare DB18C6: (a) boat, (b) chair I, and (c) chair II. The
numbers in the figure represent the total energies relative to that of the most stable conformer (boat).
The total energies are corrected by the zero-point vibrational energy.
9
Fig. 4 Optimized structures of DB18C6-(H2O)n. Solid lines show H-bond on the bottom side
of boat-DB18C6 and dotted lines on the top side. Alkyl hydrogen atoms are not shown for n =
2–4.

10
Fig. 5 Electrostatic potential from –0.08 a.u. (red) to +0.08 a.u. (blue) on the surface of the same
electron density (0.01 e/a03).

11
A graphical and textual abstract
The growth of hydrogen-bonding networks of water clusters inside the crown cavity has been
studied for dibenzo-18-crown-6-ether in a supersonic beam.