structure, function and evolution of metabolic networks (i) jing zhao college of pharmacy, second...
Post on 18-Dec-2015
232 views
TRANSCRIPT

Structure, Function andEvolution of Metabolic
Networks (I)
Jing Zhao
College of Pharmacy, Second Military Medical University Shanghai Center for Bioinformation and Technology
2009.5.25
Spring school on multiscale methods and modeling in biophysics and system biology, Shanghai, China
Outline
I. Reconstruction of metabolic networks
II. Network metrics and topological features
III.Modularity and network decomposition
IV.Topological diversity of networks with a given degree sequence
I. Reconstruction of metabolic networks
Zhao J, Yu H, Luo J, Cao Z, Li Y: Complex networks theory for analyzing metabolic networks. Chinese Science Bulletin 2006, 51(13):1529-1537.

What is network?
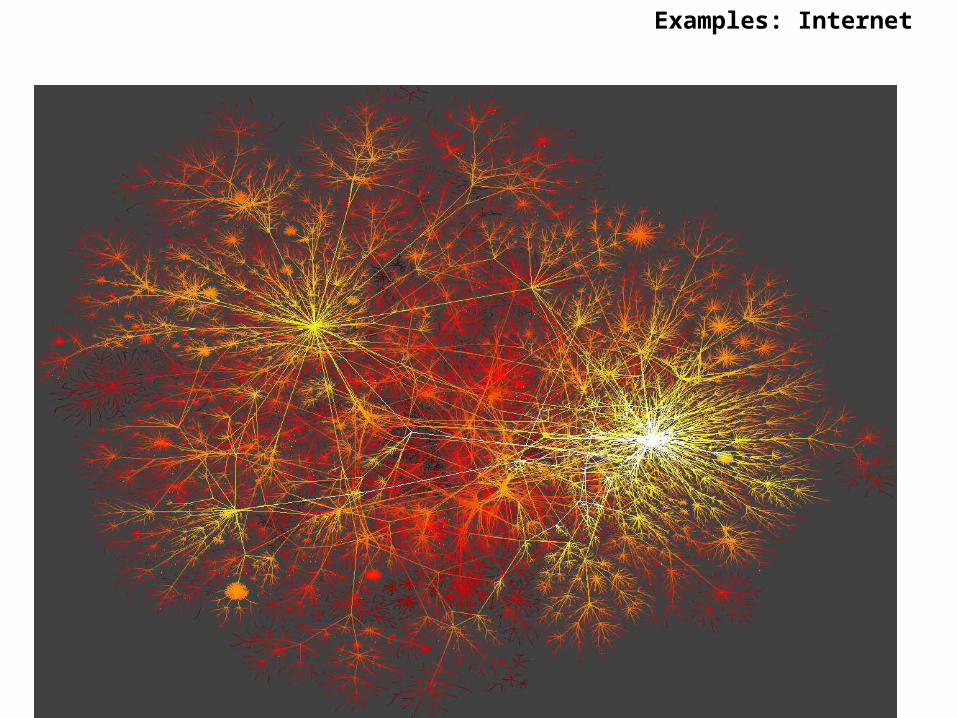
Examples: Internet
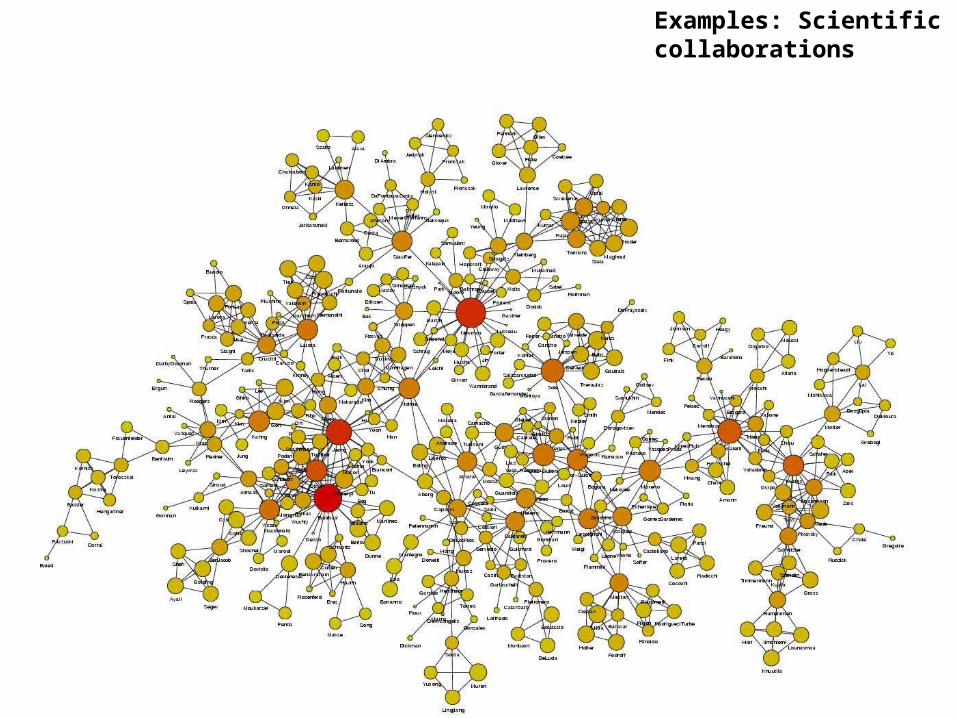
Examples: Scientific collaborations
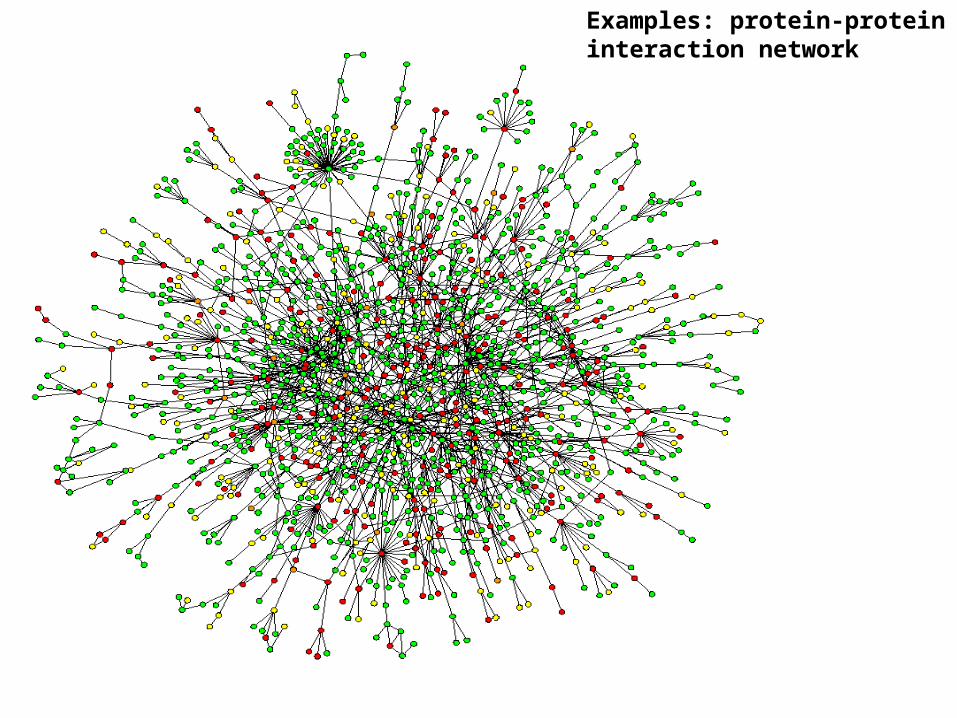
Examples: protein-protein interaction network

Metabolism

Examples: metabolic network

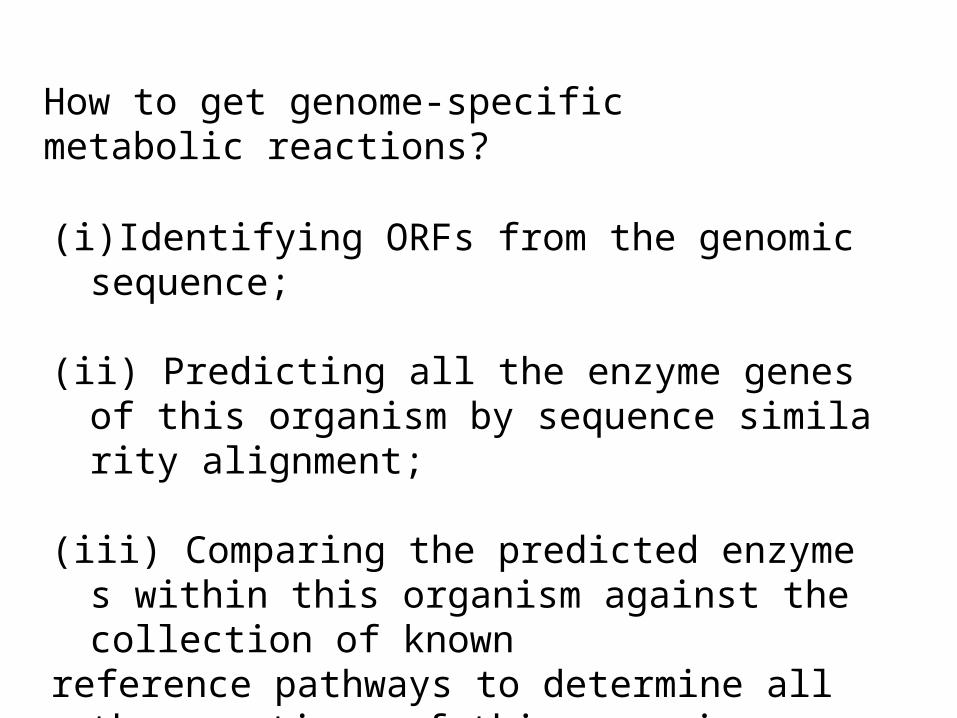
(i) Identifying ORFs from the genomic sequence;
(ii) Predicting all the enzyme genes of this organism by sequence similarity alignment;
(iii) Comparing the predicted enzymes within this organism against the collection of known
reference pathways to determine all the reactions of this organism.
How to get genome-specific metabolic reactions?

Two refined metabolism database for human being manually reconstructed:
• BiGG database Duarte, N. C.; Becker, S. A.; Jamshidi, N.; Thiele, I.; Mo, M. L.; Vo, T. D.; Srivas, R.; Palsson, B. O., Global reconstruction of the human metabolic network based on genomic and bibliomic data. PNAS 2007, 104, (6), 1777-1782.
• The Edinburgh human metabolic network Ma, H.; Sorokin, A.; Mazein, A.; Selkov, A.; Selkov, E.; Demin, O.; Goryanin, I., The Edinburgh human metabolic network reconstruction and its functional analysis. Molecular Systems Biology 2007, 3, 135.

Statistics for BiGG database

Process for reconstructing the Edinburgh human metabolic network
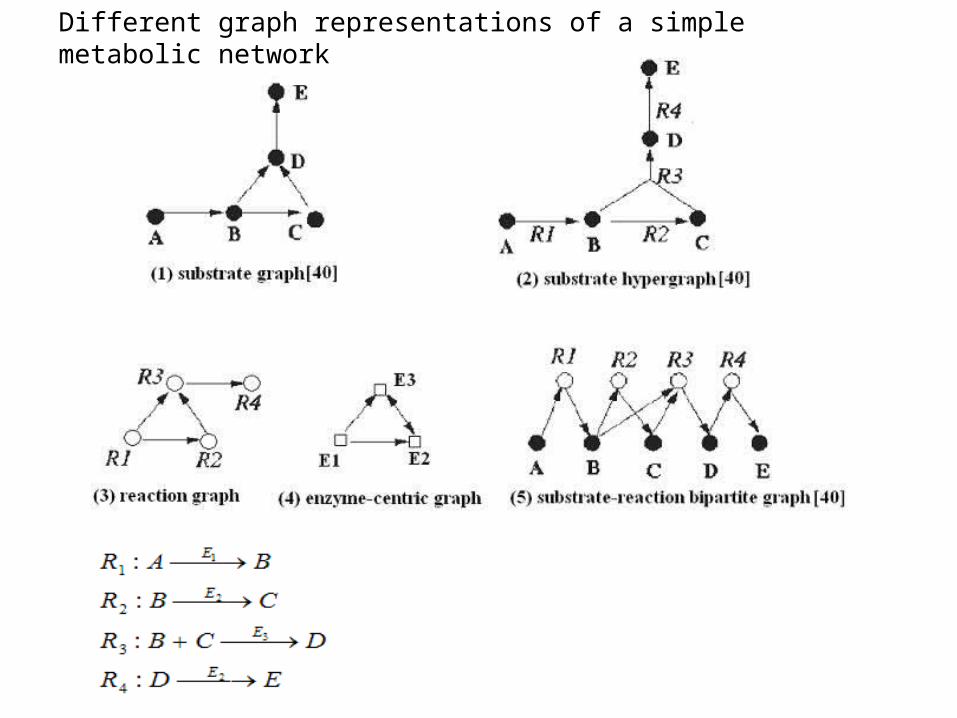
Different graph representations of a simple metabolic network

Currency metabolites
Ma H, Zeng A-P: Reconstruction of metabolic networks from genome data and analysis of their global structure for various organisms. Bioinformatics 2003, 19(2):270-277.

Currency metabolites

Definition: • currency metabolites have high degree• they make not meaningful shortcuts i.e. tie together distant parts of the network i.e. tie different modules together
Currency metabolites
Algorithm:Remove vertices in order of (currently) highest degree. The set of removed vertices that gives the network the highest modularity is the set of currency metabolites.
Huss M, Holme P: Currency and commodity metabolites: Their identification and relation to the modularity of metabolic networks. IET Systems Biology 2007, 1:280-285.
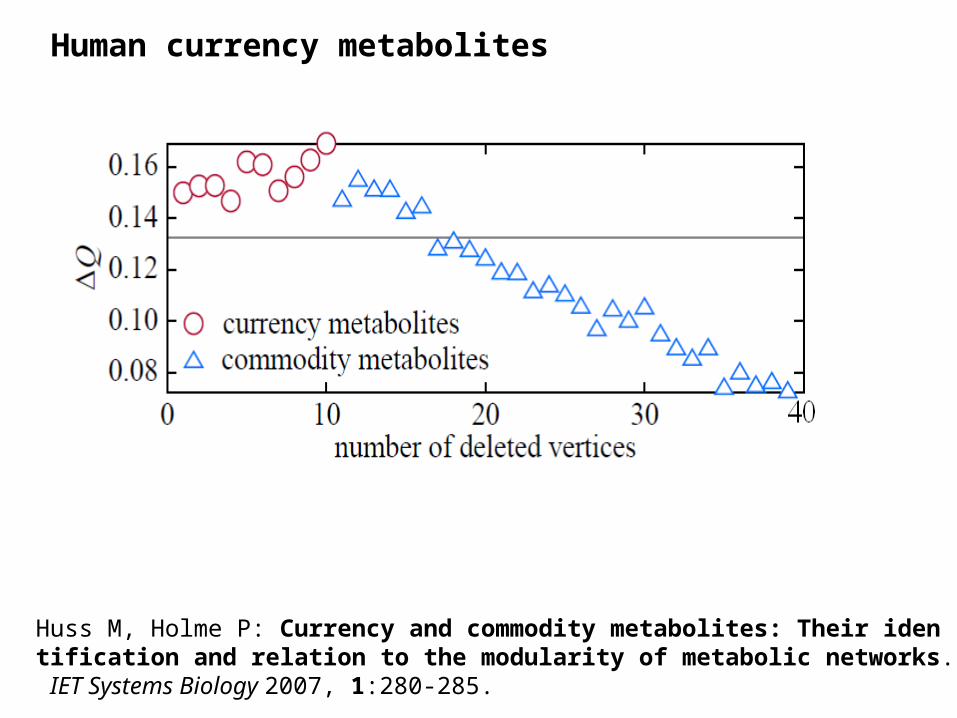
Human currency metabolites
Huss M, Holme P: Currency and commodity metabolites: Their identification and relation to the modularity of metabolic networks. IET Systems Biology 2007, 1:280-285.

Steps for reconstructing a metabolic network
1. Get reaction list
2. Generate substrate - product pair list
3. Delete currency metabolites
4. Generate metabolic network
Useful tool:
Text2pajek.exe

II. Network metrics and topological features
Zhao J, Yu H, Luo J, Cao Z, Li Y: Complex networks theory for analyzing metabolic networks. Chinese Science Bulletin 2006, 51(13):1529-1537.

network science
Measures of network structure. How does a network that is too large to draw .look. like? Real-world networks have both randomness and structure. How can we quantify network structure?
Models of evolving networks. How do networks get their structure? What .microscopic. properties are responsible for the macro-structure of the network.
Models of network changing events. Malicious attacks; overload breakdowns.
Classication and functional prediction. How can we classify vertices and predict their function in the network?
How does the network structure affect dynamic systemsof the network? Running dynamic simulations on top of the network and see how dynamic properties correlates with the network structure.
As for biochemical networks, what questions can we ask?
• how can the large-scale organization be characterized?
• are there any universal features over different species?
• do the differences tell us something about evolution?
• can we identify functional modules?
•. . the functions of molecules?
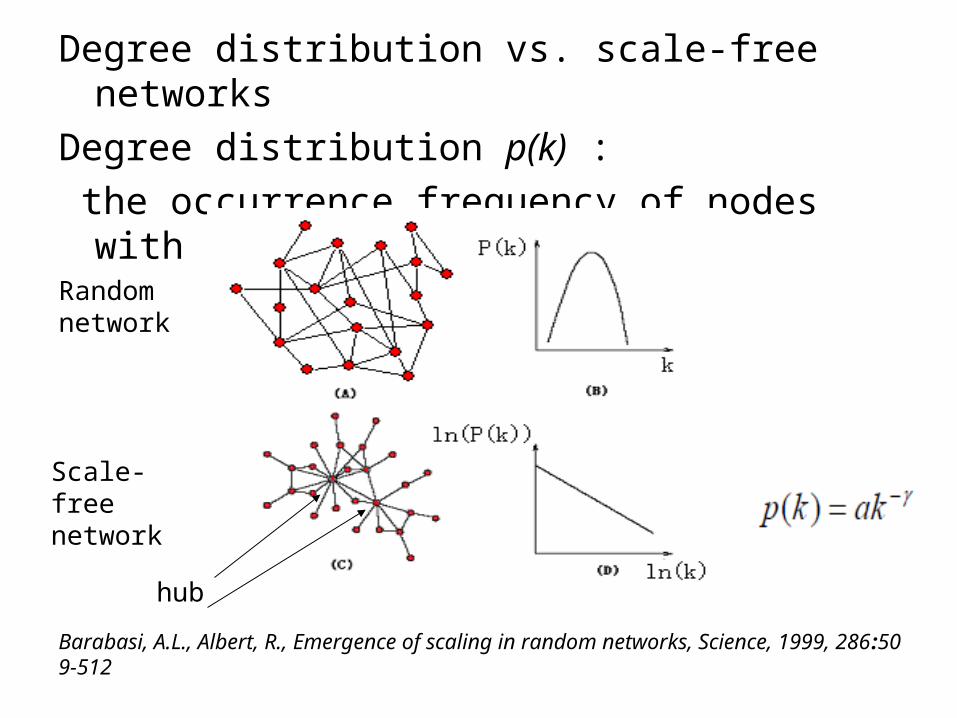
Degree distribution vs. scale-free networks
Degree distribution p(k) :
the occurrence frequency of nodes with degree k, (k=1,2,…).
Barabasi, A.L., Albert, R., Emergence of scaling in random networks, Science, 1999, 286:509-512
Random network
Scale-free network
hub
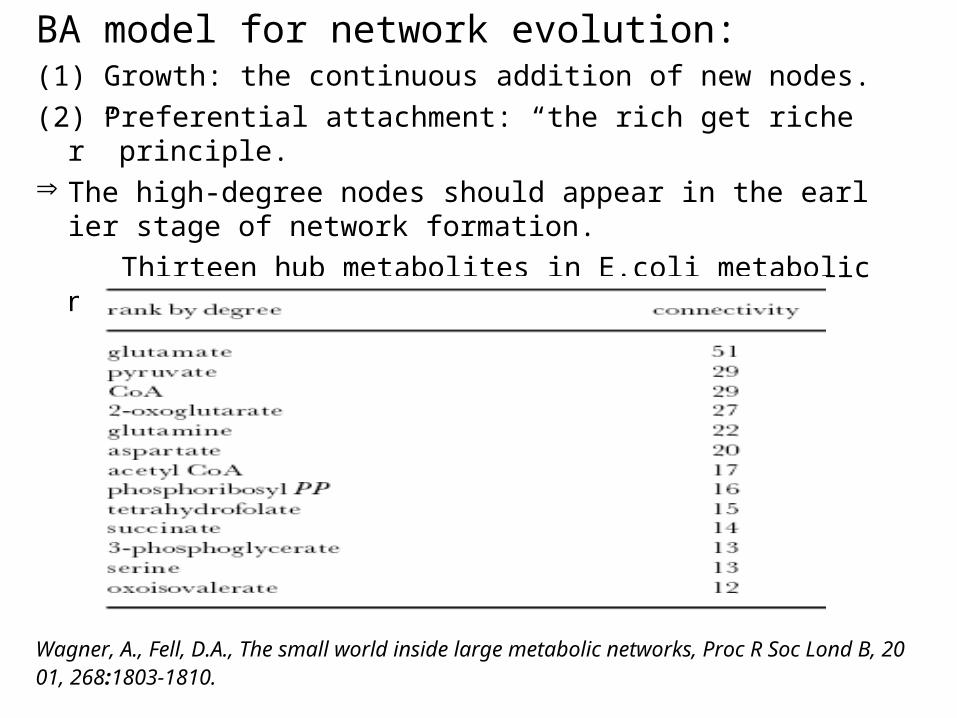
BA model for network evolution:(1) Growth: the continuous addition of new nodes.
(2) Preferential attachment: “the rich get richer” principle. The high-degree nodes should appear in the earlier stag
e of network formation.
Thirteen hub metabolites in E.coli metabolic network
Wagner, A., Fell, D.A., The small world inside large metabolic networks, Proc R Soc Lond B, 2001, 268:1803-1810.

Performance of scale-free networks:error tolerance: high resistance to random perturbations
attack vulnerability : the removal of a few hub nodes will destroy the whole network.
Albert, R., Jeong, H., Barabasi, A.-L., Error and attack tolerance of complex networks, Nature, 2000, 406:378-382.
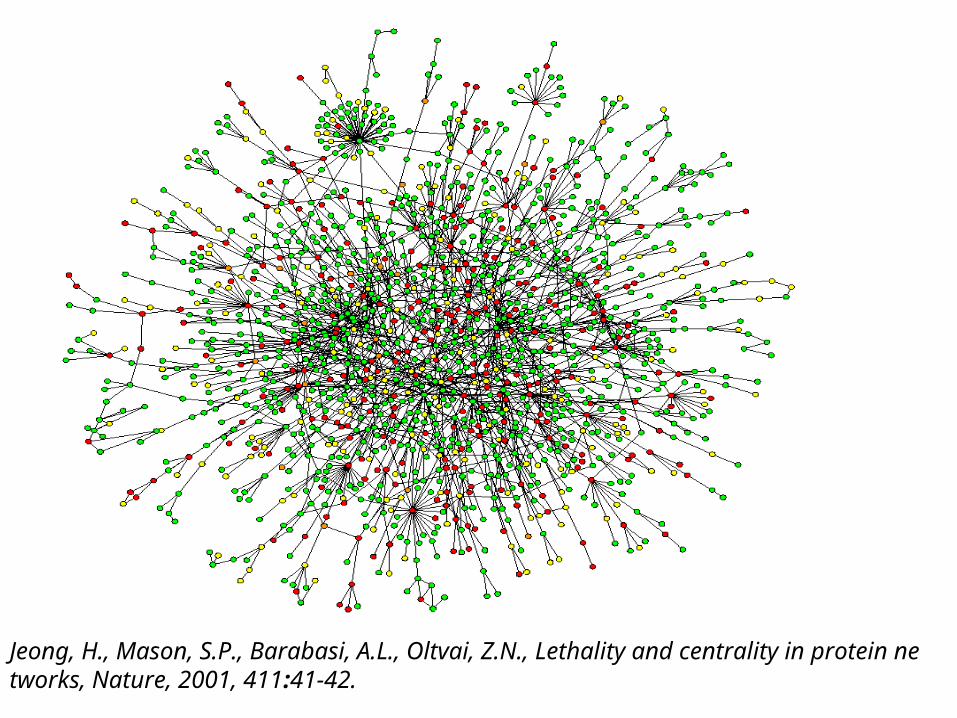
Jeong, H., Mason, S.P., Barabasi, A.L., Oltvai, Z.N., Lethality and centrality in protein networks, Nature, 2001, 411:41-42.
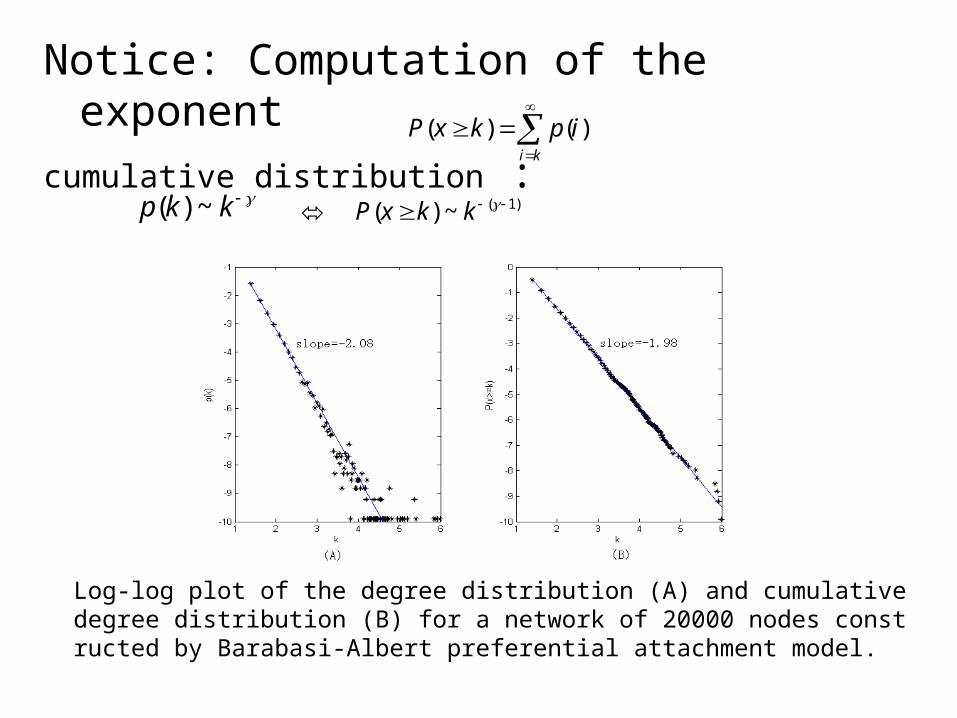
Notice: Computation of the exponent
cumulative distribution :
ki
ipkxP )()(
kkp ~)( )1(~)( kkxP
Log-log plot of the degree distribution (A) and cumulative degree distribution (B) for a network of 20000 nodes constructed by Barabasi-Albert preferential attachment model.

Clustering coefficient vs. Hierarchical modular networks
2 ( )( )
( )( ( ) 1)
N vCC v
d v d v
How many triangles are there in the network?
N(v): the number of links between neighbours of node vd(v) :the degree of node v
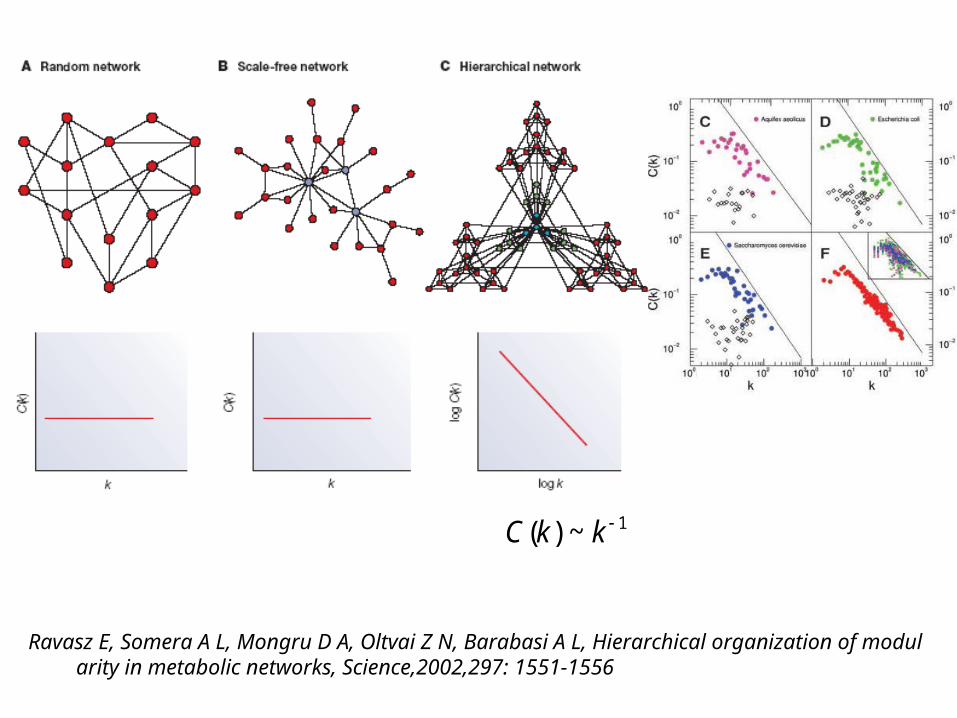
1~)( kkC
Ravasz E, Somera A L, Mongru D A, Oltvai Z N, Barabasi A L, Hierarchical organization of modularity in metabolic networks, Science,2002,297: 1551-1556
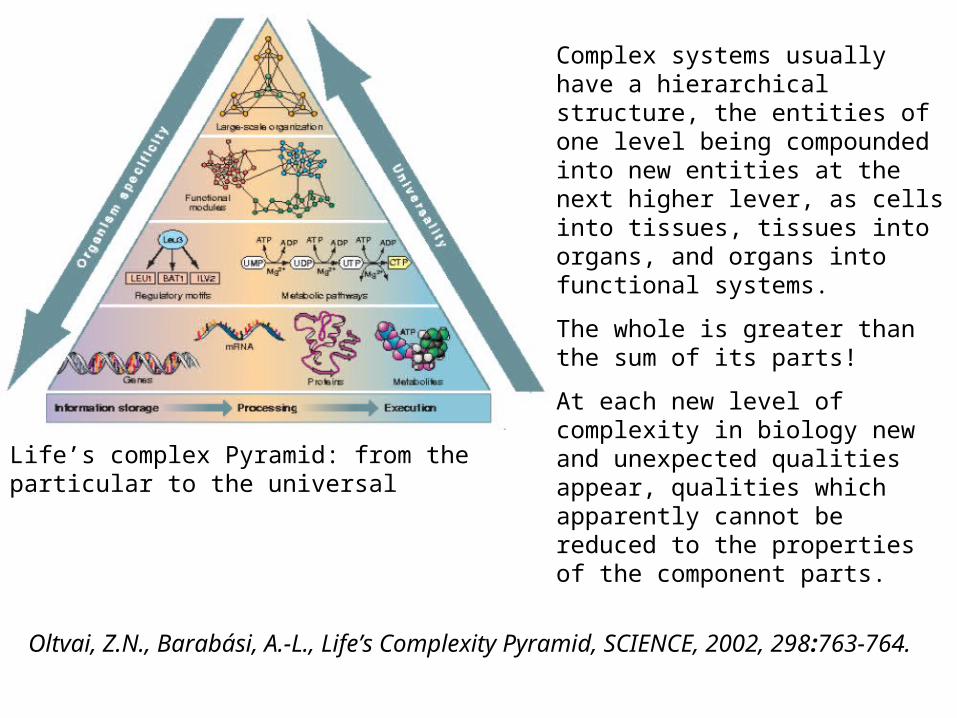
Life’s complex Pyramid: from the particular to the universal
Oltvai, Z.N., Barabási, A.-L., Life’s Complexity Pyramid, SCIENCE, 2002, 298:763-764.
Complex systems usually have a hierarchical structure, the entities of one level being compounded into new entities at the next higher lever, as cells into tissues, tissues into organs, and organs into functional systems.
The whole is greater than the sum of its parts!
At each new level of complexity in biology new and unexpected qualities appear, qualities which apparently cannot be reduced to the properties of the component parts.

Mean path length vs. small-world networks
Watts, D.J., Strogatz, S.H., Collective dynamics of `small-world' networks, Nature, 1998, 393:440-442.
Small-world cell networks=>the cell may react quickly to changes of the surroundings
Small-world network: small mean path length; high clustering coefficient

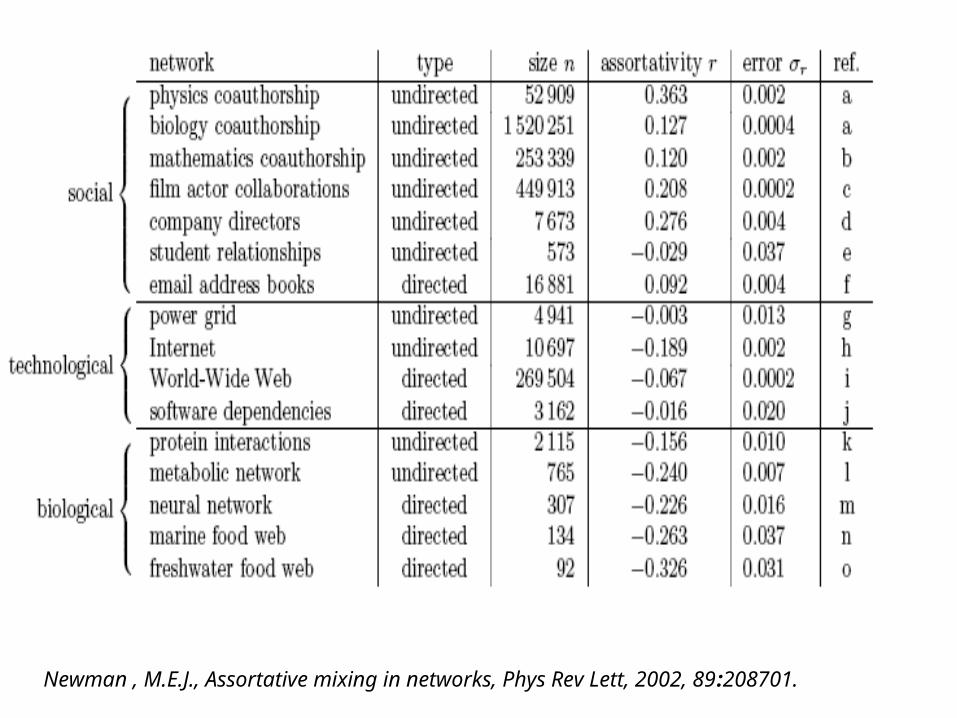
Assortativity coefficient vs. degree-degree correlation Are high-degree vertices connected to other high-degree ver
tices? Or are these vertices primarily connected to low-degree vertices?
ji , ki: the degrees of the nodes at the ends of the ith edgeM: number of edges in the network
r>0: assortative network r<0: disassortative network
Newman , M.E.J., Assortative mixing in networks, Phys Rev Lett, 2002, 89:208701.
Newman , M.E.J., Assortative mixing in networks, Phys Rev Lett, 2002, 89:208701.

The average connectivity <knn> of the nearest neighbors of a node depending on its connectivity k for the 1998 snapshot of the Internet, the generalized BA model and the fitness model.
Romualdo Pastor-Satorras, Alexei Vázquez, and Alessandro Vespignani, Dynamical and Correlation Properties of the Internet, PHYSI CAL REV IEW LETTERS, VOLUME 87, NUMBER 25(2002)

Correlation profiles of protein interaction network in yeast. Z-scores for connectivity correlations :Z(K0,K1) = (P(K0,K1) − Pr(K0,K1))/r(K0,K1) where r(K0,K1) is the standard deviation of Pr(K0,K1) in 1000 realizations of a randomized network.
Maslov, S., Sneppen, K., Specificity and Stability in Topology of Protein Networks, Science, 2002, 296:910-913.
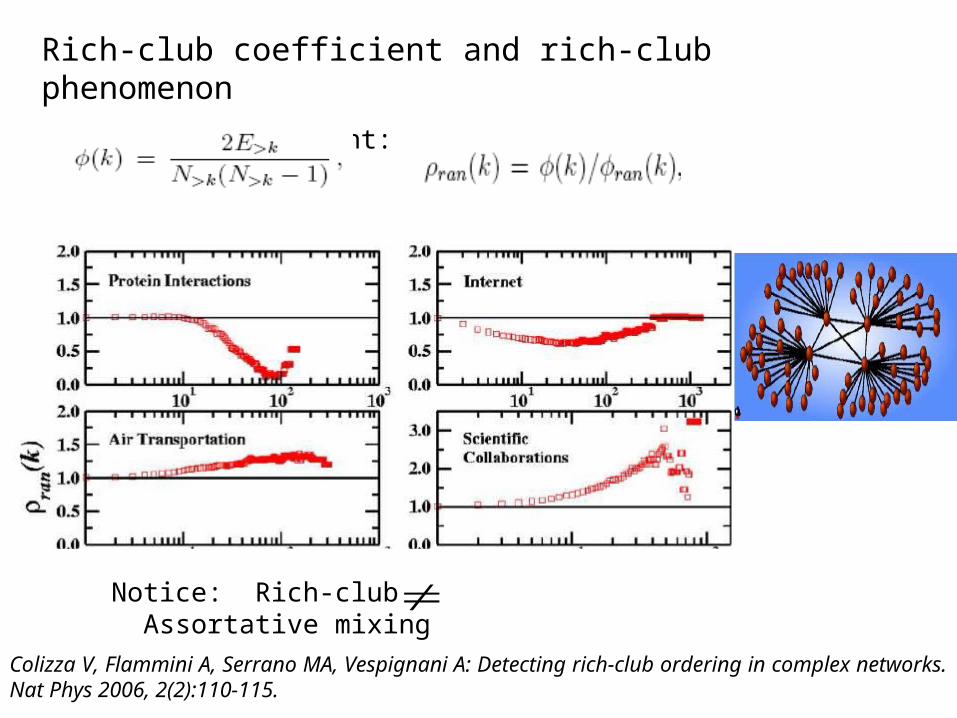
Rich-club coefficient and rich-club phenomenon
rich-club coefficient:
Colizza V, Flammini A, Serrano MA, Vespignani A: Detecting rich-club ordering in complex networks. Nat Phys 2006, 2(2):110-115.
Notice: Rich-club Assortative mixing
Centrality:
Which nodes are important for communication on the network?
Assumption: Information transmission or material
transportation on the network are along shortest paths.

Node betweenness measures the degree to which a vertex is participating in the communication between pairs of other vertices
( , )( )
( , )v
Bs t
s tC v
s t
:the number of shortest paths from s to t
: the number of shortest paths from s to t with v as an inner vertex
),( ts
),( tsv
Betweenness centrality
Holme P, Kim BJ, Yoon CN, Han SK: Attack vulnerability of complex networks. Phys Rev E 2002, 65:056109.
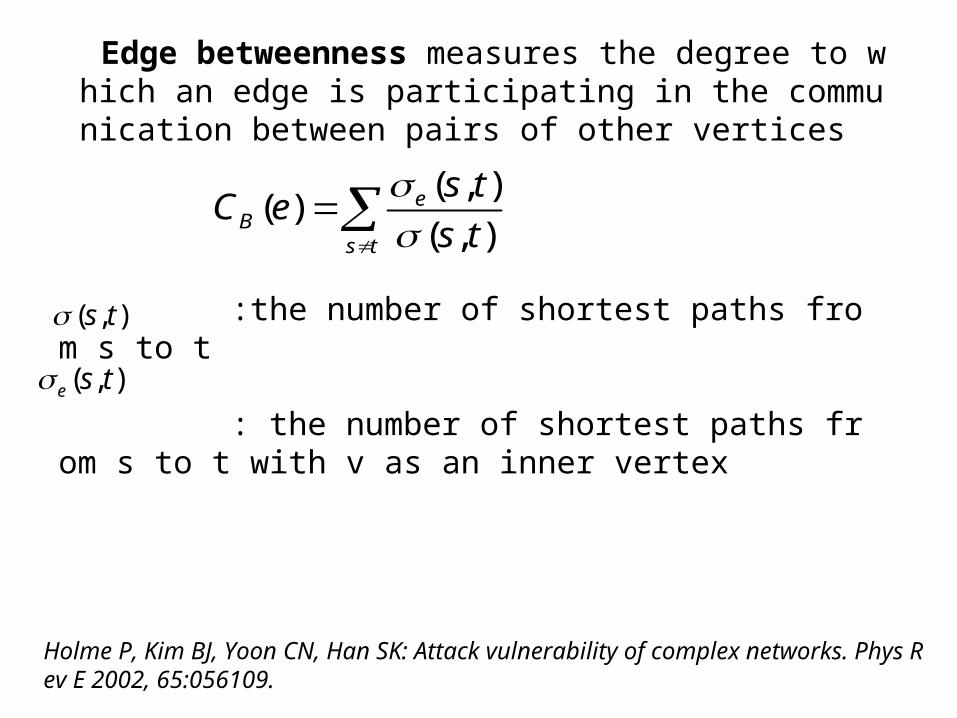
Edge betweenness measures the degree to which an edge is participating in the communication between pairs of other vertices
( , )( )
( , )e
Bs t
s tC e
s t
:the number of shortest paths from s to t
: the number of shortest paths from s to t with v as an inner vertex
),( ts
( , )e s t
Holme P, Kim BJ, Yoon CN, Han SK: Attack vulnerability of complex networks. Phys Rev E 2002, 65:056109.

• Nodes and edges of high betweenness centrality could be bottlenecks of the network, thus could be important enzymes or metabolites.
• Edges of high betweenness centrality could be bridges of modules.
Rahman, S.A., Schomburg, D., Observing local and global properties of metabolic pathways: 'load points' and 'choke points' in the metabolic networks, Bioinformatics, 2006, 22:1767-1774.
Girvan M, Newman MEJ: Community structure in social and biological networks. Proc Natl Acad Sci 2002, 99(12):7821-7826.

Closeness centrality
Closeness centrality measures the degree to which a vertex is close to other vertices on average.
1( )
( , )C
t v
C vd v t
“Service facility locating problem”: Find the location of a shopping mall that the average driving distance to the mall is minimal.
Solution: the nodes which have the biggest closeness centrality

Center:
“Emergency facility locating problem”: find the optimal location of a firehouse such that the worst-case response distance of a fire engine is minimal.
))},(max(min),(max{)(1 yxdyxdVxGCVyVxVy
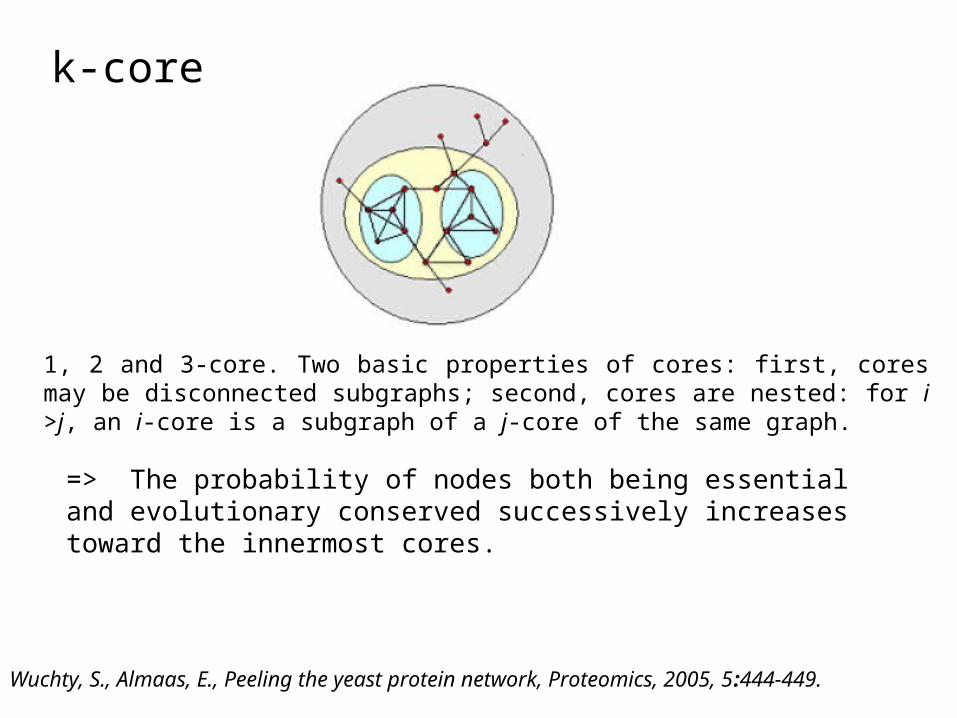
k-core
1, 2 and 3-core. Two basic properties of cores: first, cores may be disconnected subgraphs; second, cores are nested: for i>j, an i-core is a subgraph of a j-core of the same graph.
=> The probability of nodes both being essential and evolutionary conserved successively increases toward the innermost cores.
Wuchty, S., Almaas, E., Peeling the yeast protein network, Proteomics, 2005, 5:444-449.

Reciprocity metric
aij= 1 if there is an arc from nodes i to j,
aij = 0 otherwise
L: the number of total arcs in the network
N: the number of total nodes in the network
ρ = -1 for purely unidirectional networksρ = 1 for purely bidirectional networks

Network null models
•Network structures are always relative
•Network structures: how the network differs from a random network, or a null model
•One has to be clear about what to compare with a null model Null model 1: random graphs (Poisson random graphs,Erdos-Renyi graphs) Null model 2: random graphs constrained to the set ofdegrees of the original graph

Null Models : random rewiring
Maslov S, Sneppen K, Zaliznyak A: Detection of topological patterns in complex networks: correlation profile of the internet. Physica A: Statistical and Theoretical Physics 2004, 333:529-540.
Maslov, S., Sneppen, K., Specificity and Stability in Topology of Protein Networks, Science, 2002, 296:910-913.

r
r
P
PPZ
Z-score
Pajek: http://vlado.fmf.uni-lj.si/pub/networks/pajek/ txt2pajek.exe; pajek.exe
UCINET: http://www.analytictech.com/downloaduc6.htm
NetMiner: http://www.netminer.com/NetMiner/home_01.jsp
Graph analysis and visualization software:

III. Modularity and network decomposition
Zhao J, Yu H, Luo J, Cao Z, Li Y: Complex networks theory for analyzing metabolic networks. Chinese Science Bulletin 2006, 51(13):1529-1537.

2.1 Modularity:
From functional view:
Modularity: the system can be decomposed in parts (modules), such that each part has its own relatively independent function, while different parts have some communications with each other.
From topological view:
Assumption: A densely connected subnetwork "part with complex function."
Modularity: network could be divided into groups of vertices that have a high density of edges within them, with a lower density of edges between groups.
Hartwell LH, Hopfield JJ, Leibler S, Murray AW: From molecular to modular cell biology. Nature 1999, 402:C47-C52.
Papin JA, Reed JL, Palsson BO: Hierarchical thinking in network biology: the unbiased modularization of biochemical networks ,Trends in Biochemical Sciences 2004, 29:641-647.

])([ 2
1
jij
r
iii eeM
The modularity metric of a network is defined as the largest modularity metric of all possible partitions of the network.
The modularity of networks must always be compared to the null case of a random graph.
For a given decomposition of a network, the modularity metric is defined as:
Newman M: Detecting community structure in networks EurPhysJB 2004, 38:321-330.
Guimera R, Sales-Pardo M, Amaral LAN: Modularity from fluctuations in random graphs and complex networks. Physical Review E 2004, 70:025101.
the sum is over the a partition into clusters and eij is the fraction ofedges that leads between vertices of cluster i and j

2.2 Simulated annealing method:
])([maxmax 2
1
jij
r
iii eeM
Guimera R, Nunes Amaral LA: Functional cartography of complex metabolic networks. Nature 2005, 433(7028):895-900.

2.3 Hierarchical clustering method:
Similarity index(or dissimilarity index):
to signify the extent to which two nodes would like in the same cluster.
Agglomerative method:
to start off with each node being its own cluster. At each step, it combines the two most similar clusters to form a new larger cluster until all nodes have been combined into one cluster.
Divisive method:
to begin with one cluster including all the nodes, and attempts to find the splitting point at which two clusters are as dissimilar as possible.

Topological overlap algorithm: Substrate graph
),min(
),(),(
ji
nT kk
jiJjiO
Jn(i,j) denotes the number of nodes to which both i and j are linked ( pl
us 1 if there is a direct link between i and j ); ki, kj is the degree of i and
j, respectively.
Agglomerative method.
Ravasz E, Somera AL, Mongru DA, Oltvai ZN, Barabasi AL: Hierarchical Organization of Modularity in Metabolic Networks. Science 2002, 297(5586):1551-1555

Shortest path algorithm: enzyme graph
)),(),,(min(),( ijdjidjiitydissimilar
d(i, j) is the number of arcs in the shortest directed path from i to j .
Agglomerative method.
Ma H-W, Zhao X-M, Yuan Y-J, Zeng A-P: Decomposition of metabolic network into functional modules based on the global connectivity structure of reaction graph. Bioinformatics 2004, 20(12):1870-1876.

Betweenness method: substrate-reaction bipartite graph
ts
r
inB ts
ts
rkrC
),(
),(
)(
1)(
is the number of shortest paths between s and t that passes through r, is the total number of shortest paths between s and t, is the in-degree of node r.
Divisive method.
),( tsr),( ts
)(rk in
Holme P, Huss M, Jeong H: Subnetwork hierarchies of biochemical pathways. Bioinformatics 2003, 19(4):532-538.

Corrected Euclidean-like dissimilarity algorithm: substrate graph
N
jikk
jkikkjkijiij ddddddjiD
,1
222 ])()[()(),(
d(i, j) is the number of arcs in the shortest directed path from i to j .
Agglomerative method.
Zhao J, Yu H, Luo J, Cao Z, Li Y: Hierarchical modularity of nested bow-ties in metabolic networks. BMC Bioinformatics 2006:7:386.
IV. Topological diversity of networks with a given degree sequence
Zhao J, Tao L, Yu H, Luo J-H, Cao Z-W, Li Y-X: The effects of degree correlations on network topologies and robustness. Chinese Physics 2007, 16.

Seed networks:
• Seed network A: the hierarchically modular network constructed by Ravasz et al. (RB model) in the 3rd iteration.
• Seed network B: a model network constructed by the BA preferential attachment model .
• Seed network C: the biggest connected cluster of the E.coli metabolic
• Seed network D: the biggest connected cluster of the protein interaction network CCSB-HI1

Graphs with the same degree sequence have significantly topological diversity.
The Smax graph (A) and Smin graph (B) for a small seed network. Nodes with differentdegrees are shown in different colours.
Extreme networks of degree correlation

Assortative coefficient (r) as function of the randomization fraction (p).
Constructing network ensemble from the extreme networks

Relationship between mean path length (L) and assortative coefficient (r). The data shown in the figures are averaged over 10 random realizations of the rewiring process.
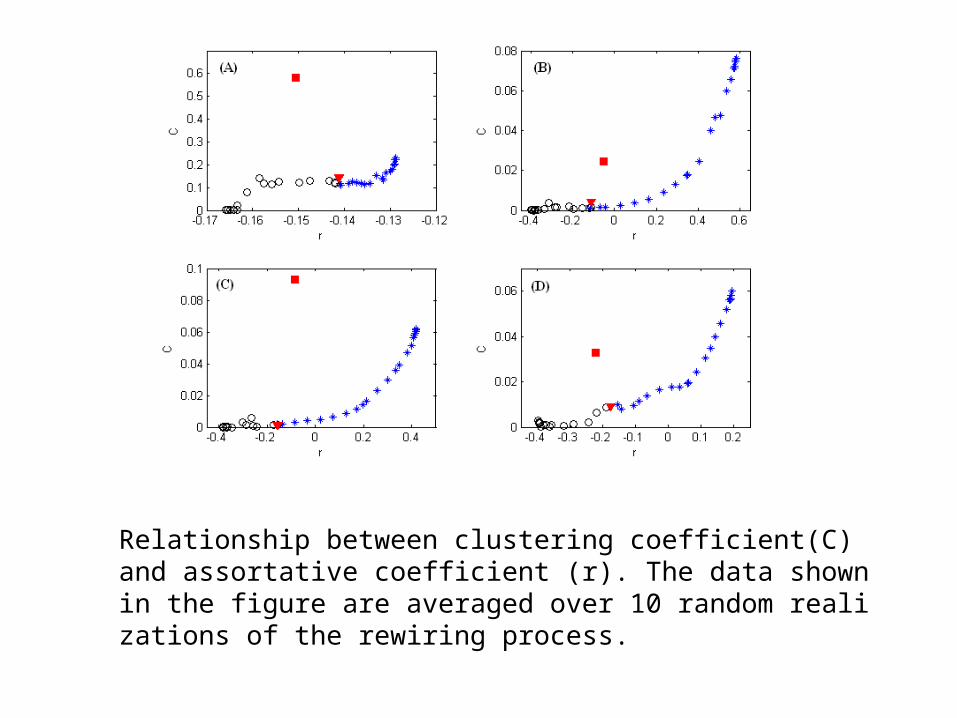
Relationship between clustering coefficient(C) and assortative coefficient (r). The data shown in the figure are averaged over 10 random realizations of the rewiring process.
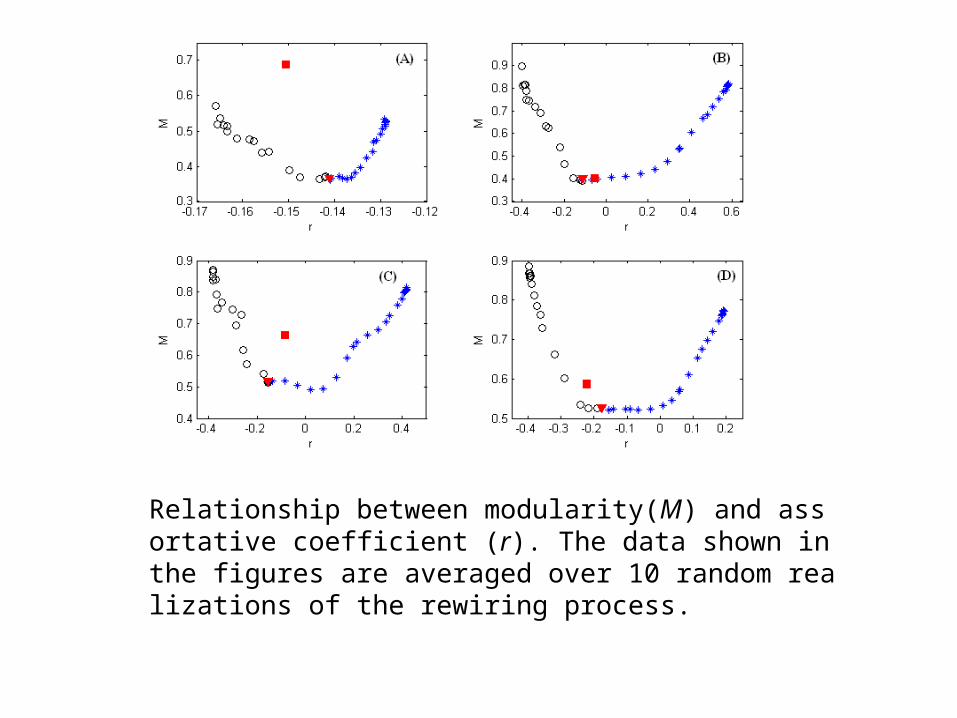
Relationship between modularity(M) and assortative coefficient (r). The data shown in the figures are averaged over 10 random realizations of the rewiring process.

The effect of degree correlation on network robustness. Figures in the first and second row depict the robustness under attacks and failures as a function of assortativity, respectively. The data shown in the figures are averaged over 10 random realizations of the rewiring process.
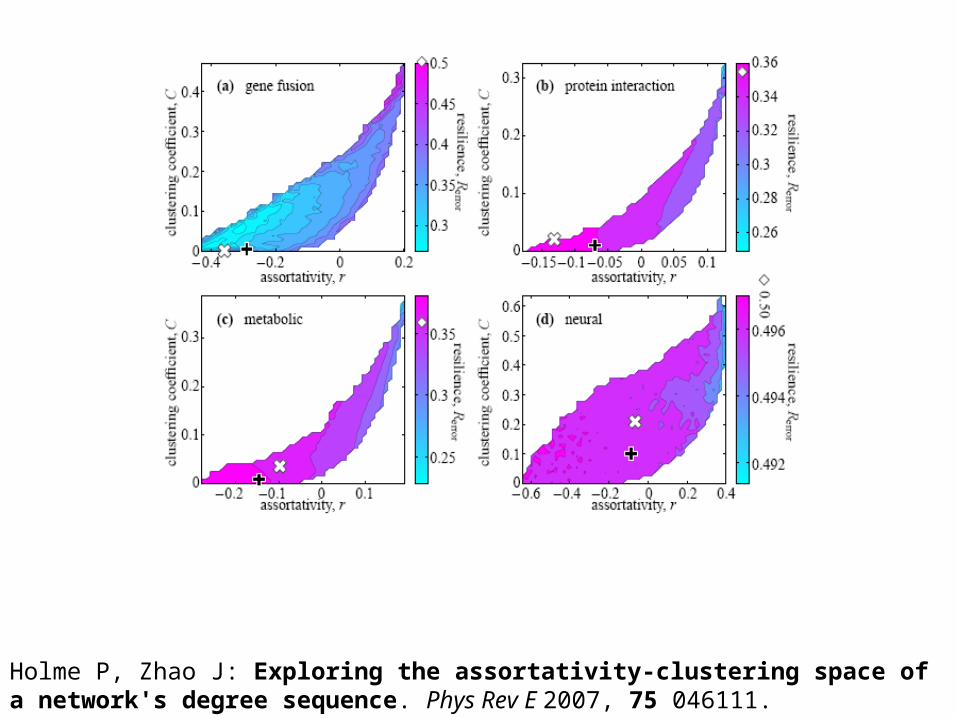
Holme P, Zhao J: Exploring the assortativity-clustering space of a network's degree sequence. Phys Rev E 2007, 75 046111.

Thanks!